Article

Coupling Simulation of Longitudinal Vibration of Rod String and Multi-Phase Pipe Flow in Wellbore and Research on Downhole Energy Efficiency

School of Mechanical Engineering, University Yanshan, Qinhuangdao 066004, China
*
Author to whom correspondence should be addressed.
Energies 2023, 16(13), 4988; https://doi.org/10.3390/en16134988
Submission received: 19 May 2023 / Revised: 20 June 2023 / Accepted: 26 June 2023 / Published: 27 June 2023
(This article belongs to the Section K: State-of-the-Art Energy Related Technologies)

Abstract

:
The wellbore of a sucker-rod pumping well experiences a multi-phase flow consisting of oil, gas, and water. The flow pattern and pump discharge pressure are greatly impacted by oil well production, which in turn significantly affects the simulation results of longitudinal vibration in the sucker-rod string. When calculating the discharge pressure in a hydrostatic column containing both oil and water (HC), the pressure is not affected by the oil well’s production. This thereby avoids interference between vibrations in the sucker-rod string’s longitudinal direction and the flow from the wellbore. Considering the coupling characteristics between the longitudinal vibration of the sucker-rod string and the wellbore flow, a mathematical model of the sucker-rod pumping system (CMSRS) and a mathematical model of the downhole energy efficiency parameters were established. In detail, the CMSRS comprises two parts: the discharge pressure mathematical models of multi-phase flow dynamics (MD) and the wave equation of the longitudinal vibration of the sucker-rod string. A numerical simulation model of the sucker-rod pumping system was constructed based on a mathematical model. We compared the experimental results, the simulation results of the CMSRS and the simulation results of the sucker-rod string based on the oil-water two–phase hydrostatic column (SMSRS) and found good agreement, indicating the feasibility of the CMSRS. The simulation details show the following: (1) The HC model’s discharge pressure exceeds that of the MD model by more than 33.52%. The polished rod load for the CMSRS is 18.01% lower than that of the SMSRS, and the pump input power for the CMSRS is 36.23% lower than that of the SMSRS. (2) The effective power simulation model based on the energy balance relationship is essentially the same as the effective power calculated by the model based on multi-phase flow effective power. This validates the accuracy of the multi-phase flow effective power model. (3) The limitations of the industry standard effective power model are that (i) the effective head is the net lift height of the fluid in the wellbore reduced to the oil and water phases rather than the effective lift height based on the energy balance relationship and (ii) the power of the gas phase delivered by the pumping pump is disregarded, and only the effective power of the pump delivering the oil-water mixture is considered. (4) The influence of the wellbore parameters on the wellbore efficiency and sub–efficiency is systematically analyzed. The analysis results have an important significance in the guidance of energy saving in pumping wells.

1. Introduction

The simulation of rod string longitudinal vibration and the indicator diagram is the key technology for the dynamic simulation of the sucker-rod pumping system. It is also the basis for the simulation of energy efficiency parameters of pumping well and system optimization design. Gibbs [1] initially developed a simulation model for the longitudinal vibration of rod strings using the wave equation. Subsequently, other experts and scholars have developed models based on the coupled longitudinal vibration of rod strings [2,3,4]. Additionally, a method for analyzing the efficiency parameter of the sucker-rod pumping system (SRPS) and optimizing its design has been developed. This method is based on a model of longitudinal vibration in the rod string [5,6,7,8]. Recently, there has been a significant amount of research on the longitudinal vibration of sucker-rod strings, with a primary focus on developing calculation methods for nonlinear friction–damping forces and exploring the nonlinear vibration characteristics of the rod string [9,10,11,12].
However, inadequate research has been conducted on the boundary conditions of the longitudinal vibration of the sucker-rod string [8,13,14,15,16,17]. The boundary conditions for the longitudinal vibration of a sucker-rod string consist of two components: the boundary conditions for movement at the top of the sucker-rod string and the axial load concentration dependent on discharge pressure at the bottom of the sucker-rod string. Currently, the discharge pressure calculation model comprises the oil-water two–phase hydrostatic column (HC) model and the multi-phase flow dynamics (MD) model [13]. An electromechanical coupling dynamic mathematical model for the well pumping system was established, but the discharge pressure was calculated using the HC model [14]. An improved mathematical model for the longitudinal vibration of a sucker rod string was established by considering the influence of the fluid inlet law on the lower boundary conditions of the longitudinal vibration of the sucker rod string, but the HC model was used to calculate the discharge pressure [8]. Considering the influence of nonlinear force on the longitudinal vibration of the pumping rod string, an improved simulation model for the longitudinal vibration of the pumping rod string was established, but the HC model was used to calculate the discharge pressure [15]. In order to optimize the energy–saving effect of the pumping unit system, two control systems, an open loop and a closed loop, have been developed to achieve the energy–saving effect of the pumping unit well system. However, the discharge pressure in the longitudinal vibration of the pumping rod string is still calculated according to the HC model [16]. A simulation model was established for the fluid inlet law and the instantaneous pressure inside the pump barrel, taking into account the influence of factors such as plunger motion law, valve ball motion law, valve gap instantaneous flow rate, and oil well inflow characteristics. However, the discharge pressure model used the HC model [17]. Within the mechanical drive (MD) system, oil production affects the discharge pressure, while the longitudinal vibration of the sucker-rod string affects oil production, creating a coupling effect between the longitudinal vibration of the pumping rod string and oil production. Nevertheless, there is no existing literature on the modeling of the coupling of sucker-rod string longitudinal vibration and oil production.
The longitudinal vibration of the sucker-rod string is the basis for studying energy efficiency parameters. Currently, industry standards in the petroleum sector are used to calculate downhole efficiency, rod string efficiency, and pump efficiency. However, there are significant discrepancies in pump efficiency due to inefficient pumping. The analysis findings suggest that the observed phenomenon can be attributed to the constraints of the prevailing power calculation model in the petroleum industry. The disadvantage of the effective power calculation method in the petroleum industry standard was explained by Dong [18], who established an effective power calculation model based on multi-phase pipe flow, but its correctness was not verified. However, there is currently no literature available on the investigation of energy efficiency parameters that are based on the coupling of the longitudinal vibration of the sucker-rod string and multi-phase flow in the wellbore or the validation of an effective power calculation model that is based on multi-phase pipe flow.
In this paper, considering the coupling characteristics of the longitudinal vibration of the sucker-rod string and the wellbore flow, the sucker-rod pumping system model (CMSRS) and the simulation model of downhole energy efficiency parameters were established. According to the energy balance relationship of the downhole system, we analyzed the disadvantage of the standard effective power calculation model of the oil industry and proved the correctness of the effective power calculation model based on multi-phase pipe flow.

2. Mathematical Model of Unit Simulation

2.1. Mathematical Model of Longitudinal Vibration of Sucker Rod String

To ensure the generalizability of this research, we took the directional well as the research object. Based on the force analysis diagram in Reference [19] and the principle of force balance, the mathematical model for the longitudinal vibration of multi–stage combined sucker-rod strings was established. In detail, the model is made up of five parts: a wave equation, an upper boundary condition, a lower boundary condition, a continuity boundary condition, and an initial condition. The initial condition includes the upper boundary initial condition, the initial condition of sucker-rod string displacement, and the lower boundary initial condition. It is given as follows:
2 u i t 2 c i 2 2 u i s i 2 + υ i u i t = υ i d u 0 d t d 2 u 0 d t 2 u i t u i t h i N i + ρ i g cos θ i i = 1 , 2 , , I u 1 0 , t = 0 E i A i u i s i , t s i | s i = L i = E i + 1 A i + 1 u i + 1 s i + 1 , t s i + 1 | s i + 1 = 0 E I A I u I s I | s I = L I = P p t u i s i , 0 = 0 u 0 0 = 0 P p 0 = A p Δ p d + A r d p d + π L p D Δ p d δ 2 L p
where:
q i = ρ i ρ l A i g N i = E i A i u i s i d θ i d s i q i sin θ i 2 + E i A i u i s i sin θ i d φ i d s i 2 ρ i = ρ i ρ l ρ i h i = f ρ i A i
where u i is the displacement of the i–stage sucker rod, m ; t is the time of the rod string movement, s ; s i is the position of the i–stage sucker rod, m ; c i is the propagation speed of sound in the sucker-rod string, m / s ; υ i is the damping coefficient of the i–stage sucker rod, s 1 ; E i is the elastic modulus of the i-stage sucker rod, Pa ; ρ i is the density of the i–stage sucker rod, kg / m 3 ; ρ l is the density of the fluid, kg / m 3 ; u 0 is the displacement of the polished rod, m ; P p t is the plunger load, N ; A i is the cross-section area of the i–stage sucker rod, m 2 ; L i is the length of the i–stage sucker rod, m ; f is the damping coefficient of the sucker rod and tubing string, s 1 ; θ i is the well inclination angle, rad ; φ i is the azimuth, rad ; I is the series of the sucker rod, dimensionless; g is gravitational acceleration, m / s 2 ; δ is the radial clearance between the plunger and the pump barrel, m .
The model of the suspension point displacement, u 0 , is shown in the literature [20]. The concentrated axial load, P p t , at the bottom of the sucker-rod strings is made up of three parts: the differential pressure liquid load above and below the plunger, the liquid friction between the plunger and the pump barrel, and the hydraulic resistance of the valve gap. To conduct this study, several assumptions and simplifications were made. Firstly, it was assumed that the clearance flow between the plunger and the pump barrel is characterized by Newtonian fluid laminar flow. Secondly, the flow in the pump chamber was assumed to be stable and homogeneous. Finally, it was assumed that the pump sink pressure and discharge pressure remained constant throughout the study.
The concentrated axial load at the bottom end of the sucker-rod strings is given as follows [21]:
P P ( t ) = A p p d p A r d p d + P f
With Equation (3), the friction between the plunger and the pump barrel is given as follows:
P f = π L p D p d p δ 2 L p + μ v p δ 1 1 ε 2
where
p = V o g V o g + V x n p d + Δ p d v p > 0 ,   u p u p d   p d + Δ p d v p > 0 ,   u p u p d V g V g ( V p V x ) n   p s Δ p s     v p < 0 ,   u p u p s p s Δ p s   v p < 0 ,   u p u p s
where A p is the cross-sectional area of the plunger, m 2 ; p d is the discharge pressure, Pa ; p s is the submergence pressure, Pa ; p is the pump barrel pressure, Pa ; A r d is the remaining cross–sectional area, m 2 ; P f is the friction between the plunger and the pump barrel, N ; L p is the plunger length, m ; D is the plunger diameter, m ; δ is the radial clearance between the plunger and the pump barrel, m ; μ is the dynamic viscosity of the oil well fluid, Pa · s ; ε is the eccentricity of the plunger and the pump barrel, m ; Δ p d , Δ p s is the differential pressure across the valve, Pa ; V o g is the volume of gas in the residual volume when the plunger reaches the bottom dead center, m 3 ; V x is the stroke volume of the plunger, m 3 ; V g is the volume of gas in the pump barrel at the end of the plunger upstroke, m 3 ; V p is the stroke volume, m 3 ; V x is the stroke volume of the plunger, m 3 ; u p is the displacement of the plunger movement, m ; u p d is the displacement of the plunger when the fixed valve is opened, m ; u p s is the displacement of the plunger when the traveling valve is opened, m ; v p is the plunger running speed, m / s .
With Equation (5), the V o g , V x , V g , V p , Δ p s , and Δ p d can be calculated from the Reference [8].
Based on the longitudinal vibration simulation results of the sucker-rod string, the suspension point load and the effective stroke length of the plunger are given as follows:
P R L = E 1 A 1 u 1 s 1 | s 1 = 0 + W r
S p u m p = u p max u p min
where P R L is the polished rod load, N ; W r is the pole weight, N ; E 1 is the elastic modulus of the 1–stage sucker rod, Pa ; A 1 is the cross–section area of the 1–stage sucker rod, m 2 ; u 1 is the displacement of the 1-stage sucker rod, m ; s 1 is the position of the 1–stage sucker rod, m ; S p u m p is the effective stroke of the plunger, m ; u p max is the maximum stroke of the plunger, m ; u p min is the minimum stroke of the plunger, m .

2.2. Model of Sinking Pressure and Discharge Pressure

The sucker-rod pumping well experiences a three–phase unsteady flow of oil, gas, and water. Figure 1 illustrates the flow field structure diagram. The distribution of fluid pressure in the wellbore is dependent on both spatial location and time. To calculate the discharge pressure, the unsteady flow of oil, gas, and water is typically simplified to a steady two–phase flow of gas and liquid [13].
This study utilized the Hasan–Kabir model [13] to calculate the pressure gradient and discharge pressure in the tubing for a stable two–phase flow of liquid gas. The fluid pressure gradient in the tubing is solely dependent on oil production under specific conditions of wellbore structure and fluid properties. The discharge pressure is expressed as follows:
p d = p o + 0 L f Q d s
where p o is the oil pressure, Pa ; Q is the oil production, t ; f Q is the unit pressure drop as a function of oil well and output, Pa .
The fluid pressure gradient is affected by the flow pattern of the fluid in the oil pipe, which can be categorized as bubble flow, segment plug flow, churning flow, and annular flow. The calculation model for this phenomenon is presented in Reference [13].
The distribution of fluid properties in the oil jacket annulus follows a specific pattern, which includes the gas column section and the oil column section containing dissolved gas. In the absence of gas generation within the oil jacket annulus, the formula for calculating the sinking pressure is as follows:
p s = p c + H d L ρ o s g cos θ d s
where p c is the casing pressure, Pa ; H d is the dynamic liquid level height, m ; ρ o s is the oil fluid density, kg / m 3 ; L is the oil well depth, m ; ρ o s is the mixture density, kg / m 3 .

2.3. Coupling Model of Discharge Pressure and Oil Production Based on Pump Outflow Characteristics

Pumping pump outflow characteristics reflect the relationship between oil production as a function of sink pressure and discharge pressure [17]:
Q = 1440 A p S N α
where S is the suspension stroke length, m ; N is the jig frequency, min 1 ; α is the discharge coefficient, dimensionless.
The model of the discharge coefficient is given as follows:
α = η s η F η L η v
where
η s = S p u m p S η F = 1 1 + R 1 k R 1 + R p s Δ p s p d + Δ p d 1 n [ 1 p s Δ p s p d + Δ p d 1 n ] η L = A p S p u m p u p d Δ Q A p S p u m p u p d η v = 1 1 n w B o p s + n w B w p s + 1 n w S p S s p s p s t T s t t o Z p s p s
where η s is the plunger stroke coefficient, dimensionless; η F is the pump barrel filling coefficient, dimensionless; η L is the oil well pump leakage coefficient, dimensionless; R is the dissolved gas-oil ratio, dimensionless; η v is the volume coefficient of the oil–gas-water mixture in the pump barrel under submerged pressure conditions, dimensionles; Δ Q is the total leakage, m 3 ; S p u m p is the plunger stroke length, m ; u p d is the plunger displacement relative to the top dead center when the traveling valve is opened, m ; n w is the water content,%; B o p s is the volume coefficient of crude oil in the pump barrel under submerged pressure conditions, dimensionless; B w p s is the volume coefficient of water inside the pump barrel under submerged pressure conditions, dimensionless; S s p s is the gas-oil ratio inside the pump barrel under submerged pressure conditions, dimensionless; Z p s is the compressibility factor of natural gas in a pump barrel under submerged pressure, dimensionless; S p is the production gas-oil ratio, dimensionless; p s t is the pressure under standard conditions, Pa ; T s t is the temperature under standard conditions, K ; t o is the temperature inside the pump barrel, K .
The calculation model for the leakage amount is given as follows:
Δ Q = 0 T π D ( p d p ) δ 3 12 μ L p 1 + 3 2 ε 2 d t
where L p is the length of the plunger, m , and T is the operating cycle, s .

3. System Coupling Model and Numerical Simulation Algorithm

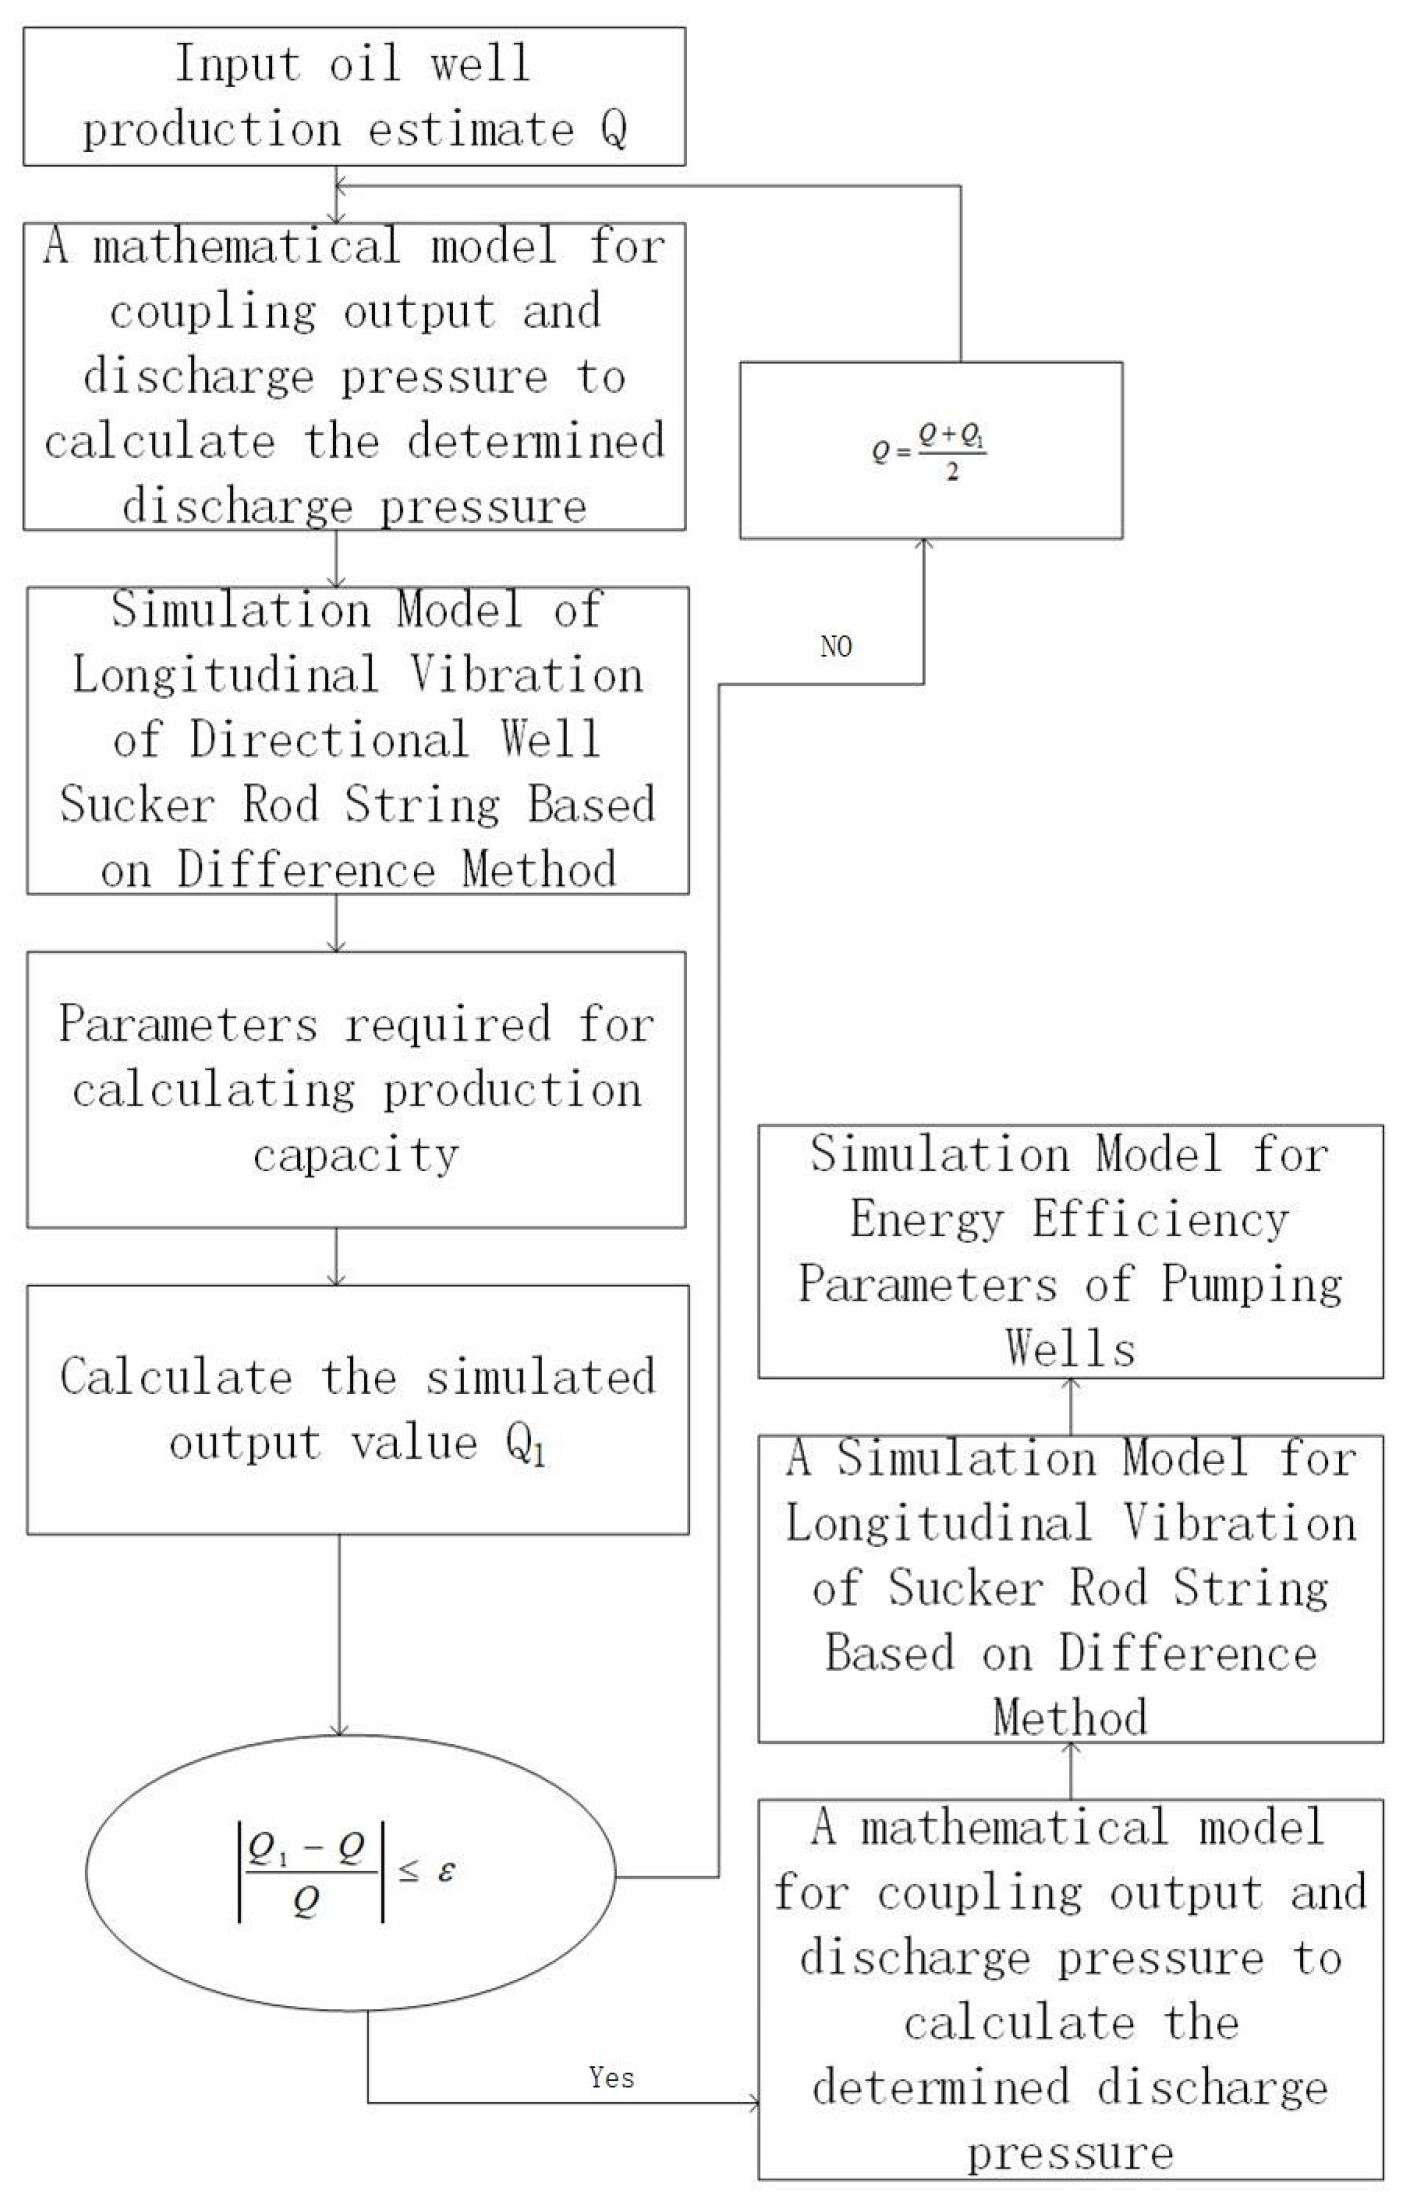
The simulation model for the longitudinal vibration of the sucker-rod string indicates that discharge pressure affects both the longitudinal vibration and the static and dynamic deformation of the sucker-rod string. These factors, in turn, impact the stroke length of the plunger and the oil yield. Additionally, the calculation model for discharge pressure demonstrates that oil yield is influenced by discharge pressure, while the pumping pump outflow characteristics model shows that discharge pressure affects oil yield. The analysis above reveals that the mathematical models for the longitudinal vibration of the sucker-rod string, the calculation of discharge pressure based on multi-phase pipe flow, and the characterization of pump outflow are interdependent and coupled. This highlights the need for a comprehensive approach to modeling these phenomena. Based on the coupling characteristics between these three models, the numerical simulation algorithm was established in this study to solve the system coupling problem. This study employed the finite difference method [22] to solve the mathematical model of the longitudinal vibration of the sucker-rod string. Additionally, an iterative optimization algorithm was utilized to couple the longitudinal vibration and the production of the sucker-rod string. The Runge–Kutta Method [23] was used to calculate discharge pressure. The specific process is detailed in Appendix A, and the algorithm’s flow chart is presented in Figure 2. The detailed steps of the algorithm are as follows:
(1)
Input the parameters of the oil production, Q , and the oil well fluid parameters;
(2)
Based on the oil production, Q , the oil well fluid parameters, and the multi-phase pipe flow model in the wellbore, calculate the discharge pressure, p d , using the Runge–Kutta method;
(3)
Based on the longitudinal vibration model of the sucker-rod string and the discharge pressure, p d , calculate the displacement of any interface of the sucker-rod string and the downhole energy efficiency parameters using the finite difference method;
(4)
Calculate the oil production simulation results, Q 1 ;
(5)
If Q 1 Q Q ϕ ( ϕ is the calculation error check value), output the required parameters and indicator diagram. If Q 1 Q Q ϕ , correct Q = Q + Q 1 2 , and return to Steps (2)–(4) until the result is met.

4. Mathematical Model of Downhole Energy Efficiency Parameters

4.1. Mathematical Model of Polished Rod Power

The instantaneous and average power of the polished rod is given as follows:
N p r = P R L v a 1000 N p r m = 1 T 0 T N p r d t
where N p r is the instantaneous power of the polished rod, kw ; N p r m is the average of the bare poles, kw .

4.2. Mathematical Model of Pump Input Power and Pump Internal Loss Power

The model for calculating the instantaneous and average input power of the pumping pump is given as follows:
N p = P P v p 1000 N pm = 1 T 0 T N p u m p d t
where N p is the instantaneous input power of the oil pump, kw ; N p m is the average power of the oil pump, kw .
The loss of power in the pump is made up of three parts: the mechanical friction loss power between the plunger and the pump barrel, the volume loss power of the plunger and the pump barrel gap leakage, and the hydraulic loss power of the valve gap. The calculation model of the instantaneous mechanical friction power and average mechanical friction power between the plunger and pump barrel of the pumping pump are given as follows:
N m = P f v p 1000 N m m = 1 T 0 T N m d t
where N m is the friction loss power between the plunger and the pump barrel, kw ; N m m is the average friction loss power between the plunger and the pump barrel, kw .
The instantaneous volume loss power and the average volume loss power of the plunger and pump barrel gap leakage are given as follows:
N v = π D p d p 2 δ 3 1 + 3 2 ε 2 12000 μ L p N v m = 1 T 0 T N v d t
where N v is the instantaneous leakage loss power of the oil pump, kw ; N v m is the average leakage loss power of the oil well pump, kw .
The model of the hydraulic loss power of the pumping pump valve gap is given as follows:
N h = N h 1 + N h 2
With Equation (18), the fixed and swing valve gap hydraulic loss power, N h 1 , N h 2 are given as follows:
N h 1 = 10 3 ξ A o 1 2 ( p p s ) ρ l h j 1 ρ l g N h 2 = 10 3 ξ A o 2 2 ( p d p ) ρ l h j 2 ρ l g
where ξ is discharge Coefficient, dimensionless; A o 1 , A o 2 is the seat area, m 2 .
The hydraulic loss of the valve gap is given as follows:
h j 1 = ( A p A o 1 1 ) 2 v p 2 g v p < 0 0 v p < 0
h j 2 = ( 1 A p A o 2 ) 2 v p 2 g v p 0 0 v p 0

4.3. Mathematical Model for the Effective Power of a System

4.3.1. Industry Standard Effective Power Model

The effective power calculation model of industry standards is given as follows [19]:
N e 1 = 10 3 Q H ρ g 86400
where H is the effective lifting height, m ; ρ is the density of the mixed oil well fluid, kg / m 3 .
With Equation (22), the effective head and the density of the oil-water mixture are given as follows:
H = H d + p o p c ρ g
ρ = n w ρ w + 1 n w ρ o

4.3.2. Effective Power Calculation Model Based on Multiphase Flow

The fluid flow in the pumping pump was assumed to be a steady homogeneous flow. Based on the energy balance relationship between the pump suction port with the discharge port and the definition of the effective head of the fluid machinery, the effective power of the pump under multi-phase flow conditions is given as follows [20]:
N e 2 = 10 3 Q l p d p s + p s R s 1 n 1 p d p s n 1 n 1
The effective power is composed of two parts: the effective power of lifting the liquid phase oil-water mixture and the effective power of lifting the gas phase. The effective power is given as follows:
N e 2 = N e 2 l + N e 2 g
where n is the compression coefficient of the natural gas, dimensionless. Q l is the average flow rate of the liquid phase, m 3 / s .

4.3.3. Effective Power Model Based on Pumping Pump Energy Balance Relationship

Based on the energy balance relationship in the pump and the simulation results of the input power of the pump and the lost power in the pump, the simulation model of the effective power of the system is given as follows:
N e 3 = N p m N m m N v m N h m

4.3.4. Calculation Model of Downhole Efficiency and Sub-Efficiency

The downhole efficiency, pumping efficiency, and sucker-rod string efficiency are given as follows:
η d i = N e i N p r m i = 1 , 2 , 3
η pi = N e i N p i = 1 , 2 , 3
η r = N p m N p r m

5. Precision Verification

System dynamic simulation software was developed based on the model presented above. This software simulates the longitudinal vibration of the sucker-rod string coupled with the multi-phase tubular flow in the wellbore. It enables the calculation of various parameters such as the polished rod indicator diagram, pumped indicator diagram, polished rod power, pump input power, oil production, discharge pressure, downhole efficiency, pumping rod column efficiency, and pumping pump efficiency. Without particular description and labeling, the fundamental parameters calculated in this study are given as follows: sucker-rod pumping type: CYJY10–3–53HB; rated power of motor: 45 kw; reservoir midpoint: 1200 m; saturation pressure: 8 MPa; density of crude oil: 860 kg/m3; viscosity of crude oil: 50 mpa · s ; gas-oil ratio (GOR): 100 m3/m3; relative density of natural gas: 0.8 kg / m 3 ; pump setting depth: 980 m; pump diameter: 70 mm; stroke length: 3 m; stroke time: 6 min 1 ; wellhead oil pressure: 0.5 MPa ; casing pressure: 0.6 MPa ; water content: 45%; dynamic liquid length: 760 m; oil production: 36.98 m 3 / d ; pump clearance grade: 2; anti-flush distance: 0.5 m; tubing anchoring; tubing specification: 73 mm; rod string diameter: 25 mm; rod string length: 980 m; steel rod.
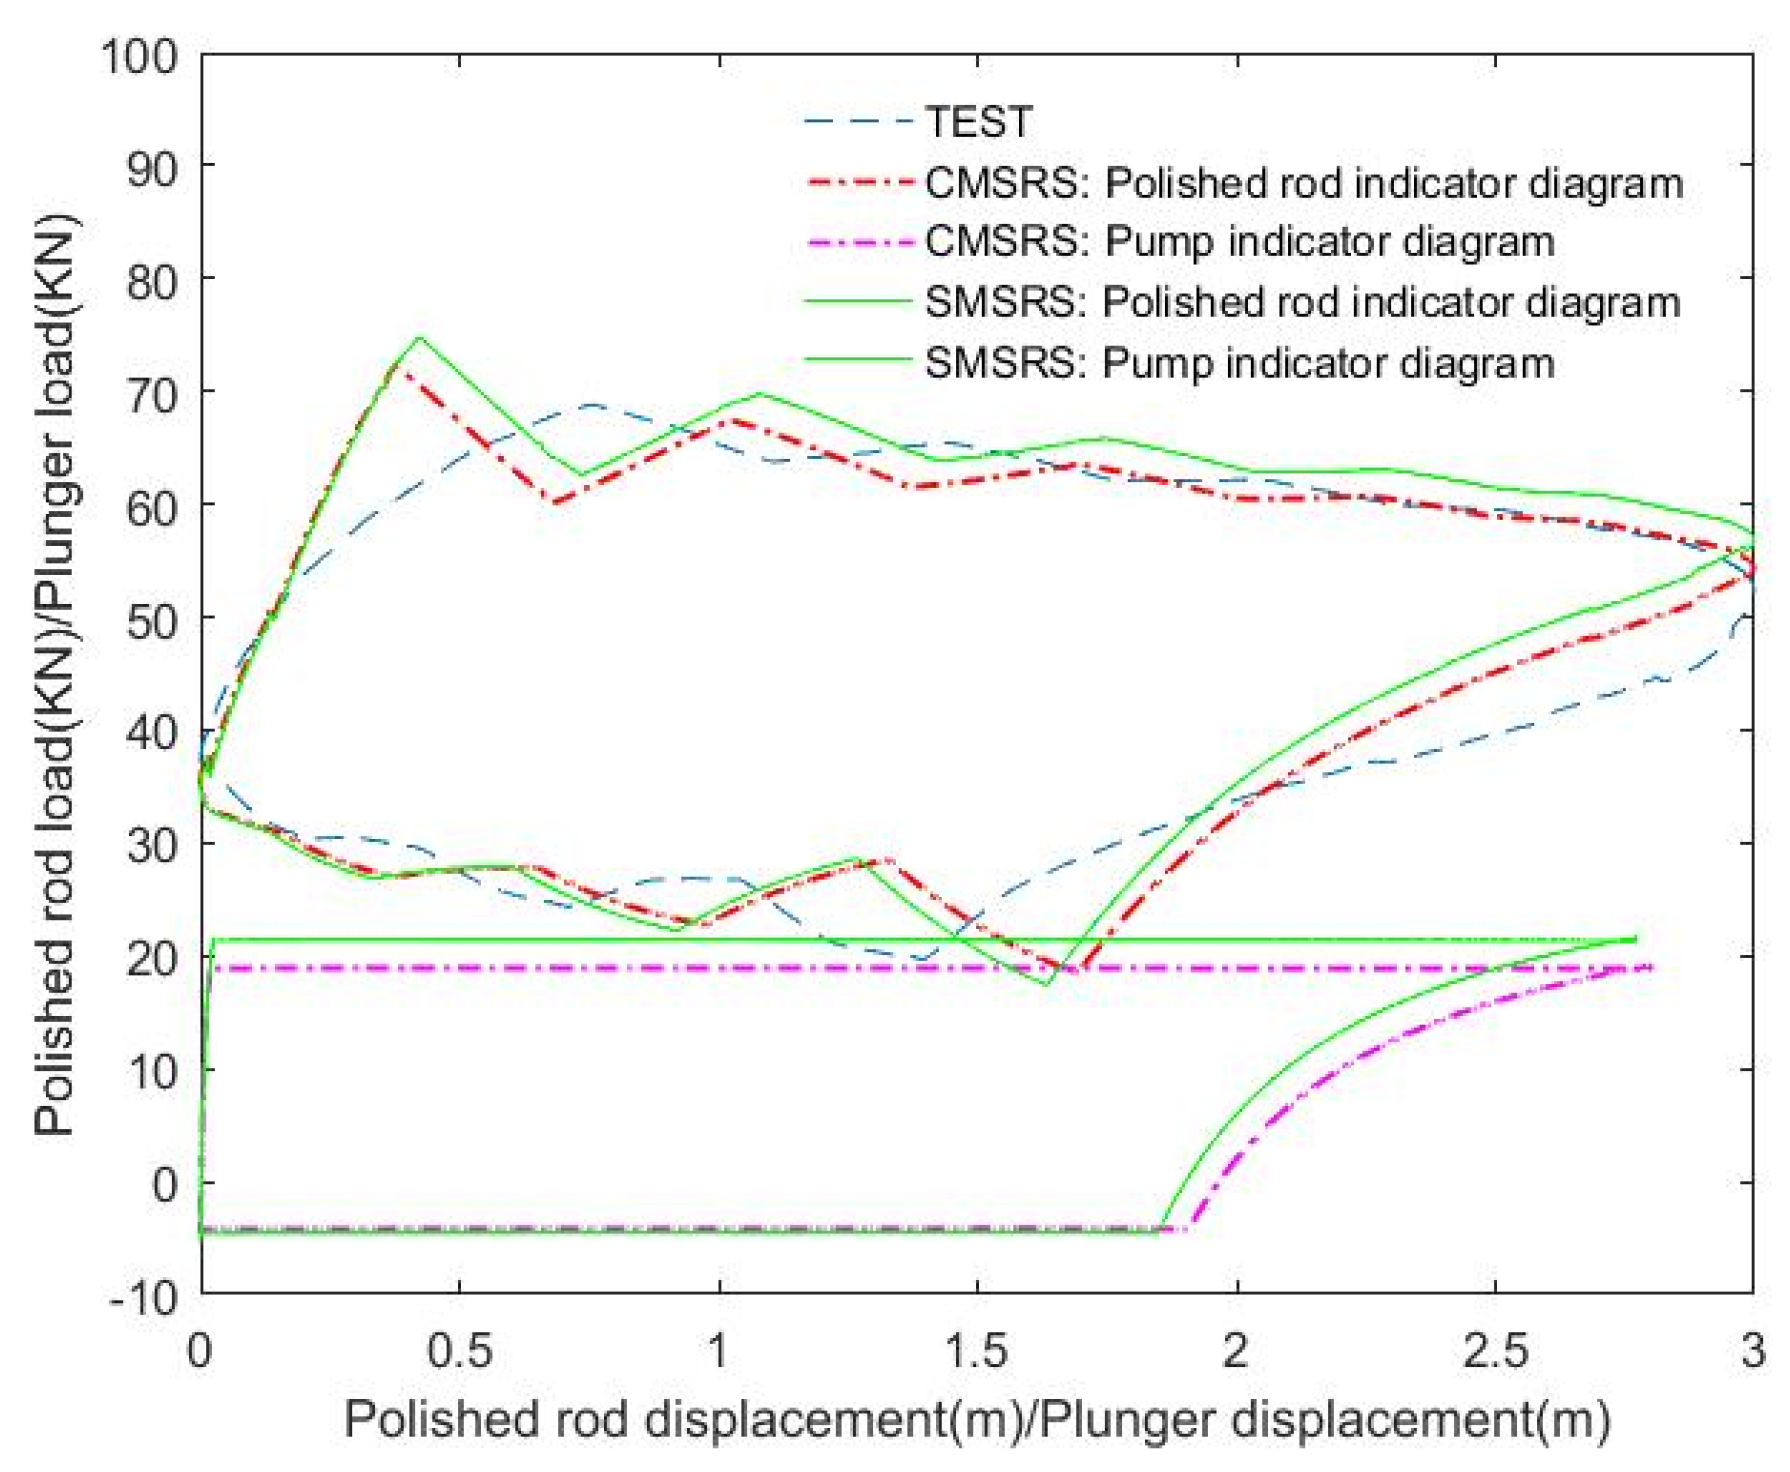
Based on the above well parameters, the simulation showed the power diagram and downhole energy efficiency parameters, and the simulation results were compared with the actual measurement results to verify the model’s accuracy. The simulation model is made up of two parts: the sucker-rod string longitudinal vibration model (simplified model (SMSRS)) based on the oil-water two–phase mixture to calculate the discharge pressure, and the coupling model between the sucker-rod string longitudinal vibration and the multi-phase tubular flow in the wellbore (coupling model (CMSRS)). Among them, the simplified model for the discharge pressure, p d o , of the oil-water two–phase mixture is given as follows:
p d o = p o + ( n w ρ w + ( 1 n w ) ρ o ) L g
Table 1 presents the simulated and measured values of the maximum and minimum polished rod loads, as well as the average power of polished rod power. Additionally, Figure 3 displays the polished rod indicator diagram, the pump indicator diagram for both models and the measured polished rod indicator diagram (TEST).
From the analysis of the data in Figure 2 and Table 1, it can be concluded that the shape of the polished rod indicator diagrams of the SMSRS and the CMSRS and the shape of the measured polished rod indicator diagram are similar. The CMSRS has less simulation error for the maximum, minimum, and average polished rod loads compared to the SMSRS. Using the CMSRS improves the accuracy of the simulation of the pumping well’s dynamic characteristics.

5.1. Analysis of Calculation Results of Discharge Pressure

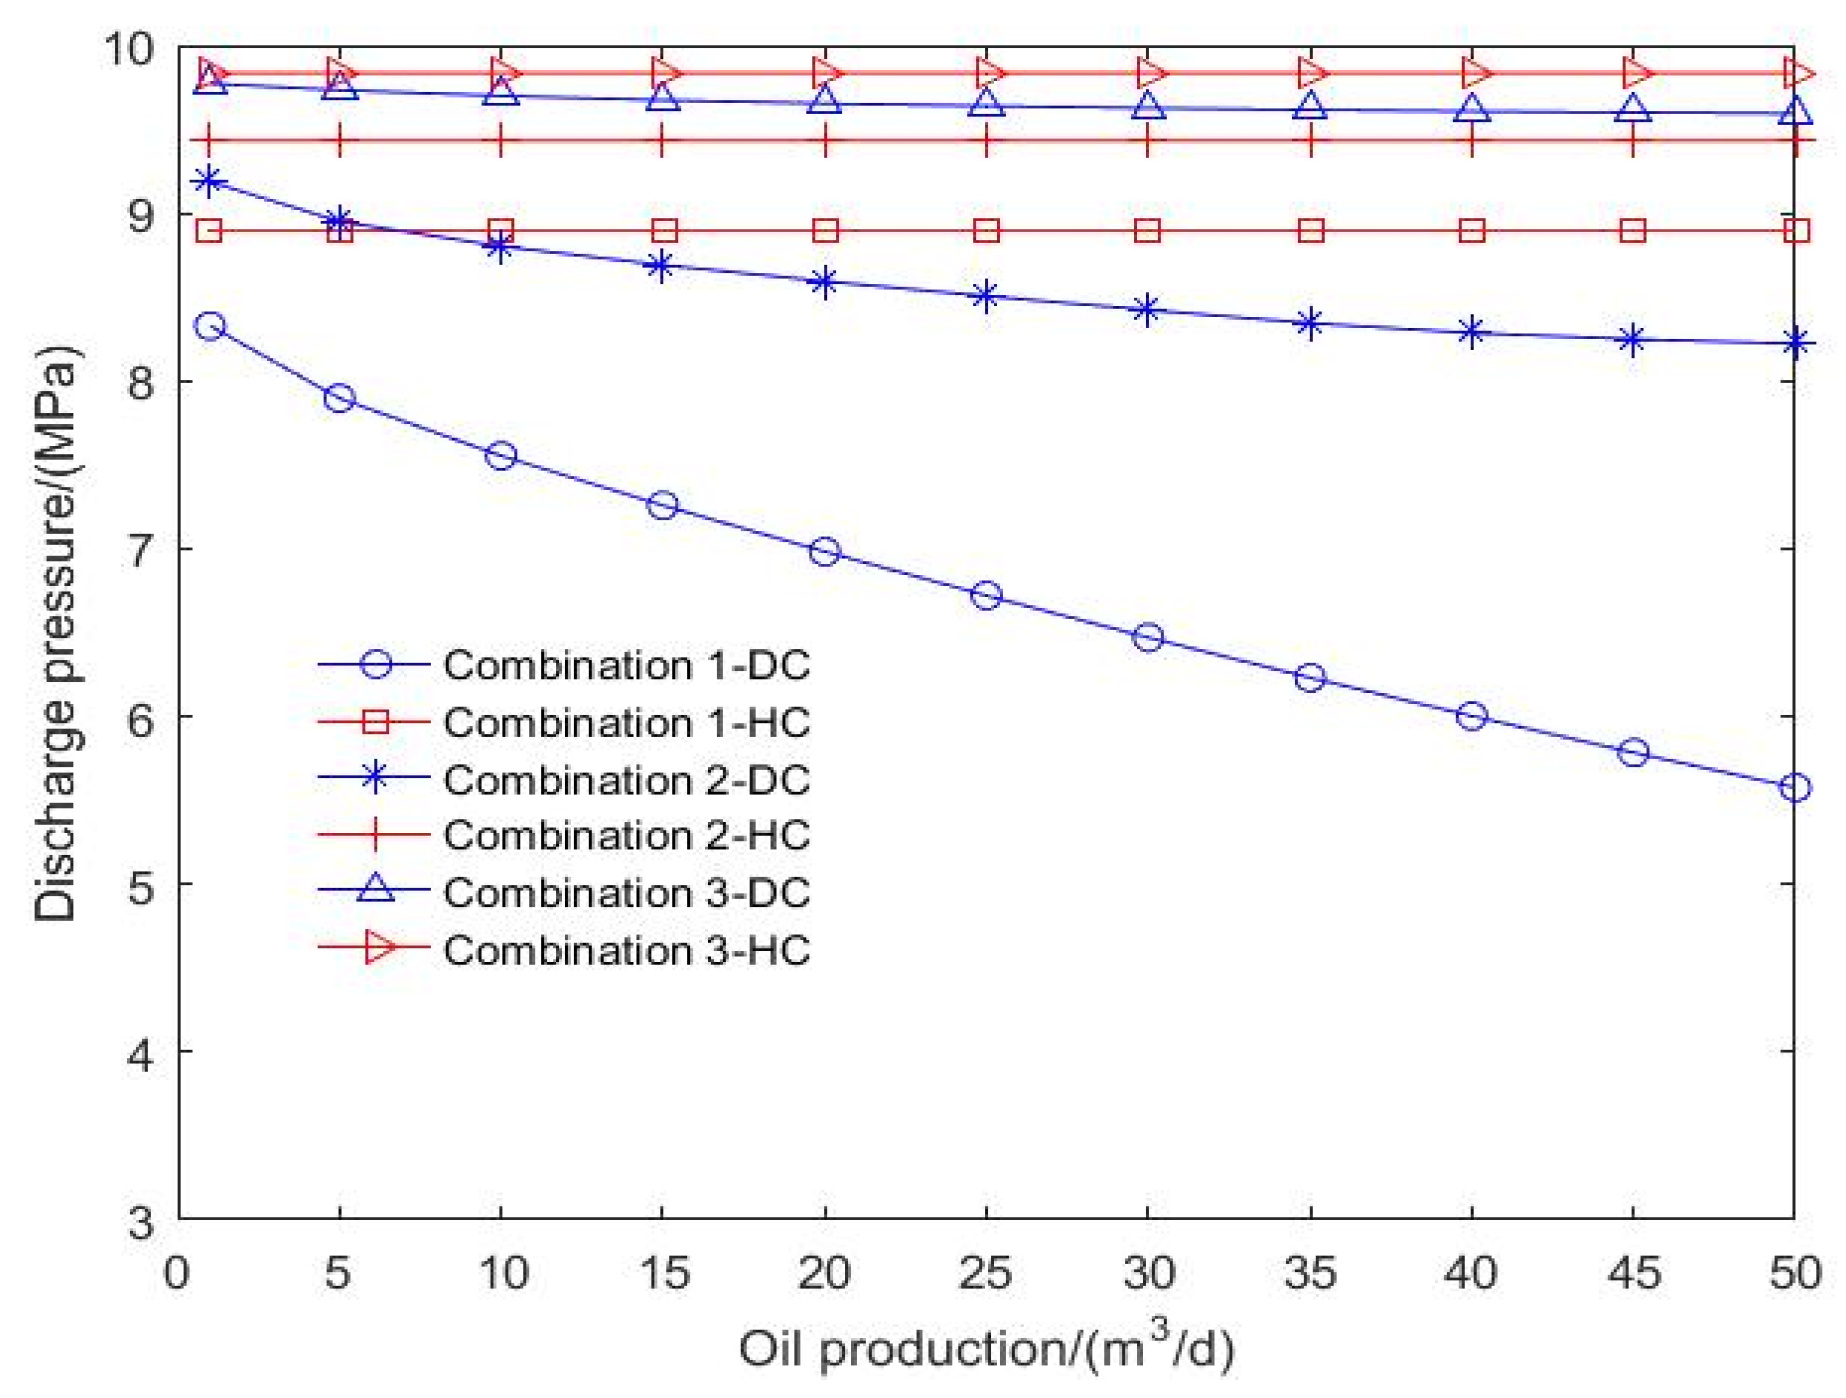
The discharge pressure is calculated based on the multi-phase flow dynamics model (DC) and the oil-water two–phase model (HC). Figure 4 shows the variation of the discharge pressure with oil production for different combinations of water content and gas-oil ratio (GOR; Combination 1: water content 10%, gas-oil ratio (GOR) 100 m3/m3; Combination 2: water content 50%, gas-oil ratio (GOR) 60 m3/m3; Combination 3: water content 80%, gas-oil ratio (GOR) 20 m3/m3).
The results of the comparison of the curves in the figure show that:
(1)
When the HC is used to calculate the discharge pressure, the production does not affect the discharge pressure. However, when the DC is used, the discharge pressure decreases as oil production increases. As the gas-oil ratio (GOR) increases and the water content decreases, the degree of variation in the discharge pressure also increases;
(2)
The discharge pressure calculated by the HC is lower than that calculated by the DC. The difference between the calculated results of the two models is greater when the oil well production is higher, the gas-oil ratio (GOR) is higher, and the water content is lower. This is due to the presence of not only bubbly flows but also slug flow, agitation flow, and annular flow in the fluid flow inside the oil pipe. These flow patterns result in a decrease in the pressure gradient of the fluid and in the discharge pressure.

5.2. Comparison Analysis of Simulation Results of the Indicator Diagram

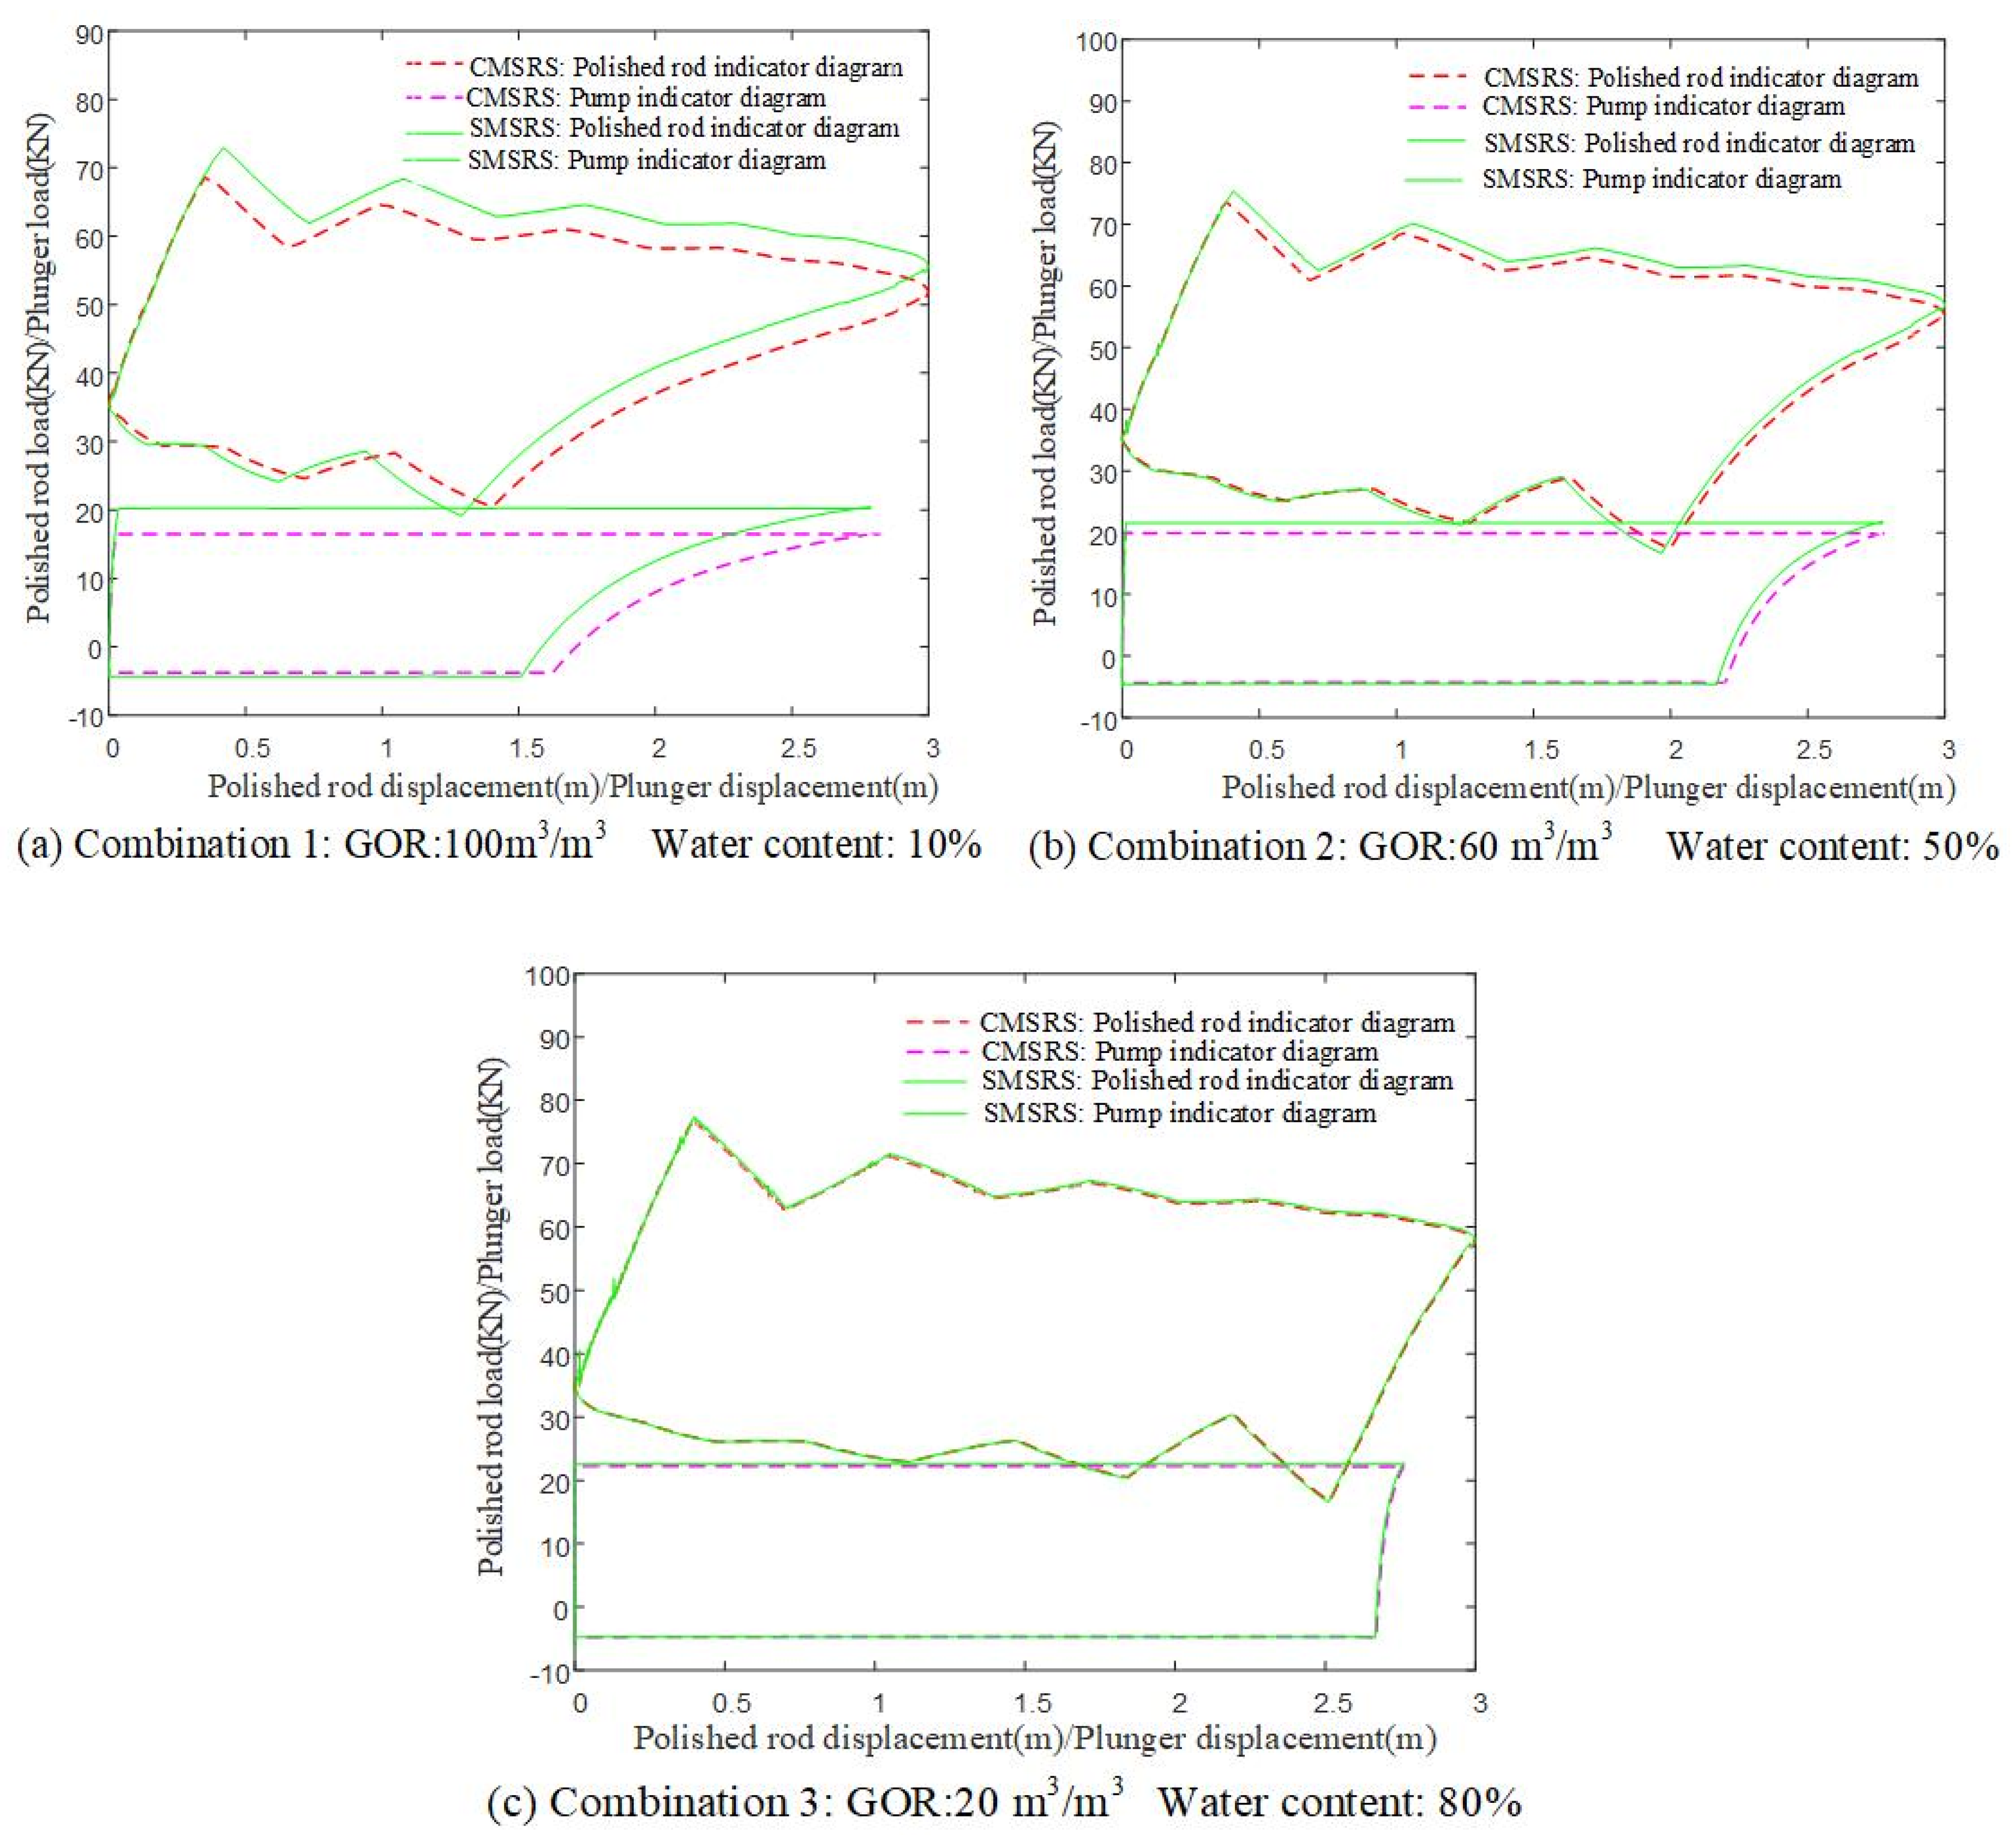
The study calculated dynamic parameters, including the maximum and minimum polished rod load, the average input power of the sucker rod and pumping pump, discharge pressure, and oil production, for two models based on the SMSRS and CMSRS. Figure 5 displays the indicator diagram results for three combinations of gas-oil ratio (GOR) and water content. Table 2 presents the discharge pressure, maximum and minimum polished rod loads, the average input power of the polished rod and pumping pump, and oil production for three combinations of gas-oil ratio (GOR) and water content.
Comparative analysis of the figure and table shows that:
(1)
The simulation indicator diagram of the CMSRS model differs from that of the SMSRS model. The discrepancy between the two models is larger when the water content is lower, and the gas-oil ratio (GOR) is higher;
(2)
The maximum load on the polished rod, as calculated by the CMSRS, is lower than the load calculated by the SMSRS. Conversely, the minimum load on the polished rod, as calculated by the CMSRS, is higher than the load calculated by the SMSRS. This discrepancy is primarily due to variations in the water content and gas-oil ratio. At a gas-oil ratio (GOR) of 100 and water content of 10%, the maximum and minimum polished rod load differences are −17.07% and 20.30%, respectively. Similarly, at a gas-oil ratio (GOR) of 20 and water content of 80%, the maximum and minimum polished rod load differences are only −1.16% and 1.78%, respectively;
(3)
The average power of the polished rod calculated using the CMSRS is less than that calculated using the SMSRS. Similarly, the average pump input power, calculated using the CMSRS, was also less than that calculated using the SMSRS. However, the oil production calculated using the CMSRS was larger than that calculated using the SMSRS. When the gas-oil ratio (GOR) is 100, and the water content is 10%, the average power of the polished rod difference is −18.10% and the oil production difference is 4.43%. When the gas-oil ratio is 20, and the water content is 80%, the average power of the polished rod and the oil production difference are only −1.87% and 0.33%, respectively;
(4)
The main reason for the above results is that the discharge pressure calculated by the DC is smaller than that calculated by the HC. When the gas-oil ratio (GOR) is 100 and the water content is 10%, the difference in the discharge pressure is −33.52%. When the gas-oil ratio (GOR) is 20, and the water content is 80%, the difference in the discharge pressure is only −2.74%.

5.3. Comparison of Effective Power Simulation Results of Different Models

Table 3 displays the results of the effective power calculations using three different models: the industry standard effective power model, the multi-phase flow effective power model, and the effective power model based on the pump energy balance relationship. These models were applied to calculate the effective power under three different combinations of the gas-oil ratio and water content.
The data comparison in Table 3 shows that:
(1)
The effective power of the multi-phase flow model is equivalent to the effective power based on the energy balance equation of the pump. The difference between the calculated results of the available power under the three gas-oil ratios (GORs) and water content combination conditions is only 0.04–1.02%. This verifies the correctness of the effective power model of the multi-phase flow;
(2)
There are significant disparities between the industry standard calculated effective power and the pump energy balance simulation results. The effective power calculation results of the two models differ by −3.50–−17.90% under the combined conditions of three gas-oil ratios (GORs) and water content. Upon analyzing Equations (22) to (23), it became evident that the industry standard effective power calculation model has certain limitations. Specifically, the reciprocating pump transports oil, gas, and water, and its effective power is not only the power of the pump lifting the liquid phase but also the power of the pump lifting the gas phase. However, the industry standard only accounts for the output of the pump that lifts the oil-water mixture and does not consider the output of the pump that lifts the gas phase. The computation of the discharge pressure simplifies the fluid in the wellbore into the mixed liquid oil and water, which increases the discharge pressure and lifting height.

5.4. Simulation Analysis of Downhole Efficiency and Sub-Efficiency

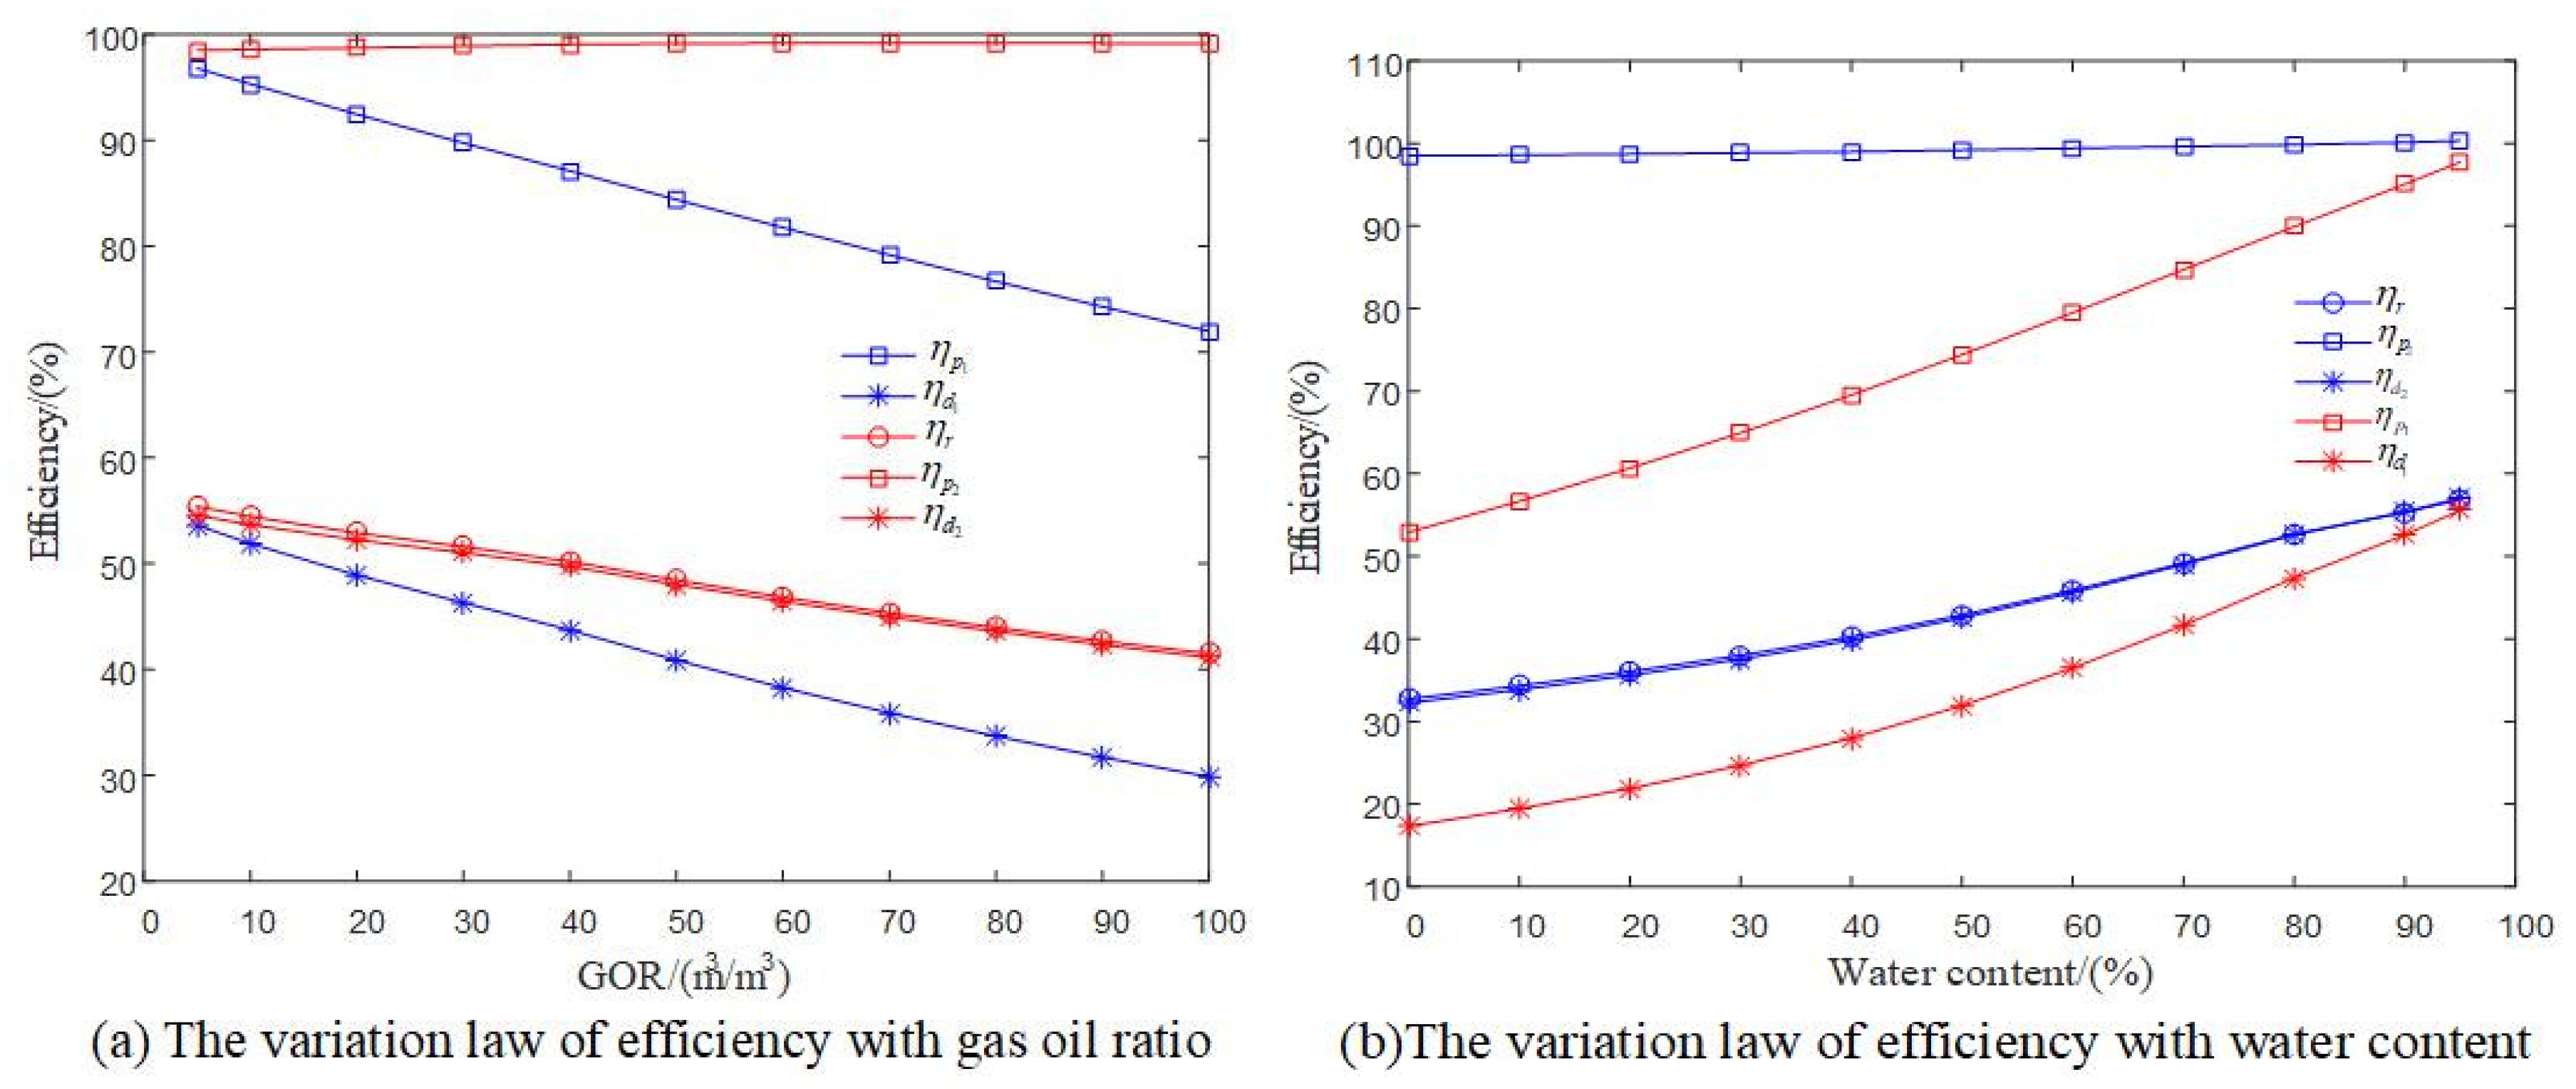
The CMSRS was used to simulate the polished rod indicator diagram, pump indicator diagram, average polished rod power, average pump input power, pump discharge pressure, and oil production based on the given parameters. The effective power was determined using both the industry standard model and the multi-phase flow model. In addition, the downhole efficiency, pump efficiency, and sucker-rod string efficiency were calculated. Figure 6 shows the curves that illustrate how downhole efficiency, sucker-rod string efficiency, and pump efficiency change with respect to the gas-oil ratio (GOR), water content, and dynamic liquid length.
Based on the analysis of the figure, it can be inferred that: (1) When calculating effective power, variations exist in the results of calculating downhole efficiency between an industry standard model and a multi-phase flow model in a tubing system. The difference in downhole efficiency, calculated by the two models, becomes more significant with decreasing water content, increasing gas-oil ratio (GOR), and deeper dynamic fluid surface. This relationship suggests that the lower the water content and the higher the gas-oil ratio (GOR), the greater the impact on the difference in downhole efficiency between the two models. Additionally, a deeper dynamic fluid surface also contributes to a more significant difference in downhole efficiency. For example, the downhole efficiency for a gas-oil ratio (GOR) of 100 m 3 / m 3 is 29.87% using the industry standard model, compared to 41.14% using the multi-phase piping flow model. For a dynamic liquid surface of 900 m, the downhole efficiency is 21.21% using the industry standard model, compared to 33.84% using the multi-phase pipe flow model.
(1)
When the effective power is calculated using the multi-phase pipe flow model, the pump’s efficiency approaches 100%, and the impacts of the gas-oil ratio, water content, and dynamic liquid length are minimal. The pump’s efficiency under the simulated thin oil conditions in this study was found to be nearly 100%, consistent with the experimental findings. When based on the industry standard model, the pump efficiency is below 100% and is highly dependent on various parameters. For example, the pump efficiency varies depending on the water content and gas-oil ratio (GOR). At a water content of 10%, the pump efficiency is 56.66%, while at a gas-oil ratio (GOR) of 100, the pump efficiency is 71.95%. However, at a gas-oil ratio (GOR) of 5 m 3 / m 3 and a water content of 95%, the pump efficiency is nearly 100%. The results of the downhole efficiency calculation also reveal the constraints of the industry standard effective power model;
(2)
In the presence of thin oil and normal clearance leakage in the pump, the primary cause of downhole power loss in the pumping unit is frictional power loss in the rod. Pump power loss is negligible, resulting in downhole efficiency being nearly equal to the rod efficiency;
(3)
The impact of wellbore parameters on downhole efficiency is significant. An increase in the gas-oil ratio and water content results in a decrease in downhole efficiency. An inflection point exists in the relationship between downhole efficiency and submergence degree. This suggests that there is an optimal submergence degree in the pumping well that maximizes downhole efficiency. Hence, optimizing the parameters of swabbing can considerably enhance the downhole and system efficiency.

6. Conclusions

(1)
Significant differences are present between the discharge pressure obtained from the multi-phase pipe flow model and that obtained from the hydrostatic column model for oil and water. Given that the wellbore of the pumping unit involves a multi-phase flow of oil, gas, and water, it is imperative to compute the discharge pressure using a multi-phase pipe flow model. Additionally, it is crucial to develop a simulation model for the longitudinal vibration of the rod string;
(2)
The CMSRS model was developed by integrating the multi-phase pipe flow model with the longitudinal vibration of the sucker-rod string. This model was utilized to determine the discharge pressure in the system’s dynamic simulation. The experimental results demonstrated that the simulation model effectively improves the accuracy of the simulation for both indicators and energy efficiency;
(3)
Based on the simulation results of the pump indicator diagram and the energy balance relationship, a simulation model was established to determine the effective power of the system. The accuracy of the multi-phase flow effective power calculation model was demonstrated by comparing its simulation results with those of the industry standard and multi-phase flow models while also highlighting the limitations of the industry standard model;
(4)
The impact of wellbore parameters, including the gas-oil ratio, water content, and dynamic liquid level, on the efficiency of downhole, rod, and pump operations was analyzed. The simulation results indicated that the pump operates with high efficiency, and the efficiency of the rod primarily affects the downhole efficiency. Downhole efficiency is significantly affected by water content and the gas-oil ratio. Optimizing swabbing parameters and achieving appropriate sinking depths can greatly improve downhole efficiency.

Author Contributions

Conceptualization, B.M.; Methodology, B.M.; Software, B.M.; Validation, B.M.; Data curation, S.D.; Writing—original draft, B.M.; Writing—review & editing, S.D.; Visualization, Biao Ma and S.D.; Supervision, S.D. All authors have read and agreed to the published version of the manuscript.

Funding

National Natural Science Foundation of China: 51974276.

Data Availability Statement

Due to the privacy of the data, the data in this paper cannot be publicly published.

Conflicts of Interest

The authors declare no conflict of interest.

Appendix A

The mathematical model for the longitudinal vibration of the sucker-rod string can be expressed in differential form as follows:
Newton’s Precedence Formula for Time and Space:
u t k , j = u k , j + 1 u k , j Δ t k = 1 , 2 , 3 , , K   j = 1 , 2 , 3 , ,   J 2 u t 2 k , j = u k , j + 1 2 u k , j + u k , j 1 Δ t 2 k = 1 , 2 , 3 , , K   j = 1 , 2 , 3 , ,   J
u s k , j = u k + 1 , j u k , j Δ s k = 1 , 2 , 3 , , K   j = 1 , 2 , 3 , ,   J 2 u s 2 k , j = u k + 1 , j 2 u k , j + u k 1 , j Δ s 2 k = 1 , 2 , 3 , , K   j = 1 , 2 , 3 , ,   J
Substitute Equations (A1) and (A2) into Equation (1):
u i k , j + 1 = ( Δ s ) 2 + ( Δ s ) 2 Δ t 1 ( 2 ( Δ s ) 2 2 ( Δ t ) 2 c i 2 + ( Δ s ) 2 Δ t ) u i k , j ( Δ s ) 2 u i k , j 1 + ( Δ t ) 2 c i 2 u i k + 1 , j + ( Δ t ) 2 c i 2 u i k 1 , j υ i d u 0 d t d 2 u 0 d t 2 sgn u i k , j h i E i A i u i k + 1 , j u i k , j Δ s θ i k θ i k 1 Δ s q i sin θ i k 2 + E i A i u i k + 1 , j u i k , j Δ s sin θ i k θ i k θ i k 1 Δ s 2 + ρ i g cos θ i k
Discretization of boundary conditions:
u 1 0 , j = u 0 j
u I K , j + 1 = E I A I 2 u I K 1 , j + 1 1 2 u I K 2 , j + 1 + P p j + 1 Δ x 3 2 E I A I
Discretization of continuity conditions:
E i A i u i s i , t s i | s i = L i = E i + 1 A i + 1 u i + 1 s i + 1 , t s i + 1 | s i + 1 = 0
According to Taylor’s formula:
u i k 1 , j = u i k , j u i s i Δ s i + 2 u i s 2 i 1 2 Δ s i 2 u i + 1 k 1 , j = u i k , j u i + 1 s i + 1 Δ s i + 1 + 2 u i + 1 s 2 i + 1 1 2 Δ s i + 1 2
According to Equation (A7):
u i s i = u i k , j u i k 1 , j Δ s i + 2 u i 2 s i 1 2 Δ s i u i + 1 s i + 1 = u i + 1 k , j u i + 1 k 1 , j Δ s i + 1 + 2 u i + 1 2 s i + 1 1 2 Δ s i + 1
According to Equations (A1), (A2) and (A6)–(A8):
u i ( K 1 ) + 1 , j = O 2 O 1 u K i 1 + 2 , j 1 + O 3 O 1 u K i 1 + 1 , j 1 + O 4 O 1 u K i 1 + 1 , j 2 + O 5 O 1 u K i 1 , j 1 + O 6 O 1 a 0 j 1 + O 7 O 1 u 0 j 1 + F r t K i 1 + 1 × s i g n v K i 1 , j × Δ s i E i A i h 1 2 c 2 i Δ s i 1 E i 1 A i 1 h O 1
where:
v K i 1 + 1 , j = u K i 1 + 1 , j 1 u K i 1 + 1 , j 2 Δ t h = sin θ K i 1 + 1 × φ K i 1 + 1 φ K i 1 2 + θ K i 1 + 1 θ K i 1 2 ρ i A i 1 h 1 = sin θ K i 1 + 1 × φ K i 1 + 1 φ K i 1 2 + θ K i 1 + 1 θ K i 1 2 ρ i A i F r t K i 1 + 1 = E i A i u K i 1 + 1 , j 1 u K i 1 , j 1 Δ t θ K i 1 + 1 θ K i 1 Δ s K i 1 + 1 q i sin θ K i 1 2 + E i A i u K i 1 + 1 , j 1 u K i 1 , j 1 Δ t sin θ K i 1 φ K i 1 + 1 φ K i 1 Δ s 2
O 1 = E i 1 A i 1 Δ s i 1 2 c 2 i 1 Δ t 2 + υ i 1 E i 1 A i 1 Δ s i 1 2 c 2 i 1 Δ t + E i A i Δ s i 2 c 2 i Δ t 2 + υ i E i A i Δ s i 2 c 2 i Δ t O 2 = E i A i Δ s i O 3 = E i A i Δ s i E i 1 A i 1 Δ s i 1 + E i A i Δ s i c 2 i Δ t 2 + υ i E i A i Δ s i 2 c 2 i 1 Δ t + E i 1 A i 1 Δ s i 1 c 2 i 1 Δ t 2 + υ i 1 E i 1 A i 1 Δ s i 1 2 c 2 i 1 Δ t O 4 = E i A i Δ s i 2 c 2 i 1 Δ t 2 E i 1 A i 1 Δ s i 1 2 c 2 i 1 Δ t 2 O 5 = E i 1 A i 1 Δ s i 1 O 6 = E i A i Δ s i 2 c 2 i E i 1 A i 1 Δ s i 1 2 c 2 i 1 O 7 = υ i Δ s i E i A i 2 c 2 i υ i 1 Δ s i 1 E i 1 A i 1 2 c 2 i 1
The discrete formats of the displacement of the sucker-rod string at the first moment and the second moment are:
u i k , 0 = 0
u i k , 1 = 0
The discretization formats of the upper boundary conditions for the first and second moments are:
u 0 0 = 0
u 0 1 = 0
The discretization formats of the lower boundary conditions for the first and second moments are:
P p 0 = A p Δ p d + A r d p d + π L p D Δ p d δ 2 L p
P p 1 = A p Δ p d + A r d p d + π L p D Δ p d δ 2 L p
By solving Equations (A3)–(A5) and (A9)–(A17), u i can be solved.

References

  1. Gibbs, S.G. Predicting the Behavior of Sucker Rod Pumping Systems; Shell Development Co.: Houston, TX, USA, 1963; Volume 6, pp. 1–10. [Google Scholar] [CrossRef]
  2. Doty, D.R.; Schmidt, Z. An improved model for sucker rod pumping. Soc. Pet. Eng. J. 1983, 23, 33–41. [Google Scholar] [CrossRef]
  3. Lekia, S.D.; Evans, R.D. A coupled rod and fluid Dynamic model for predicting the behavior of sucker-rod pumping system. SPE Prod. Oper. 1995, 10, 26–40. [Google Scholar] [CrossRef]
  4. Shardakov, I.N.; Wasserman, I.N. Numerical Modeling of Longitudinal Vibration of a Sucker Rod String. J. Sound Vib. 2010, 329, 317–327. [Google Scholar] [CrossRef]
  5. Everitt, T.A.; Jennings, J.W. An Improved Finite Difference Calculation of Downhole Dynamometer Cards for Sucker Rod Pumps. SPE Prod. Oper. 1992, 7, 121–127. [Google Scholar] [CrossRef]
  6. Schafer, D.J.; Jennings, J.W. An Investigation of Analytical and Numerical Sucker Rod Pumping Mathematical Models; SPE-16919-MS; Society of Petroleum Engineers: Richardson, TX, USA, 1987. [Google Scholar] [CrossRef]
  7. Xing, M.M. Response Analysis of Longitudinal Vibration of Sucker Rod String Considering Rod Buckling. Adv. Eng. Softw. 2016, 99, 49–58. [Google Scholar] [CrossRef]
  8. Li, W.C.; Dong, S.M.; Sun, X.R. An Improved Sucker Rod Pumping System Model and Swabbing Parameters Optimized Design. Math. Probl. Eng. 2018, 2018, 4746210. [Google Scholar] [CrossRef]
  9. Xing, M.; Zhou, L.; Zhang, C.; Xue, K. Simulation Analysis of Nonlinear Friction of Rod String in Sucker Rod Pumping System. J. Comput. Nonlinear Dyn. 2019, 14, 091008. [Google Scholar] [CrossRef]
  10. Li, Q.; Chen, B.; Huang, Z.; Tang, H. Study on Equivalent Viscous Damping Coefficient of Sucker Rod Based on the Principle of Equal Friction Loss. Math. Probl. Eng. 2019, 2019, 9272751. [Google Scholar] [CrossRef]
  11. Moreno, G.A.; Garriz, A.E. Sucker Rod String Dynamics in Deviated Wells. J. Pet. Sci. Eng. 2020, 184, 106534. [Google Scholar] [CrossRef]
  12. Wang, X.; Lv, L.; Li, S.; Pu, H. Longitudinal vibration analysis of sucker rod based on a simplified thermo-solid model. J. Comput. Nonlinear Dyn. 2021, 196, 107951. [Google Scholar] [CrossRef]
  13. Hasan, A.R.; Kabir, C.S. Two-phase flow in vertical and inclined annuli. Int. J. Multiph. Flow 1992, 18, 279–293. [Google Scholar] [CrossRef]
  14. Li, W.; Vaziri, V.; Aphale, S.S.; Dong, S.; Wiercigroch, M. Dynamics and frequency and voltage control of downhole oil pumping system. Mech. Syst. Signal Process. 2020, 139, 106562. [Google Scholar] [CrossRef]
  15. Xing, M.M.; Dong, S. An improved longitudinal vibration model and dynamic characteristic of sucker rod string. J. Vibro Eng. 2014, 16, 3432–3448. [Google Scholar]
  16. Li, W.; Vaziri, V.; Aphale, S.S.; Dong, S.; Wiercigroch, M. Energy saving by reducing motor rating of Sucker-Rod Pump systems. Energy 2021, 228, 120618. [Google Scholar] [CrossRef]
  17. Wang, H.; Dong, S.; Gan, Q.; Xin, H.; Zhu, G. Dynamic parameter simulation model of low-production pumping well and the ways to improve system efficiency. Shiyou Xuebao/Acta Pet. Sin. 2018, 39, 1299–1307. [Google Scholar] [CrossRef]
  18. Dong, S. Study on a new method for calculating effective power of pumping wells. Pet. Mach. 2003, 10, 19–22+75. (In Chinese) [Google Scholar]
  19. Lukasiewicz, S.A. Dynamic Behavior of the Sucker Rod String in the Inclined Well. In Proceedings of the SPE Production Operations Symposium, Oklahoma City, OK, USA, 7–9 April 1991; SPE 21665. Society of Petroleum Engineers: Richardson, TX, USA, 1991; pp. 313–321. [Google Scholar] [CrossRef]
  20. Zhang, B.; Gao, X.; Li, X. Complete Simulation and Fault Diagnosis of Sucker-Rod Pumping. SPE Prod. Oper. 2021, 36, 277–290. [Google Scholar] [CrossRef]
  21. Sun, X.; Dong, S.; Li, W.; Zhang, W. The numerical simulation of entire sucker rod string buckling with coupling in vertical wells. Clust. Comput. 2018, 22, 12283–12295. [Google Scholar] [CrossRef]
  22. Antonietti, P.; Formaggia, L.; Scotti, A.; Verani, M.; Verzott, N. Mimetic finite difference approximation of flows in fractured porous media. ESAIM Math. Model. Numer. Anal. 2016, 50, 809–832. [Google Scholar] [CrossRef] [Green Version]
  23. Ahmadianfar, I.; Heidari, A.A.; Gandomi, A.H.; Chu, X.; Chen, H. RUN beyond the metaphor: An efficient optimization algorithm based on Runge Kutta method. Expert Syst. Appl. 2021, 181, 2–22. [Google Scholar] [CrossRef]
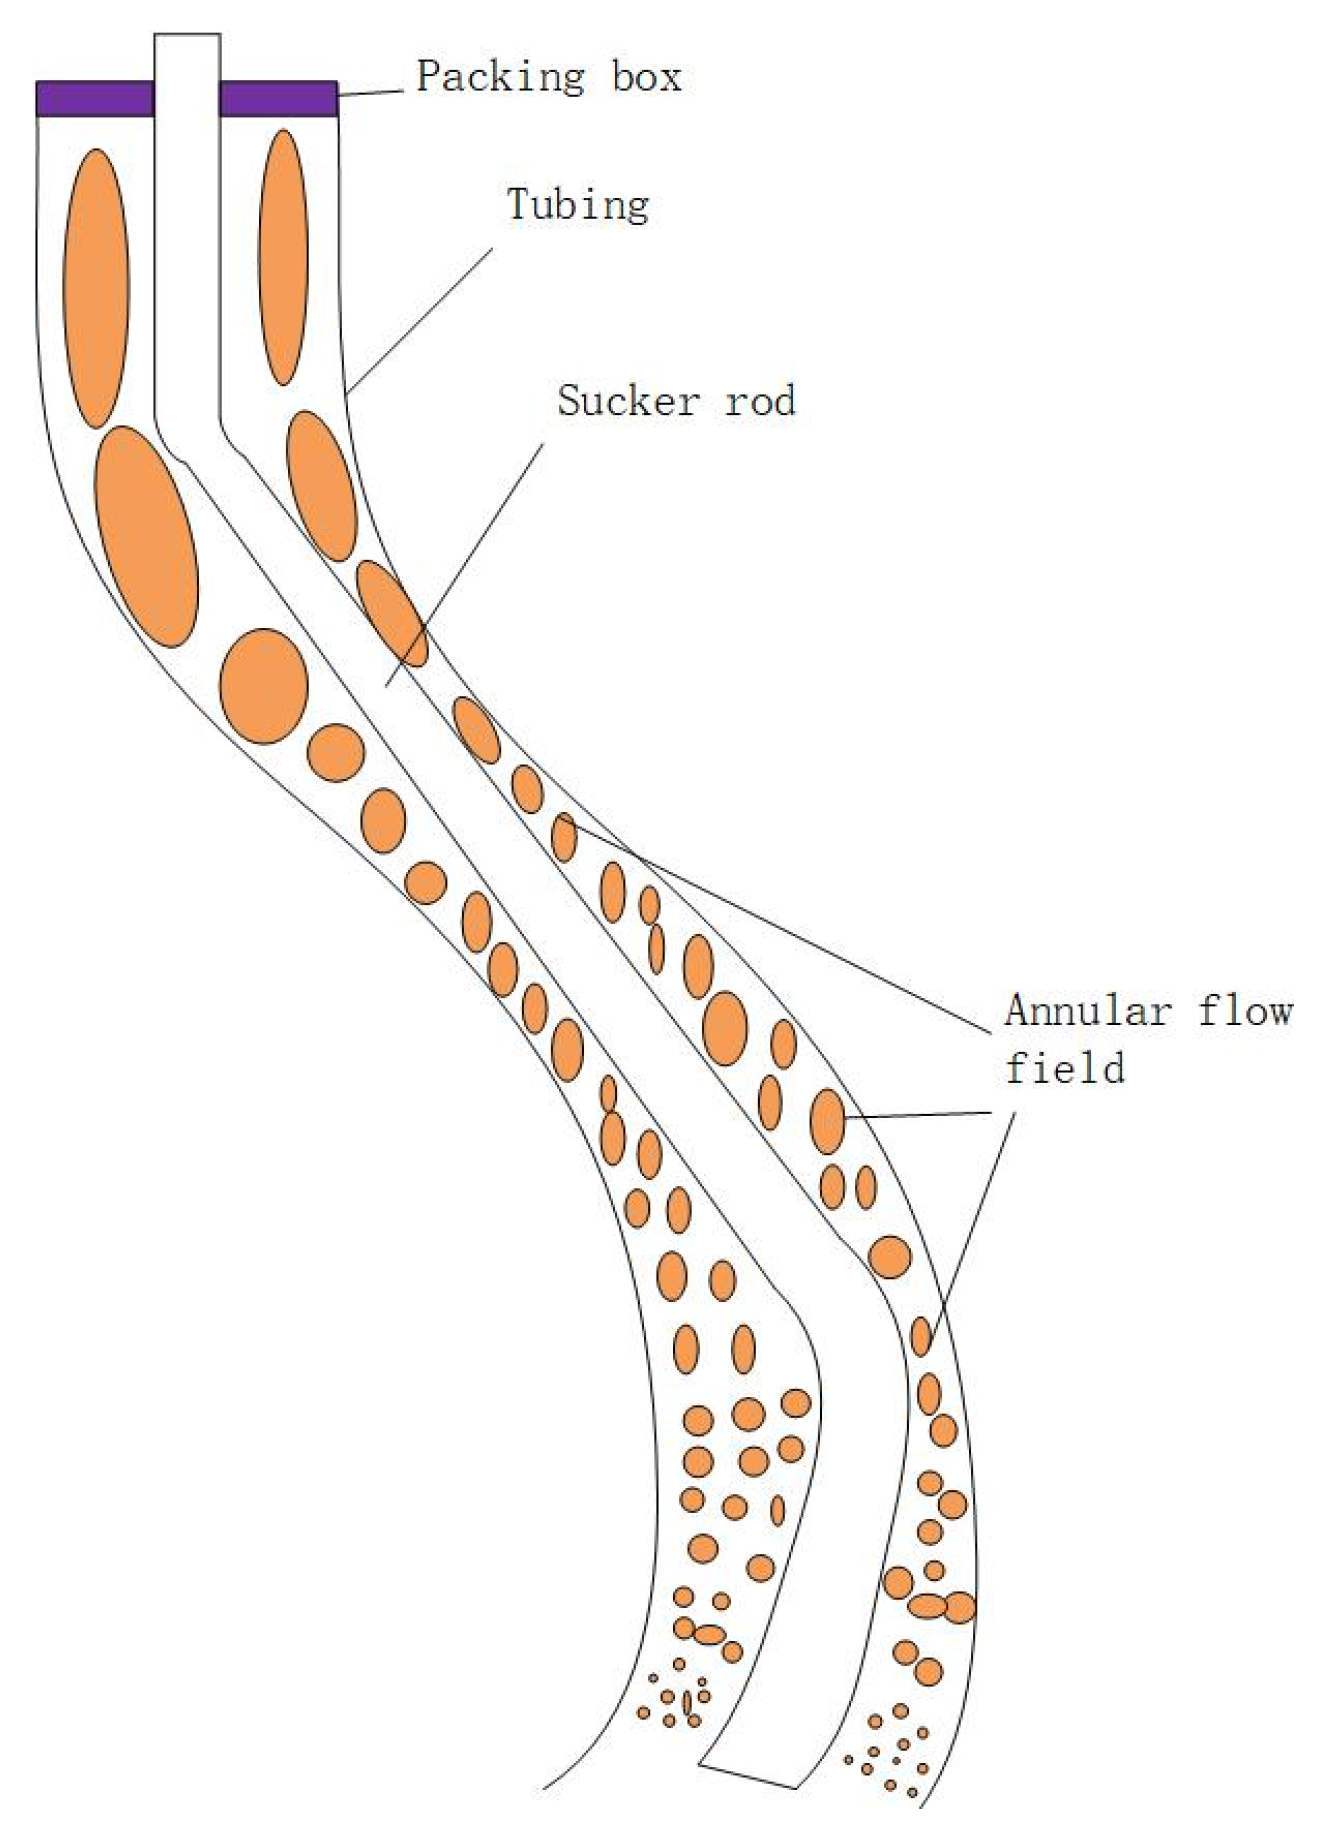
Figure 1. Flow field structure diagram.
Energies 16 04988 g001
Figure 2. Algorithm flow chart.
Energies 16 04988 g002
Figure 3. Curve of the indicator diagram.
Energies 16 04988 g003
Figure 4. Variation Law of discharge pressure with output.
Energies 16 04988 g004
Figure 5. Comparison of indicator diagrams under different combination conditions.
Energies 16 04988 g005
Figure 6. Variation law of efficiency with wellbore influence parameters.
Energies 16 04988 g006aEnergies 16 04988 g006b
Table 1. Comparison between simulation results and measured.
ParameterTESTCMSRSSMSRS
SimulationError/%SimulationError/%
PRLmax/kN68.8566.46−3.4775.549.72
PRLmin/kN19.6319.851.1216.63−15.28
Nprm/kW10.209.74−4.5111.3010.79
Table 2. Comparison of simulation results of different combinations of water content and GOR.
ParameterGOR 100 m3/m3Water Content 10%GOR 60 m3/m3Water Content 50%GOR 20 m3/m3Water Content 80%
CMSRSSMSRSError/(%)CMSRSSMSRSError/(%)CMSRSSMSRSError/(%)
pd/MPa5.918.89−33.528.199.43−13.159.579.84−2.74
PRLmax/KN61.1173.69−17.0771.1476.02−6.4276.9677.86−1.16
PRLmin/KN21.9318.2320.3018.0116.0712.0716.6216.331.78
Pprm/KW8.5610.44−18.0110.8011.79−8.4012.5912.83−1.87
Ppm/KW2.944.61−36.235.196.12−15.207.117.36−3.40
Q/m3/d42.0240.244.4367.1365.961.7787.3187.020.33
Table 3. Calculated values of different effective power under different combination conditions.
ParameterWater Content 10%, GOR 100 m3/m3Water Content 50%, GOR 60 m3/m3Water Content 80%, GOR 20 m3/m3
Ne1/kW3.126.127.36
Ne2/kW2.915.167.10
Ne3/kW2.945.197.11
Ne2l/kW1.674.346.95
Ne2g/kW1.240.820.15
Disclaimer/Publisher’s Note: The statements, opinions and data contained in all publications are solely those of the individual author(s) and contributor(s) and not of MDPI and/or the editor(s). MDPI and/or the editor(s) disclaim responsibility for any injury to people or property resulting from any ideas, methods, instructions or products referred to in the content.