Article

Optimal Scheduling of the Wind-Photovoltaic-Energy Storage Multi-Energy Complementary System Considering Battery Service Life

1
College of Energy and Power Engineering, North China University of Water Resources and Electronic Power, Zhengzhou 450045, China
2
Henan Fluid Machinery Engineering Research Center, Zhengzhou 450045, China
*
Author to whom correspondence should be addressed.
Energies 2023, 16(13), 5002; https://doi.org/10.3390/en16135002
Submission received: 29 May 2023 / Revised: 15 June 2023 / Accepted: 19 June 2023 / Published: 28 June 2023
(This article belongs to the Section D: Energy Storage and Application)

Abstract

:
Under the background of “peak carbon dioxide emissions by 2030 and carbon neutrality by 2060 strategies” and grid-connected large-scale renewables, the grid usually adopts a method of optimal scheduling to improve its ability to cope with the stochastic and volatile nature of renewable energy and to increase economic efficiency. This article proposes a short-term optimal scheduling model for wind–solar storage combined-power generation systems in high-penetration renewable energy areas. After the comprehensive consideration of battery life, energy storage units, and load characteristics, a hybrid energy storage operation strategy was developed. The model uses the remaining energy in the system after deducting wind PV and energy storage output as the “generalized load”. An improved particle swarm optimization (PSO) is used to solve the scheduling schemes of different running strategies under different objectives. The optimization strategy optimizes the battery life-loss coefficient from 0.073% to 0.055% under the target of minimizing the mean squared deviation of “generalized load”, which was optimized from 0.088% to 0.053% under the minimized fluctuation of combined system output and optimized from 0.092% to 0.081% under the minimized generation costs of the combined system. The results show that the model can ensure a stable operation of the combined system, and the operation strategy proposed in this article effectively reduces battery life loss while reducing the total power generation cost of the system. Finally, the superiority of the improved PSO algorithm was verified.

1. Introduction

The strategy in China of achieving “peak carbon dioxide emissions” by 2030 and “carbon neutrality” by 2060 points out that “the proportion of non-fossil energy in primary energy consumption should reach about 25% by 2030 [1], the total installed capacity of wind and solar energy should reach more than 1.2 billion kilowatts, and the proportion of renewable energy generation should reach more than 70% by 2060” [2]. The scale of construction of renewable energy generation is bound to continually increase in order to meet the strategic objectives [3]. A grid that is connected to such a large scale of randomly fluctuating renewable energy sources will lead to new problems and challenges with grid stability and power quality [4], relying only on the flexibility of thermal power units for regulation, which will inevitably result in frequent startups and shutdowns of thermal power units or prolonged operation in a deep peaking state. This will seriously threaten the safety and economy of grid operations and the traditional power system operation mode, where thermal power shares too much of the peaking task, increases fluctuations in thermal power output, reduces generation efficiency, and increases coal consumption [5,6]. Therefore, the operation mechanism of the power system needs to be innovative, and renewable energy sources, such as wind power, photovoltaic and energy storage, are usually considered as a whole to form a combined generation system to solve the above problems [7]. Therefore, it is of great significance to fully explore the adjustment ability of flexible power supply in the combined generation system and improve the consumption of renewable energy while meeting the demand of peak regulation and dispatching.
Experts and scholars at home and abroad have focused their research on multi-energy hybrid systems on energy sources, such as energy storage, wind, and PV. Lu et al. [8] established a multi-energy complementary scheduling model of “wind, PV, thermal, Pumped storage”. The article considers the cost of power generation for conventional units operating at low loads and ramping conditions. Zhang and Wu et al. [9,10] proposed a multi-objective short-term stepwise optimal hydropower scheduling model with the load fluctuation and the system’s integrated costs as objectives, with the difference that the former is solved by converting it into a linear mixed-integer model, while the latter is solved by a multi-objective intelligent algorithm. However, there is limited ability to smooth out the load fluctuations by exploiting the complementary wind–solar and hydropower systems. Therefore, Wang and Al Shereiqi et al. [11,12] used batteries and super-capacitors as hybrid energy storage devices for wind–solar complementary systems, where the capacity optimization configuration of the energy storage system in wind–solar complementary power generation was studied, and the load deficit and energy waste rates were considered as constraints. However, energy storage equipment is costly, and the configuration of the type and capacity of energy storage power supply is crucial when meeting the requirements of the grid. Sun et al. [13] used the flexible schedule of pumped storage to spatially level the output of intermittent energy sources, smooth the generalized load curve and smooth out fluctuations, modeling the introduction of a multi-objective function with a maximum output of multiple energy sources and minimum fluctuations in generalized load for wind–solar storage. Abdelshafy et al. [14] proposed a hybrid energy storage system comprising pumped storage and storage batteries. Compared with a single battery or single-pumped storage systems, hybrid energy storage systems can effectively reduce power costs and interact with the main grid, complementing the advantages and disadvantages of both by compensating for long-term low-frequency power and short-term high-frequency power, respectively. Hybrid energy storage is an effective way to improve the utilization of new energy sources in the grid. Compared to single energy storage, the hybrid energy storage system can combine the advantages and disadvantages of different energy storage systems to improve the performance of the system, and the optimal scheduling of the grid containing hybrid energy storage devices has become a hot topic of research for scholars at home and abroad in recent years.
Researchers’ research on battery energy storage life loss starts from its own life decay mechanism and studies the impact of various factors during operation on battery energy storage life. In order to simplify the calculation, Teleke et al. [15] limited the number of battery cycles during the scheduling cycle and limited the remaining capacity to a certain range. However, it is difficult to represent the dynamic changes in battery energy storage during operation with a fixed number of cycles. The throughput method, used by He et al. [16] is a simple and feasible life prediction method proposed to solve the problem concerning the number of cycles in battery operation, which is difficult to be counted. Xu et al. [17] used the weighted throughput method to develop a battery life evaluation model to discuss the effects of the depth and number of battery charges and discharges on the lifetime, which can more accurately reflect the economics of the energy storage system during the battery’s life cycle.
In terms of solving models, intelligent heuristic algorithms can efficiently handle problems with a large number of decision variables. Zhang et al. [18] converted the multi-objective model into a mixed-integer linear programming (MILP) model to reduce the computational complexity. The MILP model is applied to the Southern Power Grid to determine the hourly generation schedule of large hydropower-based plants in Yunnan and the transmission schedule of DC liaison lines. However, intelligent heuristic algorithms are able to handle problems with a large number of decision variables. Kerdphol et al. [19] proposed a new method to evaluate an optimum size of BESS at a minimal total BESS cost by using particle swarm optimization (PSO)-based frequency control of the stand-alone micro-grid in Japan. Nguyen et al. [20] proposed an improved cuckoo search algorithm (ICSA) to solve the distribution network reconfiguration (NR) problem with multi-objective functions. Mohamed et al. [21] used actual data on wind speed, solar radiation, temperature, and power demand at a specific location and employed a particle swarm algorithm to obtain the minimum cost of the energy generated while matching the power supply to local demand with a specific reliability metric. The advantage of using an intelligent algorithm is that the process of modeling discontinuous, nonlinear constraints can be refined.
After considering the shortcomings of research on battery energy storage life loss and its coordinated use in optimization scheduling, this article constructs a wind–solar energy storage multi-energy complementary combined system based on the flexibility of energy storage power plants and daily load trends in China. The scientific novelty of this paper is the emphasis on the flexibility of energy storage power plants in the combined scheduling process, where a hybrid energy storage operation strategy considering battery life loss was proposed, effectively improving the battery’s service life. Under the strategy, the output scheduling problem for each power source under three different objectives was solved using an improved PSO algorithm to determine a more rational scheduling plan for the combined system. The innovations and contributions of this paper are as follows:
(1) A wind–solar energy storage combined scheduling model, with the objectives of minimizing the mean squared deviation of “generalized load”, minimizing the fluctuation of the combined system output, and minimizing the generation cost of the combined system is established, and the corresponding scheduling scheme is solved.
(2) This paper combined the battery energy storage station and pumped storage into a hybrid energy storage system. Under the condition considering the battery life loss, the operation strategy of the hybrid energy storage system is formulated. The operation results under different strategies are used to verify the effectiveness of the optimization strategy proposed in this paper.
(3) Propose an improved PSO algorithm to improve the accuracy of solving scheduling schemes.
The remainder of this paper is organized as follows. Section 2 analyzes the multi-energy complementary combined system composition and then establishes the mathematical models of the objective functions and constraint conditions. Section 3 analyzes the energy management and optimization, then proposes the hybrid energy storage system operation strategy and improved particle swarm optimization. Section 4 presents the results and analysis, then compares the solutions of different strategies under the same object. By comparing the solutions of the same strategy under different objects, the influence of objects and strategies on the system energy scheduling is obtained. In the last section, a summary of the completed work in this paper is presented.

2. Multi-Energy Complementary Combined System Composition

The multi-energy complementary combined system includes a wind power station, PV power station, battery energy storage station, pumped storage power station, inverter, and rectifier. A battery energy storage station-pumped storage power station is used as a hybrid energy storage system in a combined system. The combined system structure diagram is shown in Figure 1.

2.1. Objective Functions

(1)
Minimize the mean squared deviation of “generalized load”:
This paper develops an optimal scheduling model for a wind–photovoltaic–storage combined system with a high penetration of renewable energy to leverage the complementary wind and photovoltaic power and the regulation of a hybrid energy storage system to smooth out fluctuations in a combined system. This model uses the remaining energy in the system after deducting wind, PV, and energy storage output as the “generalized load”, and the objective function is to minimize the mean squared deviation of the “generalized load”.
P g , t = P l , t P w , t + P p v , t + P c , t + P b , t
m i n F 1 = 1 T t = 1 T   P g , t 1 T t = 1 T   P g , t 2
where F 1 is the generalized system load’s mean squared deviation; P l , t is the load forecast for the system at time t; P g , t is the generalized load of system; P w , t is the wind farm output at time t; P p v , t is the PV power station output at time t; P b , t is the BESS output at time t; P c , t is the pumped storage power station output at time t; T is the scheduling cycle.
(2)
Minimize the fluctuation of the combined system output:
P f , t = P g , t + P w , t + P p v , t + P c , t + P b , t
m i n F 2 = t = 1 24 [ P f , t P f , t 1 ] 2
where F 2 is the combined system output fluctuation; P f , t is the system output at time t.
(3)
Minimize the generation cost of the combined system:
m i n F 3 = t = 1 T ( C f u e l , t + C f i x e d , t + C e n v i r , t + C l o s s , t + C r a m p , t )
where F 3 is the system’s operating cost, C f u e l , t , C f i x e d , t , C e n v i r , t , C l o s s , t , a n d   C r a m p , t are the fuel cost, fixed cost, environmental cost, wind–solar energy curtailment cost, and ramp-up cost incurred in the time period t of the combined system, respectively.
Fuel cost:
C f u e l , t = i = 1 N ( a i u i , t + b i P g , t + c i P g , t 2 )
where a i , b i , a n d   c i are the fuel cost factors for thermal power units; u i , t is a variable of 0 or 1, indicating the on/off state of the thermal power unit i at time t.
Fixed cost [22]:
C f i x e d , t = k M   K k , O M · P k , t + k M   F k 8760 k j · τ ( 1 + τ ) σ k ( 1 + τ ) σ k 1 · P k , t + C b S loss
where M is the controllable unit with different power sources; K k , O M   a n d   F k are the operation and maintenance factors and investment costs of the k t h power unit; P k , t is the active power output from the k t h power supply at time t; τ , σ , a n d   k j denote the annual interest rate, service life, and capacity factor, respectively; C b   a n d   S loss indicate the investment cost and the lifetime loss factor of the battery.
Environmental cost:
C envir ,   t   = i = 1 N   [ λ envir ,   c   ( α c , i u i , t + β c , i P i , t + γ c , i P i , t 2 ) + λ envir ,   s ( α s , i u i , t + β s , i P i , t + γ s , i P i , t 2 ) ]
where λ envir ,   c   a n d   λ envir ,   s are the environmental cost factors for CO2 and SO2 from thermal power generation; α c , i , β c , i , γ c , i are the CO2 emission factors for thermal power unit i; α s , i , β s , i , γ s , i are the SO2 emission factors for thermal power unit i.
Wind and solar energy curtailment costs:
C loss ,   t = P w , t + P p v , t P w , t P p v , t
where C loss ,   t is the amount of wind and solar energy curtailment, which can be derived from the difference between the optimal scheduled output of wind farms and a PV power station and their predicted power output; P w , t   a n d   P p v , t are the predicted power output of the wind farms and PV plants at time t.
Ramp-up cost:
C ramp ,   t = σ i d P g , t d t
where σ i is the ramping rate factors for thermal power unit i.

2.2. Constraint Conditions

(1)
Constraints on the system’s power balance:
P f , t = P g , t + P w , t + P p v , t + P c , t + P b , t
(2)
Constraints on wind and PV output:
P w , t m i n P w , t P w , t m a x
P p v , t m i n P p v , t P p v , t m a x
where P w , t and P p v , t are the output of the wind farms and PV plants at time t; P w , t m i n , P w , t m a x and P p v , t m i n , P p v , t m a x are the minimum and maximum values of the allowable output of the wind farm and PV plant at time t, respectively.
(3)
Constraints on the battery charge\discharge limitations:
P b , t m i n P b , t P b , t m a x E b , t + 1 = E b , t Δ E b , t Δ E b , t = P b , t ξ b × Δ t , P b , t > 0 P b , t × η b × Δ t , P b , t < 0 E b , t m i n < E b , t < E b , t m a x
where P b , t m i n   a n d   P b , t m a x are the minimum and maximum values of the allowable output of the battery at time t, respectively; E b , t is the capacity of the battery at time t; E b , t m i n   a n d   E b , t m a x are the minimum and maximum values of the battery capacity at time t, respectively; η b   a n d   ξ b are the battery charge and discharge efficiencies.
(4)
Constraint on the pumped storage power station:
P c , t m i n P c , t P c , t m a x E c , t + 1 = E c , t Δ E c , t Δ E c , t = P c , t ξ c × Δ t , P c , t > 0 P c , t × η c × Δ t , P c , t < 0 E c , t m i n < E c , t < E c , t m a x
where P c , t m i n a n d P c , t m a x are the minimum and maximum values of the allowable output of the pumped storage at time t, respectively; E c , t is the capacity of the pumped storage at time t; E c , t m i n   a n d   E c , t m a x are the minimum and maximum values of the pumped storage capacity at time t, respectively; η c   a n d   ξ c are the pumped storage charge and discharge efficiency.
(5)
Constraint on combined system’s reliability:
f P S R f P S R m i n
where f P S R is the system’s power supply reliability; f P S R m i n is the minimum value of the system’s power supply reliability.

2.3. Combined System Operating Indicators

(1)
Reliability indicators for electricity supply
As an important operational indicator for combined systems, supply reliability is defined as the ratio of the actual system output to the total load demand [23].
f P S R = 1 i = 1 T ( P l , t P f , t ) P l , t  
where the higher f P S R indicates a more stable combined supply system.
(2)
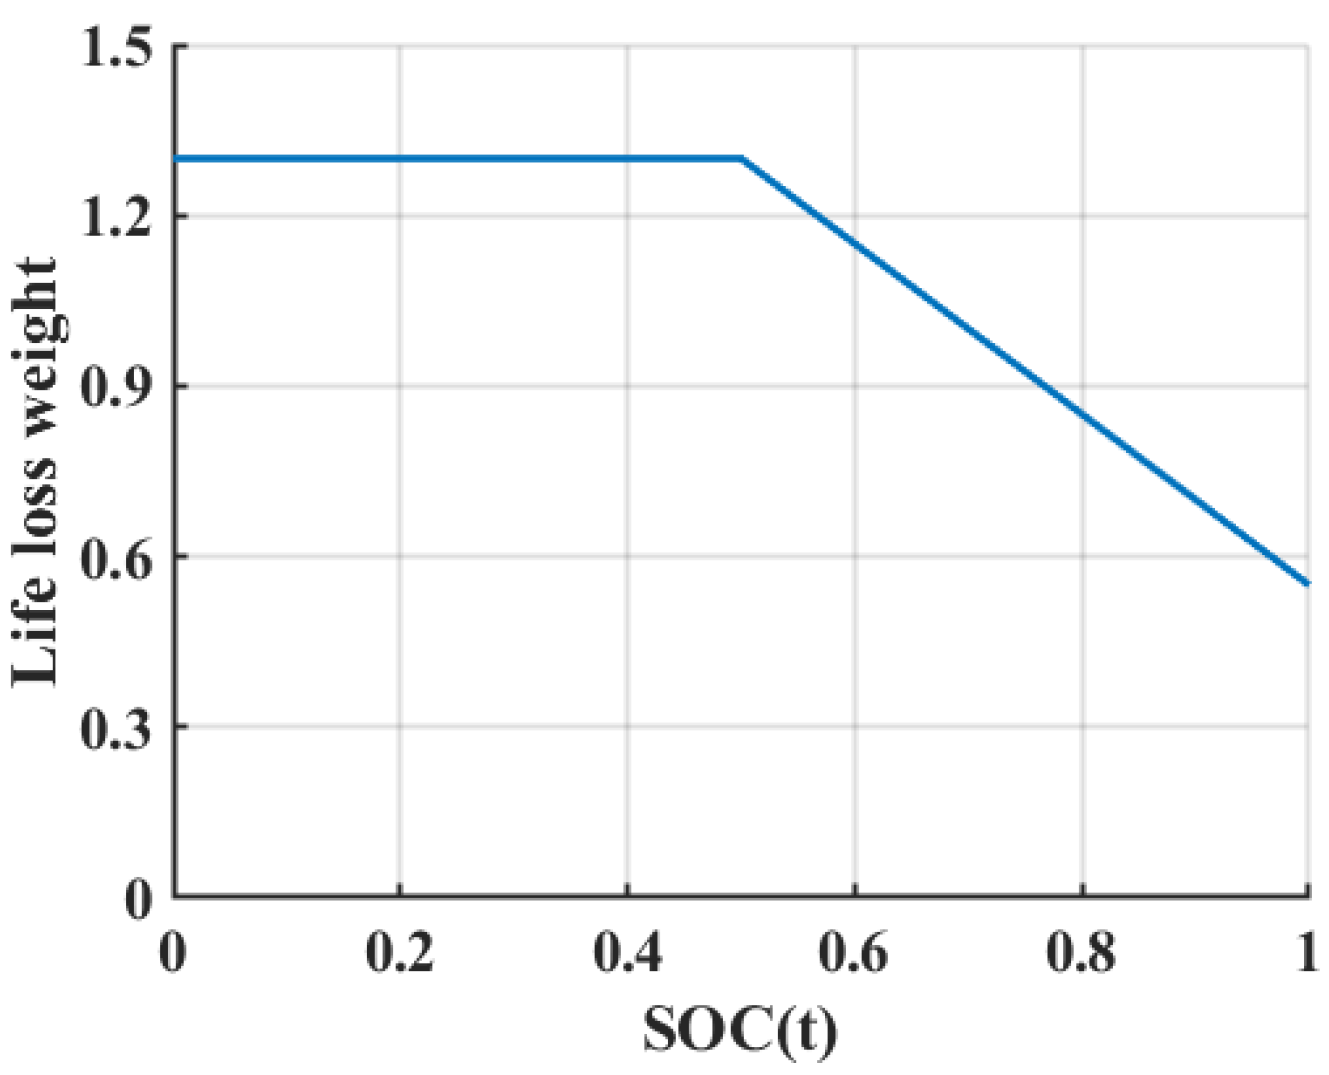
Evaluation model for battery life
Under the operating strategy of a hybrid energy storage system, the batteries are frequently charged and discharged at different depths to cope with the different scheduling schemes of the combined system. Related scholars propose throughput models for predicting a battery’s life [24].
E f u l l = i = 1 n E b , t × N i × D i × 2   n
where E f u l l is the total energy throughput over the life of the battery; D i is the depth of discharge of the battery for the i t h test; N i is the i t h test cycle of the battery; n is the number of discharge depths of the battery.
The battery’s state of charge (SOC) also has an effect on the actual life of the battery. The relationship between the battery life-loss weights and SOC is shown in Equation (10). The mathematical relationship can be plotted, as shown in Figure 2, where the battery SOC is lower than 0.5, its life-loss weight is higher, and the life-loss weight tends to decrease linearly when it is greater than 0.5 [25].
f ( S O C ( t ) ) = 1.3 0 S O C t 0.5 1.5 × S O C t + 2.05 0.5 S O C t 1
Therefore, the life-loss coefficient of the combined system within a scheduling cycle T is S l o s s .
S l o s s = 0 T P b , t × f ( S O C ( t ) ) d t E f u l l

3. Energy Management and Optimization

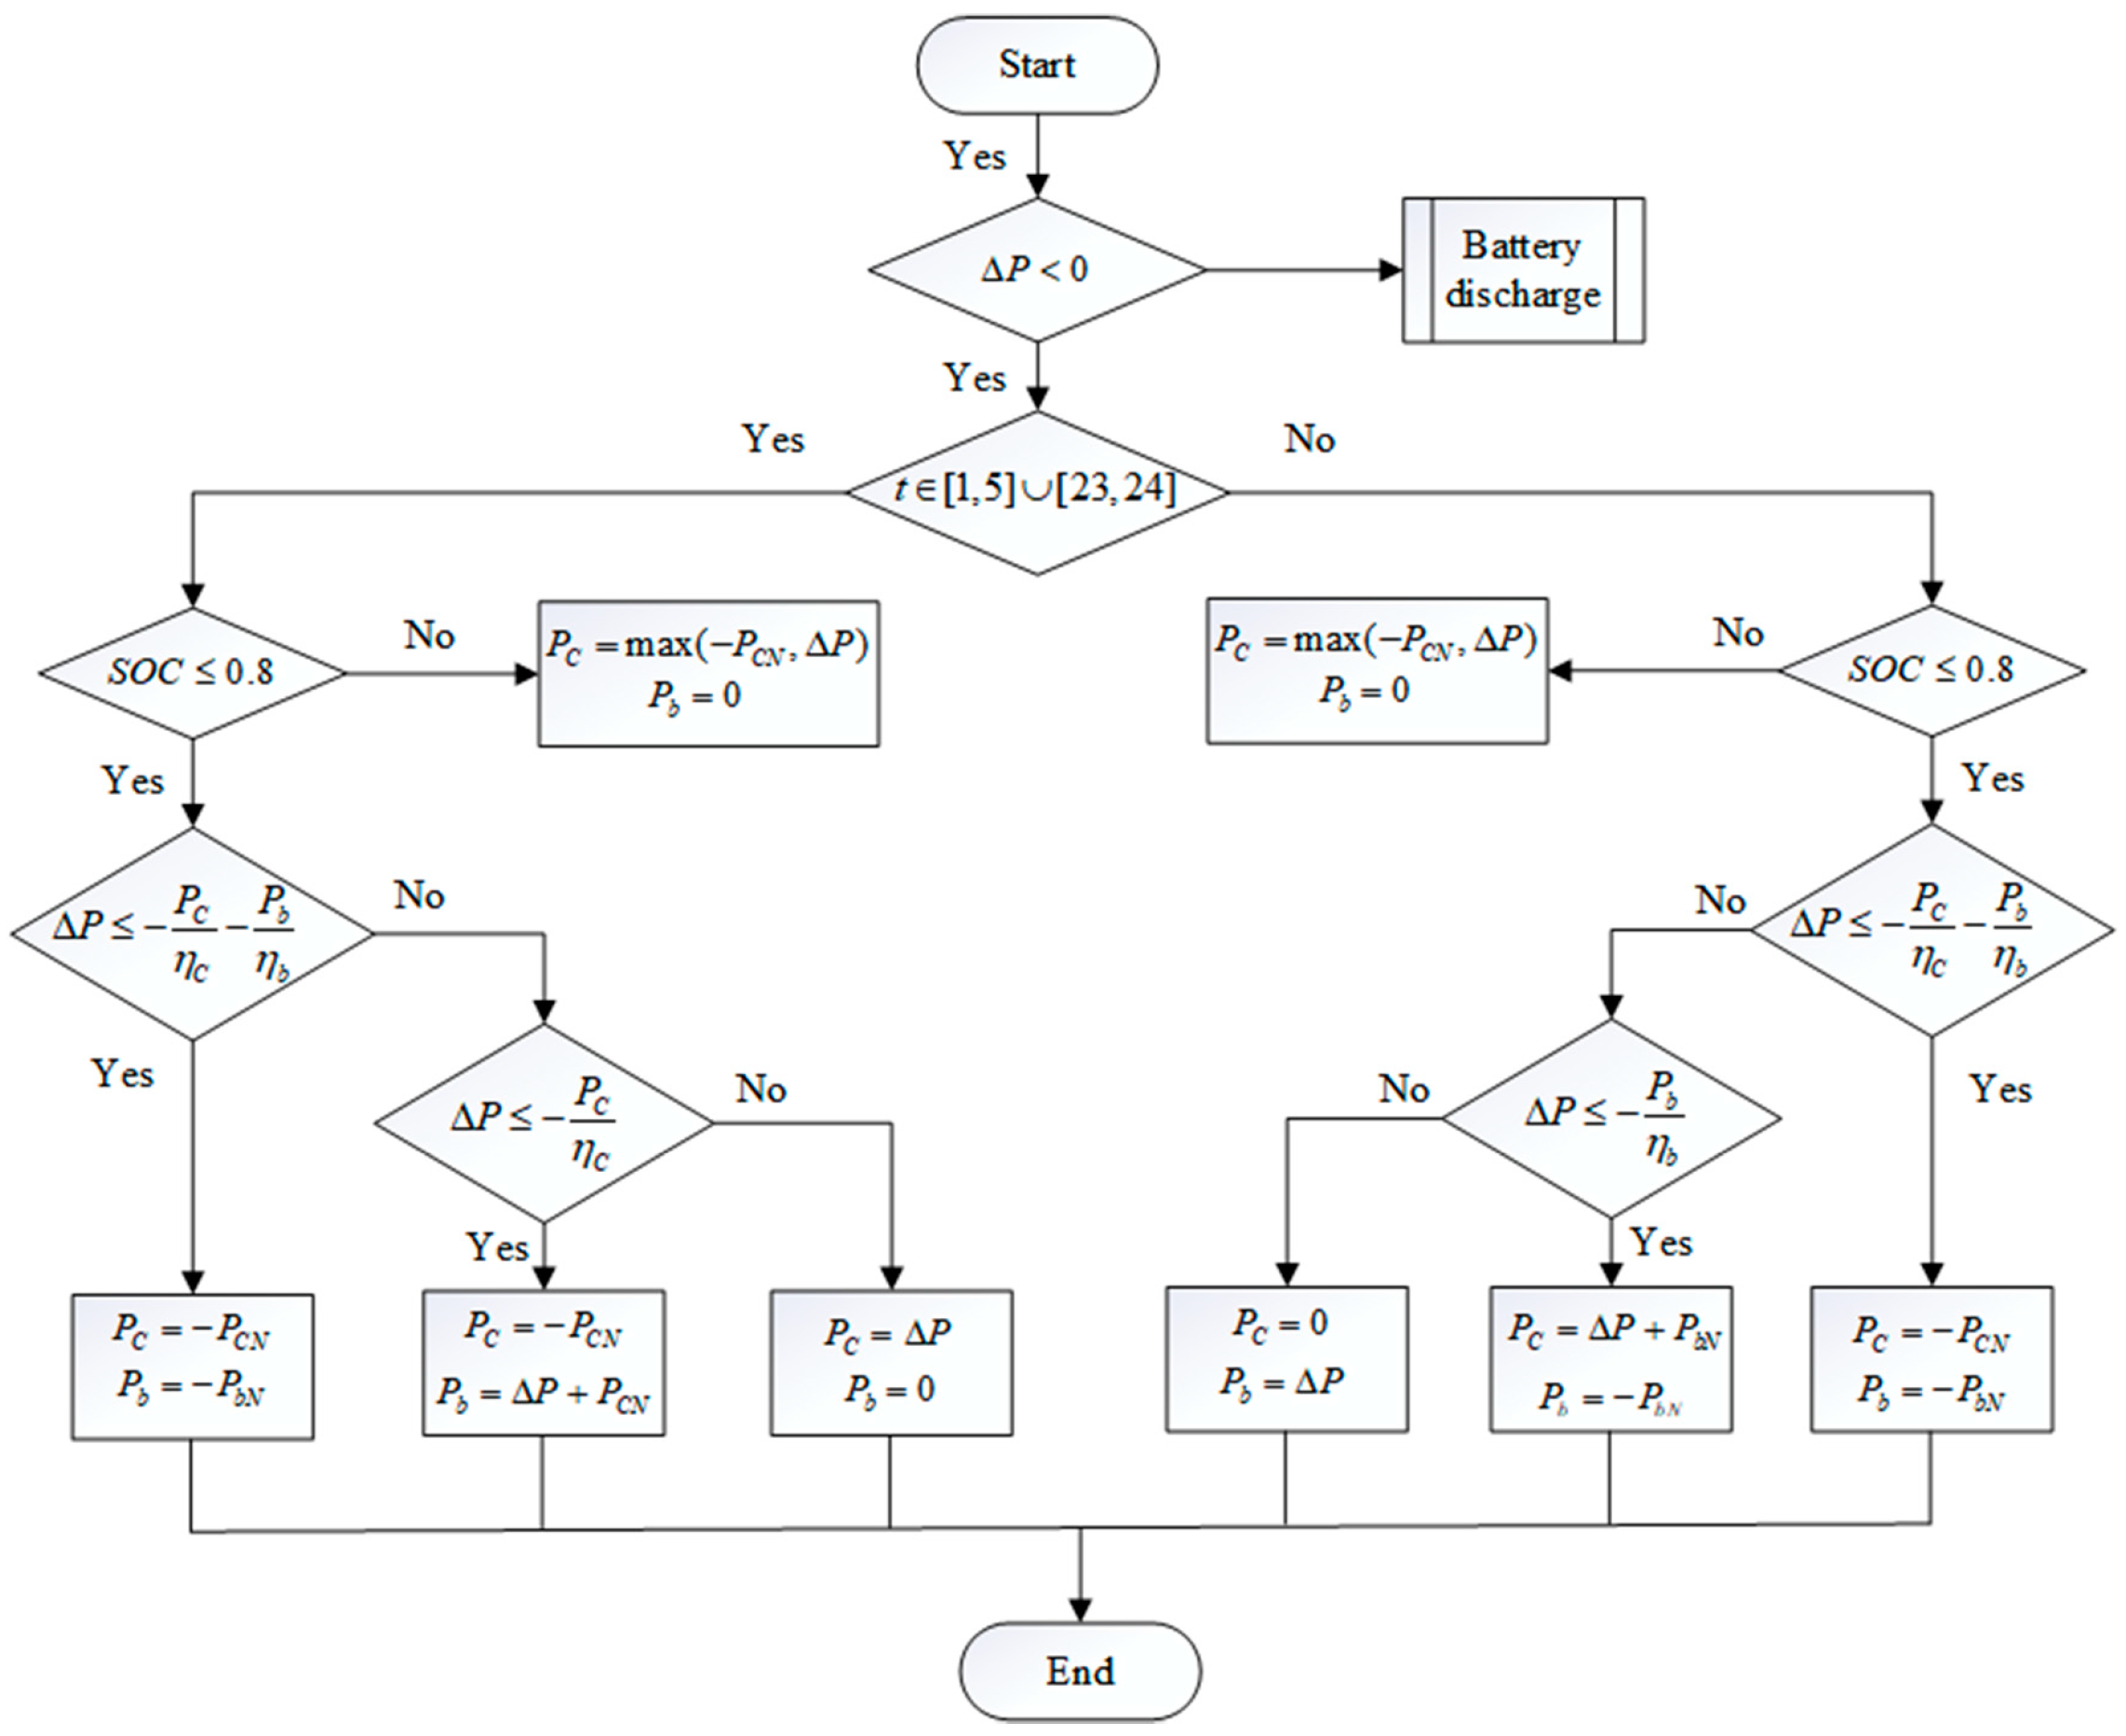
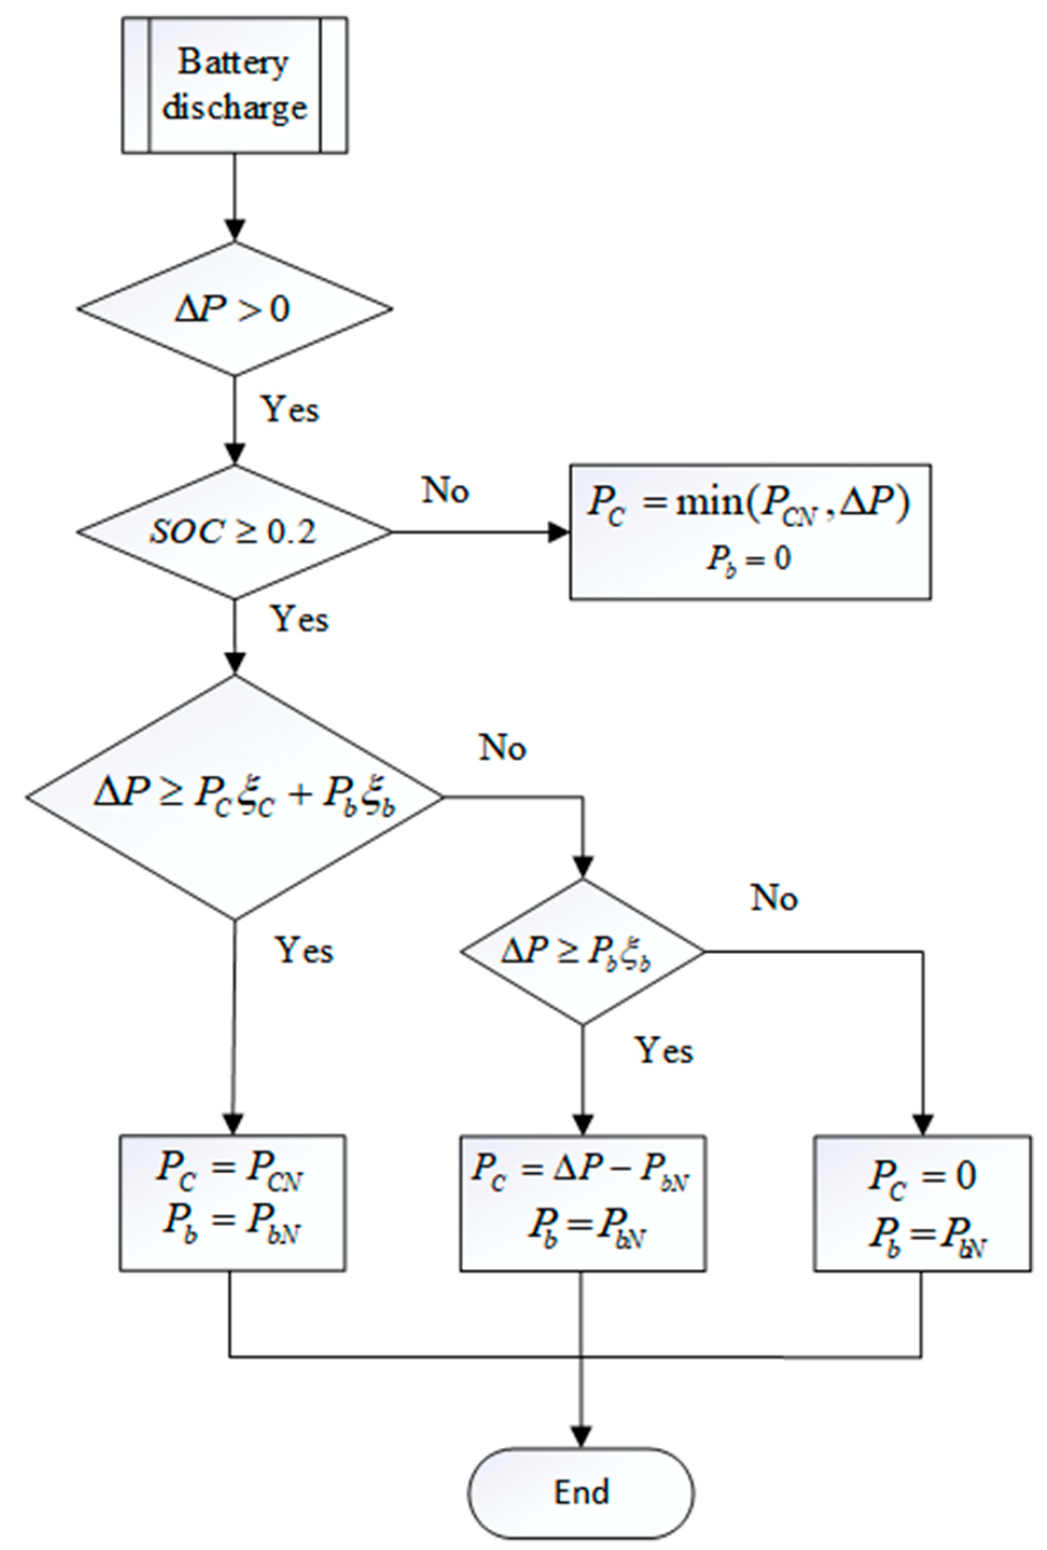
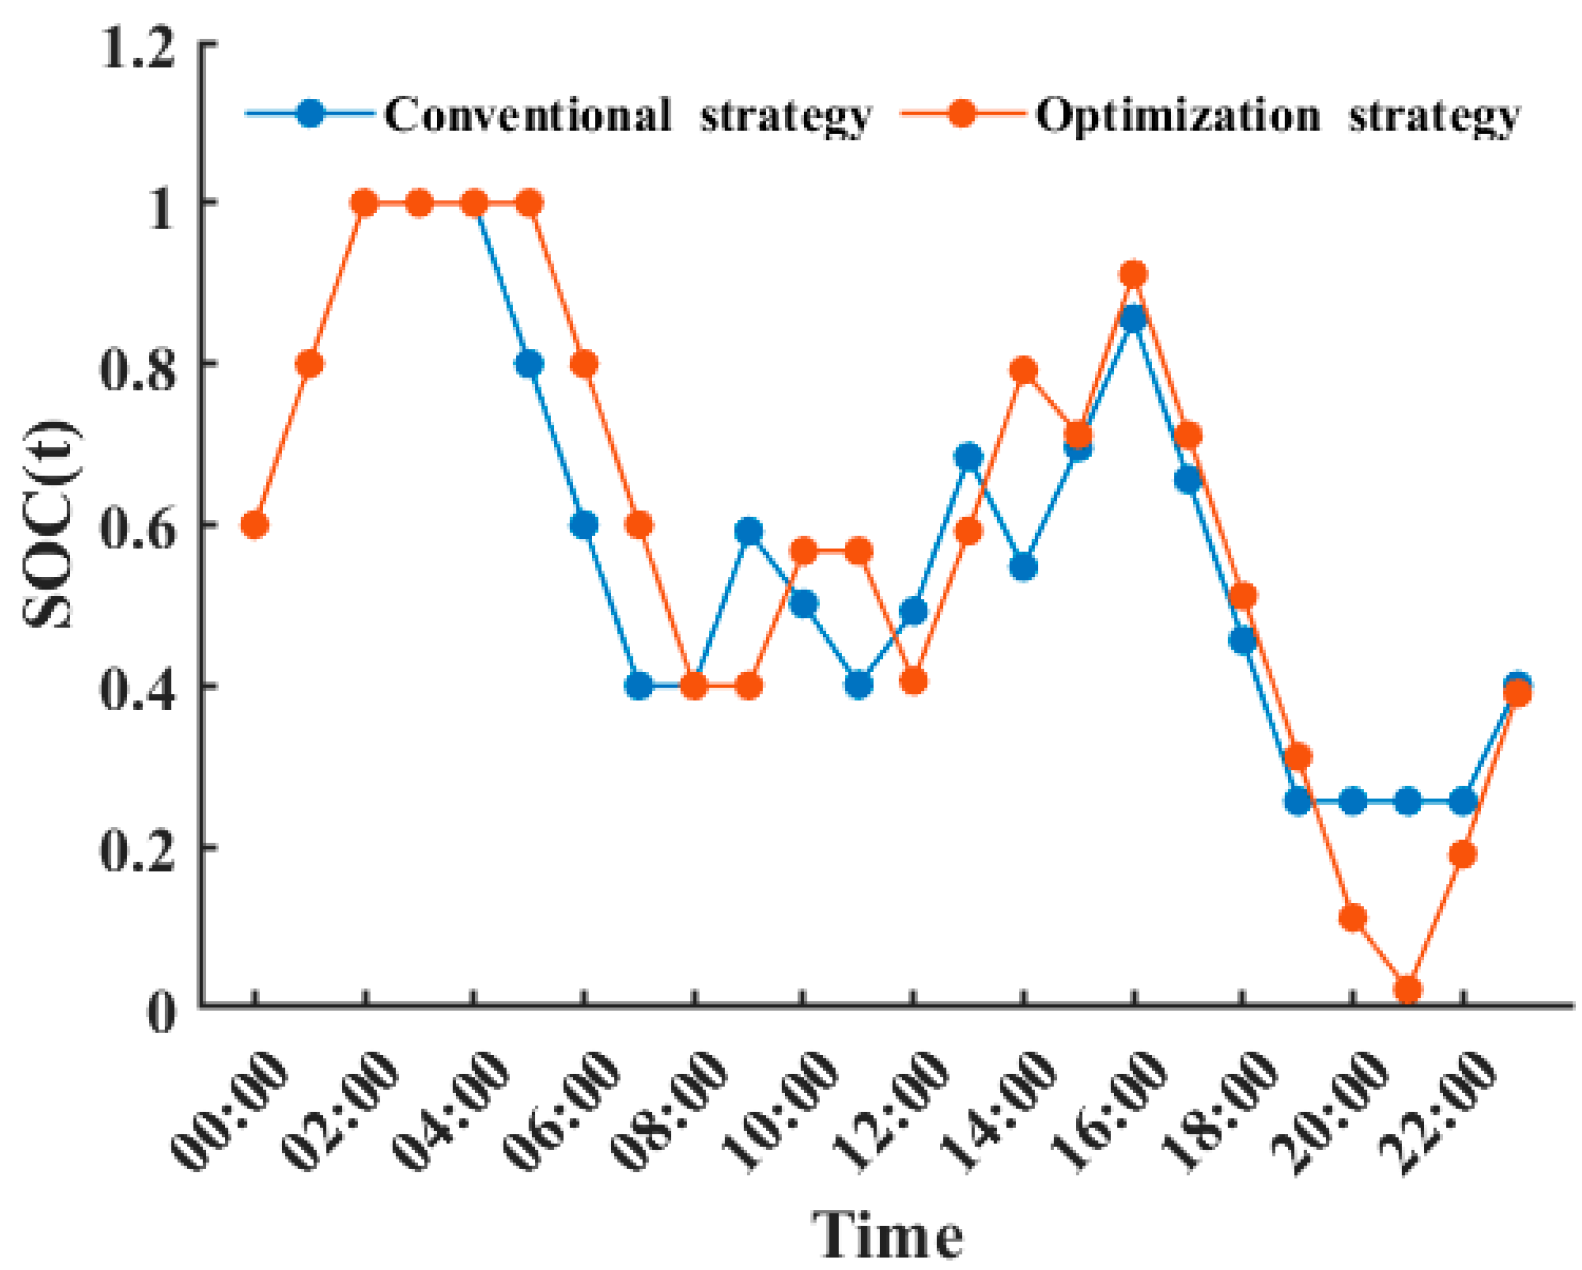
3.1. Hybrid Energy Storage System Operation Strategy

To balance a system’s power, the hybrid energy storage system is set to operate under payload [26] conditions. Using the characteristics of pumped storage for a long duration, a wide range of energy regulations, and the fast charging and discharging of battery storage—which helps to suppress the short-term power fluctuation of the combined system—allows the hybrid energy storage system to maintain the battery in shallow-cycle operation [27]. Optimizing the battery charge and discharge states prolongs its service life. The charging strategy of the hybrid energy storage system is shown in Figure 3. Firstly, a determination of the charging and discharging, based on the difference between the load and system output, is required. If proceeding with charging when the load is low, a determination of whether the SOC of the battery exceeds the upper limit of the constraint is first required. If it exceeds the limit, the battery is not charged, and the remaining power is stored by pumped storage. Otherwise, it needs to be considered whether it is less than the sum of the ratio of pumped storage and battery storage-rated power to charge efficiency. If it is less than that, both energy storages are charged at the rated power. Otherwise, it needs to be considered whether it is less than the ratio of pumped storage-rated power to charging efficiency. If it is less than the pumped storage-rated power, then the pumped storage is charged with the rated power, and the battery storage is responsible for storing the remaining power; otherwise, it is charged by the pumped storage only.
When charging with additional consideration of the living electricity load period, the battery is used to quickly respond to the system’s scheduling demand so that the battery energy storage is first stored to cope with the sudden increase in load on the system’s frequency change, while the pumped storage is used to store the remaining power.
The discharge strategy of the hybrid energy storage system is shown in Figure 4. When determining whether the SOC of the battery is below the lower limit of the constraint, if it is less than that, the battery is not discharged, and the pumped storage is discharged to replenish the shortage of power. If it is greater than the lower limit of the SOC constraint, it needs to be considered whether it is greater than the sum of the multiplied pumped storage and battery storage-rated power to discharge efficiency; if greater than that, both energy storages are discharged at the rated power. Otherwise, it needs to be considered whether it is greater than the multiply of battery storage-rated power to their discharge efficiency; if it is greater than that, the battery is discharged at the rated power, and the pumped storage is responsible for releasing the shortage of power; if it is less than that, only the battery storage energy is discharged. The hybrid energy storage operation strategy not only takes into account the characteristics of the battery and pumped storage systems but also the load characteristics; while, this occurs under the condition that the SOC of the battery is satisfied so that it can quickly respond to the peak and frequency regulation demands of the grid.

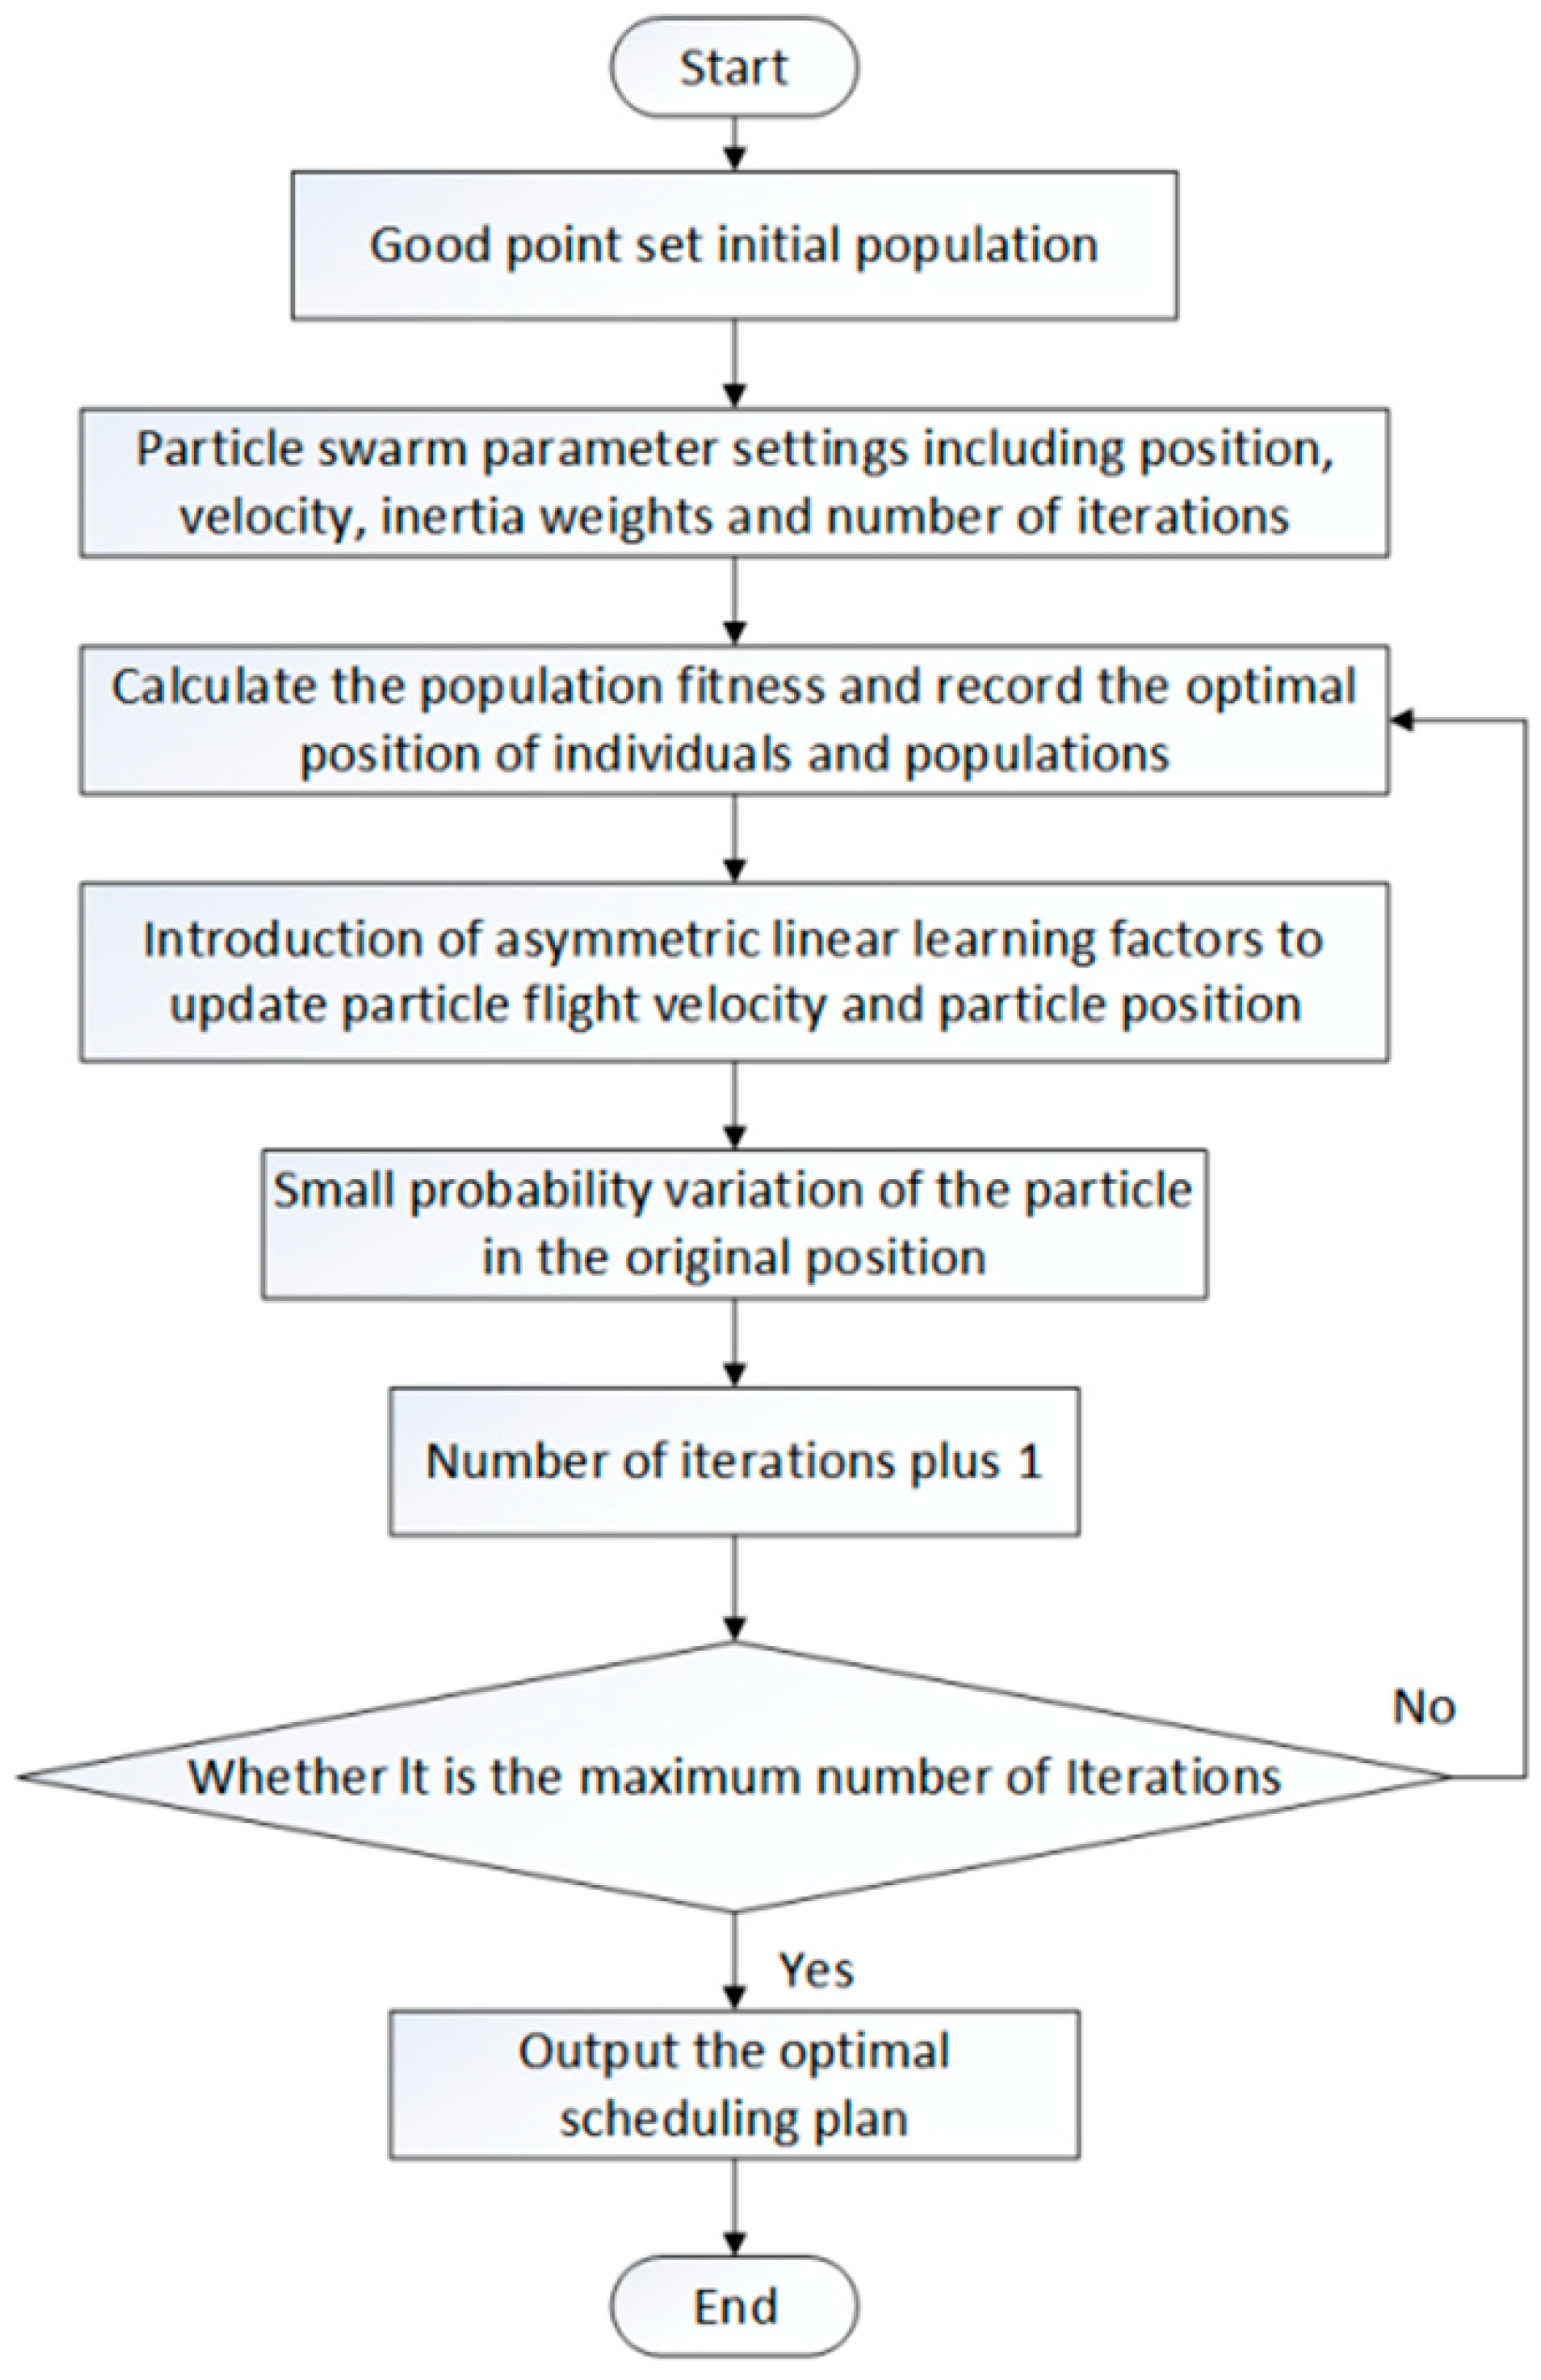
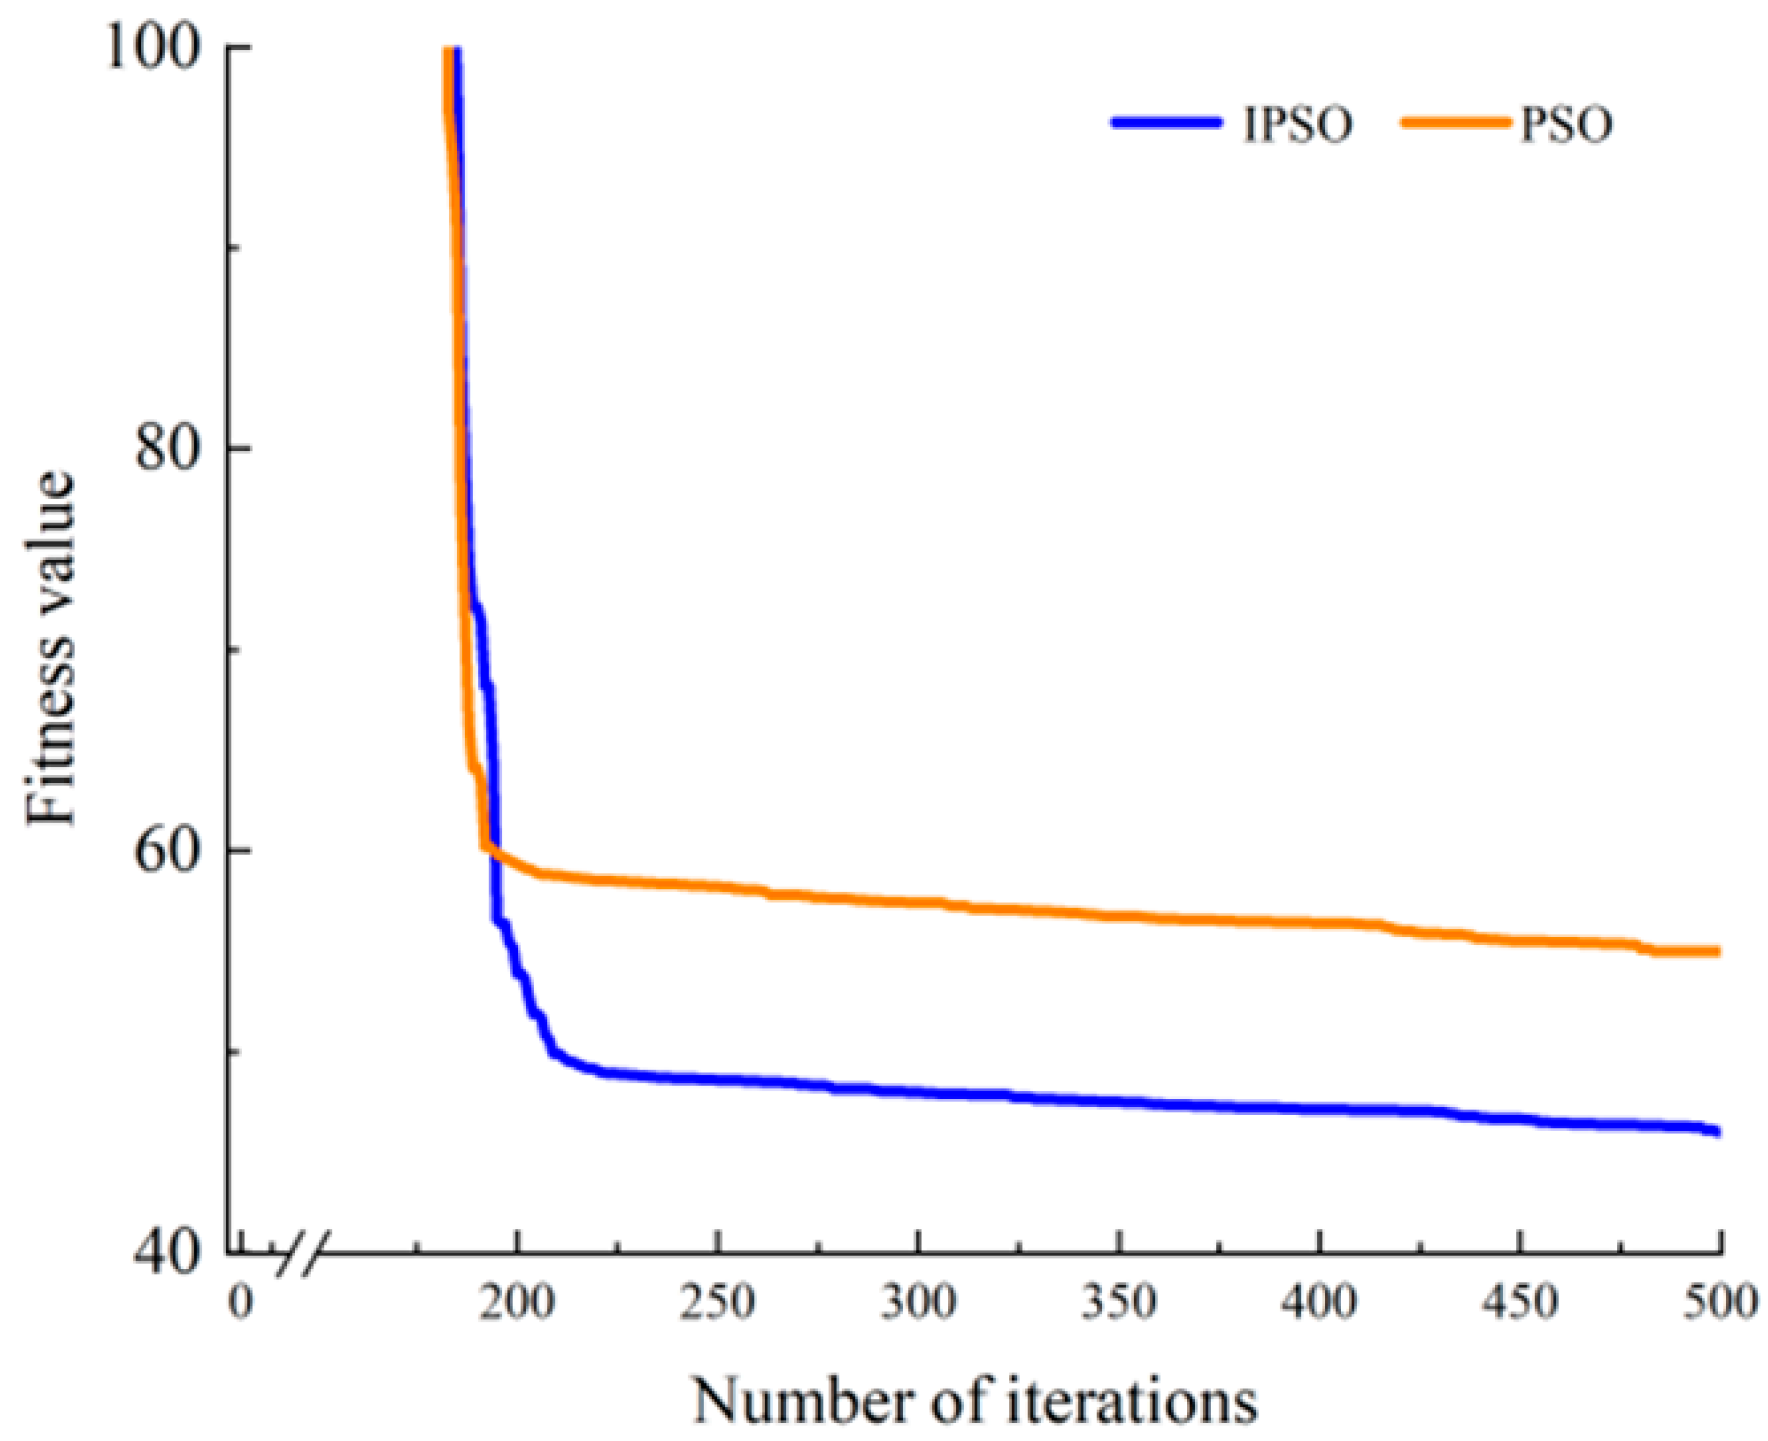
3.2. Improved Particle Swarm Optimization

The particle swarm optimization (PSO) algorithm determines the superiority of the scheme with the fitness function. These solutions are evaluated by objective functions and iterative searches for solutions. The equations regarding the specific search process of PSO are as follows:
X i g + 1 = X i g + V i ( g + 1 )
V i g + 1 = W g V i g + C 1 r 1 ( P i , b e s t g X i g ) + C 2 r 2 ( G i , b e s t g X i g )
where W g is the inertia weight coefficient of the g t h iteration; C 1   a n d   C 2 are the self-cognition coefficient and social cognition factor, respectively; r 1 , r 2 are random numbers; X i g   a n d   V i g are the rate and position of particle i going through iteration g , respectively.
The PSO algorithm cannot converge to the global optimum with a probability of 1 because the diversity within the population decreases rapidly with the number of iterations. Poor particle diversity results in the algorithm being unable to jump out of the local optimum and converging prematurely, thus affecting the global search capability [28].
(1)
Linearly decreasing inertia weight
The analysis of the exploration process of the particle swarm algorithm shows that the main factors affecting the particle swarm algorithm fall into the local extreme value point or enter the premature state and are the diversity of the particle swarm and the flight speed of the particles. Therefore, the particle swarm algorithm in this paper introduces linear decreasing inertia weights to compensate for its lack of particle diversity [29]. The linearly decreasing inertia weight function is as follows:
W g = W m a x ( W m a x W m i n ) × ( g g m a x ) 2
where g is the number of current iterations and g m a x is the maximum number of iterations; W m a x and W m i n are the maximum and minimum values of the inertia weights, respectively.
(2)
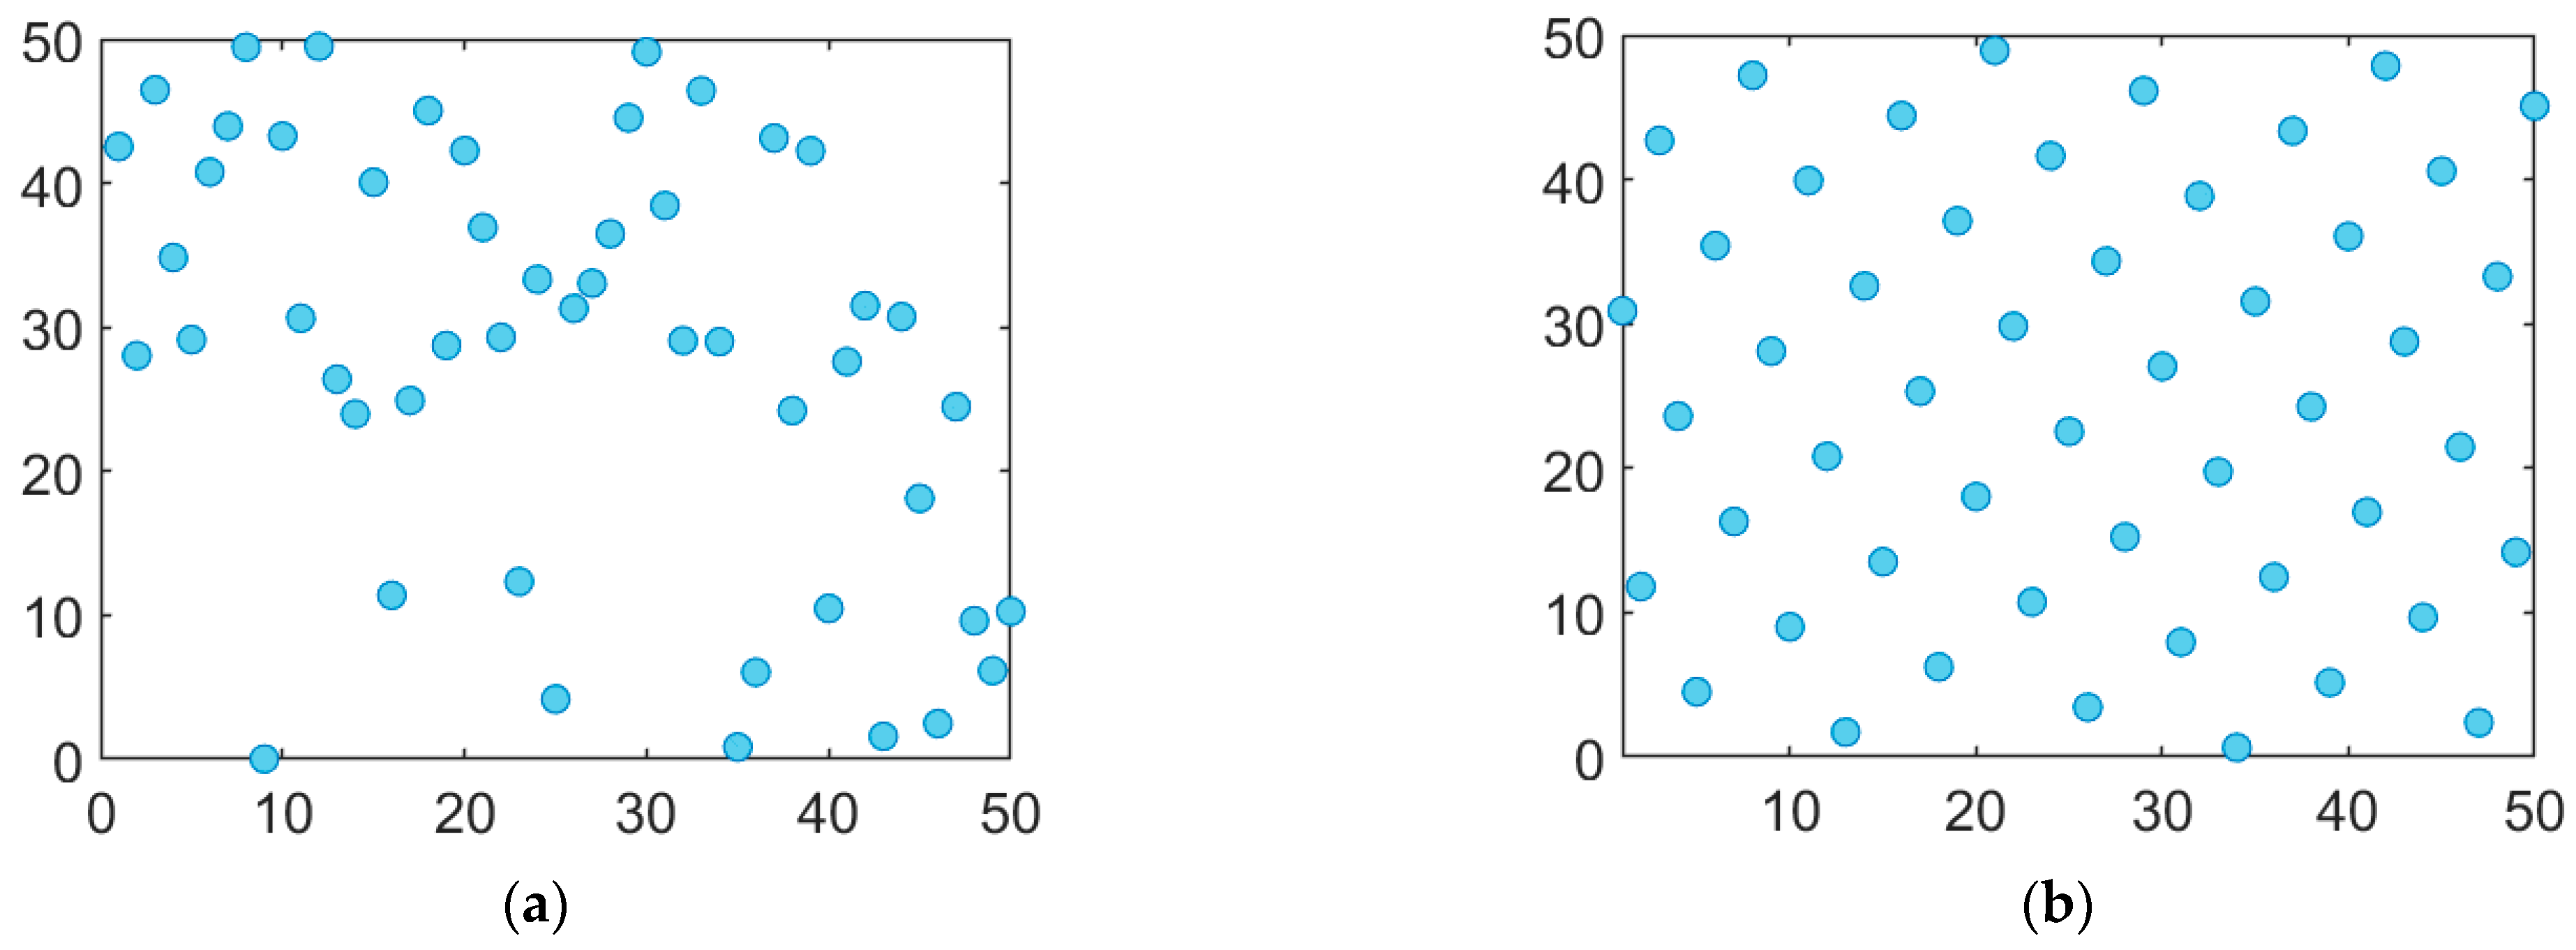
Prime ideal set initialization particle
The distribution of the initial population is closely related to the whole algorithm’s search process. The initial populations of the PSO algorithm are randomly generated, leading to the possibility that some particles may gather in one region, making the particles easily confine the search space, thus affecting the algorithm’s computation time and speed while the solution quality is not high. To solve the above problem and ensure that the generated particles are evenly distributed in all corners of the region, the prime ideal set method is introduced [30]. The particle distributions generated by the two methods are shown in Figure 5.
From the above figure, it can be seen that under the same number of particles, the prime ideal (e.g., Figure 5b) set method selects points more uniformly than the random method (e.g., Figure 5a), thereby improving the diversity of the initial population and achieving the goal of global optimization; To avoid having particles fall into premature convergence, mutation processing is added to the algorithm.
(3)
Learning factors of asynchronous change
The learning factors C 1 and C 2 determine the particle’s ability to learn from itself and from the population. This article adopts asynchronous changing learning factors, where C 1 decreases linearly and C 2 increases linearly; therefore, the population in the early stage of evolution can quickly search for the optimal value in a short time and in the late stage of evolution, it can quickly and accurately converge to the optimal solution [31]. The flow of the improved particle swarm algorithm is shown in Figure 6. The equations regarding the learning factors of asynchronous change are as follows:
C 1 = C 1 m a x ( C 1 m a x C 1 m i n ) × g g m a x
C 2 = C 2 m a x ( C 2 m a x C 2 m i n ) × g g m a x

4. Results and Analysis

A day-ahead optimal scheduling study was carried out for a combined power generation system with a high proportion of new energy penetration. In this paper, a 500 MW wind farm, 400 MW photovoltaic power station, 75 MW pumped storage power plant, and 25 MW battery energy storage station are taken as examples. Basic data of the combined power generation system are shown in Table 1. The optimized code and images in this chapter are performed on Matlab.
The improved PSO algorithm is used to solve the model in the case of the proposed optimization strategy and the conventional strategy (not considering the life loss caused by battery charging and discharging behaviors) in this paper. Divide a day into 96 scheduling periods based on a 15 min scheduling cycle, and solve the scheduling schemes that minimize the fluctuation of the generalized load, the fluctuation of the combined system output, and the generation cost of the combined systems. Solve for a scheduling scheme that minimizes the mean squared deviation of “generalized load”, minimizes the fluctuation of the combined system output and minimizes the generation cost of the combined system, respectively.
When taking the typical daily load curve of a certain area and the output prediction data of wind farms and photovoltaic power plants as an example input, the basic data are shown in Figure 7. The optimized code and images in this chapter are performed on Matlab.

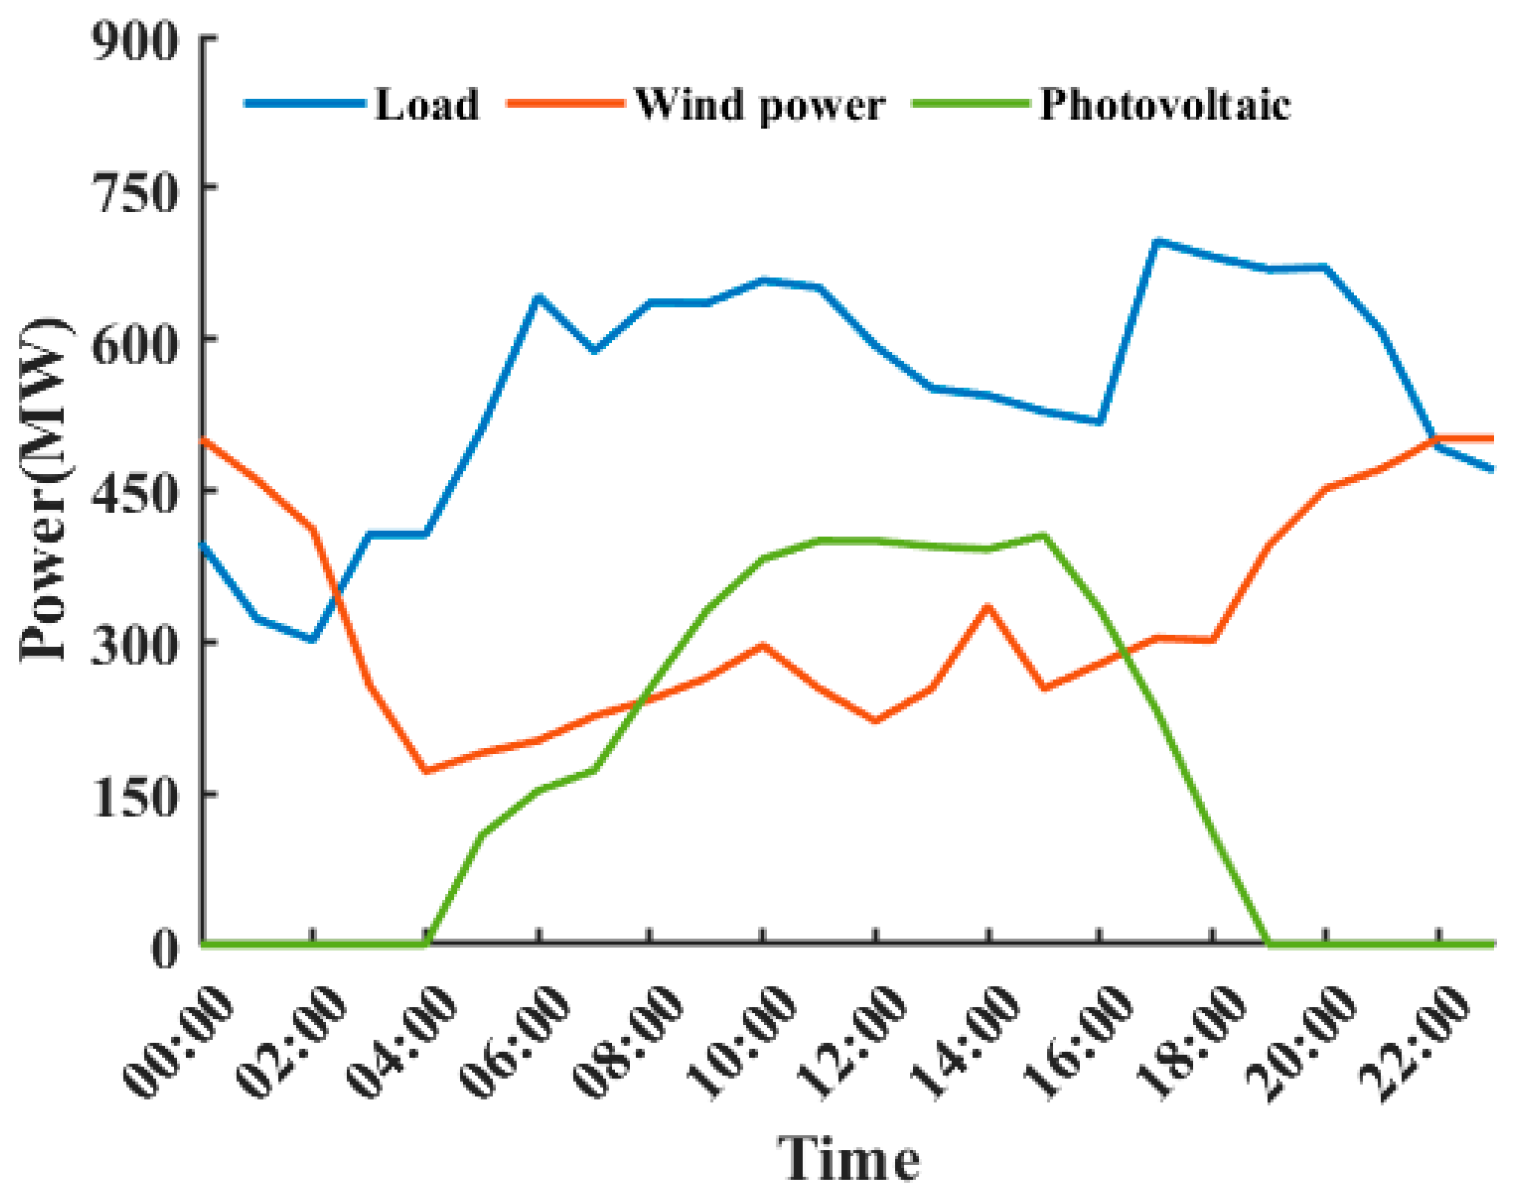
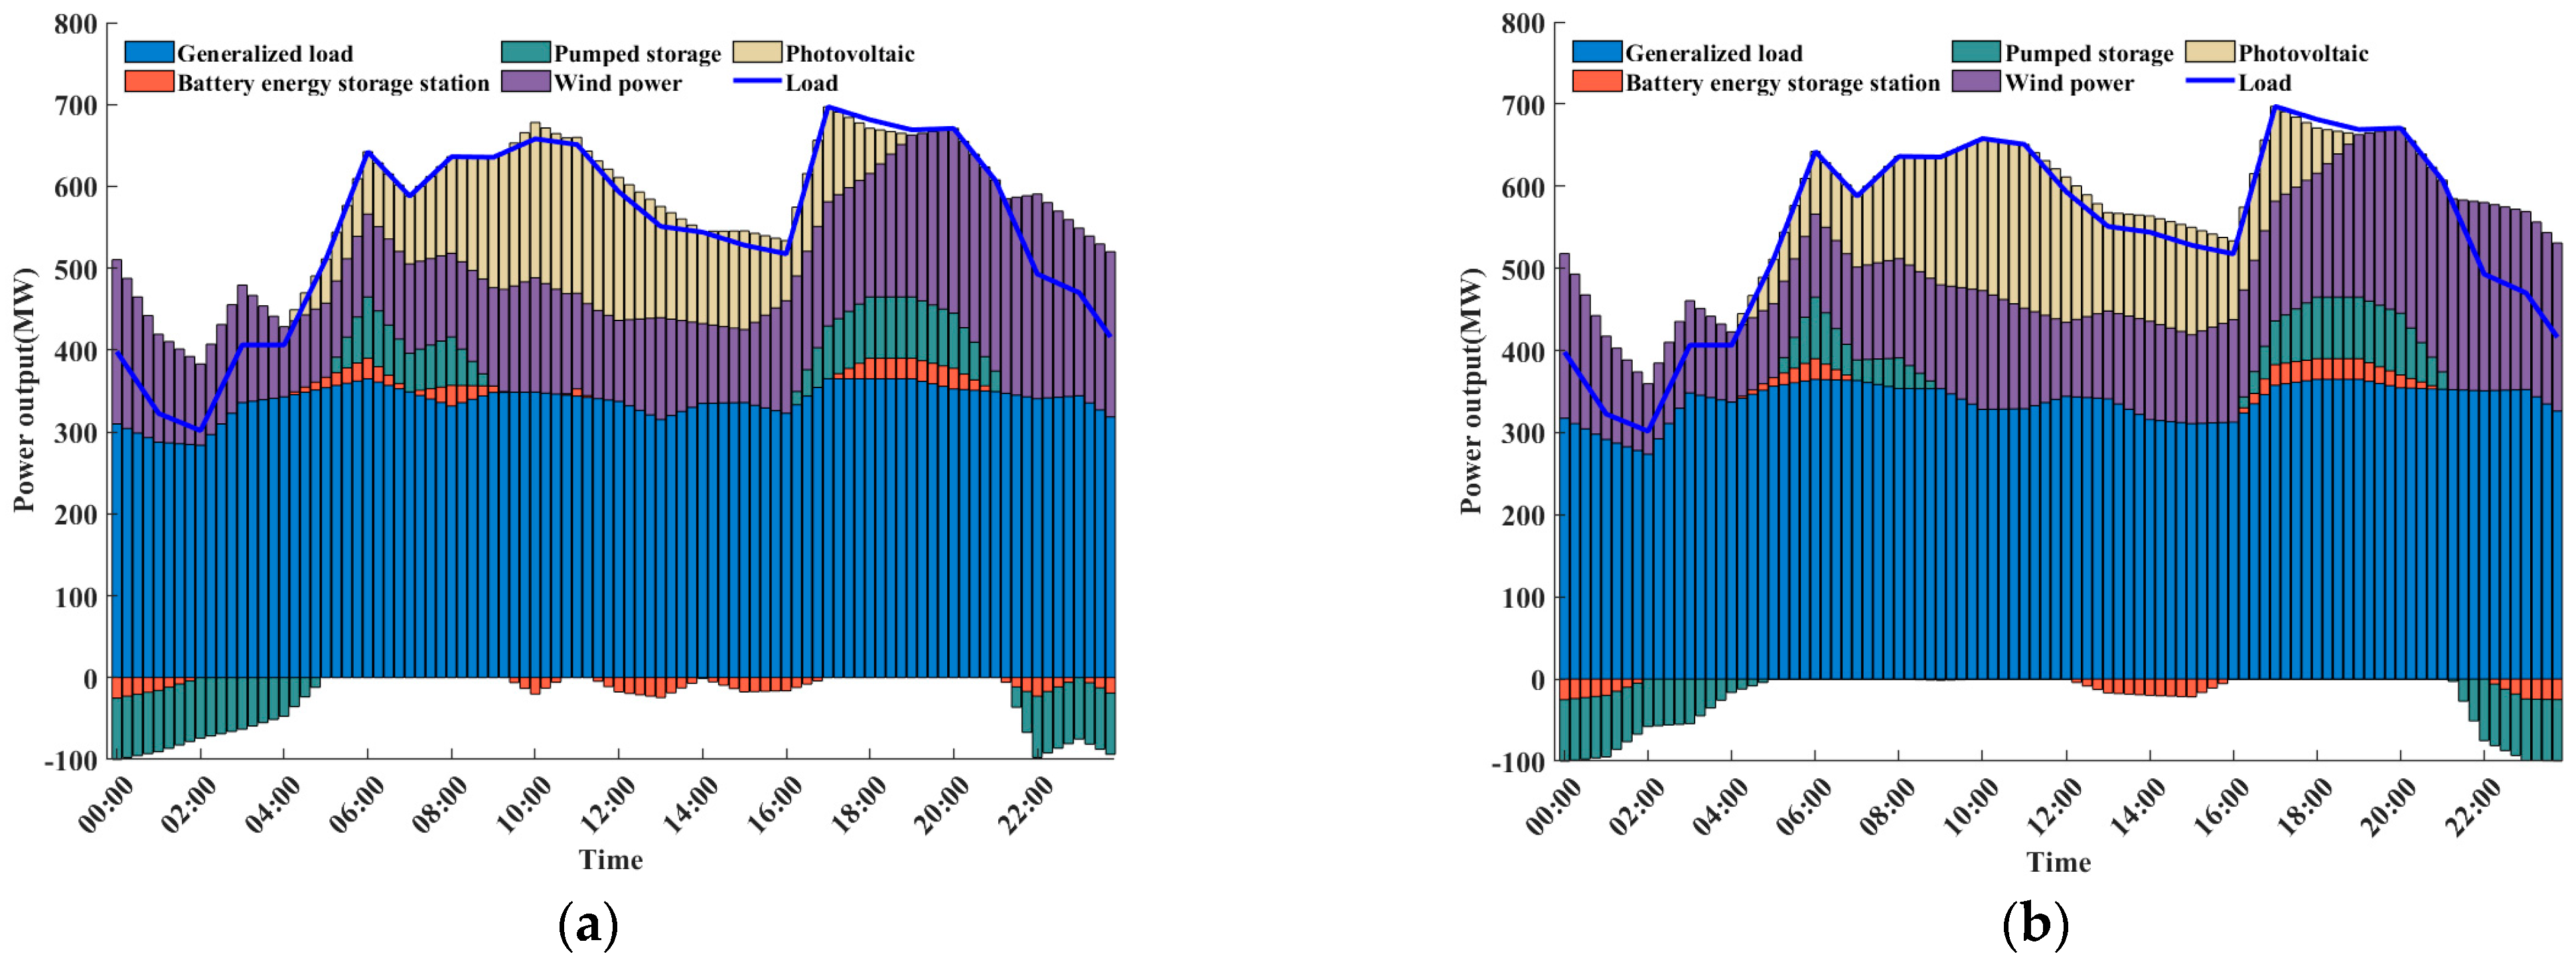
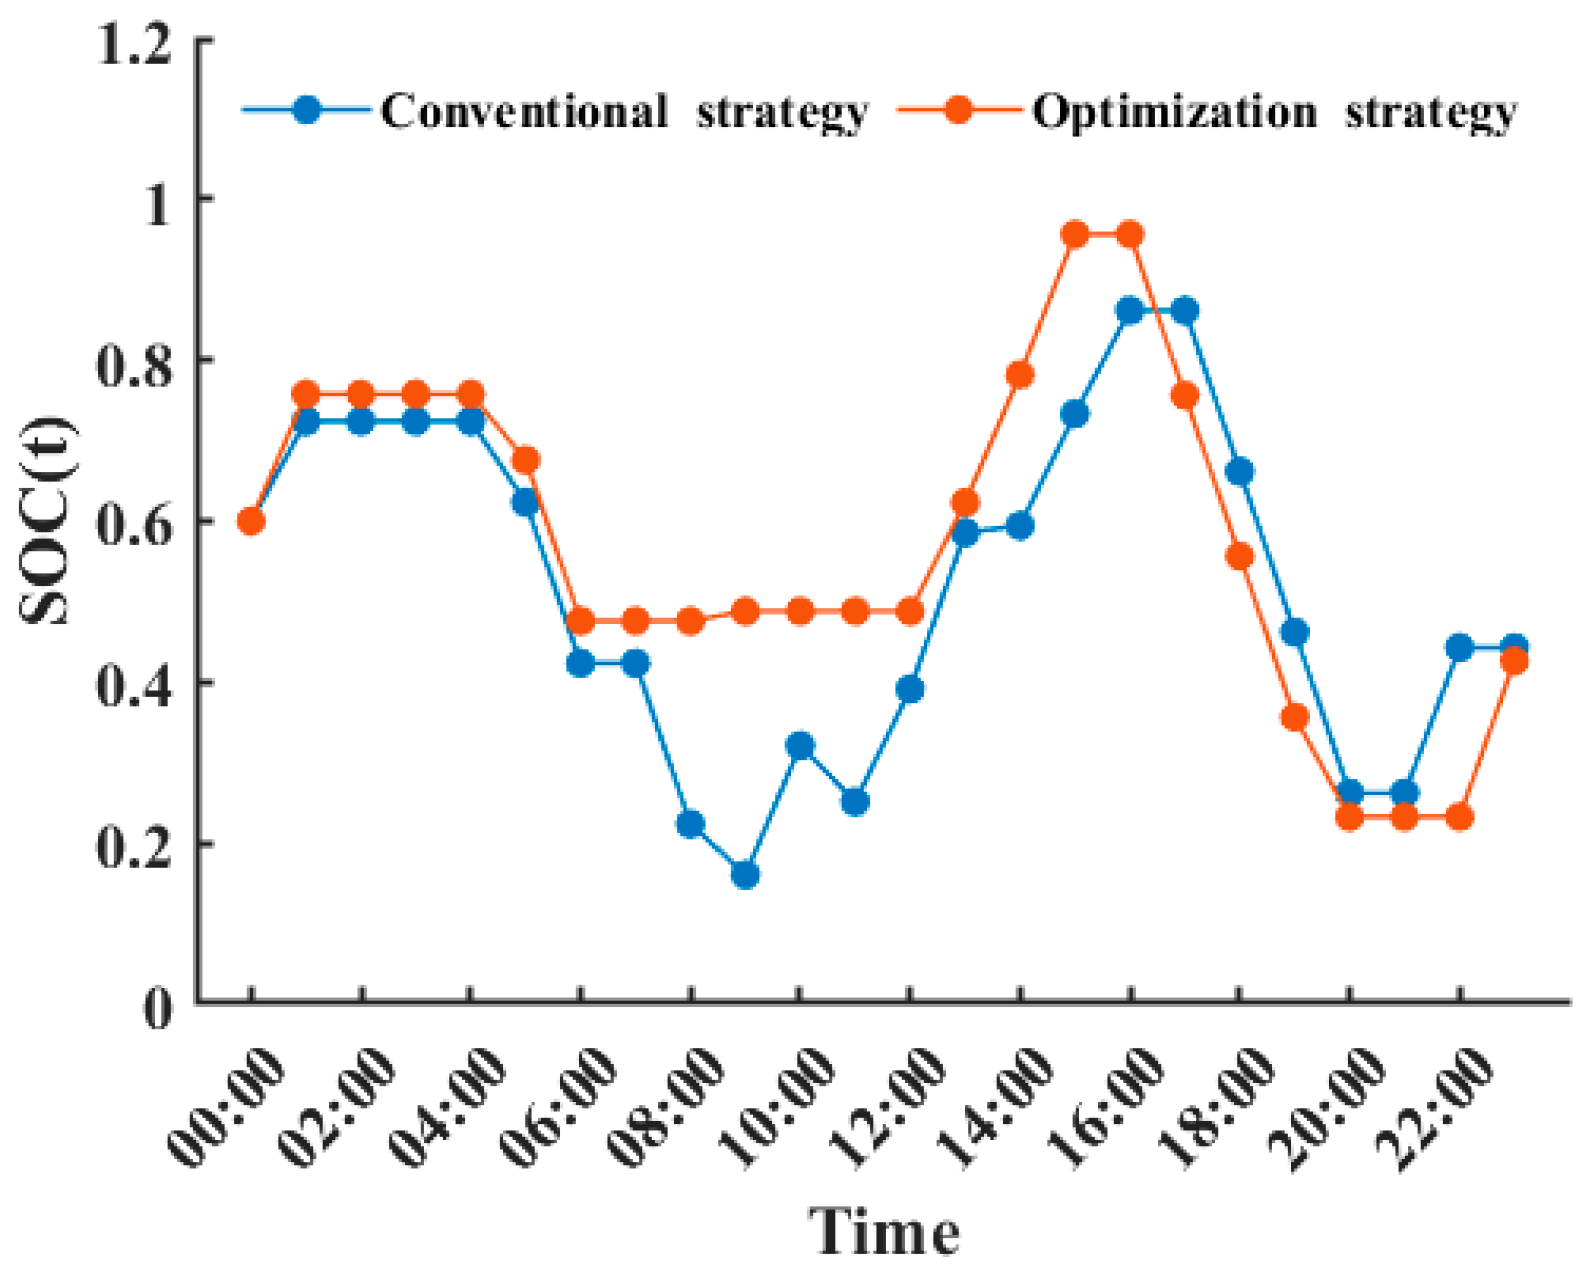
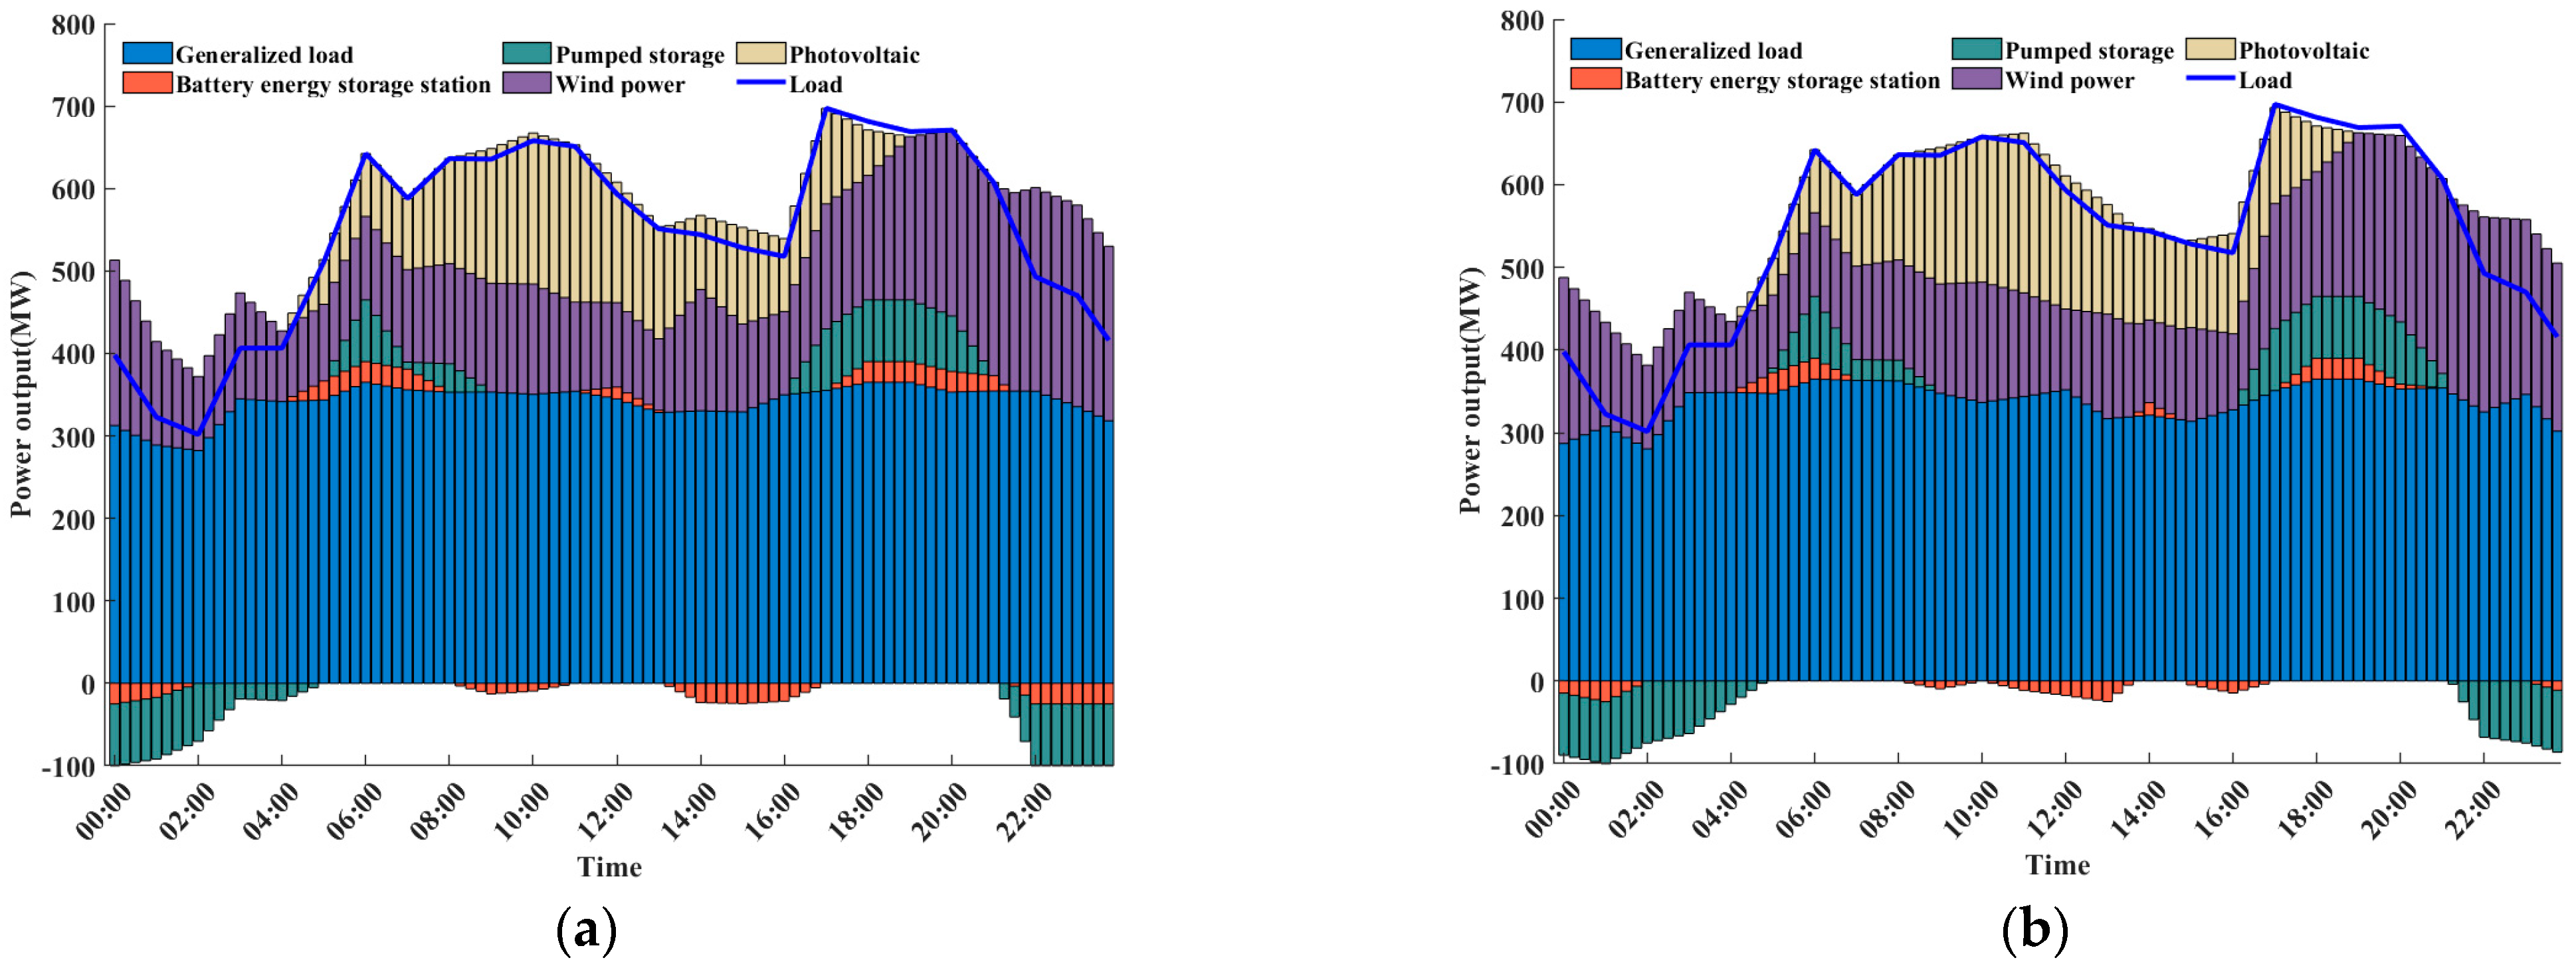
4.1. Analysis of Optimization Scheduling Results

The output of the combined system is shown in Figure 8 of when the minimized mean squared deviation of the “generalized load” is objective one, where two pictures in the horizontal direction are a group (e.g., Figure 8a,b); the picture on the left side indicates the scheduling results of the optimization strategy (e.g., Figure 8a), and the picture on the right side indicates the scheduling results of the conventional strategy (e.g., Figure 8b).
It can be seen from Figure 8 that the generalized load curve changes gently; however, there is an obvious wind and solar energy curtailment. Under this objective, the hybrid energy storage system stores energy during low load periods in the early morning and discharges during the peak load periods of 7:00−9:00 and 18:00−21:00 to perform “Peak Shaving and Valley Filling” on the combined system while low system fluctuations occur during the peak load hours of 10:00−12:00 as solar radiation becomes stronger.
Figure 8b shows that, in order to avoid the battery SOC reaching the lower limit during 10:00−15:00, the broad load is regulated during this period to cope with the change in the wind and solar outputs; therefore, the mean squared deviation of the generalized load of the system under the optimized strategy increases from 43.83 MW to 49.76 MW. The shallow running state of the battery, from 00:00 to 19:00, effectively improves the battery life, where the battery life-loss coefficient of 0.073% under the conventional strategy is reduced to 0.055% under the optimization strategy. The battery SOC states for the two different operating strategies in objective one are shown in Figure 9.
Figure 10 illustrates the output of the combined system, where the minimized fluctuation of the output is set as objective two, where controlling the magnitude of the power output changes of all power sources in adjacent periods within a dispatch cycle reduces the pressure for a safe and stable operation of the grid system after grid integration.
Figure 9 shows that, compared to objective one, the hybrid energy storage system needs to increase the frequency and depth of charging and discharging to smooth out the fluctuations in the generalized load and wind and solar outputs. The operation mode of the optimization strategy improved the SOC decline caused by a continuous discharge during 05:00−08:00 and 18:00−22:00, which maintained the SOC in a healthy state, where the battery life−loss coefficient of 0.088% under the conventional strategy was reduced to 0.053% under the optimization strategy. The battery SOC states for the two different operating strategies in objective two are shown in Figure 11.
Figure 12 displays the output of the combined system when the minimized generation cost is objective three. A reduced system’s wind and solar energy curtailment has the lowest cost of wind and solar energy curtailment compared to the other objectives; due to the limited total capacity of a hybrid energy storage system, it is necessary to complete partial wind and solar energy consumption under the coordination of a generalized load, resulting in greater fluctuations in the generalized load.
At the same time, a hybrid energy storage system requires more frequent scheduling, and the battery is in a state of frequent charging and discharging. Where hybrid energy storage generation is increased, and generalized load costs are minimized, under this objective, the total generation cost of the system is 449.14 (104 RMB) under the conventional strategy and is reduced to 448.88 (104 RMB) under the optimization strategy. Meanwhile, by keeping the SOC in a healthy state, a battery life−loss coefficient of 0.092% is achieved under the conventional strategy, and is reduced to 0.081% by the optimization strategy. The battery SOC states for the two different operating strategies in objective two are shown in Figure 13.
After inputting the basic data of the combined system, the data of the optimization results for the three objective functions and their different operation strategies are shown in Table 2.

4.2. Analysis of Operating Cost Results

The comparison of daily operating costs with or without considering the hybrid energy storage optimization strategy under the objective three conditions is shown in Table 3. After considering the hybrid energy storage optimization strategy, the life-loss coefficient of the battery is maintained in a healthy state, indicating that the operating cost of the battery in a healthy state is lower when charging and discharging the same amount of electricity.
According to the objective function requirement of minimizing the generation cost of the combined system, the total charge and discharge capacities of the hybrid energy storage system increases, reducing the burden on the generalized load output and making it less costly, thus ensuring healthy battery operation while reducing the total operating costs of the combined system. This verifies the reasonableness and effectiveness of the hybrid energy storage operation strategy.
As can be seen from Figure 14, in the algorithm results in the comparison chart, the improved PSO algorithm has higher solution accuracy compared to the conventional PSO algorithm; with an increase in the number of iterations, the basic PSO converges prematurely to 54.98 MW around the 180th iteration, falling into a locally optimal solution. The improved PSO algorithm converges to 43.83 MW around the 210th iteration.
Because the improved PSO algorithm initialization particle is uniformly distributed, it improves the quality of the initial particle and expands its range of merit search. Improved inertia weights compensate for the lack of particle diversity, resulting in a slower convergence than the conventional algorithm and ultimately avoid the algorithm falling into a local optimum.

5. Conclusions

This paper proposes a hybrid energy storage operation strategy that takes into account the lifetime of the battery, taking a wind–light-storage multi-energy complementary combined system as the research object. When combined with a load of a typical day and the predicted output data of the photovoltaic power station and wind farm, the improved PSO algorithm is used to solve the output distribution scheme of the combined power generation system, which considers the following objectives: minimizing the mean squared deviation of a generalized load, minimizing the fluctuation of a combined system’s output, and minimizing the generation costs of the combined system. The following conclusions are drawn:
(1)
By utilizing the hybrid energy storage operation strategy proposed in this article, the scheduling schemes for each objective function were solved. Battery charging and discharging are managed so as to optimize the battery life-loss coefficient, ensuring healthy battery operation while reducing the total combined system’s operating costs.
(2)
The improved PSO algorithm introduces a prime ideal set initialization population to improve the quality of the initial population by introducing linear decreasing inertia weights to compensate for its insufficient particle diversity. In order to avoid particles falling into premature convergence, small probability mutation processing was added to the algorithm. The improved PSO algorithm converges to 43. 83MW around the 210th iteration. An improved PSO achieves an optimal scheduling scheme in a more precise manner.
However, in this study, only the outputs of wind and PV on a given day were considered. Further research will therefore focus on the uncertainties of annual wind and PV outputs and the impact of multiple targets on the combined power generation system.

Author Contributions

Supervision, writing—original draft preparation, and conceptualization, Y.L.; methodology, and writing—original draft preparation, H.W.; visualization, Z.Z.; formal analysis, H.L.; writing—review and editing, X.W.; data curation, Q.Z., T.Z., and P.Z.; software, F.C. All authors have read and agreed to the published version of the manuscript.

Funding

This research was funded by the National Natural Science Foundation of China, grant number No. 51579104 and the National Natural Science Foundation of China, grant number No. 51909094.

Data Availability Statement

These data supporting this study’s findings are available from the corresponding author upon reasonable request.

Conflicts of Interest

The authors declare no conflict of interest.

References

  1. Wei, D.; Li, H.; Ren, Y.; Yao, X.; Wang, L.; Jin, K. Modeling of hydrogen production system for photovoltaic power generation and capacity optimization of energy storage system. Front. Energy Res. 2022, 10, 1004277. [Google Scholar] [CrossRef]
  2. Gaojun, M.; Yanwen, D.; Pau, G.; Linlin, Y.; Wenyi, T. Multi-objective capacity optimization configuration of independent wind-photovoltaichydrogen-battery system based on improved MOSSA algorithm. Front. Energy Res. 2023, 10, 1077462. [Google Scholar] [CrossRef]
  3. Liu, S.; Lin, Z.; Jiang, Y.; Zhang, T.; Yang, L.; Tan, W.; Lu, F. Modelling and discussion on emission reduction transformation path of China’s electric power industry under "double carbon" goal. Heliyon 2022, 8, e10497. [Google Scholar] [CrossRef] [PubMed]
  4. Chen, K.; Peng, H.; Zhang, J.; Chen, P.; Ruan, J.; Li, B.; Wang, Y. Optimized Demand-Side Day-Ahead Generation Scheduling Model for a Wind–Photovoltaic–Energy Storage Hydrogen Production System. ACS Omega 2022, 7, 43036–43044. [Google Scholar] [CrossRef] [PubMed]
  5. Nikolova, S.; Causevski, A.; Al-Salaymeh, A. Optimal operation of conventional power plants in power system with integrated renewable energy sources. Energy Convers. Manag. 2013, 65, 697–703. [Google Scholar] [CrossRef]
  6. Wang, J.; Huo, J.; Zhang, S.; Teng, Y.; Li, L.; Han, T. Flexibility transformation decision-making evaluation of coal-fired thermal power units deep peak shaving in China. Sustainability 2021, 13, 1882. [Google Scholar] [CrossRef]
  7. Hou, H.; Xu, T.; Wu, X.; Wang, H.; Tang, A.; Chen, Y. Optimal capacity configuration of the wind-photovoltaic-storage hybrid power system based on gravity energy storage system. Appl. Energy 2020, 271, 115052. [Google Scholar] [CrossRef]
  8. Lu, M.; Guan, J.; Wu, H.; Chen, H.; Gu, W.; Wu, Y.Z.; Hang, L. Day-ahead optimal dispatching of multi-source power system. Renew. Energy 2022, 183, 435–446. [Google Scholar] [CrossRef]
  9. Zhang, X.M.; Wang, L.P.; Li, J.W.; Zhang, Y.K. Self-optimization simulation model of short-term cascaded hydroelectric system dispatching based on the daily load curve. Water Resour. Manag. 2013, 27, 5045–5067. [Google Scholar] [CrossRef] [Green Version]
  10. Wu, X.Y.; Cheng, C.T.; Shen, J.J.; Luo, B.; Liao, S.L.; Li, G. A multi-objective short term hydropower scheduling model for peak shaving. Int. J. Electr. Power Energy Syst. 2015, 68, 278–293. [Google Scholar] [CrossRef]
  11. Wang, L.; Vo, Q.S.; Prokhorov, A.V. Stability improvement of a multimachine power system connected with a large-scale hybrid wind-photovoltaic farm using a supercapacitor. IEEE Trans. Ind. Appl. 2017, 54, 50–60. [Google Scholar] [CrossRef]
  12. Al Shereiqi, A.; Al-Hinai, A.; Albadi, M.; Al-Abri, R. Optimal sizing of a hybrid wind-photovoltaic-battery plant to mitigate output fluctuations in a grid-connected system. Energies 2020, 13, 3015. [Google Scholar] [CrossRef]
  13. Sun, K.; Li, K.J.; Pan, J.; Liu, Y.; Liu, Y. An optimal combined operation scheme for pumped storage and hybrid wind-photovoltaic complementary power generation system. Appl. Energy 2019, 242, 1155–1163. [Google Scholar] [CrossRef]
  14. Abdelshafy, A.M.; Jurasz, J.; Hassan, H.; Mohamed, A.M. Optimized energy management strategy for grid connected double storage (pumped storage-battery) system powered by renewable energy resources. Energy 2020, 192, 116615. [Google Scholar] [CrossRef]
  15. Teleke, S.; Baran, M.E.; Huang, A.Q.; Bhattacharya, S.; Anderson, L. Control strategies for battery energy storage for wind farm dispatching. IEEE Trans. Energy Convers. 2009, 24, 725–732. [Google Scholar] [CrossRef]
  16. He, Y.; Guo, S.; Zhou, J.; Wu, F.; Huang, J.; Pei, H. The quantitative techno-economic comparisons and multi-objective capacity optimization of wind-photovoltaic hybrid power system considering different energy storage technologies. Energy Convers. Manag. 2021, 229, 113779. [Google Scholar] [CrossRef]
  17. Xu, Y.; Zhao, T.; Zhao, S.; Zhang, J.; Wang, Y. Multi-objective chance-constrained optimal day-ahead scheduling considering BESS degradation. CSEE J. Power Energy Syst. 2018, 4, 316–325. [Google Scholar] [CrossRef]
  18. Zhang, J.; Cheng, C.; Yu, S.; Wu, H.; Gao, M. Sharing hydropower flexibility in interconnected power systems: A case study for the China Southern power grid. Appl. Energy 2021, 288, 116645. [Google Scholar] [CrossRef]
  19. Kerdphol, T.; Fuji, K.; Mitani, Y.; Watanabe, M.; Qudaih, Y. Optimization of a battery energy storage system using particle swarm optimization for stand-alone micro-grids. Int. J. Electr. Power Energy Syst. 2016, 81, 32–39. [Google Scholar] [CrossRef]
  20. Nguyen, T.T. An improved cuckoo search algorithm for the problem of electric distribution network reconfiguration. Appl. Soft Comput. 2019, 84, 105720. [Google Scholar] [CrossRef]
  21. Mohamed, M.A.; Eltamaly, A.M.; Alolah, A.I. Swarm intelligence-based optimization of grid-dependent hybrid renewable energy systems. Renew. Sustain. Energy Rev. 2017, 77, 515–524. [Google Scholar] [CrossRef]
  22. Sharifi, M.R.; Akbarifard, S.; Qaderi, K.; Madadi, M.R. Developing MSA algorithm by new fitness-distance-balance selection method to optimize cascade hydropower reservoirs operation. Water Resour. Manag. 2021, 35, 385–406. [Google Scholar] [CrossRef]
  23. Zhao, M.; Wang, Y.; Wang, X.; Chang, J.; Chen, Y.; Zhou, Y.; Guo, A. Flexibility evaluation of wind-PV-hydro multi-energy complementary base considering the compensation ability of cascade hydropower stations. Appl. Energy 2022, 315, 119024. [Google Scholar] [CrossRef]
  24. Jenkins, D.P.; Fletcher, J.; Kane, D. Lifetime prediction and sizing of lead–acid batteries for microgeneration storage applications. IET Renew. Power Gener. 2008, 2, 191–200. [Google Scholar] [CrossRef]
  25. Sun, S.; Zhang, Q.; Sun, J.; Cai, W.; Zhou, Z.; Yang, Z.; Wang, Z. Lead–Acid Battery SOC Prediction Using Improved AdaBoost Algorithm. Energies 2022, 15, 5842. [Google Scholar] [CrossRef]
  26. Wu, G.; Li, T.; Xu, W.; Xiang, Y.; Su, Y.; Liu, J.; Liu, F. Chance-constrained energy-reserve co-optimization scheduling of wind-photovoltaic-hydrogen integrated energy systems. Int. J. Hydrogen Energy 2023, 48, 6892–6905. [Google Scholar] [CrossRef]
  27. Yun, J.Y.; Yu, G.; Kook, K.S.; Rho, D.H.; Chang, B.H. SOC-based control strategy of battery energy storage system for power system frequency regulation. Trans. Korean Inst. Electr. Eng. 2014, 63, 622–628. [Google Scholar] [CrossRef] [Green Version]
  28. Ghorbani, N.; Kasaeian, A.; Toopshekan, A.; Bahrami, L.; Maghami, A. Optimizing a hybrid wind-PV-battery system using GA-PSO and MOPSO for reducing cost and increasing reliability. Energy 2018, 154, 581–591. [Google Scholar] [CrossRef]
  29. Xing, Y.X.; Wang, J.S.; Zheng, Y.; Wang, Y.C. Partiele Swarm Optimization Algorithm Based on Different Inertia Weights for Solving the P-Hub Allocation Problem. IAENG Int. J. Appl. Math. 2022, 52, 1–15. [Google Scholar]
  30. Chen, Y.; Liu, Z.; Xu, C.; Zhao, X.; Pang, L.; Li, K.; Shi, Y. Heavy metal content prediction based on Random Forest and Sparrow Search Algorithm. J. Chemom. 2022, 36, e3445. [Google Scholar] [CrossRef]
  31. Zhang, L.; Xu, J.; Liu, Y.; Zhao, H.; Deng, W. Particle swarm optimization algorithm with multi-strategies for delay scheduling. Neural Process. Lett. 2022, 54, 4563–4592. [Google Scholar] [CrossRef]
Figure 1. Wind–photovoltaic storage combined system structure diagram.
Energies 16 05002 g001
Figure 2. Life-loss weight considering SOC factor of battery.
Energies 16 05002 g002
Figure 3. Flow chart of charging strategy for hybrid energy storage system.
Energies 16 05002 g003
Figure 4. Flow chart of discharging strategy for hybrid energy storage system.
Energies 16 05002 g004
Figure 5. The initial population generated (Population N = 50): (a) random method; (b) prime ideal method.
Energies 16 05002 g005
Figure 6. Flow chart of improved PSO.
Energies 16 05002 g006
Figure 7. Typical daily load and wind–solar data.
Energies 16 05002 g007
Figure 8. The optimal scheduling results of objective one: (a) conventional strategy; (b) optimization strategy.
Energies 16 05002 g008
Figure 9. Battery SOC under objective one operation.
Energies 16 05002 g009
Figure 10. The optimal scheduling results of objective two: (a) conventional strategy; (b) optimization strategy.
Energies 16 05002 g010
Figure 11. Battery SOC under objective two operation.
Energies 16 05002 g011
Figure 12. The optimal scheduling results of objective three: (a) conventional strategy; (b) optimization strategy.
Energies 16 05002 g012
Figure 13. Battery SOC under objective three operation.
Energies 16 05002 g013
Figure 14. Algorithm results comparison chart.
Energies 16 05002 g014
Table 1. Basic data of combined power generation system.
Technical Specifications
Wind farmInstalled capacity (MW)500
Investment cost (104 RMB/MW)1200
The operation and maintenance factor0.25
Service life (a)25
PV power stationInstalled capacity (MW)400
Investment cost (104 RMB/MW)2000
The operation and maintenance factor0.125
Service life (a)10
Pumped storageInstalled capacity (MW)75
Pump turbine construction costs (104 RMB/MW)210
Pump turbine operation and maintenance costs (104 RMB/MW)2
η c 0.8
ξ c 0.9
Battery energy storage stationInstalled capacity (MW)25
Investment cost (104 RMB/MW)502.4
S O C m i n 0.3
S O C m a x 0.8
η b 0.85
ξ b 0.9
Table 2. Optimization results of different operational strategies under three optimization objectives.
Optimization ObjectivesOperational StrategiesGeneralized Load Mean Square Deviation (MW)Wind and Solar Curtailment (%)Battery Life Loss Coefficient (%)Total System Generation Cost (104 RMB)
Minimize the mean squared deviation of generalized loadGeneral strategy43.8314.320.073467.91
Optimization strategy46.7613.930.055464.83
Minimize the fluctuation of combined system outputGeneral strategy45.1914.390.088470.10
Optimization strategy47.8214.180.053465.86
Minimize the generation cost of the combined systemGeneral strategy60.489.640.092449.14
Optimization strategy54.099.710.081448.88
Table 3. Comparison of operating costs for objective three.
Type of Operating CostDaily Operating Cost without Considering Optimization Strategy
(104 RMB)
Daily Operating Cost of Considering Optimization Strategy
(104 RMB)
Wind and photovoltaic power192.99193.17
Generalized load224.58223.03
Pumped storage12.1212.84
Battery storage10.8211.19
Wind and solar curtailment8.638.65
Total cost449.14448.88
Disclaimer/Publisher’s Note: The statements, opinions and data contained in all publications are solely those of the individual author(s) and contributor(s) and not of MDPI and/or the editor(s). MDPI and/or the editor(s) disclaim responsibility for any injury to people or property resulting from any ideas, methods, instructions or products referred to in the content.

