
Exploring the Potential of Kite-Based Wind Power Generation: An Emulation-Based Approach

 ,
,  ,
, 
Abstract
:1. Introduction
- The study analysed the scalability of the KAWECS using PMSM and key results are discussed in the paper;
- The dynamic behaviour of a kite-based wind power generation. The effects of wind speed in terms of reel-out speed, tether force, traction power, drum speed, and drum torque are described;
- The design, simulation, and implementation of an airborne wind energy turbine emulator system built using PMSM is outlined;
- The KAWECS emulator was tested with the experimental data from the field tests and the behaviour of the system is described.
2. KAWECS Emulator Modelling
2.1. Kite Dynamics
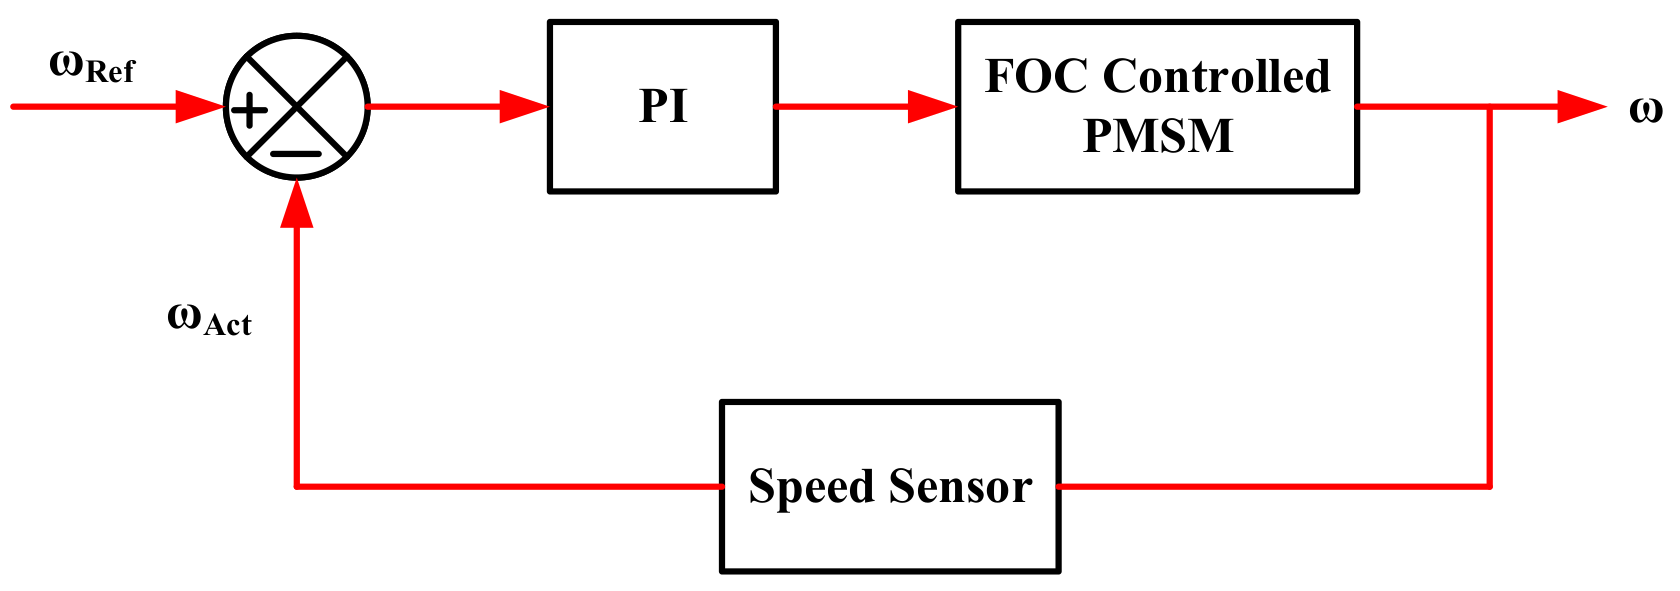
2.2. PMSM Modelling
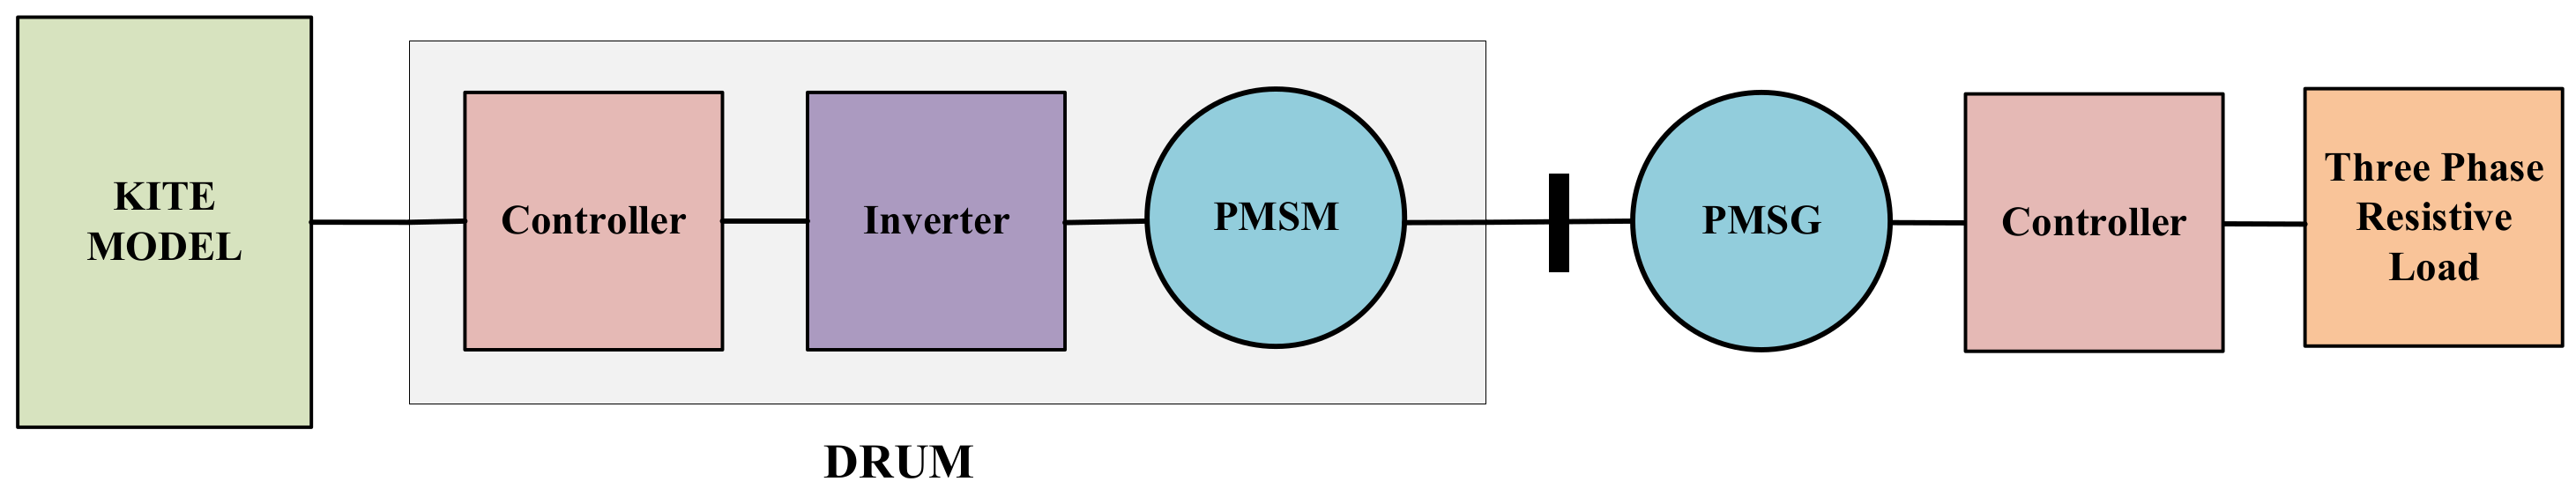
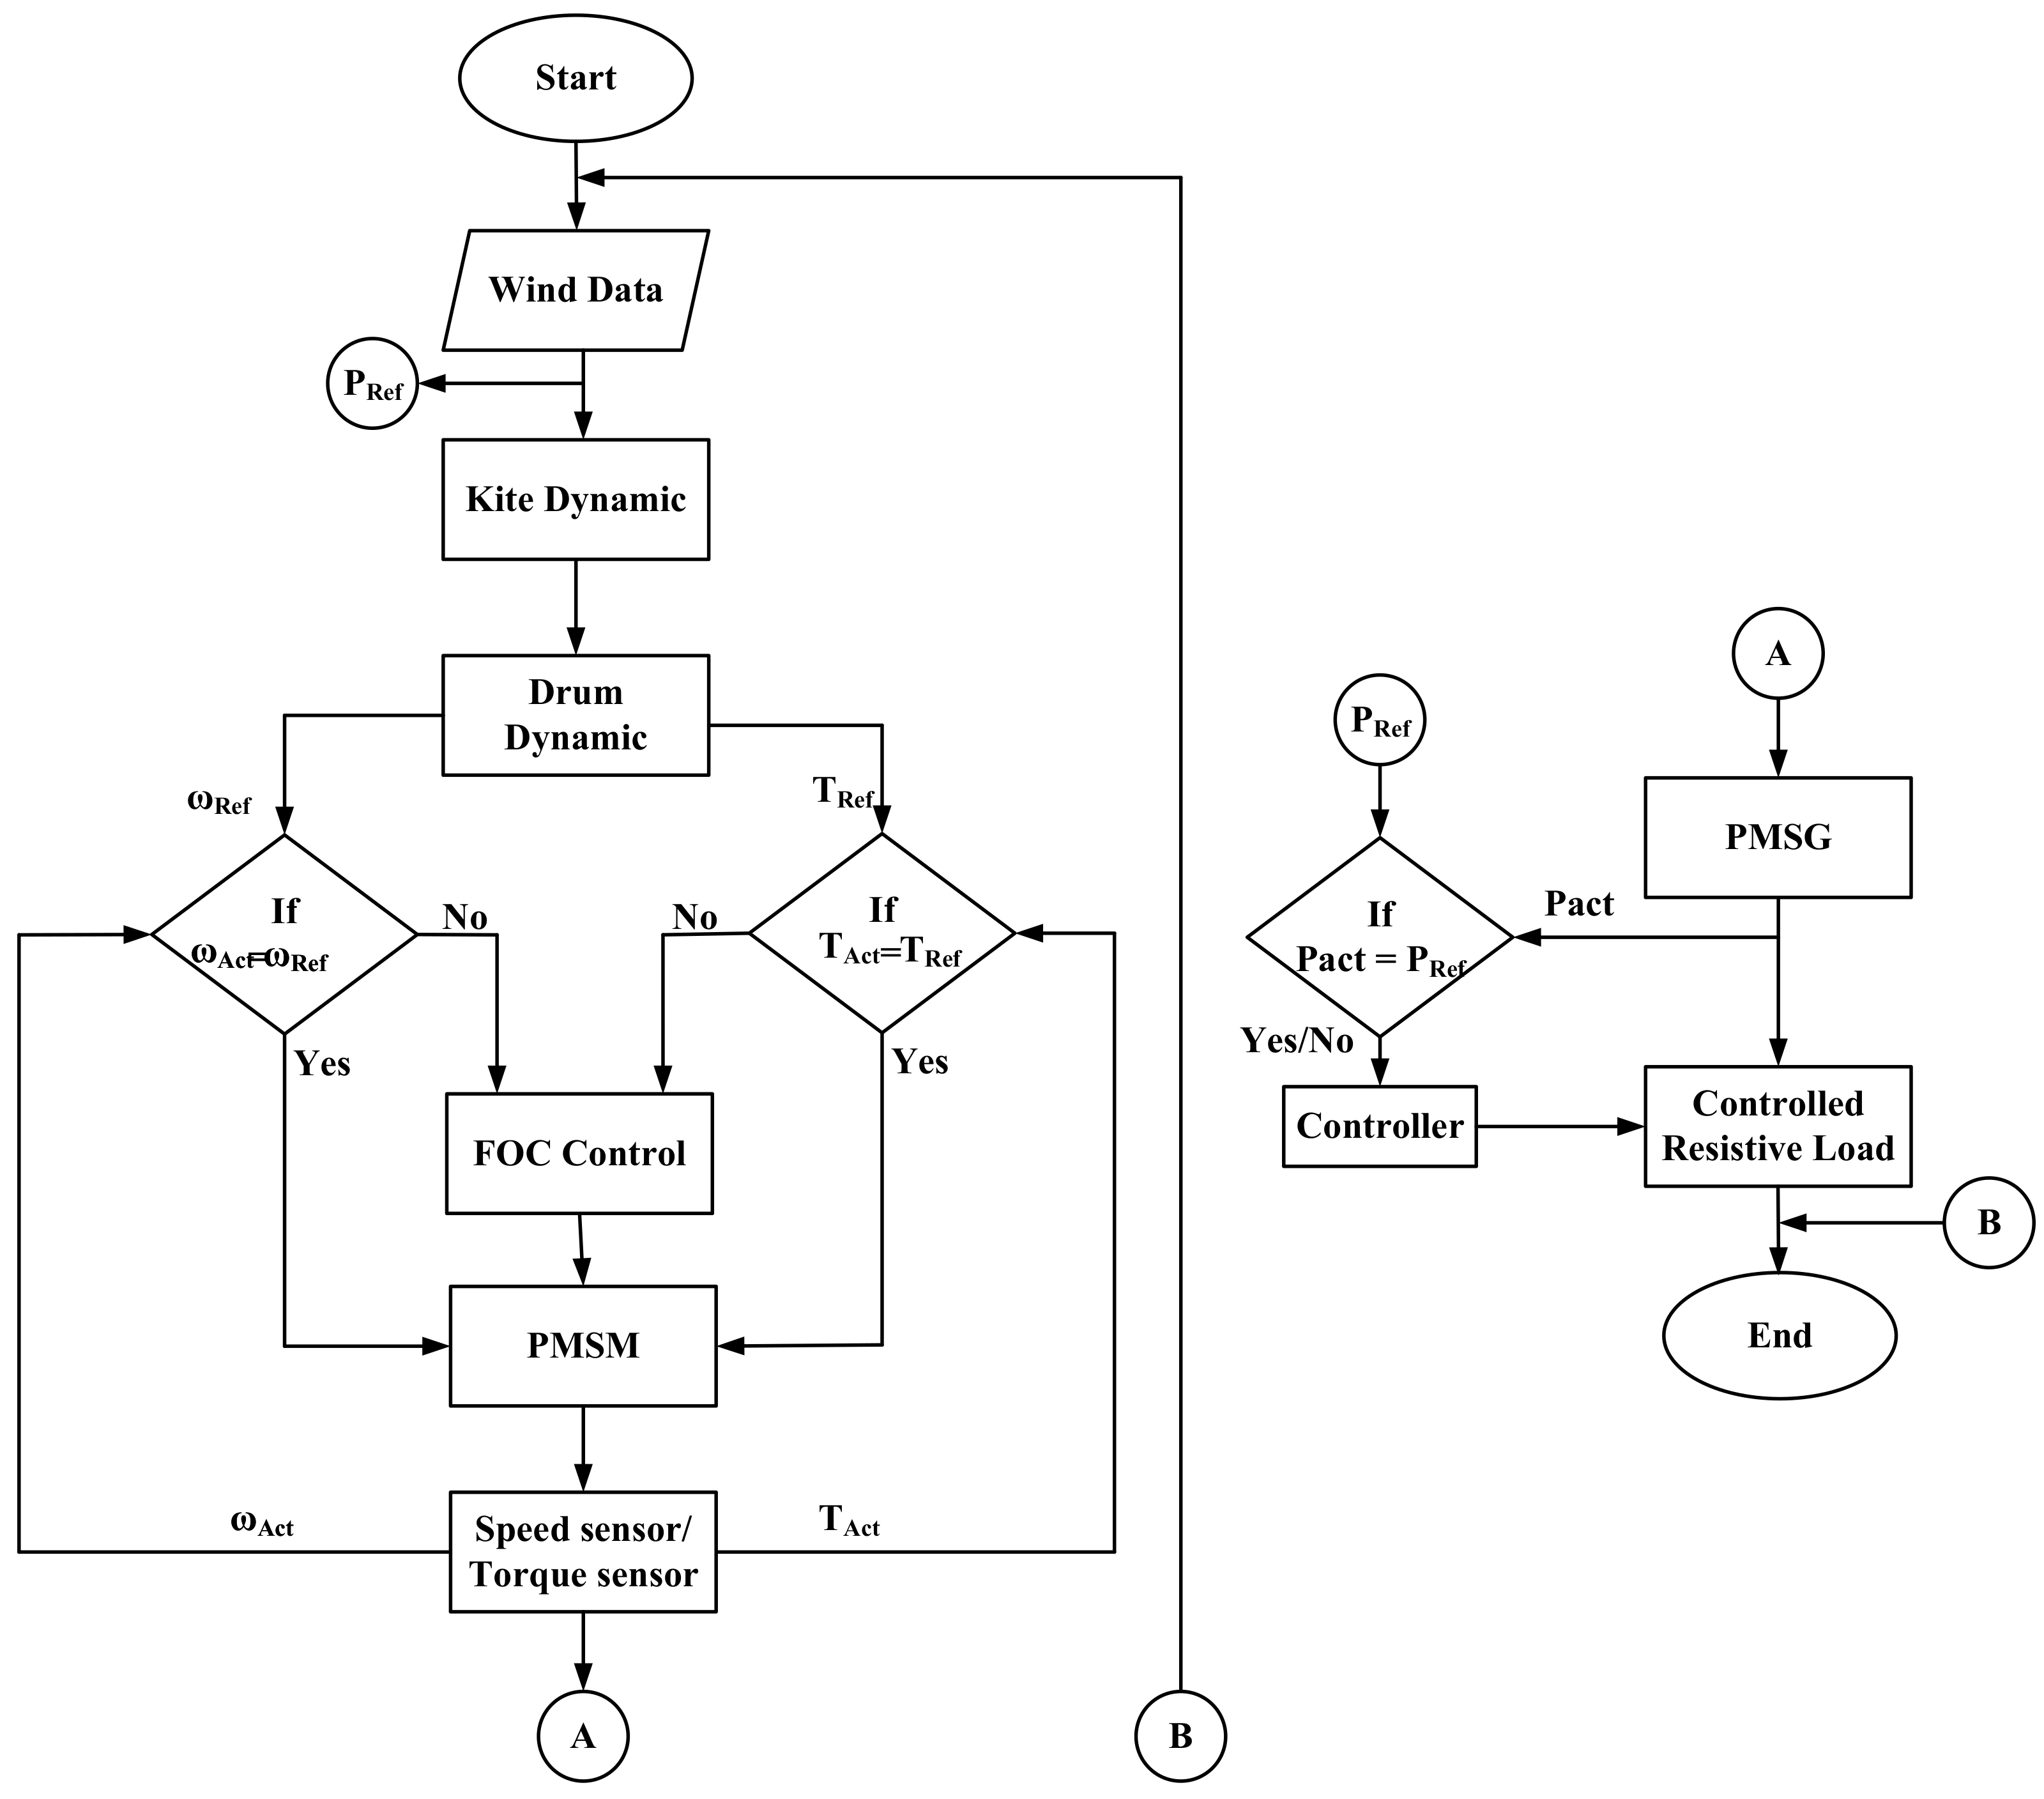
2.3. Simulation Model
2.4. Emulator Model
2.5. Comparison with Conventional Wind Turbine
3. Simulation Results and Discussion
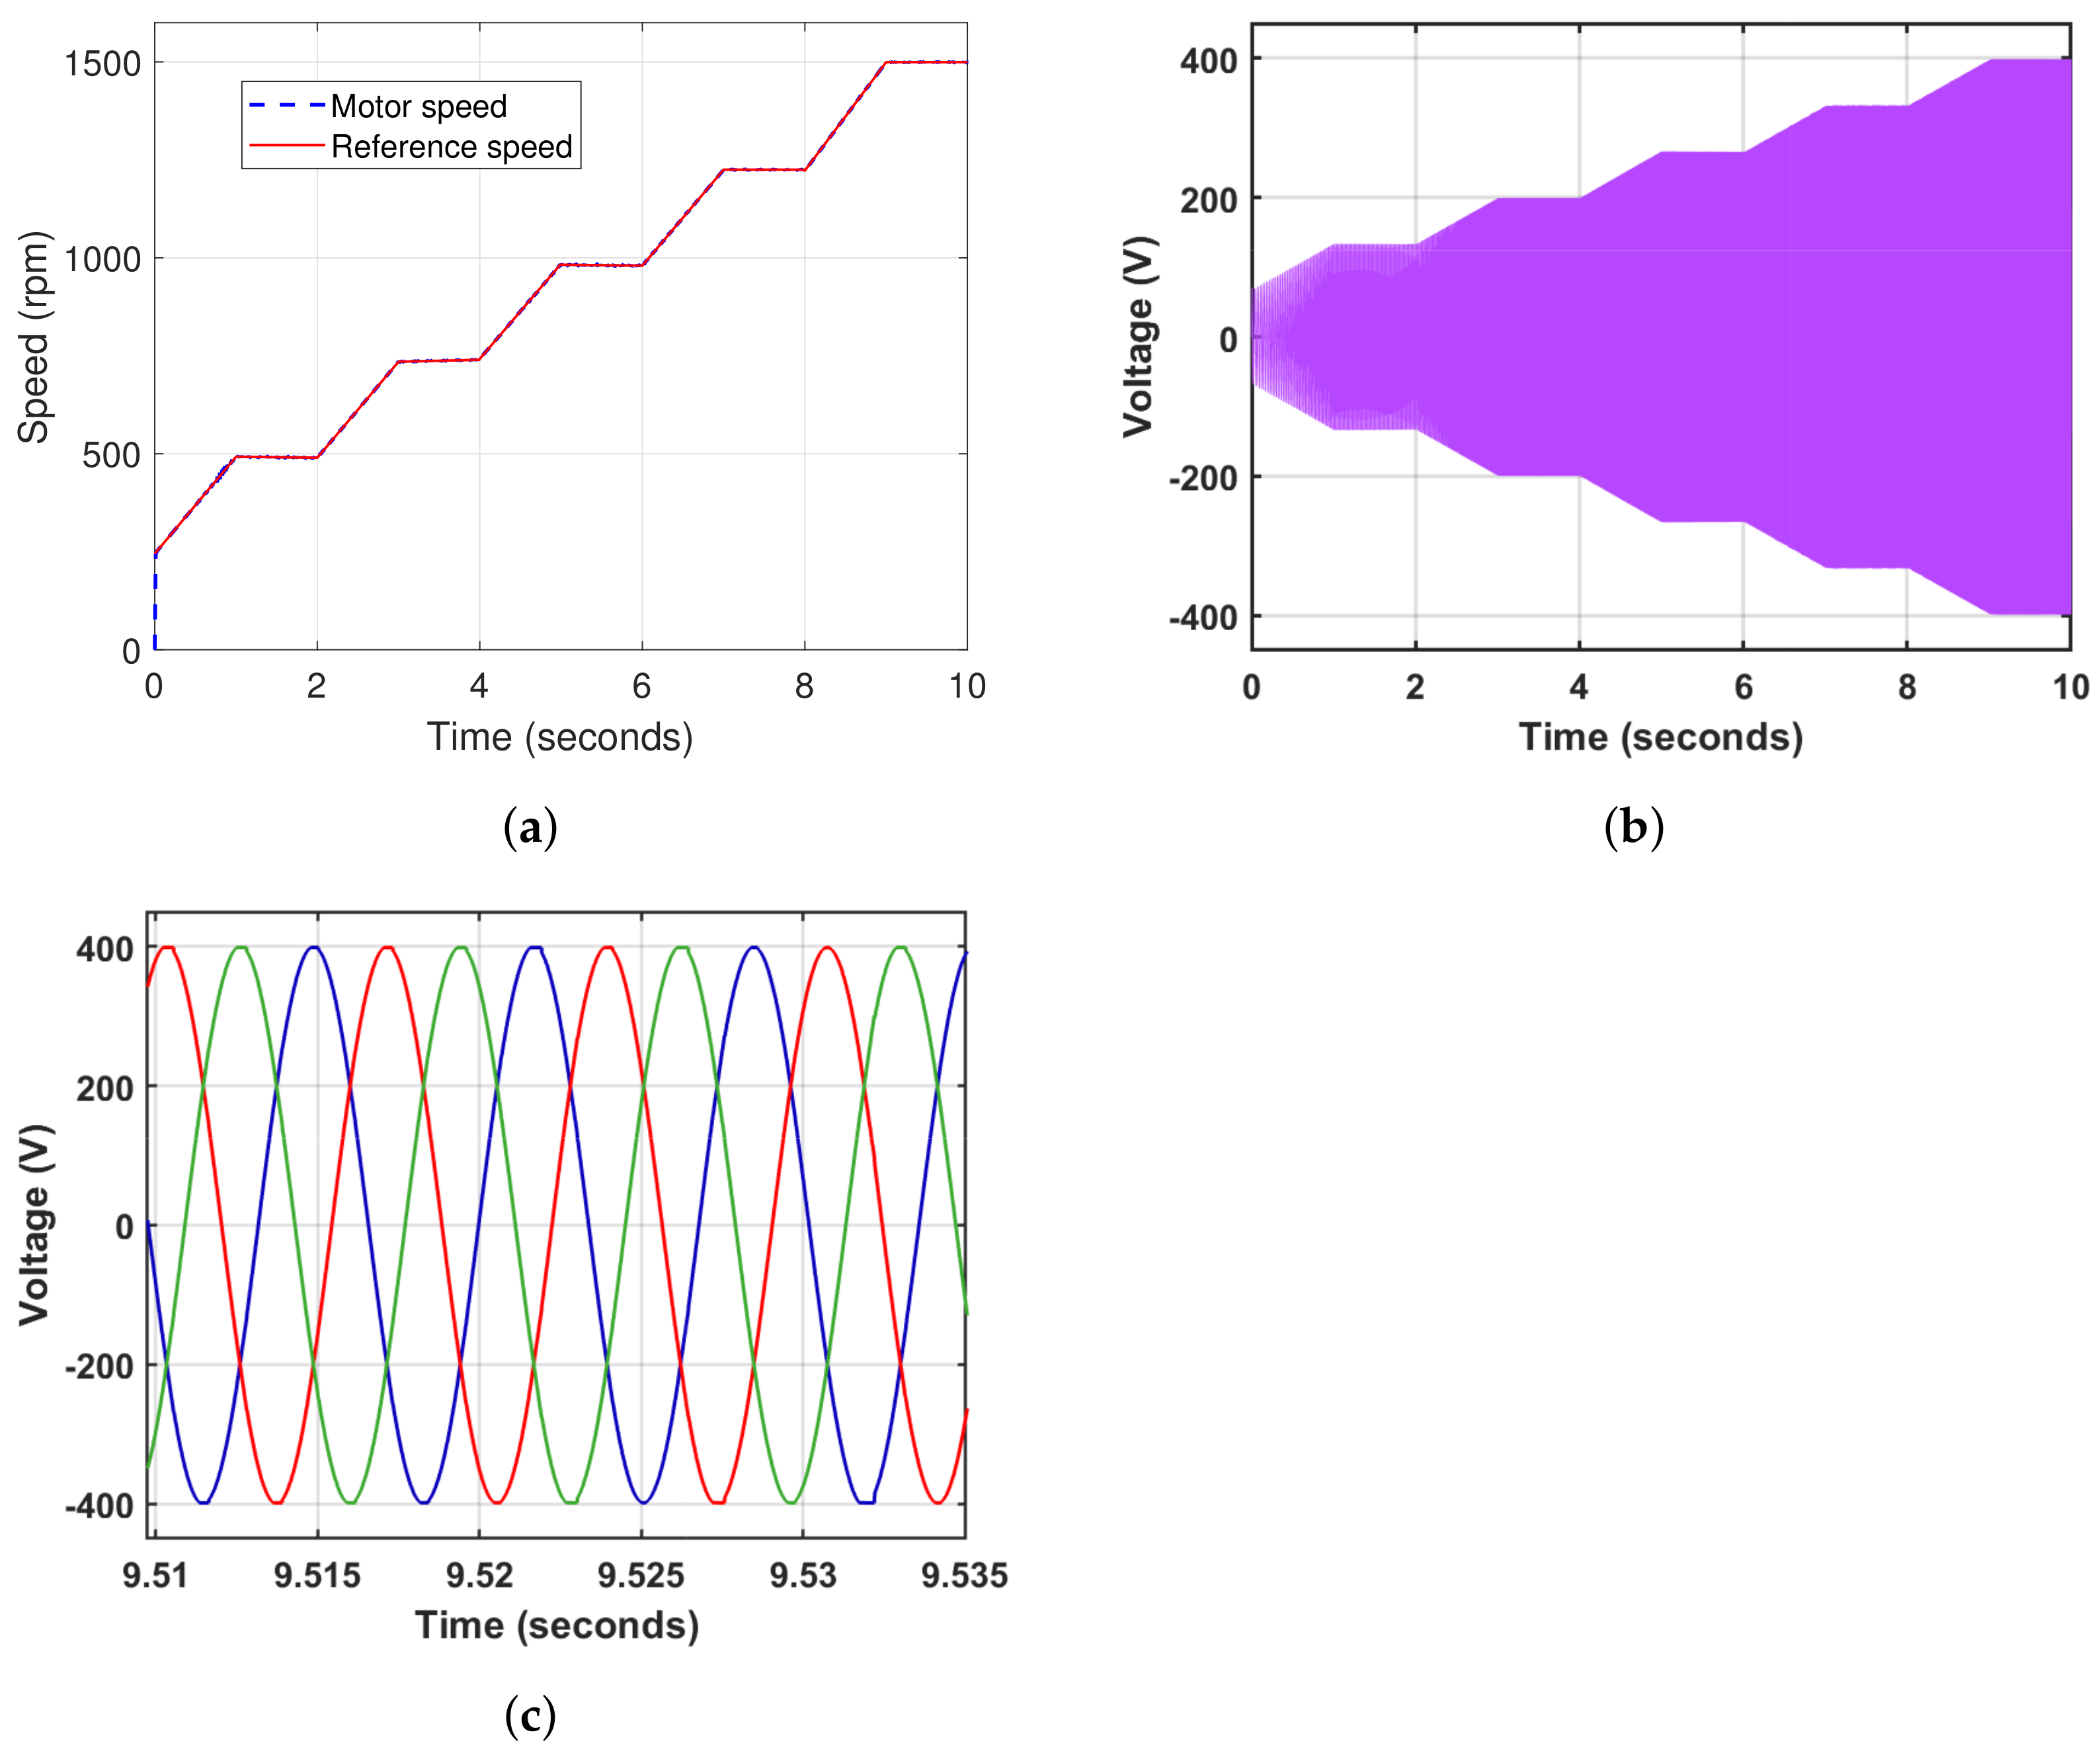
3.1. No-Load Test
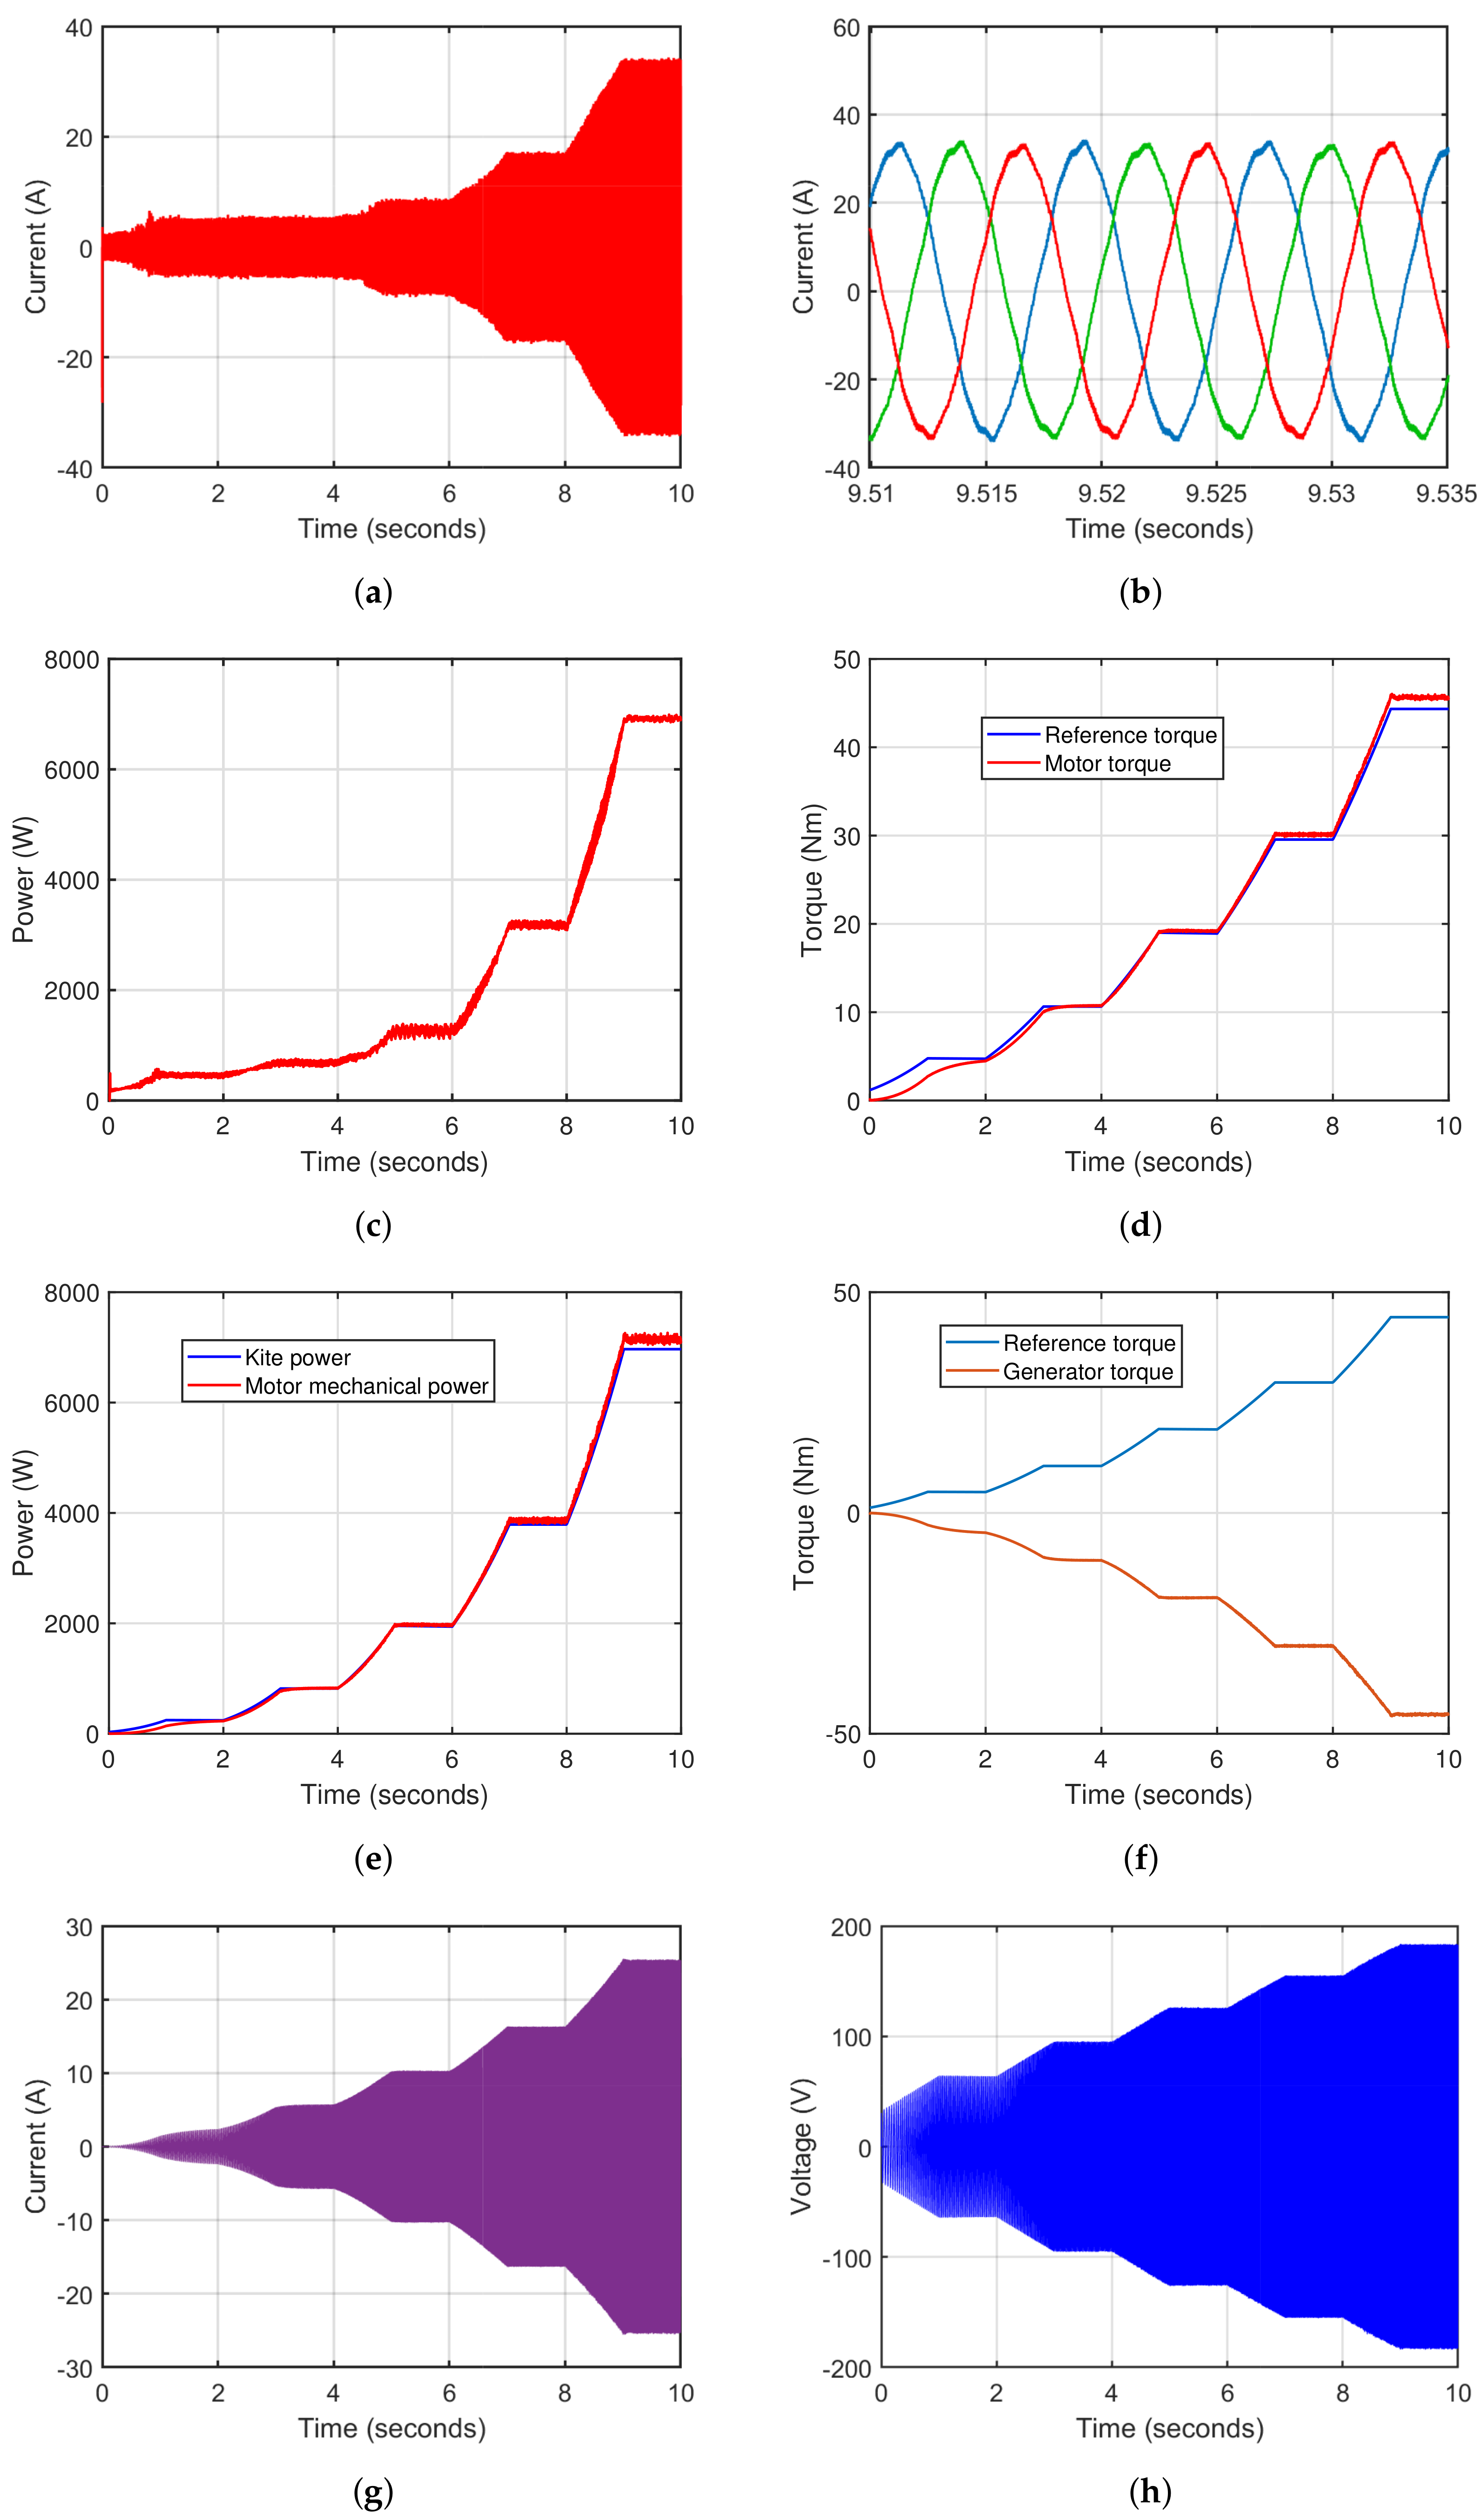
3.2. On-Load Test
3.3. Field Test Data Analysis
3.4. Simulation Using the Satellite Data
3.5. Verification Using Experimental Data
3.6. Discussion and Applications
4. Conclusions
- The KAWECS emulator based on an FOC-controlled PMSM offers precise control over speed and torque, which can mimic the kite characteristics accurately;
- The KAWECS emulator offers a wide range of kite sizes at varying wind speeds, which can help researchers to realise the system prior to implementation to study the dynamics of the system;
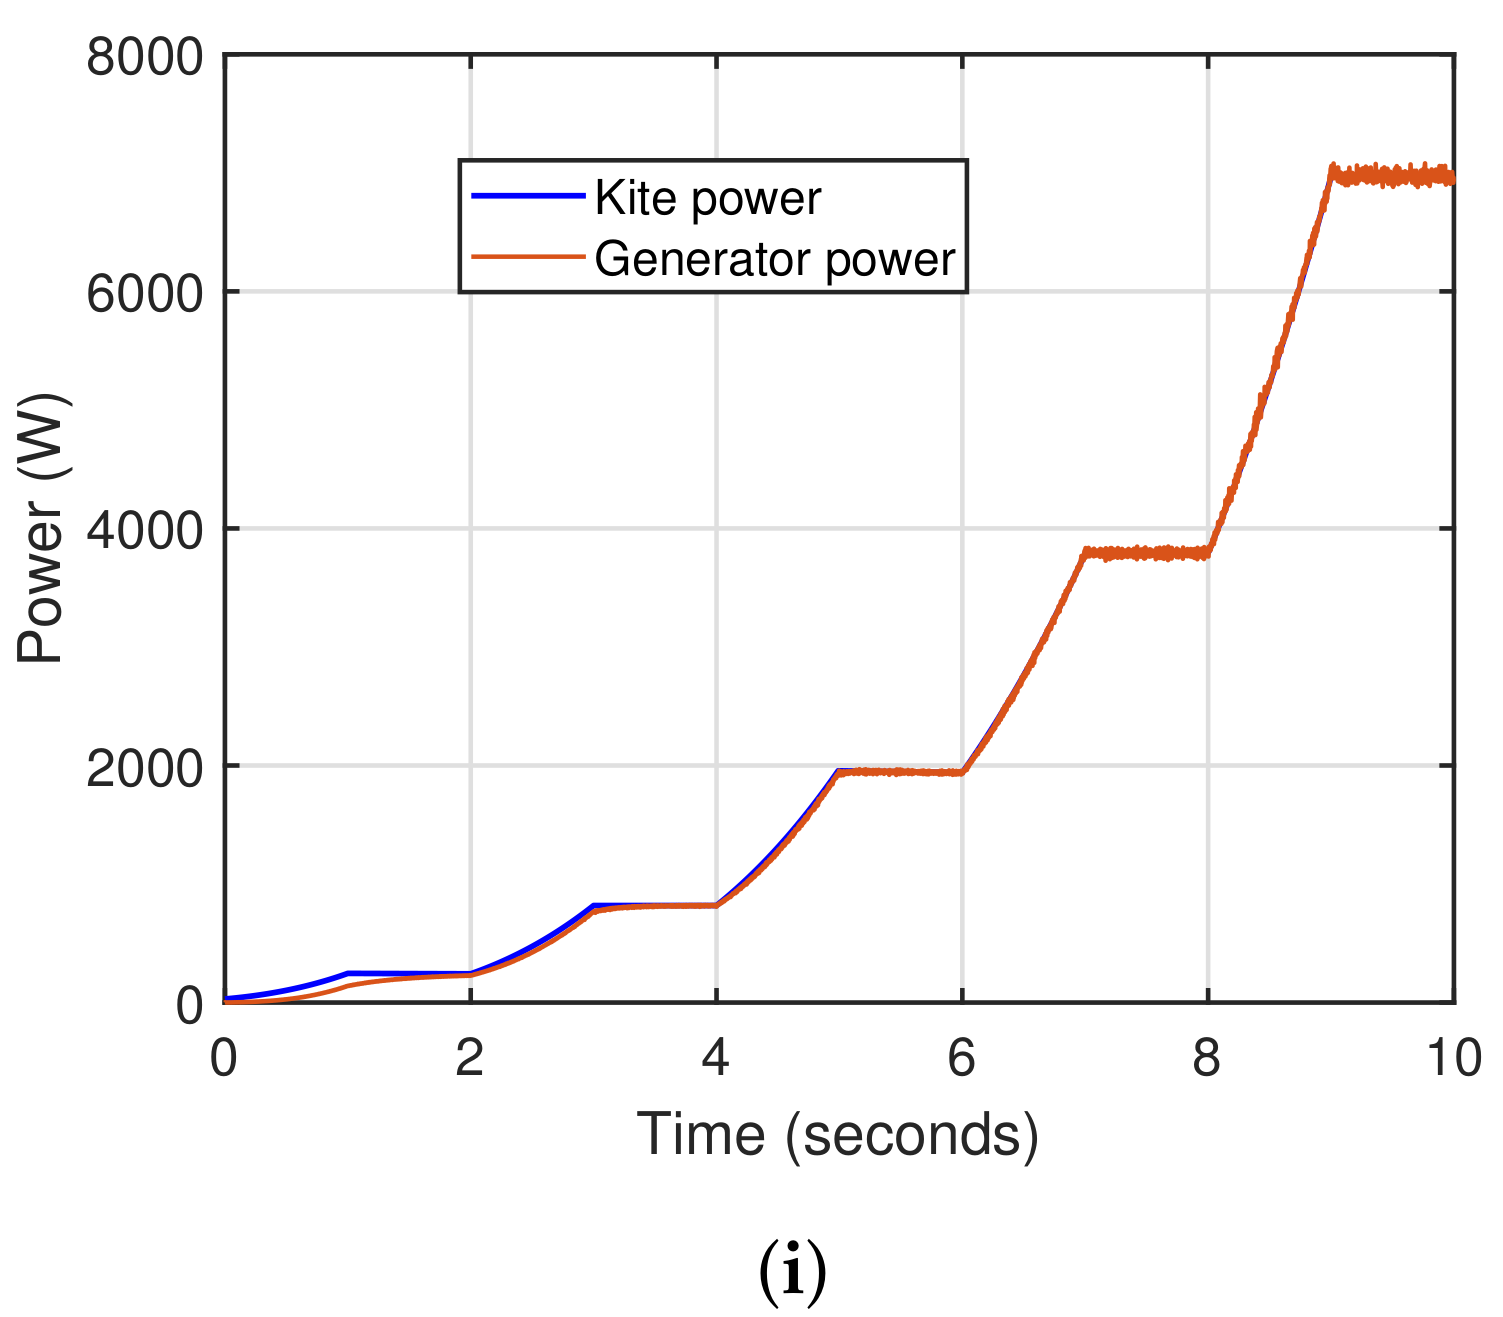
- The proposed KAWECS emulator was simulated with three power ranges of 1 kW, 10 kW, and 100 kW at a kite surface area of 2.5 m, 14 m, and 60 m, respectively, at the generator terminal;
- The wind speed varied from 2 m/s to 12.25 m/s for both no-load and full-load rated conditions. We used experimental ground test data to verify the system and the dynamic behaviour of the generator under no-load and on-load conditions;
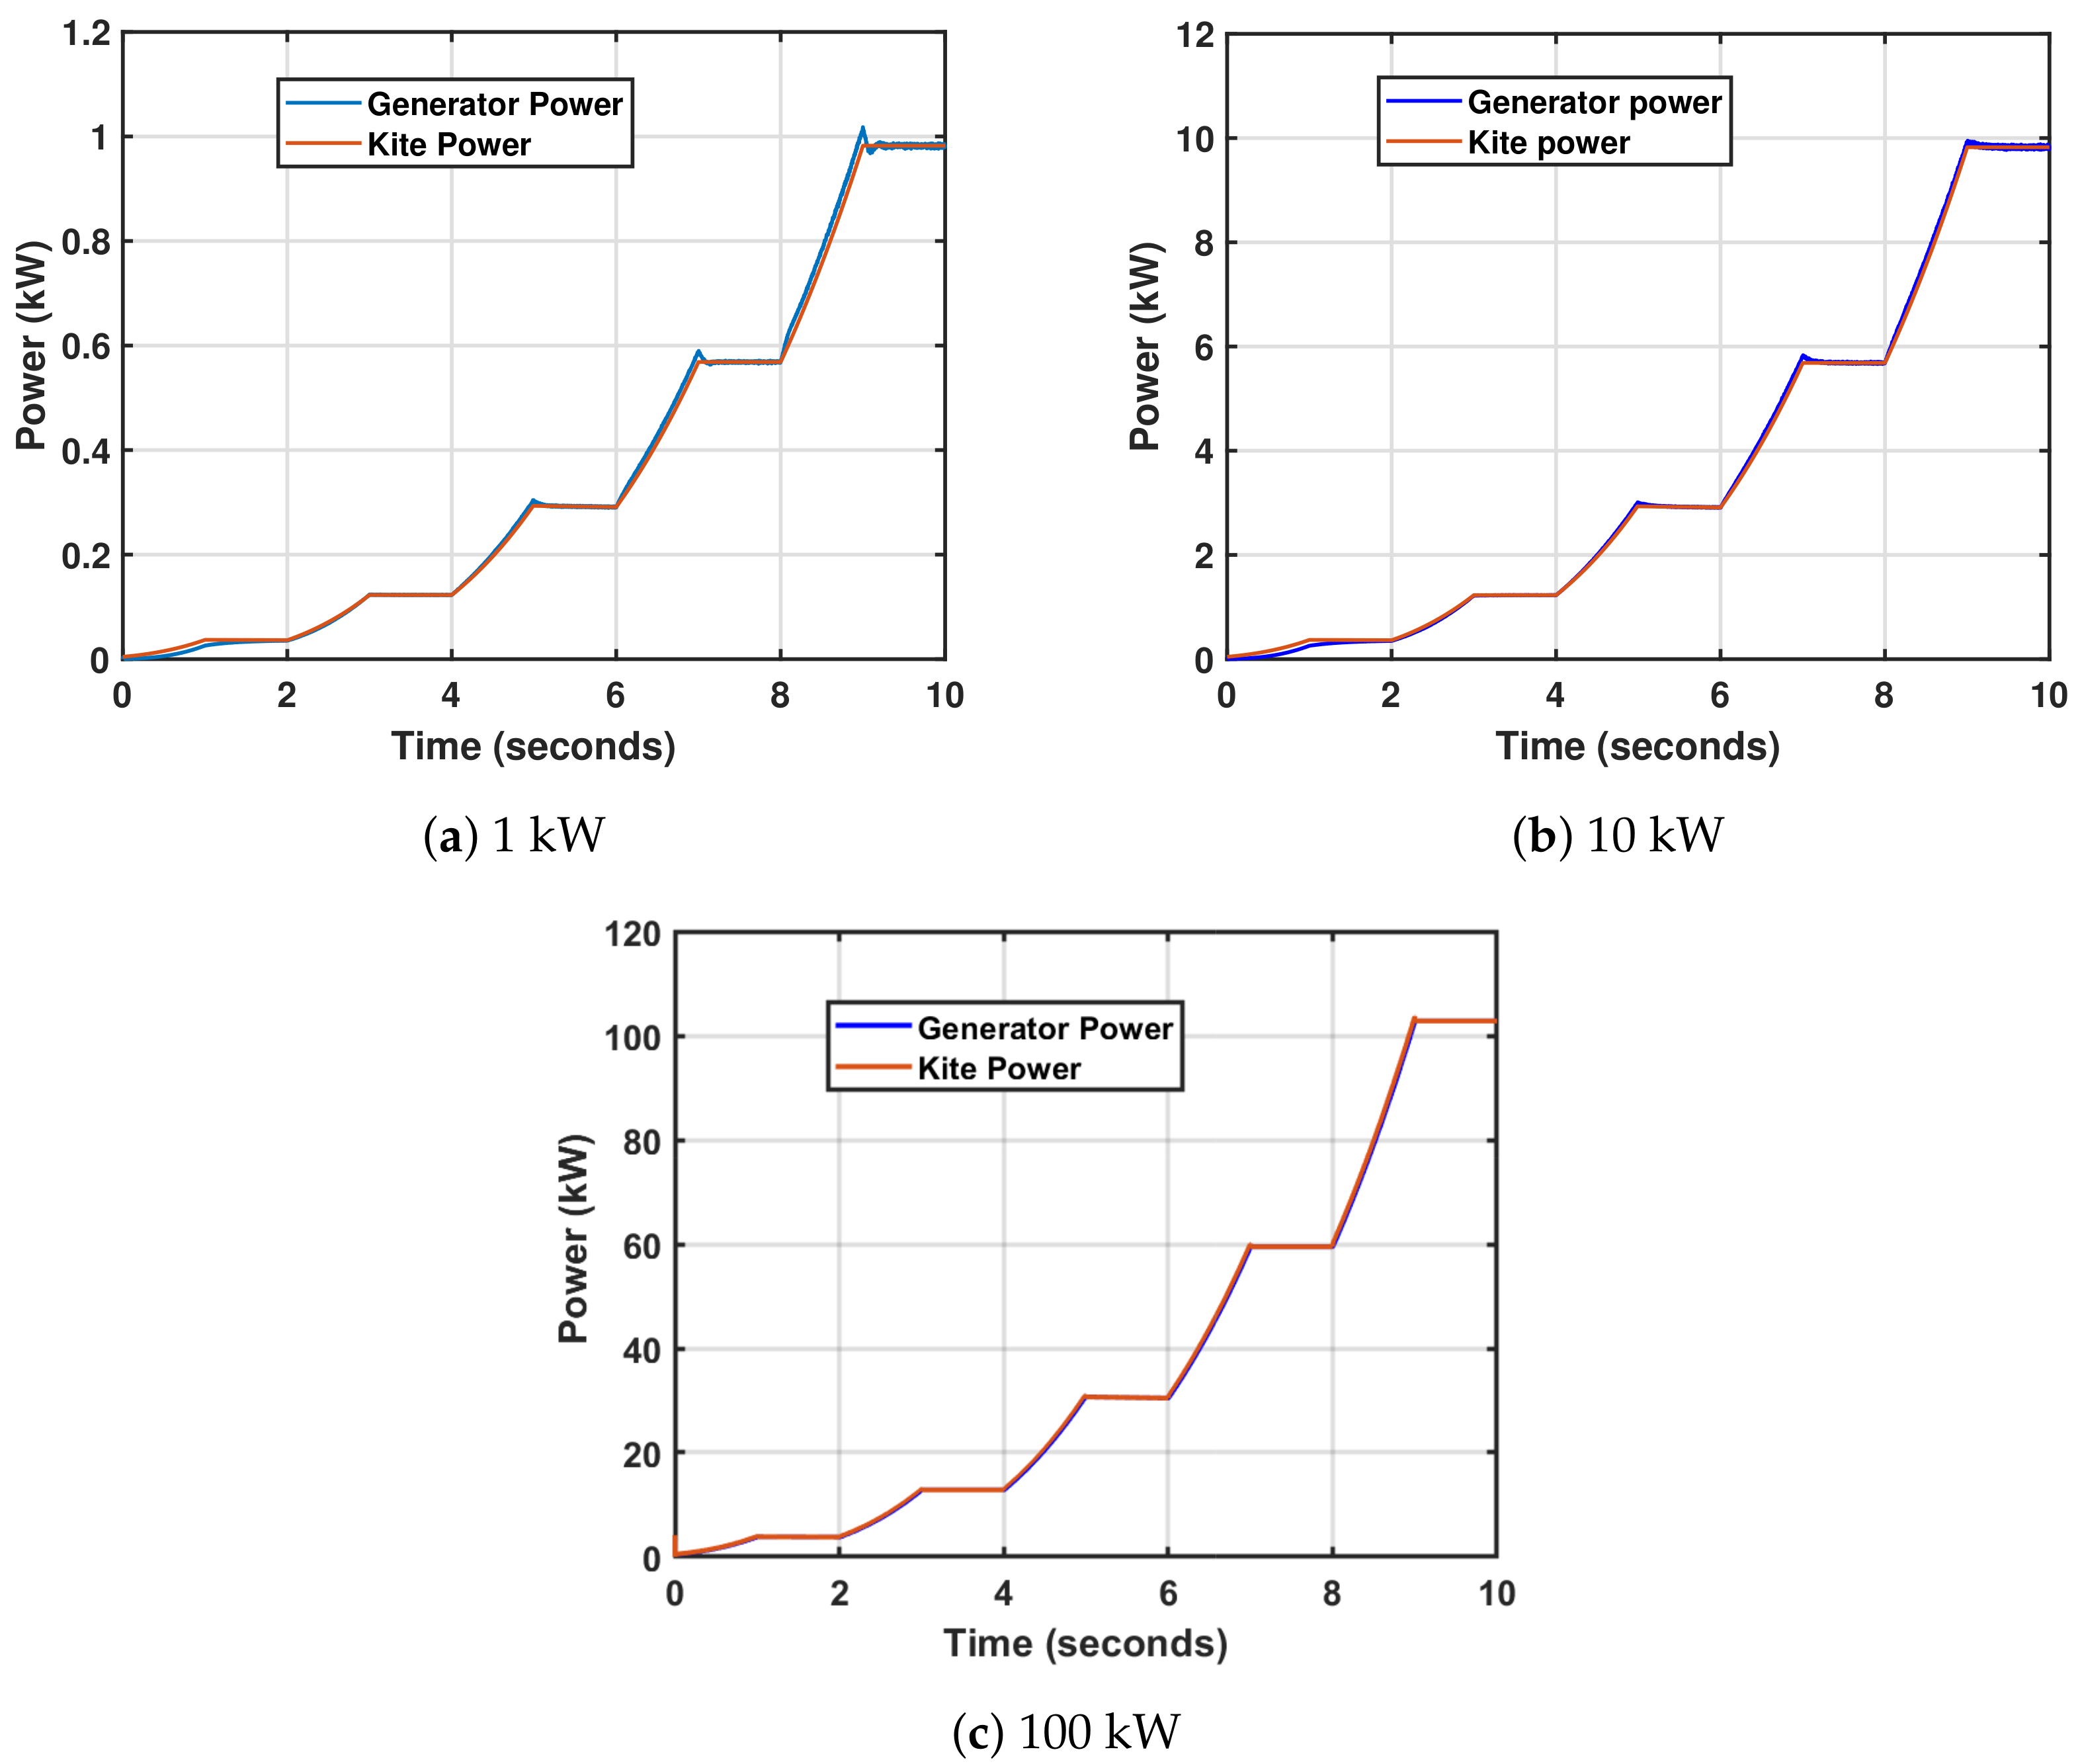
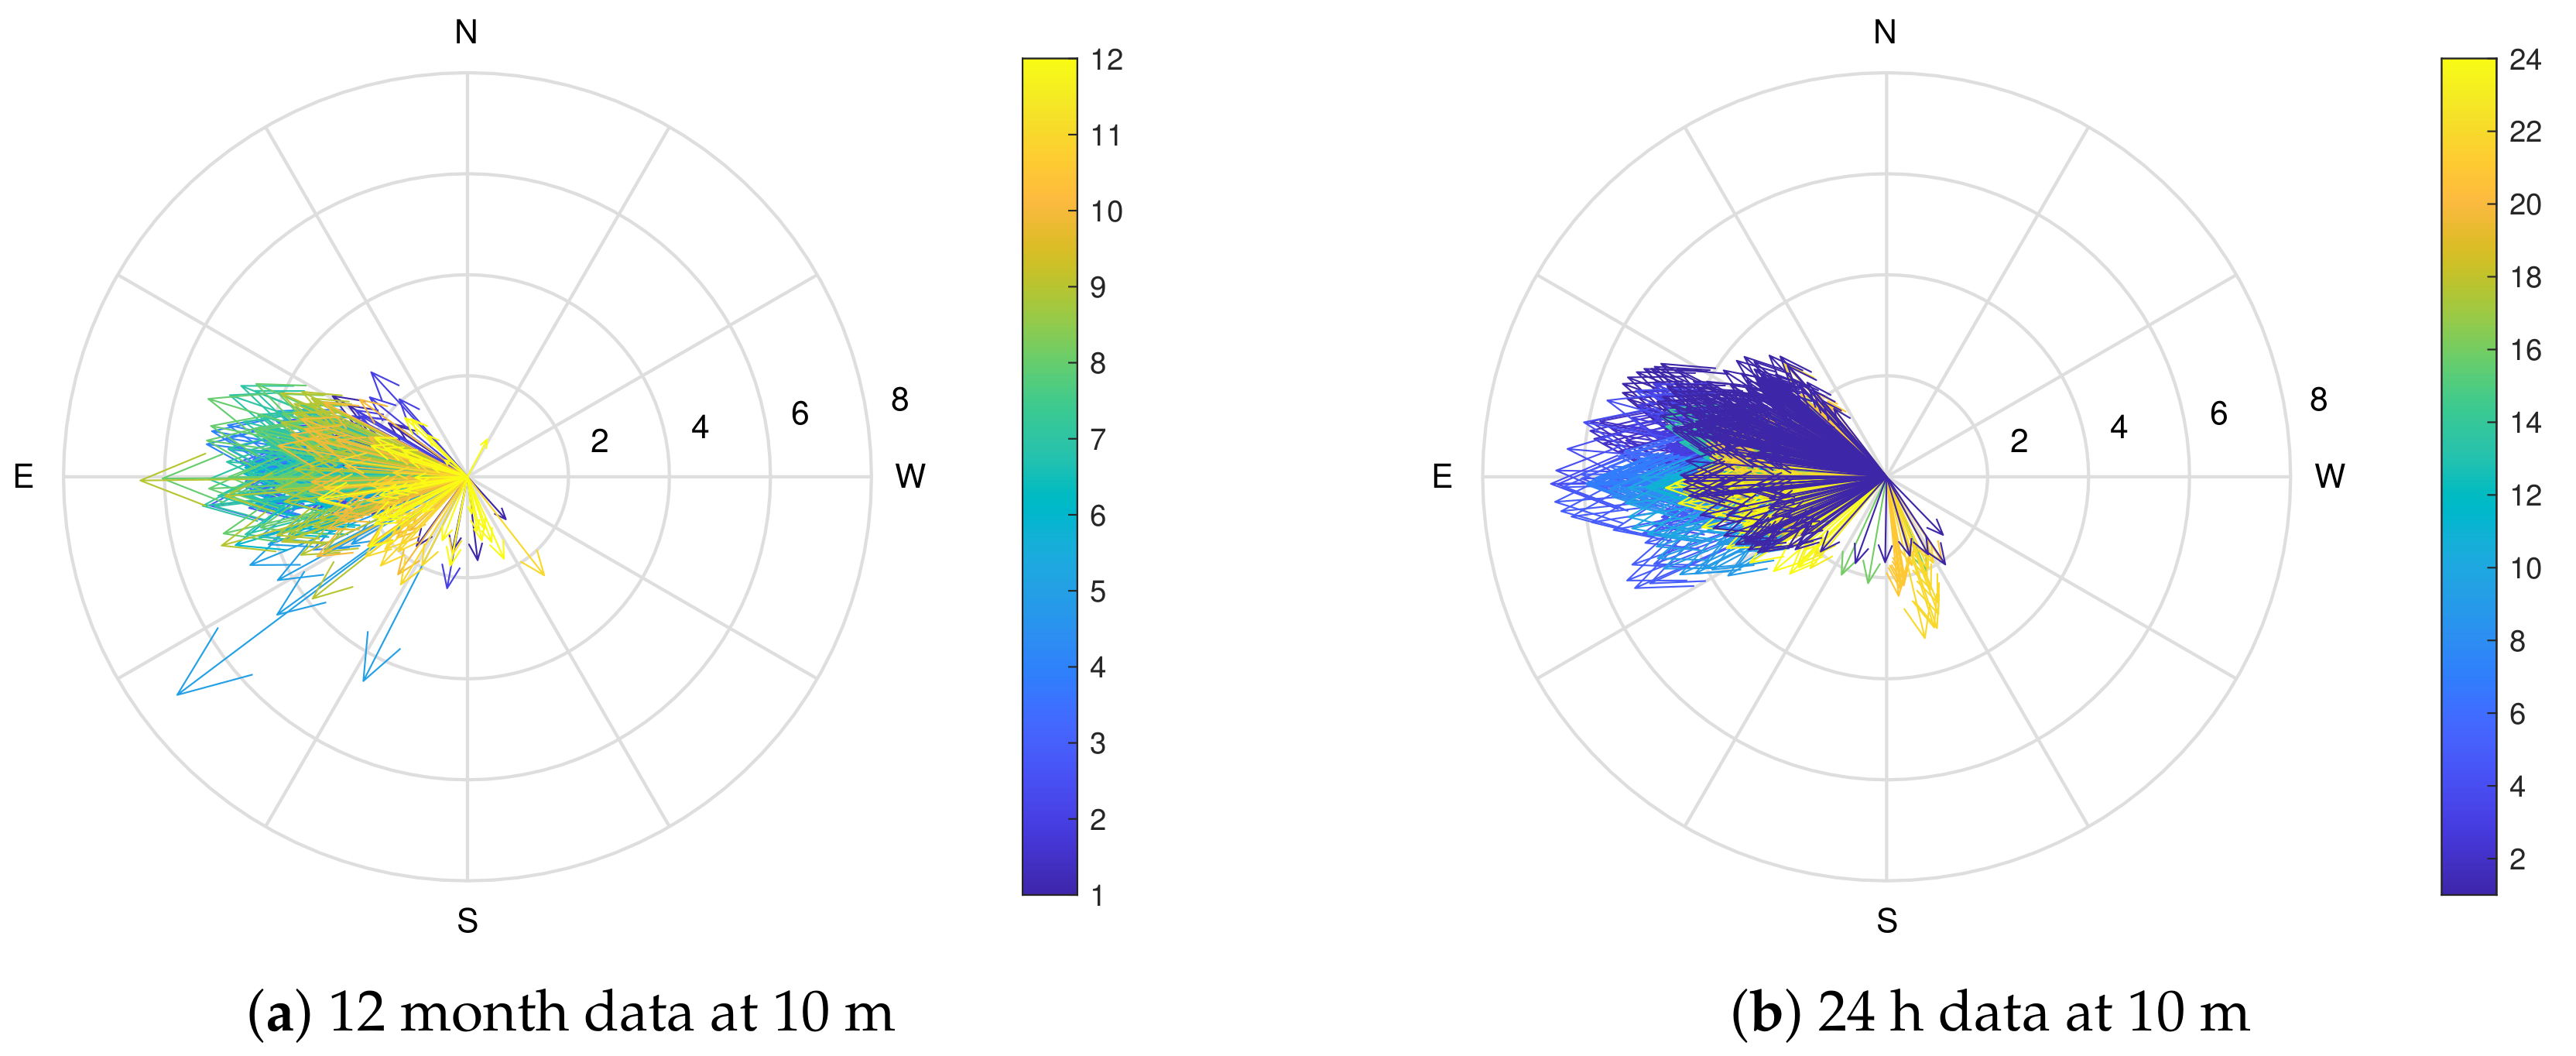
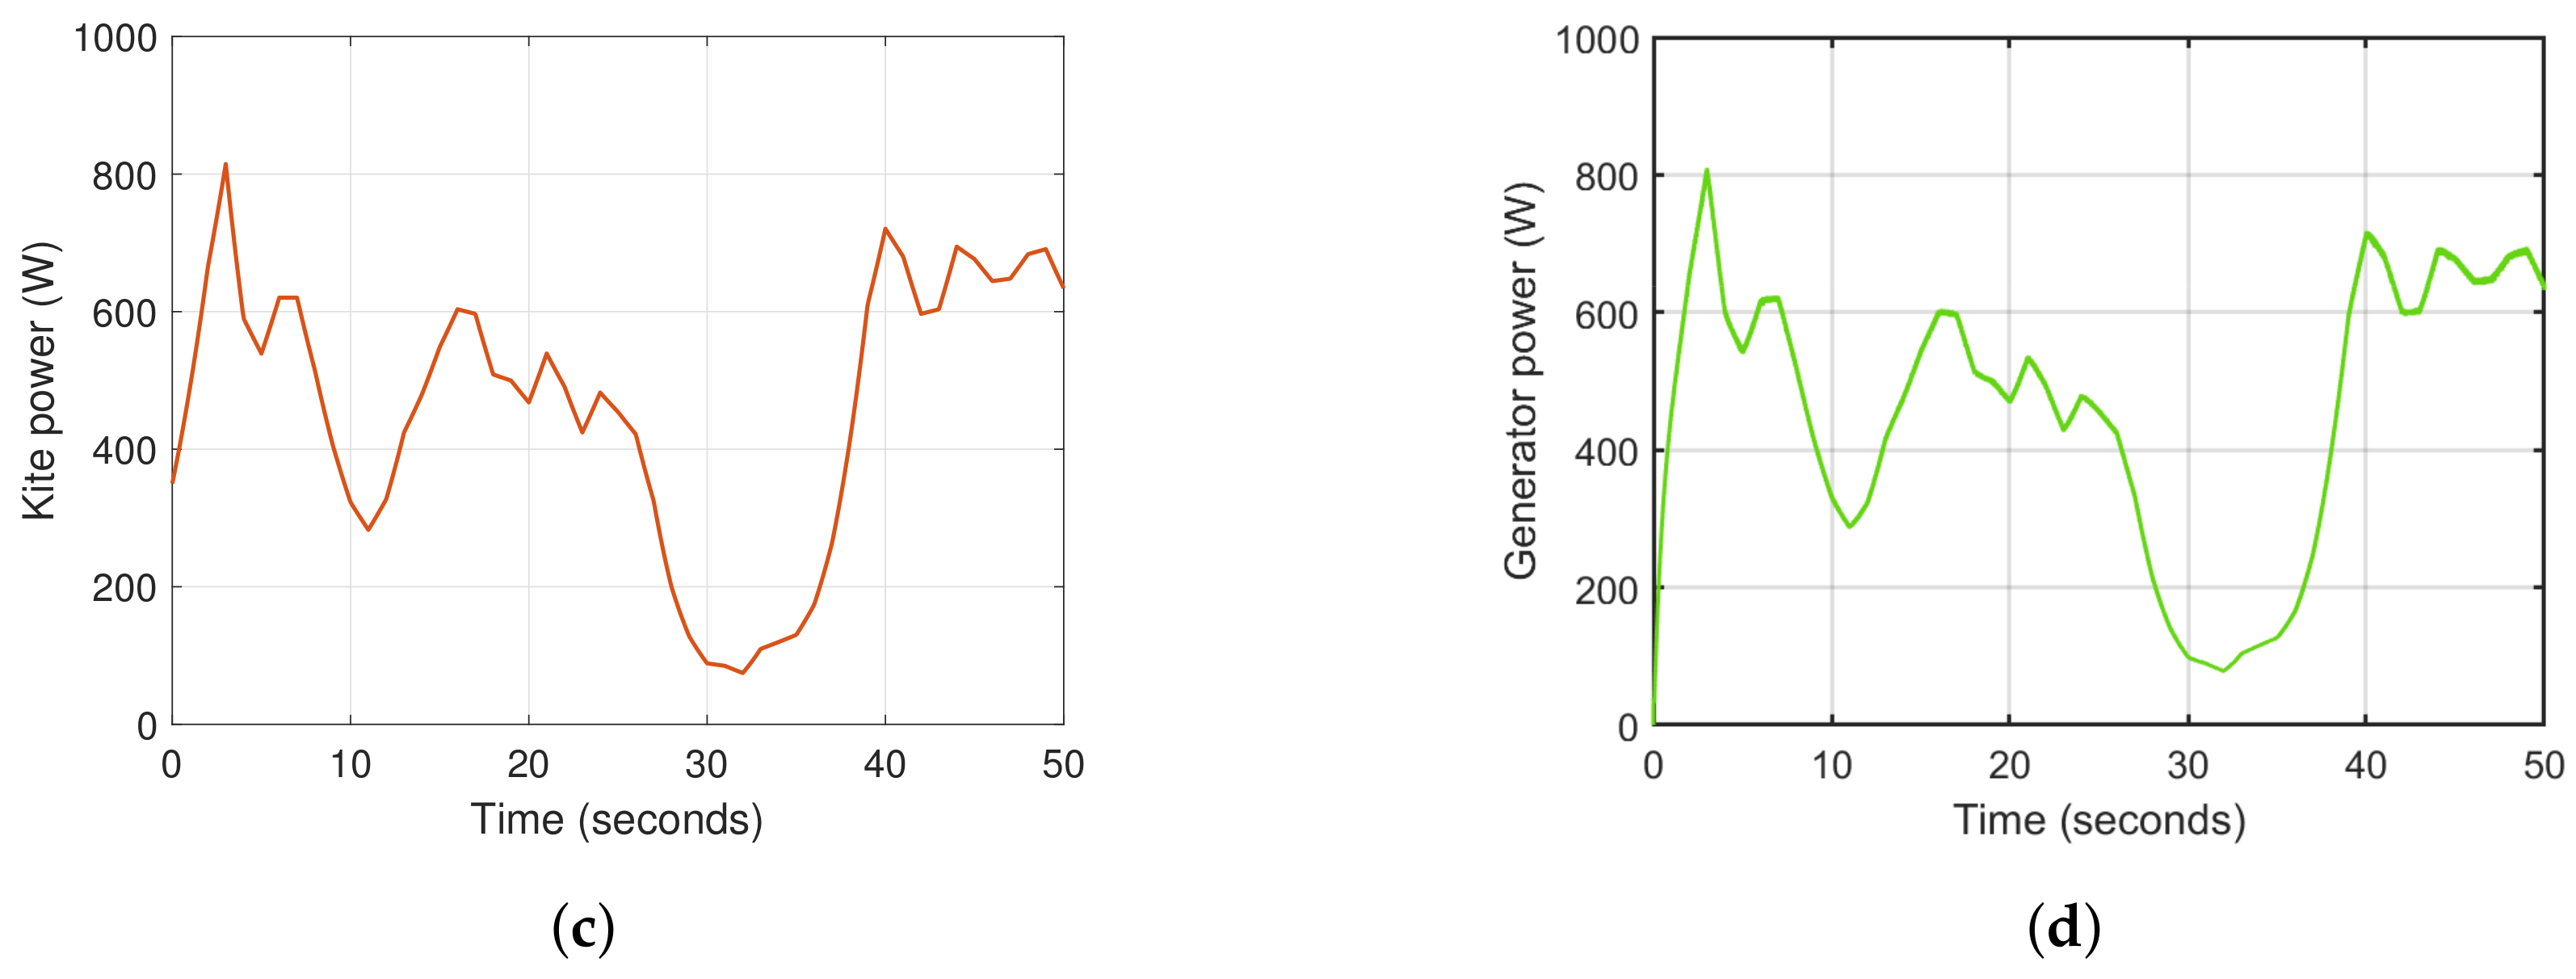
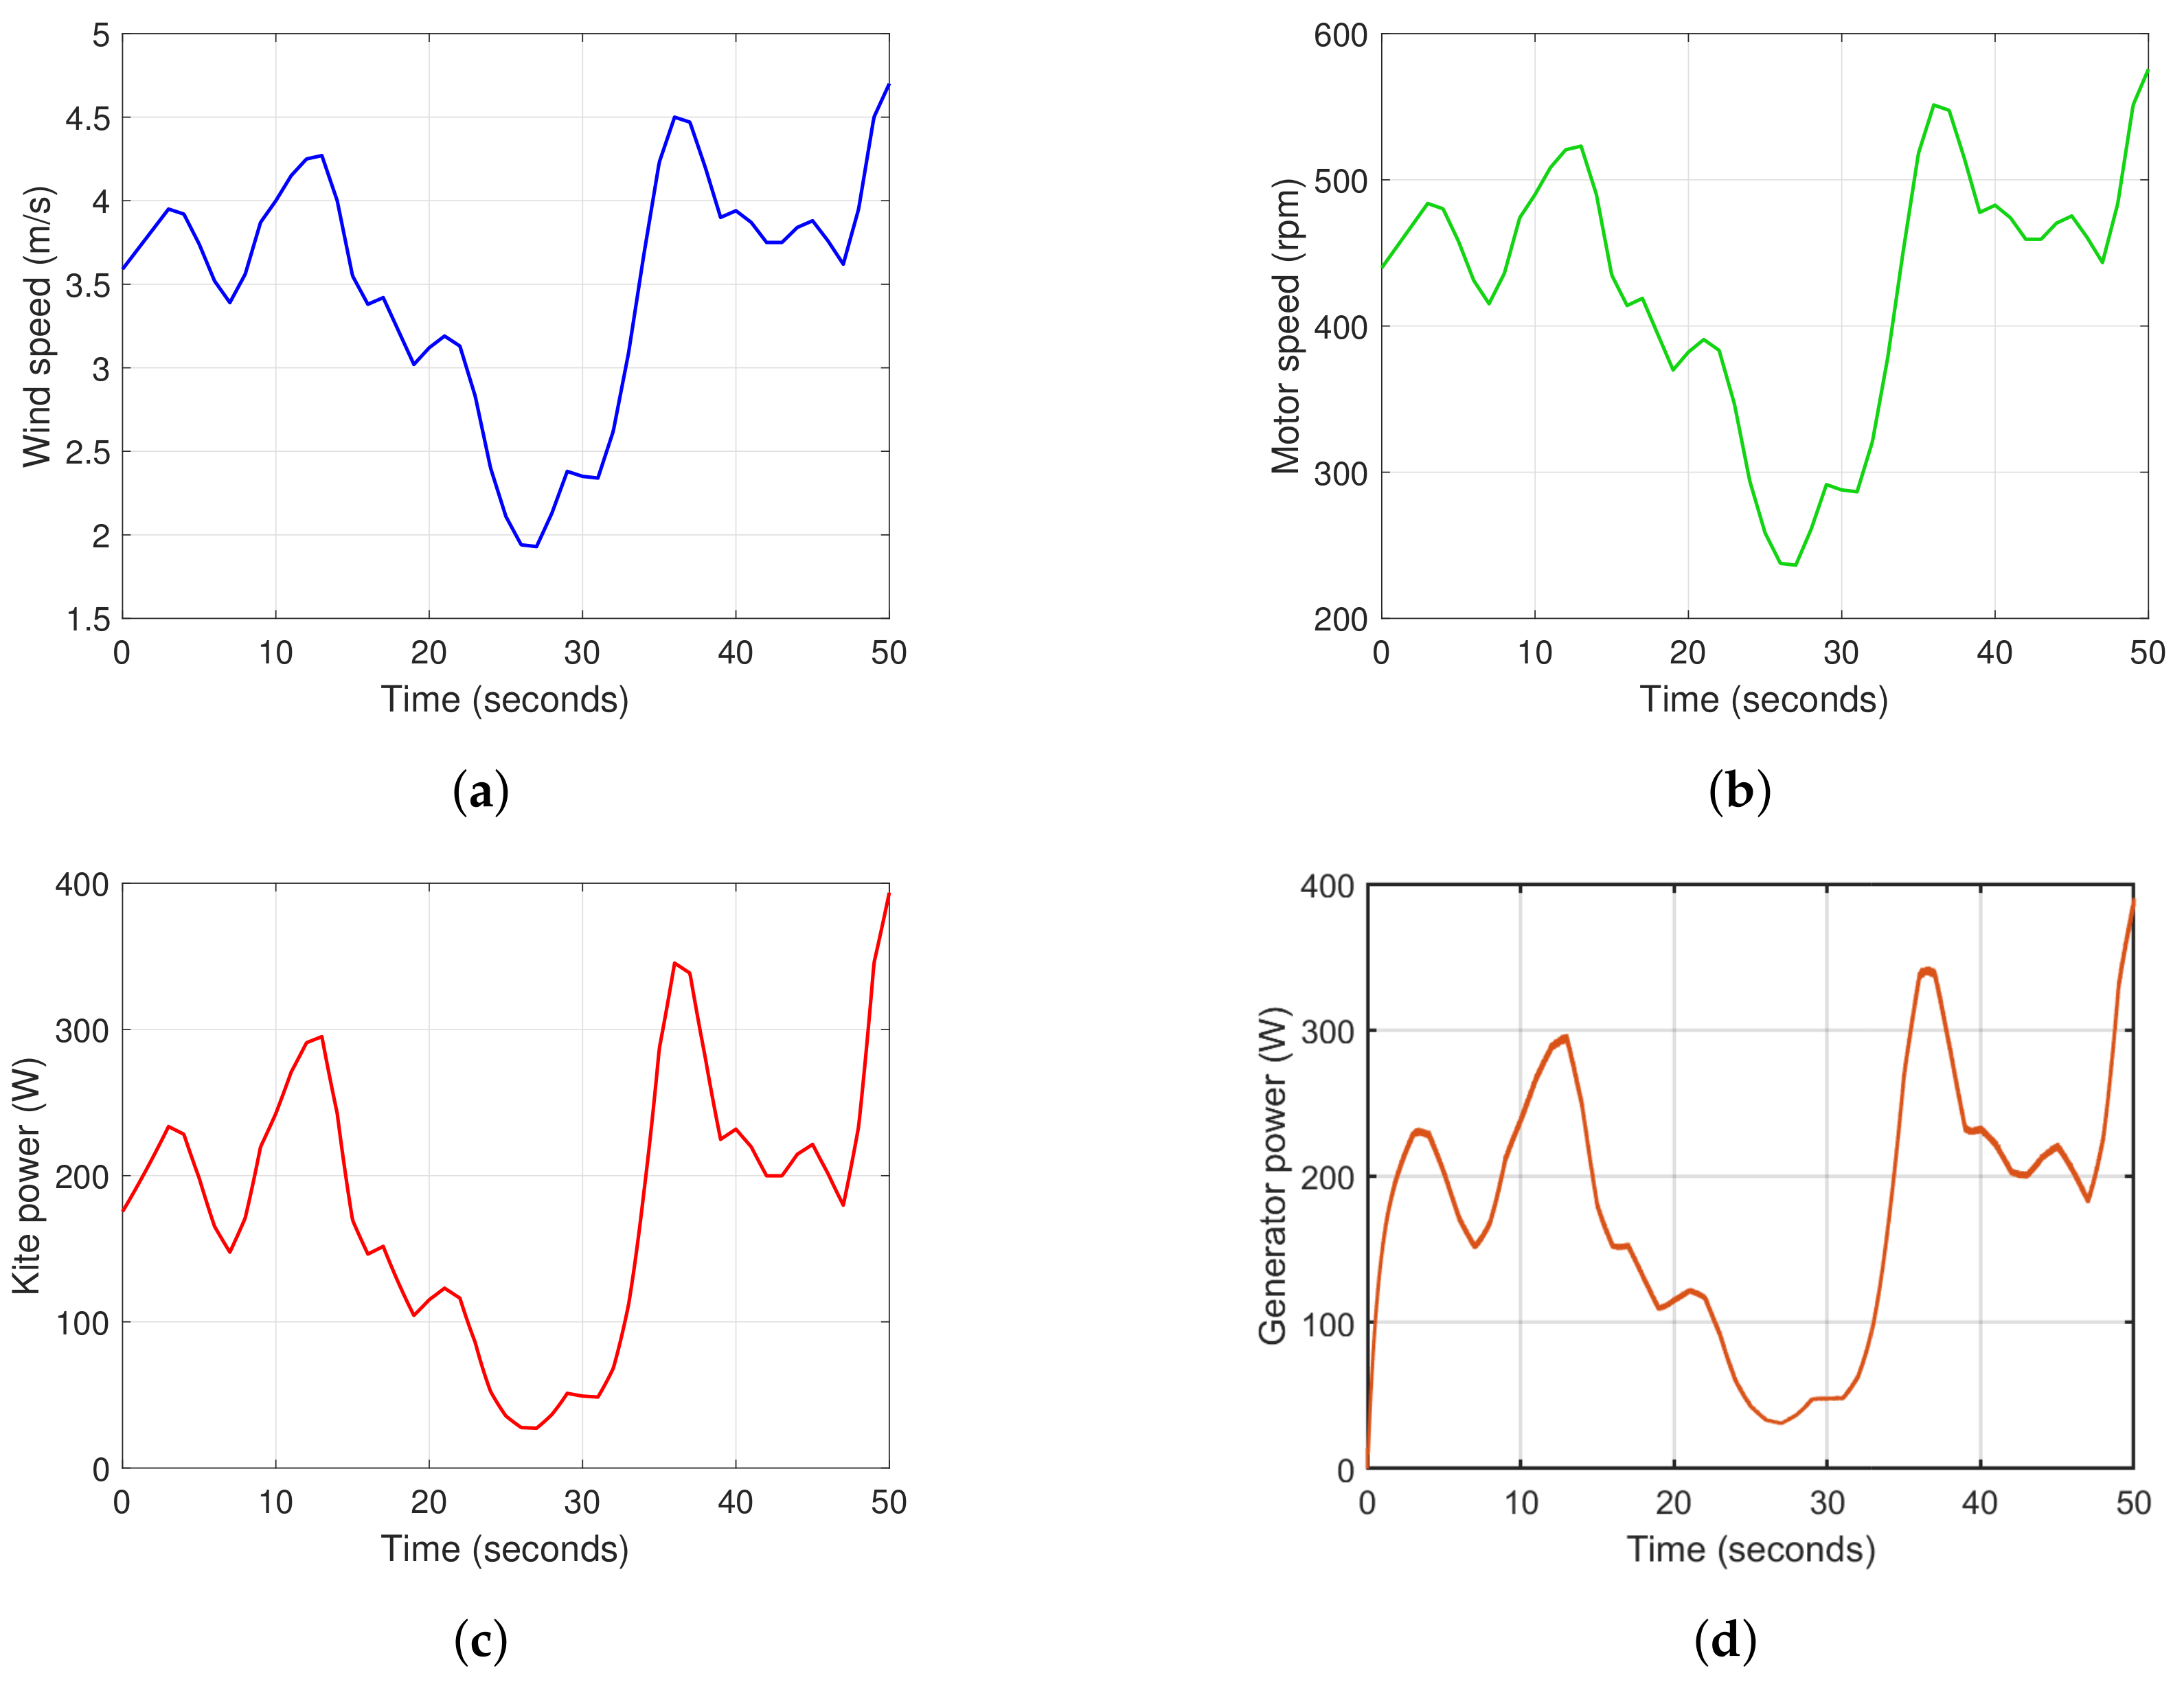
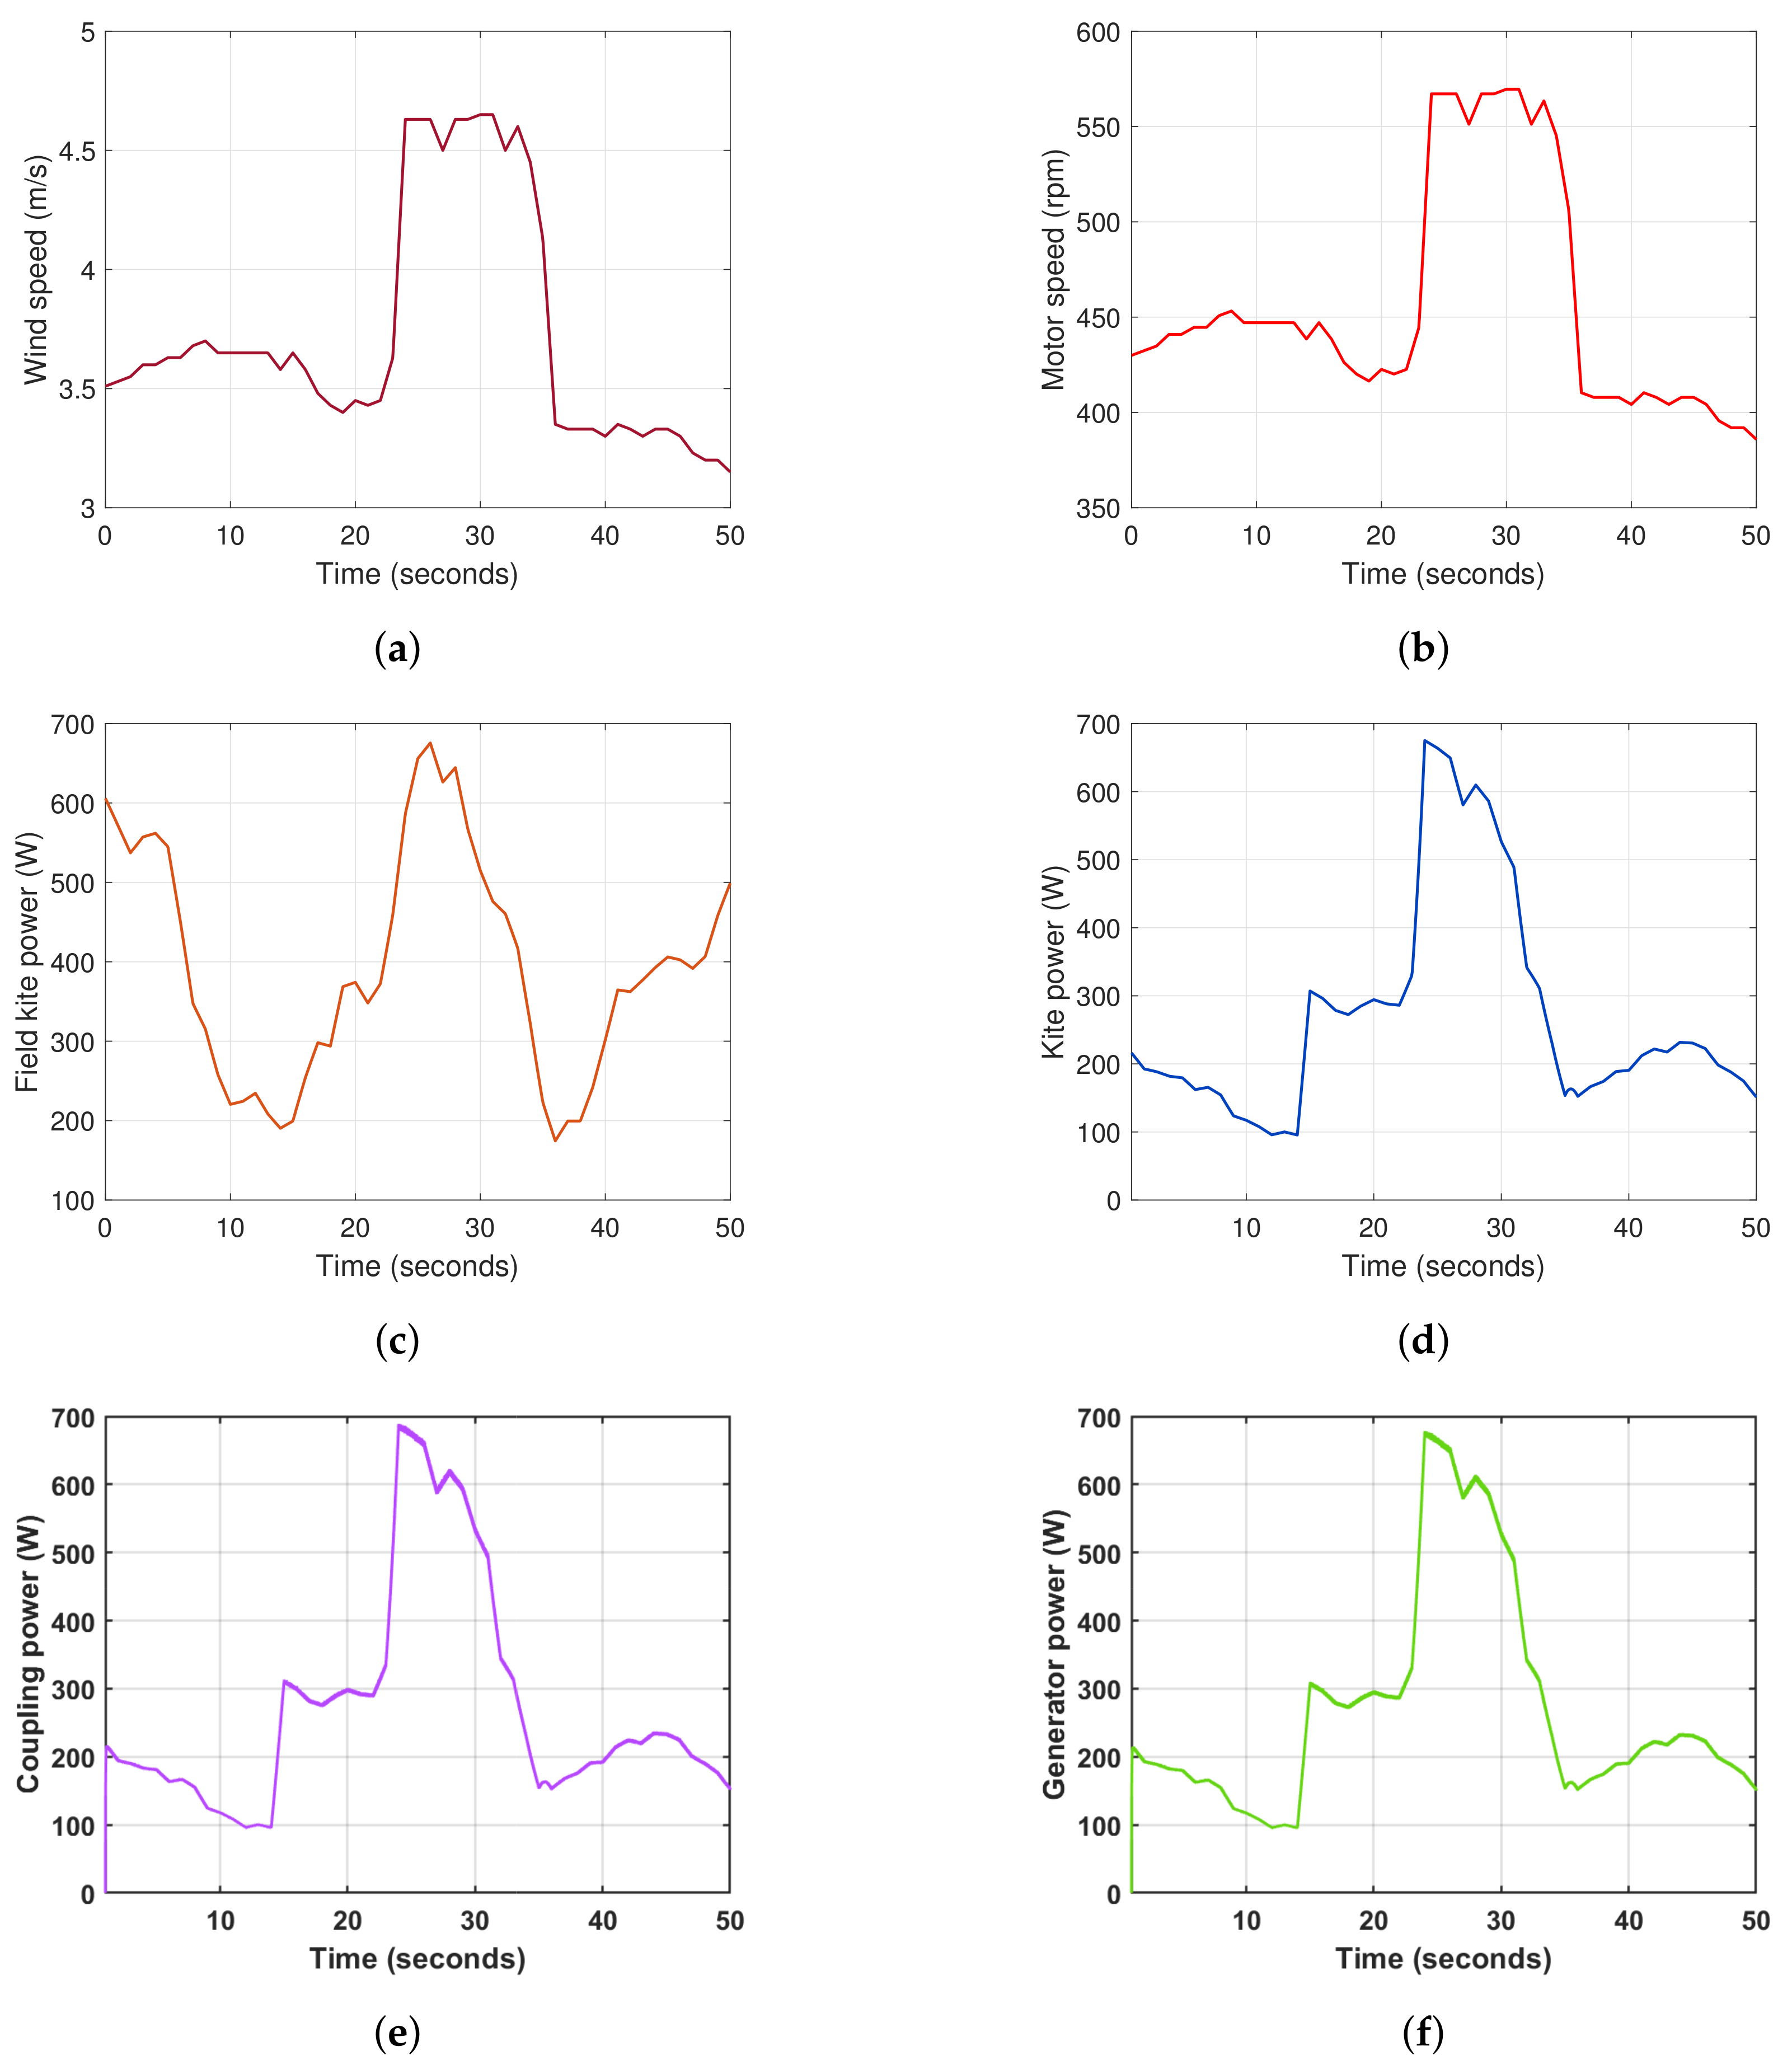
- The hourly satellite wind speed data at 10 m and 50 m above the ground was considered in this study with the figure-of-eight data from the field tests to emulate the power generation from KAWECS. The wind speed data at a 50 m height with a maximum power of 820 W was generated with a kite area of 10 m at a maximum wind speed of 6 m/s. The wind speed data at the height of 10 m with a maximum power of 392 W was generated with a kite area of 10 m at a maximum wind speed of 4.65 m/s;
- The comparative study of the KAWECS and CWT at a 2 MW power range showed that the capacity factor of the KAWECS is 45.59% compared to 31.36% for the CWT, indicating a 45% increased average power production in the KAWECS, which is one of the highest factors in the wind energy industry.
Author Contributions
Funding
Data Availability Statement
Acknowledgments
Conflicts of Interest
References
- Olabi, A.G.; Wilberforce, T.; Elsaid, K.; Sayed, E.T.; Salameh, T.; Abdelkareem, M.A.; Baroutaji, A. A review on failure modes of wind turbine components. Energies 2021, 14, 5241. [Google Scholar] [CrossRef]
- Saleem, A.; Kim, M.H. Aerodynamic analysis of an airborne wind turbine with three different aerofoil-based buoyant shells using steady RANS simulations. Energy Convers. Manag. 2018, 177, 233–248. [Google Scholar] [CrossRef]
- Ghosh, A.; Biswas, A.; Sharma, K.; Gupta, R. Computational analysis of flow physics of a combined three bladed Darrieus Savonius wind rotor. J. Energy Inst. 2015, 88, 425–437. [Google Scholar] [CrossRef]
- Ackermann, T.; Söder, L. Wind energy technology and current status: A review. Renew. Sustain. Energy Rev. 2000, 4, 315–374. [Google Scholar] [CrossRef]
- Kolar, J.W.; Friedli, T.; Krismer, F.; Looser, A.; Schweizer, M.; Friedemann, R.A.; Steimer, P.K.; Bevirt, J.B. Conceptualization and multiobjective optimization of the electric system of an airborne wind turbine. IEEE J. Emerg. Sel. Top. Power Electron. 2013, 1, 73–103. [Google Scholar] [CrossRef]
- Peçanha, L.B.C.; Oliveira, N.d.S.B.; Bretas, W.V. Generation of Wind Energy with Kites: A Review of the Airborne Wind Energy Technology. In Proceedings of the 2020 IEEE PES Transmission & Distribution Conference and Exhibition-Latin America (T&D LA), Montevideo, Uruguay, 28 September–2 October 2020; IEEE: Piscataway, NJ, USA, 2020; pp. 1–6. [Google Scholar]
- Loyd, M. crosswind kite power for large-scale wind power production. Energy 1980, 4, 106–111. [Google Scholar] [CrossRef]
- Cherubini, A.; Papini, A.; Vertechy, R.; Fontana, M. Airborne Wind Energy Systems: A review of the technologies. Renew. Sustain. Energy Rev. 2015, 51, 1461–1476. [Google Scholar] [CrossRef] [Green Version]
- Zillmann, U.; Bechtle, P. Emergence and economic dimension of airborne wind energy. In Airborne Wind Energy: Advances in Technology Development and Research; Springer: Berlin/Heidelberg, Germany, 2018; pp. 1–25. [Google Scholar]
- Fagiano, L.; Nguyen-Van, E.; Rager, F.; Schnez, S.; Ohler, C. Autonomous takeoff and flight of a tethered aircraft for airborne wind energy. IEEE Trans. Control Syst. Technol. 2017, 26, 151–166. [Google Scholar] [CrossRef] [Green Version]
- De Lellis, M.; Mendonça, A.; Saraiva, R.; Trofino, A.; Lezana, A. Electric power generation in wind farms with pumping kites: An economical analysis. Renew. Energy 2016, 86, 163–172. [Google Scholar] [CrossRef]
- Salari, M.E.; Coleman, J.; Toal, D. Airborne Wind Energy—A Review. In Proceedings of the 3rd International Congress on Energy Efficiency and Energy Related Materials (ENEFM2015), Oludeniz, Turkey, 19–23 October 2015; Springer: Berlin/Heidelberg, Germany, 2015; p. 81. [Google Scholar]
- Bechtle, P.; Schelbergen, M.; Schmehl, R.; Zillmann, U.; Watson, S. Airborne wind energy resource analysis. Renew. Energy 2019, 141, 1103–1116. [Google Scholar] [CrossRef]
- Masters, G.M. Renewable and Efficient Electric Power Systems; John Wiley and Sons: Hoboken, NJ, USA, 2013. [Google Scholar]
- Costello, S.; Franois, G.; Bonvin, D. Crosswind kite control–a benchmark problem for advanced control and dynamic optimization. Eur. J. Control 2017, 35, 1–10. [Google Scholar] [CrossRef] [Green Version]
- Costello, S.; François, G.; Bonvin, D. Real-time optimizing control of an experimental crosswind power kite. IEEE Trans. Control Syst. Technol. 2017, 26, 507–522. [Google Scholar] [CrossRef] [Green Version]
- Ahmed, M.S.; Hably, A.; Bacha, S. Kite generator system modeling and grid integration. IEEE Trans. Sustain. Energy 2013, 4, 968–976. [Google Scholar] [CrossRef] [Green Version]
- Erhard, M.; Strauch, H. Flight control of tethered kites in autonomous pumping cycles for airborne wind energy. Control Eng. Pract. 2015, 40, 13–26. [Google Scholar] [CrossRef] [Green Version]
- Todeschini, D.; Fagiano, L.; Micheli, C.; Cattano, A. Control of a rigid wing pumping airborne wind energy system in all operational phases. Control Eng. Pract. 2021, 111, 104794. [Google Scholar] [CrossRef]
- Ali, Q.S.; Kim, M.H. Power conversion performance of airborne wind turbine under unsteady loads. Renew. Sustain. Energy Rev. 2022, 153, 111798. [Google Scholar] [CrossRef]
- Salari, M.E.; Coleman, J.; O’Donnell, C.; Toal, D. Experimental rig investigation of a direct interconnection technique for airborne wind energy systems. Int. J. Electr. Power Energy Syst. 2020, 123, 106300. [Google Scholar] [CrossRef]
- Licitra, G.; Koenemann, J.; Bürger, A.; Williams, P.; Ruiterkamp, R.; Diehl, M. Performance assessment of a rigid wing Airborne Wind Energy pumping system. Energy 2019, 173, 569–585. [Google Scholar] [CrossRef]
- Coleman, J.; Ahmad, H.; Pican, E.; Toal, D. Non-reversing generators in a novel design for pumping mode airbornewind energy farm. In Airborne Wind Energy; Springer: Berlin/Heidelberg, Germany, 2013; pp. 587–597. [Google Scholar]
- Ahmed, M.; Hably, A.; Bacha, S.; Ovalle, A. Kite generator system: Grid integration and validation. In Proceedings of the IECON 2014-40th Annual Conference of the IEEE Industrial Electronics Society, Dallas, TX, USA, 29 October–1 November 2014; IEEE: Piscataway, NJ, USA, 2014; pp. 2139–2145. [Google Scholar]
- Martinez, F.; Herrero, L.C.; de Pablo, S. Open loop wind turbine emulator. Renew. Energy 2014, 63, 212–221. [Google Scholar] [CrossRef]
- Singla, M.K.; Gupta, J.; Nijhawan, P.; Ganguli, S.; Rajest, S.S. Development of an Efficient, Cheap, and Flexible IoT-Based Wind Turbine Emulator. In Business Intelligence for Enterprise Internet of Things; Springer International Publishing: Berlin/Heidelberg, Germany, 2020; pp. 225–231. [Google Scholar]
- Battaiotto, P.; Mantz, R.; Puleston, P. A wind turbine emulator based on a dual DSP processor system. Control Eng. Pract. 1996, 4, 1261–1266. [Google Scholar] [CrossRef]
- Bagaber, B.; Junge, P.; Mertens, A. Lifetime Estimation and Dimensioning of the Machine-Side Converter for Pumping-Cycle Airborne Wind Energy System. In Proceedings of the 2020 22nd European Conference on Power Electronics and Applications (EPE’20 ECCE Europe), Lyon, France, 7–11 September 2020; IEEE: Piscataway, NJ, USA, 2020; p. 1. [Google Scholar]
- Saberi, S.; Rezaie, B. Robust adaptive direct speed control of PMSG-based airborne wind energy system using FCS-MPC method. ISA Trans. 2022, 131, 43–60. [Google Scholar] [CrossRef] [PubMed]
- von den Hoff, D.; Haberschusz, D.; Rotering, N.; De Doncker, R. Design and Evaluation of a Battery-Supported Electric Drivetrain for Kite-Based High-Altitude Wind Energy Conversion. In Proceedings of the 2019 Conference for Wind Power Drives (CWD), Aachen, Germany, 12–13 March 2019; IEEE: Piscataway, NJ, USA, 2019; pp. 1–10. [Google Scholar]
- Bauer, F.; Hackl, C.M.; Smedley, K.; Kennel, R.M. “Virtual”-power-hardware-in-the-loop simulations for crosswind kite power with ground generation. In Proceedings of the 2016 American Control Conference (ACC), Boston, MA, USA, 6–8 July 2016; IEEE: Piscataway, NJ, USA, 2016; pp. 4071–4076. [Google Scholar]
- Bagaber, B.; Mertens, A. A Parallel Voltage Source Converter and Diode Rectifier PMSM Drive Concept for Decoupling the Thermal Cycles in the Machine-Side Converter of an Airborne Wind Energy Generator. In Proceedings of the 2021 23rd European Conference on Power Electronics and Applications (EPE’21 ECCE Europe), Virtually, 6–10 September 2021; IEEE: Piscataway, NJ, USA, 2021; p. 1. [Google Scholar]
- Bagaber, B.; Heide, D.; Ponick, B.; Mertens, A. Efficiency and Lifetime Analysis of Several Airborne Wind Energy Electrical Drive Concepts. In Proceedings of the 2022 24th European Conference on Power Electronics and Applications (EPE’22 ECCE Europe), Hanover, Germany, 5–9 September 2022; IEEE: Piscataway, NJ, USA, 2022; pp. 1–11. [Google Scholar]
- van der Vlugt, R.; Bley, A.; Noom, M.; Schmehl, R. Quasi-steady model of a pumping kite power system. Renew. Energy 2019, 131, 83–99. [Google Scholar] [CrossRef]
- Schmehl, R.; Noom, M.; van der Vlugt, R. Traction power generation with tethered wings. In Airborne Wind Energy; Springer: Berlin/Heidelberg, Germany, 2013; pp. 23–45. [Google Scholar]
- Noom, M. Theoretical Analysis of Mechanical Power Generation by Pumping Cycle Kite Power Systems. Master’s Thesis, TU Delft, Delft, The Netherlands, 2013. [Google Scholar]
- Fechner, U.; Schmehl, R. Feed-forward control of kite power systems. J. Phys. Conf. Ser. 2014, 524, 012081. [Google Scholar] [CrossRef]
- Ba, X.; Gong, Z.; Guo, Y.; Zhang, C.; Zhu, J. Development of equivalent circuit models of permanent magnet synchronous motors considering core loss. Energies 2022, 15, 1995. [Google Scholar] [CrossRef]
- Suman, K.; Mathew, A.T. Speed control of permanent magnet synchronous motor drive system using PI, PID, SMC and SMC plus PID controller. In Proceedings of the 2018 International Conference on Advances in Computing, Communications and Informatics (ICACCI), Bangalore, India, 19–22 September 2018; IEEE: Piscataway, NJ, USA, 2018; pp. 543–549. [Google Scholar]
- Kim, K.H.; Van, T.L.; Lee, D.C.; Song, S.H.; Kim, E.H. Maximum output power tracking control in variable-speed wind turbine systems considering rotor inertial power. IEEE Trans. Ind. Electron. 2012, 60, 3207–3217. [Google Scholar] [CrossRef]
- Yan, J.; Lin, H.; Feng, Y.; Guo, X.; Huang, Y.; Zhu, Z. Improved sliding mode model reference adaptive system speed observer for fuzzy control of direct-drive permanent magnet synchronous generator wind power generation system. IET Renew. Power Gener. 2013, 7, 28–35. [Google Scholar] [CrossRef]
- Castelino, R.V.; Kashyap, Y.; Kosmopoulos, P. Airborne Kite Tether Force Estimation and Experimental Validation Using Analytical and Machine Learning Models for Coastal Regions. Remote Sens. 2022, 14, 6111. [Google Scholar] [CrossRef]
- Bansal, R.; Bhatti, T.; Kothari, D. On some of the design aspects of wind energy conversion systems. Energy Convers. Manag. 2002, 43, 2175–2187. [Google Scholar] [CrossRef]
- Spooner, E.; Williamson, A. Direct coupled, permanent magnet generators for wind turbine applications. IEE Proc.-Electr. Power Appl. 1996, 143, 1–8. [Google Scholar] [CrossRef]
- Pereira, A.F.; Sousa, J.M. A Review on Crosswind Airborne Wind Energy Systems: Key Factors for a Design Choice. Energies 2022, 16, 351. [Google Scholar] [CrossRef]
- Reuchlin, S.; Joshi, R.; Schmehl, R. Sizing of Hybrid Power Systems for Off-Grid Applications Using Airborne Wind Energy. Energies 2023, 16, 4036. [Google Scholar] [CrossRef]
- Mittal, R.; Sandhu, K.; Jain, D. Battery energy storage system for variable speed driven PMSG for wind energy conversion system. In Proceedings of the 2010 Joint International Conference on Power Electronics, Drives and Energy Systems & 2010 Power India, New Delhi, India, 20–23 December 2010; IEEE: Piscataway, NJ, USA, 2010; pp. 1–5. [Google Scholar]
- Ilyushin, Y.V.; Afanaseva, O.V. Development of scada-model for trunk gas pipeline’s compressor station. J. Min. Inst. 2019, 240, 686–693. [Google Scholar] [CrossRef] [Green Version]
- Afanaseva, O.; Ilyushin, Y. Analysis and synthesis of distributed icedrill heating control system of mountain reconnaissance drilling rig. Int. Multidiscip. Sci. Geoconf. SGEM 2018, 18, 41–47. [Google Scholar]


| Parameter | 1 kW | 10 kW | 100 kW |
|---|---|---|---|
| Kite Area | 2.5 m | 14 m | 60 m |
| Aerodynamic Coefficient, | 1.125 | 2.875 | 3.825 |
| Wind Speed | 2–12.25 m/s | 2–12.25 m/s | 2–12.25 m/s |
| Air Density | 1.225 kg/m | 1.225 kg/m | 1.225 kg/m |
| Rated Voltage of Machines | 415 V | 415 V | 415 V |
| Rated Speed of Machines | 1500 rpm | 1500 rpm | 1500 rpm |
| Pole Pairs of Machines | 4 | 4 | 4 |
| Rated Current of Machines | 1.5 A | 14 A | 135 A |
| Maximum Torque of Machines | 6 Nm | 65 Nm | 630 Nm |
| Parameters | KAWECS | CWT |
|---|---|---|
| Nominal Power () | 2 MW | 2 MW |
| Specifications | Wing span = 36.8 m Projected Area = 270.9 m Tether diameter = 3 cm Reel-out length = 230 m Max tension = 56.09 ton | Hub height = 78 m Blade length = 43 m Area swept = 5808.0 m TSR = 6.7 = 0.43 |
| Rated Wind Speed at | 7.3 m/s | 9.8 m/s |
| Max Power | = 1322 kW = 2 MW = 678 kW | = 2 MW |
| Average Power () | 911 kW | 627 kW |
| Capacity Factor () | 45.59% | 31.36% |
| Data Point | Yaw (Degrees) | Pitch (Degrees) | Roll (Degrees) | Altitude (m) | Tether Force (N) | Wind Speed (m/s) | Wind Direction (Degrees) |
|---|---|---|---|---|---|---|---|
| 1 | 50.68 | −131.76 | 48.03 | 1.90 | 481 | 3.58 | 17 |
| 2 | 48.37 | −135.88 | 52.03 | 2.40 | 485 | 3.53 | 14 |
| 3 | 45.94 | −143.90 | 54.68 | 4.90 | 453 | 3.55 | 9 |
| 4 | 47.20 | −147.42 | 54.78 | 5.90 | 464 | 3.60 | 8 |
| 5 | 48.21 | −149.27 | 46.20 | 7.10 | 467 | 3.60 | 11 |
| 6 | 52.36 | −151.14 | 35.22 | 8.10 | 450 | 3.63 | 13 |
| 7 | 54.88 | −155.88 | 29.09 | 10.20 | 372 | 3.63 | 6 |
| 8 | 56.07 | −156.77 | 25.46 | 10.60 | 283 | 3.68 | 6 |
| 9 | 54.80 | −160.40 | 25.39 | 12.20 | 255 | 3.70 | 15 |
| 10 | 53.56 | −166.97 | 27.68 | 13.80 | 211 | 3.65 | 12 |
Disclaimer/Publisher’s Note: The statements, opinions and data contained in all publications are solely those of the individual author(s) and contributor(s) and not of MDPI and/or the editor(s). MDPI and/or the editor(s) disclaim responsibility for any injury to people or property resulting from any ideas, methods, instructions or products referred to in the content. |
© 2023 by the authors. Licensee MDPI, Basel, Switzerland. This article is an open access article distributed under the terms and conditions of the Creative Commons Attribution (CC BY) license (https://creativecommons.org/licenses/by/4.0/).
Share and Cite
Castelino, R.V.; Kumar, P.; Kashyap, Y.; Karthikeyan, A.; Sharma K., M.; Karmakar, D.; Kosmopoulos, P. Exploring the Potential of Kite-Based Wind Power Generation: An Emulation-Based Approach. Energies 2023, 16, 5213. https://doi.org/10.3390/en16135213
Castelino RV, Kumar P, Kashyap Y, Karthikeyan A, Sharma K. M, Karmakar D, Kosmopoulos P. Exploring the Potential of Kite-Based Wind Power Generation: An Emulation-Based Approach. Energies. 2023; 16(13):5213. https://doi.org/10.3390/en16135213
Chicago/Turabian StyleCastelino, Roystan Vijay, Pankaj Kumar, Yashwant Kashyap, Anabalagan Karthikeyan, Manjunatha Sharma K., Debabrata Karmakar, and Panagiotis Kosmopoulos. 2023. "Exploring the Potential of Kite-Based Wind Power Generation: An Emulation-Based Approach" Energies 16, no. 13: 5213. https://doi.org/10.3390/en16135213
APA StyleCastelino, R. V., Kumar, P., Kashyap, Y., Karthikeyan, A., Sharma K., M., Karmakar, D., & Kosmopoulos, P. (2023). Exploring the Potential of Kite-Based Wind Power Generation: An Emulation-Based Approach. Energies, 16(13), 5213. https://doi.org/10.3390/en16135213