
Intelligent Micro-Cogeneration Systems for Residential Grids: A Sustainable Solution for Efficient Energy Management


Abstract
:
1. Introduction
2. Literature Review
2.1. Micro-Cogeneration Systems with Internal Combustion Engines
2.2. Micro-Cogeneration Systems with Fuel Cells
2.3. Challenges in Integrating Micro-Cogeneration into Residential Grids
2.4. Machine Learning and Control Strategies for Energy Management
3. Data Collection and Analysis
3.1. Residential Grid Data Sources
3.2. Data Analysis and Machine Learning
4. Mathematical Model
4.1. PV Model
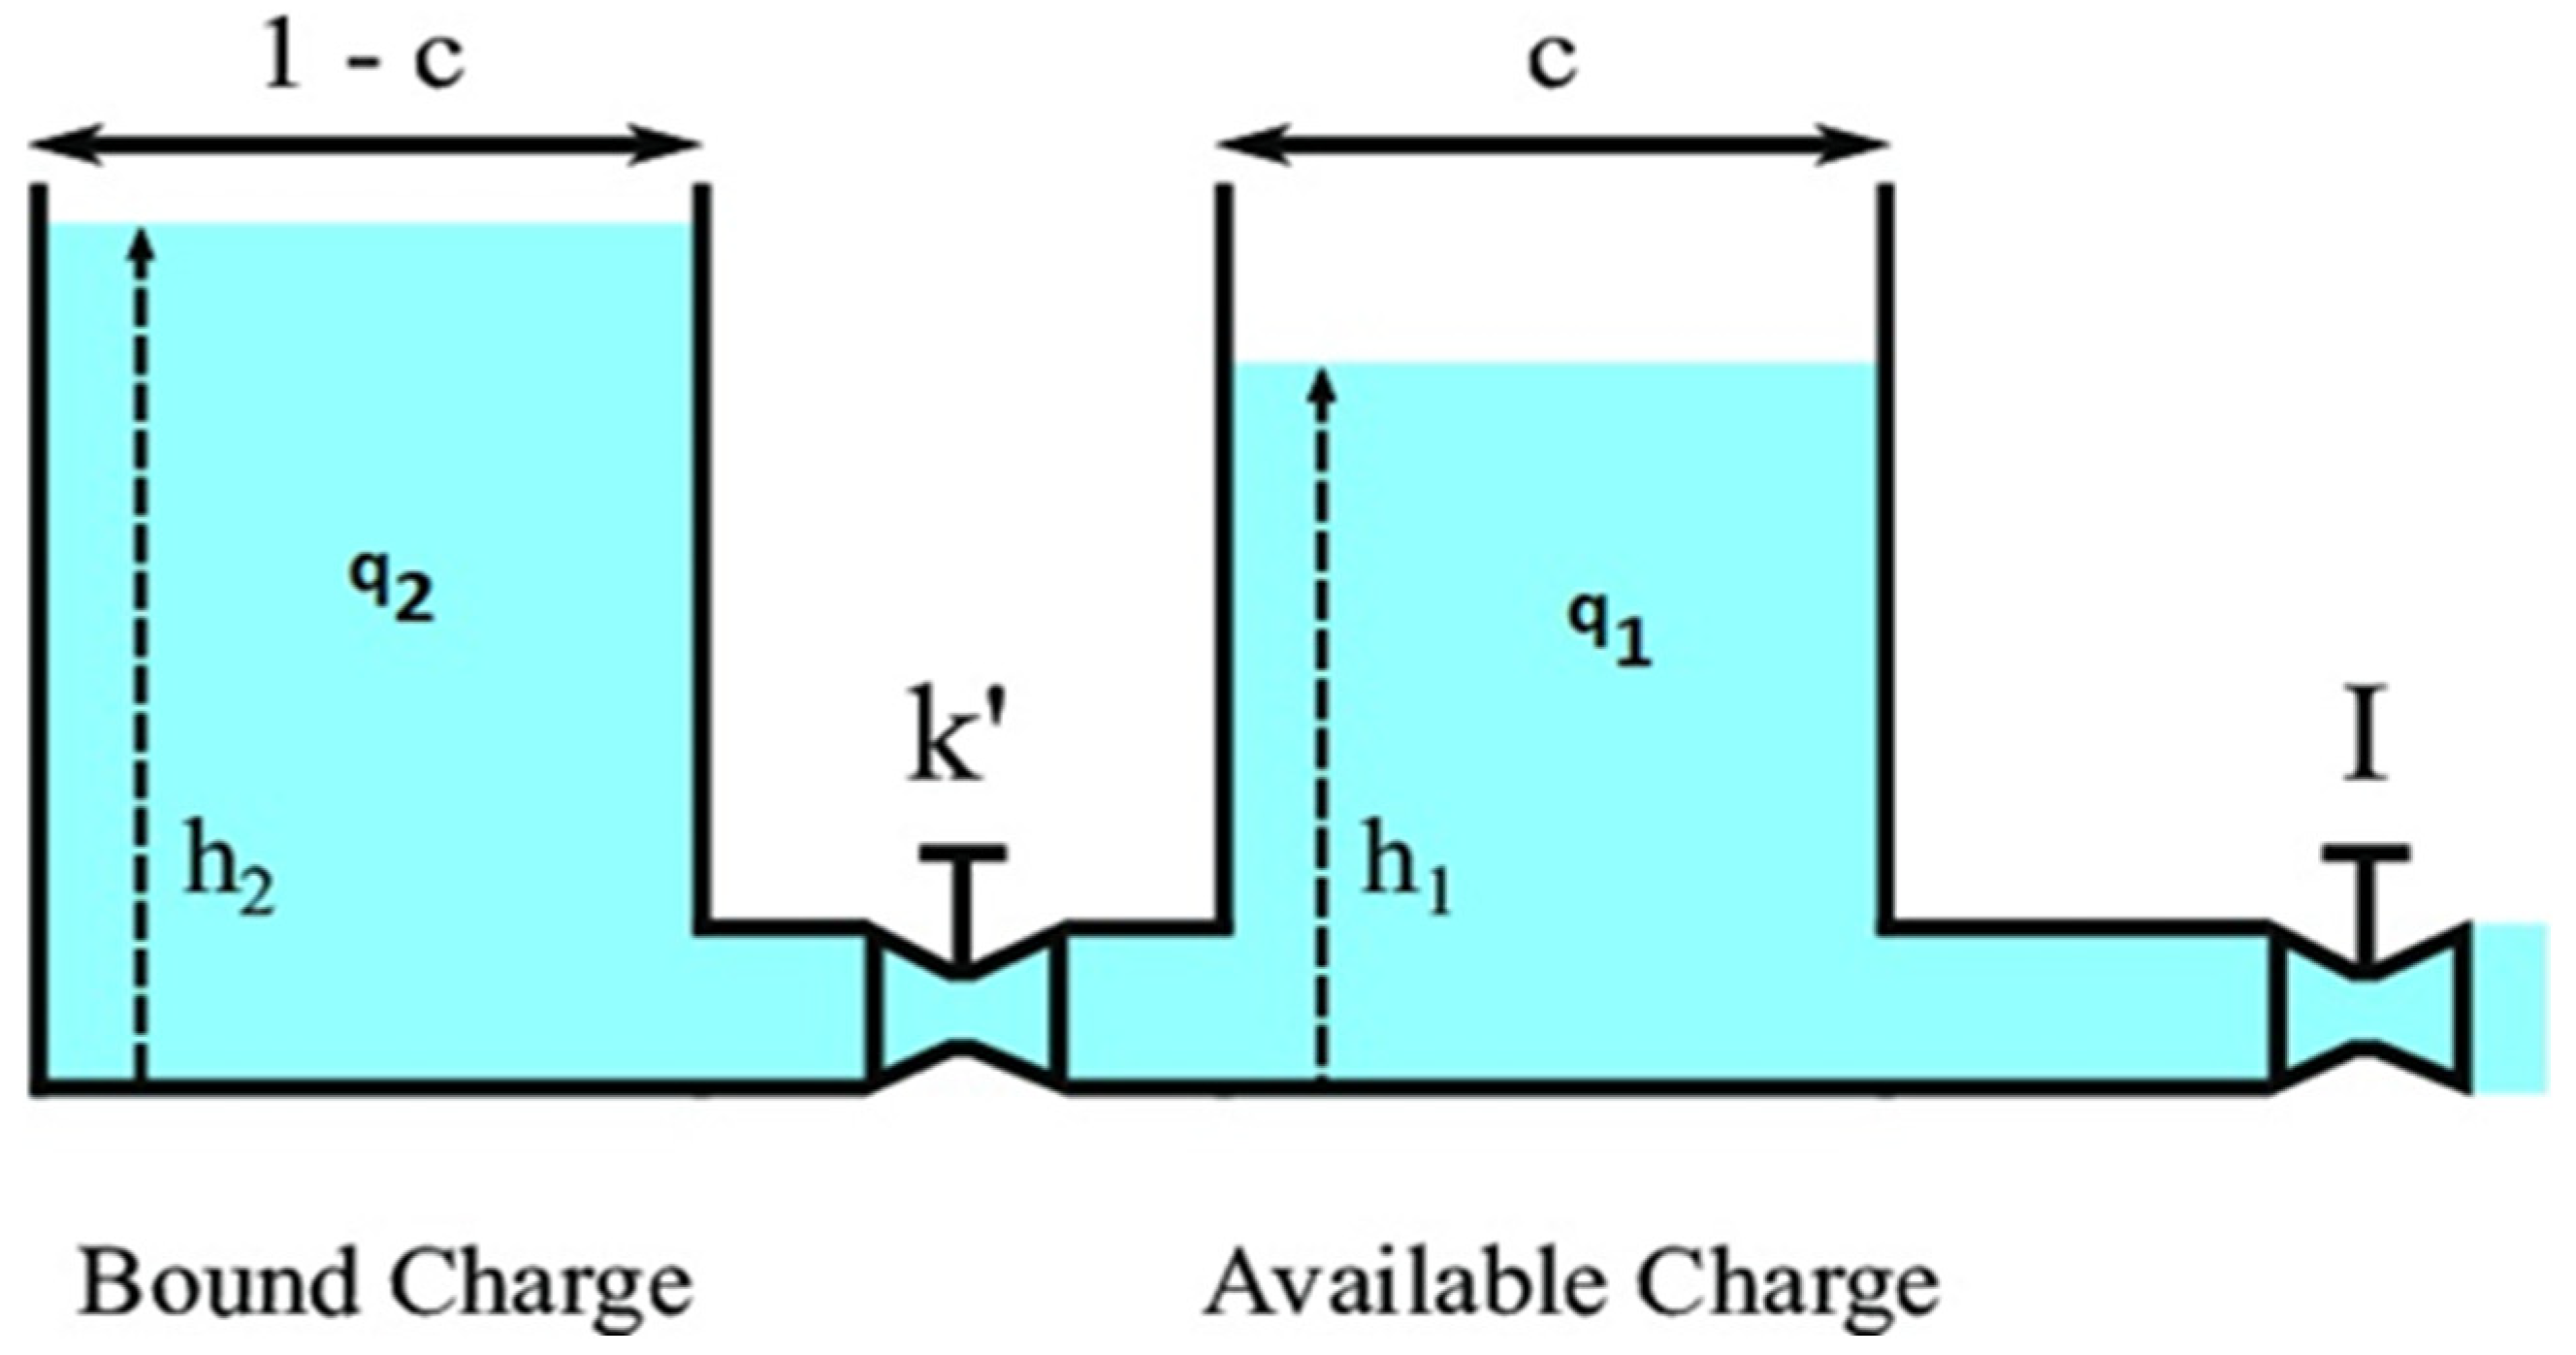
4.2. Battery Model
4.3. Micro-CHP Model
5. Machine Learning-Based Demand Prediction Model
5.1. Model Selection and Rationale
5.2. Model Training and Validation
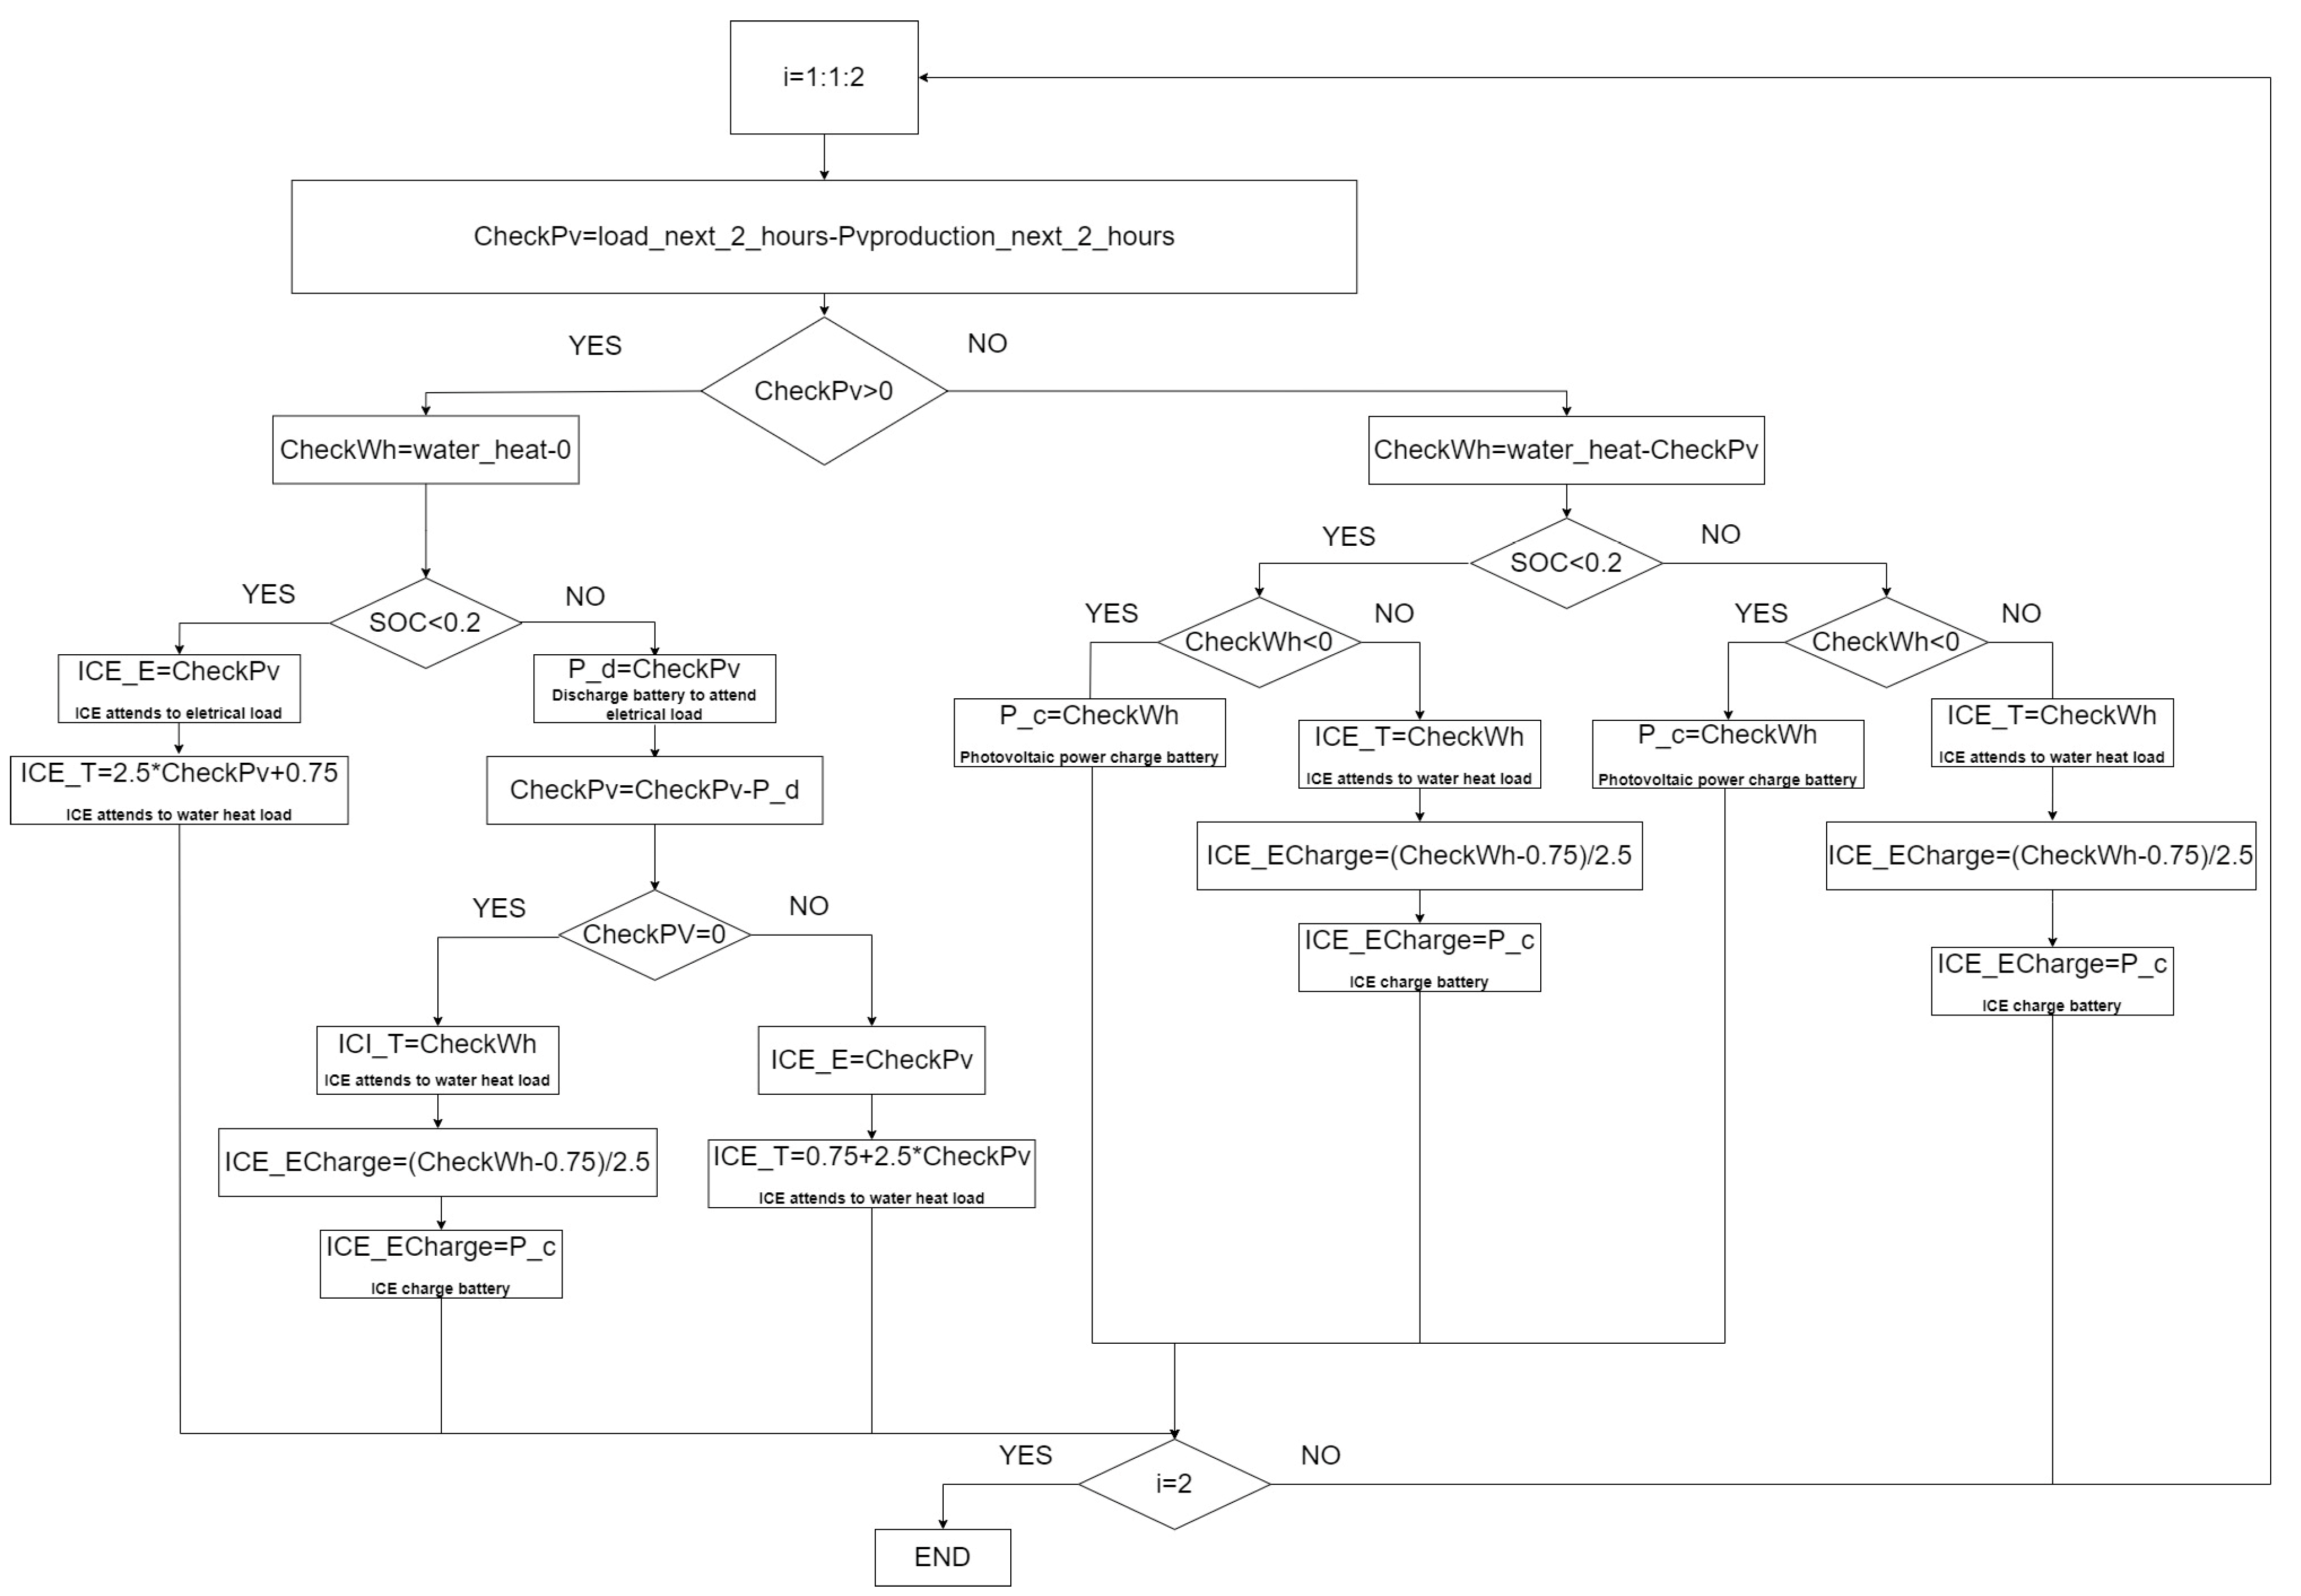
6. Control Strategy for Flexible Operation
Designing the Control Strategy
7. Simulation and Validation
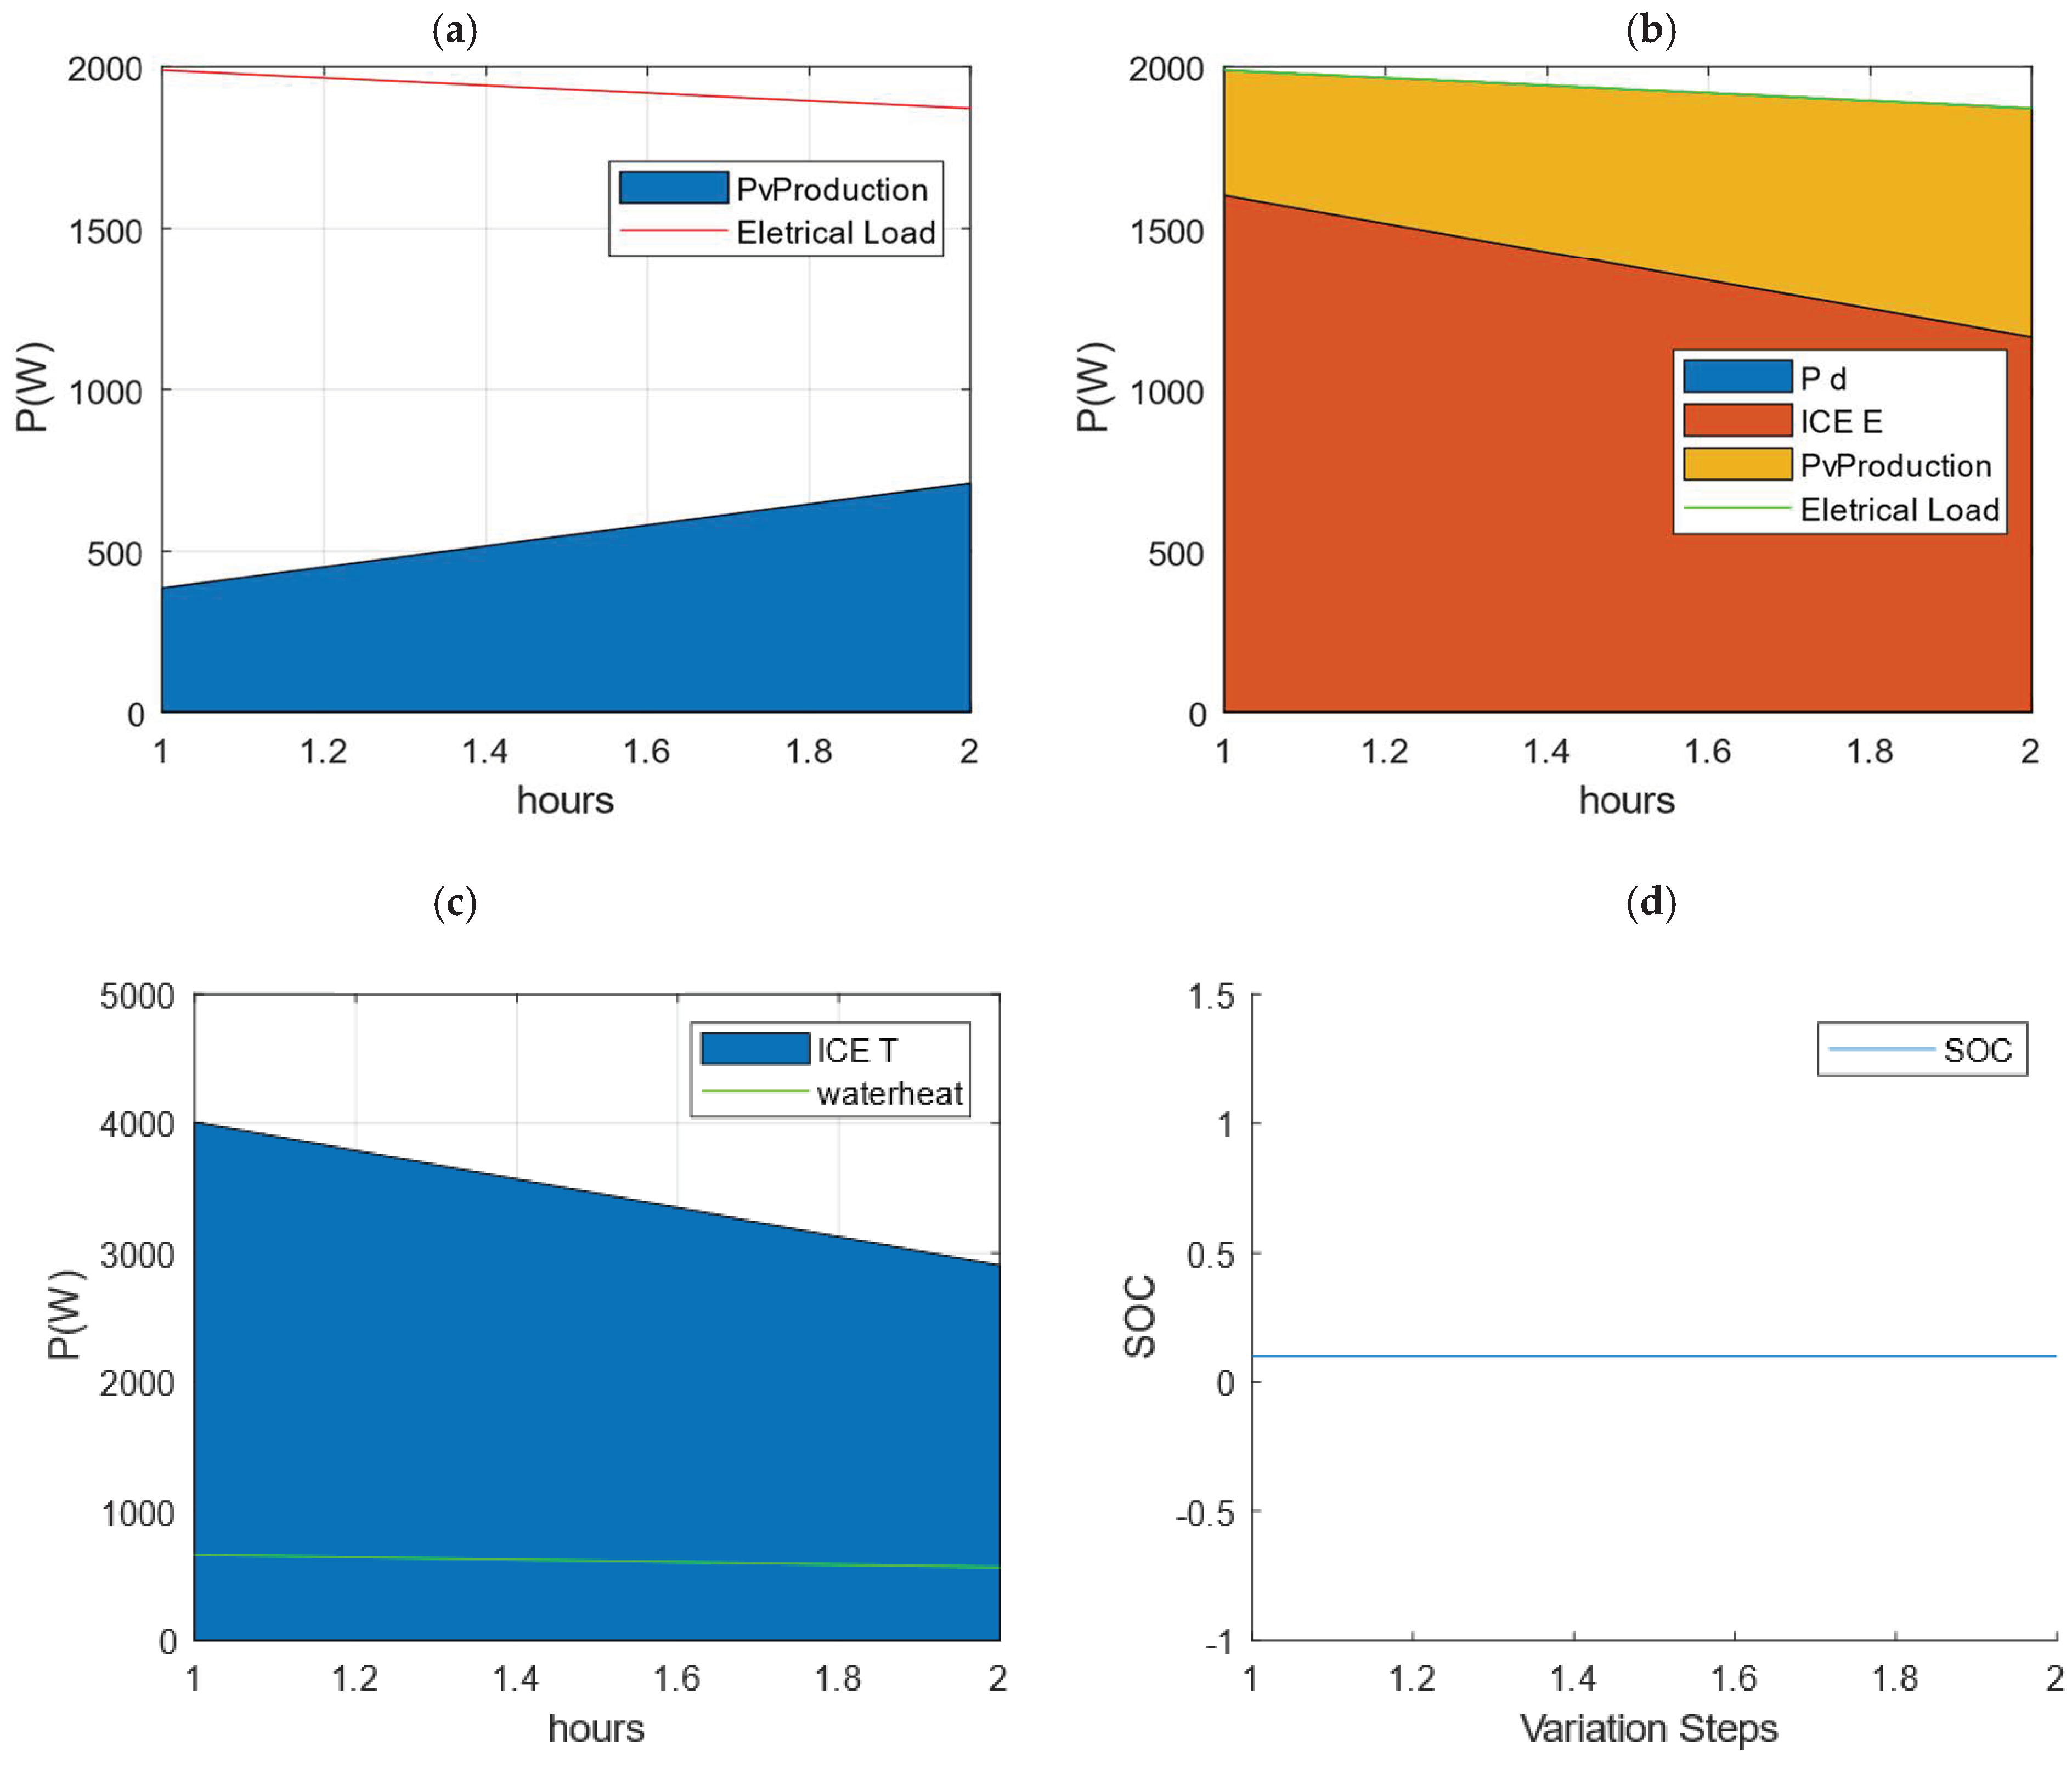
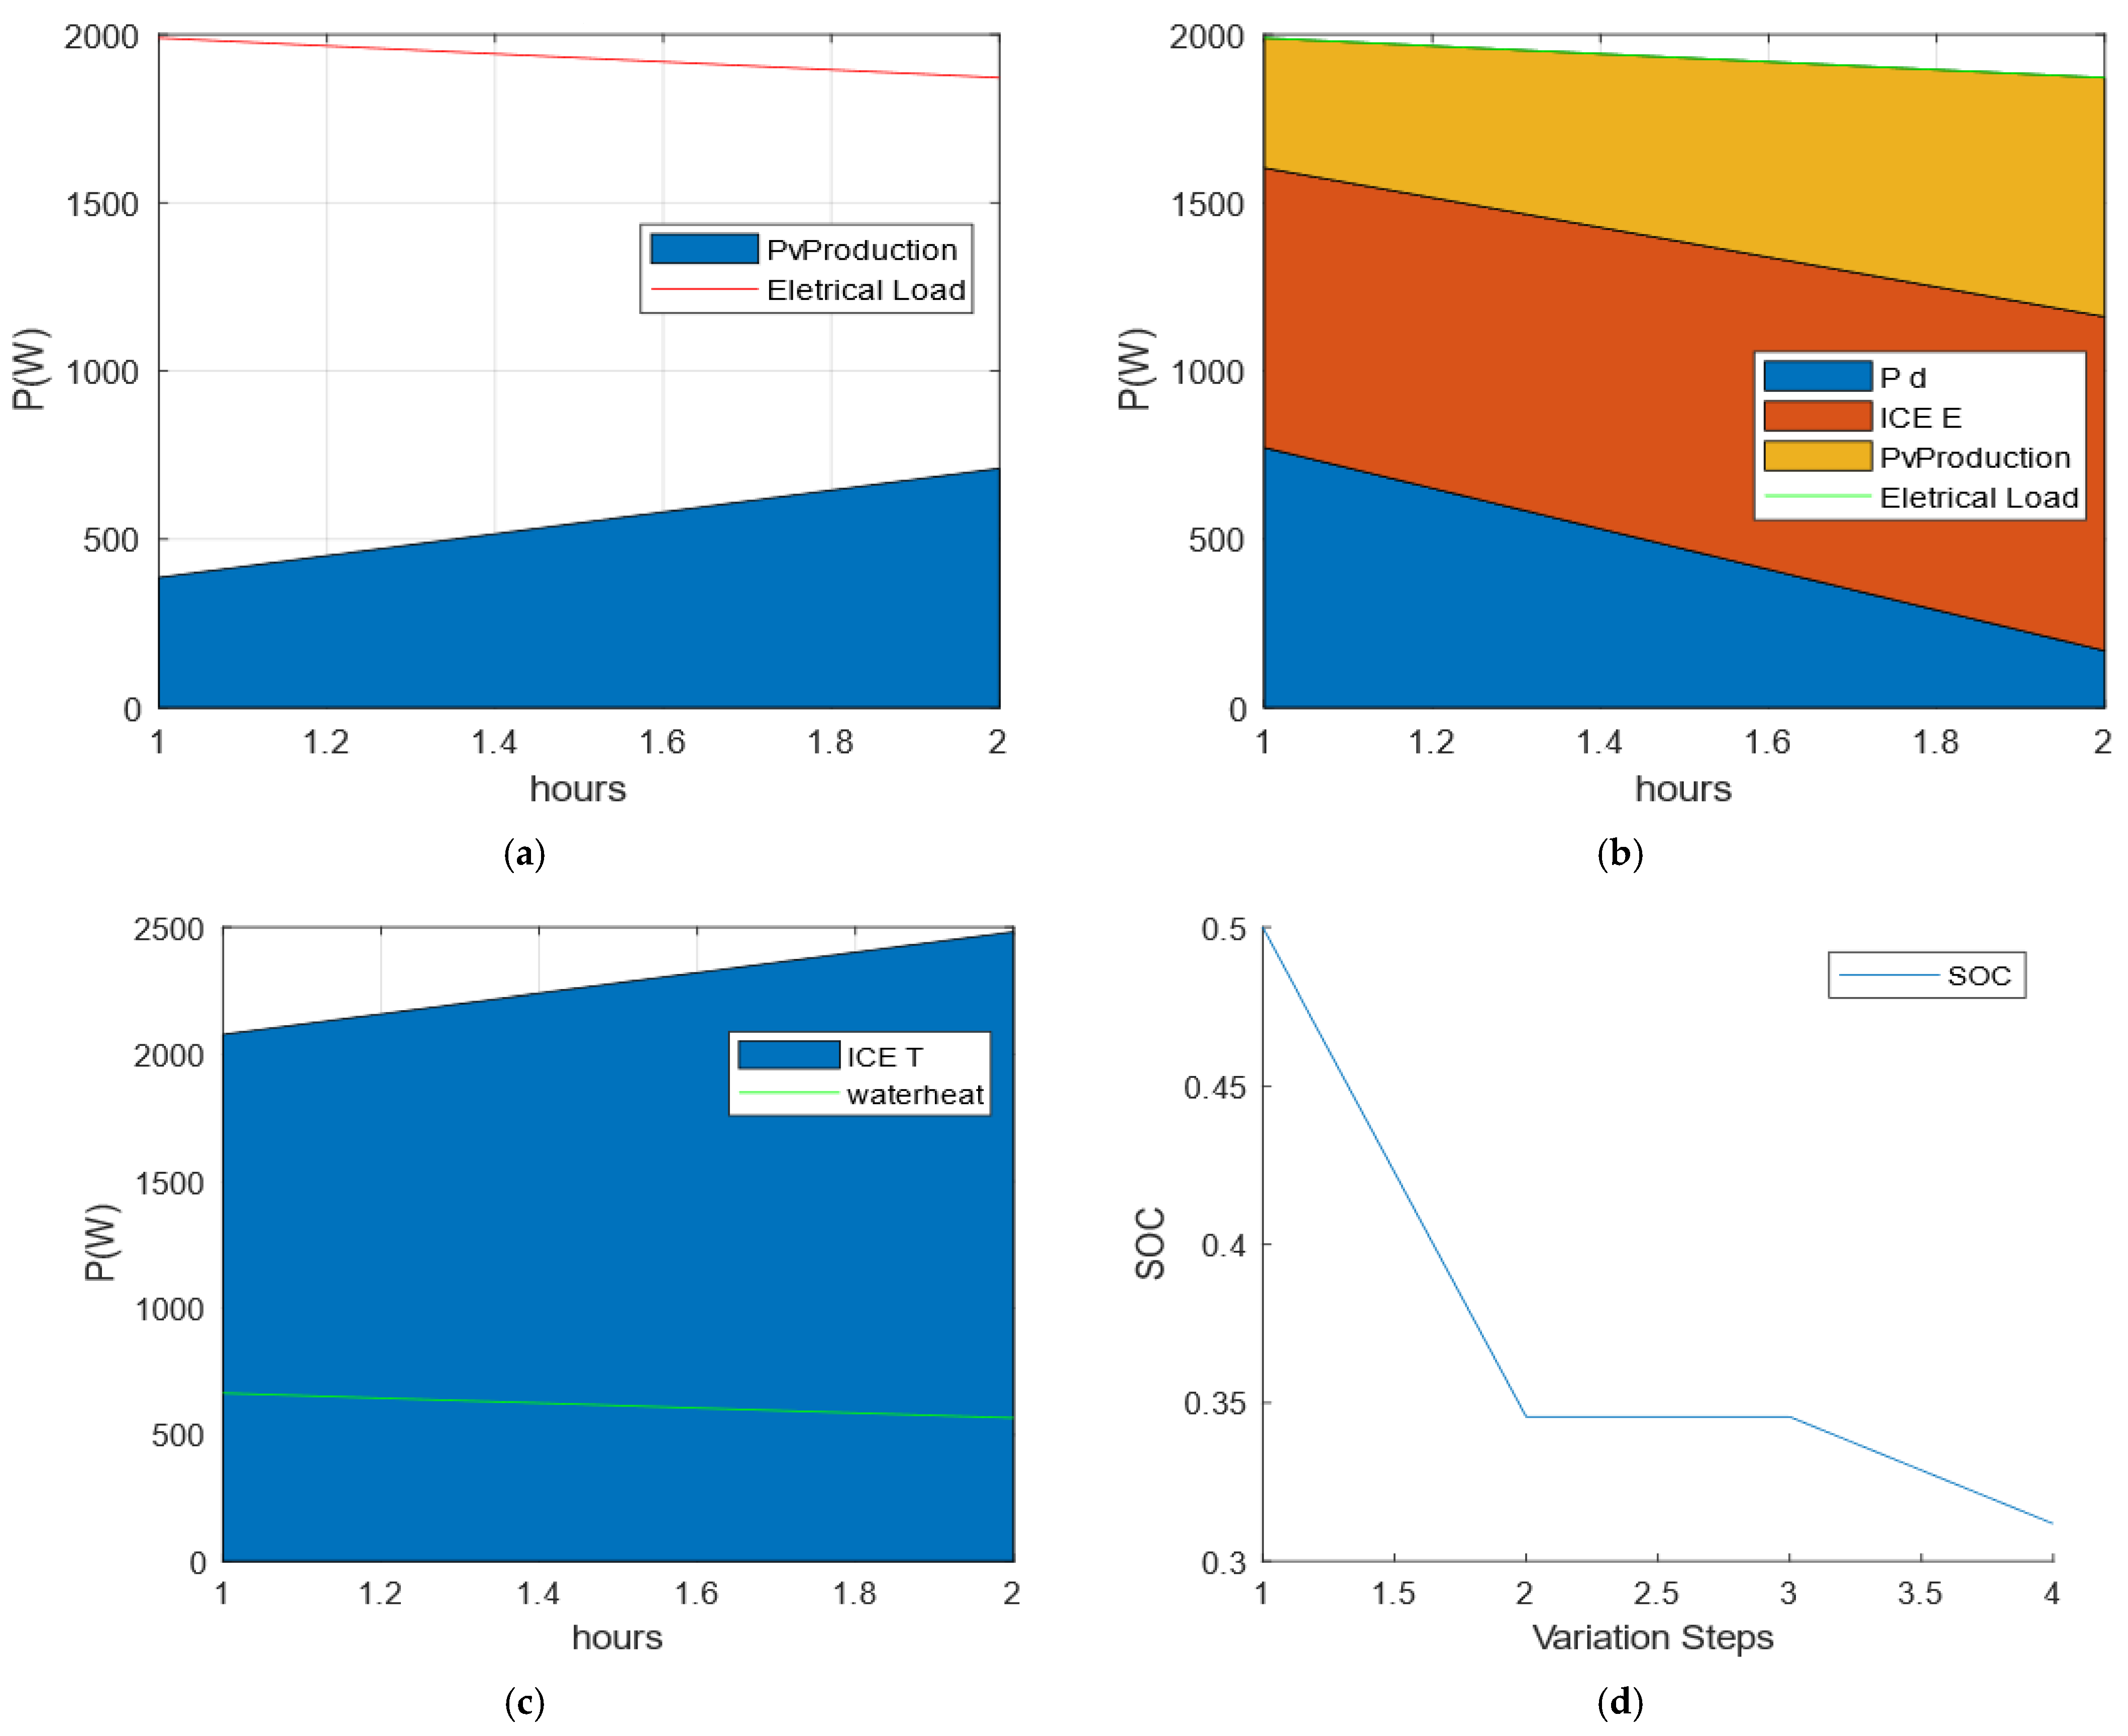
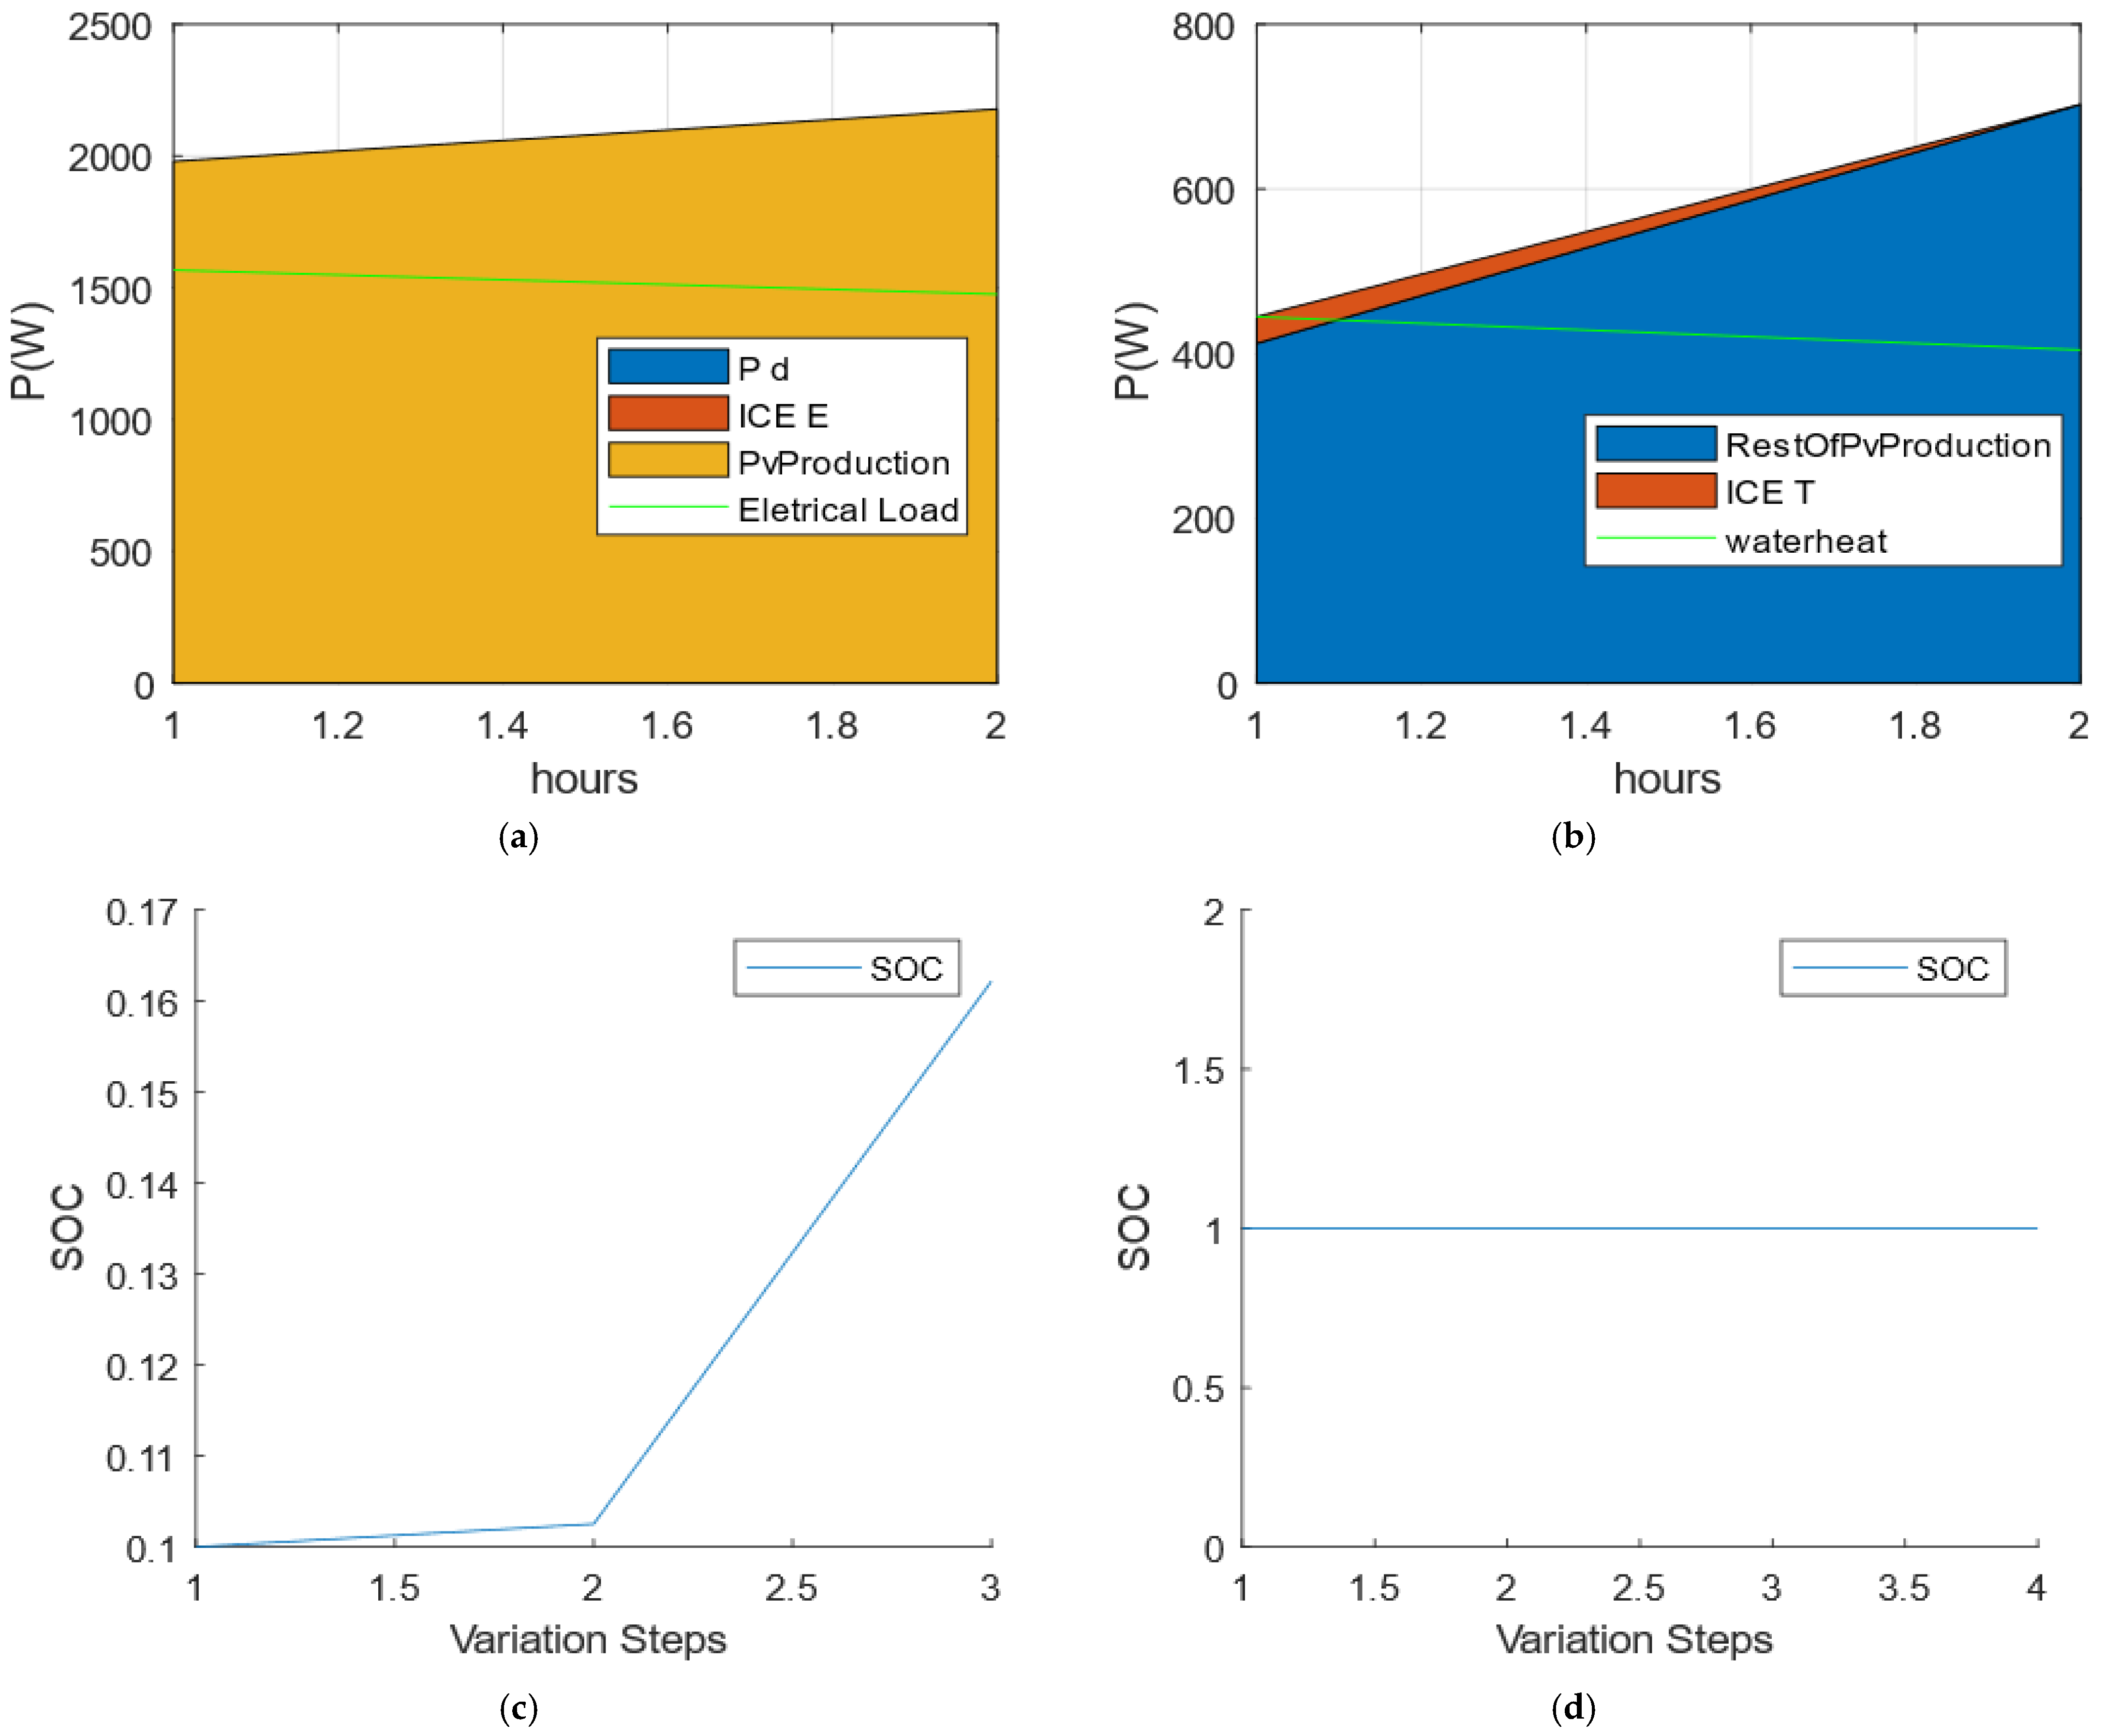
7.1. Simulation Setup and Scenarios (PV/Battery/Micro-CHP)
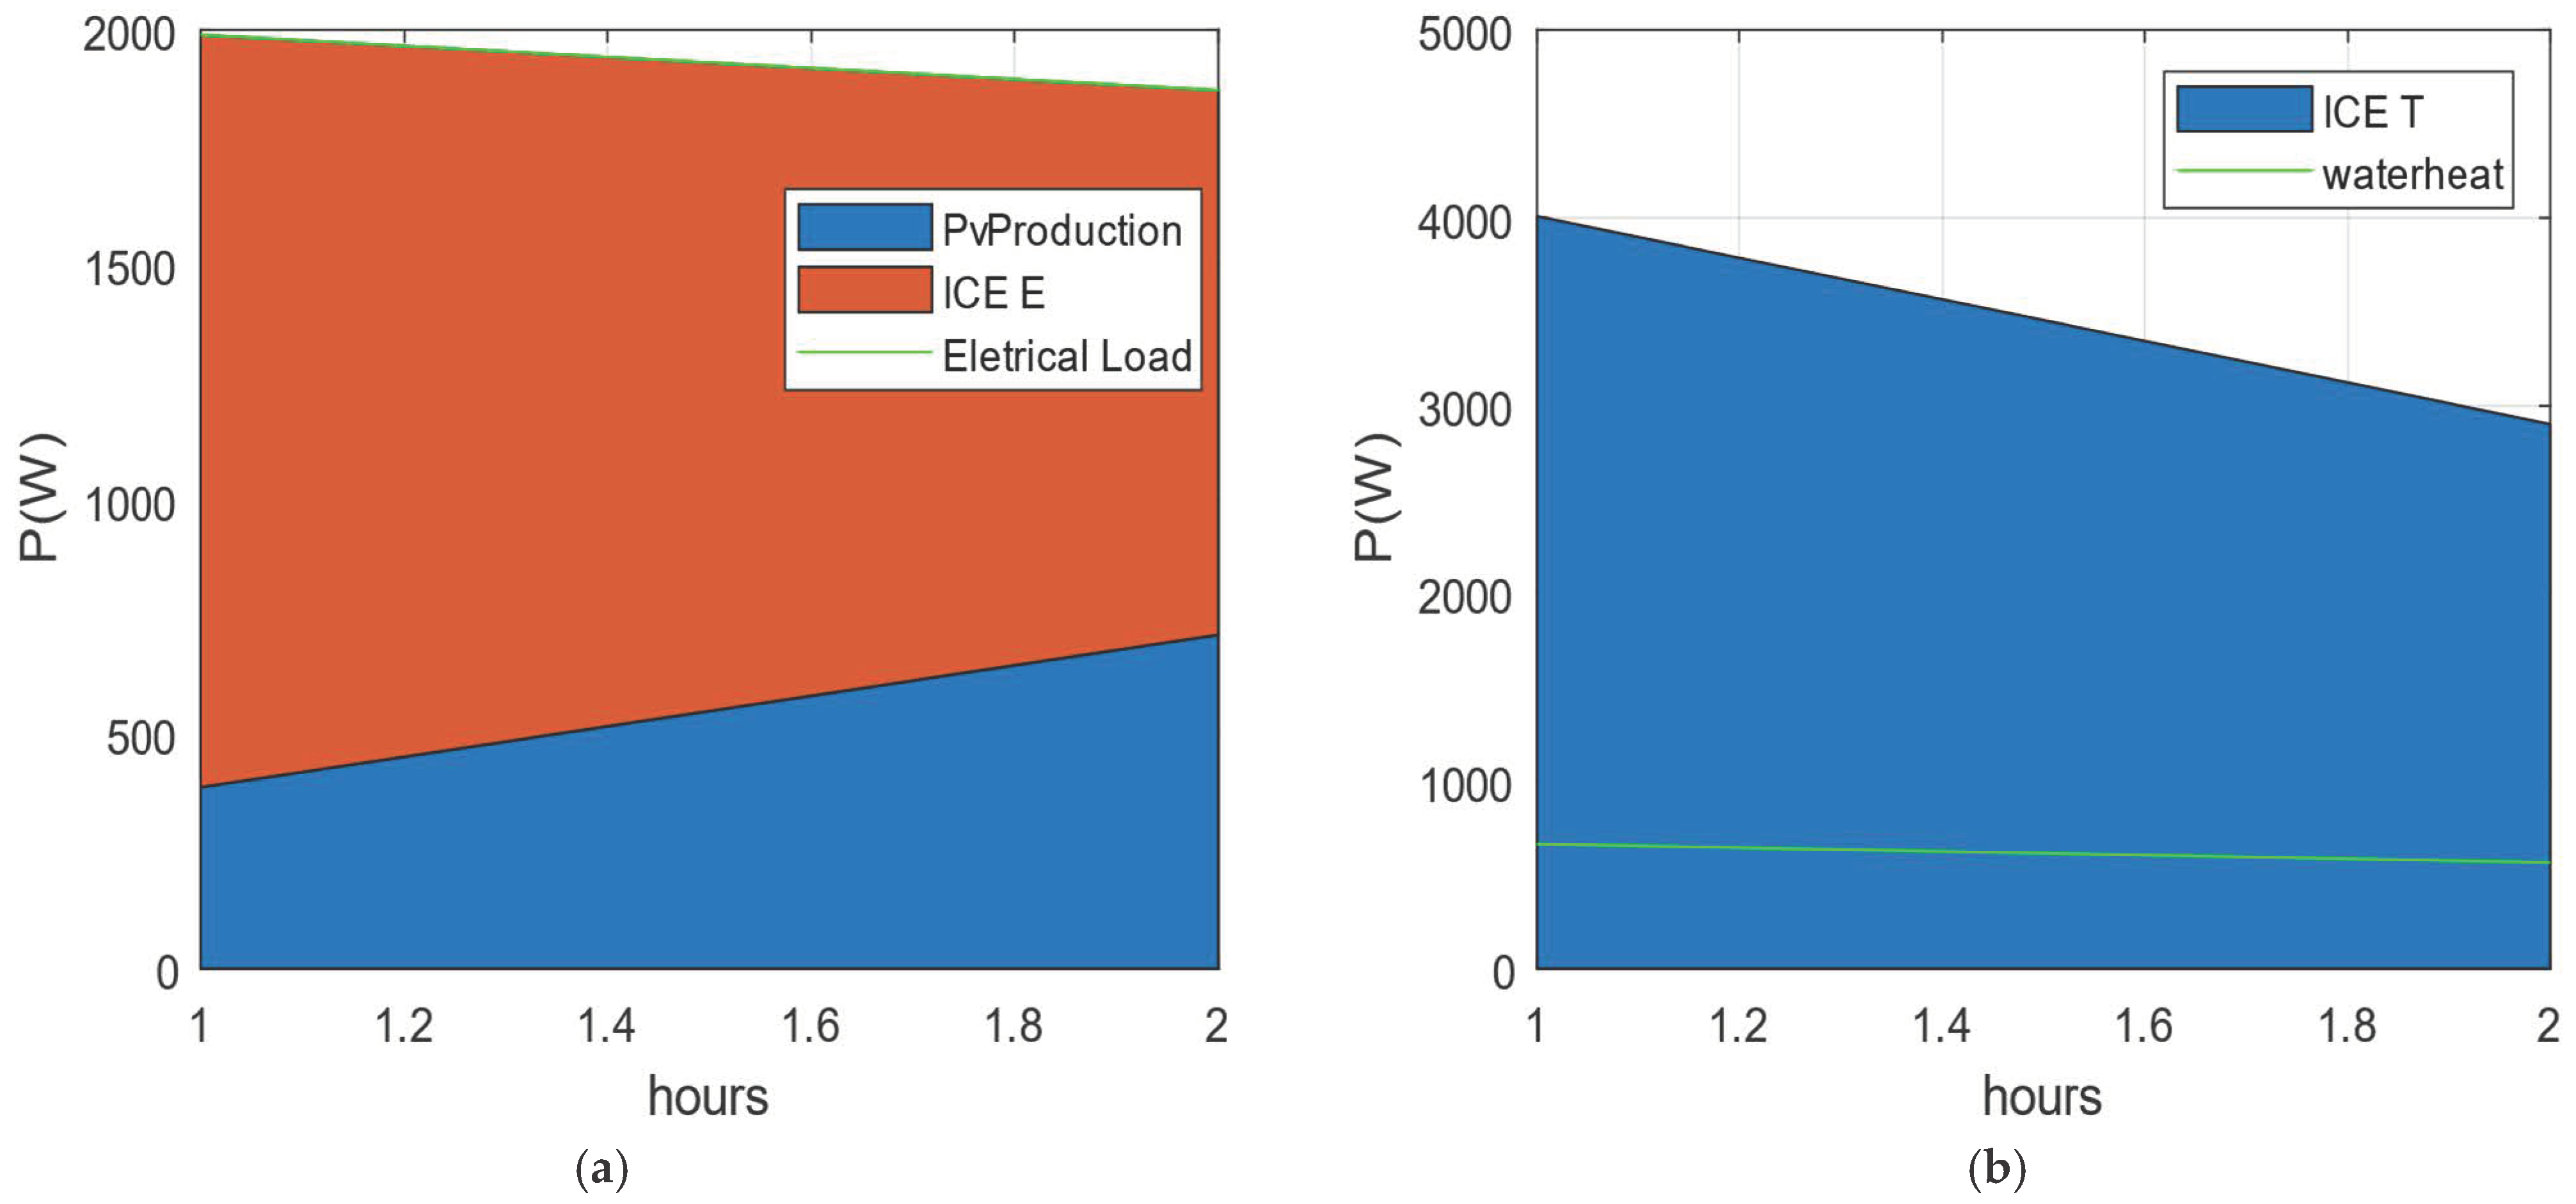
7.2. Simulation Setup and Scenarios (PV/Micro-CHP)
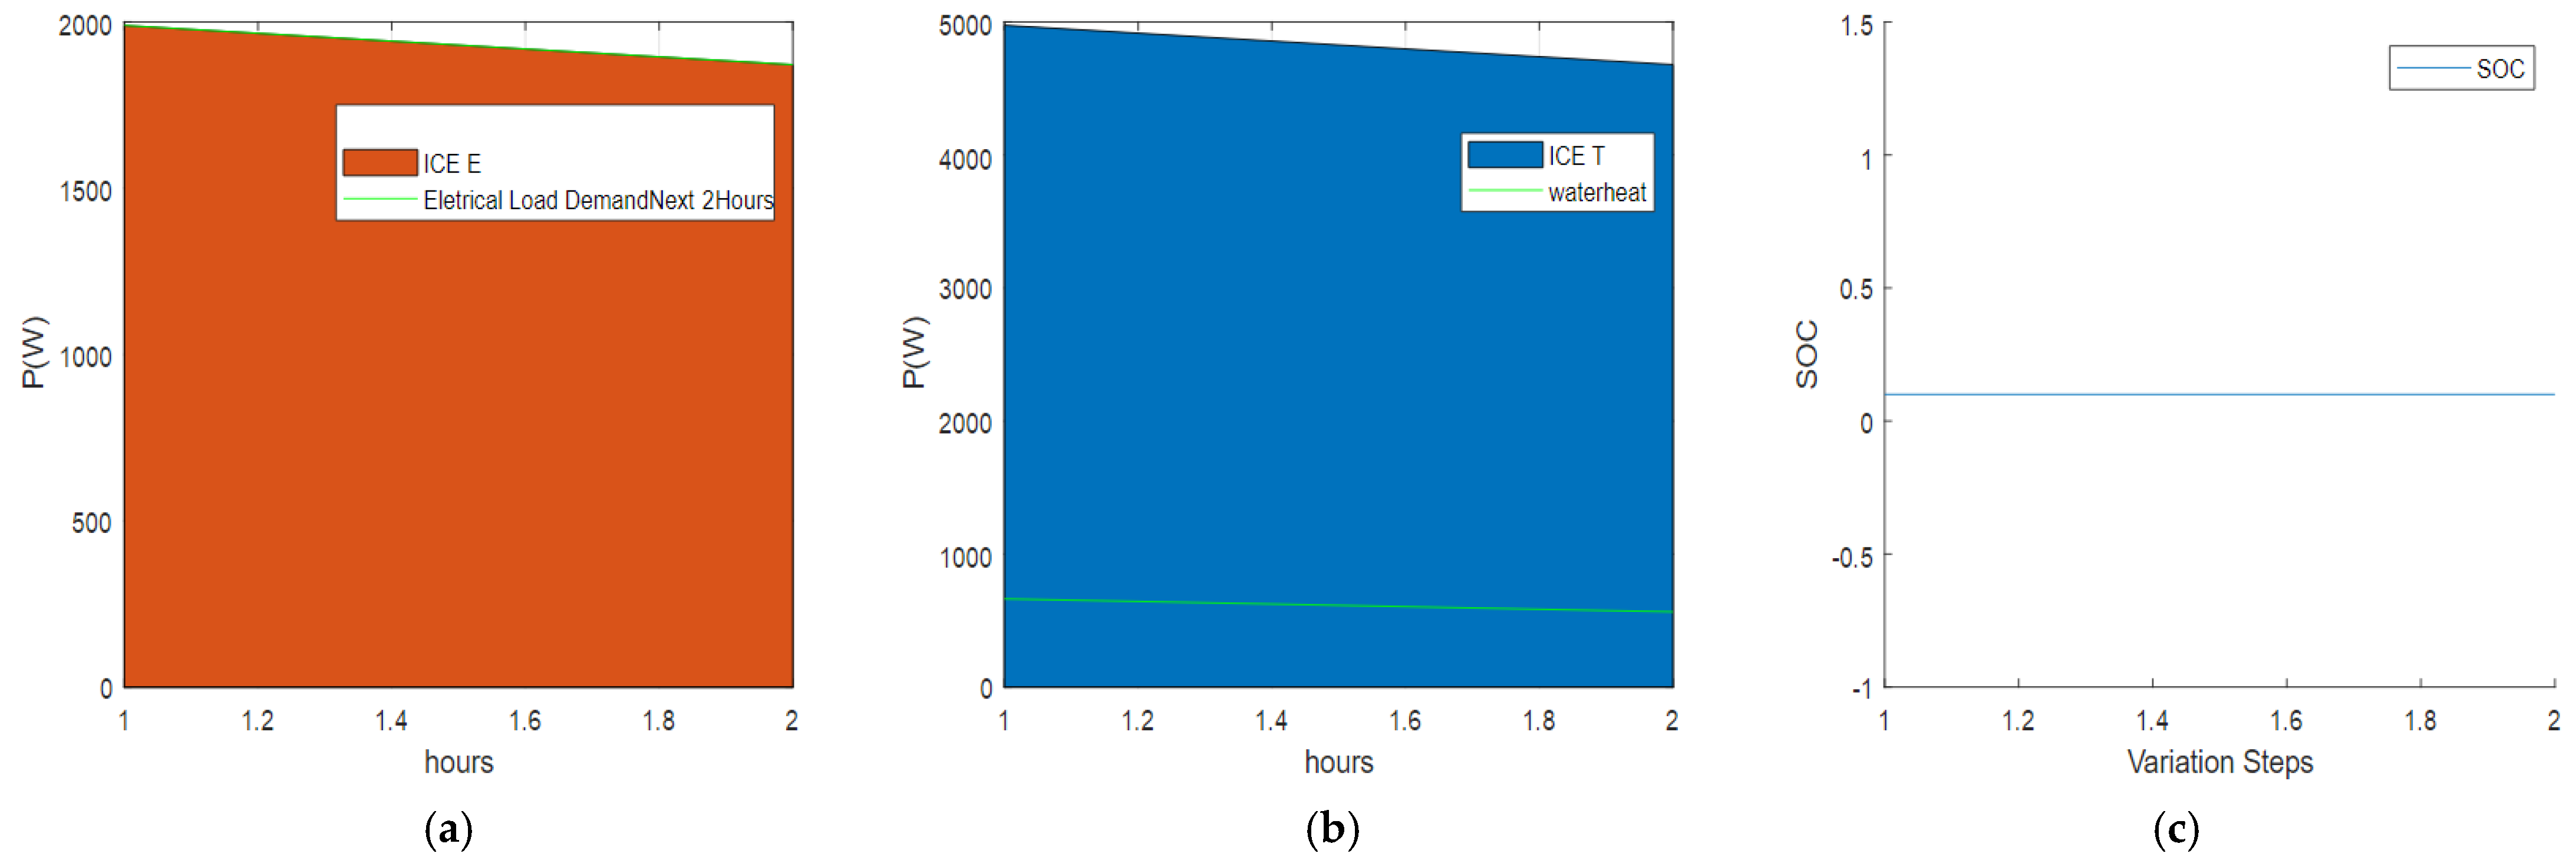
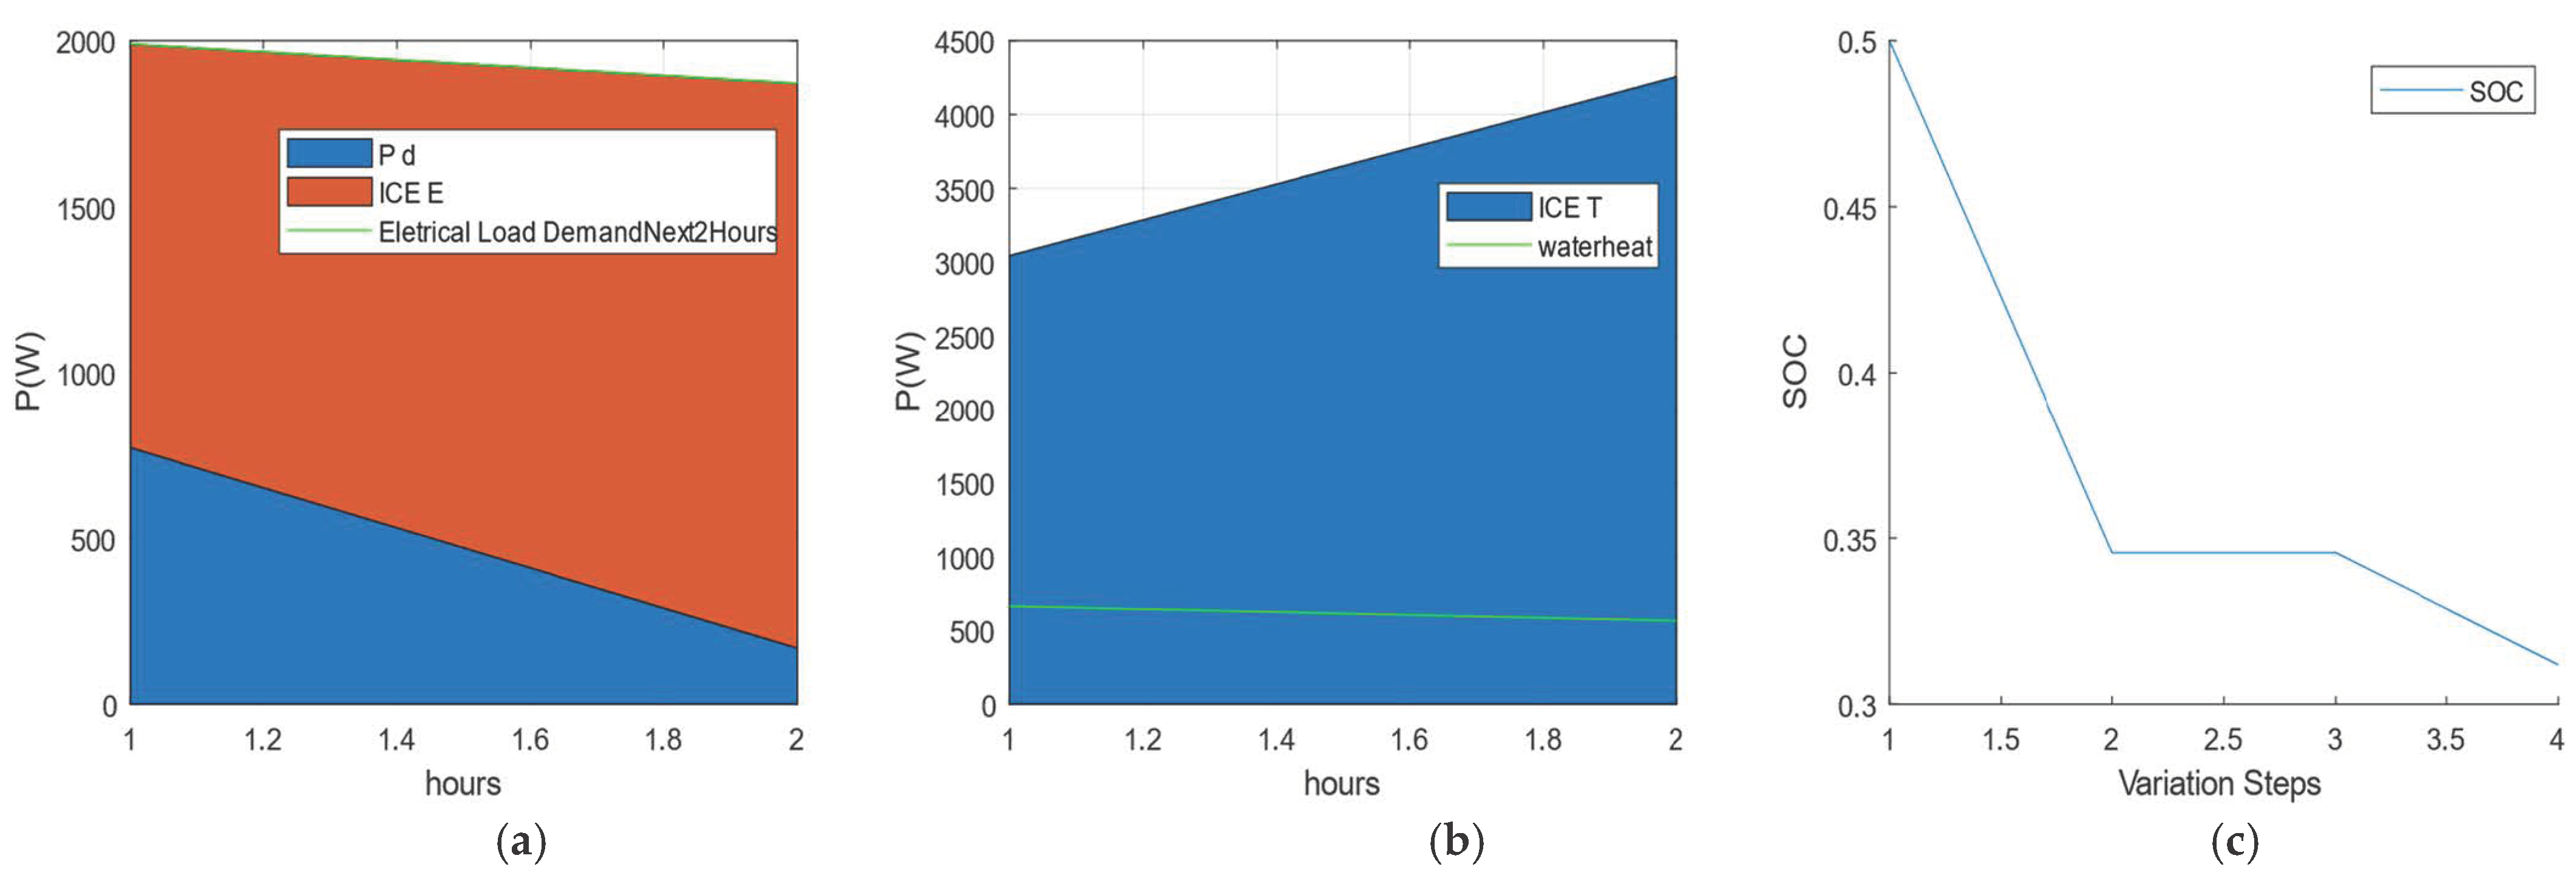
7.3. Simulation Setup and Scenarios (Battery/Micro-CHP)
8. Performance Evaluation of the Proposed Solution
9. Conclusions
9.1. Summary of Findings
9.2. Contributions to Grid Resilience, Energy Efficiency, and Renewable Energy Integration
9.3. Limitations and Future Work
Author Contributions
Funding
Conflicts of Interest
References
- Faria, J.; Pombo, J.; Mariano, S.; Rosario Calado, M.D. Power Management Strategy for Standalone PV Applications with Hybrid Energy Storage System. In Proceedings of the 2018 IEEE International Conference on Environment and Electrical Engineering and 2018 IEEE Industrial and Commercial Power Systems Europe (EEEIC/I&CPS Europe), Palermo, Italy, 12–15 June 2018; Volume 1–6, p. 101109. [Google Scholar]
- Entchev, E.; Yang, L.; Ghorab, M.; Rosato, A.; Sibilio, S. Energy, economic and environmental performance simulation of a hybrid renewable Microgeneration system with neural network predictive control. Alex. Eng. J. 2018, 57, 455–473. [Google Scholar] [CrossRef] [Green Version]
- Ribberink, H.; Entchev, E. Exploring the potential synergy between Micro-cogeneration and electric vehicle charging. Appl. Therm. Eng. 2014, 71, 677–685. [Google Scholar] [CrossRef]
- Koohi-Fayegh, S.; Rosen, M.A. A review of energy storage types, applications, and recent developments. J. Energy Storage 2020, 27, 101047. [Google Scholar] [CrossRef]
- Kang, E.-C.; Lee, E.-J.; Ghorab, M.; Yang, L.; Entchev, E.; Lee, K.-S.; Lyu, N.-J. Investigation of energy and environmental potentials of a renewable trigeneration system in a residential application. Energies 2016, 9, 760. [Google Scholar] [CrossRef] [Green Version]
- Mikalsen, R. Internal combustion and reciprocating engine systems for small and Micro combined heat and power (CHP) applications. In Small and Micro Combined Heat and Power (CHP) Systems; Elsevier: Amsterdam, The Netherlands, 2011; Volume 125–146, p. 101533. [Google Scholar]
- Frangopoulos, C.A. EDUCOGEN, The European Educational Tools on Cogeneration; European Commission: Brussels, Belgium, 2001. [Google Scholar]
- Onovwiona, H.I.; Ugursal, V.I. Residential cogeneration systems: Review of the current technology. Renew. Sustain. Energy Rev. 2006, 105, 389–431. [Google Scholar] [CrossRef]
- Orlando, J.A. Cogeneration Design Guide; ASHRAE: Atlanta, GA, USA, 1996. [Google Scholar]
- Chicco, G.; Mancarella, P. Assessment of the greenhouse gas emissions from cogeneration and trigeneration systems. Part I: Models and indicators. Energy 2008, 33, 410–417. [Google Scholar] [CrossRef]
- Tanaka, H.; Suzuki, A.; Yamamoto, K.; Yamamoto, I.; Yoshimura, M.; Togawa, K. New Ecowill—A new generation gas engine Micro-CHP. In Proceedings of the International Gas Union Research Conference 2011, Seoul, Republic of Korea, 19–21 October 2011. [Google Scholar]
- Japan’s Smallest Gas Engine Cogeneration System. The Netherlands: Centre for the Analysis and Dissemination of Demonstrated Energy Technologies. In CADDET Energy Efficiency; IEA/OECD: Paris, France, 2001. [Google Scholar]
- Alcaide, F.; Cabot, P.-L.; Brillas, E. Fuel cells for chemicals and energy cogeneration. J. Power Sources 2006, 153, 47–60. [Google Scholar] [CrossRef]
- Milcarek, R.J.; Ahn, J.; Zhang, J. Review and analysis of fuel cell-based, Micro-cogeneration for residential applications: Current state and future opportunities. Sci. Technol. Built Environ. 2018, 23, 1224–1243. [Google Scholar] [CrossRef]
- Little, A.D. Volume I: Main Text. In Opportunities for Micropower and Fuel Cell/Gas Turbine Hybrid Systems in Industrial Applications; Arthur D. Little, Inc.: Cambridge, MA, USA, 2000; Volume 1, p. 173. [Google Scholar]
- Isa, N.M.; Tan, C.W.; Yatim, A.H.M. A comprehensive review of cogeneration system in a Microgrid: A perspective from architecture and operating system. Renew. Sustain. Energy Rev. 2018, 81, 2236–2263. [Google Scholar] [CrossRef]
- Darcovich, K.; Henquin, E.R.; Kenney, B.; Davidson, I.J.; Saldanha, N.; Beausoleil-Morrison, I. Higher-capacity lithium ion battery chemistries for improved residential energy storage with Micro-cogeneration. Appl. Energy 2013, 111, 853–861. [Google Scholar] [CrossRef] [Green Version]
- Desideri, U.; Cinti, G.; Discepoli, G.; Sisani, E.; Penchini, D. SOFC Micro-CHP integration in residential buildings. In Proceedings of the 25th International Conference on Efficiency, Cost, Optimization and Simulation of Energy Conversion Systems and Processes, ECOS 2012; Firenze University Press: Firenze, Italy, 2012; pp. 26–29. [Google Scholar]
- Quaschning, V. Understanding Renewable Energy Systems; Routledge: Abingdon, UK, 2016. [Google Scholar]
- Faizollahzadeh Ardabili, S.; Mahmoudi, A.; Mesri Gundoshmian, T. Modeling and simulation controlling system of HVAC using fuzzy and predictive (radial basis function, RBF) controllers. J. Build. Eng. 2016, 6, 301–308. [Google Scholar] [CrossRef]
- Karballaeezadeh, N.; Mohammadzadeh, S.D.; Shamshirband, S.; Hajikhodaverdikhan, P.; Mosavi, A.; Chau, K.W. Prediction of remaining service life of pavement using an optimized support vector machine. Eng. Appl. Comput. Fluid Mech. 2019, 13, 188–198. [Google Scholar]
- Faizollahzadeh Ardabili, S.; Najafi, B.; Shamshirband, S.; Minaei Bidgoli, B.; Deo, R.C.; Chau, K.-W. Computational intelligence approach for modeling hydrogen production: A review. Eng. Appl. Comput. Fluid Mech. 2018, 12, 438–458. [Google Scholar] [CrossRef]
- Mosavi, A.; Salimi, M.; Faizollahzadeh Ardabili, S.; Rabczuk, T.; Shamshirband, S.; Varkonyi-Koczy, A. State of the Art of Machine Learning Models in Energy Systems, a Systematic Review. Energies 2019, 12, 1301. [Google Scholar] [CrossRef] [Green Version]
- Zhang, J.; Walter, G.G.; Miao, Y.; Lee, W.N.W. Wavelet neural networks for function learning. IEEE Trans. Signal Process. 1995, 43, 1485–1497. [Google Scholar] [CrossRef]
- Faizollahzadeh Ardabili, S.; Najafi, B.; Ghaebi, H.; Shamshirband, S.; Mostafaeipour, A. A novel enhanced exergy method in analyzing HVAC system using soft computing approaches: A case study on mushroom growing hall. J. Build. Eng. 2017, 13, 309–318. [Google Scholar] [CrossRef]
- Mandelli, S.; Brivio, C.; Colombo, E.; Merlo, M. A sizing methodology based on Levelized Cost of Supplied and Lost Energy for off-grid rural electrification systems. Renew. Energy 2016, 89, 475–488. [Google Scholar] [CrossRef] [Green Version]
- Okoye, C.O.; Solyalı, O. Optimal sizing of stand-alone photovoltaic systems in residential buildings. Energy 2017, 126, 573–584. [Google Scholar] [CrossRef]
- Zhang, Q.; Li, Y.; Shang, Y.; Duan, B.; Cui, N.; Zhang, C. A Fractional-Order Kinetic Battery Model of Lithium-Ion Batteries Considering a Nonlinear Capacity. Electronics 2019, 8, 394. [Google Scholar] [CrossRef] [Green Version]
- Rodrigues, L.; Montez, C.; Moraes, R.; Portugal, P.; Vasques, F. A Temperature-Dependent Battery Model for Wireless Sensor Networks. Sensors 2017, 17, 422. [Google Scholar] [CrossRef] [PubMed] [Green Version]
- Manwell, J.F.; McGowan, J.G. Lead acid battery storage model for hybrid energy systems. Solar Energy 1993, 50, 399–405. [Google Scholar] [CrossRef]
- Amarasinghe, K.; Marino, D.L.; Manic, M. Deep neural networks for energy load forecasting. In Proceedings of the 2017 IEEE 26th International Symposium on Industrial Electronics (ISIE), Edinburgh, UK, 19–21 June 2017; pp. 1483–1488. [Google Scholar]
- Zhang, H.-T.; Xu, F.-Y.; Zhou, L. Artificial neural network for load forecasting in smart grid. In Proceedings of the 2010 International Conference on Machine Learning and Cybernetics, Qingdao, China, 11–14 July 2010; pp. 3200–3205. [Google Scholar]
- Lai, L.L.; Subasinghe, H.; Rajkumar, N.; Vaseekar, E.; Gwyn, B.J.; Sood, V.K. Object-oriented genetic algorithm based artificial neural network for load forecasting. In Proceedings of the Simulated Evolution and Learning: Second Asia-Pacific Conference on Simulated Evolution and Learning, SEAL’98, Canberra, Australia, 24–27 November 1999; pp. 462–469. [Google Scholar]
- Bento, P.M.R.; Pombo, J.A.N.; Calado, M.R.A.; Mariano, S.J.P.S. Optimization of neural network with wavelet transform and improved data selection using bat algorithm for short-term load forecasting. Neurocomputing 2019, 358, 53–71. [Google Scholar] [CrossRef]
- Islam, B.U. Comparison of conventional and modern load forecasting techniques based on artificial intelligence and expert systems. Int. J. Comput. Sci. Issues 2011, 8, 504–513. [Google Scholar]


| Parameter | Value |
|---|---|
| Latitude (deg.) | 41.157 |
| Longitude (deg.) | −8.391 |
| Elevation (m) | 166 |
| Slope (deg.) | 37 |
| Azimuth (deg.) | 10 |
| Nominal power PV system (kW) | 3.5 |
| System losses (%) | 15 |
| Parameter | Value |
|---|---|
| 25 | |
| Parameter | Value |
|---|---|
| k | 0.38 |
| c | 0.271 |
Disclaimer/Publisher’s Note: The statements, opinions and data contained in all publications are solely those of the individual author(s) and contributor(s) and not of MDPI and/or the editor(s). MDPI and/or the editor(s) disclaim responsibility for any injury to people or property resulting from any ideas, methods, instructions or products referred to in the content. |
© 2023 by the authors. Licensee MDPI, Basel, Switzerland. This article is an open access article distributed under the terms and conditions of the Creative Commons Attribution (CC BY) license (https://creativecommons.org/licenses/by/4.0/).
Share and Cite
Cardoso, D.; Nunes, D.; Faria, J.; Fael, P.; Gaspar, P.D. Intelligent Micro-Cogeneration Systems for Residential Grids: A Sustainable Solution for Efficient Energy Management. Energies 2023, 16, 5215. https://doi.org/10.3390/en16135215
Cardoso D, Nunes D, Faria J, Fael P, Gaspar PD. Intelligent Micro-Cogeneration Systems for Residential Grids: A Sustainable Solution for Efficient Energy Management. Energies. 2023; 16(13):5215. https://doi.org/10.3390/en16135215
Chicago/Turabian StyleCardoso, Daniel, Daniel Nunes, João Faria, Paulo Fael, and Pedro D. Gaspar. 2023. "Intelligent Micro-Cogeneration Systems for Residential Grids: A Sustainable Solution for Efficient Energy Management" Energies 16, no. 13: 5215. https://doi.org/10.3390/en16135215
APA StyleCardoso, D., Nunes, D., Faria, J., Fael, P., & Gaspar, P. D. (2023). Intelligent Micro-Cogeneration Systems for Residential Grids: A Sustainable Solution for Efficient Energy Management. Energies, 16(13), 5215. https://doi.org/10.3390/en16135215