Article

A Comparative Study on the Energy Flow of Electric Vehicle Batteries among Different Environmental Temperatures

1
China Automotive Engineering Research Institute Co., Ltd., Chongqing 401122, China
2
New Energy Technology of CAERI Co., Ltd., Chongqing 401122, China
3
Vehicle Engineering Institute, Chongqing University of Technology, Chongqing 400054, China
4
Zongshen Industrial Group Co., Ltd., Chongqing 401320, China
*
Author to whom correspondence should be addressed.
Energies 2023, 16(14), 5253; https://doi.org/10.3390/en16145253
Submission received: 17 May 2023 / Revised: 20 June 2023 / Accepted: 22 June 2023 / Published: 8 July 2023
(This article belongs to the Section D2: Electrochem: Batteries, Fuel Cells, Capacitors)

Abstract

:
In the present research, the energy flow of electric vehicle batteries under different environmental temperatures was experimentally examined in a climate chamber. The energy flow characteristics, energy loss conditions, and the critical components’ operating conditions and working efficiency under different environmental temperatures were comparatively analyzed. The test results show that the environmental temperature has a profound impact on an electric vehicle’s performance and the critical components’ working conditions. The driving mileage of the tested vehicle at −7 °C, 23 °C, and 35 °C was found to be 162.89 km, 256.09 km, and 198.69 km, respectively. The environmental temperature does not have much effect on the loss of the motor and motor control unit under driving conditions, and the proportion of those at different temperatures is in all cases about 18%. The battery-recycled energy at 23 °C under braking conditions is much higher than that at −7 °C and 35 °C, leading to a longer driving range. The power battery pack thermal transfer loss at −7 °C is much greater than that at 23 °C and 35 °C due to the low charging and discharging efficiency and the high energy consumption required to warm up the battery at a low environmental temperature. The compressor energy consumption accounts for a large proportion in both braking and driving conditions at 35 °C, and the proportions are 15.25% and 12.41%, respectively. The battery state-of-charge drops the fastest at −7 °C, followed by 35 °C, due to the differences in the power demands of air conditioning, warm air positive temperature coefficient (PTC), and battery PTC in high- and low-temperature environments. The working condition of the front motor under driving conditions at 35 °C is the most severe and leads to the lowest working efficiency.

1. Introduction

In recent years, resource depletion, the energy crisis, and ecological environment deterioration have become the main global problems [1,2]. The extensive use of fossil fuels and aggravated carbon dioxide emissions have caused the serious problem of global warming [3,4]. Against this background, many countries have committed to achieving neutral carbon emissions by 2060 [5]. Transportation emits a lot of greenhouse gases (GHGs) around the world due to its high levels of carbon emissions [6]. In 2019, according to the European Environment Agency, transport accounts for 27% of the UK’s total emissions, while the majority (91%) of this came from road transport vehicles [7]. In addition, the transport sector is a major cause of harmful emissions. As a leading automobile consumer, in 2021, China emitted a large number of harmful substances from motor vehicles [8], which not only affected the ecological environment and national economy but also human health [9,10].
In order to reduce the dependence on conventional fuels, urgent efforts are required to mitigate the environmental impact of transport. Electric vehicles (EVs) show great potential in energy security guarantee and harmful emissions reduction resulting from road traffic increasing [11,12]. EVs offer a path to a carbon-free environment [13,14]. Relevant studies [15] show that compared with using gasoline and diesel vehicles, using EVs can reduce 60% of GHG and 50% of GHG emissions, respectively. Therefore, many governments are giving strong backing to EV development through financial and non-financial policies and measures to promote both demand and supply [16]. According to the “Global EV Outlook 2023” from the International Energy Agency, global EV sales surpassed 10 million in 2022 and are expected to increase another 35 percent to 14 million in 2023. This means that the global market share of EVs has already increased from 4% in 2020 to 14% in 2022 and will continue to rise to 18% in 2023 [17]. However, the development of EVs is limited by many factors [18]. First of all, the long charging time and lack of charging points for EVs are serious problems [19]. In addition, people are less willing to buy EVs because of the battery capacity limitation and relatively short cruise range. The driving range of pure EVs can be improved by increasing the power battery energy density to some extent. However, there are still huge technical challenges and problems [20]. As is known, power battery packs which are the power supply sources for EVs are very sensitive to environmental temperature [21]. Both low and high operating temperatures can increase the degradation of the battery and shorten its lifespan [22]. If the temperature is below 0 °C, the battery’s internal resistance increases rapidly, and the available capacity of the battery is severely reduced, leading to a significant decline in the power density of the battery [23]. Petzl et al. [24] found that the discharge times of lithium batteries were reduced to 90–140 cycles when they were charged at low temperatures. Moreover, extra energy is consumed in cabin heating, usually in the form of heat pump systems [25] and positive temperature coefficient (PTC) heaters [26]. Studies [27,28] have shown that the capacity of lithium-ion batteries will decay and cathode materials will be exhausted under high temperatures and high discharge rates. Furthermore, during high-temperature periods, the energy consumption of EVs increases due to the use of auxiliary devices to make passengers comfortable while using air conditioning [29]. Therefore, it is very important to carry out in-depth research into the effect of temperature on EVs.
Another way to improve the range of pure EVs is to improve the energy using the efficiency of some components and full vehicles [30], such as energy regeneration technology, single-pedal technology [31], energy management strategy optimization [32], power semiconductor devices [33], and so on. For the past few years, energy flow analysis has played a significant role in vehicle efficiency improvement, whether in traditional fuel vehicles or new energy vehicles [34,35]. An energy flow analysis of the entire vehicle can effectively understand the flow of its energy and clearly show how much effective energy is used and lost during the consumption of the entire vehicle energy [36,37]. As a valid method to improve vehicle performance, energy flow analysis has been investigated by some practitioners and scholars when applied to pure EVs. In order to facilitate EV energy flow performance, Li et al. [38] proposed an energy management strategy for a hybrid power system on the basis of fuzzy logic. The experiment results showed there are obvious advantages of the proposed energy management strategy in urban driving cycles. Danko et al. [39] optimized the EV energy flow control on the basis of a global positioning system. The results show that an algorithm based on a predetermined path saves more energy than the basic algorithm, which functions on the basis of the battery current. As is known, depending on electricity supply and demand, EVs may be the best solution for energy storage and recovery. Thus, Merhy et al. [40] proposed an energy strategy on the basis of a multi-objective, multi-criteria optimization algorithm, which involves controlling the energy flow between EVs and the grid, homes and buildings. Schulz-Mönninghoff et al. [41] established an integrated energy flow model for evaluating the full life cycle of battery reuse in EVs. The results showed that climate change benefits in multi-use cases are lower than in single-use cases. A similar study was conducted by Bobba et al. [42]. Xie et al. [43] analyzed the influence of different environments on pure EV driving range and energy consumption and through experimental and simulation methods. However, the simulation model does not contain temperature components, such as the air conditioning system PTC and water pump, which can be applied to analyze the impact of the management system and the structural parameters of the battery on its performance.
Although some past studies have studied energy flow analysis of EVs, few studies have looked at the impacts of environmental temperature on the performance of EVs through energy flow analysis. In addition, some past studies on EVs have fallen short of determining all of the EV energy flow characteristics. Moreover, many studies [43,44,45,46] on EV energy analysis have lacked specific thermal management system energy distributions. What is more, most studies rarely consider the key component and system operational status and working efficiency. As a result, the purpose of this research is to ascertain the energy flow distributions, energy loss conditions, and critical component working efficiency and working conditions of a pure electric passenger vehicle under different environmental temperatures and to offer support for the follow-up optimization of the EV.
In this study, energy flow experiments of pure electric vehicles among the environmental temperatures of −7 °C, 23 °C, and 35 °C under a worldwide light-duty test cycle (WLTC) were first conducted in a climate chamber. Then, the overall results such as the driving mileage, the power consumption rate, and the duration of the test under different environmental temperatures was compared. After that, the tested EV energy flow statistical data and energy loss conditions were computed based on the test results and fundamental theory of vehicle energy flow. Lastly, the critical components’ operating conditions and working efficiency under different environmental temperatures were comparatively analyzed.

2. Energy Flow Experiment

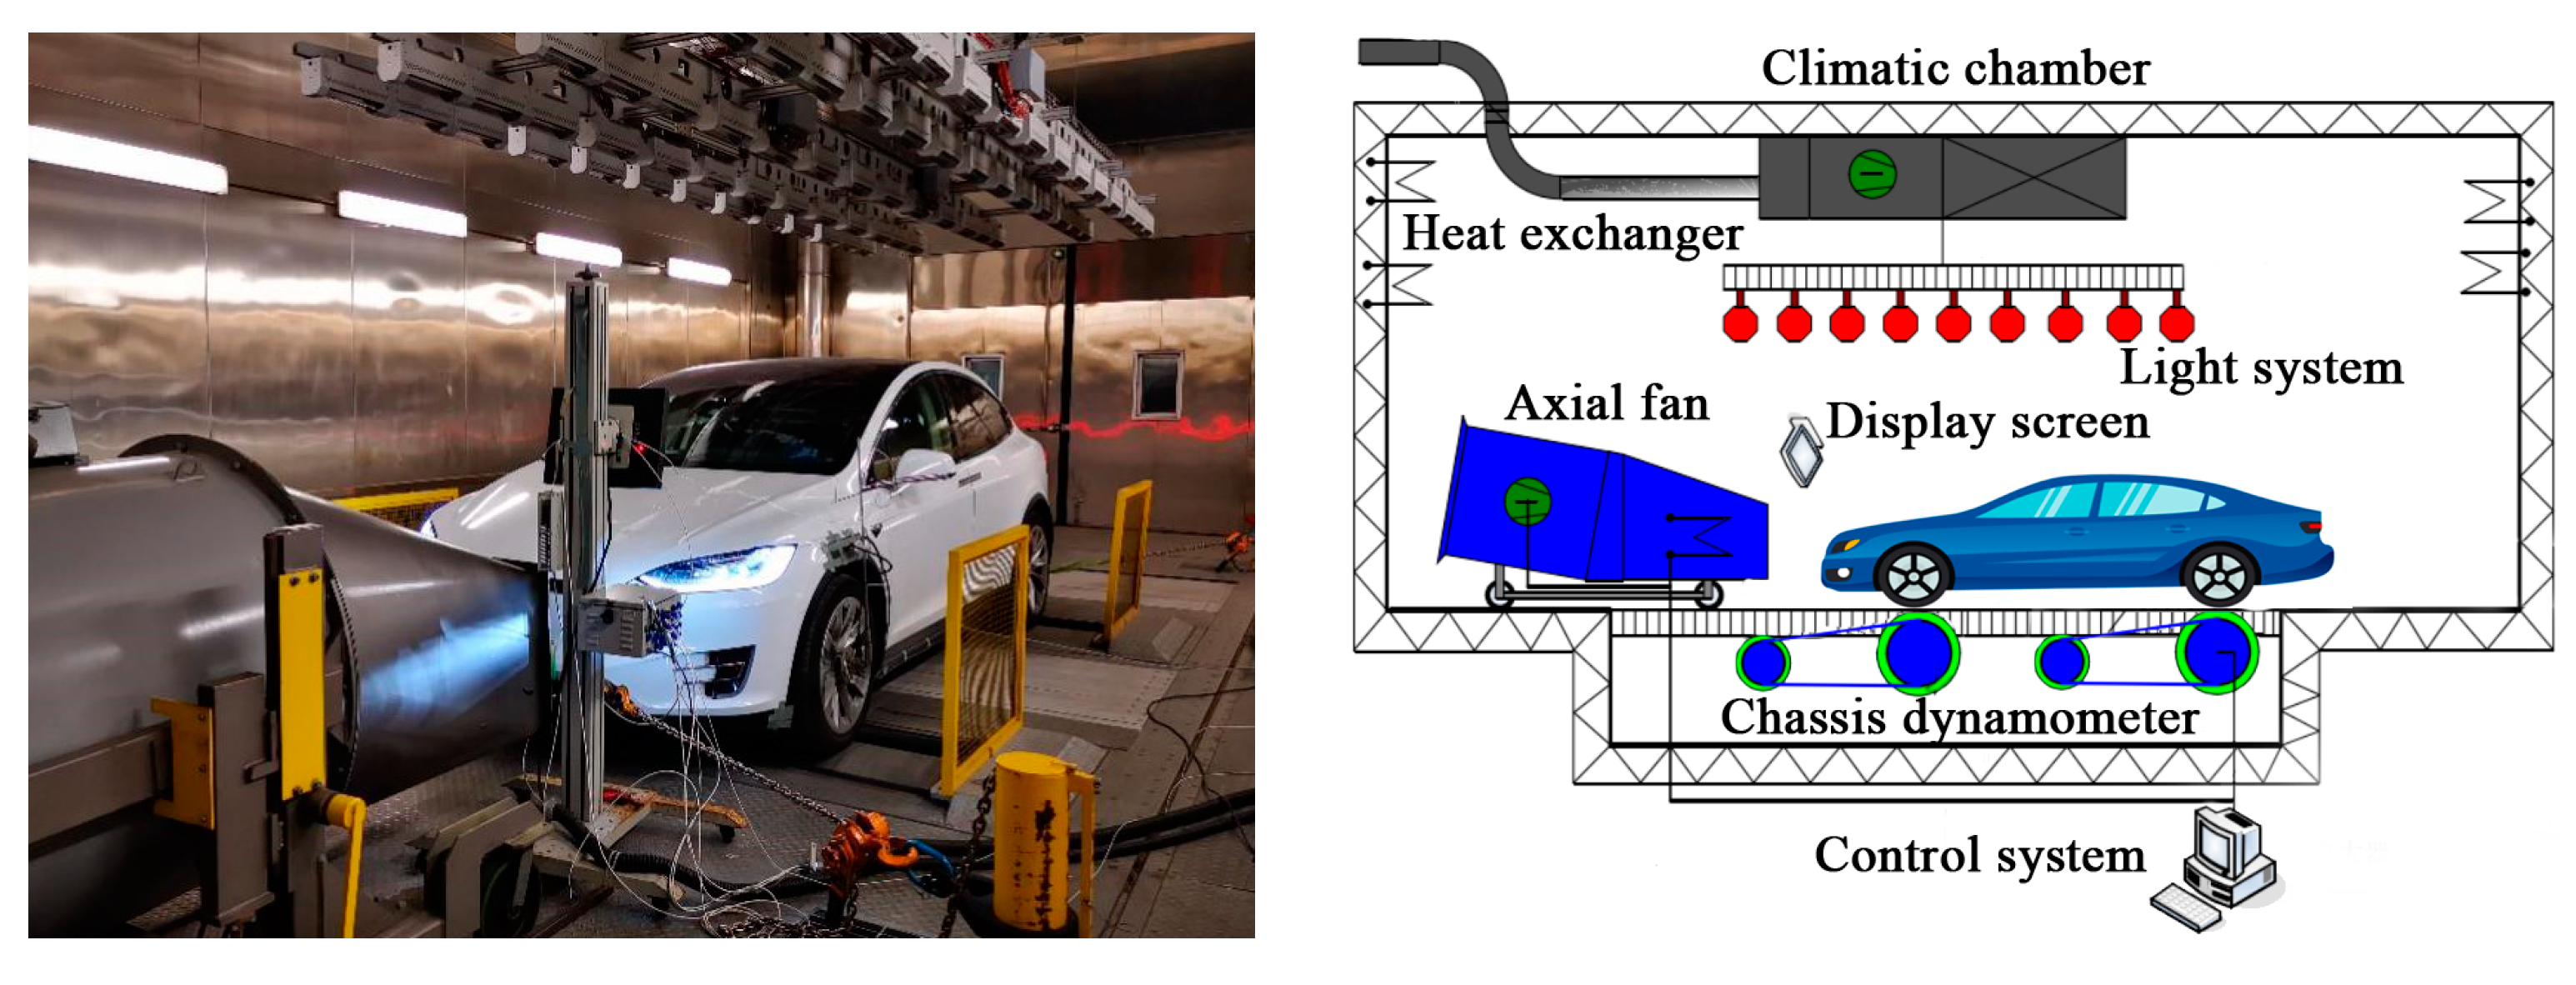
2.1. Experiment Platform

A dynamic test was carried out on a chassis dynamometer in the climate chamber, and the energy flow experiment set-up is shown in Figure 1. The climate chamber is used to simulate real ambient conditions, and the EV is installed on the chassis dynamometer to simulate the tested EV driving on a real roadway. The experiment platform contains a chassis dynamometer signal collection system, air conditioning system, supervisory systems, and axial fan. The air conditioning system and axial fan are utilized to control the vehicle’s environmental temperature. During the experiment, the system is monitored to ensure safety. The tested EV is a passenger car, and it is driven by a 60-kWh high-voltage power ternary lithium battery and a 386-kW peak power alternating current asynchronous motor. The main technical specifications of the whole vehicle, the motor, and the power battery are listed in Table 1.

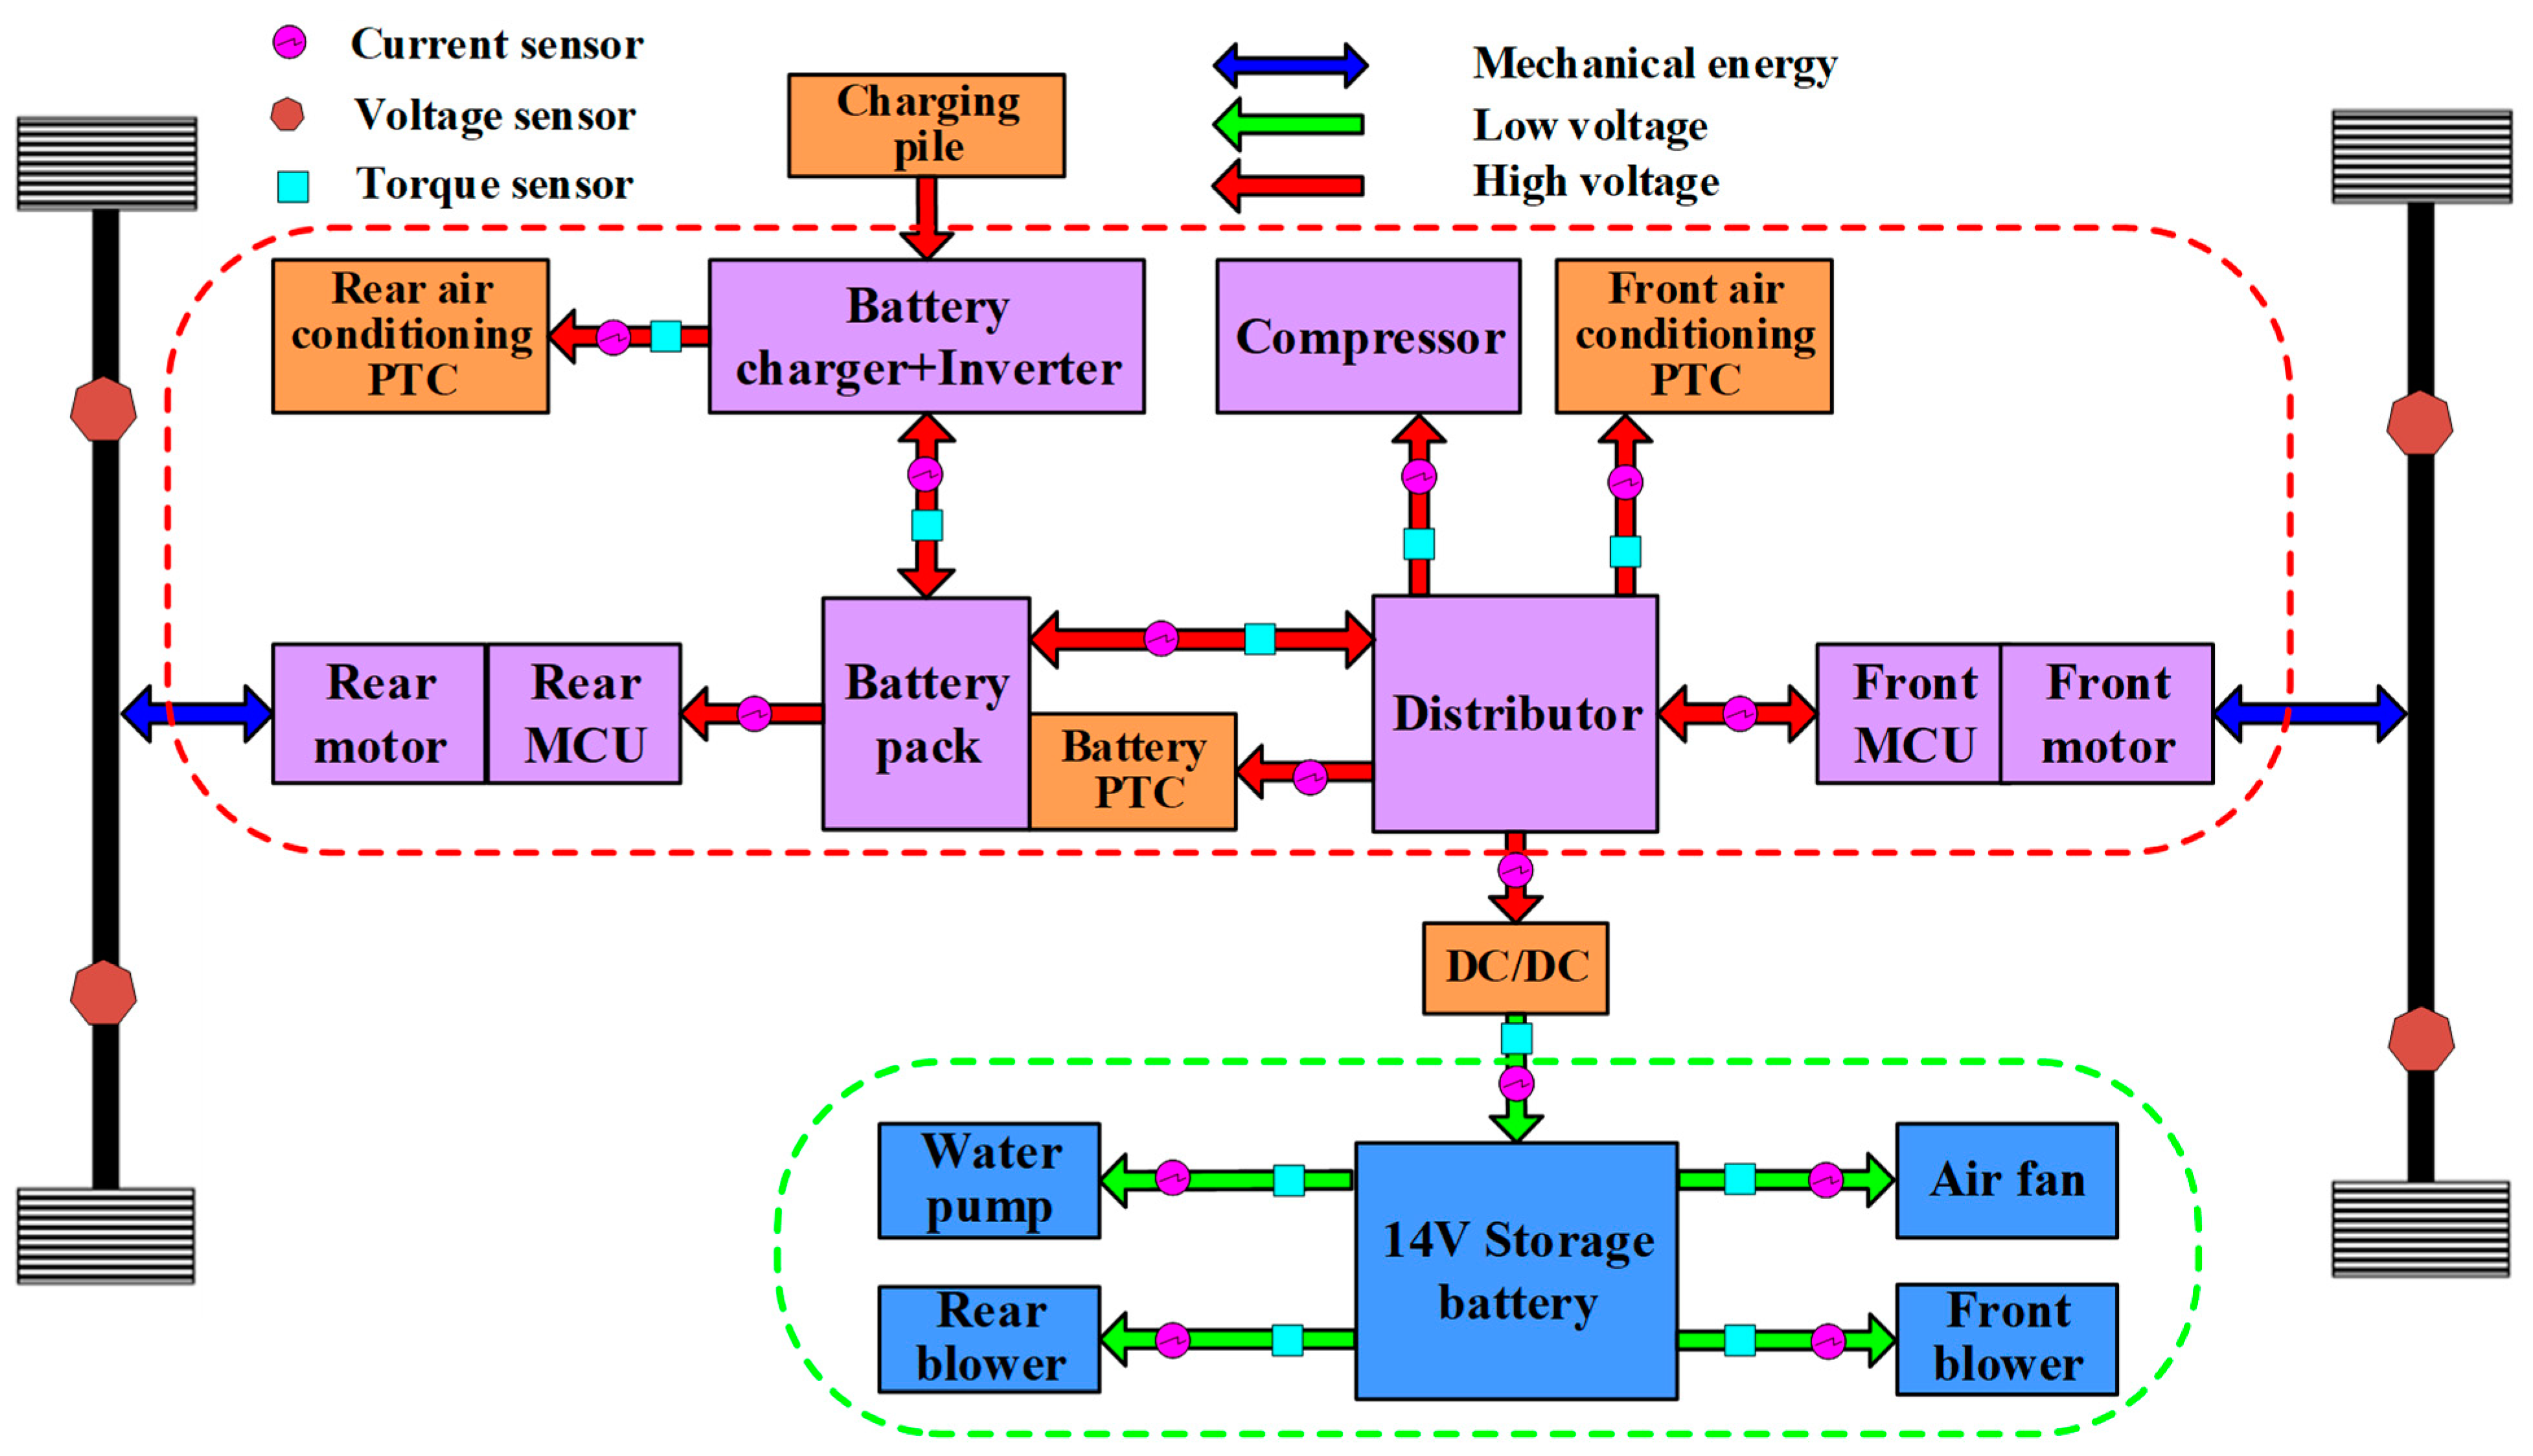
2.2. Energy Flow Test

In order to assess the energy distribution and comprehensively monitor the running state of the vehicle during the test process, a variety of sensors were installed on the tested EV. The vehicle status signal was recorded immediately, and the energy flow data were obtained. A variety of pressure, temperature, flow, current, voltage, and torque sensors were installed at key locations in waterways and electric circuits. According to the characteristics of the measured signal, all sensors were carefully chosen and calibrated. In order to precisely monitor the vehicle’s status during testing, some vehicle signals were obtained from the vehicle controller area network (CAN) bus. All the signals and information were integrated into the data acquisition system at the same time. Through the integrated output of multi-source information, the synchronous testing of the mechanical power flow, heat flow, and electric power flow of the vehicle are realized. The schematic of the sensor layout scheme in the tested EV power system and thermal management system used in this experiment are illustrated in Figure 2 and Figure 3, respectively. The measurement devices, sensors, and their properties are listed in Table 2.

2.3. Test Cycles

In this paper, the EV was tested under a WLTC according to “measurement methods of fuel consumption for light-duty vehicles (GB/T 19233-2020)” [47] and “Electric vehicles-Energy consumption and range-Test procedures (GB/T 18386-2017)”. The WLTC test conditions include four simulation conditions: low, medium, high, and extra-high speed. Each period of the WLTC is 1800 s, and the test distance is 23.25 km. The maximum and average speeds of the WLTC are 131.3 km/h and 46.51 km/h, respectively. The details of the WLTC are shown in Figure 4. Before the WLTC test, the vehicle coasting test should be conducted to obtain the resistance test on a 0-degree road.
In order to determine how the environmental temperature influences the energy flow characteristics of the tested EV, the energy flow experiment was carried out under the environmental temperatures of −7 °C, 23 °C, and 35 °C to ensure that the climate chamber is performing in accordance with a realistic environment.
In order to guarantee that the operation of the climate chamber conforms to the actual environment, the vehicle needs to be placed in the climate chamber for at least 10 h under different environmental temperatures by controlling the air conditioning system. In addition, the initial power battery state-of-charge (SOC) for each test under different environmental temperatures was 100% to eliminate the effects of the battery’s initial state. The cycle test is repeated under each temperature until the battery is 4 kWh (SOC is about 6.67%). After the test at each temperature, the power battery was charged again to obtain the energy from the power grid.

3. Results and Discussion

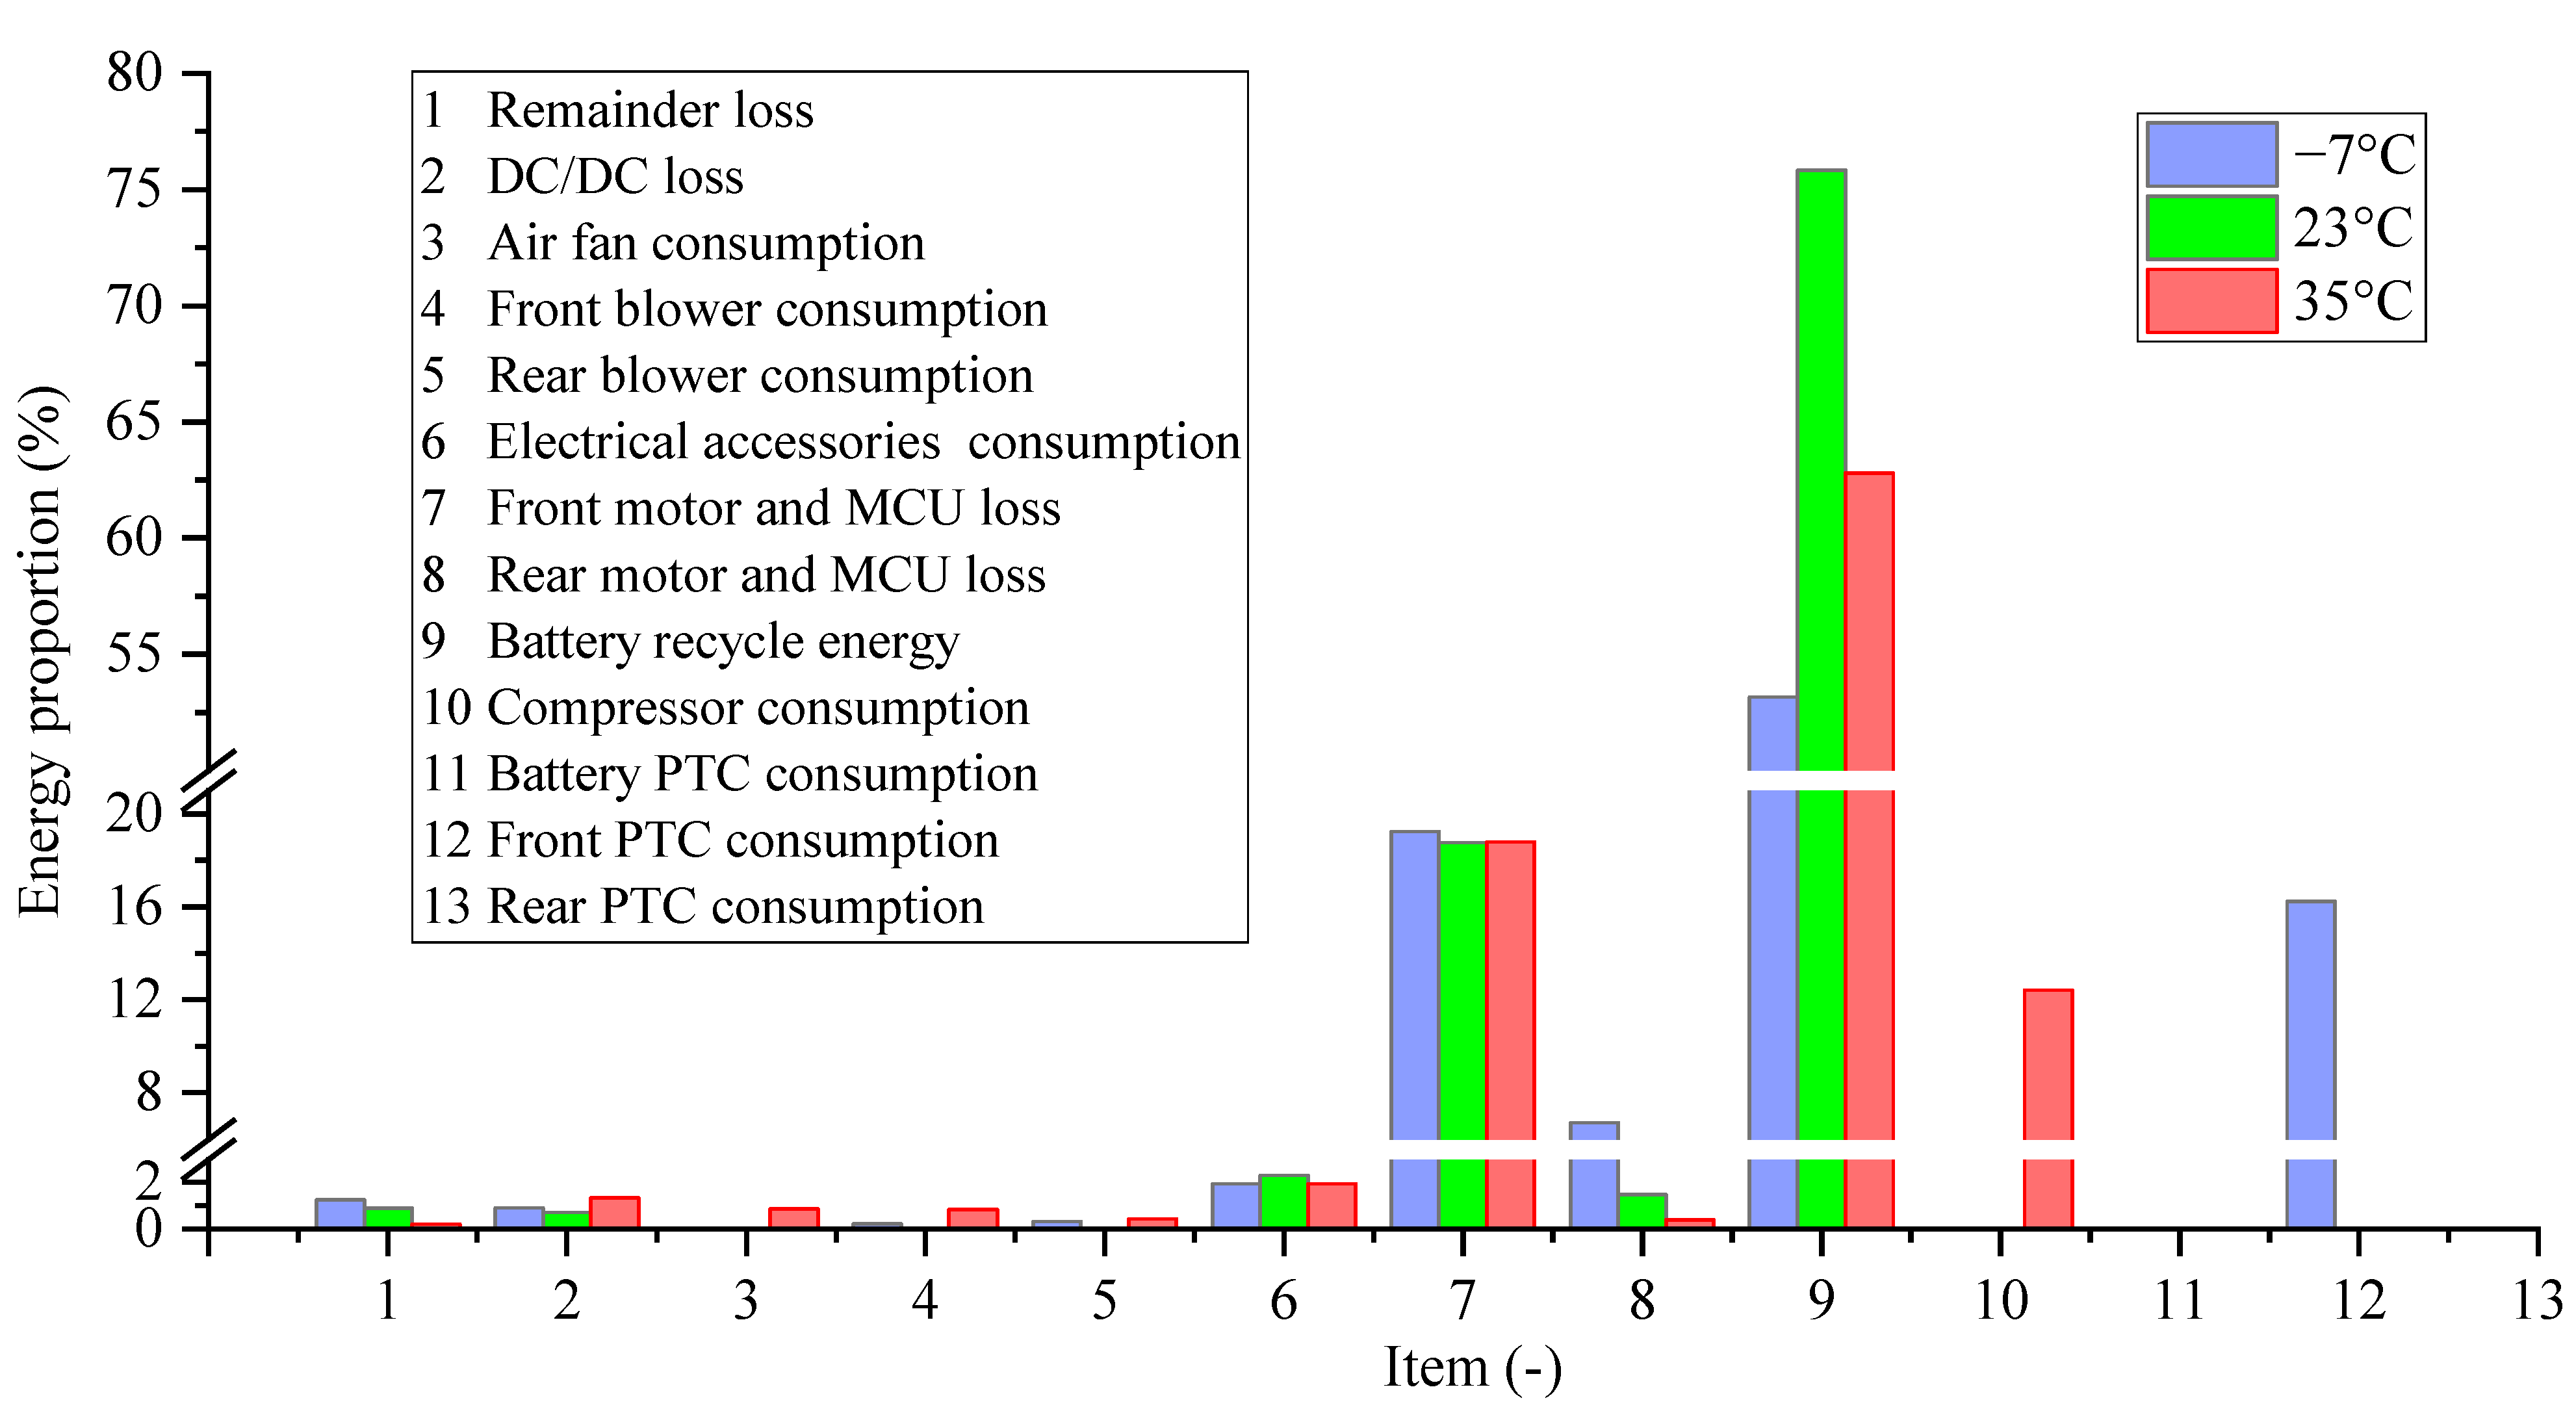
3.1. Energy Consumption Distribution

The overall results at different temperatures are listed in Table 3. It can be seen that the tested WLTC cycle number at −7 °C, 23 °C, and 35 °C is 6.93, 10.92, and 8.67, respectively, while the driving mileage at −7 °C, 23 °C, and 35 °C is 162.89 km, 256.09 km, and 198.69 km, respectively. That means that the power consumption rate of the tested EV under normal temperatures is much lower than that of low and high temperatures.
To gain a better understanding of the energy consumption under different temperatures, the tested EV energy flow data were computed based on the test results and the fundamental theory of vehicle energy flow which can be found in our previous study [48]. The energy flow chart of this EV under different temperatures under a WLTC is shown in Figure 5. Generally speaking, it mainly includes the driving and braking conditions during the driving process of the EV. The energy flow statistical results in the driving and braking conditions at different temperatures are shown in Figure 6 and Figure 7, respectively. In the driving conditions, the higher the proportion of effective energy actually transferred to the axle, the more energy used to drive the whole vehicle. In Figure 6, it can be found that the proportion of axle work used to drive this vehicle at −7 °C, 23 °C, and 35 °C is 60.52% (front axle 50.62%; rear axle 9.91%), 79.23% (front axle 43%; rear axle 36.23%), and 62.05% (front axle 30.88%; rear axle 31.17%), respectively. This illustrates that the energy utilization of the EV at normal temperatures is much higher than that at low and high temperatures, which leads to higher driving mileage (see Table 3). From Figure 6, the motor and motor control unit (MCU) losses under driving conditions at −7 °C, 23 °C, and 35 °C are 17.07% (front 14.06%; rear 3.01%), 18.62% (front 10.85%; rear 7.77%), and 17.98% (front 9.61%; rear 8.37%), respectively. This means that the environmental temperature does not have much of an effect on the loss of the motor and MCU under driving conditions. From Figure 7, the proportion of front motor and MCU losses at different temperatures under braking conditions is about 19% for all instances, and there is little difference in the proportion of front motor and MCU losses at different temperatures. However, the rear motor and MCU losses under braking conditions at −7 °C are much higher than those at 23 °C and 35 °C. In addition, the front and rear PTC energy consumption at −7 °C is also much higher than that at 23 °C and 35 °C (see Figure 6 and Figure 7).
Note that the motor and MCU losses account for a large proportion under all temperatures due to copper loss, iron loss, and heat transfer loss [49,50]. From Figure 5, the heat transfer loss of the front motor and the MCU at −7 °C, 23 °C, and 35 °C is 5.24 kWh, 6.11 kWh, and 5.57 kWh, respectively, while the whole energy loss of the front motor and the MCU at −7 °C, 23 °C, and 35 °C is 10.09 kWh, 10.97 kWh, and 9.08 kWh, respectively. This means that most of the front motor and MCU losses are heat transfer losses at different temperatures, and this is the same for the rear motor and the MCU. In Figure 5, it can also be seen that the power battery pack thermal transfer loss at −7 °C is much higher than that at 23 °C and 35 °C. This is because the battery power characteristics worsen, and the charging and discharging efficiency decreases at low environment temperatures [51]. The thermal management system should improve the power battery pack temperature to ensure the good power characteristics of the battery, leading to high thermal transfer losses. Generally speaking, research on energy regeneration technology is very important. It is an effective way to improve vehicle energy utilization efficiency [52,53]. Although more regeneration energy can be recovered, this can only be achieved during the braking process [54,55]. In Figure 5 and Figure 7, the proportion of battery-recycled energy under braking conditions at 23 °C (75.84%) is much higher than that at −7 °C (53.15%) and 35 °C (62.79%). This is another reason for the higher energy utilization and the longer driving range for testing the EV at 23 °C. It should be pointed out that the compressor energy consumption accounts for a large proportion in both braking and driving conditions at 35 °C, and the proportions are 15.25% and 12.41%, respectively. However, the compressor energy consumption is basically 0 in both braking and driving conditions at −7 °C and 23 °C. That is because the compressor needs to work for a long time to guarantee the normal operation of air conditioning and decrease the temperature in the car under high environmental temperatures [56]. The other losses such as DC/DC losses, air fan consumption, front and rear blower consumption, and electric accessories consumption are very small under all environmental temperatures, and those have little effect on the energy consumption of the whole vehicle.

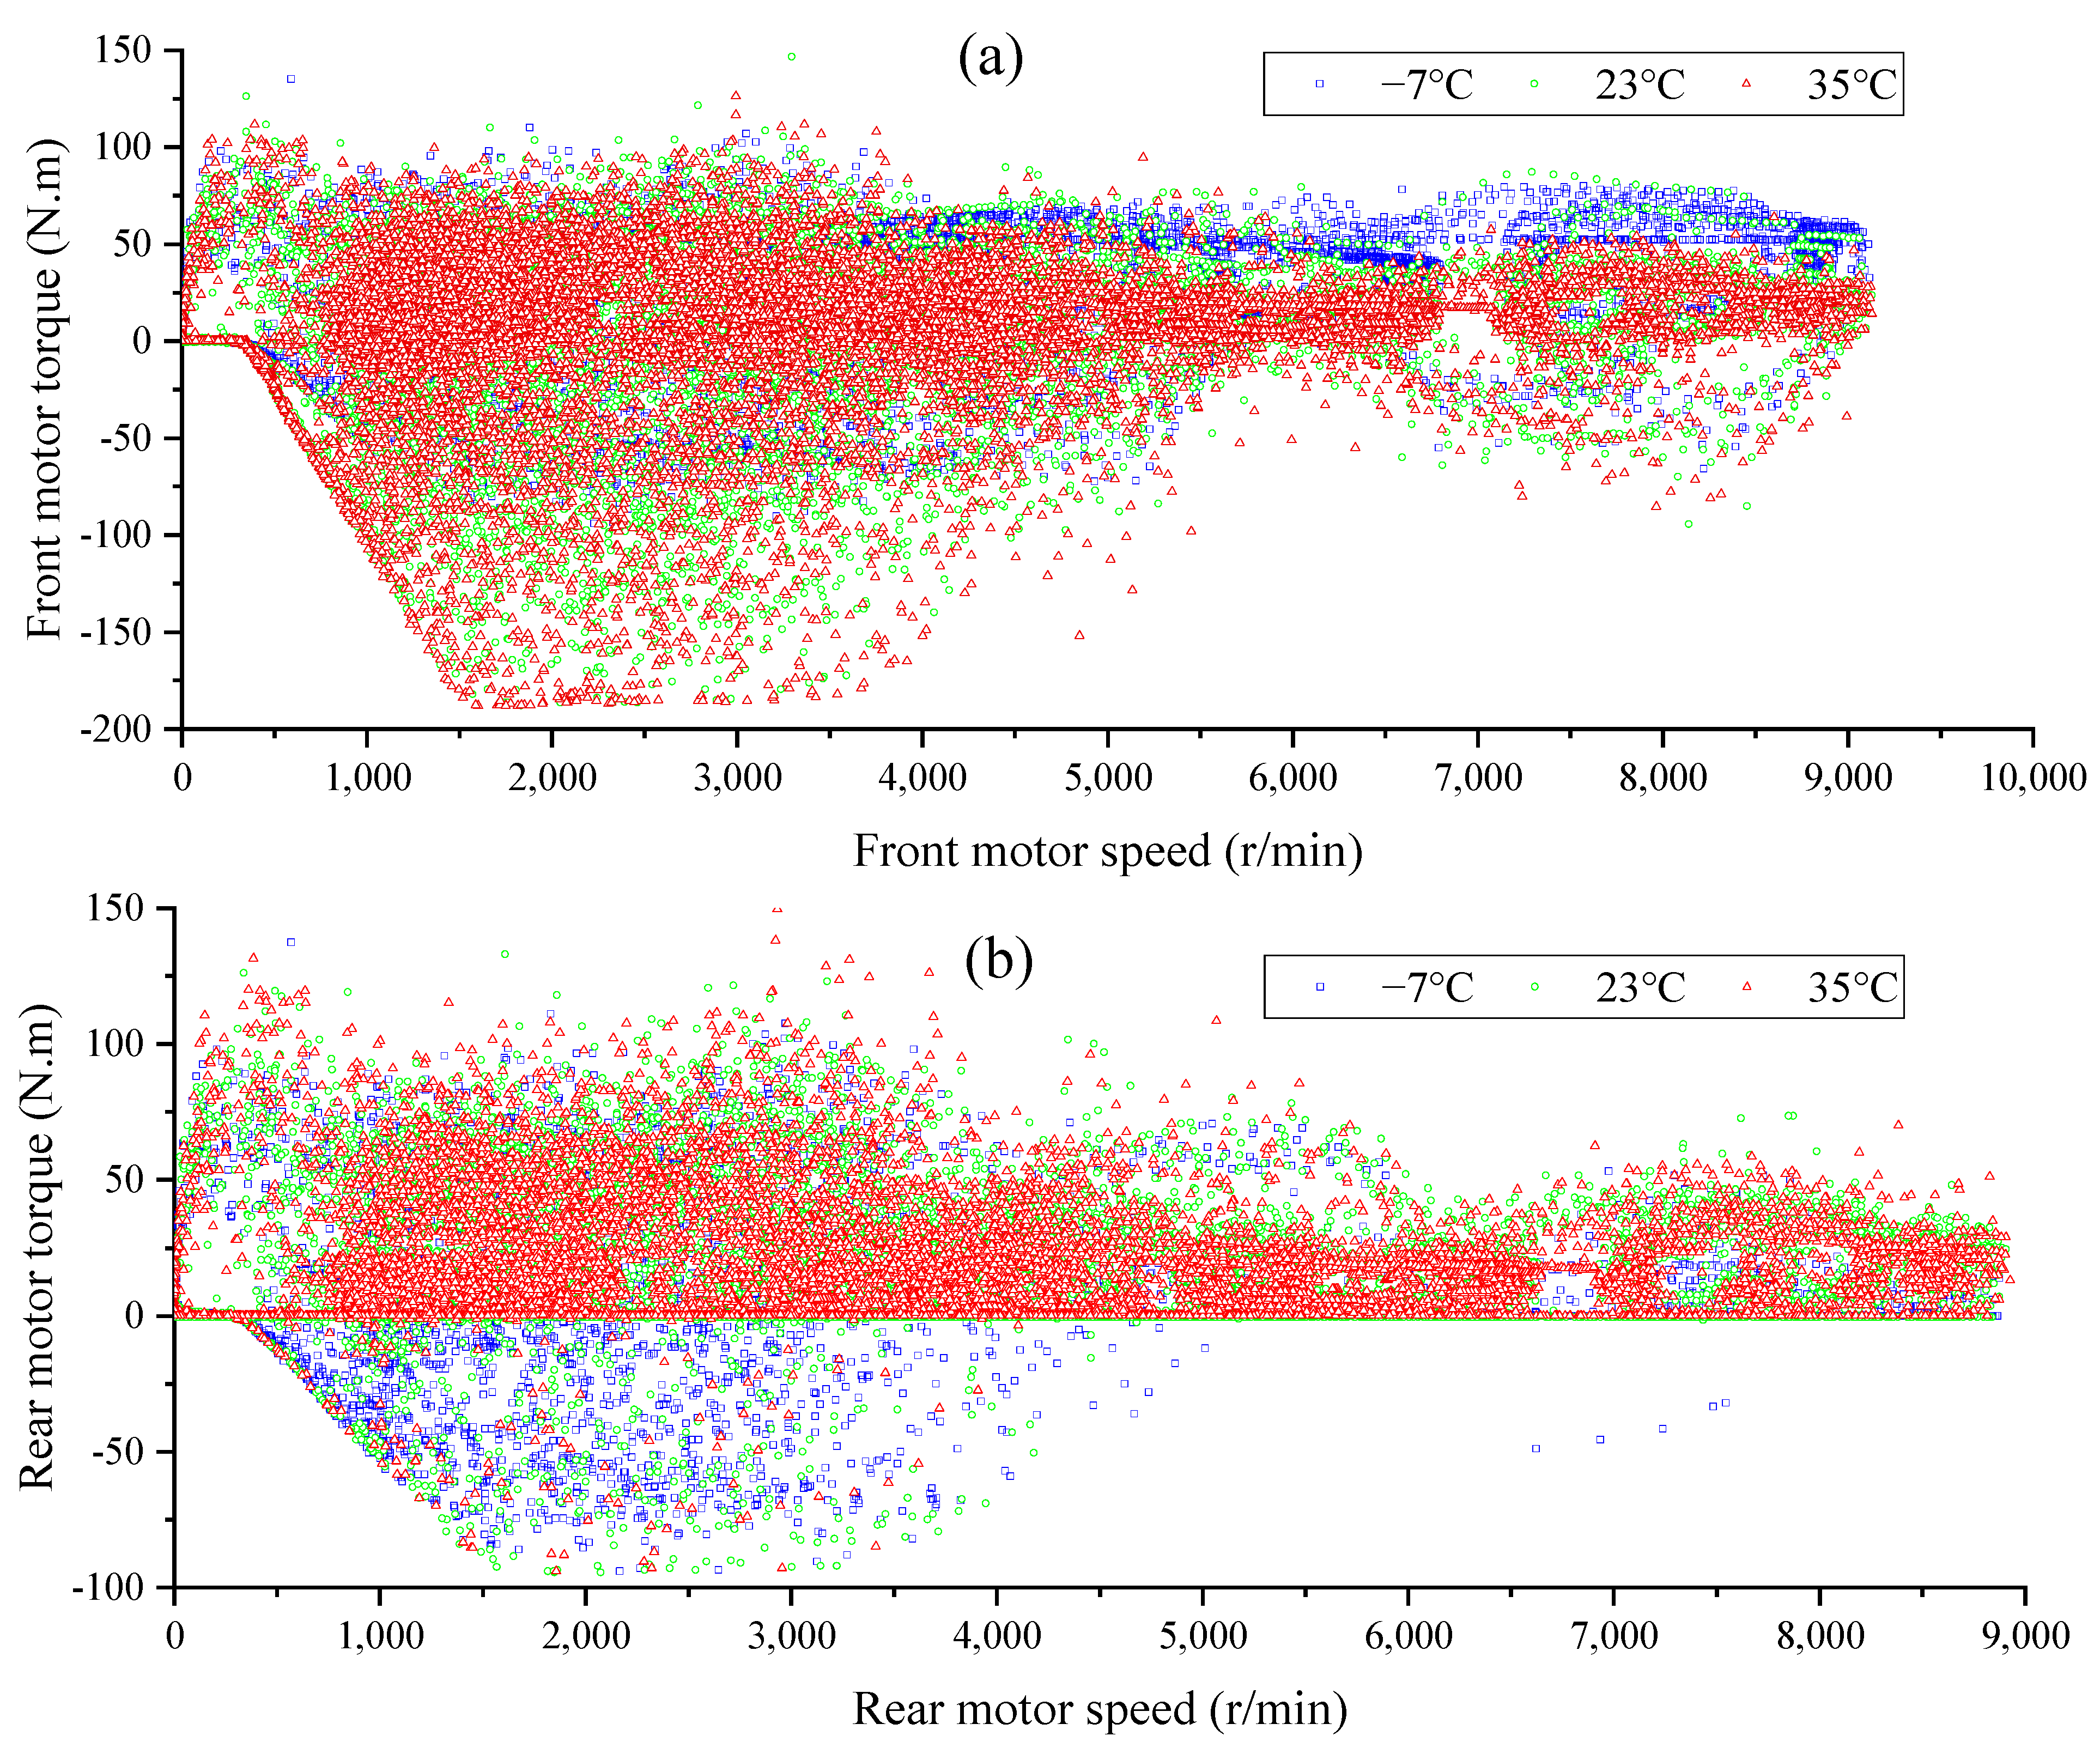
3.2. Key Component Operation Condition and Efficiency

In order to deeply understand the energy flow characteristics of this EV, the key component operation condition and efficiency under different environmental temperatures were analyzed in detail. The key component operation efficiency is also an important parameter to evaluate the energy utilization characteristics of EVs [57], and it can be obtained thought the energy flow chart (see Figure 5).
The power system and component working efficiency under different temperatures is shown in Figure 8. It can be seen that most of the power system and component working efficiencies are less than 90%, except for the retarder and charging system under all environmental temperatures. Some measures can be taken to improve the efficiency of the relevant components, especially for the motor drive assembly system, which has high energy consumption (See Figure 6 and Figure 7). On the whole, the power system and component working efficiency at 23 °C is higher than that at −7 °C and 35 °C. To some extent, this also reflects that the electric vehicle has the highest energy efficiency at 23 °C.
The main function of the power battery in EVs is to provide output power during acceleration and energy recovery during frequent braking. As is known, power batteries are mainly used for power output during acceleration and energy recovery during frequent braking in EVs [58]. In general, the SOC is one of the most significant evaluation indicators and performance parameters of batteries [59]. Accuracy of the SOC is critical to the battery management strategy [60]. The SOCs of the power battery under different environmental temperatures during the first WLTC cycle are shown in Figure 9. It can be seen that the SOC declines the fastest at −7 °C, followed by 35 °C. The main reasons for the difference in the SOC decline rate are the differences in the power demands of air conditioning, warm air PTC, and battery PTC under low and high environmental temperatures. The specific battery output power at different temperatures during the first WLTC cycle is shown in Figure 10. It can also be seen that the battery output power at 23 °C is lower than that at −7 °C and 35 °C at the same moment.
The motor working points distributions are very important to vehicle drive and energy recovery. This will have a big impact on the efficiency of battery output power and energy recovery [61]. The front and rear motor operation point distributions at different temperatures are shown in Figure 11. It is possible to see that the front motor working points under driving conditions are most widely distributed at 35 °C followed by −7 °C (Figure 11a). This indicates that the working condition at 35 °C is the most severe and leads to the lowest working efficiency (see Figure 8), while for the front motor working points under braking conditions, the motor working points at 23 °C and 35 °C are mainly in the relatively high efficiency areas, leading to higher working efficiency than that at −7 °C. The front motor working efficiency under driving conditions at −7 °C, 23 °C, and 35 °C is 84.8%, 82.5%, and 85.6%, respectively, while that under braking conditions is 82.2%, 84.5%, and 85.1%, respectively (see Figure 8). For the rear motor, the working points under driving conditions are most widely distributed at −7 °C, followed by 35 °C. In addition, the working point characteristics of the rear motor under braking conditions are similar to the front motor (see Figure 11b). The rear motor working efficiency under driving conditions at −7 °C, 23 °C, and 35 °C is 84%, 86.4%, and 85.8%, respectively, while that under braking conditions is 81.8%, 83.8%, and 85.9%, respectively (see Figure 8). Note that it can be seen that the negative torque of the front motor has a wider distribution range than that of the rear motor and the absolute value is larger, indicating that the front motor undertakes more energy recovery work (see Figure 5).

4. Conclusions

In the present study, the energy flow of a battery electric passenger vehicle under different environmental temperatures under a WLTC was experimentally examined in a climate chamber. The energy flow distribution characteristics, energy loss conditions, and key components’ operating conditions and working efficiency under different environmental temperatures are detailed and were comparatively analyzed. The main conclusions are as follows:
The environmental temperature has a profound impact on the EV’s performance and the critical components’ working conditions. The driving mileage of the tested vehicle at −7 °C, 23 °C, and 35 °C under a WLTC is 162.89 km, 256.09 km, and 198.69 km, respectively.
The proportions of axle work that drive the vehicle at −7 °C, 23 °C, and 35 °C are 60.52%, 79.23% and 62.05%, respectively. However, the environmental temperature does not have much of an effect on the loss of the motor and MCU under driving conditions, and the proportion of those losses at different temperatures are all approximately 18%. In addition, the proportion of front motor and MCU losses at different temperatures under braking conditions are all approximately 19%. However, the rear motor and MCU losses under braking conditions at −7 °C are much bigger than those at 23 °C and 35 °C.
The compressor energy consumption accounts for a large proportion in both braking and driving conditions at 35 °C, and the proportions are 15.25% and 12.41%, respectively. That is because the compressor needs to work for a long time to guarantee the normal operation of air conditioning and decrease the temperature in the car under a high environmental temperature.
The proportion of battery-recycled energy at −7 °C, 23 °C, and 35 °C under braking conditions is 53.15%, 75.84%, and 62.79%. This is another reason for the higher energy utilization and longer driving range of the tested electric vehicle at 23 °C.
The power battery pack thermal transfer loss at −7 °C is much higher than that at 23 °C and 35 °C due to the low charging and discharging efficiency and the high energy consumption required to warm up the battery at low environmental temperatures. Therefore, the SOC of the battery drops the fastest at −7 °C, followed by 35 °C, due to differences in the power demands of the air conditioning, the warm air PTC, and the battery PTC under high and low environmental temperatures. The working condition of the front motor under driving conditions at 35 °C is the most severe and leads to the lowest working efficiency. On the whole, the efficiency of the power system and the components working at 23 °C is higher than that at −7 °C and 35 °C.
Therefore, this study has sufficiently demonstrated the influence of environmental temperature on EV energy flow. The results have some guiding significance for the optimization of the energy utilization efficiency of EVs.

Author Contributions

Conceptualization, Y.O. and Y.W.; methodology, L.L.; validation, J.Y., formal analysis, R.F.; investigation, L.L.; resources, Y.O.; data curation, S.W.; writing—original draft preparation, R.F.; writing—review and editing, Z.Z.; visualization, J.Y.; supervision, Y.O.; project administration, Y.W.; funding acquisition, Z.Z. All authors have read and agreed to the published version of the manuscript.

Funding

This research is supported by the Chongqing Automotive Core Software Research and Development Project (CSTB2022TIAD-STX0005) and the Science and Technology Research Program of Chongqing Municipal Education Commission (Grant No. KJQN202201150).

Data Availability Statement

The data presented in this study are available on request from the corresponding author. The data are not publicly available due to the fact that they are Authors own measurement results.

Conflicts of Interest

The authors declare no conflict of interest.

Nomenclature

Acronyms
CANController area network
COCarbon monoxide
EVElectric vehicle
GHGGlobal greenhouse gas
HCUnburned hydrocarbon
MCUMotor control unit
NOxNitrogen oxides
PMParticulate matter
PTCPositive temperature coefficient
SOCState-of-charge
WLTCWorldwide Light duty test cycle

References

  1. Yuan, S.; Lei, W.; Liu, Q.; Liu, R.; Liu, J.; Fu, J.; Han, Y. Distribution and environmental impact of microalgae production potential under the carbon-neutral target. Energy 2022, 263, 125584. [Google Scholar] [CrossRef]
  2. Feng, R.; Hu, X.; Li, G.; Sun, Z.; Ye, M.; Deng, B. Exploration on the emissions and catalytic reactors interactions of a non-road diesel engine through experiment and system level simulation. Fuel 2023, 342, 127746. [Google Scholar] [CrossRef]
  3. Wang, H.; Zheng, T.; Sun, W.; Khan, M.Q. Research on the pricing strategy of park electric vehicle agent considering carbon trading. Appl. Energy 2023, 340, 121017. [Google Scholar] [CrossRef]
  4. Sun, X.; Xie, M.; Zhou, F.; Wu, X.; Fu, J.; Liu, J. Hierarchical evolutionary construction of neural network models for an Atkinson cycle engine with double injection strategy based on the PSO-Nadam algorithm. Fuel 2023, 333, 126531. [Google Scholar] [CrossRef]
  5. Lin, Z.; Wang, P.; Ren, S.; Zhao, D. Comprehensive impact assessment of carbon neutral pathways and air pollution control policies in Shaanxi Province of China. Resour. Conserv. Recycl. Adv. 2023, 18, 200143. [Google Scholar] [CrossRef]
  6. Shafique, M.; Luo, X. Environmental life cycle assessment of battery electric vehicles from the current and future energy mix perspective. J. Environ. Manag. 2021, 303, 114050. [Google Scholar] [CrossRef] [PubMed]
  7. European Environment Agency (EEA). Transport and Environment Statistics: Autumn 2021. Available online: https://www.gov.uk/government/statistics/transport-and-environment-statistics-autumn-2021/transport-and-environment-statistics-autumn-2021#main-findings (accessed on 19 October 2021).
  8. China Mobile Source Environmental Management Annual Report, Ministry of Ecology and Environment of the People’s Republic of China. 2022. Available online: https://www.mee.gov.cn/hjzl/sthjzk/ydyhjgl/202212/W020221207387013521948.pdf (accessed on 7 December 2022). (In Chinese)
  9. Duan, X.; Liu, Y.; Liu, J.; Lai, M.-C.; Jansons, M.; Guo, G.; Zhang, S.; Tang, Q. Experimental and numerical investigation of the effects of low-pressure, high-pressure and internal EGR configurations on the performance, combustion and emission characteristics in a hydrogen-enriched heavy-duty lean-burn natural gas SI engine. Energy Convers. Manag. 2019, 195, 1319–1333. [Google Scholar] [CrossRef]
  10. Duan, X.; Xu, L.; Jiang, P.; Lai, M.-C.; Sun, Z. Parallel perturbation analysis of combustion cycle-to-cycle variations and emissions characteristics in a natural gas spark ignition engine with comparison to consecutive cycle method. Chemosphere 2022, 308, 136334. [Google Scholar] [CrossRef]
  11. Hardman, S.; Chandan, A.; Tal, G.; Turrentine, T. The effectiveness of financial purchase incentives for battery electric vehicles—A review of the evidence. Renew. Sustain. Energy Rev. 2017, 80, 1100–1111. [Google Scholar] [CrossRef]
  12. Wu, Y.A.; Ng, A.W.; Yu, Z.; Huang, J.; Meng, K.; Dong, Z. A review of evolutionary policy incentives for sustainable development of electric vehicles in China: Strategic implications. Energy Policy 2020, 148, 111983. [Google Scholar] [CrossRef]
  13. Tang, A.; Yao, L.; Gong, P.; Jiang, Y. Lithium-ion battery state-of-charge estimation of an order-reduced physics-based model in electric vehicles considering erroneous initialization. Int. J. Energy Res. 2021, 46, 3529–3538. [Google Scholar] [CrossRef]
  14. Alabi, T.M.; Lu, L.; Yang, Z. Improved hybrid inexact optimal scheduling of virtual powerplant (VPP) for zero-carbon multi-energy system (ZCMES) incorporating Electric Vehicle (EV) multi-flexible approach. J. Clean. Prod. 2021, 326, 129294. [Google Scholar] [CrossRef]
  15. Chen, Y.; Huang, M.; Tao, Y. Density-based clustering multiple linear regression model of energy consumption for electric vehicles. Sustain. Energy Technol. Assess. 2022, 53, 102614. [Google Scholar] [CrossRef]
  16. Hasan, S. Assessment of electric vehicle repurchase intention: A survey-based study on the Norwegian EV market. Transp. Res. Interdiscip. Perspect. 2021, 11, 100439. [Google Scholar] [CrossRef]
  17. International Energy Agency (IEA). Global EV Outlook 2023. Available online: https://www.iea.org/events/global-ev-outlook-2023 (accessed on 26 April 2023).
  18. Yu, Q.; Huang, Y.; Tang, A.; Wang, C.; Shen, W. OCV-SOC-Temperature Relationship Construction and State of Charge Estimation for a Series–Parallel Lithium-Ion Battery Pack. IEEE Trans. Intell. Transp. Syst. 2023, 24, 6362–6371. [Google Scholar] [CrossRef]
  19. Chen, R.; Qian, X.W.; Miao, L.X.; Ukkusuri, S.V. Optimal charging facility location and capacity for electric vehicles considering route choice and charging time equilibrium. Comput. Oper. Res. 2020, 113, 104776. [Google Scholar] [CrossRef]
  20. Tang, A.; Wang, C.; Zhang, D.; Zhang, K.; Zhou, Y.; Zhang, Z. A multi-model real covariance-based battery state-of-charge fusion estimation method for electric vehicles using ordered weighted averaging operator. Int. J. Energy Res. 2022, 46, 17273–17284. [Google Scholar] [CrossRef]
  21. Ma, Y.; Ding, H.; Liu, Y.; Gao, J. Battery thermal management of intelligent-connected electric vehicles at low temperature based on NMPC. Energy 2021, 244, 122571. [Google Scholar] [CrossRef]
  22. Xia, G.; Cao, L.; Bi, G. A review on battery thermal management in electric vehicle application. J. Power Sources 2017, 367, 90–105. [Google Scholar] [CrossRef]
  23. Huang, D.; Chen, Z.; Zhou, S. Model prediction-based battery-powered heating method for series-connected lithium-ion battery pack working at extremely cold temperatures. Energy 2020, 216, 119236. [Google Scholar] [CrossRef]
  24. Petzl, M.; Kasper, M.; Danzer, M.A. Lithium plating in a commercial lithium-ion battery—A low-temperature aging study. J. Power Sources 2015, 275, 799–807. [Google Scholar] [CrossRef]
  25. Li, W.; Liu, Y.; Liu, R.; Wang, D.; Shi, J.; Yu, Z.; Cheng, L.; Chen, J. Performance evaluation of secondary loop low-temperature heat pump system for frost prevention in electric vehicles. Appl. Therm. Eng. 2020, 182, 115615. [Google Scholar] [CrossRef]
  26. Park, M.H.; Kim, S.C. Heating Performance Enhancement of High Capacity PTC Heater with Modified Louver Fin for Electric Vehicles. Energies 2019, 12, 2900. [Google Scholar] [CrossRef] [Green Version]
  27. Kebede, M.A.; Phasha, M.J.; Kunjuzwa, N.; le Roux, L.J.; Mkhonto, D.; Ozoemena, K.I.; Mathe, M.K. Structural and electrochemical properties of aluminium doped LiMn2O4 cathode materials for Li battery: Experimental and ab initio calculations. Sustain. Energy Technol. Assess. 2014, 5, 44–49. [Google Scholar] [CrossRef]
  28. Panchal, S.; Dincer, I.; Agelin-Chaab, M.; Fraser, R.; Fowler, M. Experimental temperature distributions in a prismatic lithium-ion battery at varying conditions. Int. Commun. Heat Mass Transf. 2015, 71, 35–43. [Google Scholar] [CrossRef]
  29. Al-Wreikat, Y.; Serrano, C.; Sodré, J.R. Effects of ambient temperature and trip characteristics on the energy consumption of an electric vehicle. Energy 2022, 238, 122028. [Google Scholar] [CrossRef]
  30. Han, S.; Tagayi, R.K.; Kim, J.; Kim, J. Adaptive deterministic approach for optimized sizing of high-energy battery system applied in electric-powered application. Appl. Energy 2022, 309, 118498. [Google Scholar] [CrossRef]
  31. Li, S.; Xu, L.; Du, X.; Wang, N.; Lin, F.; Abdelkareem, M.A. Combined single-pedal and low adhesion control systems for enhanced energy regeneration in electric vehicles: Modeling, simulation, and on-field test. Energy 2023, 269, 126982. [Google Scholar] [CrossRef]
  32. Pan, C.; Tao, Y.; Liu, Q.; He, Z.; Liang, J.; Zhou, W.; Wang, L. Grey wolf fuzzy optimal energy management for electric vehicles based on driving condition prediction. J. Energy Storage 2021, 44, 103398. [Google Scholar] [CrossRef]
  33. Yadlapalli, R.T.; Kotapati, A.; Kandipati, R.; Koritala, C.S. A review on energy efficient technologies for electric vehicle applications. J. Energy Storage 2022, 50, 104212. [Google Scholar] [CrossRef]
  34. Lai, C.; Shan, S.; Feng, S.; Chen, Y.; Zeng, J.; Song, J.; Fu, L. Numerical investigations on heat transfer enhancement and energy flow distribution for interlayer battery thermal management system using Tesla-valve mini-channel cooling. Energy Convers. Manag. 2023, 280, 116812. [Google Scholar] [CrossRef]
  35. Sun, X.; Fu, J.; Yang, H.; Xie, M.; Liu, J. An energy management strategy for plug-in hybrid electric vehicles based on deep learning and improved model predictive control. Energy 2023, 269, 126772. [Google Scholar] [CrossRef]
  36. Dong, H.; Fu, J.; Zhao, Z.; Liu, Q.; Li, Y.; Liu, J. A comparative study on the energy flow of a conventional gasoline-powered vehicle and a new dual clutch parallel-series plug-in hybrid electric vehicle under NEDC. Energy Convers. Manag. 2020, 218, 113019. [Google Scholar] [CrossRef]
  37. Zhu, G.; Zhen, D.; Chen, W.; Zuo, Q.; Zhao, M.; Wang, Y.; Chen, Z.; Yang, J. Experimental study on the engine energy flow of a heavy-duty vehicle under C-WTVC. Energy Rep. 2022, 8, 4430–4442. [Google Scholar] [CrossRef]
  38. Li, M.; Xu, H.; Li, W.; Liu, Y.; Li, F.; Hu, Y.; Liu, L. The structure and control method of hybrid power source for electric vehicle. Energy 2016, 112, 1273–1285. [Google Scholar] [CrossRef]
  39. Danko, M.; Hanko, B.; Drgoňa, P. Optimized Control of Energy Flow in an Electric Vehicle based on GPS. Commun. Sci. Lett. Univ. Zilina 2021, 23, C7–C14. [Google Scholar] [CrossRef]
  40. Merhy, G.; Nait-Sidi-Moh, A.; Moubayed, N. A multi-objective optimization of electric vehicles energy flows: The charging process. Ann. Oper. Res. 2020, 296, 315–333. [Google Scholar] [CrossRef]
  41. Schulz-Mönninghoff, M.; Bey, N.; Nørregaard, P.U.; Niero, M. Integration of energy flow modelling in life cycle assessment of electric vehicle battery repurposing: Evaluation of multi-use cases and comparison of circular business models. Resour. Conserv. Recycl. 2021, 174, 105773. [Google Scholar] [CrossRef]
  42. Bobba, S.; Mathieux, F.; Ardente, F.; Blengini, G.A.; Cusenza, M.A.; Podias, A.; Pfrang, A. Life Cycle Assessment of repurposed electric vehicle batteries: An adapted method based on modelling energy flows. J. Energy Storage 2018, 19, 213–225. [Google Scholar] [CrossRef]
  43. Xie, Y.; Li, Y.; Zhao, Z.; Dong, H.; Wang, S.; Liu, J.; Guan, J.; Duan, X. Microsimulation of electric vehicle energy consumption and driving range. Appl. Energy 2020, 267, 115081. [Google Scholar] [CrossRef]
  44. Miri, I.; Fotouhi, A.; Ewin, N. Electric vehicle energy consumption modelling and estimation—A case study. Int. J. Energy Res. 2020, 45, 501–520. [Google Scholar] [CrossRef]
  45. Qiu, C.; Wang, G. New evaluation methodology of regenerative braking contribution to energy efficiency improvement of electric vehicles. Energy Convers. Manag. 2016, 119, 389–398. [Google Scholar] [CrossRef]
  46. Apostolaki-Iosifidou, E.; Codani, P.; Kempton, W. Measurement of power loss during electric vehicle charging and discharging. Energy 2017, 127, 730–742. [Google Scholar] [CrossRef]
  47. GB/T 19233-2020; Measurement Methods of Fuel Consumption for Light-Duty Vehicles. China Standardization Administration. Available online: http://www.gb688.cn/bzgk/gb/newGbInfo?hcno=2CBFC784D82DE14831CB72365B961610 (accessed on 2 June 2020).
  48. Feng, R.; Chen, K.; Sun, Z.; Hu, X.; Li, G.; Wang, S.; Deng, B.; Sun, W. A comparative study on the energy flow of a hybrid heavy truck between AMT and MT shift mode under local driving test cycle. Energy Convers. Manag. 2022, 256, 115359. [Google Scholar] [CrossRef]
  49. Yu, J.; Ma, Y.; Yu, H.; Lin, C. Adaptive fuzzy dynamic surface control for induction motors with iron losses in electric vehicle drive systems via backstepping. Inf. Sci. 2017, 376, 172–189. [Google Scholar] [CrossRef]
  50. Guo, Q.; Zhang, C.; Li, L.; Zhang, J.; Wang, M. Design and Implementation of a Loss Optimization Control for Electric Vehicle In-Wheel Permanent-Magnet Synchronous Motor Direct Drive System. Energy Procedia 2017, 105, 2253–2259. [Google Scholar] [CrossRef]
  51. Tang, A.; Gong, P.; Huang, Y.; Wu, X.; Yu, Q. Research on pulse charging current of lithium-ion batteries for electric vehicles in low-temperature environment. Energy Rep. 2023, 9, 1447–1457. [Google Scholar] [CrossRef]
  52. Yu, W.; Wang, R.; Zhou, R. A Comparative Research on the Energy Recovery Potential of Different Vehicle Energy Regeneration Technologies. Energy Procedia 2019, 158, 2543–2548. [Google Scholar] [CrossRef]
  53. Erhan, K.; Özdemir, E. Prototype production and comparative analysis of high-speed flywheel energy storage systems during regenerative braking in hybrid and electric vehicles. J. Energy Storage 2021, 43, 103237. [Google Scholar] [CrossRef]
  54. Al-Wreikat, Y.; Serrano, C.; Sodré, J.R. Driving behaviour and trip condition effects on the energy consumption of an electric vehicle under real-world driving. Appl. Energy 2021, 297, 117096. [Google Scholar] [CrossRef]
  55. Hamada, A.T.; Orhan, M.F. An overview of regenerative braking systems. J. Energy Storage 2022, 52, 105033. [Google Scholar] [CrossRef]
  56. Wang, F.; Wu, W.; Zhu, Q.; Li, K.; Zhang, H. Experimental study of electronic expansion valve opening on the performance of electric vehicle heat pump system at different compressor speeds. Int. J. Refrig. 2023, 149, 94–104. [Google Scholar] [CrossRef]
  57. Kwon, K.; Lee, J.-H.; Lim, S.-K. Optimization of multi-speed transmission for electric vehicles based on electrical and mechanical efficiency analysis. Appl. Energy 2023, 342, 121203. [Google Scholar] [CrossRef]
  58. Atangulova, A.; Komshilov, K.; Sennikova, A.; Barbashov, N.; Shanygin, S.; Lobacheva, E. Method for Recovery of Vehicle Braking Energy with Electric Drive Powered by DC Network and Device for Its Implementation. Transp. Res. Procedia 2023, 68, 967–972. [Google Scholar] [CrossRef]
  59. Yan, D.; Lu, L.; Li, Z.; Feng, X.; Ouyang, M.; Jiang, F. Durability comparison of four different types of high-power batteries in HEV and their degradation mechanism analysis. Appl. Energy 2016, 179, 1123–1130. [Google Scholar] [CrossRef]
  60. Snoussi, J.; Ben Elghali, S.; Zerrougui, M.; Bensoam, M.; Benbouzid, M.; Mimouni, M.F. Unknown input observer design for lithium-ion batteries SOC estimation based on a differential-algebraic model. J. Energy Storage 2020, 32, 101973. [Google Scholar] [CrossRef]
  61. Wei, D.; He, H.; Cao, J. Hybrid electric vehicle electric motors for optimum energy efficiency: A computationally efficient design. Energy 2020, 203, 117779. [Google Scholar] [CrossRef]
Figure 1. The energy flow experimental set-up: (left) the physical photo and (right) the schematic diagram.
Energies 16 05253 g001
Figure 2. Schematic of the sensor layout scheme of the in-vehicle power transmission system.
Energies 16 05253 g002
Figure 3. Schematic of the sensor layout scheme in vehicle thermal management system.
Energies 16 05253 g003
Figure 4. Vehicle speed profile of the WLTC.
Energies 16 05253 g004
Figure 5. The electric vehicle energy flow chart at different temperatures under a WLTC.
Energies 16 05253 g005
Figure 6. The proportion of energy consumption under driving state in a WLTC.
Energies 16 05253 g006
Figure 7. The proportion of energy consumption under braking state in a WLTC.
Energies 16 05253 g007
Figure 8. Power system and component working efficiency under different temperatures.
Energies 16 05253 g008
Figure 9. SOC of the power battery at different temperatures during the first WLTC cycle.
Energies 16 05253 g009
Figure 10. Battery output power at different temperatures during the first WLTC cycle.
Energies 16 05253 g010
Figure 11. Distribution of motor working points at different temperatures: (a) front motor and (b) rear motor.
Energies 16 05253 g011
Table 1. Specifications of the vehicle, motor, and power battery.
ComponentItemContent
VehicleTypeFive-door and five-seat passenger car
Mass (kg)2440
Wheelbase (mm)2965
Drive modeElectric four-wheel drive
Rolling radius (m)0.508
Transmission typeSingle-speed transmission
Transmission ratio9.2
Maximum speed (km/h)210
MotorTypeAlternating current asynchronous motor
Peak power (kW)386
Peak torque (N·m)660
High-voltage batteryTypeTernary lithium battery
Battery capacity (kW·h)60
Rated voltage (V)400
Table 2. Specifications of the main test equipment.
Equipment NameManufacturer/TypeMeasurement RangePrecision
Chassis dynamometerHoriba VULCAN EMS-CD48L/≤±0.005% FS
Torque sensorKistler 4503B0–5000 N·m≤±0.05% FS
Current sensorLEM IT65-S±60 A0.03%
SENADC-301±300 A0.03%
HIOKI CT6845-050–500 A0.03%
Voltage sensorLEM CV 3-10000–700 V0.2%
LEM CV3-100/SP30–200 V0.03%
Pressure sensorMPM4120-30–3 bar0.2%
Temperature sensorOmega TT-K-24-5.0M−100–260 °CⅠ Grade
Flow meterDM TF-104.5–60 L/min≤±0.05% FS
DM TF4-80–12 L/min≤±0.05% FS
Power analyzerHIOKI PW60011500 V/300 A≤±0.1% FS
Data acquisition systemHBM-Quantum X MX840B (100 channels)//
Table 3. Overall results at different temperatures.
Item−7 °C23 °C35 °C
Driving mileage (km)162.89256.09198.69
Charging capacity (kWh)65.266.167.4
Power consumption rate
(kWh/100 km)
40.0325.8133.92
Duration of test (s)12,46919,65415,599
WLTC cycle number (-)6.9310.928.67
Disclaimer/Publisher’s Note: The statements, opinions and data contained in all publications are solely those of the individual author(s) and contributor(s) and not of MDPI and/or the editor(s). MDPI and/or the editor(s) disclaim responsibility for any injury to people or property resulting from any ideas, methods, instructions or products referred to in the content.

