Article

Experimental Validation of Damping Adjustment Method with Generator Parameter Study for Wave Energy Conversion

1
Department of Mechanical Engineering, College of Engineering, Universidad del Bío-Bío, 4051381 Collao Avenue, Concepción 1202, Chile
2
Department of Electric and Electronic Engineering, College of Engineering, Universidad del Bío-Bío, 4051381 Collao Avenue, Concepción 1202, Chile
*
Author to whom correspondence should be addressed.
Energies 2023, 16(14), 5298; https://doi.org/10.3390/en16145298
Submission received: 1 June 2023 / Revised: 30 June 2023 / Accepted: 6 July 2023 / Published: 11 July 2023

Abstract

:
Effective control strategies are essential for optimizing wave energy production. While theoretical studies have explored various control approaches, experimental validation of these methods remains limited. This study proposes a damping adjustment method as a means to enable the experimental application of resistive control in wave energy systems. The system’s damping is adjusted through a variable electrical resistance coupled to the generator. A mathematical model is developed to capture the interaction between the wave energy converter, generator, and variable resistance. Experimental validation demonstrates a good fit between the experimental results and the mathematical model. Four different DC machines acting as generators are tested to evaluate the influence of the model’s parameters on control capability. Results indicate that DC machines with less internal resistance allow a wider range of damping and power adjustment by using external resistance. The proposed method shows promising results, emphasizing the significance of the DC machine parameters in achieving effective control over system variables. These findings contribute to the development of efficient and reliable control strategies for enhancing wave energy production at small scales.

1. Introduction

Wave energy is one of the main sources of energy on Earth, with a global potential estimated to be between 1 and 10 TW [1,2], and the general consensus is that the amount of available ocean wave energy is capable of contributing significantly to the energy needs of different countries [3]. However, its commercial use compared to other renewable energy sources such as solar and wind energy is still low, mainly due to operational, techno-economic, and maintenance issues [4]; therefore, reducing the cost of wave energy converters (WECs) is key to advancing the technology, with the costs associated with the device structure presenting the greatest potential for achieving this reduction [5]. Then, regardless of the chosen design, a control strategy is essential for optimal operation of the device over time in order to maximize the absorbed power of the WEC [6]. Many strategies have been investigated to improve the energy conversion efficiency [7], which is a key indicator for evaluating the performance of a WEC [8]. Some of the most studied control strategies for WEC systems are resistive, reactive, latching, and model predictive control (MPC) [9,10]. A comprehensive review of the different control strategies implemented in wave energy can be found in [9].
Resistive control (also referred to as passive control or damping control) considers the power take-off (PTO) force to be proportional to the speed of the device, so it only requires manipulating the damping of the PTO, and does not involve reactive power flow or prediction of the future wave behaviour [9,11,12]. In fact, this control strategy is usually found in the demonstrators or pre-commercial wave energy converters [9].
Control techniques can be implemented on the mechanical or electrical mechanism side, focusing on controlling parameters that influence the power generation of WECs, and can be conducted on different components of a PTO system [8].
In order to adjust the PTO damping in the resistive control approach, different techniques have been studied. These techniques are very dependent on the type of PTO studied, for example, for hydraulic PTO the damping adjustment can be performed by modifying the hydraulic motor displacement as in [13], or the rectifying valve position as shown in [14]. For systems that use a turbine for the PTO, the control can be achieved by modifying the blade angle [15]. For Linear Permanent-Magnet Generators (LPMG), the PTO force, i.e., the electromagnetic force on the translator, can be controlled by controlling the power or the current drawn from the coils to achieve the desired dynamic interaction between the primary capture system and the generator system to optimize the power extraction [8]. In 2007, Stalberg et al. demonstrated that for an LPMG, the hydrodynamic behaviour of the point absorber depends, to a large extent, on the damping of the generator and that the damping, in turn, can be controlled remotely by changing the load resistance [16].
The authors in [17] perform a theoretical and numerical study for a point absorber by coupling to the system a device named tuned inertial mass (TIM), modelling the obtained system as having two degrees of freedom, consisting of an inertial rotational mass coupled to the generator axis and a tuning spring between the device and the just-mentioned mass. For a resonant state, it was found that adjusting the rotational inertial mass generates an increase in the power generated, because it is coupled to the axis of the same, while in a non-resonant state this has no effect, as only an optimal value of the spring stiffness is used.
The same authors in [18] experimentally validate the device using a scale model on a wave bank with regular wave inputs. The generator is a three-phase permanent-magnet synchronous generator, connected to three resistive loads in a star configuration, with resistance optimized to increase the absorbed power by varying its value in a range of 4–15 ohms with a 1 ohm increment for each wave input of different dominant periods, noting that the optimum value of the resistance depends on the input wave.
Finally, in [19], the authors numerically evaluate two control strategies named Static Admittance Control (SA) and Performance-Guaranteed Control (PG) [20] for a two-body WEC with the TIM system and the conventional device, in which the generator current value is modified by adjusting its admittance. A numerical simulation is performed using the WAMIT software, concluding that the new WEC outperforms the previous one using both controls, with better performance for the PG control
Other authors in [21] theoretically analyze a WEC consisting of a two-body system; the upper body oscillates due to wave forces, and the second body undergoes forced oscillation due to the motion of the first body. They mathematically relate the hydrodynamic variables with the electrical variables of a linear generator, obtaining an expression for the absorbed power. Finally, it was demonstrated that the system’s efficiency and absorbed power are sensitive to wave height, resistive load, and system stiffness.
In [22], the authors perform real-time Nonlinear Model Predictive Control (NMPC) for a laboratory-scale dual coaxial cylinder WEC connected to an LPMG, which finds the optimal damping that maximizes the absorbed power by changing the value of a resistive load connected to the stator of the generator by using a solid-state relay.
It has been observed that there are various studies in which the absorbed power of the PTO system is optimized by control strategies that modify the electrical variables, and it is already known that the load resistance can modify the damping of the system.
However, only a couple of the previous works have experimental validations, mostly on large wave channels and using a single LPMG without focusing on how the characteristics of the generator affect the regulation capacity of the system dynamics. Additionally, it is important to highlight that, in wave energy converter design, it is highly recommended to start the design process with small-scale devices and increase the scale gradually. One challenge faced at small scales is the difficulty to study control strategies because most of the proposed PTO systems have high losses at small scales in relation with the control forces.
Therefore, the aim of this paper is to study theoretically and experimentally how the PTO damping and consequently the generated power can be modified by varying a resistance load connected to the DC machine of a small-scale wave energy converter and how the characteristics of this machine affect the regulation capacity of the system dynamics.

2. Experimental Setup

2.1. Wave Channel

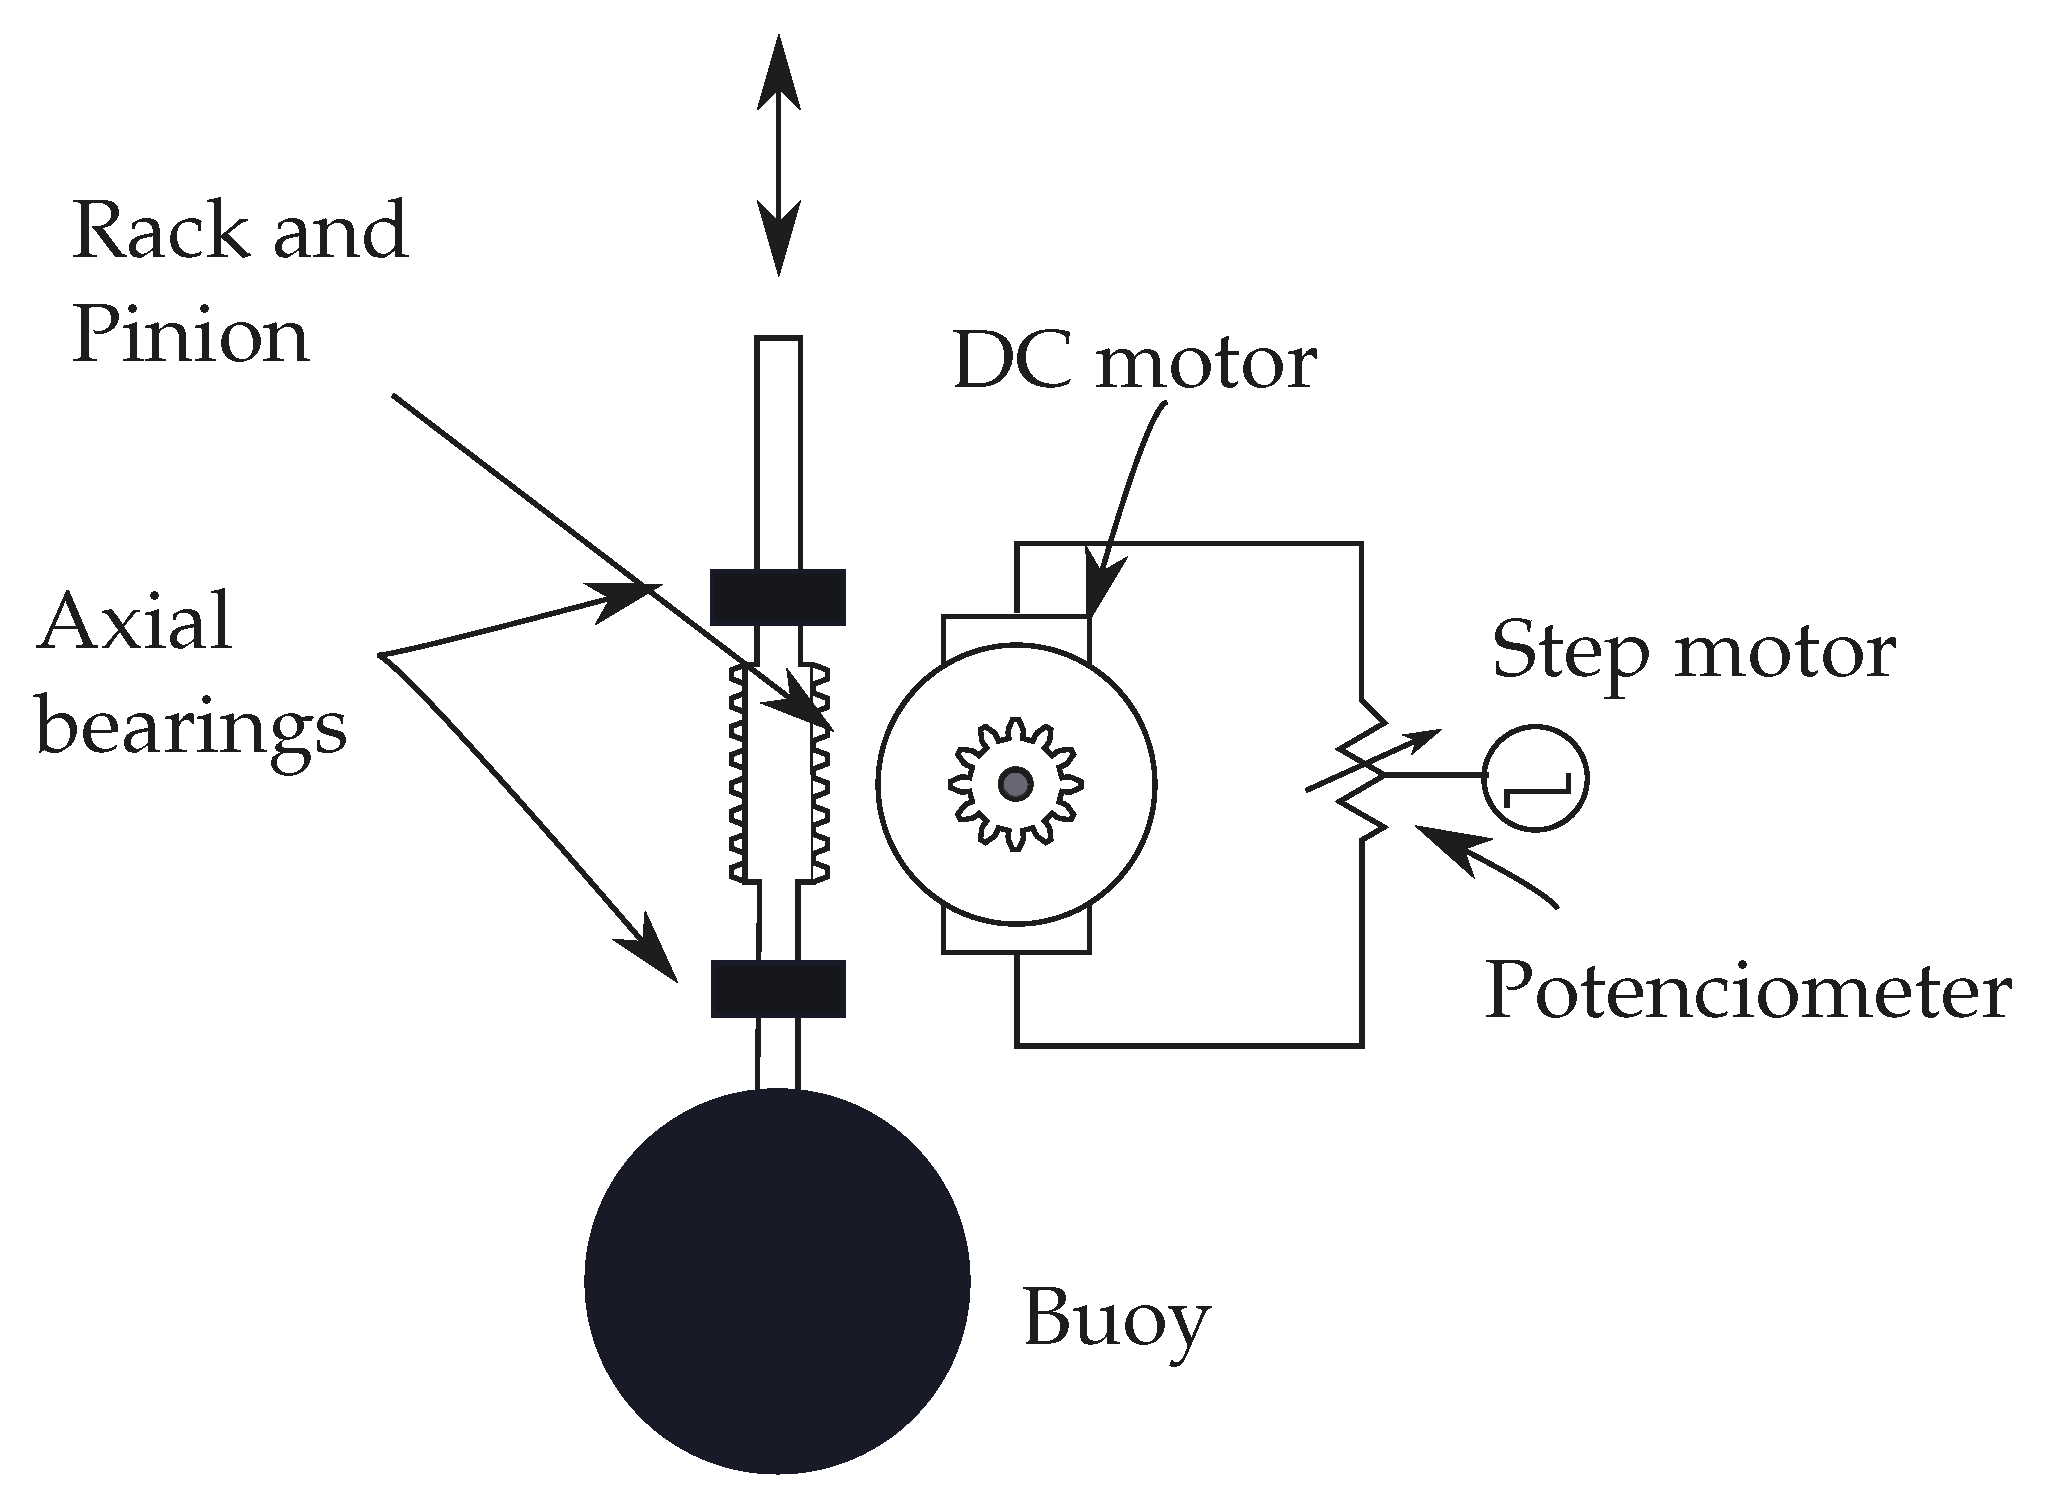
Figure 1 depicts a schematic view of the experimental test rig [23]. It consists of a single-direction wave channel, with a generation zone at the beginning (hinged paddle and absorption zone) and a final absorption zone to avoid reflections. At a distance L d from the generation zone a buoy is placed. This buoy represents the point absorber wave energy converter (PA-WEC), which consists of a spherical buoy of diameter D b , printed with a 3D printer using PLA filament connected to an aluminium vertical shaft of 20 mm in diameter, restricted to heave motion by two axial bearings. A picture of the laboratory wave energy converter is depicted in Figure 2. The power take-off (PTO) system consists of a direct mechanical drive system using a rack and pinion system connected to a DC electrical machine. DC machines were selected in this work for their simplicity in modelling and controlling. The PA-WEC and PTO are represented in Figure 3. The main dimensions of the wave channel and PA-WEC are shown in Figure 1 and Table 1.
The motion of the (PA-WEC) is measured using a laser displacement sensor and the wave surface elevation is measured by a resistive-type wave gauge placed up-wave of the PA-WEC. The voltage and current of the DC machine are also measured using an oscilloscope. These four variables are transferred to the computer by a National Instrument I/O board DAQ NI PCI 6221. A load resistance R L is connected to the terminal of the DC machine, and such a resistance is adjusted by using a potentiometer, the angular position of which is controlled by a step motor.
The control of wave frequency ω is carried out by means of a variable frequency drive connected to a gear reduction box with a transmission ratio of 0.4 between the motor shaft and the wave generator system.

2.2. Electric DC Machines

Four different electric DC machines are studied. Each one is characterized experimentally using a KEYSIGHT oscilloscope model DSOX2024A, with which the electric current circulating in the DC machine is measured when a voltage is applied with an external source whose value varies in a different range for each one, in order to obtain an average value of the results. The main characteristics of these DC machines are listed in Table 2.

3. Mathematical Formulation

The mathematical model consists of the coupling between the hydrodynamic model of the WEC and the electric model of the motor with the external adjustable resistance connected to the motor.

3.1. Hydrodynamic Model

In order to obtain the hydrodynamic response of the floating body to different waves, a Linear Potential Theory (LPT)-based model is solved by using the Boundary Element Method (BEM) through the software Ansys AQWA. This is a numerical analysis software for the hydrodynamic study of floating and fixed structures. The fluid–structure interaction is modelled based on the potential flow theory, which considers the ideal working fluid, i.e., incompressible, non-viscous, and irrotational. Under these conditions, the water velocity u can be expressed in terms of the scalar function named velocity potential Φ , whihc must satisfy (1) known as Laplace’s equation [24].
2 Φ = 0
The laboratory PA-WEC is represented by a one-degree-of-freedom system. The mathematical model to represent the dynamics of the PA-WEC is based on the most common approach for hydrodynamics models named the Cummins equation. Derived in 1962 [25], the Cummins equation for a body of mass m and no forward speed and considering an ideal fluid can be written as
( m + A ( ω ) ) z ¨ + D r ( ω ) z ˙ + S z = F e x c ( ω ) F P T O ,
where A is the added mass, D r is the radiation damping coefficient, S the stiffness of the hydrostatic restoring force, F e x c is the excitation force, and F P T O is the vertical force due to the power take-off mechanism. It is observed that the hydrodynamic parameters A, D r , and F e x c are variables that depend on the frequency of the incident wave on the device, denoted as ω . This frequency can vary throughout an experiment if working with irregular waves or remain constant if working with regular waves, i.e., waves with a constant period and amplitude.
The hydrodynamic coefficients A, D r , F e x c , and S were obtained from Ansys AQWA solver and are depicted in Table 3, where it can be observed that the added mass and excitation force divided by the wave amplitude ( H s ) exhibit a linearly decreasing behaviour as the wave frequency increases, while the radiation damping remains approximately constant. The obtained value for the stiffness of the system is K G = 349.21 N/m.

3.2. Electric Motor Model

The DC machine armature voltage v a can be represented as shown in (3).
t e = k m θ ˙ = L a d i a d t + R a i a ,
where i a is the armature current. The torque of the motor t e can be written in terms of the electrical properties or in terms of the mechanical properties as
t P T O = J θ ¨ + D θ ˙ + k m i a ,
where J is the motor angular inertia, D is the viscus friction coefficient, and t P T O is the torque from the WEC.
Assuming a perfect transmission from the rack–pinion system, the power take-off torque ( t P T O ) from the motor can be written as
t P T O = F P T O r ,
where r is the pinion radius.

3.3. Controllable System Using Variable Resistor

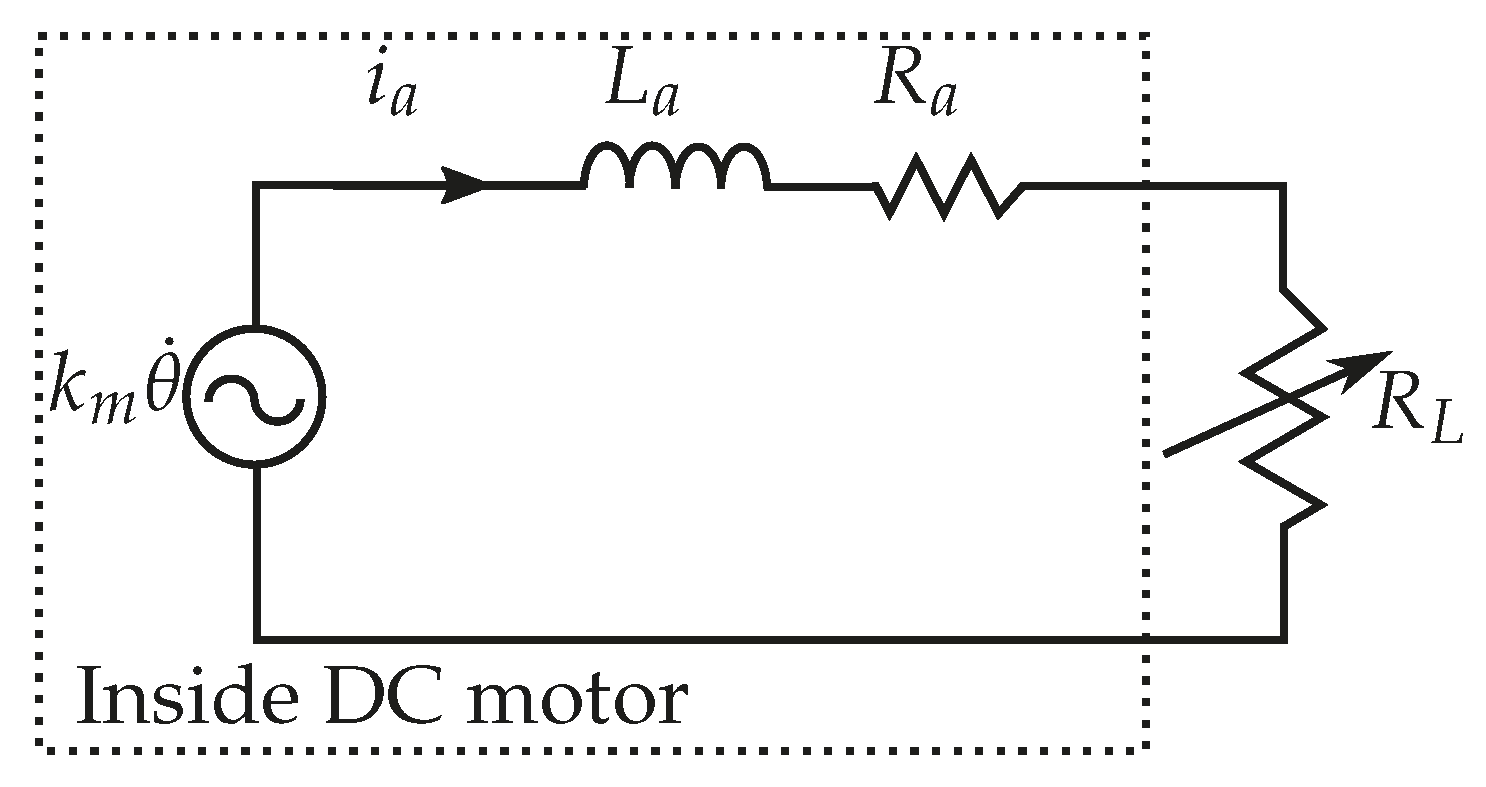
In the present work, a controllable WEC is proposed based on a variable resistor. The schematic representation of this system connected to the DC machine is shown in Figure 4.
Equation (3) can be modified to include the variable resistance R L that depends on the input signal u, where the new equation is
k m θ ˙ = L a d i a d t + R a i a + R L ( u ) i a ,
Neglecting d i a d t because it has a much faster dynamic compared with the rest of the system, the current i a from Equation (6) can be written as
i a = k m R a + R L ( u ) θ ˙ ,
where the current is only related to the resistance (internal and external) and the motor rotating speed.

3.4. Coupling Hydrodynamic and Electric

If Equations (2), (4), and (6) are combined and the relations between linear and angular dynamics are transformed according to z = r θ , z ˙ = r θ ˙ , and z ¨ = r θ ¨ , we can identify the following equation:
( m + A ( ω ) ) z ¨ + D r ( ω ) z ˙ + S z = F e x c ( ω ) 1 / r J θ ¨ + D θ ˙ + k m i a
Adding the definition obtained in (7), Equation (9) can be obtained.
( m + A ( ω ) + J r 2 ) z ¨ + ( D r ( ω ) + D r 2 + 1 r 2 ( k m ) 2 R a + R L ( u ) ) z ˙ + ( S ) z = F e x c ( ω )
Defining the new global variables M G , D G , K G , and F G as
M G ( ω ) = m + A ( ω ) + J / r 2
D G ( ω , u ) = D r ( ω ) + D / r 2 + 1 r 2 ( k m ) 2 R a + R L ( u )
K G = S
F G ( ω ) = F e x c ( ω )
it is possible to represent Equation (14) as
M G ( ω ) z ¨ + D G ( ω , u ) z ˙ + K G z = F G ( ω )
The generated electrical power is obtained from Equation (15).
P e = D P T O z ˙ 2
where the velocity of the WEC is derived from Equation (14) and the PTO damping D P T O is defined according to
D P T O = 1 r 2 ( k m ) 2 R a + R L ( u )

4. Experimental Procedure

Due to the fact that the damping cannot be measured directly, the mathematical model is compared with experiments by using the generated power. To observe the influence of the variable external resistance R L and the DC machine parameters on the absorbed power, the following procedure is followed:
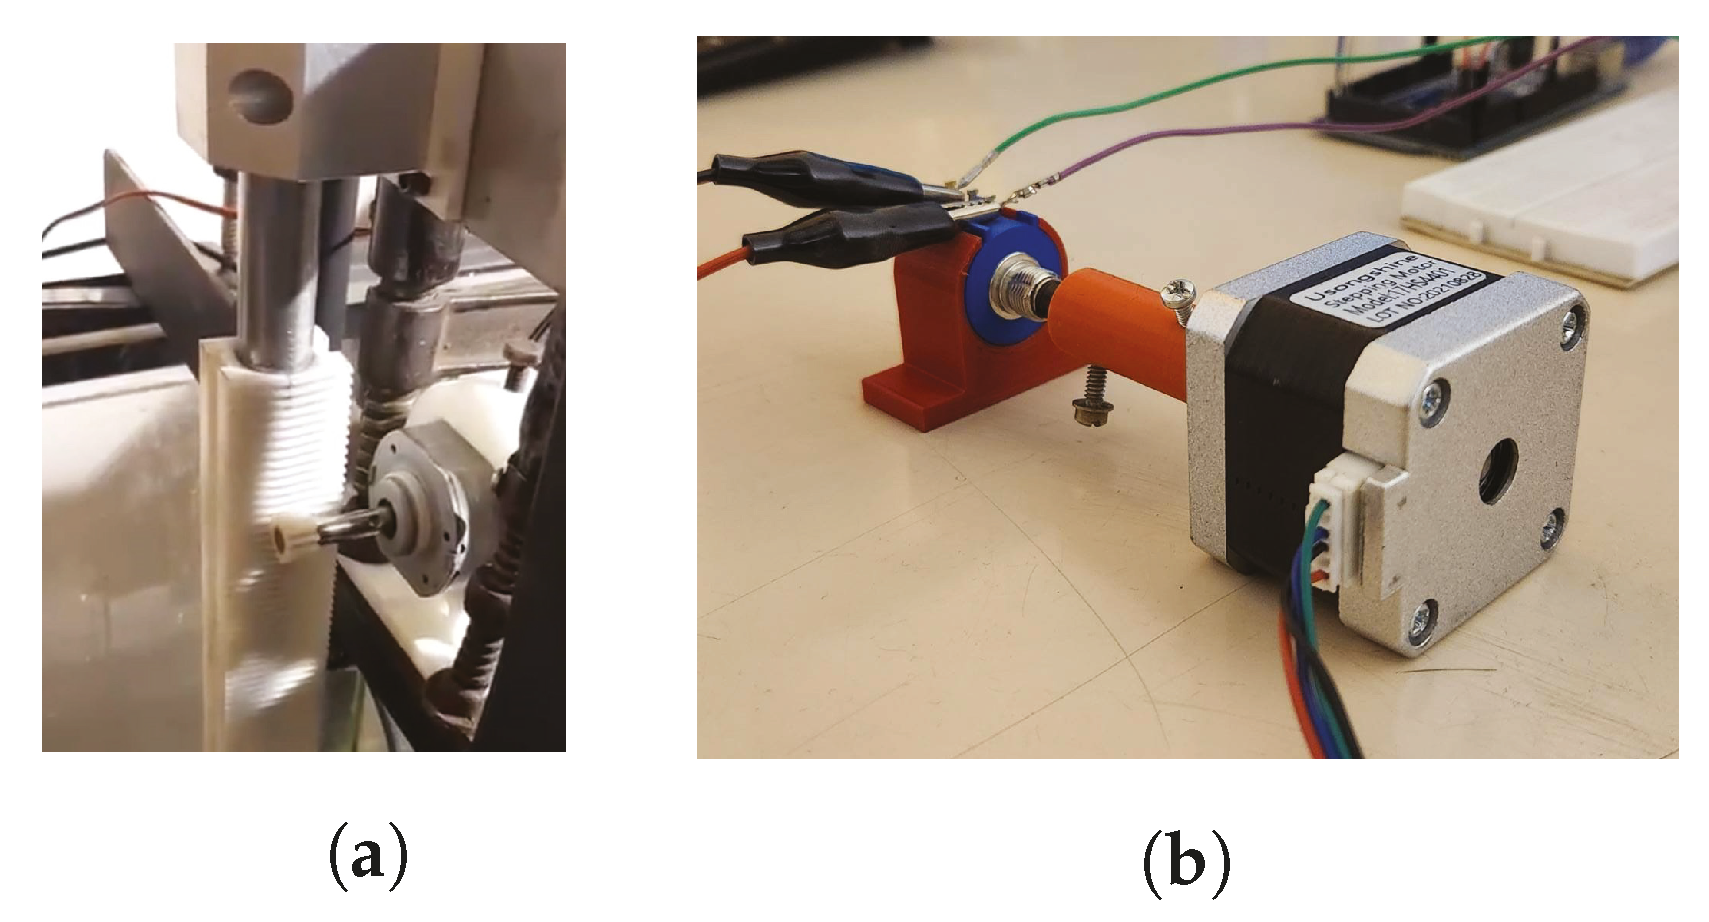
  • The WEC is placed in the wave flume in the position depicted in Figure 1 and the DC machine is coupled to the system by using the rack and pinion system, as shown in Figure 5a. The four DC machines are tested by replacing the machine in each set of test.
  • For each tested machine, R L is varied by using the adjustable resistance system shown in Figure 5b that has been schematically described in Figure 3. The external resistance is adjusted by varying the angular position of the potenciometer connected to the end of the terminals of the DC machine. For a precise adjustment, the angular position is controlled by a step motor that is rigidly attached to the potenciometer. It is important to mention that the linear relation between angular position and resistance load was previously studied. The studied external resistances for this work are 0.8 Ω , 5.0 Ω , and 10.0 Ω .
  • Frequency values of 3.20 Hz, 3.30 Hz, and 3.40 Hz are selected on the variable frequency drive (VFD). This VFD controls the velocity of the electric motor shown in Figure 6b, which generates the movement of the wave generator flap. Then, as explained in Section 2, the velocity is reduced by a gear box, generating regular waves with frequencies of ω 1 = 1.28 Hz, ω 2 = 1.32 Hz, and ω 3 = 1.36 Hz, respectively. The experimental wave generation system is shown in Figure 6.
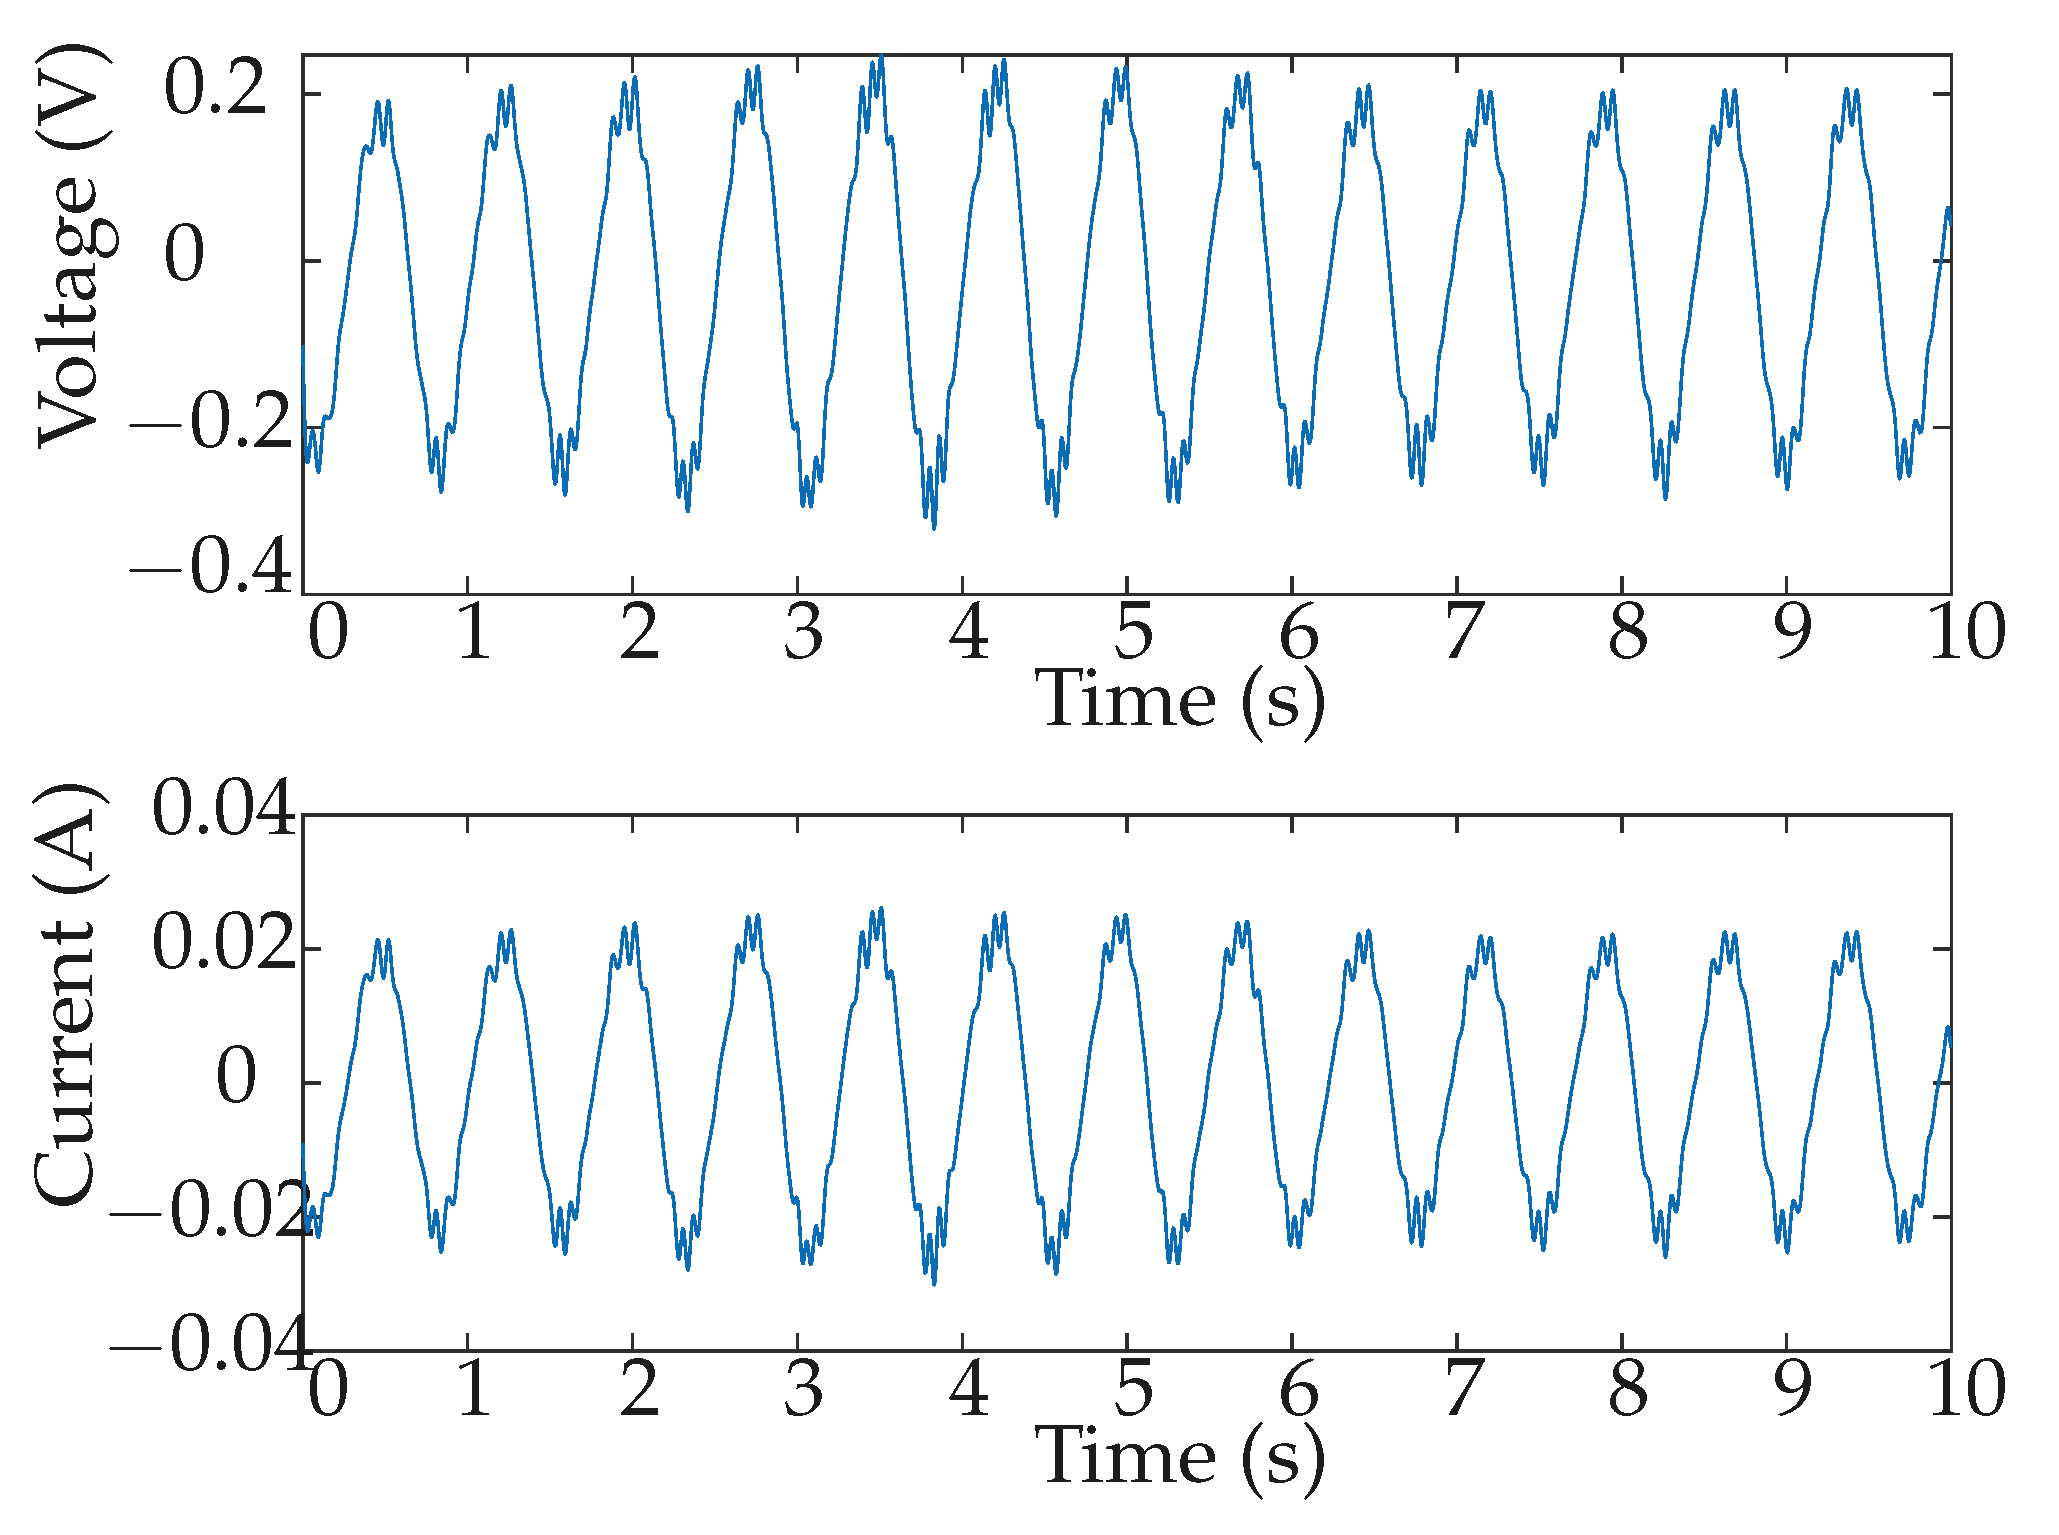
  • The generated power is obtained by multiplying the measured voltage and current using the oscilloscope, and the average value of the resulting power is calculated. The measured voltage and current for the case where DC machine G4 is used, with R L = 10 Ω and wave frequency of ω 3 = 1.36 Hz, is depicted in Figure 7 as an example of the procedure. The observed behaviour of the current and voltage in Figure 7 can be explained by the conversion of the sinusoidal linear movement generated by the waves into rotational motion through the rack and pinion system (see Figure 3). This rotational movement closely resembles a sinusoidal pattern, resulting in a sinusoidal rotational speed θ ˙ . According to the relationship v = k m θ ˙ , this sinusoidal rotational speed θ ˙ generates a sinusoidal voltage v. Therefore, despite the machine being DC, the voltage and current at the DC machine terminals exhibit a sinusoidal waveform due to the sinusoidal nature of the variable θ ˙ .
The four steps described above are performed at least 5 times in order to ensure repeatability. Each measurement has a duration of 60 s, with a sampling frequency of 100 Hz, obtaining 6000 data points for each measurement.
The wave amplitude H s is also measured for each test in order to consider the variations in this parameter. This is important because changes in the wave amplitude can be more influential on the generated power than changes in the PTO damping [26]. The measured amplitude for each case is depicted in Table 4.

5. Results and Analysis

The results are divided into two subsections. The first one is the experimental validation of the theoretical model by comparing the generated power and electrical current per wave amplitude for each generator and different wave frequencies. The second one is focused on the analysis of how the external resistance affects different system parameters and how the characteristics of the electric machine affect the PTO damping and the regulation capacity of the generated power.

5.1. Experimental Validation

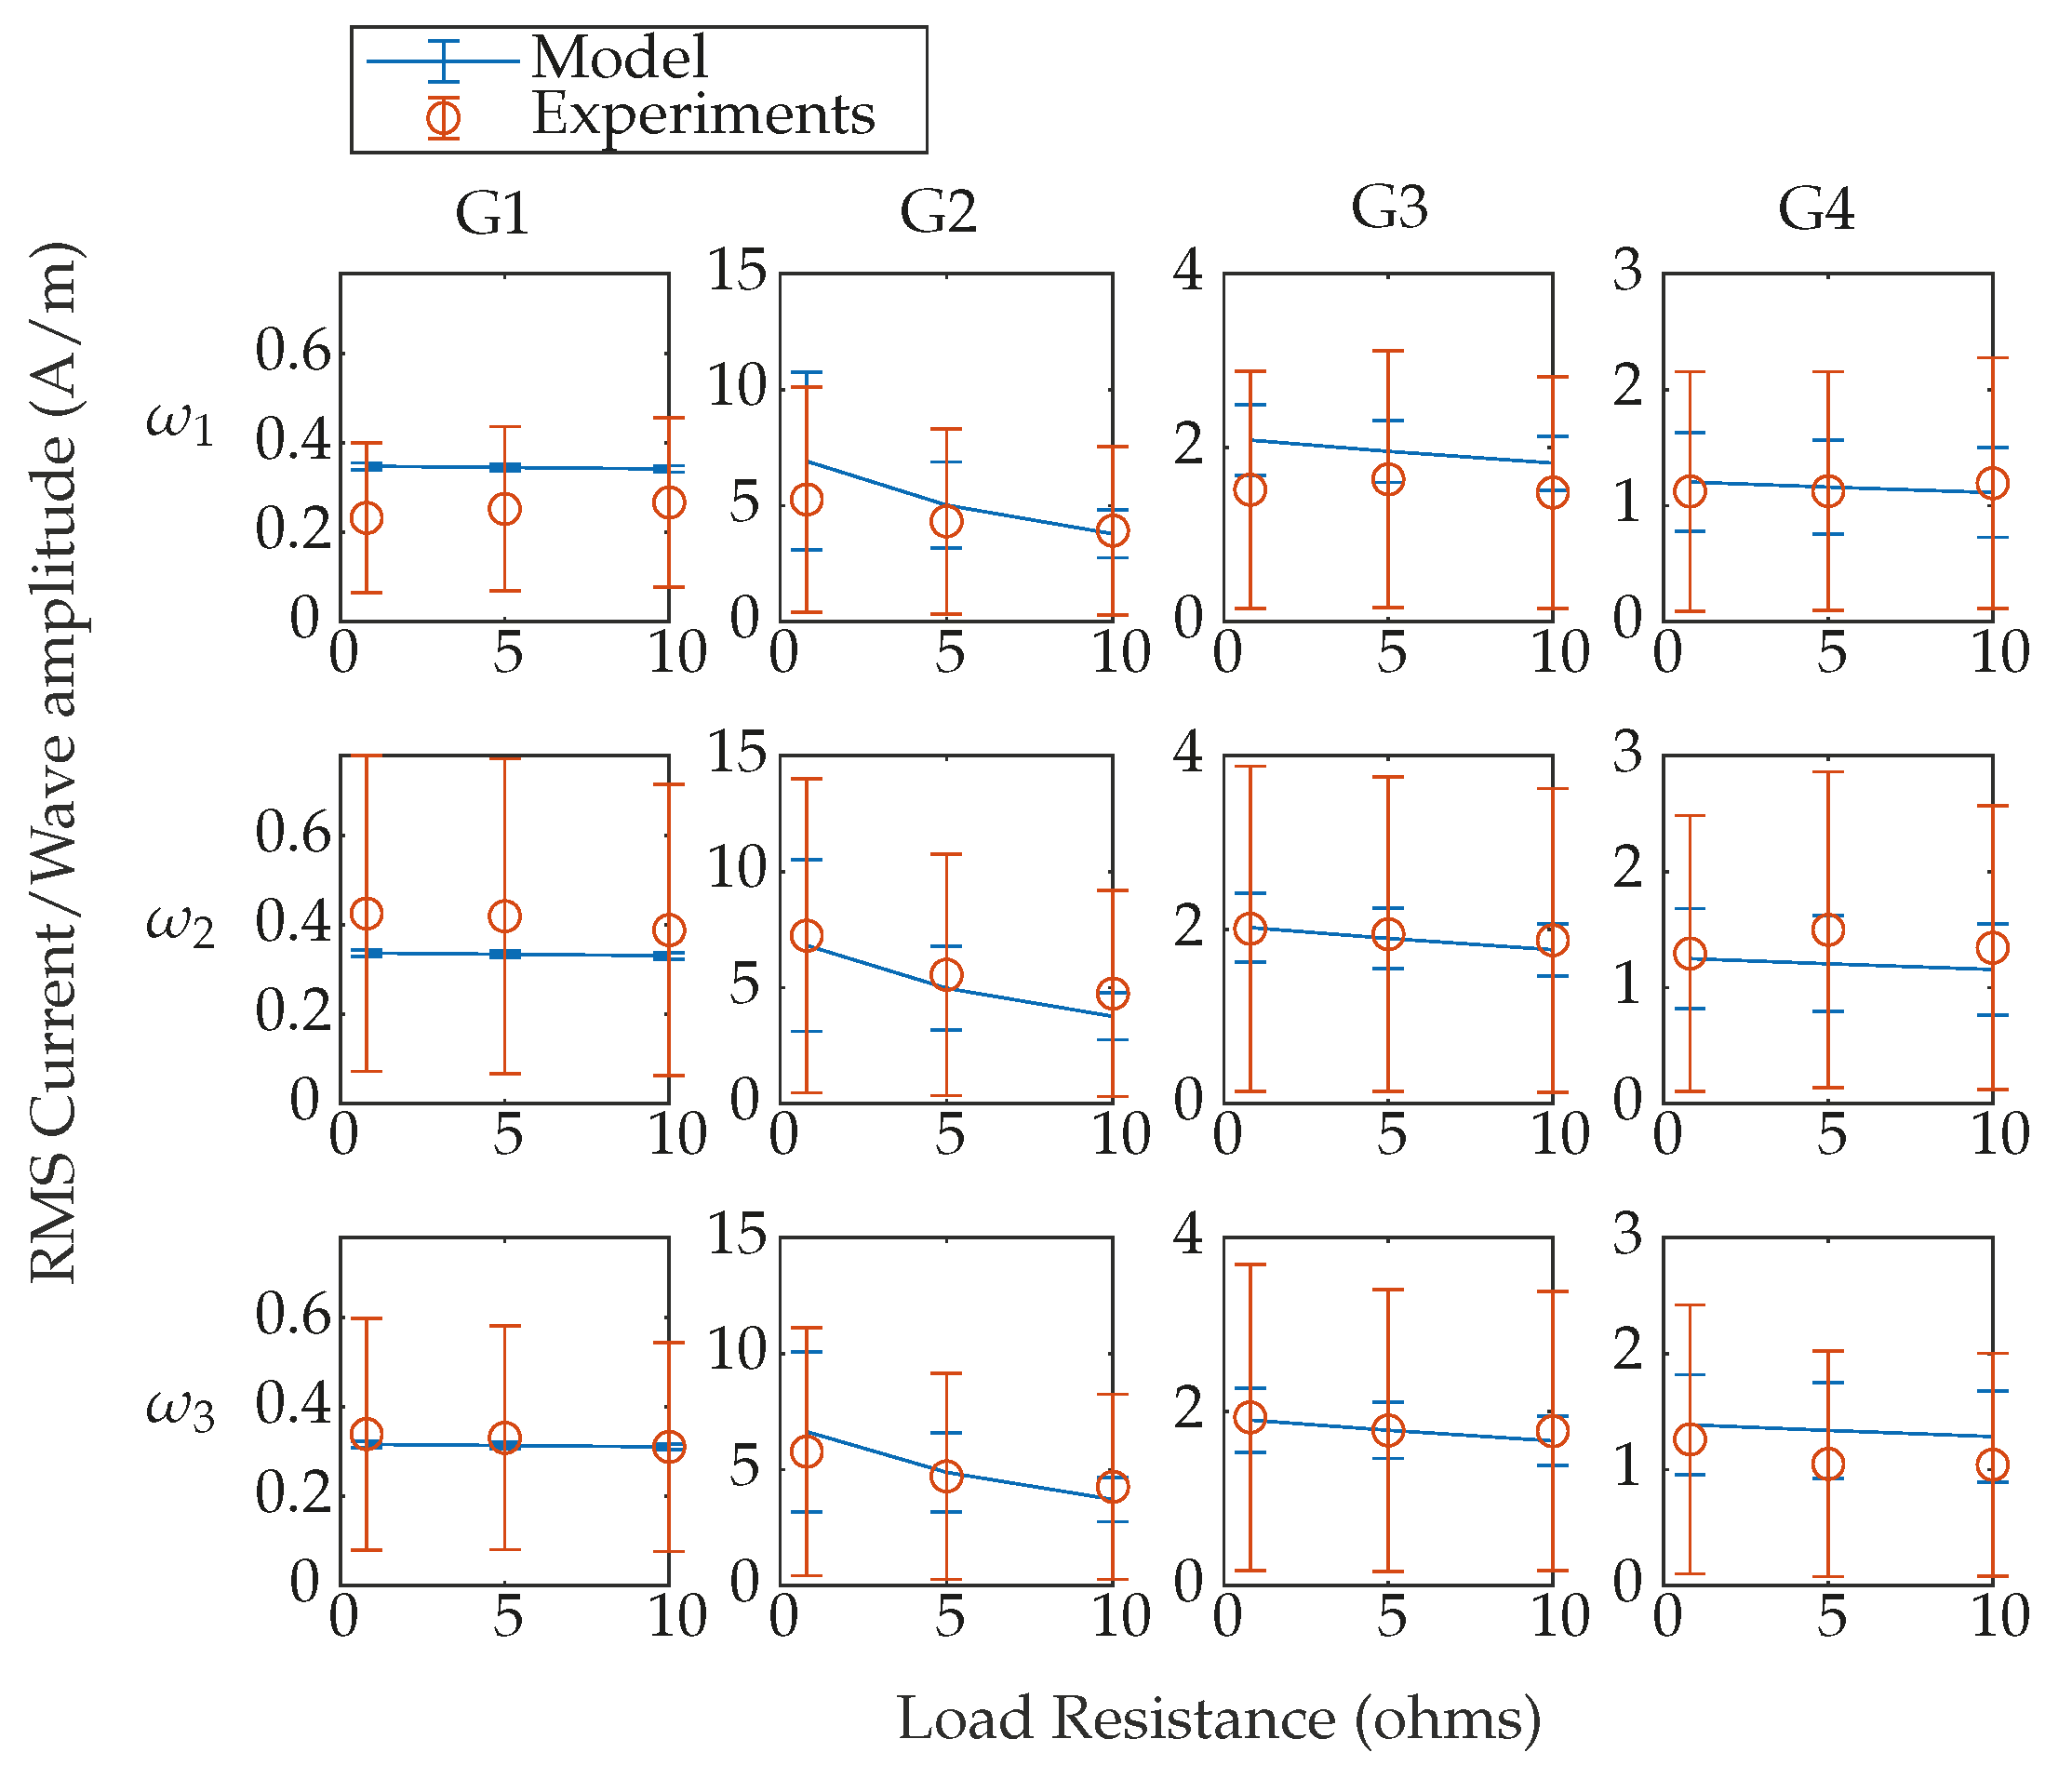
By using the hydrodynamic coefficients obtained from AQWA and the electrical parameters described in Table 2 and replacing them in (7), it is possible to obtain the power for each motor for the different wave frequencies and external electric load resistances ( R L ) studied in this work. In order to validate the model results, the RMS current per wave amplitude and the RMS power per wave amplitude are calculated and compared with the experimental results. Figure 8 presents twelve graphs depicting the value of RMS current per wave amplitude (Y-axis) versus resistive load ( R L ) (X-axis). The graphs are arranged in a matrix format, where each row represents a studied wave frequency ( ω 1 , ω 2 , ω 3 ), and each column represents the DC machine used (G1, G2, G3, and G4). For instance, the top-left graph illustrates the results of RMS current per wave amplitude versus resistive load for a wave frequency of ω 1 = 1.28 Hz using the DC machine G1.
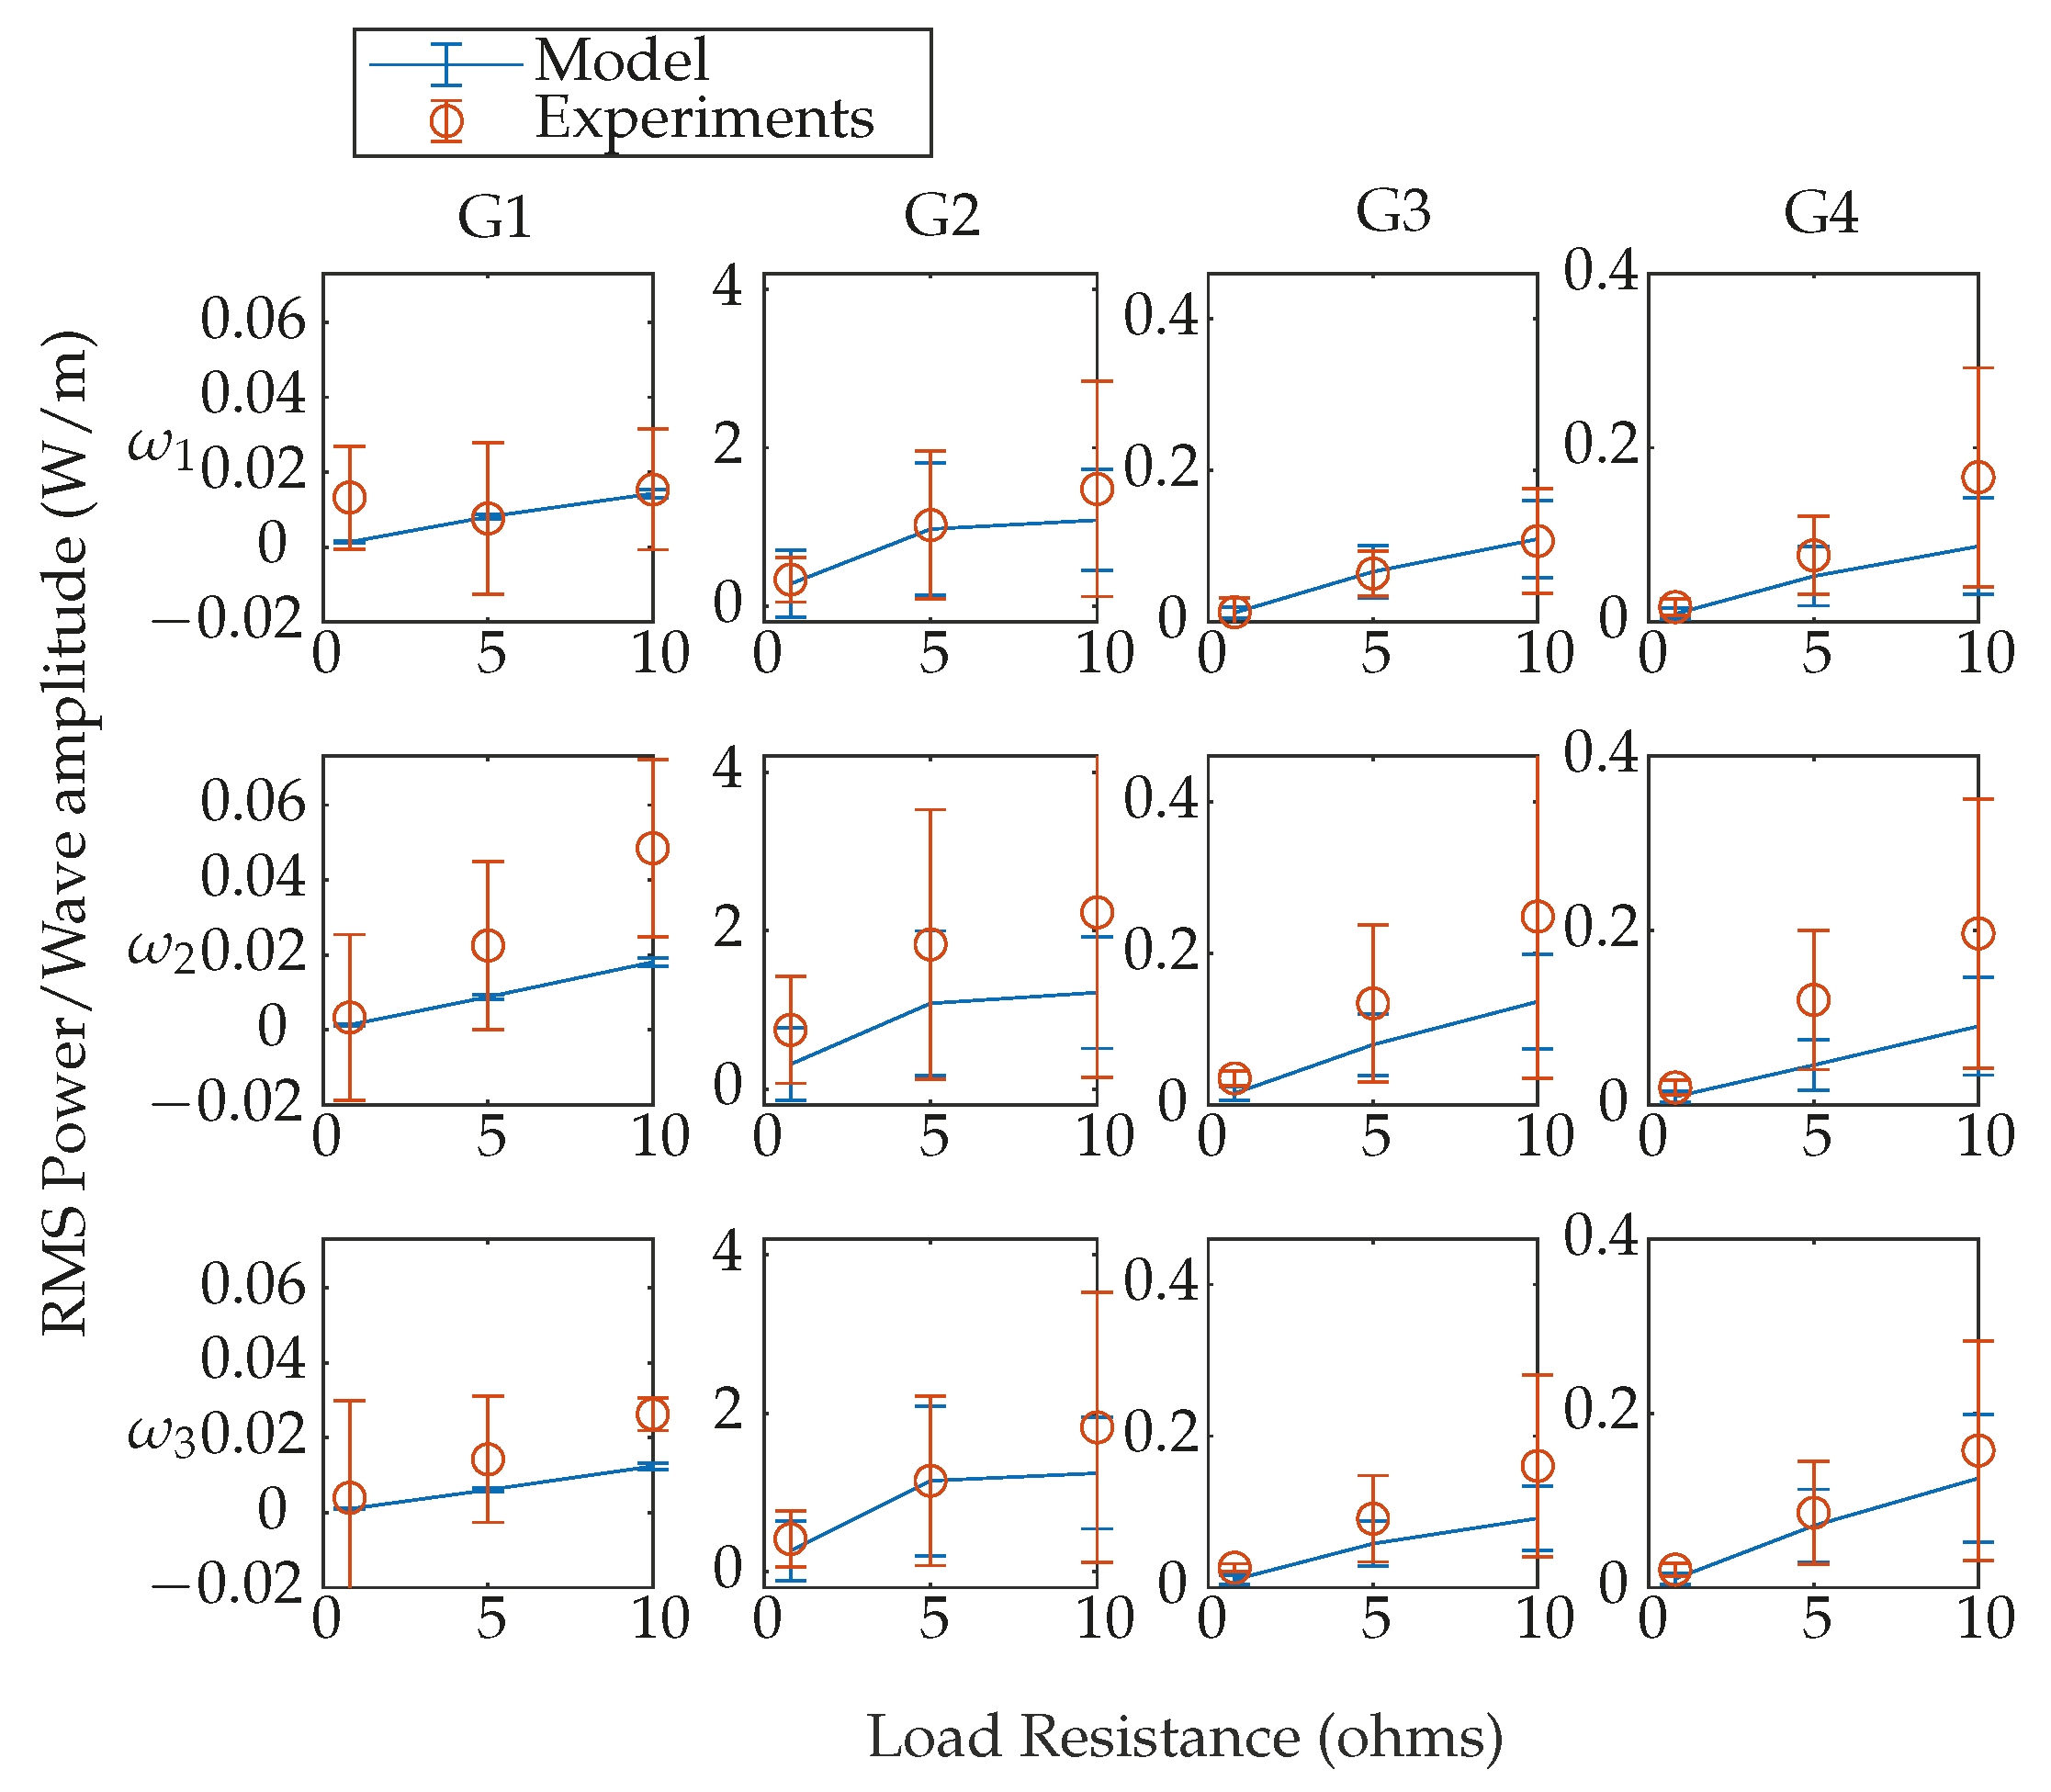
Figure 9 is analogous to Figure 8, but this time it shows the RMS power per unit of wave amplitude versus external resistive load value ( R L ).
It is possible to see that it is evident that the model correctly represents the general behaviour of the measured electrical current and power for all the studied electric machines. Figure 9 also shows that the electrical power is higher for ω 2 , as expected, due to the fact that ω 2 = 1.32 Hz corresponds to the resonant frequency. Additionally, machine G 2 presents the best behaviour, reaching up to 1 W per meter of wave, practically 10 times higher than G 3 and G 4 and 100 times G 1 . It is important to mention that in this scale the experimental uncertainties are important and the use of higher-precision sensors can be beneficial for the accuracy of the model.

5.2. Theoretical Analysis

The main goal of the present work is to demonstrate how each electrical machine affects the PTO damping by adjusting the electrical load resistance and how this variation produces a variation in the generated electrical power. In order to evaluate this goal, in Figure 10a the PTO damping is plotted for one wave frequency and for the four different DC machines against the external load resistance value. It can be seen that theoretically the PTO damping can be adjusted with any of the machines and as expected from the definition of D P T O in Equation (11) the damping is reduced when R L is increased. Nevertheless, the total damping (mainly due to mechanical and electrical losses) in G1 and G3 is higher compared to G2 and G4, as can be seen in Figure 10d; this produces a very low displacement of the system for G1 and G3, as can be seen in Figure 10b. On the contrary, a higher displacement can be reached with G4, which has lower losses. However, a lower RMS power is achieved with G4 compared to machine G2; this can be explained by observing the electrical parameters in Figure 10e,f, where the generated current and voltage present lower values for G4 compared to G2.
It is highlighted that for the motors G2 and G3, within the range of resistive loads studied, there is an optimal value for the latter that maximizes the RMS power, which is notably evident for the motor G2. This shows that by varying the external resistive load an optimal damping can be achieved that maximizes the generated power.
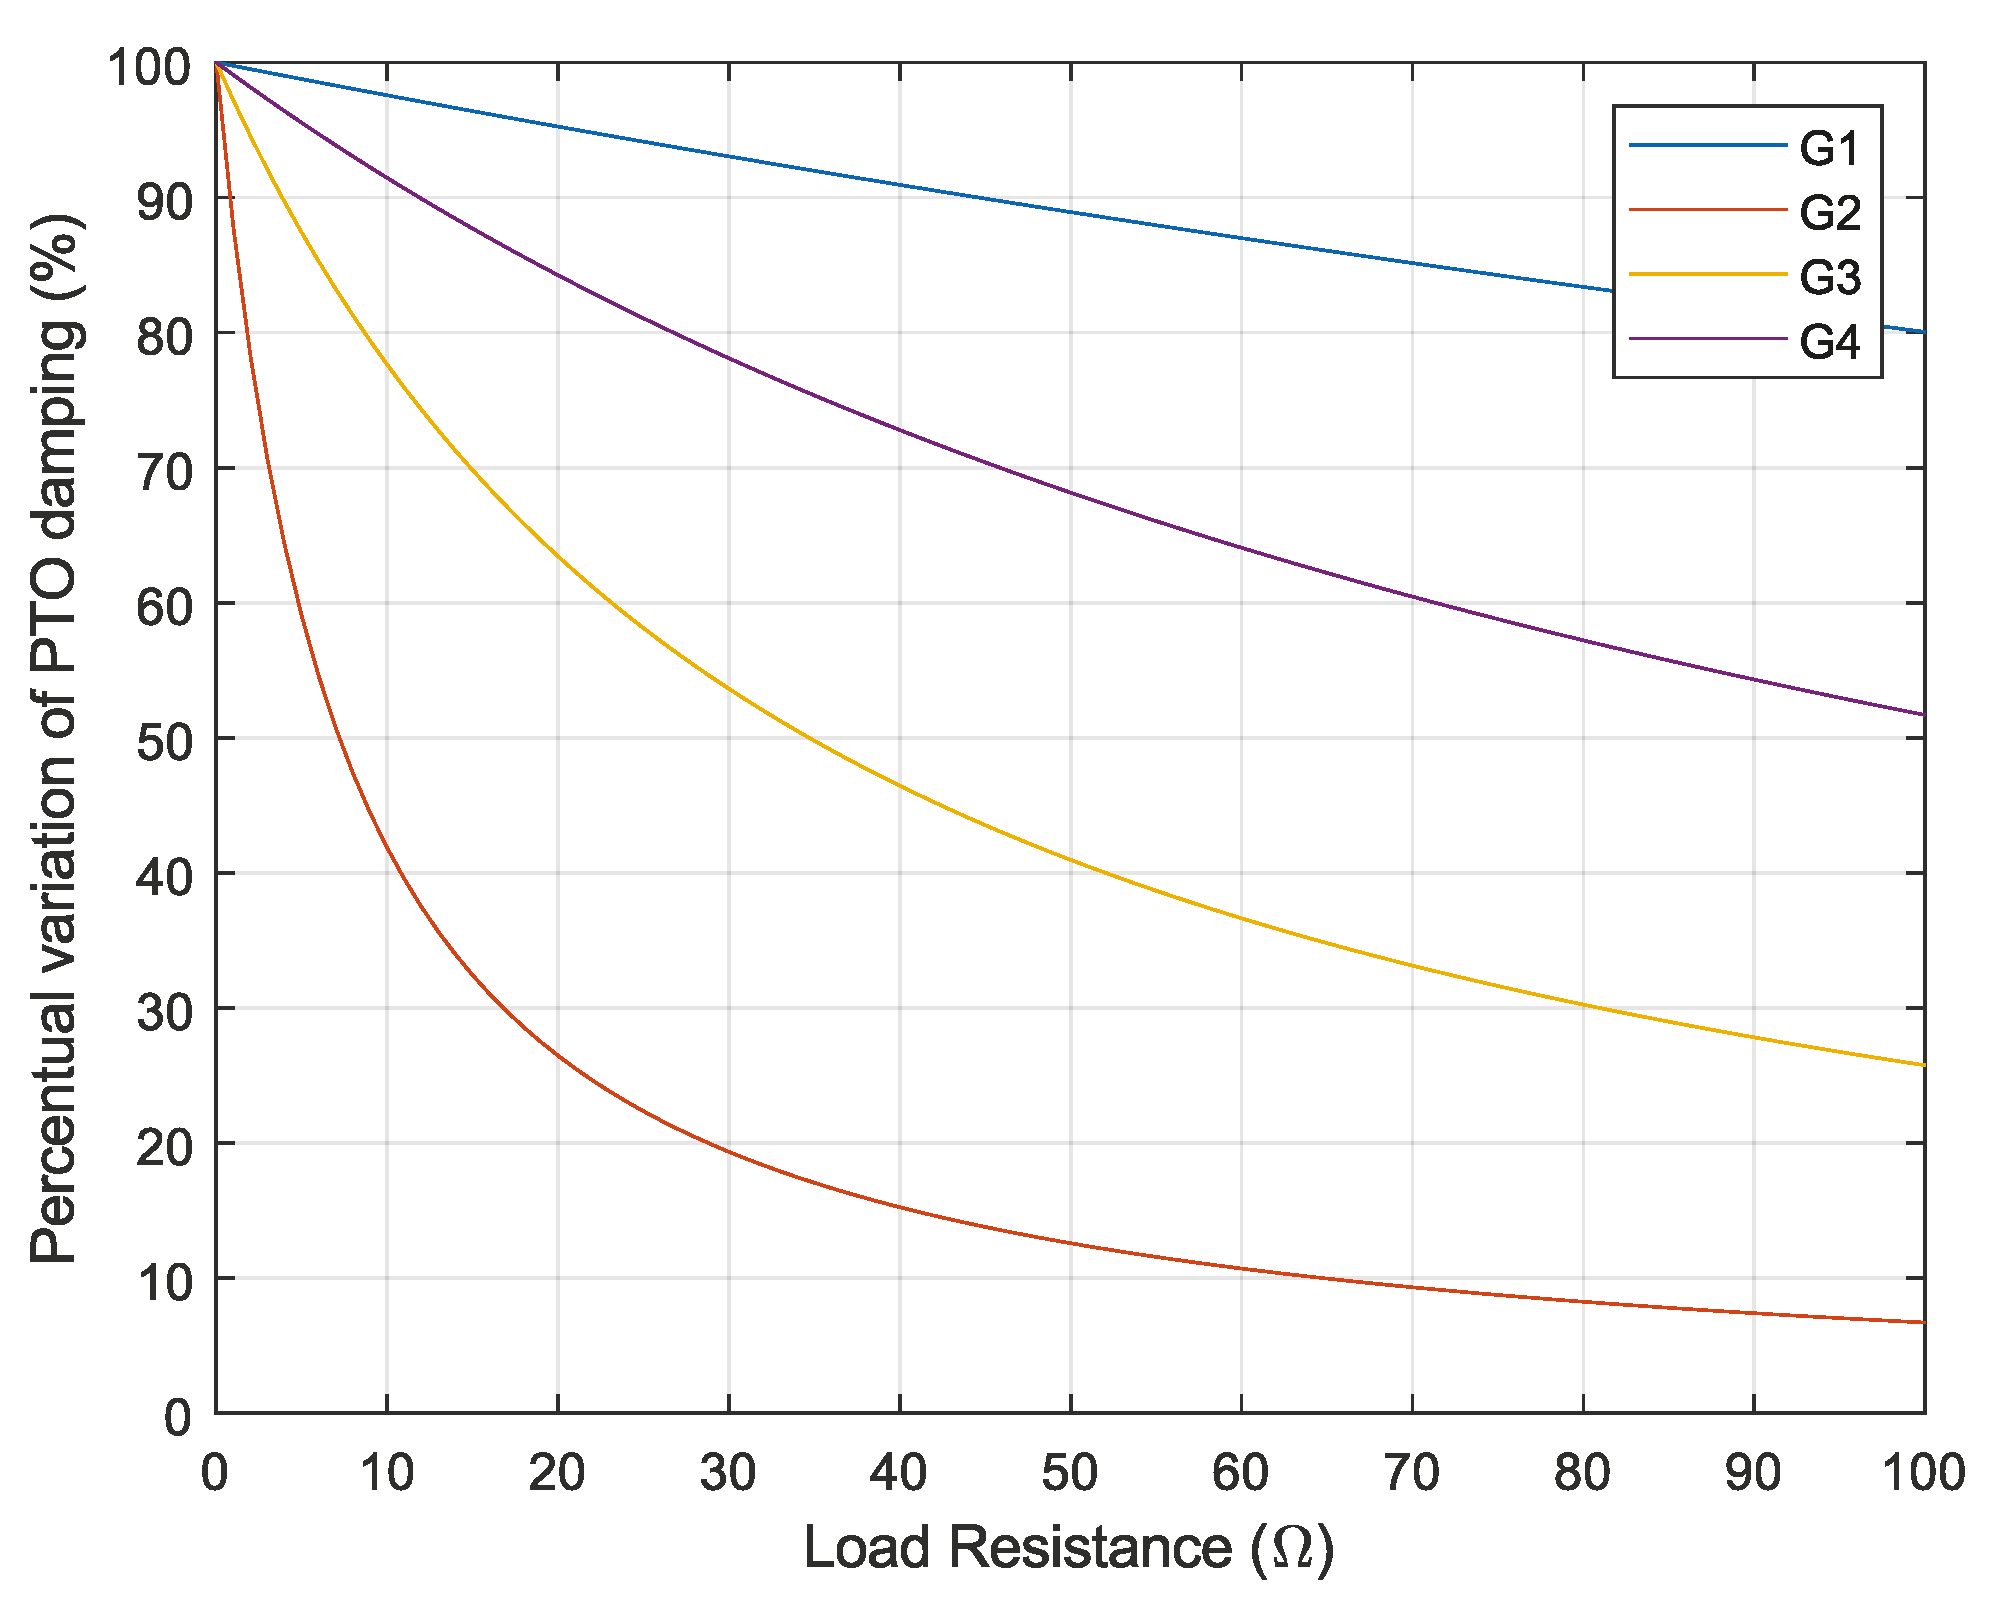
For a better analysis of this behaviour, the variation in the damping is normalized by dividing the PTO damping by its higher value and plotted against load resistance in the region between 0 and 100 Ohm and depicted in Figure 11. It can be seen that the load resistances have almost no influence over the PTO damping for G1 and G3 obtaining, respectively, a variation of approximately 20 and 40 percent. Nevertheless, the power can be significantly modified in G2 by varying the electric resistance with a change of over 90 percent. What makes G2 better is its low value of k m that is explained in part by its low internal resistance R a .
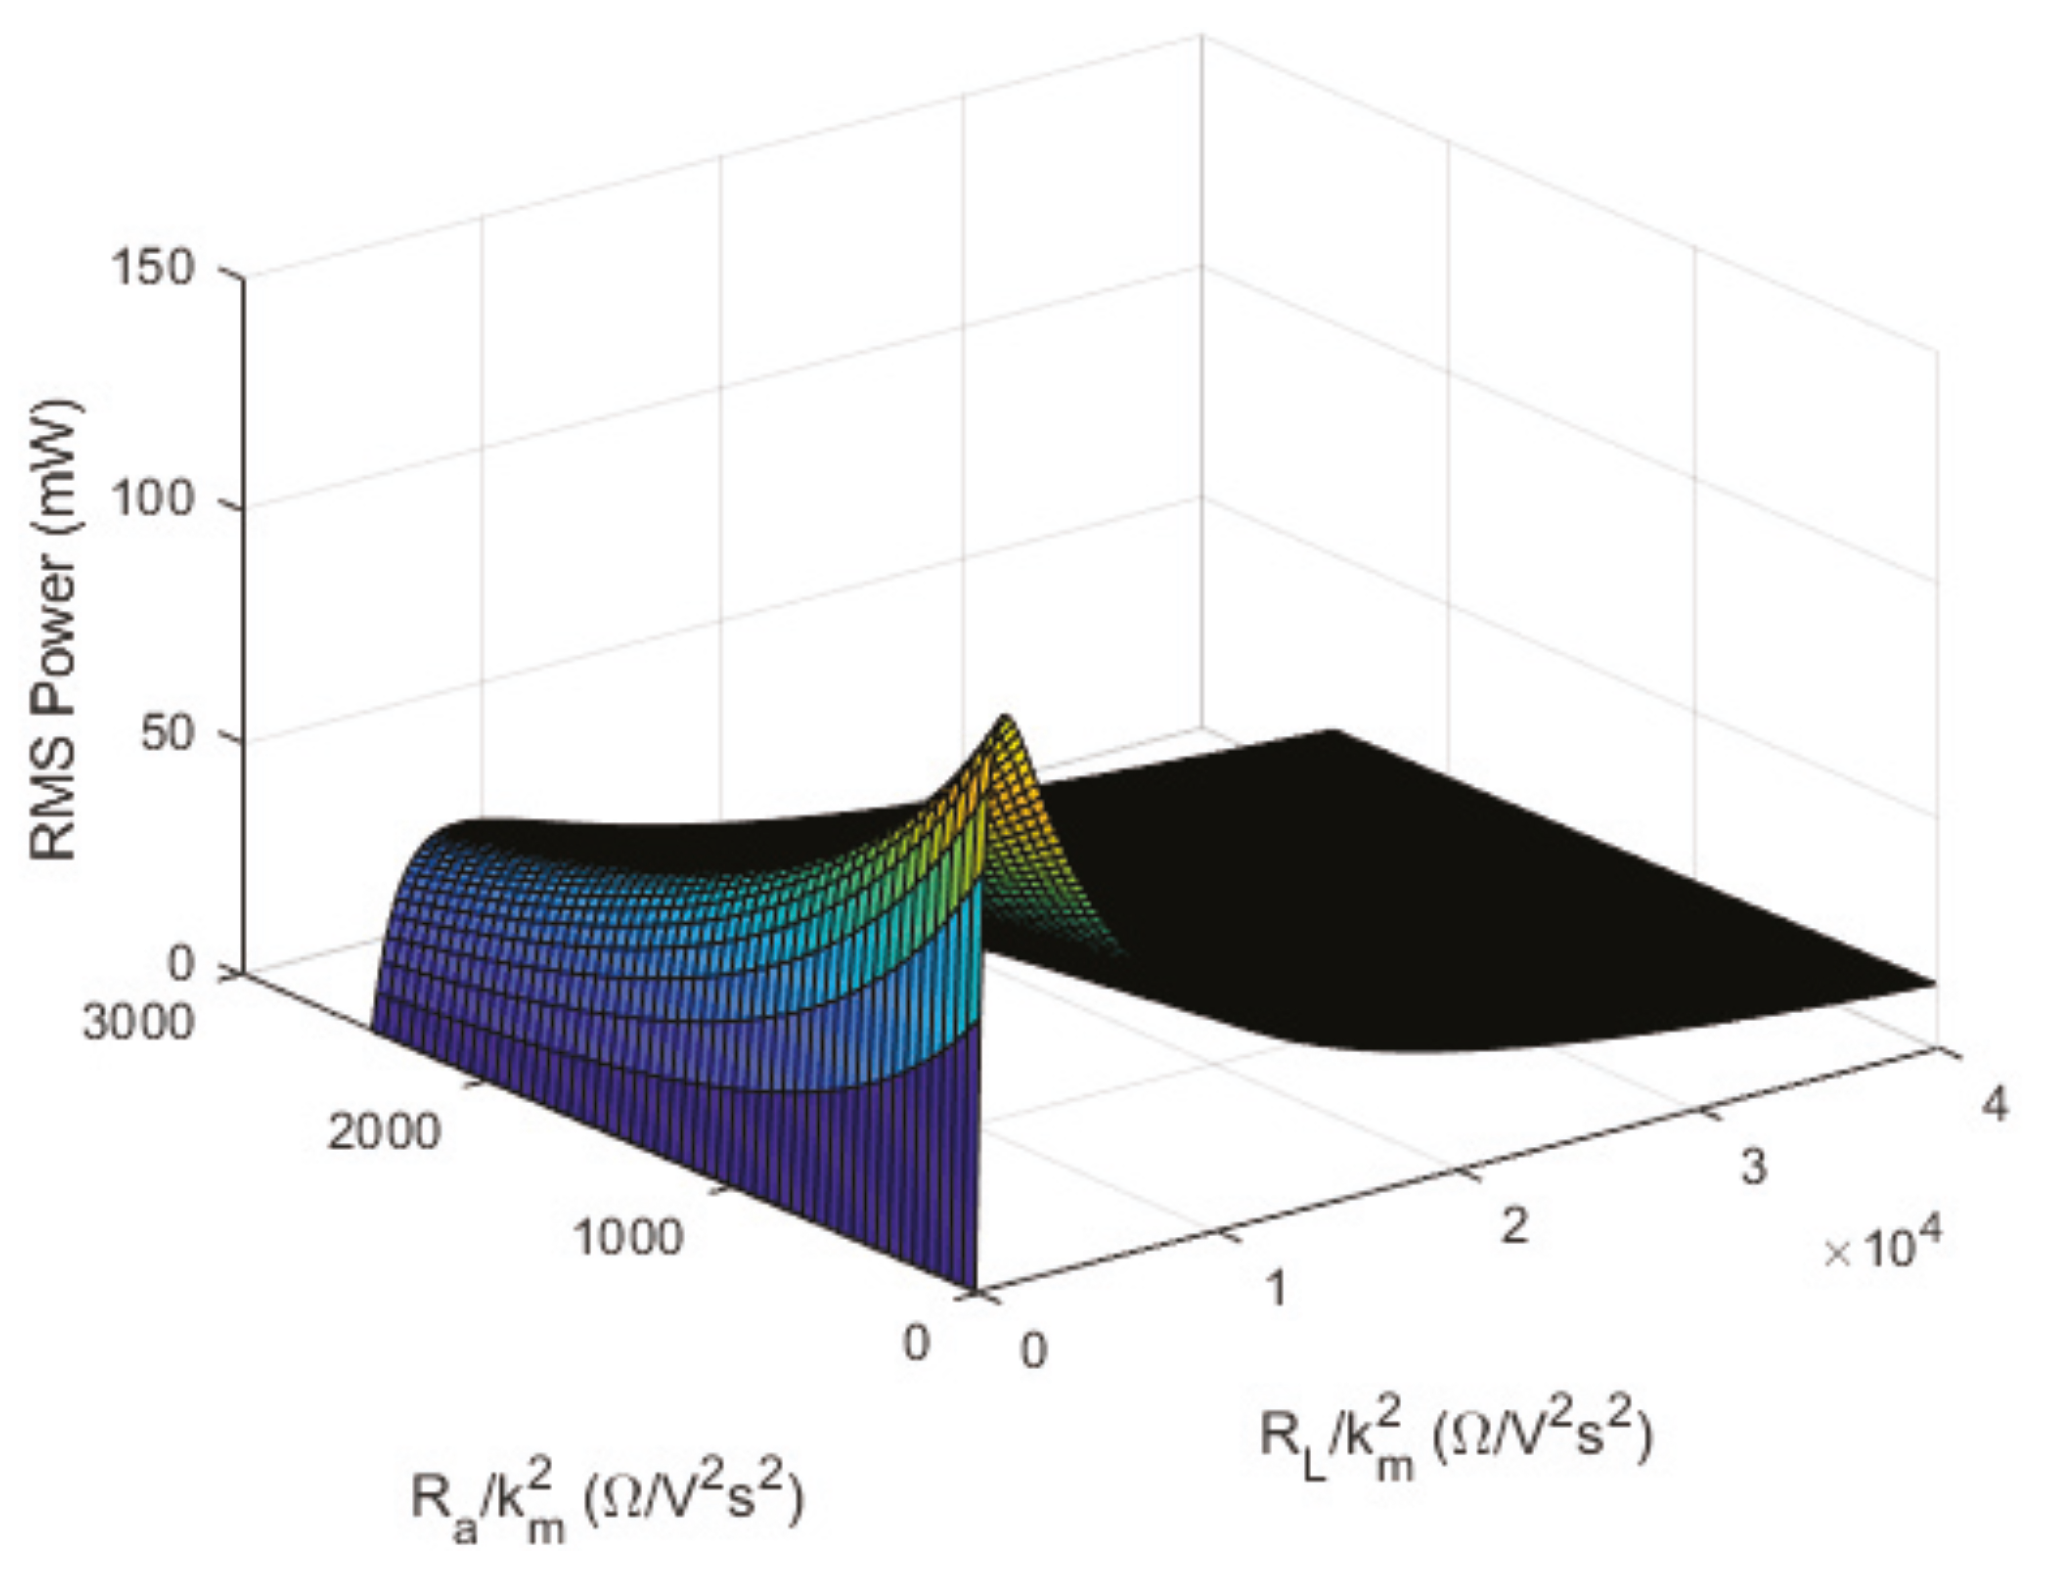
It can be seen that the characteristics of the DC machine have a great influence on the regulation capacity of different dynamic properties of the system. In Figure 12, it is studied how the internal resistance R a and the constant k m affect the ability to change the PTO damping by varying the external load resistance R L . In order to do that, the RMS power is plotted as function of R a / k m 2 and R L / k m 2 . In a similar manner, Figure 13 shows the influence of the characteristics of the DC machines on the generated power of the system.
Figure 13 shows that when R a / k m 2 is lower, the power variation as a function of R L / k m 2 is higher, reaching an increase of up to eight times when the maximum power is compared with the power generated at the maximum R L / k m 2 studied of 40,000 Ω /V 2 s 2 . When R a / k m 2 is increased, R L / k m 2 has less influence on the generated power, making the system less controllable. For example, using R a / k m 2 = 2000 Ω /V 2 s 2 , the maximum power is only 2.4 times the minimum power at R L / k m 2 = 40,000 Ω /V 2 s 2 .
The behaviour shown in Figure 12 can be explained according to Equation (16). This equation shows that the PTO damping depends on r, k m , R a , and R L . If the only option is to modify R L , when this parameter tends to zero the PTO damping will become constant and equal to k m 2 / ( r 2 R a ) , and when this value tends to infinity D P T O will become 0, so the maximum variation depends on the dimensions of k m 2 / ( r 2 R a ) , so for a smaller R a the range will be higher and the same happens for a higher k m . This is the reason why it can be concluded that, for a constant r with a smaller R a / k m 2 , a wider range of action can be achieved. It is possible to see in Figure 13 that, as expected, with a wider range of adjustment of the PTO damping, a higher variation in power can be obtained.

6. Conclusions

This study demonstrates the feasibility of adjusting the PTO damping and, consequently, the power output of the wave energy system using variable resistance connected to the DC machine. By implementing the proposed damping adjustment method, precise control over the system’s behaviour and power output can be achieved, allowing for fine-tuning of the energy conversion process. The variable resistance serves as a valuable actuator, enabling the efficient regulation of the system and enabling the future experimental application of resistive control of the WEC. Importantly, this research highlights the significance of DC machine selection in attaining desired control outcomes. DC machines with specific characteristics prove crucial in achieving substantial power variations within the range of external resistance. A careful consideration of the DC machine parameters is therefore pivotal in maximizing control capability and overall system performance. Overall, this study contributes to the advancement of control strategies for wave energy production. The experimental validation of the damping adjustment method, along with its emphasis on the influence of DC machine parameters, offers valuable insights for the design of efficient and reliable control systems, ultimately aiming to enhance wave energy production. It is important to mention that with the findings of this work, it is possible to implement different control techniques and theoretically validate control strategies at a small scale, such as the one shown in [12]. Additionally, these results allow the correct selection of electric machines for real-scale wave energy converters, where a resistive control strategy is selected.

Author Contributions

Conceptualization, F.G.P. and J.R.; methodology, F.G.P., M.R. and J.R.; software, F.G.P., M.R. and J.R.; validation, F.G.P., M.R. and J.R.; formal analysis, F.G.P., M.R. and J.R.; investigation, F.G.P., M.R. and J.R.; data curation, F.G.P., M.R. and J.R.; writing—original draft preparation, F.G.P., M.R. and J.R.; writing—review and editing, F.G.P., M.R. and J.R. All authors have read and agreed to the published version of the manuscript.

Funding

This research received no external funding.

Institutional Review Board Statement

Not applicable.

Informed Consent Statement

Not applicable.

Data Availability Statement

The data presented in this study are available on request from the corresponding author.

Acknowledgments

We thank the Renewable Energies and Energy Effience Group 2160180 GI/EF-UBB.

Conflicts of Interest

The authors declare no conflict of interest.

Abbreviations

The following abbreviations are used in this manuscript:
WECWave Energy Converter
MPCModel Predictive Control
PTOPower take-off
LPMGLinear Permanent-Magnet Generator
RPMGRotating Permanent-Magnet Generator
TIMTuned Inerter Mass
SAStatic Admittance Control
PGPerformance Guaranteed
NMPCNonlineal Model Predictive Control
PA-WECPoint Absorber Wave Energy Converter
LPTLinear Potential Theory
BEMBoundary Element Method

References

  1. Boud, R. Status and Research and Development Priorities; DTI Report FES-R-132, AEAT Report AEAT/ENV/1054; UK Department of Trade and Industry (DTI): London, UK, 2003. [Google Scholar]
  2. Xie, J.; Zuo, L. Dynamics and control of ocean wave energy converters. Int. J. Dyn. Control 2013, 1, 262–276. [Google Scholar] [CrossRef] [Green Version]
  3. Aderinto, T.; Li, H. Review on Power Perfomance and Efficiency of Wave Energy Converters. Energies 2019, 12, 4329. [Google Scholar] [CrossRef] [Green Version]
  4. Aderinto, T.; Li, H. Ocean Wave Energy Converters: Status and Challenges. Energies 2018, 11, 1250. [Google Scholar] [CrossRef] [Green Version]
  5. Garcia-Tuerel, A.; Forehand, D.I.M. A review of geometry optimisation of wave energy converters. Renew. Sustain. Energy Rev. 2021, 139, 110593. [Google Scholar] [CrossRef]
  6. Guo, B.; Ringwood, J.V.A. A review of wave energy technology from a research and commercial perspective. IET Renew. Power Gener. 2021, 14, 3065–3090. [Google Scholar] [CrossRef]
  7. Coe, R.; Bacelli, G.; Wilson, D.; Abdelkhalik, O.; Korde, U.; Robinett III, R. A comparison of control strategies for wave energy converters. Int. J. Mar. Energy 2017, 20, 45–63. [Google Scholar] [CrossRef]
  8. Wang, L.; Isberg, J.; Tedeschi, E. Review of control strategies for wave energy conversion systems and their validation: The wave-to-wire approach. Renew. Sustain. Energy Rev. 2018, 81, 366–379. [Google Scholar] [CrossRef]
  9. Maria-Arenas, A.; Garrido, A.; Rusu, E.; Garrido, I. Control Strategies Applied to Wave Energy Converters: State of the Art. Energies 2019, 12, 3115. [Google Scholar] [CrossRef] [Green Version]
  10. Pierart, F.G.; Villegas, C.; Basoalto, C.; Hüsing, M.; Corves, B. Model and Control Analysis for a Point Absorber Wave Energy Converter in Lebu, Chile. In Proceedings of the International Workshop IFToMM for Sustainable Dvelopment Goals, I4SDG Workshop, Bilbao, Spain, 22–23 June 2023; pp. 19–26. [Google Scholar] [CrossRef]
  11. Montoya, D.; Tedeschi, E.; Castellini, L.; Martins, T. Passive Model Predictive Control on a Two-Body Self-Referenced Point Absorber Wave Energy Converter. Energies 2021, 14, 1731. [Google Scholar] [CrossRef]
  12. Pierart, F.; Manríquez, C.; Campos, P. Reinforcement learning algorithms applied to reactive and resistive control of a wave energy converter In Proceedings of the IEEE CHILEAN Conference on Electrical, Electronics Egineering, Information and Communication Technologies (CHILECON), Online, 6–9 December 2021. [CrossRef]
  13. Choi, K.-S.; Yang, D.-S.; Park, S.-Y.; Cho, B.-H. Design and performance test of hydraulic PTO for wave energy converter. Int. J. Precis. Eng. Manuf. 2012, 13, 795–801. [Google Scholar] [CrossRef]
  14. Falcão, A.F.D.O. Modelling and control of oscillating-body wave energy converters with hydraulic power take-off and gas accumulator. Ocean Eng. 2007, 34, 2021–2032. [Google Scholar] [CrossRef]
  15. Sarmento, A.J.N.A.; Gato, L.M.C.; Falcao, A.D.O. Turbine-controlled wave energy absorption by oscillating water column devices. Ocean Eng. 1990, 17, 481–497. [Google Scholar] [CrossRef]
  16. Stalberg, M.; Waters, R.; Danielsson, O.; Leijon, M. Influence of generator damping on peak power and variance of power for a direct drive wave energy converter. In Proceedings of the 26th Internationl Conference on Offshore Mechanincs and Arctic Engineering OMAE, San Diego, CA, USA, 10–15 June 2007. [Google Scholar]
  17. Haraguchi, R.; Asai, T. Enhanced power absorption of a point absorber wave energy converter using a tuned inertial mass. Energy 2020, 202, 117740. [Google Scholar] [CrossRef]
  18. Sugiura, K.; Sawada, R.; Nemoto, Y.; Haraguchi, R.; Asai, T. Wave flume testing of an oscillating-body wave energy converter with a tuned inerter. Appl. Ocean Res. 2020, 98, 102127. [Google Scholar] [CrossRef] [Green Version]
  19. Asai, T.; Sugiura, K. Numerical evaluation of a two-body point absorber wave energy converter with a tuned inerter. Renew. Energy 2021, 171, 217–226. [Google Scholar] [CrossRef]
  20. Cassidy, I.; Scruggs, J. Nonlinear stochastic controllers for power-flow-constrained vibratory energy harvesters. J. Sound Vib. 2013, 332, 3134–3147. [Google Scholar] [CrossRef]
  21. Gao, Y.; Shao, S.; Zou, H.; Tnag, M.; Xu, H.; Tian, C. A fully floating system for a wave energy converter with direct-driven linear generator. Energy 2016, 95, 99–109. [Google Scholar] [CrossRef] [Green Version]
  22. Son, D.; Yeung, R. Real time implementation and validation of optimal damping control for a permanent-magnet linear generator in wave energy extraction. Appl. Energy 2017, 208, 571–579. [Google Scholar] [CrossRef]
  23. Pierart, F.G.; Fernandez, J.; Olivos, J.; Gabl, R.; Davey, T. Numerical Investigation of the Scaling Effects for a Point Absorber. Water 2022, 14, 2156. [Google Scholar] [CrossRef]
  24. Folley, M. Numerical Modelling of Wave Energy. Converters, 1st ed.; Joe Hayton: London, UK, 2016; pp. 1–288. [Google Scholar]
  25. Cummins, W. The impulse response function and ship motions. Schiffstechnik 1962, 9, 101–109. [Google Scholar]
  26. Anderlini, E.; Forehand, D.; Stansell, P.; Xiao, Q.; Abusara, M. Control of a Point Absorber Using Reinforcement Learning. IEEE Trans. Sustain. Energy 2016, 7, 1681–1690. [Google Scholar] [CrossRef] [Green Version]
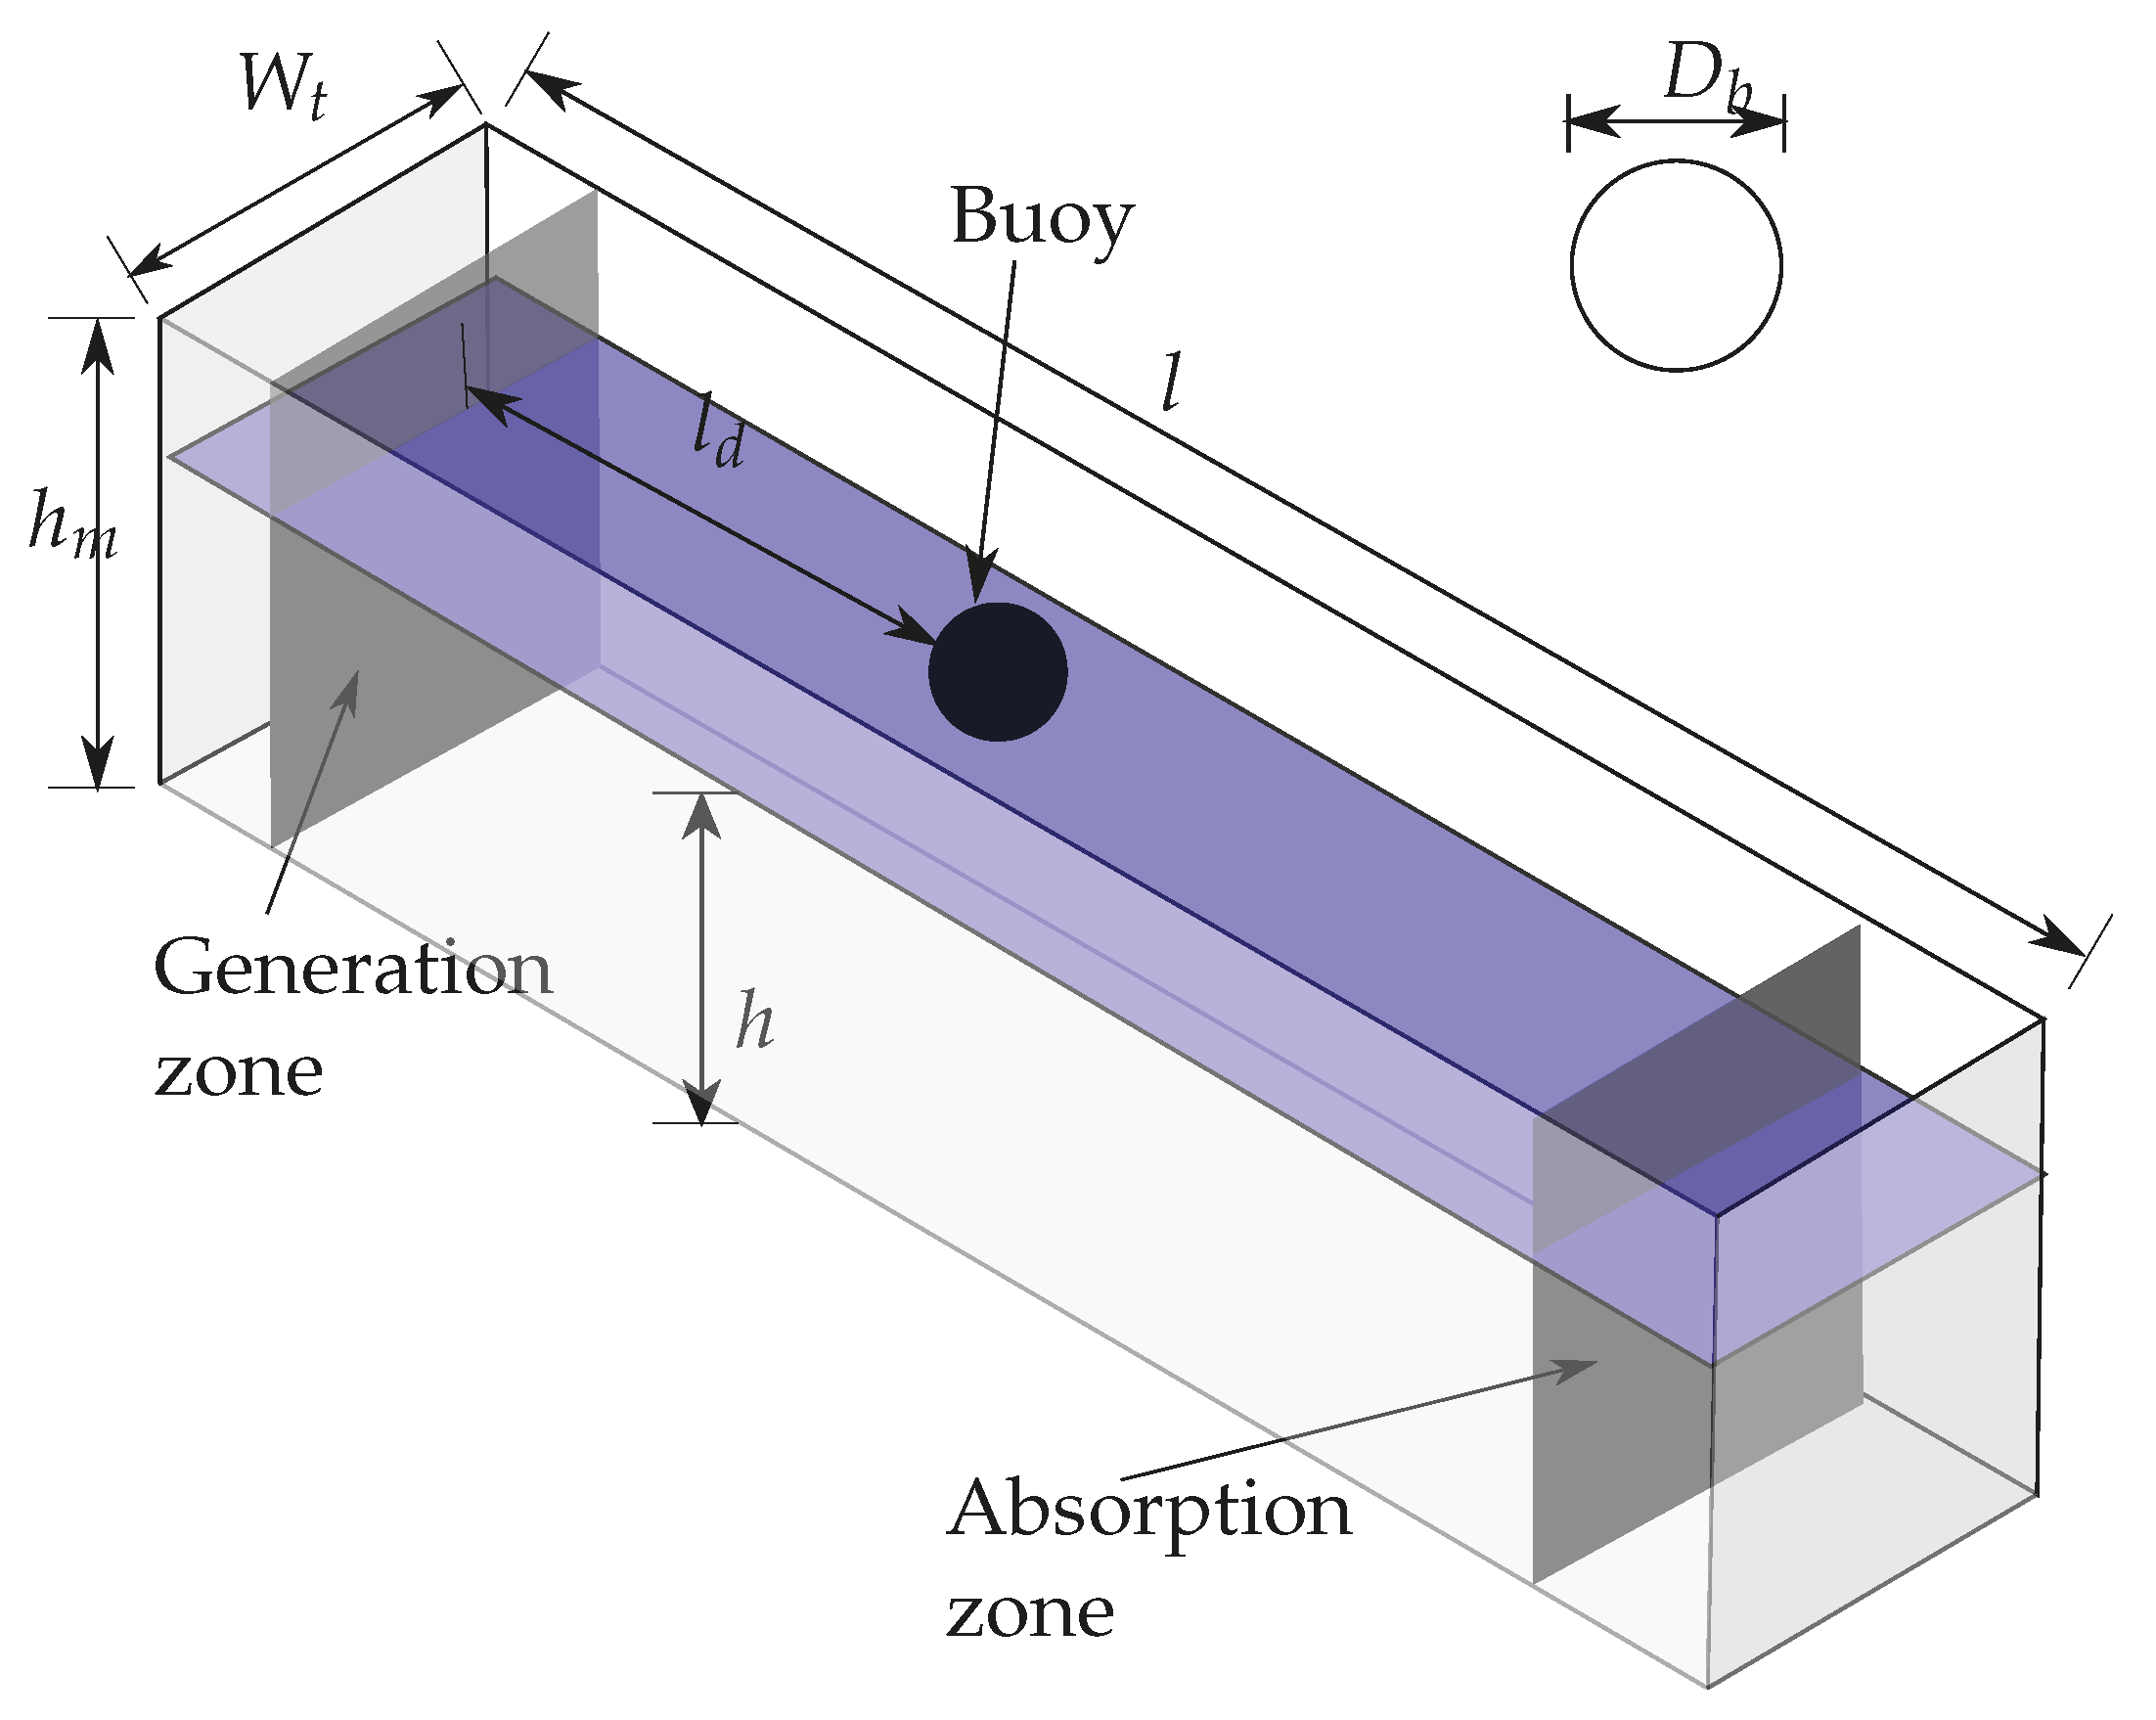
Figure 1. Schematic representation of the wave flume with its dimensions.
Energies 16 05298 g001
Figure 2. Picture of the controllable point absorber wave energy converter.
Energies 16 05298 g002
Figure 3. Controllable point absorber wave energy converter.
Energies 16 05298 g003
Figure 4. Representation of the controllable PTO.
Energies 16 05298 g004
Figure 5. Experimental setup details: (a) picture of the rack and pinion system, (b) picture of the adjustable external resistance system.
Energies 16 05298 g005
Figure 6. Experimental wave generator details: (a) picture of the wave flume with the generator flap, (b) picture of the electric motor and wave generator system.
Energies 16 05298 g006
Figure 7. Measured voltage and current for DC machine G4 using R L = 10 Ω and wave frequency of ω 3 = 1.36 Hz.
Energies 16 05298 g007
Figure 8. RMS electrical current per wave amplitude versus external load resistance value. Experimental and mathematical model results for four DC machines and three different wave frequencies.
Energies 16 05298 g008
Figure 9. RMS electrical power per wave amplitude versus external load resistance value. Experimental and mathematical model results for four DC machines and three different wave frequencies.
Energies 16 05298 g009
Figure 10. Influence of load resistance on different variables for wave frequency of 1.32 Hz and for each electric machine. (a) PTO damping, (b) PTO displacement, (c) RMS power, (d) Total damping, (e) Voltage and (f) RMS current.
Energies 16 05298 g010
Figure 11. Normalized influence of load resistance on different variables for wave frequency of 1.32 Hz.
Energies 16 05298 g011
Figure 12. PTO damping as function of R a / k m 2 and R L / k m 2 .
Energies 16 05298 g012
Figure 13. RMS power generated as function of R a / k m 2 and R L / k m 2 .
Energies 16 05298 g013
Table 1. Dimensions in meters of the tank illustrated in Figure 1.
h h m W t l l d D b
0.2520.59160.481.641.3260.21
Table 2. Electric DC machine characteristics and parameters. k m : proportional constant between EMF force and the angular velocity of the DC machine, R a : motor internal resistance, and L a : motor inductance.
Motor k m (V/rad/s) R a  ( Ω ) L a (H)Nominal Power (W)Nominal Voltage (V)
G10.750401.40.6435220
G20.0507.220.014018
G30.23534.780.0855120
G40.047107.690.160.512
Table 3. Hydrodynamic parameters: excitation force divided by wave amplitude (N/m), added mass (kg), and radiation damping (Ns/m), for the three wave frequencies studied.
Wave Frequency ( ω )
Parameter1.28 Hz1.32 Hz1.36Hz
F e x c / H s 136.94 N/m156.39 N/m149.06 N/m
A1.23 kg1.21 kg1.18 kg
D r 6.73 Ns/m6.73 Ns/m6.71 Ns/m
Table 4. Maximum wave amplitude H s for each machine and external resistance studied.
H s Electric MachineExternal Resistance ( R L )
0.8 Ω 5 Ω 10 Ω
G11.90 cm1.83 cm1.64 cm
G21.53 cm1.63 cm1.62 cm
G31.63 cm1.64 cm1.62 cm
G41.91 cm1.82 cm1.63 cm
Disclaimer/Publisher’s Note: The statements, opinions and data contained in all publications are solely those of the individual author(s) and contributor(s) and not of MDPI and/or the editor(s). MDPI and/or the editor(s) disclaim responsibility for any injury to people or property resulting from any ideas, methods, instructions or products referred to in the content.