Article

Minimizing Power Losses for Distributed Generation (DG) Placements by Considering Voltage Profiles on Distribution Lines for Different Loads Using Genetic Algorithm Methods

1
Doctoral School of Engineering Science, Universitas Syiah Kuala, Banda Aceh 23111, Indonesia
2
Department of Electrical and Computer Engineering, Universitas Syiah Kuala, Banda Aceh 23111, Indonesia
3
Department of Mechanical Engineering, Universitas Syiah Kuala, Jl. Syech Abdurrauf No.7 Darussalam, Banda Aceh 23111, Indonesia
*
Author to whom correspondence should be addressed.
Energies 2023, 16(14), 5388; https://doi.org/10.3390/en16145388
Submission received: 15 May 2023 / Revised: 2 July 2023 / Accepted: 10 July 2023 / Published: 14 July 2023
(This article belongs to the Section F1: Electrical Power System)

Abstract

:
The need for electrical energy is increasing in line with the increase in population and increasing progress in welfare. On the other hand, the availability of fossil fuels as the main fuel in generating electricity is dwindling; so, there is a need for policies that require the use of environmentally friendly renewable energy. The utilization of renewable energy does not necessarily apply freely due to several constraints. One effort is a generator or distributed generation (DG) which is placed in the distribution line close to the load. The utilization of DG must go through planning, especially the large capacity and position on the bus and on the feeder, which will result in small network losses and a voltage profile that meets tolerance limits. Thus, the purpose of this study is to optimize to obtain the capacity and location of the DG calculated by considering the variation in the load through the genetic algorithm method. As a result, the optimal DG position for normal load is obtained on bus 18, bus 20, and bus 32 with capacities of 190 kW, 463 kW, and 370 kW, respectively. The losses obtained decreased from 54.6733 kW to 9.9447 kW, and the voltage profile was maintained within the specified limits. Optimization was carried out for decreasing and increasing loads in percent. The result is that losses can be minimized, and the voltage profile remains within the required limits. The lower the load, the more stable the voltage and the smaller the losses; meanwhile, the larger the load, the more fluctuating the voltage is, but still within the limits specified in the optimization.

1. Introduction

Nowadays, the availability of electrical energy plays a very vital role in human life. Electrical energy is a primary need because electrical energy is used in almost every aspect of human life. The growth in demand for electrical energy from year to year continues to increase and develop. The increasing need for electrical energy is inseparable from population growth and increasing industry [1]. While the most common fossil fuels are now restricted, the demand for electrical energy is rising along with the requirement for main fuels (oil, gas, and coal) in power plants [2,3,4,5,6].
One type of renewable generator is the distributed generation (DG) technology, which is a small capacity generator that is located close to the load, namely in the electricity distribution network system. Installing DG provides many advantages, namely increased system reliability, higher efficiency, saving power, and being more environmentally friendly [7]. The number of short-circuit current sources increases when a system disturbance occurs, which is one disadvantage of DG. As a result, when installing DGs, several factors need to be taken into account, including voltage and system power losses [8,9,10,11,12]. It is crucial to know where the DG is physically located. If the system’s power losses are decreased and the voltage level is kept between the minimum and maximum values, DG is considered to be optimal. A technique is required to address the DG location optimization issue [13,14,15].
Distributed generation (DG) is often used to express small-scale electricity generation. No agreement has been made to define DG definitively. The International Council on Large Electricity Systems (CIGRE) defines distributed generation as any generating unit with a maximum capacity of 50 MW to 100 MW, which is usually connected to a distribution network. On the other hand, the Institute of Electrical and Electronics Engineers (IEEE) defines DG as the generation of electrical energy carried out by equipment that is smaller than a central power plant so that it allows interconnection to occur at almost all points in the electric power system. A different definition has been proposed in the literature, which defines DG based on connection and location, not based on generation capacity [16].
DG is a technology that is constantly evolving and can adapt to economic changes in a flexible way due to its small size and simpler construction compared to conventional power plants. Most DGs are very flexible in terms of operations, sizes, and technological advances. In addition, DG can improve the reliability of the electric power system. In its installation in the distribution network, DG is placed close to the load area and several advantages of using DG are as follows: (1) DG provides higher reliability in power utilization; (2) DG as a local energy source can help to save power; and (3) compared to power plants, DG has a higher efficiency in power distribution. DG can improve system efficiency because DG helps reduce system losses when connected to the network.
DG is environmentally friendly in producing electrical energy. Emissions generated from the production of electrical energy by DG are low, even close to zero [17]. Besides the advantages, DG can also cause some disadvantages, for example, increasing the number of short-circuit currents when a disturbance occurs in the system. Several parameters need to be considered in DG installation, namely the amounts of short-circuit currents, voltage levels, and losses in the system. One of the things that is very important in the DG discussion is the determination of the optimal location and capacity if it results in additional short-circuit currents and minimal power losses as well as maintained voltage levels, which are between minimum and maximum values [18]. Analytical methods and mathematical optimization methods provide robust optimal solutions but may require significant computational effort and duration for complex problems [19].
Of the many methods, the backward and forward sweep is an efficient method. In the backward sweep, starting from the far end point of the network, the load current is at the load point. Therefore, the current flowing in the line is calculated according to the assumptions or calculation results from the voltage in the previous iteration. After calculating the current flowing on the line, in the forward sweep from the source point, the voltage from each bus point is updated. After the forward sweep compensation for injection current is calculated, then the convergence criteria are tested. Various kinds of convergence criteria are adjusted to the voltage point, line load or current, and the input of power to the network [20].
To analyze the power flow using the forward–backward sweep method, the radial distribution network is presented like a tree with the first bus as the root or slack bus, and the other buses as the branches or load buses. By using the forward–backward sweep method, the power flow analysis for the distribution system is resolved without much calculation and efficiently at each iteration [21]. This forward–backward method uses the principle of Kirchoff’s law to calculate the current. The first forward–backward sweep method is a forward sweep to calculate the amount of current flowing in the line from the earliest bus to the last. The second is a forward sweep to calculate the value of the voltage reduction on each line by multiplying the previously calculated current value with the line impedance value [22].
A genetic algorithm (GA) is an algorithm that seeks to apply an understanding of natural evolution to problem-solving tasks. The approach taken by this GA is to combine randomly the best solution choices in a set to obtain the next best solution generation, namely, in a condition that maximizes its fit or commonly called fitness. This generation will present improvements in the initial population. By doing this process repeatedly, this GA is expected to simulate an evolutionary process. To use a GA, the problem solution is represented as chromosomes. Three aspects are important for the use of a GA [23]: (1) definition of the fitness function; (2) definition and implementation of genetic representation; and (3) definition and implementation of genetic operations. The minimizing of active power losses in the network is taken into consideration as the objective function in the optimization problem of optimal DG unit placement, finding the ideal placement and size of the dispersed generating units utilizing the hybrid genetic dragonfly algorithm as an optimization tool [24,25,26,27]. To allocate multiple DG units in a distribution network in the most effective way, a powerful optimization technique based on the sine cosine algorithm (SCA) and chaos map theory was proposed [28,29,30,31]. The genetic algorithm (GA), differential evolution (DE), particle swarm optimization (PSO), artificial bee colony (ABC), harmony search (HS), gray wolf optimization algorithm, and backtracking search optimization algorithm have all been mentioned in this paper as being used to determine the ideal size and location of DG units [32,33,34,35,36].
Based on the background, the optimization method that can be used is the genetic algorithm. The purpose of this paper is to simulate the feeder distribution network of the Lingke Krueng Cut PLN Banda Aceh City—Indonesia (Indonesian State Electricity Company). The determination of this distribution network is because this feeder has a value of electric power losses and a voltage reduction, and in this feeder, the voltage profile is outside the allowable tolerance. To address this problem, it is possible to place DG in this feeder with the hope of being able to improve the value of the power losses and the voltage profile found in the distribution system feeders used for this optimization. To simulate the distribution network in this study, the ETAP power station application was used, and the Matlab application was used to analyze it.

2. Materials and Methods

The ETAP and Matlab apps were the ones utilized in this simulation. To create “electrical digital twins” and analyze system dynamics, transients, and protection electric power, ETAP (Electrical Transient Analyzer Program) version 19.0 was used. ETAP is a software electrical network modeling and simulation software tool used by power system engineers. In this work simulation, MATLAB 2018, a high-level programming language designed primarily for numerical computing, programming, and visualization, was used.
A genetic algorithm was used to determine the optimal capacity and location of the DG, which produces the minimum power loss value and also the voltage value according to the standard provisions on the bus, namely 1.05 p.u. and 0.95 p.u., as shown in the flow chart (Figure 1).

2.1. Power Flow in Radial Distribution Networks

2.1.1. Backward Sweep

The procedure for completing the power flow starts with a backward sweep. In the first iteration, all voltages are assumed to be the same as the voltage at the main source. If there are multiple sources in the network, the compensating injection current at those sources is zero in the first iteration. On the other hand, the voltage at each point and the compensation injection current are calculated in the previous iteration. When the voltage at each point and the compensation injection current are known, the load current can be found using Equation (1).
I l d i   = [ P i + j Q i V i ] *
where I l d i   is the load current at point i; P i is the active power requirement at point i; Q i is the reactive power requirement at point i; and V i is the voltage at point i.

2.1.2. Forward Sweep

In the forward sweep, starting from the main source point where the voltage value is known, the impedance and current flowing in each line are known, and all voltages are not renewed and ignore other sources, if any, as in Equation (2).
V i = V u i Z i I L i                   i = I ,   ,   N
where V i is the voltage at point i; V u i is the voltage on top of point i; Z i is the impedance of line i; and I L i is the current flowing in line i.
Figure 2 is an example of a 6-bus radial distribution system that can be formed using the BBIC, BCBV, and DLF matrices.
  • Forming the BBIC Matrix
Kirchhoff’s Current law (KCL) is applied to the system in Figure 2. The branch current can be expressed by the equivalent injection current value as follows:
B 1 = I 1 + I 2 + I 3 + I 4 + I 5 + I 6
B 2 = I 3 + I 4 + I 5 + I 6
B 3 = I 4 + I 5
B 4 = I 5
B 5 = I 6
Based on the equation above, the BBIC matrix equation can be formed as follows:
[ B 1 B 2 B 3 B 4 B 5 ] = [ 1 1 1 1 1 0 1 1 1 1 0 0 1 1 0 0 0 0 1 0 0 0 0 0 1 ] [ I 1 I 2 I 3 I 4 I 5 ]
The branch current equation above can be arranged, in general, as follows:
[ B ] = [ B B I C ] [ I ]
2.
Compiling the BCBV Matrix
The relationship between branch current and bus voltage can be expressed as follows:
V 2 = V 1 B 1 Z 12
V 3 = V 2 B 2 Z 23
V 4 = V 3 B 3 Z 34
V 5 = V 4 B 4 Z 45
V 6 = V 3 B 5 Z 36
By substituting Equation (10) into Equation (11), the voltage at bus 3 is obtained as follows:
V 3 = V 1 B 1 Z 12 B 2 Z 23
The value of the voltage at the other bus can be written as follows:
V 4 = V 1 B 1 Z 12 B 2 Z 23 B 3 Z 34  
V 5 = V 1 B 1 Z 12 B 2 Z 23 B 3 Z 34 B 4 Z 45
V 6 = V 1 B 1 Z 12 B 2 Z 23 B 5 Z 36
Based on Equations (10), (15)–(18), the following equations can be arranged to calculate the voltage reduction:
V 1 V 1 V 1 V 1 V 1 V 2 V 3 V 4 V 5 V 6 = Z 12 0 0 0 0 Z 12 Z 23 1 1 0 Z 12 Z 23 Z 34 1 0 Z 12 Z 23 Z 34 Z 45 1 Z 12 Z 23 0 0 Z 36 B 1 B 2 B 3 B 4 B 5
Equation (19) can be arranged, in general, as follows:
[ Δ V ] = [ B C B V ] [ B ]
Then, Equation (8) can be substituted into Equation (20) so that the equation becomes
[ Δ V ] = [ B C B V ] [ B B I C ] [ I ]
[ Δ V ] = [ D L F ] [ I ]
by obtaining the BIBC, BCBV, and ΔV matrices, we can calculate the voltage value at each bus. The voltage value at each bus can be calculated with the following equation:
[Vi] = [V1] − [ΔV]

2.2. DG Data Reading

In the initial process before selecting or optimizing the placement and capacity of DG, the thing to carry out is find out how many individuals will be generated and also how many variables will be generated as a comparison of other variables. Where the variables in question are: (1) Capacity P contains the maximum value of DG capacity to be installed in the system, and the installed value is active power P (kW). The P value that will be installed during the process is a max of 500 kW, which is the maximum output power limit of the small type of distributed generation. (2) In this paper, the number of DGs that will be installed on the system is 3 DGs.

2.3. DG as Negative Load

Two types of buses have different characteristics, as a load (load) or as a generator. The load absorbs power from the system while the generator supplies power. The generator flow direction is opposite to the load power flow direction when it is installed in the distribution line. The type of bus for injecting DG into the system is a load bus, but with a negative sign which will carry information that DG acts as a generator [37].
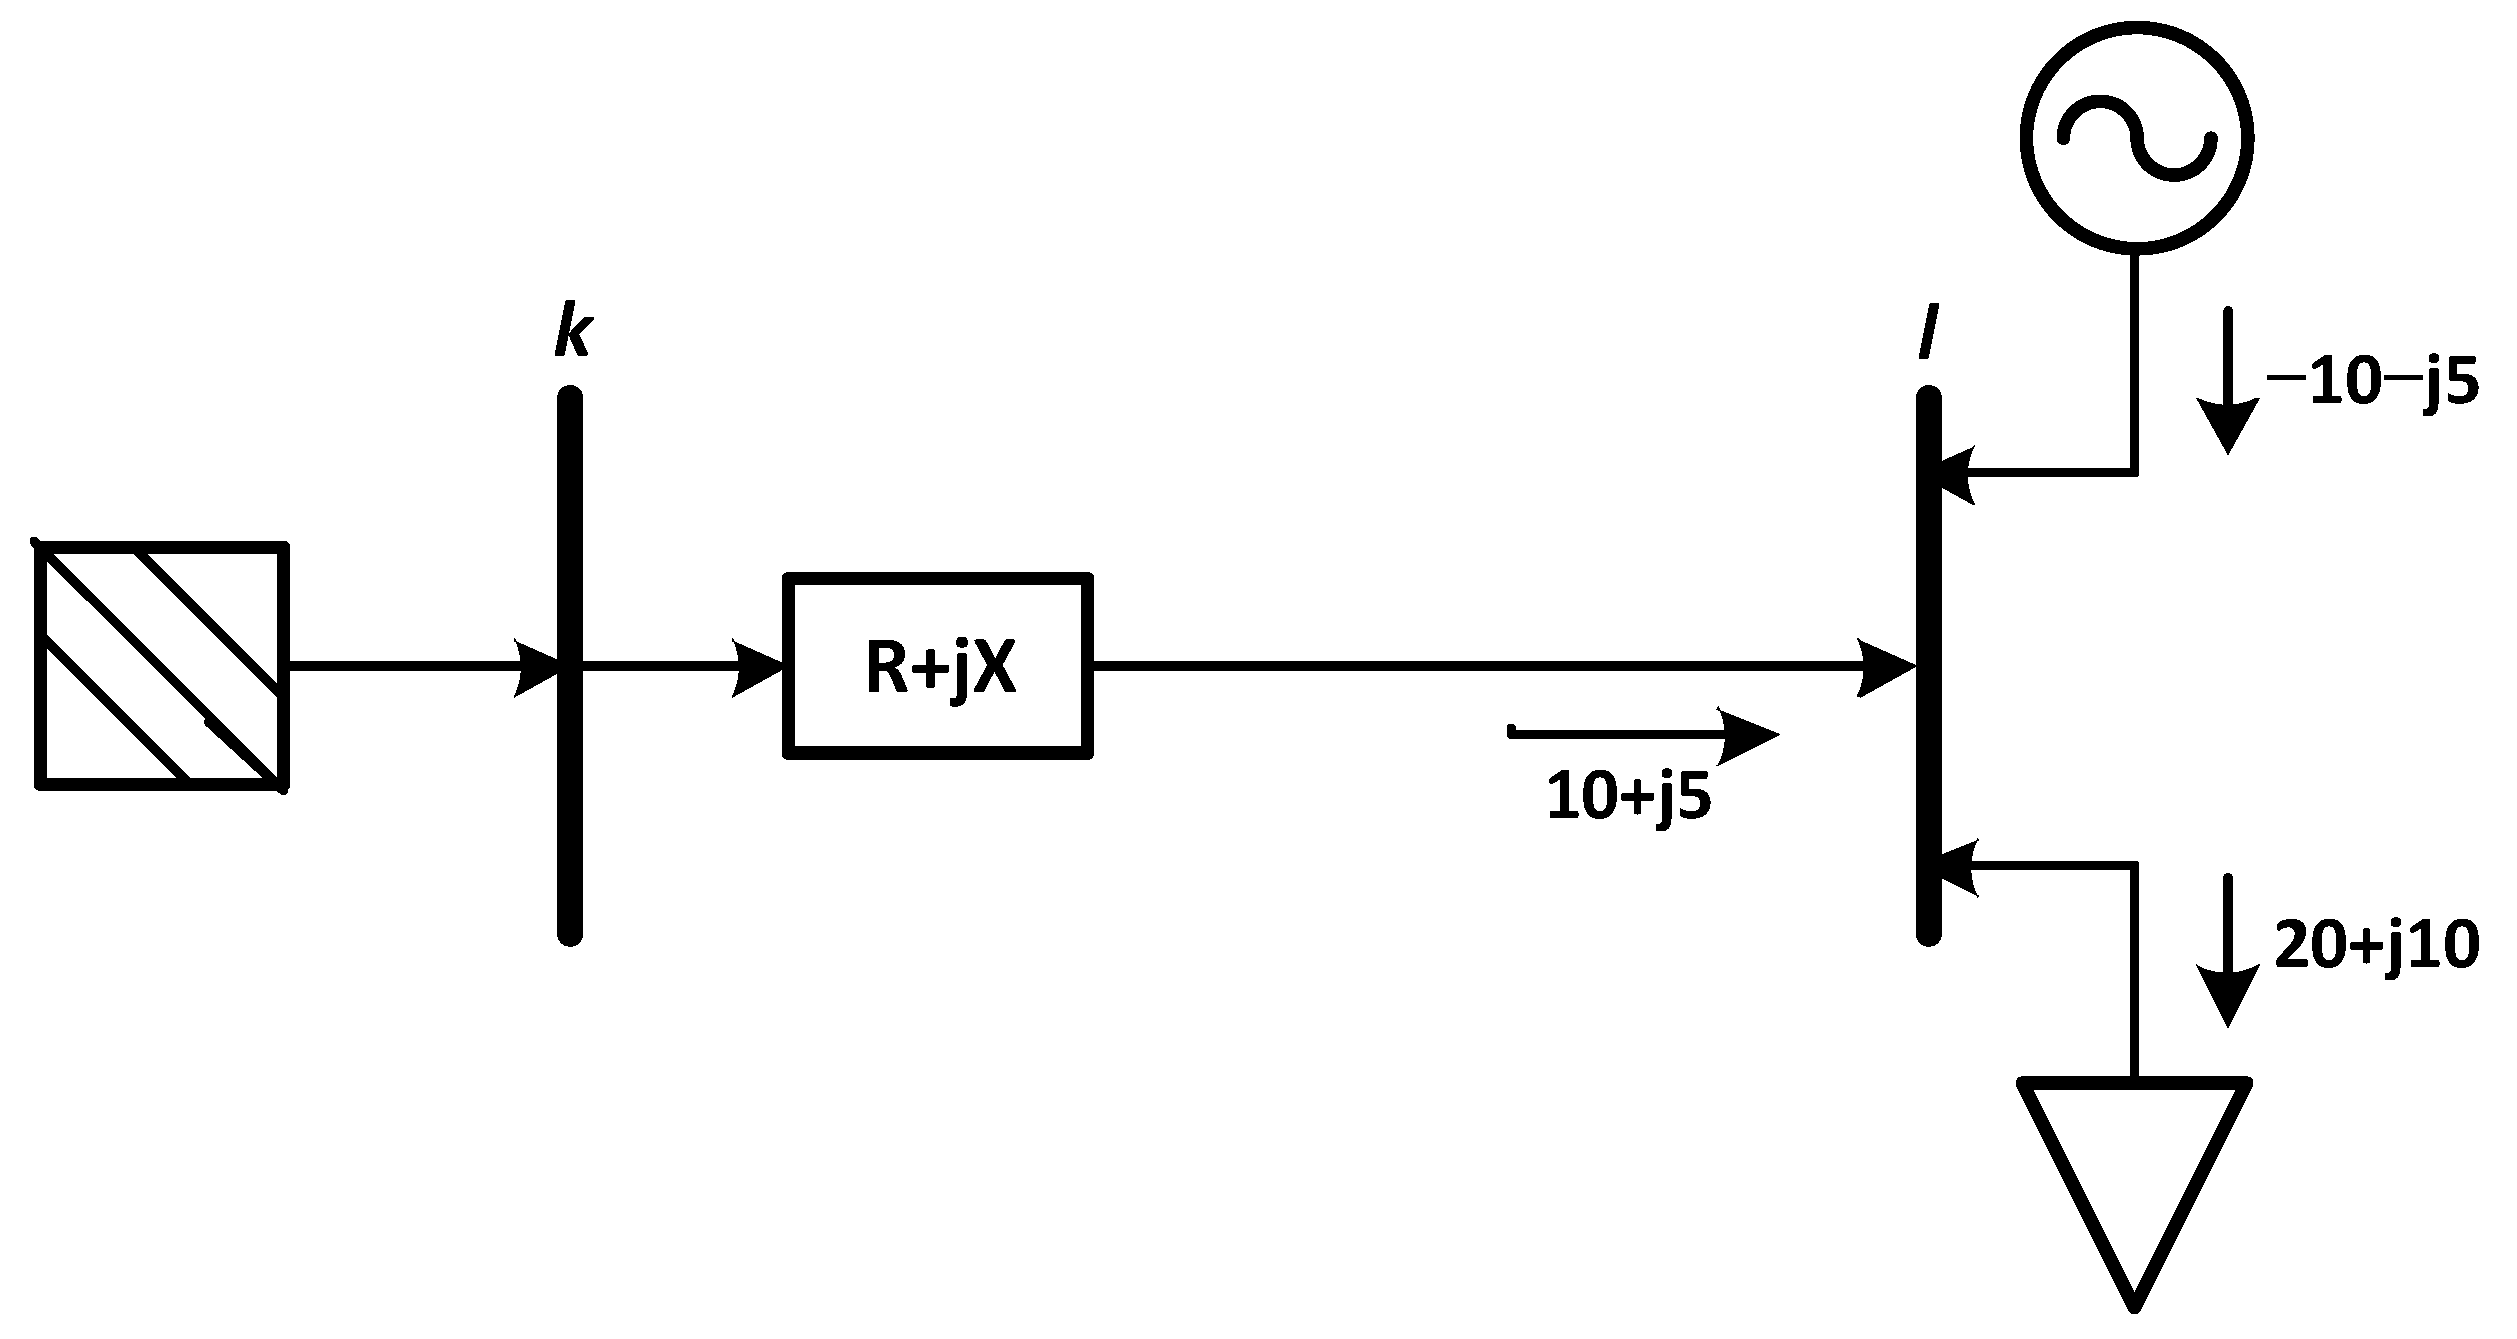
Based on Figure 3, it can be understood that when a load is installed in the form of distributed generation with a capacity of 10 + j5, the total load attached to bus 2 is 20 + j10 − 10 − j5 = 10 + j5. If the distributed generator on bus l is replaced with a load that has the same value, the total load installed is 20 + j10 + 10 + j5 = 30 + j15.

2.4. Raise the Initial Population

The initial population is generated randomly, so the placement of DG is conducted randomly without having to look at which bus to place. This individual design is nothing but a group of individuals that will be processed together in one cycle of the evolutionary process. The first determines the pop size parameter as the individual variable to be generated, and then string length as the number of genes or a representative of the number of buses to be processed. The placement and capacity generated for each variable are carried out with a limitation of 3 DG placements at the bus position, where each placement is given a capacity with the result of optimizing the capacity itself.
In the generated population is the use of binary numbers where every 1 (one) value represents a DG placement, while a value of 0 (zero) means there is no DG placement.

2.5. Objective Function

The method used to determine the most optimal DG location is to find the minimum losses between the buses installed by DG while taking into account the limitations of DG capacity. The objective function is as follows:
F = M i n   { P t = i = 1 n I i 2 R i }
where F is the objective function, Pt is the total active power loss, Ii is the i-th bus line current, Ri is the i-th bus resistance, and n = the number of buses in the system.
Subjective function is as follows:
i = 1 n P G i + P D G = i = 1 n ( P i + P l o s s )
where P G i is the active power generated (kW); P D G is the active power DG (kW); P i is power on load (kW); and P l o s s is power loss (kW).
Limits or constraints are rules in the form of parameter values that must be passed in a process as a selection function. Boundaries make the selection process more effective because there are conditions that must be met. The limitations used in this final project are
Vmin < Vbus < Vmaks
Vmin = (Vbase − 5% × Vbase)/Vbase
Vmax = (Vbase + 5% × Vbase)/Vbase
This limit is the standard voltage tolerance allowed on the bus system that applies to most large companies, which is a max value of 1.05 p.u. and a min of 0.95 p.u.

2.6. Create the New Population

The optimization process using GA sometimes requires the creation of new individuals. This happens because the initial population has a fitness value that is less than optimal, so it is necessary to generate new individuals to find optimal results from the previously generated initial population. This process occurs utilizing reproduction and crossover processes.

2.7. Generate New Population

To generate a new population, you must first know the condition of the individuals because there are several individuals in the population. The number of individuals can be generated by a new population randomly so that it can be directly processed into fitness to find optimal results.

2.8. Location Determination DG using GA

The following is a design for determining the location of DG. This design is determined based on the total power losses in the system according to Equations (29) and (30).
S r   = S l o a d S D G
P D G , l o s s   = r e a l ( S r )
where Sload and SDG are the power consumed by the load and the power generated by DG; so, to obtain the amount of power loss after installing DG, the power consumed by the load is reduced by the power generated by DG.
Determining the location of the DG using the genetic algorithm method is searched based on the random value assigned by the GA to each variable. The random value is in the form of a binary value which is then used as a solution in determining the location of the DG. The optimal installation of DG in a distribution system that has a large number of buses is a problem that can only be solved by an optimization method. Because the possibility of installing DG in the system is very large, it is assumed that every bus allows DG installation except for the grid bus. So, with so many possible combinations in this paper, a genetic algorithm method is used to obtain the determination of the DG location enabling all of these combinations to be resolved optimally to minimize the total system power loss.

3. Results

The data obtained from PT PLN (Office of the Indonesian State Electricity Company) UP3 (Unit Pelaksana Pelayanan Pelanggan/unit of − executor − service − customer) Banda Aceh, Indonesia, for the Lingke Krueng Cut feeder, consist of 37 distribution transformer buses with power data for each transformer, loading, resistance, and reactance.
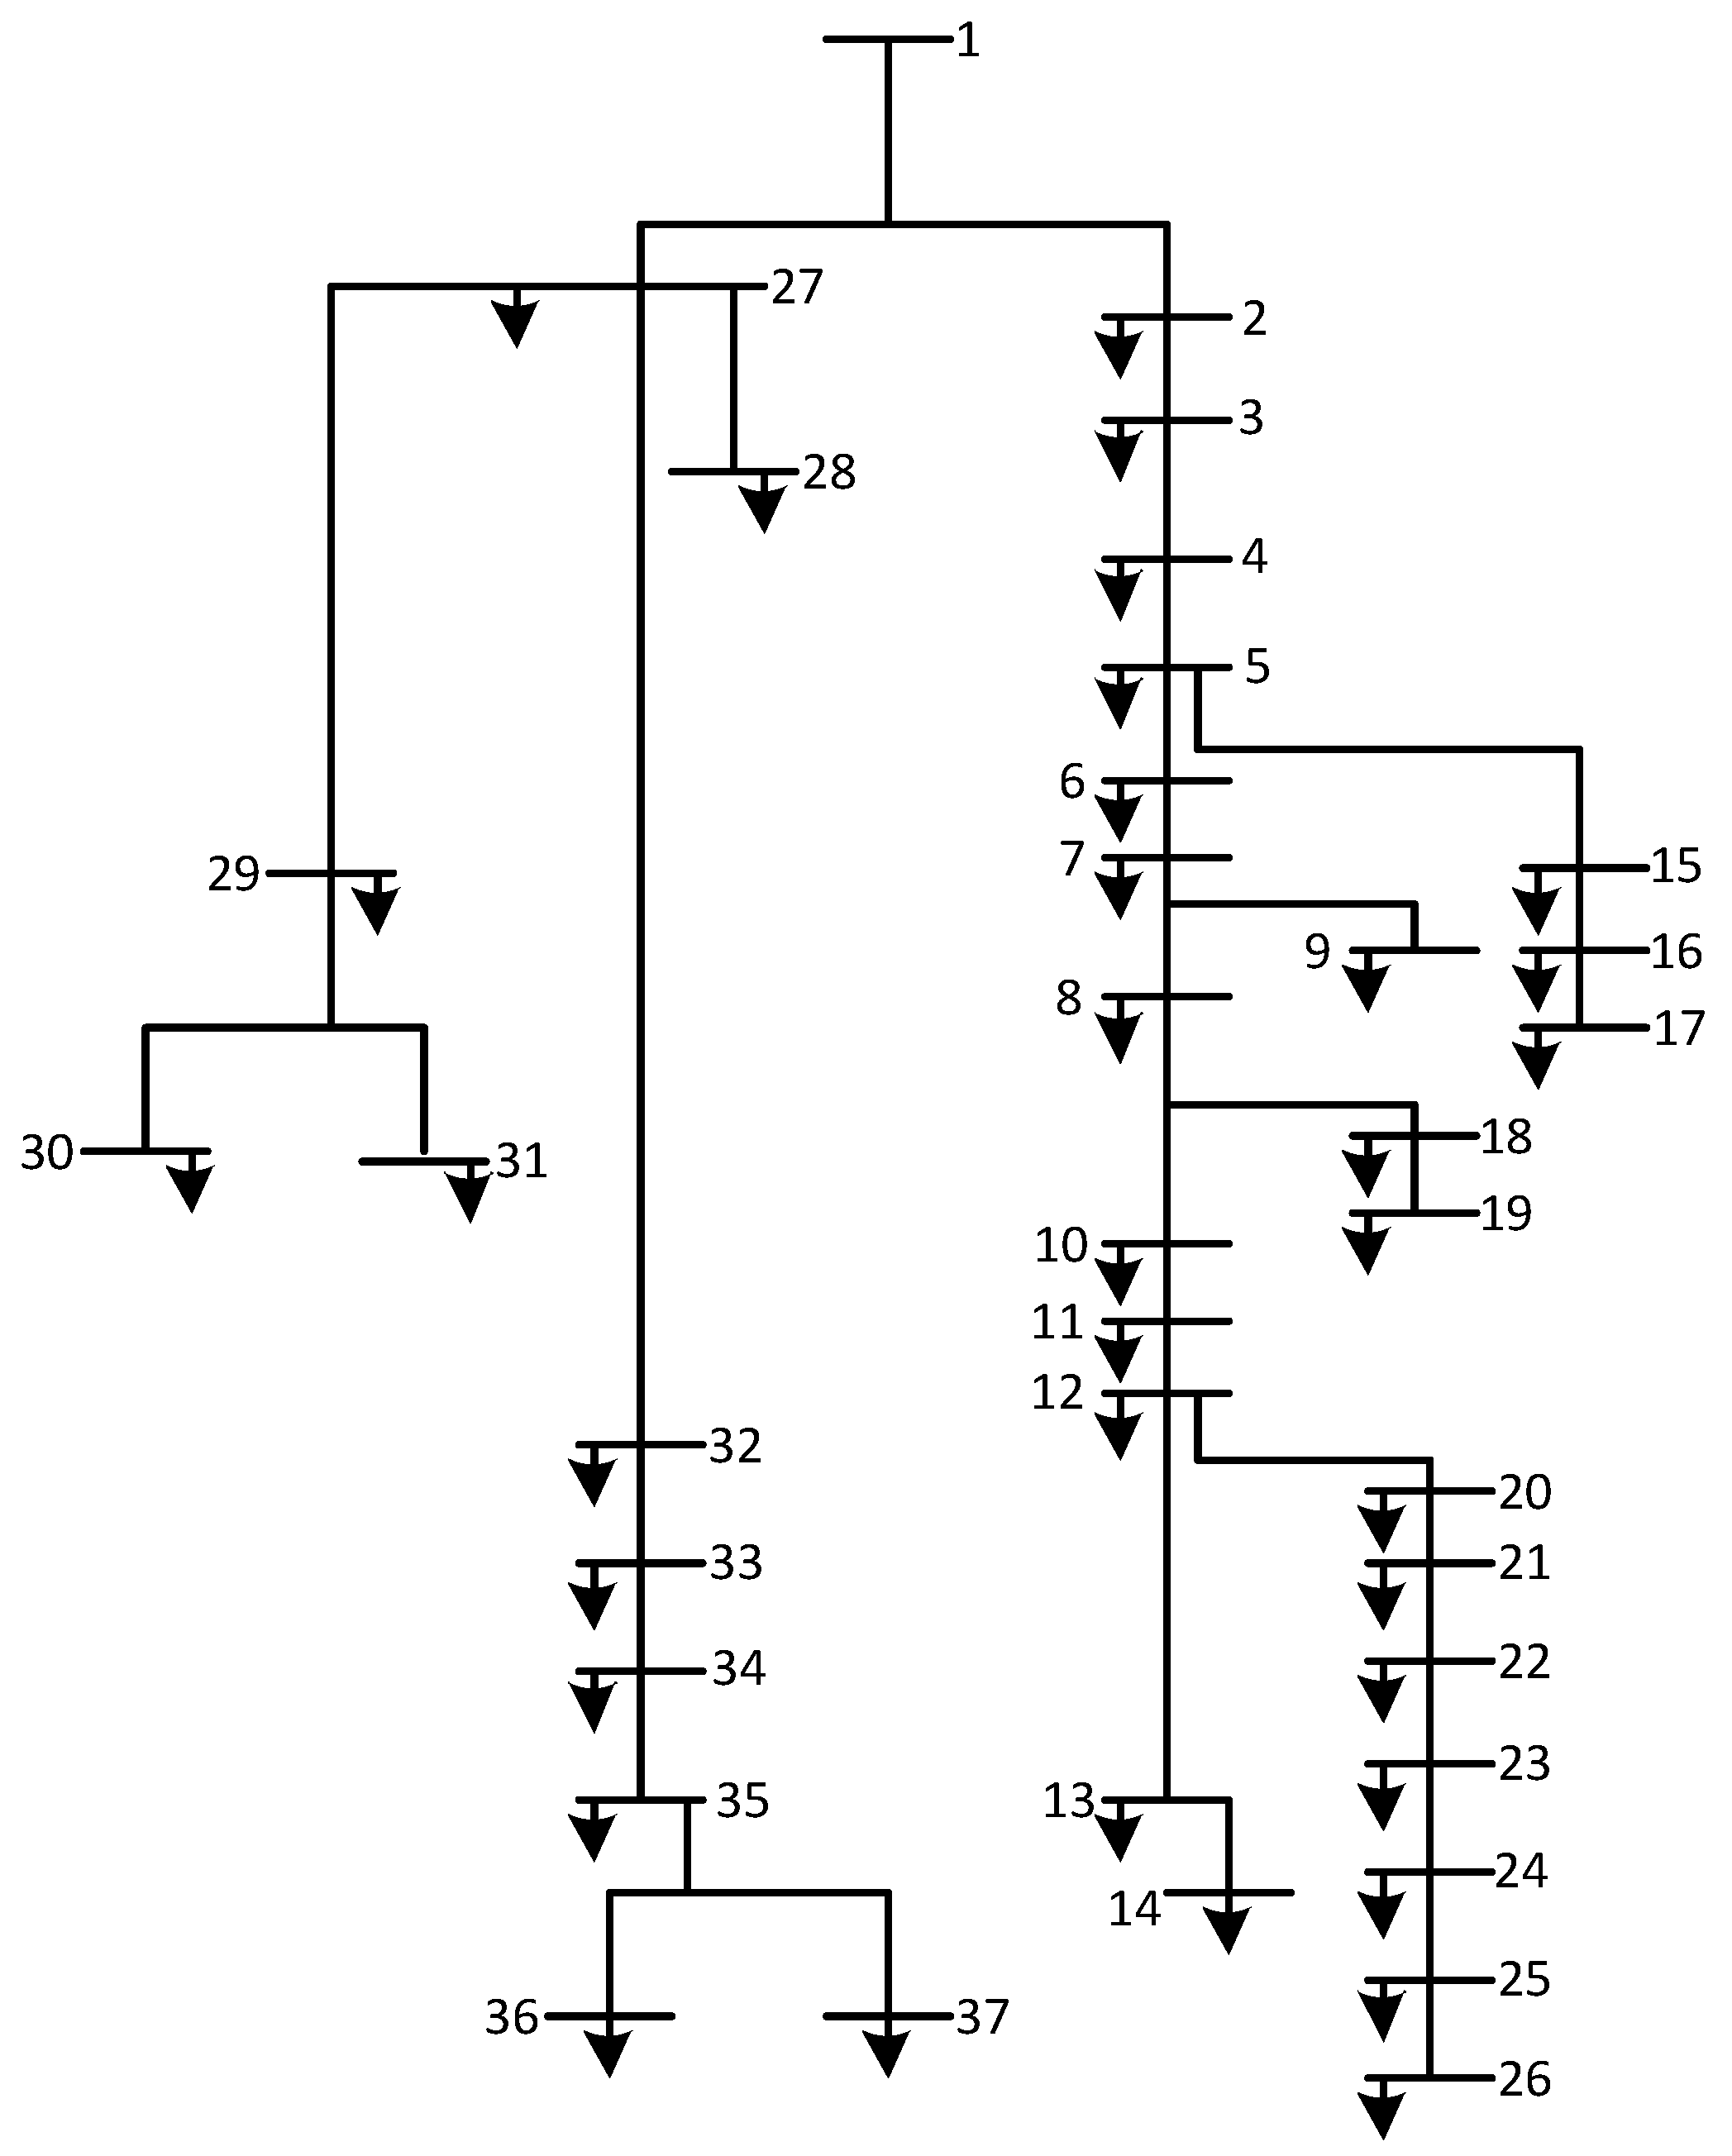
Figure 4 shows a single line diagram of the distribution network of the Lingke KRC feeder which will be used in the DG placement optimization simulation to minimize the resulting line losses, maintain a satisfactory voltage profile, and then calculate the load variations. Bus numbers from 1 to 37 are from the source to the farthest load, or the location of the bus that is likely to be placed by DG, but for optimal power flow, the position and capacity must be searched using a genetic algorithm and following changing load conditions.

3.1. Data Analysis before DG Placement

The results of the power flow using the application obtained total losses for active power amounting to 54.67337875 kW, while total losses in reactive power obtained amounted to 13.76872173 kVAr. The largest active power loss occurred on bus 4 to bus 5 which was 12.33711406 kW, and the largest reactive power loss occurred on bus 3 to bus 4 which was 3.525 kVAr. The value of the largest power loss on the line from bus 4 to bus 5 was due to having a long distance, so the resistance and reactance were also large and also due to the large loading on bus 4. Meanwhile, the smallest active power loss value was located on bus line 25 to bus 26 with an active power loss of 0.003382293 kW.
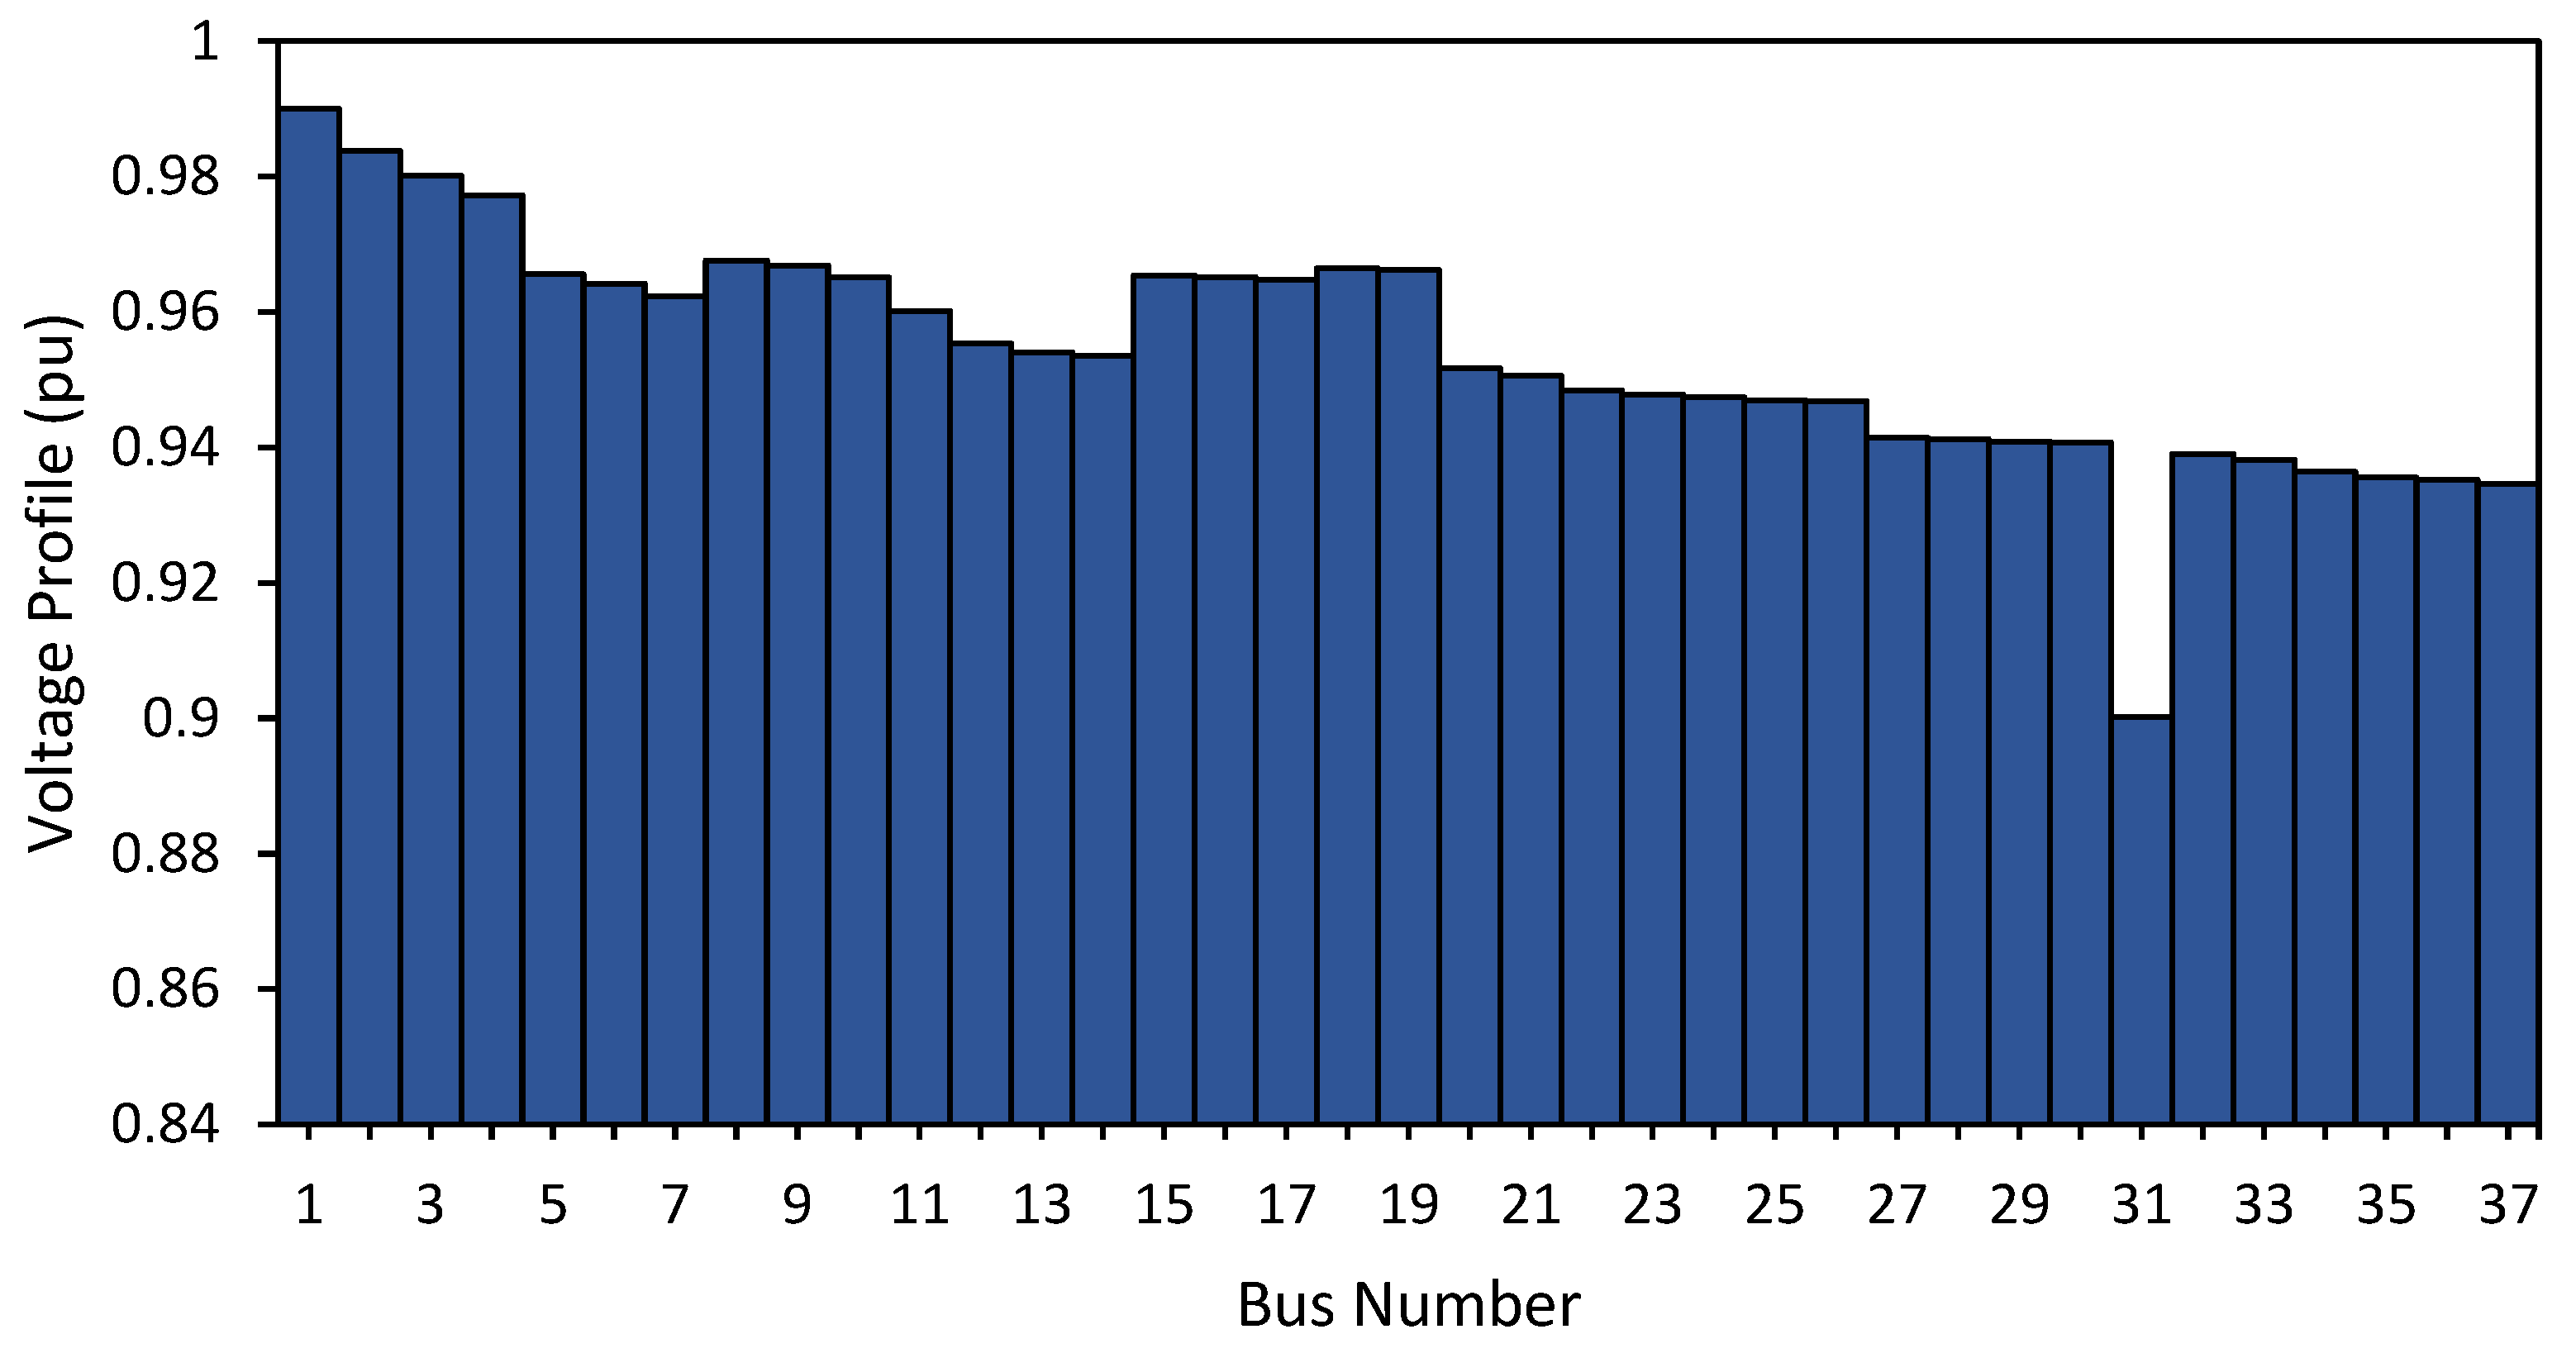
As a result of the power flow, there were several buses that experienced under voltage. Out of a total of 37 buses in the network, 15 buses experienced under voltage or the voltage was outside the minimum limit set by PLN, namely 0.95 p.u. Installation of DGs on the network can improve the voltage profile. However, the installation of DGs in the distribution system can also allow the voltage on the bus to experience over-voltage, so it is necessary to determine the location of the installation and the capacity that may be installed on the network so that the voltage is at the standard provisions on the bus, namely 1.05 p.u. and 0.95 p.u. The following is a graph of the relationship between the buses in the Lingke KRC feeder distribution system and the voltage profile of each bus at initial conditions (Figure 5).

3.2. Optimization of DG Placement and Capacity under Normal Load

The determination of place and capacity is randomly generated by the GA, where the maximum capacity used by DG is 500 kW. Placement and size of DG in the GA process to use random generation, then become a growing population by undergoing a genetic algorithm process.
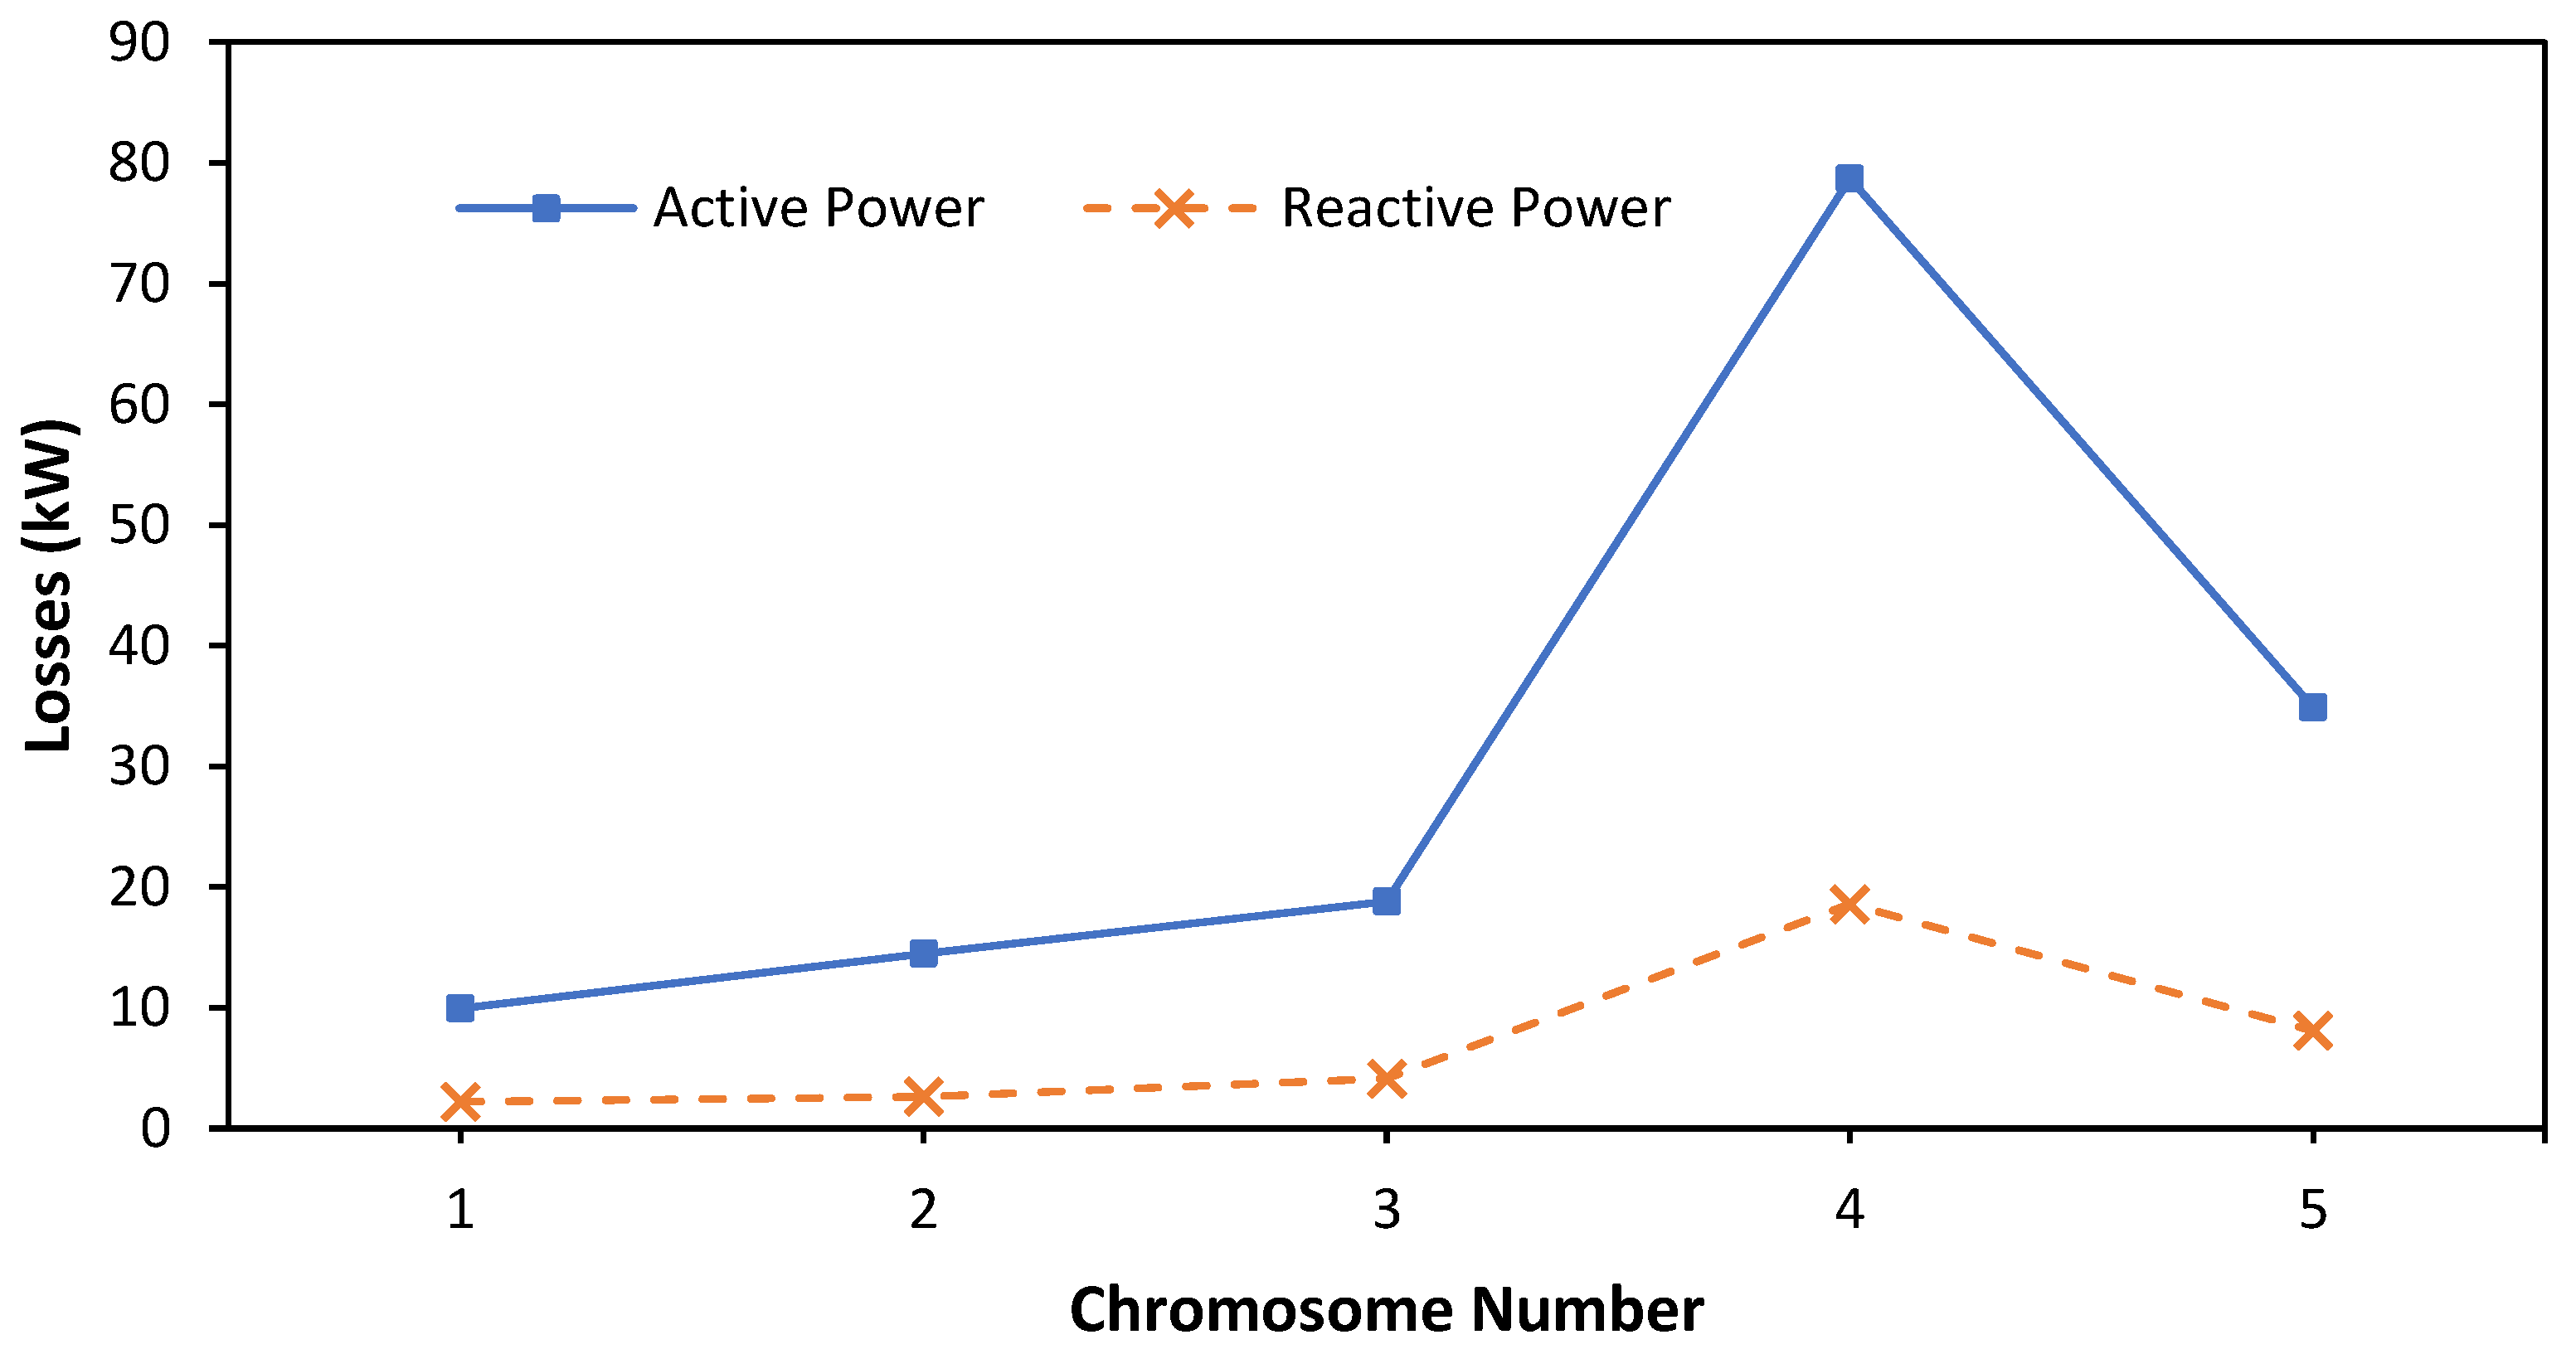
Individuals are generated using binary numbers where each value of 1 (one) is a DG placement, while a value of 0 (zero) means there is no DG placement. In the individual showing the best chromosome generated, the number of chromosomes is five. Then, the best chromosome is selected (Figure 6), namely, the chromosome that has the minimum active power loss value, in this case, chromosome number 1, which has an active power loss of 9.9443 kW.
Optimization results show that the positions or placements of DGs are on bus 18 with a size of 190 kW, bus 20 with a size of 463 kW, and bus 32 with a size of 370 kW. The following results are shown in Table 1. At a normal load for three DGs, the placement and active and reactive power losses are obtained. Genetic algorithm (GA) optimization for normal loads obtained the optimal placement and size of DG, namely on buses 18, 20, and 32 with DG sizes of 190, 463, and 370 kW, respectively. After optimization using the GA (genetic algorithm), the total value of active power losses is 9.9443 kW with three DG placements on the bus. Whereas, before the placement of DG, there was a total value of active power losses of 54.6733 kW. This proves that the placement of DG can improve active power losses. There is an improvement in the voltage profile at each bus after the placement of DG compared to before the placement of DG, with an average voltage profile improvement of 0.032745 p.u.

3.3. Comparison of Data Results before and after Optimization of DG Placement

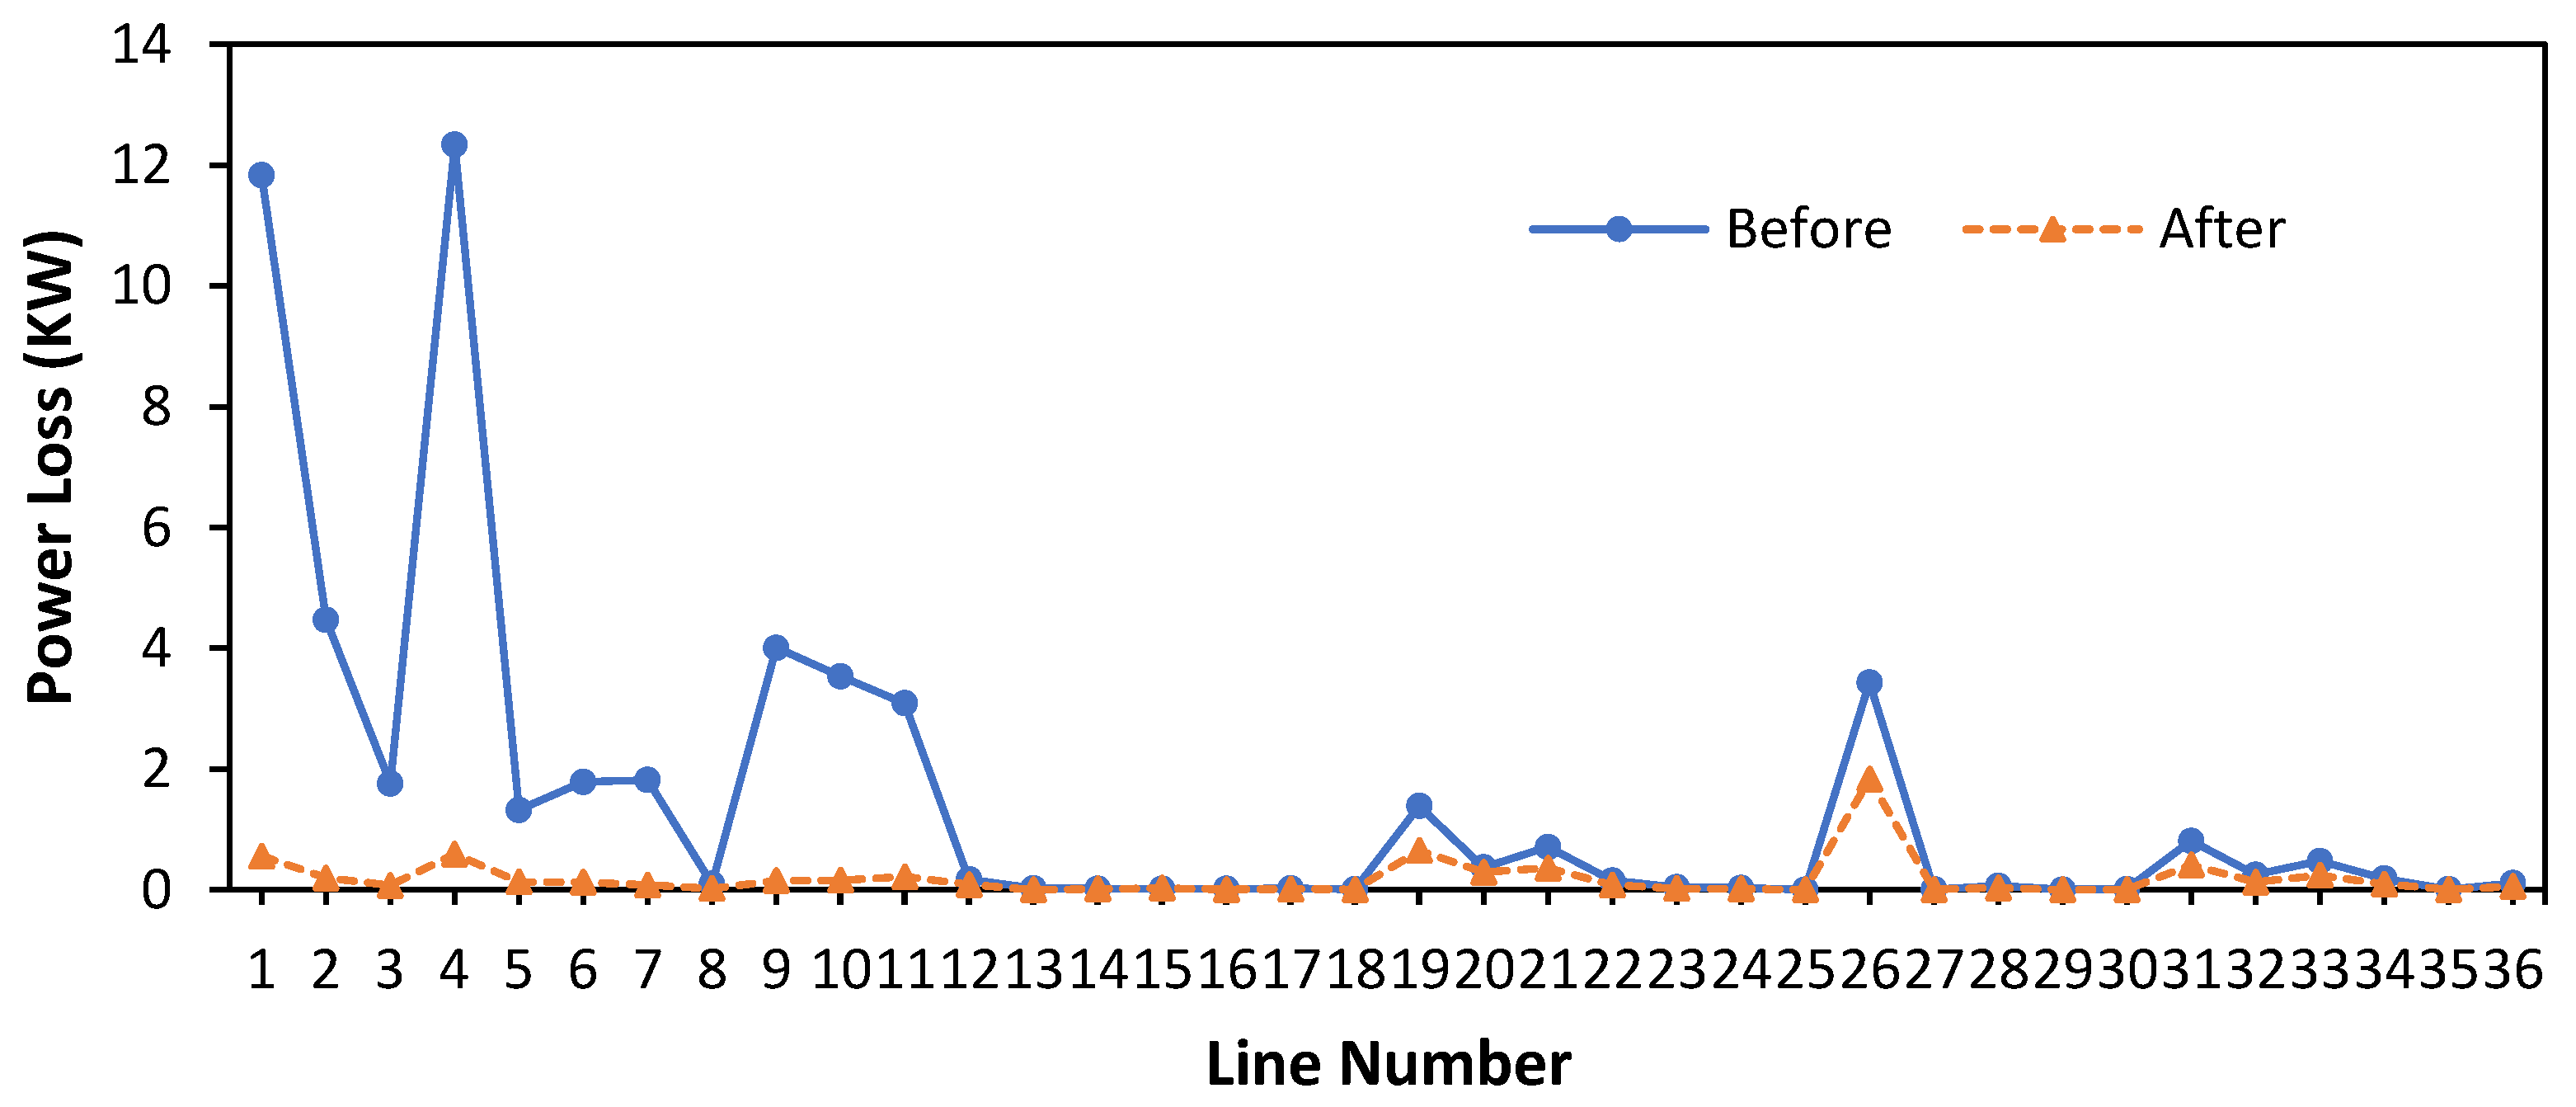
Figure 7 shows data results before optimization and after DG is installed. Before optimizing, the largest power loss occurred in line 4, namely 12.33711406 kW; after optimization, it decreased to 1.2864 kW, decreasing by 11.050714 kW. As for the comparison of the voltage profile, it can be seen in Figure 8.
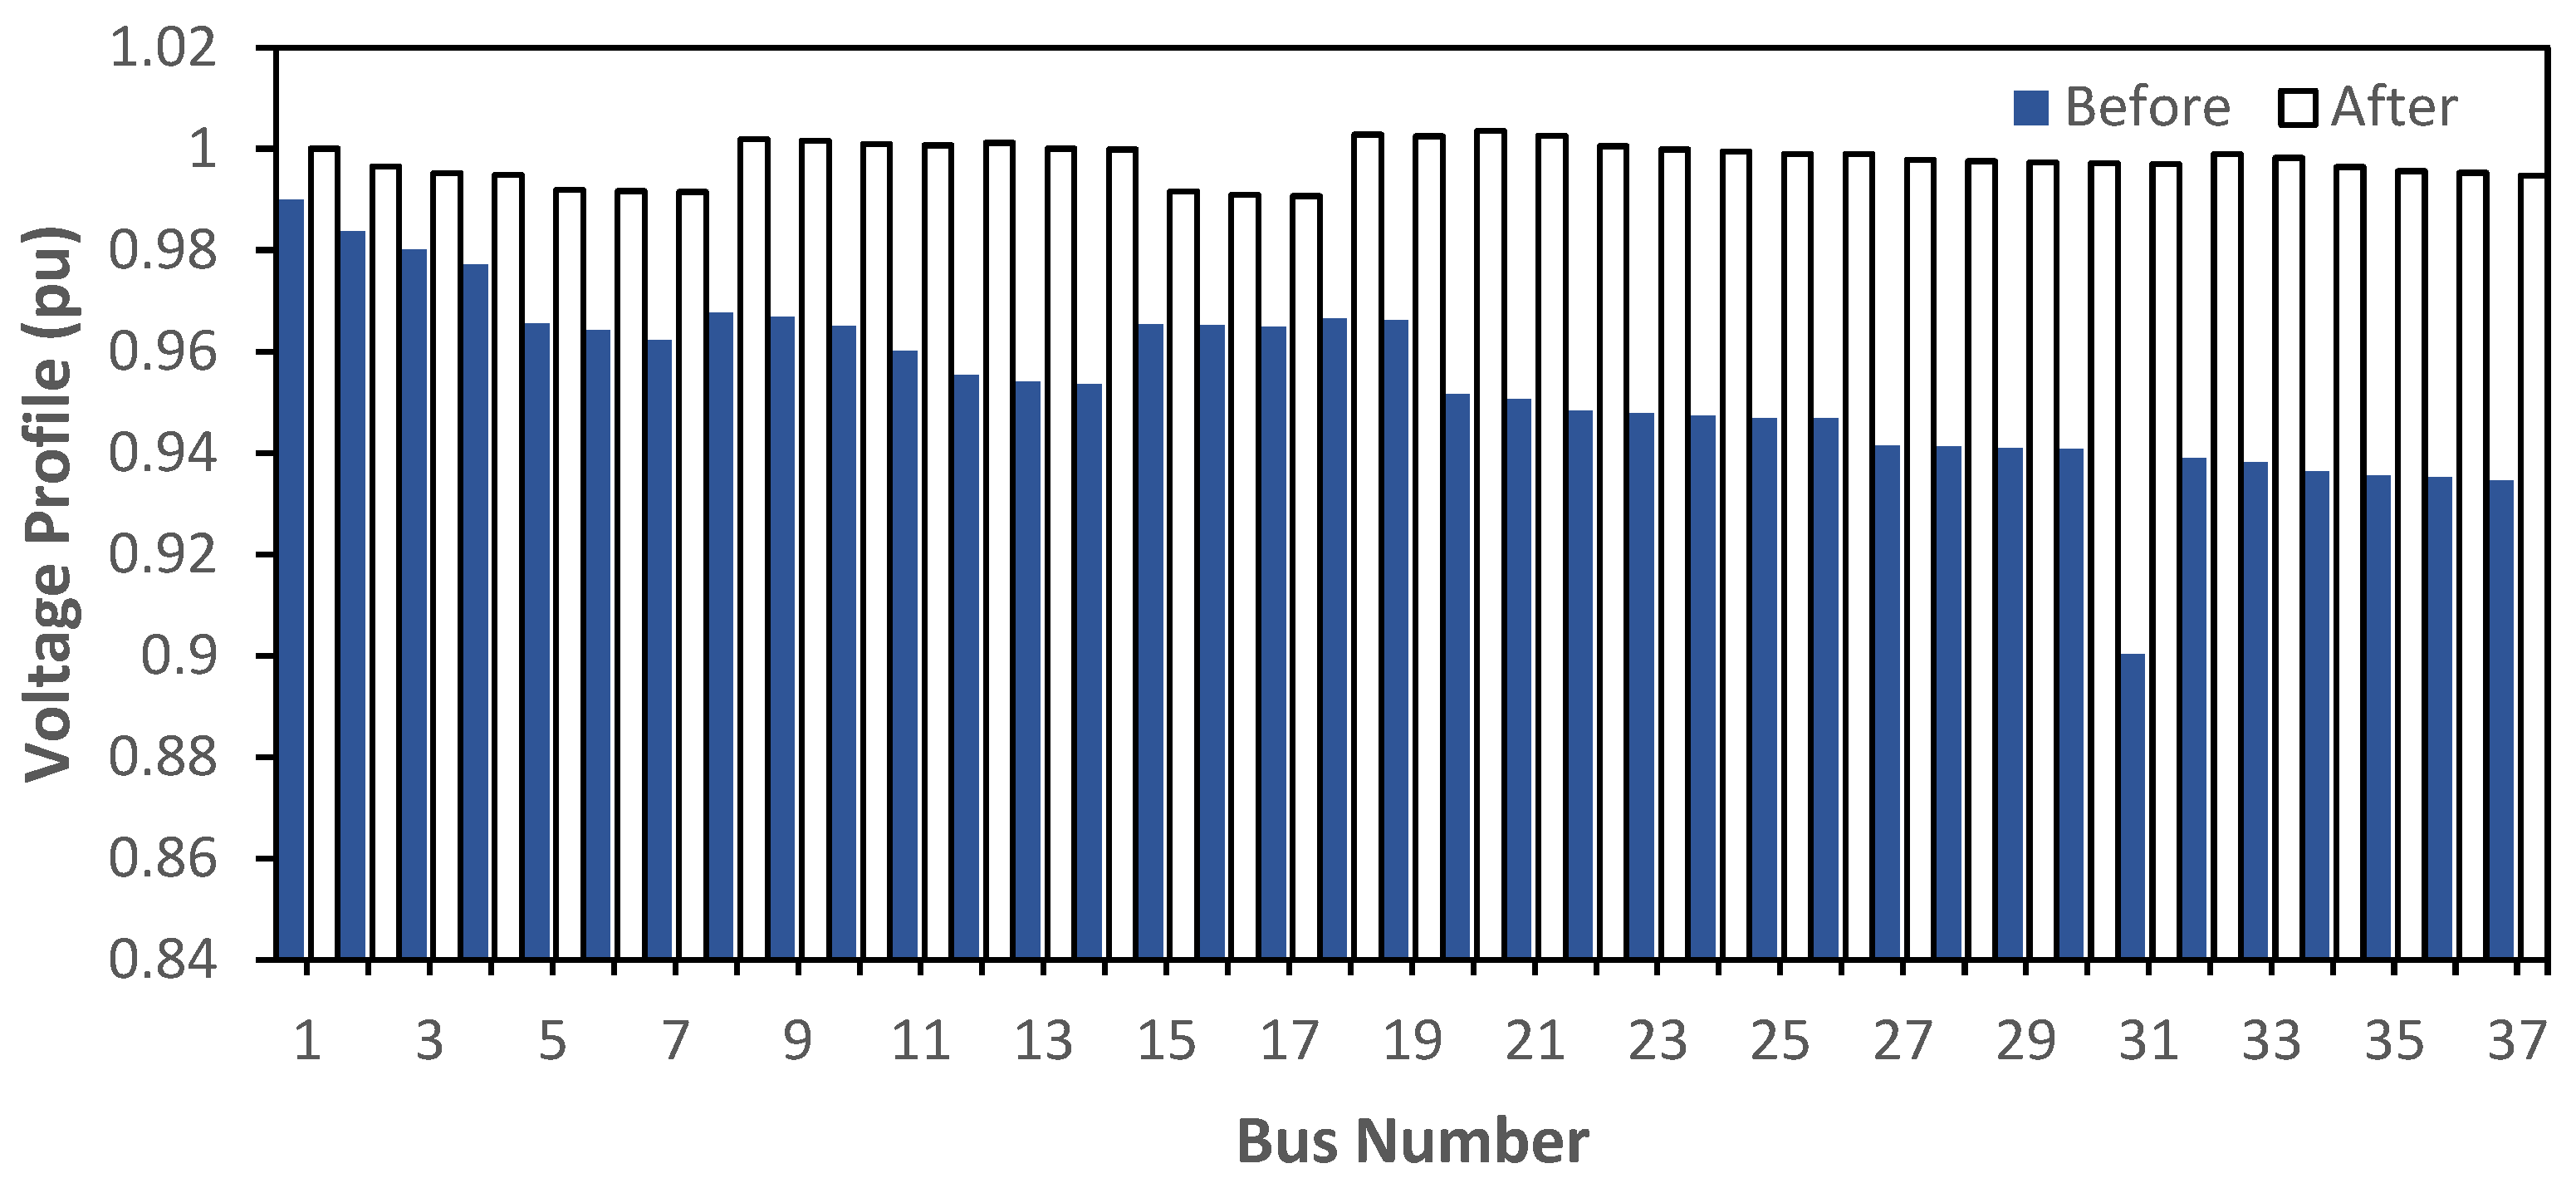
Figure 8 can be seen as a comparison of the voltage profile without and with DG installation optimization. Before DG was installed, there were still several buses that were under voltage; however, after DG was installed, all voltage profiles were within the allowable tolerance limits. If the load is constant, the line power loss can be reduced by reducing the line current by increasing the system voltage profile.

3.4. Comparison of Calculation Results with ETAP and GA as Validation

Testing the results of simulated data on ETAP after DG placement is intended to compare the value of active power losses and the value of reactive power losses by calculating using the GA with Matlab. In addition, it aims to prove validation between ETAP and the GA with Matlab.
In Table 2, in the GA calculations on Matlab on bus 5 to bus 6, the power losses were 0.1097 kW, while in the ETAP simulation, the power losses were 0 kW, with a difference of 0.1097 kW. Likewise, on bus lines 6 to 7 and 7 to 9, the power losses were greater with the GA in Matlab, compared to the ETAP simulation. However, on lines 1 to 27, the active power losses of 0.2248 kW on the GA on Matlab and 1.5 kW on ETAP were much larger. Overall, the power losses were 9.9443 kW on the GA on Matlab and 13.7 on ETAP. The reactive power losses in the calculation of the GA on Matlab are 2.2130 kVAR; meanwhile, in the ETAP simulation, the power losses were 7.2 kVAR. This shows that the simulation with the GA on Matlab is better.

3.5. Optimization of DG Placement and Capacity with Load Decrease and Load Increase for All Percentages

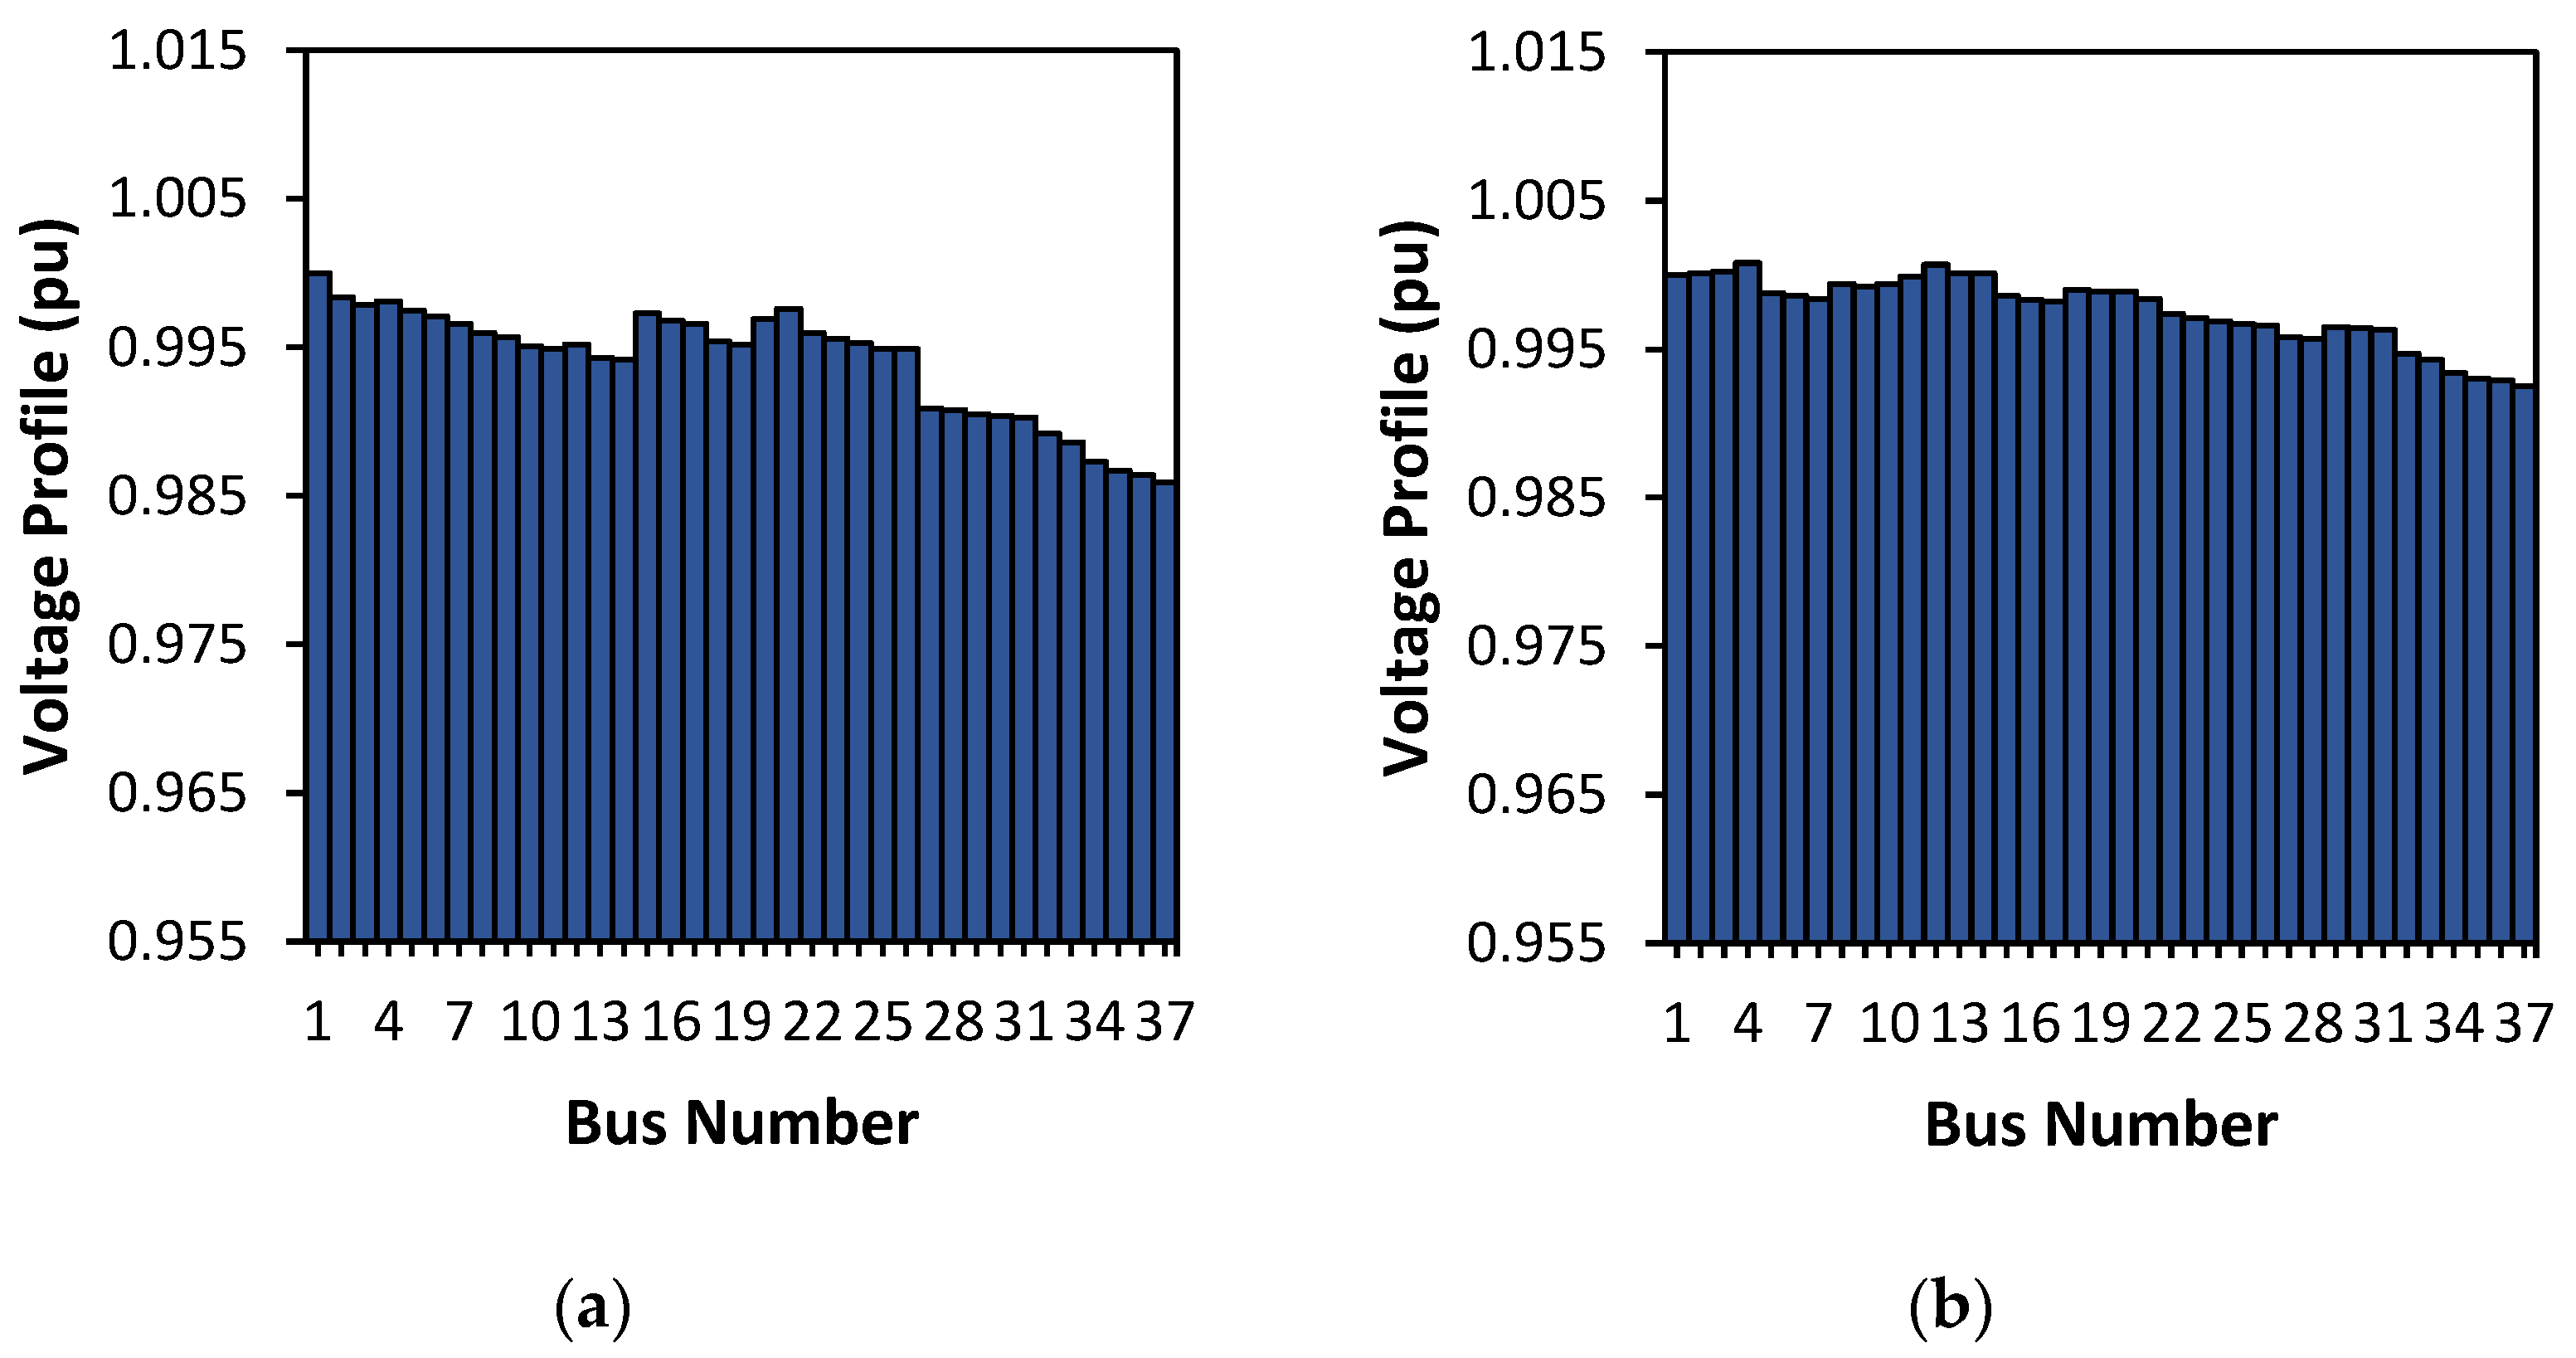
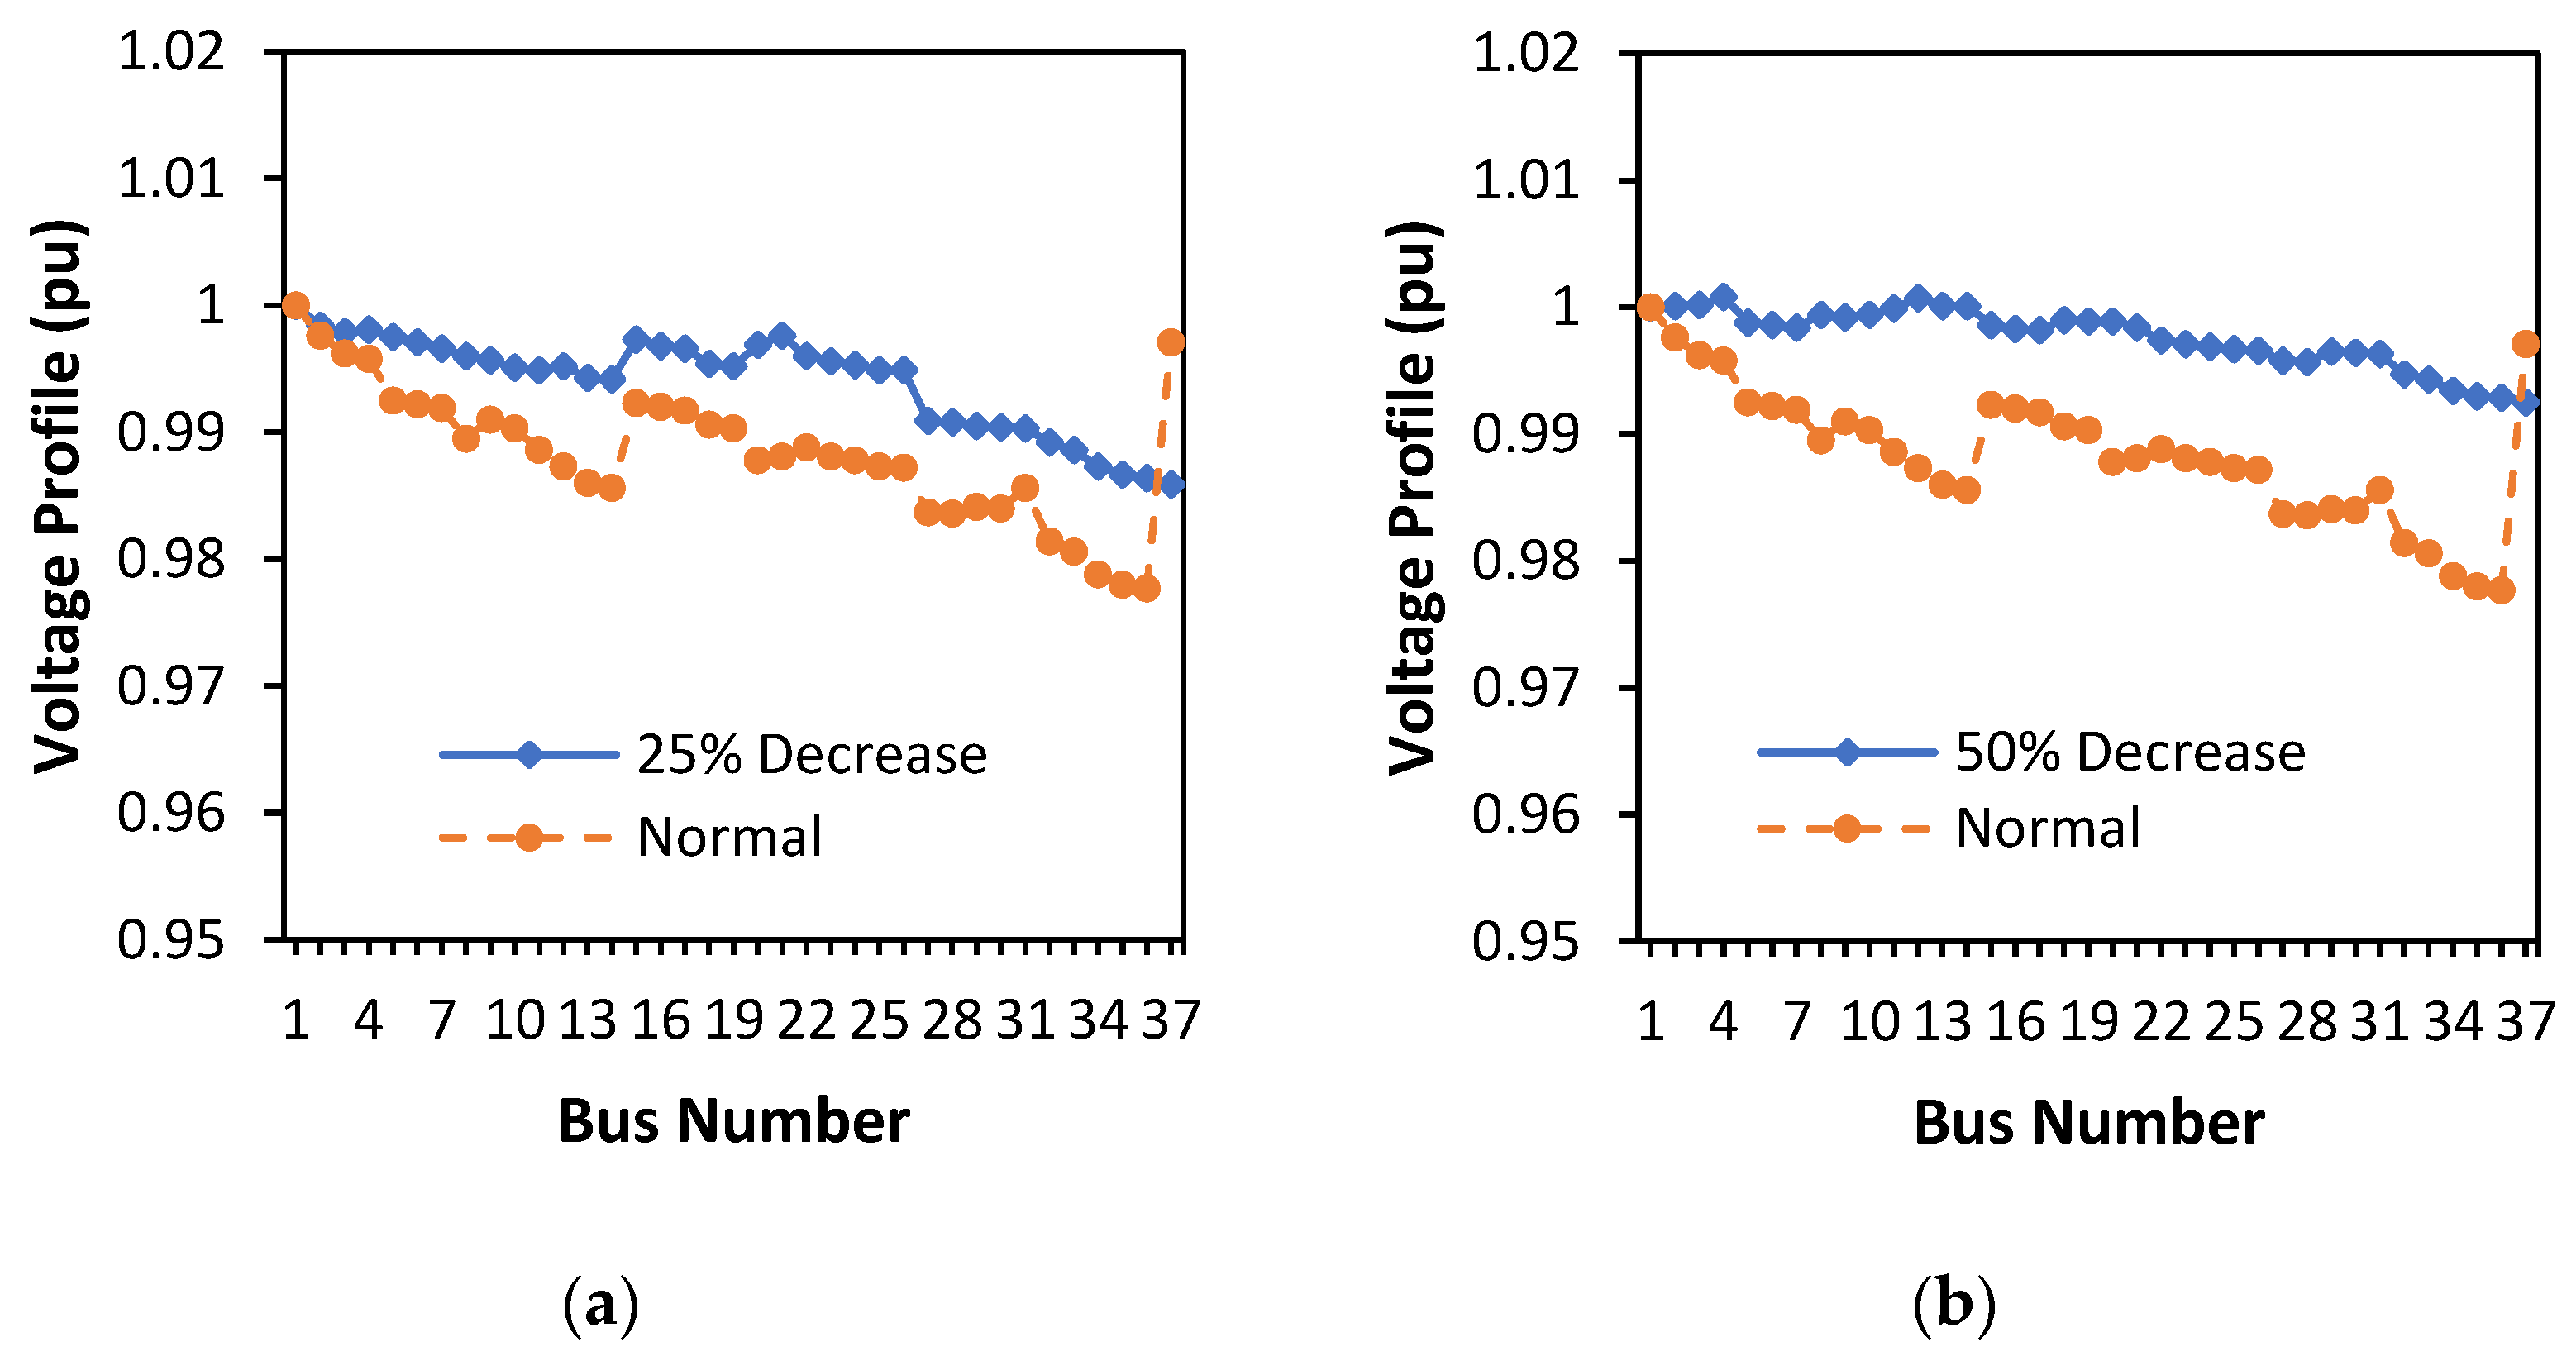
In Figure 9, the voltage profile becomes more stable with 25% and 50% load reduction. At the placement of three DGs, when the load reduction is 25%, the losses become 6.7279 kW. The voltage looks more stable with a 50% reduction in load. Figure 9b shows the voltage profile after the load is reduced by 50%. It can be seen that the voltage profile is better than the voltage profile in Figure 9a. In general, for each bus, it is closer to the ideal one per unit (p.u.).
Table 3 is the optimization of DG placement for a reduced load of 25% and 50%, which averages a loss reduction of 79.0352%.
Table 4 shows that active power losses increase with a 25% load addition, with the placement of three DGs, and the losses increase when the additional load is 50%. The addition of 75% load causes active power losses to increase to 35.3814 kW. Losses increase for the addition of three DGs with a 100% increase in load.
Table 1 shows the optimization of the placement and size of DG capacity. At three locations with normal load, the active power loss decreased from 54.67337875 kW (before optimization) to 9.9443 kW. So, the application of the genetic algorithm method for optimizing the placement and size of DG capacity appears to work on the Lingke KRC feeder. The percent loss reduction reached 81.8114%. Furthermore, by reducing the load by 25%, optimization will result in active power losses that decrease to 6.7279 kW, as well as a 50% load reduction, which looks like number three. Meanwhile, a 25% increase in load optimization results in active power losses increasing to 15.2266, and an increase in load of 50%, 75%, and 100% will continue to add active power losses. Reactive power losses will also tend to increase with increasing loads. It can be seen that the genetic algorithm used can reduce power losses with optimal DG placement and size even though they increase with increasing load.
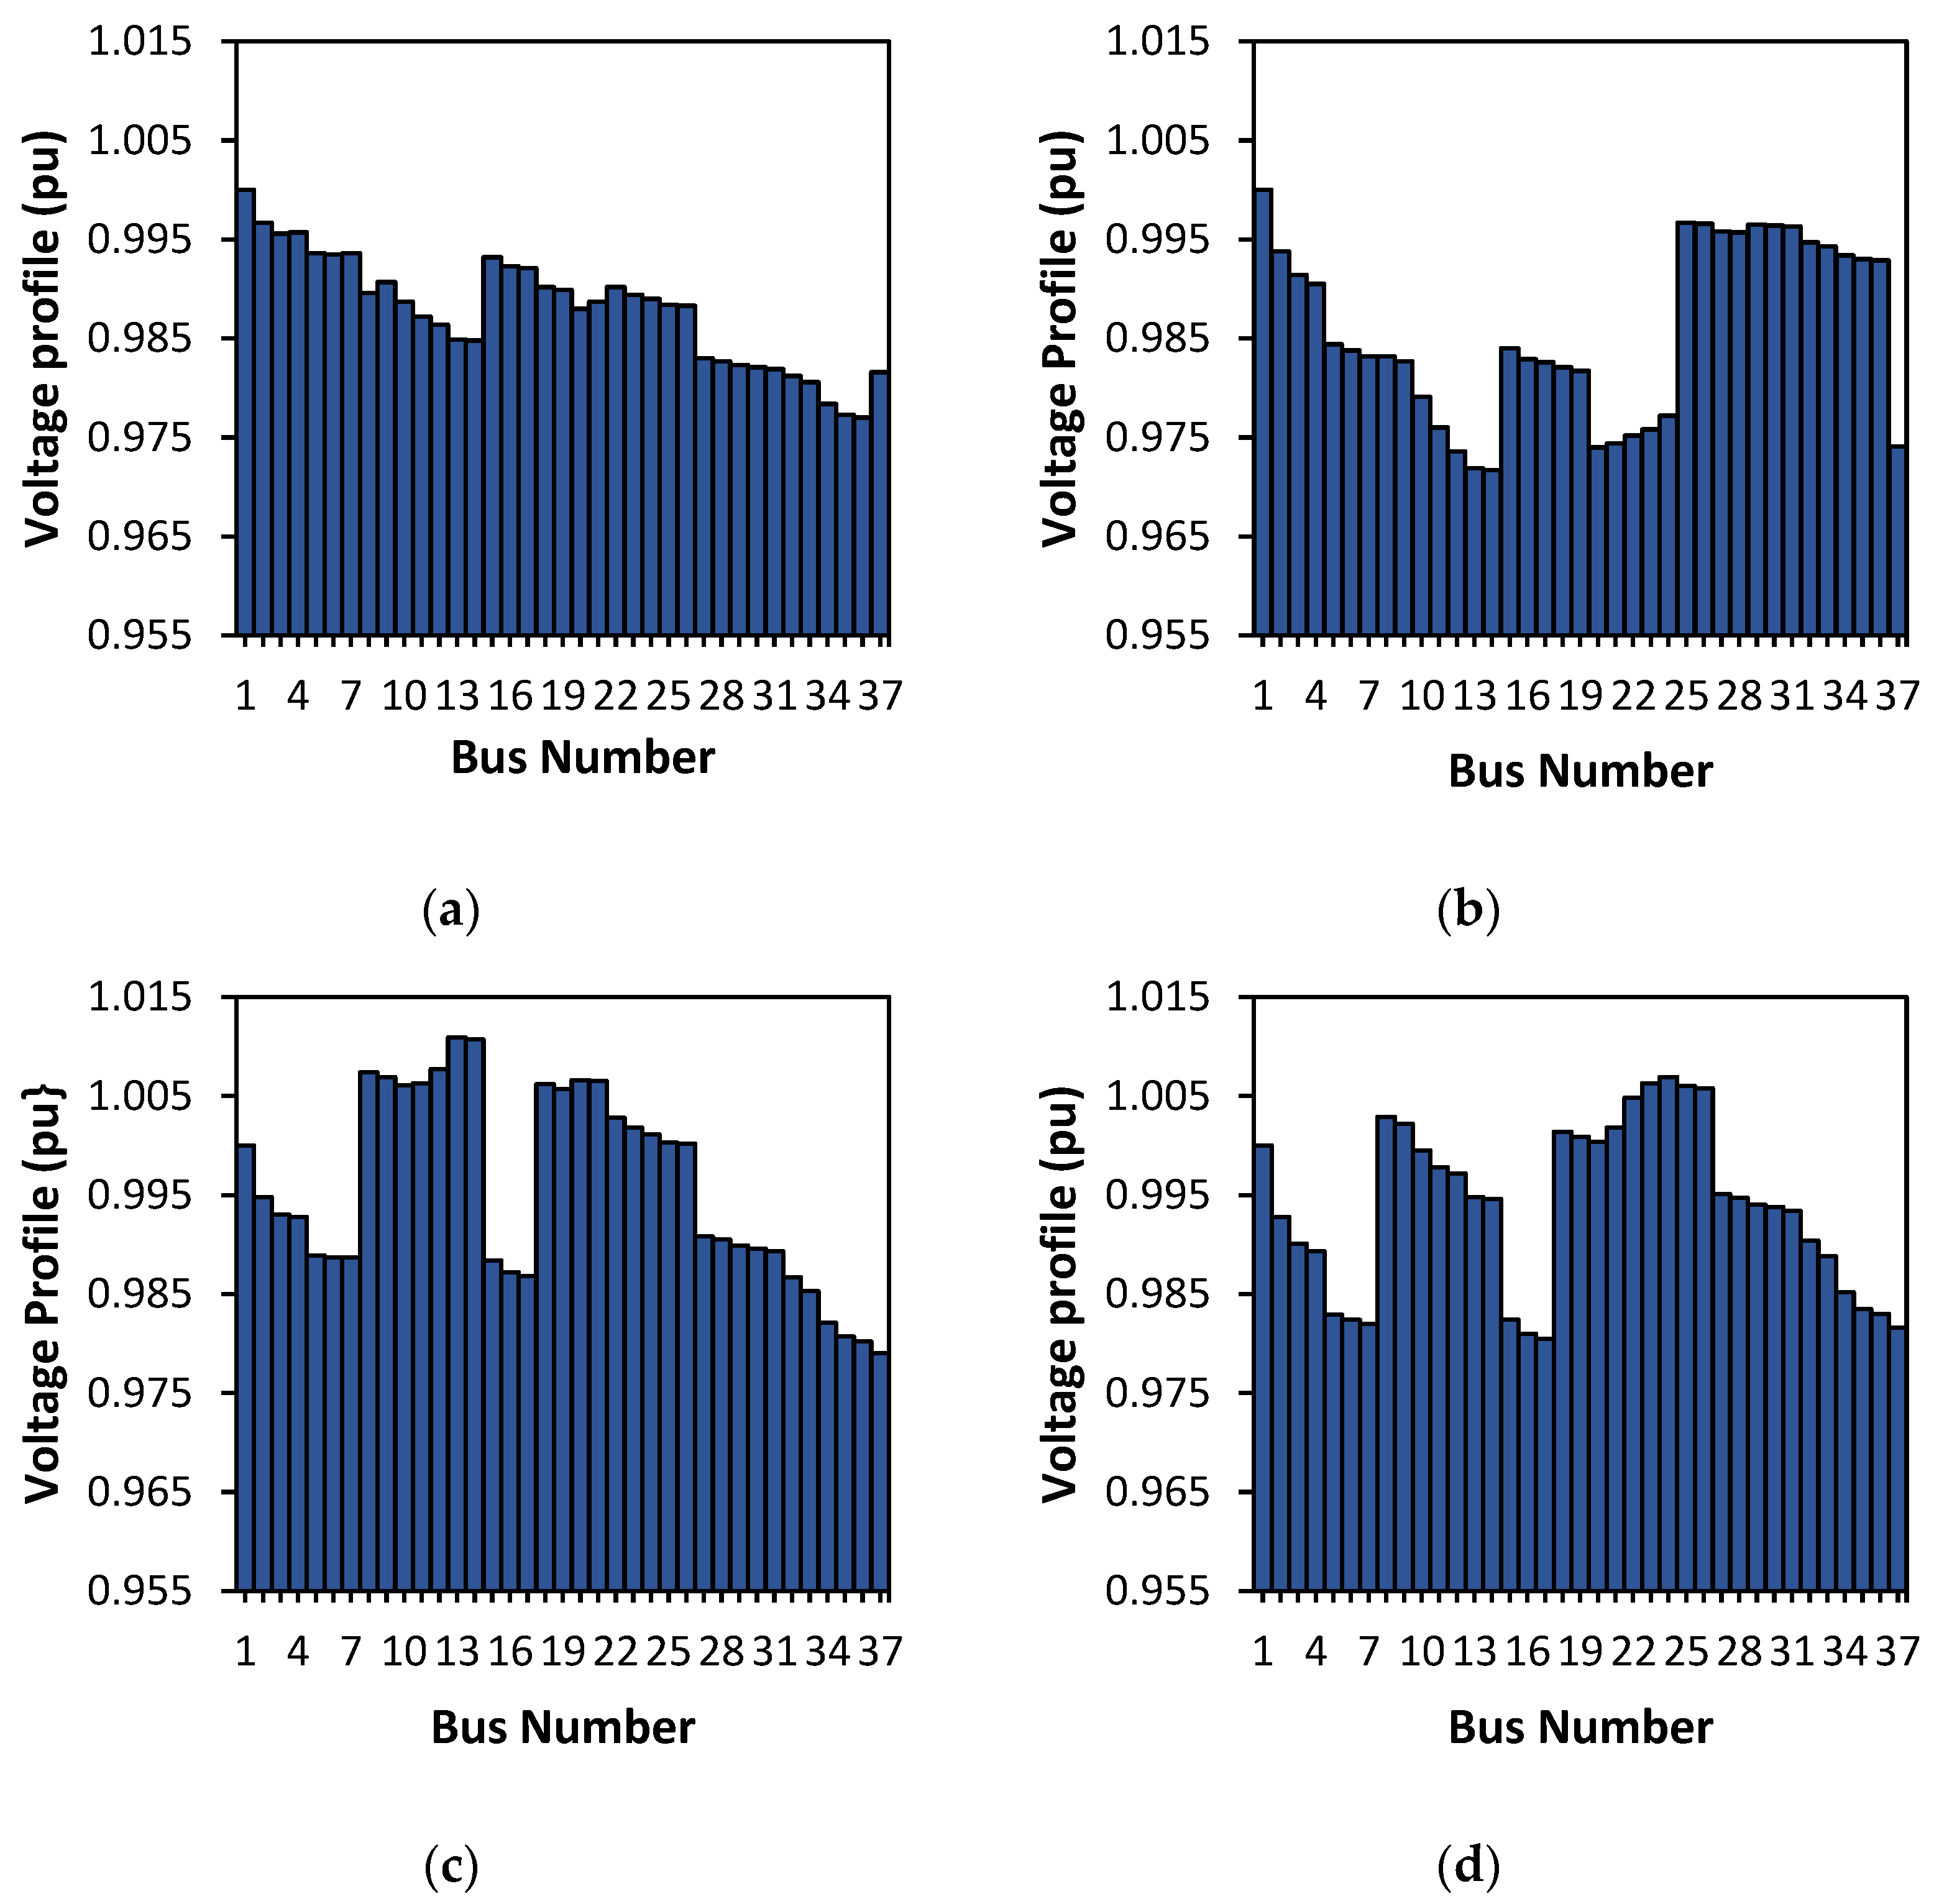
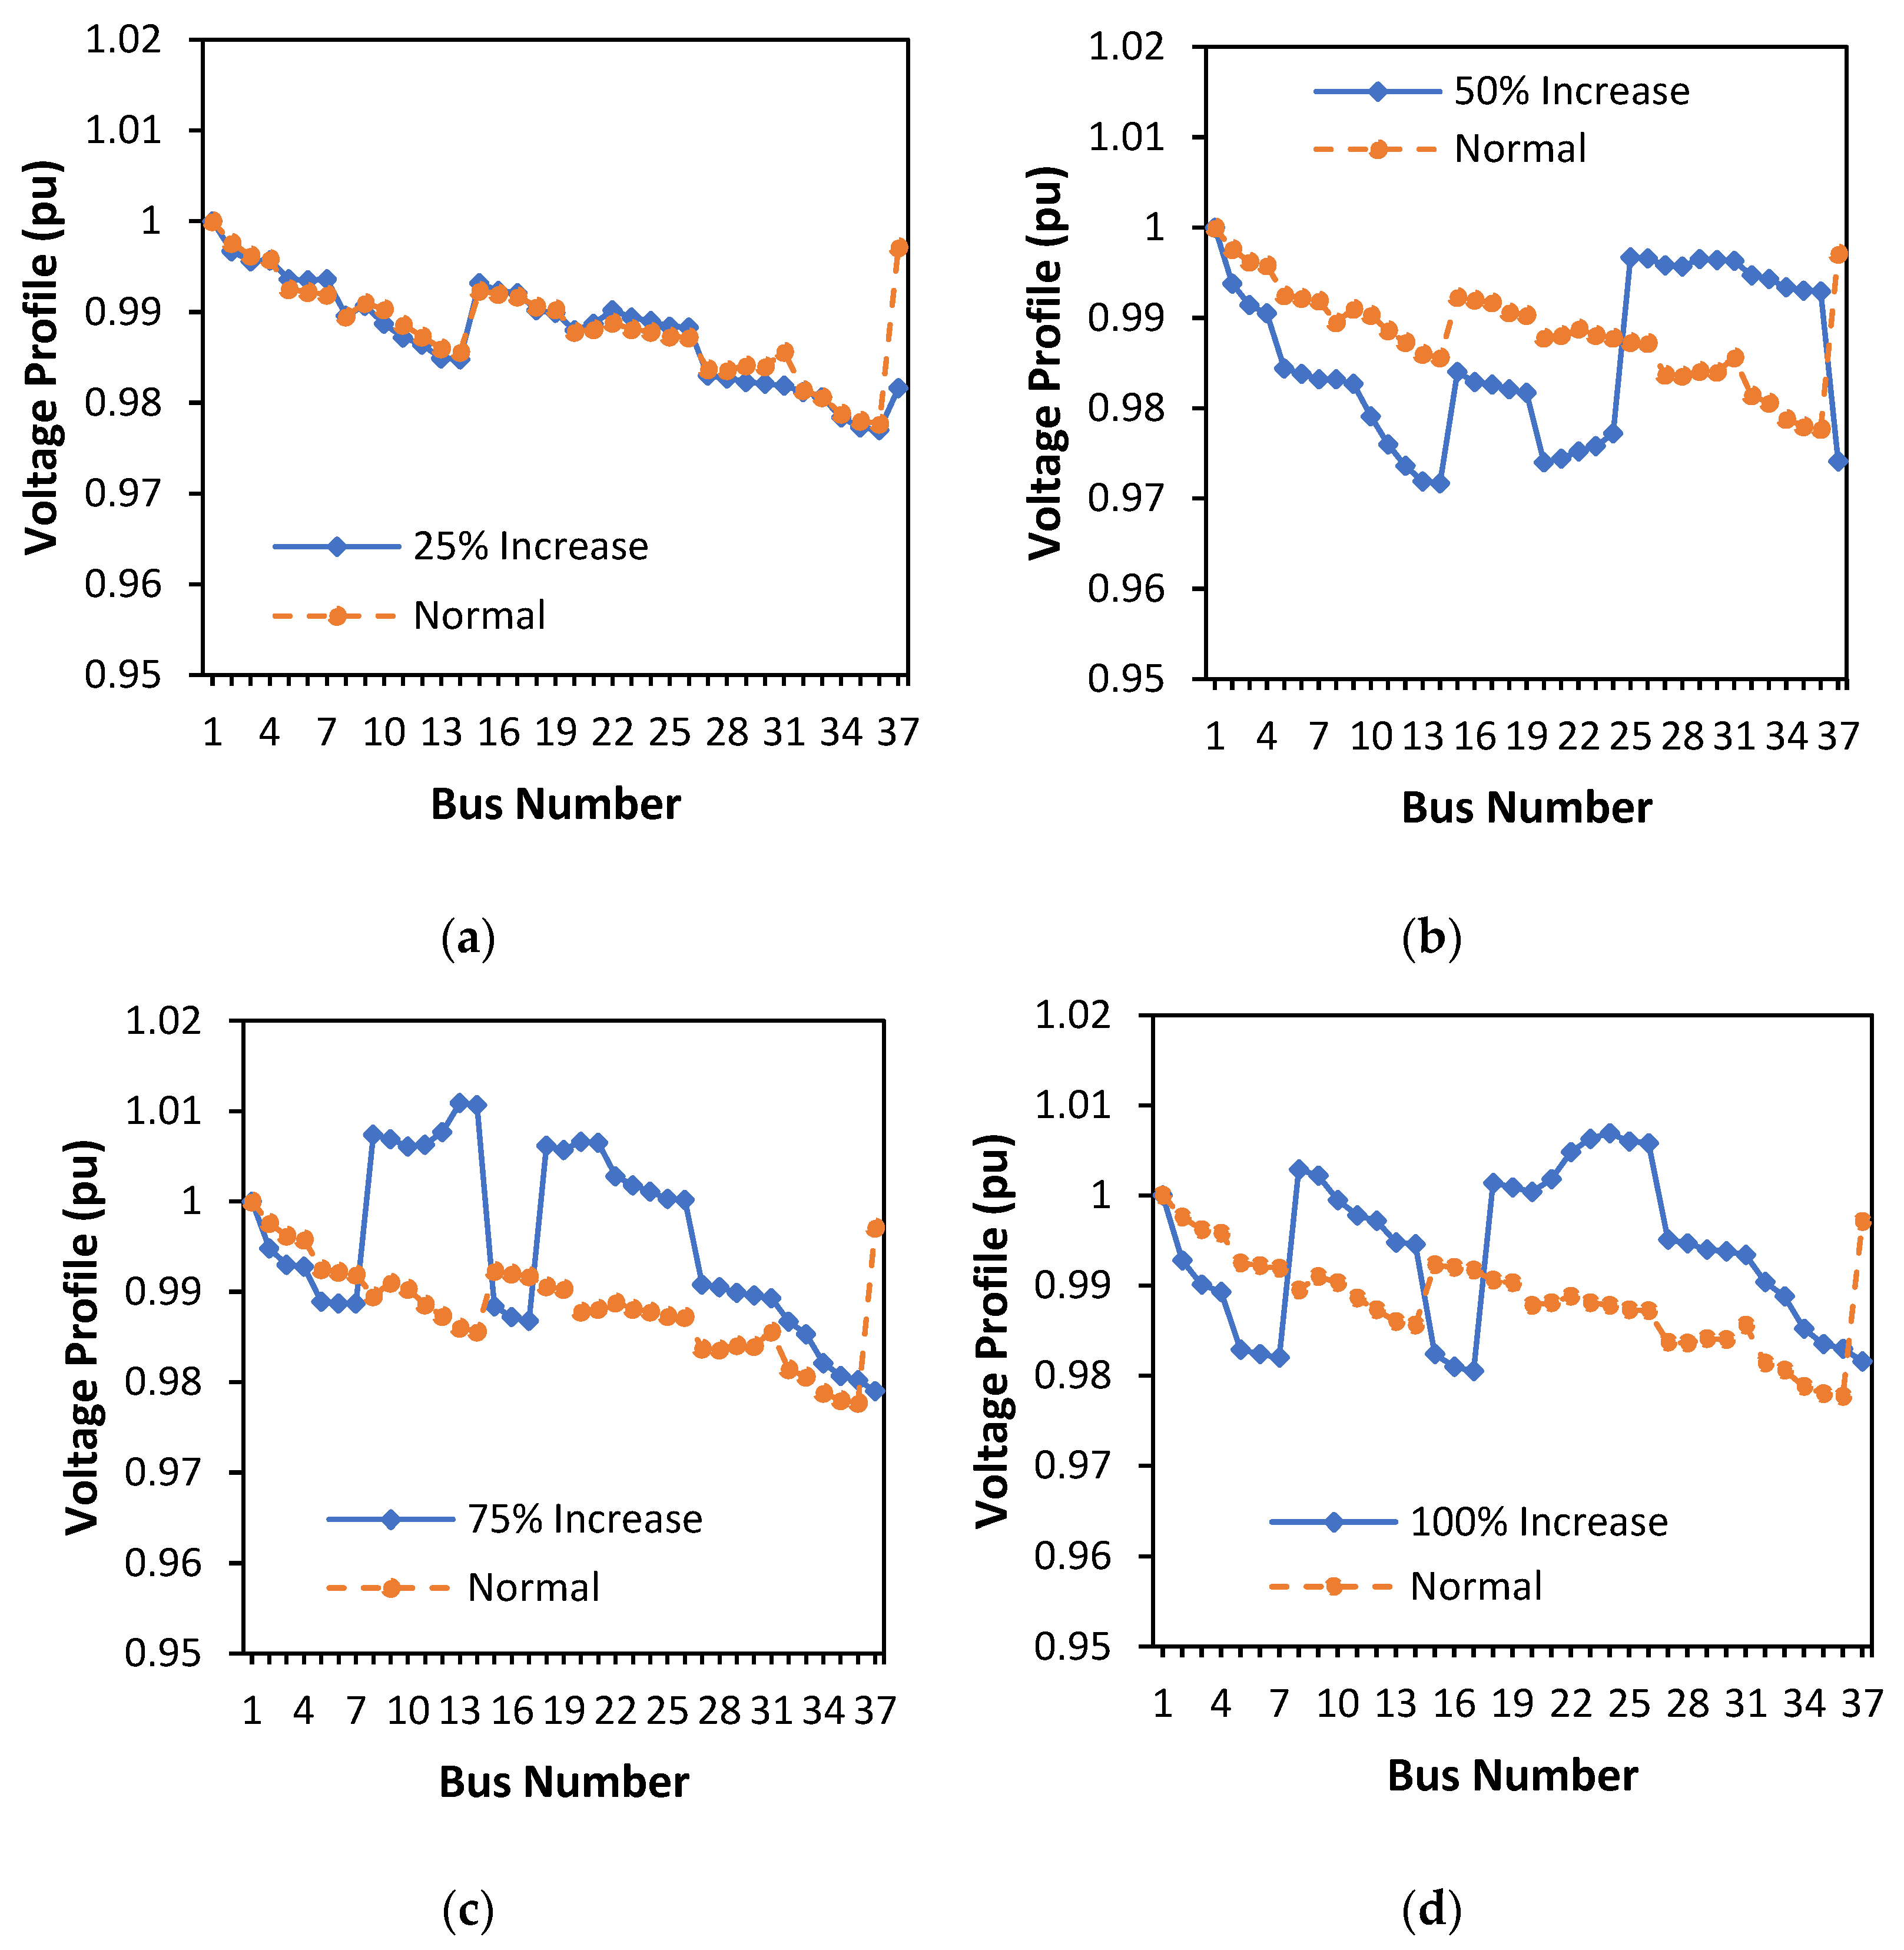
Figure 10 shows the voltage starts to fluctuate with a 25% load increase. The addition of a 50% load voltage profile increasingly fluctuates but still within tolerance limits. The voltage reduces for buses far from the source, such as buses 13, 20, and 37. The addition of 75% load causes the voltage profile to decrease. It can be seen that the voltage profile fluctuates more and more with an increase of 100% load, especially on buses far from the source.
Figure 10a shows the voltage profile after the load increases by 25%. The curve shows a decrease in voltage and is more clearly seen in Figure 10b when the voltage profile is decreasing due to an additional 50% load. Figure 10c shows that an increase of 75% load decreases the size of the voltage profile and, together with Figure 10d, for an additional 100% load, the voltage profile decreases further away from the ideal value, although it is still within the tolerance level due to optimization with the genetic algorithm.

3.6. Comparison of Active Power Losses for Normal Load and 25% Reduction and 50% Reduction

Figure 11a shows that the voltage profile is more stable for a 25% decrease in load than for a normal load. With the 50% load reduction, the voltage becomes more stable than the normal load (Figure 11b).

3.7. Comparison of Active Power Losses for Normal Load and for 25%, 50%, 75%, and 100% Increases in Load

Figure 12a shows the voltage profile decreases with the addition of a 25% load. The voltage profile at load increases by 50% to be more fluctuating compared to normal load (Figure 12b). The voltage profile is increasingly fluctuating with the addition of a 75% load (Figure 12c). Figure 12d shows that at a load increase of 100%, the voltage profile becomes more fluctuating than the normal load but still within tolerance limits. The comparison of the voltage profiles of each bus when optimizing the placement with the DG capacity under normal load conditions shows a better voltage profile when the load is reduced by 25% on the blue line (Figure 11a). Figure 11b shows that the voltage profile is getting better with a 50% reduced load.
Figure 12a shows, on the contrary, that with an increase in load of 25%, the voltage profile begins to decrease compared to normal load, and this is increasingly evident in Figure 12b. Figure 12c show that the load voltage profile increases with larger fluctuations. Figure 12d shows the magnitude of the fluctuation is seen more clearly due to the addition of a 100% load. The larger the load, the larger the current drawn from the source, causing a voltage drop on the network and reducing the amount of voltage the customer receives. However, the voltage profile is also affected by the distance of the load from the source due to the increase in impedance, where the farther from the source, the smaller the voltage profile received by the load. Thus, here, because of the optimization of the genetic algorithm, all voltage fluctuations are still within the allowable tolerance limits.
The increase in loss load appears to increase, but the voltage profile is still maintained at a certain limit even though, in general, there is a decrease. For a reduced load of 50%, the voltage profile is more stable, while with an increase in load of 50%, the voltage begins to fluctuate and you can see lower voltages on buses 14, 26, and 37. Relatedly, with a 100% increase in load, there is a decrease in voltage, especially on buses that are far away from sources such as buses 7, 16, and 37. But, in general, the bus voltage is still within tolerance limits and losses are still minimized compared to conditions before optimization.
The results of optimization through the GA by determining the location and capacity of the DG are presented in Table 1, Table 3 and Table 4. It can be seen that power losses for decreasing or increasing loads can always be minimized, and the average reduction in power losses is 81.1695% (determining the location and capacity of DG before and after load decreasing and after load increasing). The smallest percentage decrease in power loss was 78.7933%, which was seen when the load was reduced to 50%, and the largest decrease in power loss was 83.6575%, which was recorded when the load was increased by 25%. In general, the decrease in percentage power losses appears to be larger after increasing the load when performing DG optimization on the Lingke KRC feeder using the GA method. Optimization of the DG placement with the GA method also managed to maintain the lowest voltage profile value within the allowable tolerance limits, such as from 0.95 to 1.05 p.u. The lowest voltage occurs when the load increases to 50%, namely 0.9717 p.u. on bus 15. Normally, the smallest voltage occurs at the load farthest from the source and the load is larger, but with optimal DG placement and capacity through the GA method, it can produce a voltage that is still within tolerance even on the farthest bus. As shown in Figure 11, even though the load is reduced from the normal load, the voltage profile still looks better, and it can be seen that the reduced load curve (25% and 50%) is still above the normal load curve. Meanwhile, for above-normal loads, the voltage profile is seen to fluctuate above and below the normal load voltage profile. The larger the increase in load, the larger the fluctuation, but with the placement and capacity of DG through optimization of the GA, a large constant voltage profile is obtained within the allowable standard range (between 0.95 and 1.05 p.u.).

4. Discussions

A simulation of the artificial bee colony (ABC) algorithm was used to examine a novel optimization technique. The system’s overall real power loss can be reduced by choosing the ideal DG unit’s size, power factor, and location [38]. Optimization of the positioning and sizing of the photovoltaic (PV) system as DG for loss mitigation was assessed in the Purworejo region of Indonesia [39]. The entire distribution system losses for PT PLN ULP Purworejo amount to 10.467% in technical and non-technical losses, which is significantly more than the allowed maximum (5%). Investigations were conducted into methods for the positioning and sizing of distributed generations (DGs) that maintain voltage stability and minimize total power loss in the power system. The strategy is to choose the best DG location and power capacity while ensuring voltage stability as the load changes. With the help of the Voltage Stability Margin Index (VSMI), vulnerable buses are identified. The curve-fitting method in Matlab is used to determine the DG unit’s ideal size [40]. The scheme proposed in this paper is power flow, namely the process of distributing electrical energy to customers. Parameters for the successful distribution of electrical energy are line power losses, and the voltage profiles received by customers can be planned using the GA approach. The bus that has the highest voltage variations is the one that is the furthest from the source and has a heavy load, according to the findings of this study using the genetic algorithm technique using the ETAP and Matlab applications. This is brought on by the high impedance brought on by distance and also influenced by heavy loads. In contrast, a more stable voltage will be applied to the bus that is close to the source.
The increase in the load of electrical energy is very high at this time. However, research that makes the increase in load as a matter of influence is still lacking because current research is still more for constant loads which are generally applied to the IEEE test system rather than real loads in the field. On the other hand, in previous studies, it could still be improved due to the low percentage of reduction in power losses. The network was reconfigured and the size of the DG was optimized using various approaches. These techniques are also rapid and call for the fewest possible iterations. Each method makes use of different goals and constrained constants based on one or more algorithms, including trial-and-error, simulated annealing, tabu search, evolutionary algorithm, genetic algorithm, evolutionary programming, ant colony optimization, particle swarm optimization, harmony search algorithm, artificial bee colony, fuzzy, and firework algorithm. To evaluate the effectiveness of the suggested simultaneous method, these algorithms were tested on the reconfiguration and sizing of the DG [41]. The application of the genetic algorithm (GA) and other algorithms to determine the optimal capacity and location of DGs was reported, as shown in Table 5. In general, the proposed algorithm can solve DG allocation. The maximum average voltage occurs when DG is placed, and the total power losses active occurs when DG is placed.
Table 6 shows a similar case between 33-bus IEEE using the harmony search algorithm, firework algorithm (FWA), and 37-bus using the genetic algorithm (GA). The nominal load with the loss reduction genetic algorithm reached 81.2883%, while in the HSA loss reduction was only 52.26%, and the FWA loss reduction was 56.24%, with the addition of three DGs each. Likewise, for low and high loads, the GA is still better than the HSA and FWA. The successive percentages of the average voltage drop on the GA, HSA, and FWA were 80.311%, 52.4633%, and 56.4633%. Furthermore, the minimum voltage profile for nominal load using the GA was 0.9907 p.u. (better), while in the HSA, it was only 0.9670 p.u., and in the FWA, it was 0.9680 p.u. Light and heavy loading as well as the lowest voltage profile remain at a better GA. Table 7 describes the IEEE 33-bus case using the GA, showing that the reduction in losses is 47%, while with a PSO of 45%, the GA is better than PSO. This is the same case as the placement of six pieces of DGs.
Utilizing a genetic algorithm to reduce power losses for seating and sizing on DG while taking the voltage profile at various loads was evaluated in this work. For each loading scenario, power losses can be minimized by an average of 80%, while the voltage profile is kept within the permitted range, which is between 0.95 p.u. and 1.05 p.u. (best). The outcome demonstrates that the system put into place is an actual system in use. In conducting a simulation with a wide range of loads, losses on average were cut by 80% (better). A better voltage profile is one p.u. or less. Power losses can be decreased and the voltage profile can be improved using DG active power generation. According to this study’s findings, the bus with the biggest load and the farthest distance from the source also has the most voltage swings. This is a result of the high resistance created by the distance and the heavy load. On the other hand, a bus that is close to the source will acquire a more stable voltage.

5. Conclusions

This work evaluated the capacity and position of DG by taking load changes into account using a genetic algorithm approach. So, it can be concluded that with the genetic algorithm method, it is possible to determine the location and capacity of the DG to be placed in the network, thereby reducing line power losses and maintaining the voltage profile within acceptable tolerance levels. The magnitude of the load has an impact on optimization; the larger the load, the larger the power losses and the more fluctuating the voltage profile. Conversely, the lighter the load, the more power losses will decrease and the voltage will become relatively stable. The results of this study indicate that the bus that experiences the largest voltage fluctuations is the farthest from the source and has a large load. This is due to the large impedance due to distance and is also influenced by the large load. Conversely, a bus that is near the source will receive a more stable voltage. The limitation of this work is that the network condition is fixed and the type of DG used is only one type which only injects P (active power). Further studies are evaluating the effect of network reconfiguration and different DG types so that the network can inject P (active power), Q (reactive power), or both P and Q, and the consequences for network losses and voltage profiles. The development of the best method for running DG units while considering wholesale electricity pricing must be prioritized.

Author Contributions

Conceptualization, R.H.S., Y.A., T. and A.; methodology, R.H.S., Y.A., T. and A.; software, R.H.S.; validation, R.H.S.; formal analysis, R.H.S.; investigation, R.H.S.; resources, R.H.S.; data curation, R.H.S.; writing—original draft preparation, R.H.S. and A.; writing—review and editing, R.H.S., Y.A., T. and A.; visualization, R.H.S.; supervision, Y.A., T. and A.; project administration, R.H.S.; funding acquisition, R.H.S. All authors have read and agreed to the published version of the manuscript.

Funding

This research received no external funding.

Data Availability Statement

Not applicable.

Conflicts of Interest

The authors declare no conflict of interest.

References

  1. Bahramara, S.; Moghaddam, M.P.; Haghifam, M.R. Optimal planning of hybrid renewable energy systems using HOMER: A review. Renew. Sustain. Energy Rev. 2016, 62, 609–620. [Google Scholar] [CrossRef]
  2. Holechek, J.L.; Geli, H.M.E.; Sawalhah, M.N.; Valdez, R. A Global Assessment: Can Renewable Energy Replace Fossil Fuels by 2050? Sustainability 2022, 14, 4792. [Google Scholar] [CrossRef]
  3. Schirone, L.; Pellitteri, F. Energy Policies and Sustainable Management of Energy Sources. Sustainability 2017, 9, 2321. [Google Scholar] [CrossRef] [Green Version]
  4. Vinichenko, V.; Cherp, A.; Jewell, J. Historical precedents and feasibility of rapid coal and gas decline required for the 1.5°C target. One Earth 2021, 4, 1477–1490. [Google Scholar] [CrossRef]
  5. Rashedi, A.; Khanam, T.; Jonkman, M. On Reduced Consumption of Fossil Fuels in 2020 and Its Consequences in the Global Environment and Exergy Demand. Energies 2020, 13, 6048. [Google Scholar] [CrossRef]
  6. Halkos, G.; Gkampoura, E.-C. Assessing Fossil Fuels and Renewables’ Impact on Energy Poverty Conditions in Europe. Energies 2023, 16, 560. [Google Scholar] [CrossRef]
  7. Zhang, S.; Cheng, H.; Li, K.; Tai, N.; Wang, D.; Li, F. Multi-objective distributed generation planning in distribution network considering correlations among uncertainties. Appl. Energy 2018, 226, 743–755. [Google Scholar] [CrossRef]
  8. Razavi, S.-E.; Rahimi, E.; Javadi, M.S.; Nezhad, A.E.; Lotfi, M.; Shafie-Khah, M.; Catalão, J.P. Impact of distributed generation on protection and voltage regulation of distribution systems: A review. Renew. Sustain. Energy Rev. 2019, 105, 157–167. [Google Scholar] [CrossRef]
  9. Sun, P.; Jiao, Z.; Gu, H. Calculation of Short-Circuit Current in DC Distribution System Based on MMC Linearization. Front. Energy Res. 2021, 9, 634232. [Google Scholar] [CrossRef]
  10. Bevrani, H.; Golpîra, H.; Messina, A.R.; Hatziargyriou, N.; Milano, F.; Ise, T. Power system frequency control: An updated review of current solutions and new challenges. Electr. Power Syst. Res. 2021, 194, 107114. [Google Scholar] [CrossRef]
  11. Kojovic, L. Impact DG on voltage regulation. In Proceedings of the IEEE Power Engineering Society Summer Meeting, Chicago, IL, USA, 21–25 July 2002. [Google Scholar] [CrossRef]
  12. Martinez, J.A.; Martin-Arnedo, J. Impact of distributed generation on distribution protection and power quality. In Proceedings of the 2009 IEEE Power & Energy Society General Meeting, Calgary, AB, Canada, 26–30 July 2009; pp. 1–6. [Google Scholar] [CrossRef]
  13. Ogunsina, A.A.; Petinrin, M.O.; Petinrin, O.O.; Offornedo, E.N.; Petinrin, J.O.; Asaolu, G.O. Optimal distributed generation location and sizing for loss minimization and voltage profile optimization using ant colony algorithm. SN Appl. Sci. 2021, 3, 248. [Google Scholar] [CrossRef]
  14. Ayodele, T.R.; Ogunjuyigbe, A.S.O.; Akinola, O.O. Optimal Location, Sizing, and Appropriate Technology Selection of Distributed Generators for Minimizing Power Loss Using Genetic Algorithm. J. Renew. Energy 2015, 2015, 832917. [Google Scholar] [CrossRef] [Green Version]
  15. Dulău, L.I.; Abrudean, M.; Bică, D. Optimal Location of a Distributed Generator for Power Losses Improvement. Procedia Technol. 2016, 22, 734–739. [Google Scholar] [CrossRef] [Green Version]
  16. Purchala, K.; Belmans, R. Distributed Generation and Grid Integration Issues; Imperial College: London, UK, 2003. [Google Scholar]
  17. Sari, P.D.; Kumara, I.N.S. The Development of Jatiluwih Micro-Hydro Power Plants to Support Tourism Destinations. In Proceedings of the 2018 International Student Conference on Electrical and Computer Engineering (ISCECE), Bali, Indonesia, 26 October 2018; pp. 9–14, ISBN 978-602-294-346-4.. [Google Scholar]
  18. Bayat, A.; Bagheri, A. Optimal active and reactive power allocation in distribution networks using a novel heuristic approach. Appl. Energy 2018, 233–234, 71–85. [Google Scholar] [CrossRef]
  19. Wong, L.A.; Ramachandaramurthy, V.K.; Taylor, P.; Ekanayake, J.; Walker, S.L.; Padmanaban, S. Review on the optimal placement, sizing and control of an energy storage system in the distribution network. J. Energy Storage 2019, 21, 489–504. [Google Scholar] [CrossRef]
  20. De Jesus, P.M.O. A Simplified Formulation for the Backward/Forward Sweep Power Flow Method. Arxiv Cornell University, United State of America. 2020. Available online: https://arxiv.org/pdf/2010.06389.pdf (accessed on 9 July 2023).
  21. Rana, A.D.; Darji, J.B.; Pandya, M. Backward/Forward Sweep Load Flow Algorithm for Radial Distribution System. Int. J. Sci. Res. Dev. 2014, 2, 398–400. [Google Scholar]
  22. Siregar, R.H.; Away, Y. Optimizing the Placement and Capacity of Distributed Generation (DG) on the Krueng Raya Feeder in Banda Aceh Distribution System to Increase Power Flow using Genetic Algorithm Method. In Proceedings of the 2022 International Conference on Electrical Engineering and Informatics (ICELTICs), Banda Aceh, Indonesia, 27–28 September 2022; pp. 184–189. [Google Scholar] [CrossRef]
  23. Moradi, M.H.; Abedini, M. A combination of genetic algorithm and particle swarm optimization for optimal DG location and sizing in distribution systems. Int. J. Electr. Power Energy Syst. 2012, 34, 66–74. [Google Scholar] [CrossRef]
  24. Lakshmi, G.V.N.; Jayalaxmi, A.; Veeramsetty, V. Optimal Placement of Distribution Generation in Radial Distribution System Using Hybrid Genetic Dragonfly Algorithm. Technol. Econ. Smart Grids Sustain. Energy 2021, 6, 9. [Google Scholar] [CrossRef]
  25. C, H.P.; Subbaramaiah, K.; Sujatha, P. Optimal DG unit placement in distribution networks by multi-objective whale optimization algorithm & its techno-economic analysis. Electr. Power Syst. Res. 2023, 214, 108869. [Google Scholar] [CrossRef]
  26. Khan, M.O.; Wadood, A.; Abid, M.I.; Khurshaid, T.; Rhee, S.B. Minimization of Network Power Losses in the AC-DC Hybrid Distribution Network through Network Reconfiguration Using Soft Open Point. Electronics 2021, 10, 326. [Google Scholar] [CrossRef]
  27. Abbas, M.; Alshehri, M.A.; Barnawi, A.B. Potential Contribution of the Grey Wolf Optimization Algorithm in Reducing Active Power Losses in Electrical Power Systems. Appl. Sci. 2022, 12, 6177. [Google Scholar] [CrossRef]
  28. Selim, A.; Kamel, S.; Jurado, F. Efficient optimization technique for multiple DG allocation in distribution networks. Appl. Soft Comput. 2020, 86, 105938. [Google Scholar] [CrossRef]
  29. Shang, C.; Zhou, T.-T.; Liu, S. Optimization of complex engineering problems using modified sine cosine algorithm. Sci. Rep. 2022, 12, 20528. [Google Scholar] [CrossRef]
  30. Narayanan, R.C.; Ganesh, N.; Čep, R.; Jangir, P.; Chohan, J.S.; Kalita, K. A Novel Many-Objective Sine–Cosine Algorithm (MaOSCA) for Engineering Applications. Mathematics 2023, 11, 2301. [Google Scholar] [CrossRef]
  31. Jouhari, H.; Lei, D.; Al-Qaness, M.A.A.; Elaziz, M.A.; Ewees, A.A.; Farouk, O. Sine-Cosine Algorithm to Enhance Simulated Annealing for Unrelated Parallel Machine Scheduling with Setup Times. Mathematics 2019, 7, 1120. [Google Scholar] [CrossRef] [Green Version]
  32. Das, S.; Abraham, A.; Konar, A. Particle Swarm Optimization and Differential Evolution Algorithms: Technical Analysis, Applications and Hybridization Perspectives. In Advances of Computational Intelligence in Industrial Systems; Springer: Berlin/Heidelberg, Germany, 2008; Volume 116. [Google Scholar] [CrossRef] [Green Version]
  33. Lim, S.P.; Haron, H. Performance comparison of Genetic Algorithm, Differential Evolution and Particle Swarm Optimization towards benchmark functions. In Proceedings of the 2013 IEEE Conference on Open Systems (ICOS), Kuching, Malaysia, 2–4 December 2013; pp. 41–46. [Google Scholar] [CrossRef]
  34. Yarat, S.; Senan, S.; Orman, Z. A Comparative Study on PSO with Other Metaheuristic Methods. In Applying Particle Swarm Optimization; Mercangöz, B.A., Ed.; International Series in Operations Research & Management Science; Springer: Berlin/Heidelberg, Germany, 2021; Volume 306, pp. 49–72. [Google Scholar] [CrossRef]
  35. Jin, Y.; Sun, Y.; Ma, H. A Developed Artificial Bee Colony Algorithm Based on Cloud Model. Mathematics 2018, 6, 61. [Google Scholar] [CrossRef] [Green Version]
  36. Selim, A.; Kamel, S.; Mohamed, A.A.; Elattar, E.E. Optimal Allocation of Multiple Types of Distributed Generations in Radial Distribution Systems Using a Hybrid Technique. Sustainability 2021, 13, 6644. [Google Scholar] [CrossRef]
  37. Kartikeya, S.A.; Rafi, K.M. Optimal Capacitor Placement in Radial Distribution Systems using Artificial Bee Colony (ABC) Algorithm. Innov. Syst. Des. Eng. 2011, 2, 177–185. [Google Scholar]
  38. Ratuhaji, F.; Arief, A.; Nappu, M.B. Determination of optimal location and capacity of distributed generations based on artificial bee colony. J. Phys. Conf. Ser. 2019, 1341, 052012. [Google Scholar] [CrossRef] [Green Version]
  39. Wicaksana, M.G.S.; Putranto, L.M.; Waskito, F.; Yasirroni, M. Optimal Placement and Sizing of PV as DG for Losses Minimization Using PSO Algorithm: A Case in Purworejo Area. In Proceedings of the 2020 International Conference on Sustainable Energy Engineering and Application (ICSEEA), Tangerang, Indonesia, 18–20 November 2020. [Google Scholar] [CrossRef]
  40. Essallah, S.; Khedher, A.; Bouallegue, A. Integration of distributed generation in electrical grid: Optimal placement and sizing under different load conditions. Comput. Electr. Eng. 2019, 79, 106461. [Google Scholar] [CrossRef]
  41. Badran, O.; Mekhilef, S.; Mokhlis, H.; Dahalan, W. Optimal reconfiguration of distribution system connected with distributed generations: A review of different methodologies. Renew. Sustain. Energy Rev. 2017, 73, 854–867. [Google Scholar] [CrossRef]
  42. Zakaria, Y.Y.; Swief, R.A.; El-Amary, N.H.; Ibrahim, A.M. Optimal Distributed Generation Allocation and Sizing Using Genetic and Ant Colony Algorithms. J. Phys. Conf. Ser. 2020, 1447, 012023. [Google Scholar] [CrossRef]
  43. Alinejad-Beromi, Y.; Sedighizadeh, M.; Bayat, M.R.; Khodayar, M.E. Using genetic alghoritm for distributed generation allocation to reduce losses and improve voltage profile. In Proceedings of the 2007 42nd International Universities Power Engineering Conference, Brighton, UK, 4–6 September 2007; pp. 954–959. [Google Scholar] [CrossRef]
  44. Naderipour, A.; Abdul-Malek, Z.; Hajivand, M.; Seifabad, Z.M.; Farsi, M.A.; Nowdeh, S.A.; Davoudkhani, I.F. Spotted hyena optimizer algorithm for capacitor allocation in radial distribution system with distributed generation and microgrid operation considering different load types. Sci. Rep. 2021, 11, 2728. [Google Scholar] [CrossRef]
  45. Wang, M.; Zhong, J. A novel method for distributed generation and capacitor optimal placement considering voltage profiles. In Proceedings of the 2011 IEEE Power and Energy Society General Meeting, Detroit, MI, USA, 24–28 July 2011; pp. 1–6. [Google Scholar] [CrossRef] [Green Version]
  46. Srinivasa Rao, R.; Ravindra, K.; Satish, K.; Narasimham, S.V.L. Power Loss Minimization in Distribution System Using Network Reconfiguration in the Presence of Distributed Generation. IEEE Trans. Power Syst. 2013, 28, 317–325. [Google Scholar] [CrossRef]
  47. Kashyap, M.; Mittal, A.; Kansal, S. Optimal Placement of Distributed Generation Using Genetic Algorithm Approach. In Proceeding of the Second International Conference on Microelectronics, Computing & Communication Systems (MCCS 2017); Nath, V., Mandal, J., Eds.; Lecture Notes in Electrical Engineering; Springer: Singapore, 2019; Volume 476. [Google Scholar]
  48. Nayeripour, M.; Mahboubi-Moghaddam, E.; Aghaei, J.; Azizi-Vahed, A. Multi-objective placement and sizing of DGs in distribution networks ensuring transient stability using hybrid evolutionary algorithm. Renew. Sustain. Energy Rev. 2013, 25, 759–767. [Google Scholar] [CrossRef]
  49. Yammani, C.; Maheswarapu, S.; Matam, S.K. A Multi-objective Shuffled Bat algorithm for optimal placement and sizing of multi distributed generations with different load models. Int. J. Electr. Power Energy Syst. 2016, 79, 120–131. [Google Scholar] [CrossRef]
  50. Imran, A.M.; Kowsalya, M.; Kothari, D. A novel integration technique for optimal network reconfiguration and distributed generation placement in power distribution networks. Int. J. Electr. Power Energy Syst. 2014, 63, 461–472. [Google Scholar] [CrossRef]
  51. Prabha, D.R.; Jayabarathi, T. Optimal placement and sizing of multiple distributed generating units in distribution networks by invasive weed optimization algorithm. Ain Shams Eng. J. 2016, 7, 683–694. [Google Scholar] [CrossRef] [Green Version]
  52. Mistry, K.D.; Roy, R. Enhancement of loading capacity of distribution system through distributed generator placement considering techno-economic benefits with load growth. Int. J. Electr. Power Energy Syst. 2014, 54, 505–515. [Google Scholar] [CrossRef]
  53. Moradi, M.H.; Zeinalzadeh, A.; Mohammadi, Y.; Abedini, M. An efficient hybrid method for solving the optimal sitting and sizing problem of DG and shunt capacitor banks simultaneously based on imperialist competitive algorithm and genetic algorithm. Int. J. Electr. Power Energy Syst. 2014, 54, 101–111. [Google Scholar] [CrossRef]
  54. Doagou-Mojarrad, H.; Gharehpetian, G.; Rastegar, H.; Olamaei, J. Optimal placement and sizing of DG (distributed generation) units in distribution networks by novel hybrid evolutionary algorithm. Energy 2013, 54, 129–138. [Google Scholar] [CrossRef]
  55. Biswas, S.; Goswami, S.K.; Chatterjee, A. Optimum distributed generation placement with voltage sag effect minimization. Energy Convers. Manag. 2012, 53, 163–174. [Google Scholar] [CrossRef]
  56. Esmaili, M.; Firozjaee, E.C.; Shayanfar, H.A. Optimal placement of distributed generations considering voltage stability and power losses with observing voltage-related constraints. Appl. Energy 2014, 113, 1252–1260. [Google Scholar] [CrossRef]
  57. Gitizadeh, M.; Vahed, A.A.; Aghaei, J. Multistage distribution system expansion planning considering distributed generation using hybrid evolutionary algorithms. Appl. Energy 2013, 101, 655–666. [Google Scholar] [CrossRef]
  58. El-Zonkoly, A. Optimal placement of multi-distributed generation units including different load models using particle swarm optimisation. IET Gener. Transm. Distrib. 2011, 5, 760–771. [Google Scholar] [CrossRef]
  59. Biswas, S.; Goswami, S.K.; Chatterjee, A. Optimal distributed generation placement in shunt capacitor compensated distribution systems considering voltage sag and harmonics distortions. IET Gener. Transm. Distrib. 2014, 8, 783–797. [Google Scholar] [CrossRef]
  60. Kim, K.-H.; Song, K.-B.; Joo, S.-K.; Lee, Y.-J.; Kim, J.-O. Multiobjective distributed generation placement using fuzzy goal programming with genetic algorithm. Eur. Trans. Electr. Power 2008, 18, 217–230. [Google Scholar] [CrossRef]
  61. Vita, V. Development of a Decision-Making Algorithm for the Optimum Size and Placement of Distributed Generation Units in Distribution Networks. Energies 2017, 10, 1433. [Google Scholar] [CrossRef] [Green Version]
  62. Kalantari, M.; Kazemi, A. Placement of distributed generation unit and capacitor allocation in distribution systems using genetic algorithm. In Proceedings of the 2011 10th International Conference on Environment and Electrical Engineering, Rome, Italy, 8–11 May 2011; pp. 1–5. [Google Scholar] [CrossRef]
  63. Parizad, A.; Khazali, A.; Kalantar, M. Optimal placement of distributed generation with sensitivity factors considering voltage stability and losses indices. In Proceedings of the 2010 18th Iranian Conference on Electrical Engineering, Isfahan, Iran, 11–13 May 2010; pp. 848–855. [Google Scholar] [CrossRef]
  64. Aman, M.; Jasmon, G.; Bakar, A.; Mokhlis, H. A new approach for optimum simultaneous multi-DG distributed generation Units placement and sizing based on maximization of system loadability using HPSO (hybrid particle swarm optimization) algorithm. Energy 2014, 66, 202–215. [Google Scholar] [CrossRef]
  65. Rath, D.; Dey, S.H.; Goswami, S.K. Optimal Inverter-Based DG Placement considering Energy Loss, Reliability, Voltage Sag, DG, and Substation Power Cost Issues. Electr. Power Compon. Syst. 2023, 51, 409–420. [Google Scholar] [CrossRef]
  66. El-Zonkoly, A. Optimal placement of multi-distributed generation units including different load models using particle swarm optimization. Swarm Evol. Comput. 2011, 1, 50–59. [Google Scholar] [CrossRef]
  67. Radosavljevic, J.; Arsic, N.; Milovanovic, M.; Ktena, A. Optimal Placement and Sizing of Renewable Distributed Generation Using Hybrid Metaheuristic Algorithm. J. Mod. Power Syst. Clean Energy 2020, 8, 499–510. [Google Scholar] [CrossRef]
  68. Karunarathne, E.; Pasupuleti, J.; Ekanayake, J.; Almeida, D. Optimal Placement and Sizing of DGs in Distribution Networks Using MLPSO Algorithm. Energies 2020, 13, 6185. [Google Scholar] [CrossRef]
  69. Siregar, R.H.; Away, Y.; Tarmizi; Sara, I.D. Planning for Placement of Distributed Generators (DG) in Feeders with the Artificial Intelligent Hybrid GA-ANN Method. In Proceedings of the ICECME 2021: 3rd International Conference on Experimental and Computational Mechanics in Engineering, Banda Aceh, Indonesia, 11–12 October 2021; pp. 161–176. [Google Scholar] [CrossRef]
  70. Essa, M.B.; Alnabi, L.A.; Dhaher, A.K. Distribution power loss minimization via optimal sizing and placement of shunt capacitor and distributed generator with network reconfiguration. TELKOMNIKA Telecommun. Comput. Electron. Control. 2021, 19, 1039–1049. [Google Scholar] [CrossRef]
  71. Abbas, A.; Qaisar, S.M.; Waqar, A.; Ullah, N.; Al Ahmadi, A.A. Min-Max Regret-Based Approach for Sizing and Placement of DGs in Distribution System under a 24 h Load Horizon. Energies 2022, 15, 3701. [Google Scholar] [CrossRef]
  72. Ntombela, M.; Musasa, K.; Leoaneka, M.C. Power Loss Minimization and Voltage Profile Improvement by System Reconfiguration, DG Sizing, and Placement. Computation 2022, 10, 180. [Google Scholar] [CrossRef]
  73. Alizadeh, S.; Mahdavian, M.; Ganji, E. Optimal placement and sizing of photovoltaic power plants in power grid considering multi-objective optimization using evolutionary algorithms. J. Electr. Syst. Inf. Technol. 2023, 10, 7. [Google Scholar] [CrossRef]
  74. Sneha, J.A.; Kumar, K.; Victor, V.B.J.; Glenn, J.A. Optimal Placement of Different Types of Dg Sources in Distribution Networks Using Pso Algorithm and Differential Evolution. IOSR J. Electr. Electron. Eng. (IOSR-JEEE) 2014, 9, 41–45. [Google Scholar] [CrossRef]
  75. Mithulananthan, N.; Oo, T.; Phu, L.V. Distributed Generator Placement in Power Distribution System Using Genetic Algorithm to Reduce Losses. Thammasat Int. J. Sci. Technol. 2004, 9, 55–62. [Google Scholar]
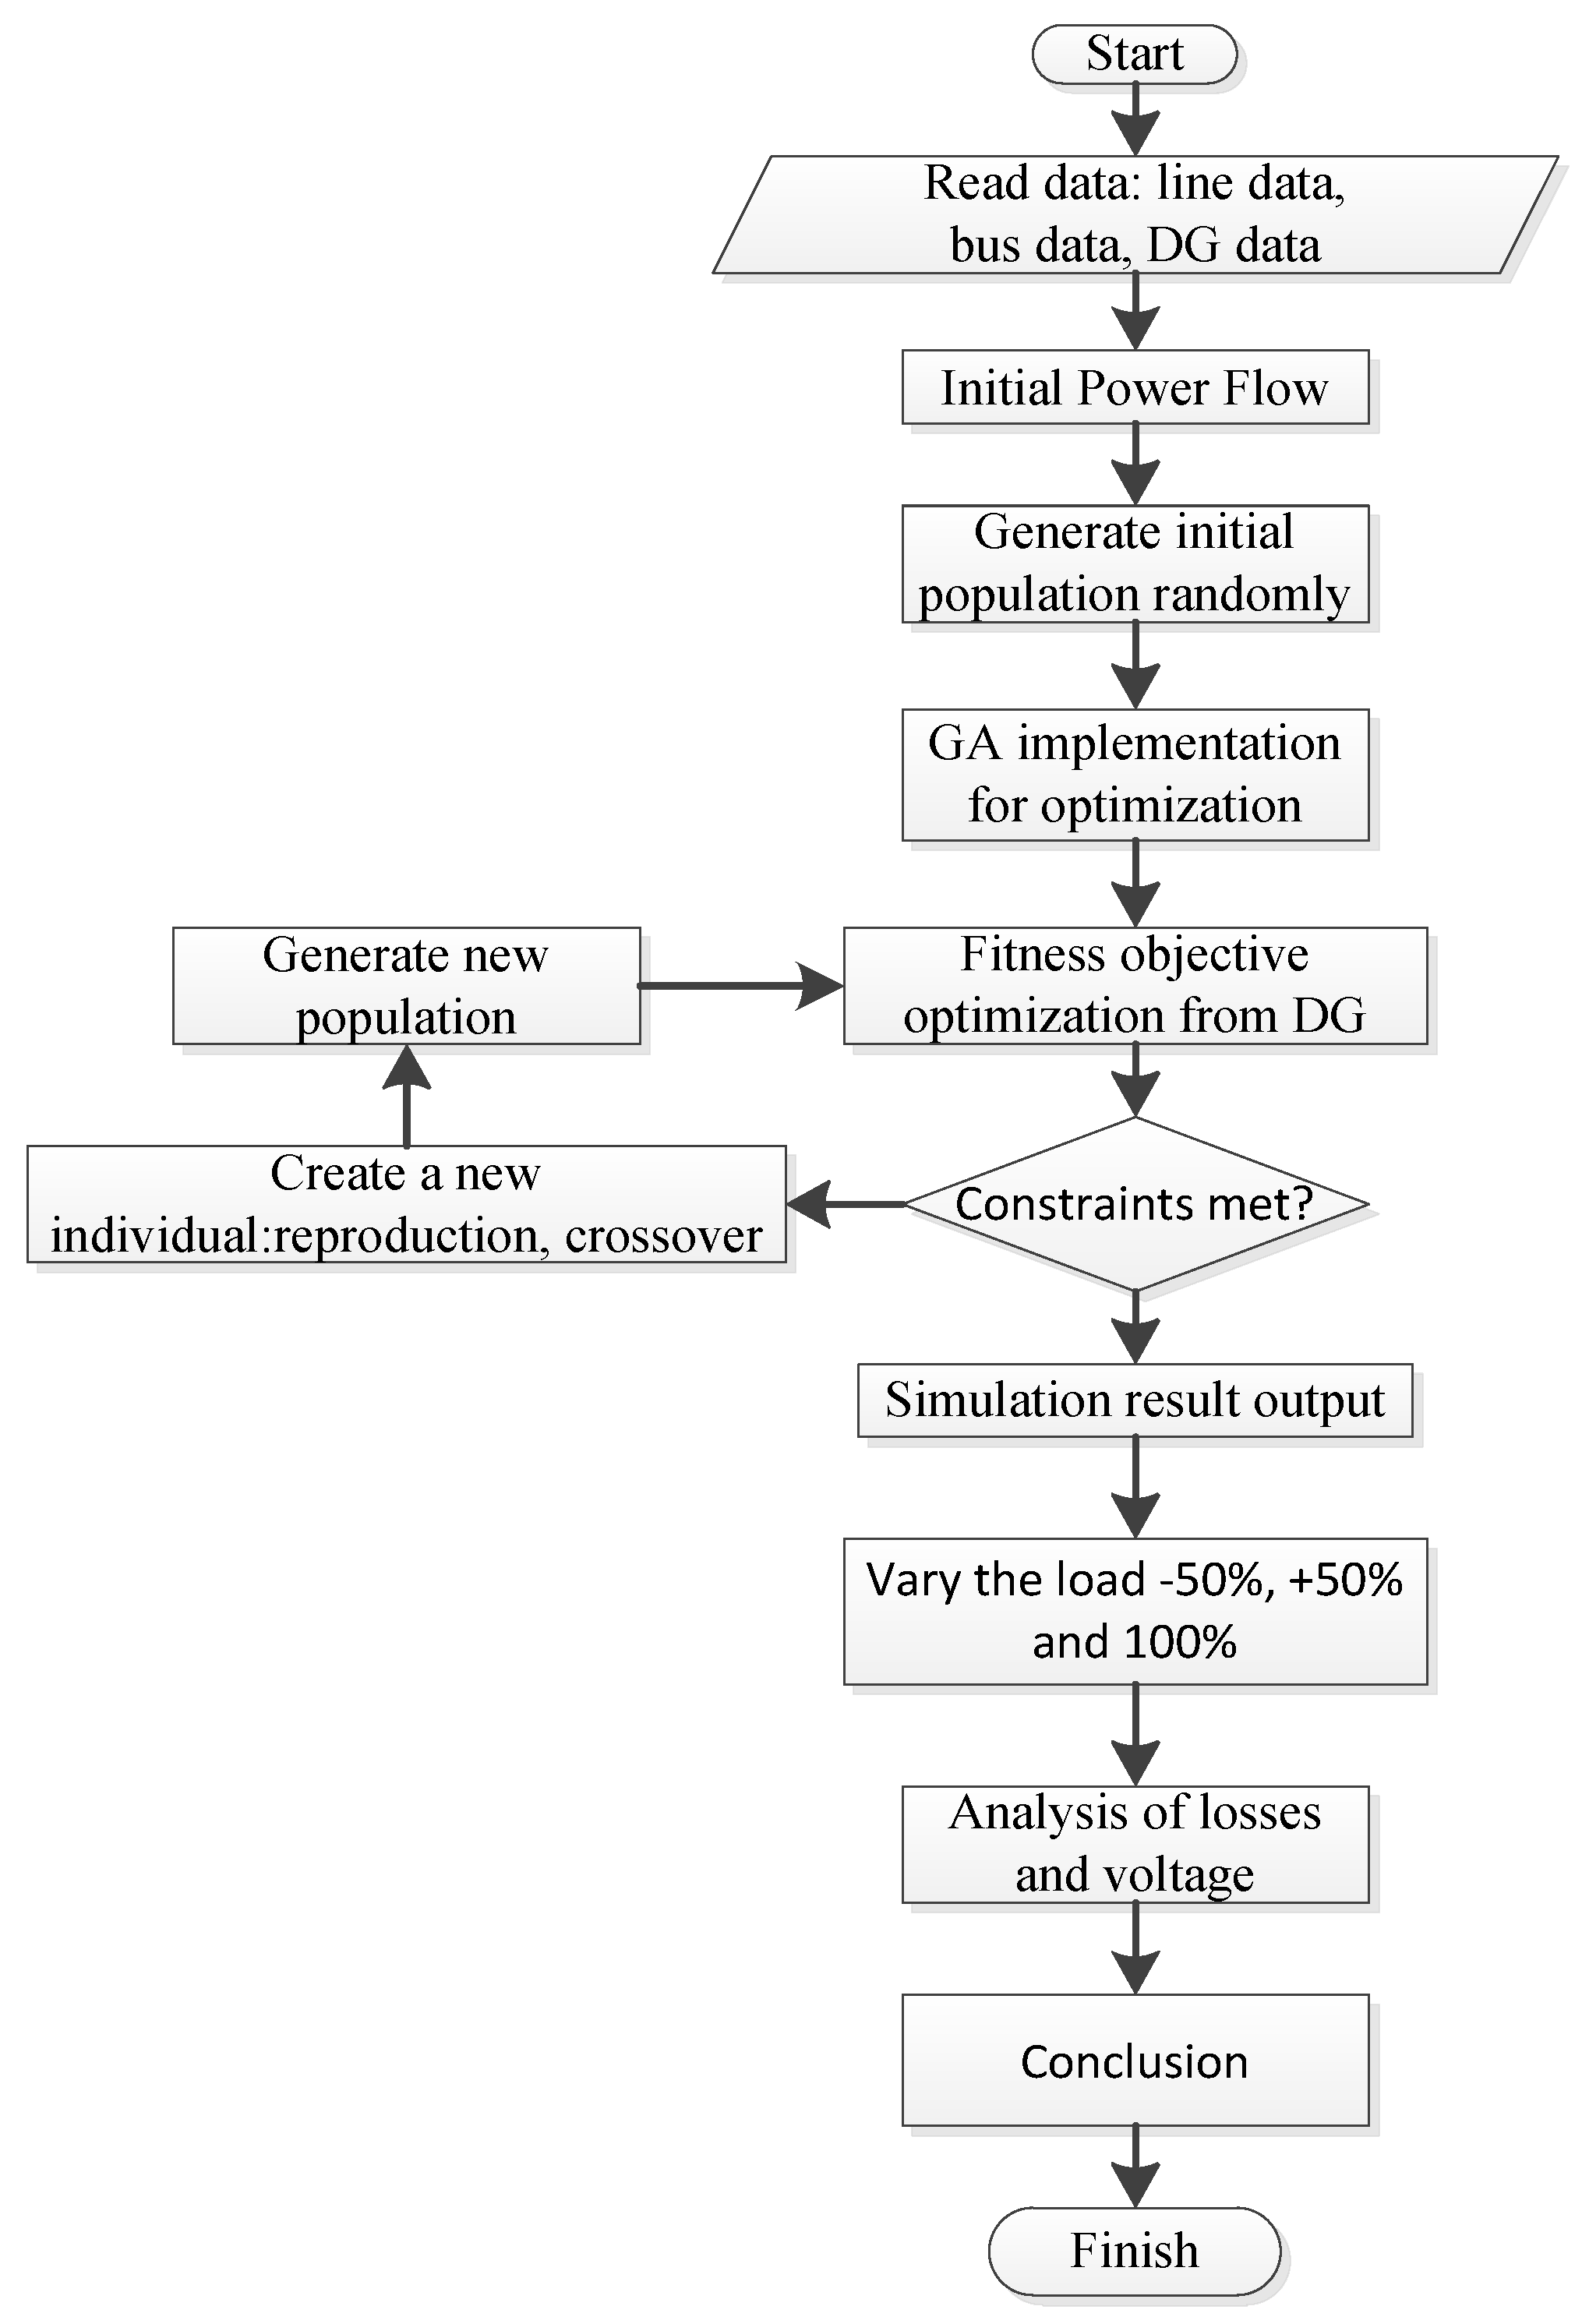
Figure 1. Flow chart optimization with GA.
Energies 16 05388 g001
Figure 2. Sample of a 6-bus radial distribution system. Where S is source, B is the bus which is bus-1 to bus-5, while Z is the line impedance between buses, for example Z12 is the impedance between bus-1, and bus-2, etc.
Energies 16 05388 g002
Figure 3. Distributed Generator is modeled as Negative Load.
Energies 16 05388 g003
Figure 4. Single line diagram of the Lingke KRC feeder. Numbers 1 to 37 are the bus numbering from the source to all loads in the feeder, while the arrows are loads from the bus in question.
Energies 16 05388 g004
Figure 5. Voltage profile of the Lingke KRC feeder.
Energies 16 05388 g005
Figure 6. Total loss of active power for each chromosome.
Energies 16 05388 g006
Figure 7. Comparison of active power loss before and after optimization.
Energies 16 05388 g007
Figure 8. Comparison of voltage profiles before and after DG placement optimization.
Energies 16 05388 g008
Figure 9. Voltage profile for (a) 25% load decrease and (b) 50% load decrease.
Energies 16 05388 g009
Figure 10. Voltage profile for (a) 25%, (b) 50%, (c) 75%, and (d) 100% of load increases.
Energies 16 05388 g010
Figure 11. Comparison of the normal load voltage profile with (a) 25% reduced load and (b) 50% reduced load.
Energies 16 05388 g011
Figure 12. Comparison of the normal load voltage profile with (a) 25% added load, 50% added load, 75% added load, and (b) 100% added load.
Energies 16 05388 g012
Table 1. Results of determining the location and capacity of DG.
DG Location (No Bus)DG Capacity (kW)
Bus 18190
Bus 20463
Bus 32370
Active power losses after/before9.9443 kW/54.67337875 kW
% Loss Reduction81.8114%
Reactive power losses after/before2.2130 kVAr/13.76872173 kVAr
Table 2. Comparison of ETAP and GA calculation results.
From
Bus
To
Bus
ETAPGA
P Loss
(kW)
Q Loss (kVAr)P Loss
(kW)
Q Loss
(kVAr)
121.20.41.78030.3564
230.60.10.59710.1195
340.20.40.20700.4145
451.00.21.14650.2295
56000.10270.0206
67000.12680.0254
780.30.10.25180.0504
790.30.10.04160.0083
8100.100.27100.0542
10110.200.29590.0592
11120.100.42170.0844
12130.200.15600.0312
1314000.00570.0011
515000.02730.0055
1516000.05630.0113
1617000.00890.0018
818000.31500.0603
1819000.00800.0016
12200.201.23710.2297
20210.100.33440.0413
21220.300.64030.0282
22230.100.14160.0122
2324000.03910.0239
2425000.02980.0013
2526000.00310.0028
1271.50.20.24480.0357
2728000.00910.0063
2729000.06000.0190
2930000.00560.0011
29310.200.01110.0022
27320.70.10.44810.0897
32330.200.22500.0450
33340.40.10.42250.0846
34350.200.16700.0334
3536000.00750.0015
35370.100.09870.0198
Total13.67.29.94432.2130
Table 3. Results of determining the location and capacity of DG with 25% and 50% load reduction.
Load ConditionDG Location (No Bus)DG Capacity (kW)Active Power Losses after/beforeReactive Power Losses% Loss Reduction
The 25% of load reductionBus 12666.7279 kW/32.249 kW1.2999 kVAr79.2771
Bus 5277
Bus 21340
The 50% of load reductionBus 112072.9825 kW/14.064 kW0.7113 kVAr78.7933
Bus 17207
Bus 22492
Average Loss Reduction (%)79.0352%
Table 4. Results of determining the DG location and capacity of load increases: 25%, 50%, 75%, and 100%.
Load ConditionDG Location (No Bus)DG Capacity (kW)Active Power Losses after/beforeReactive Power Losses% Loss Reduction
The 25% load increaseBus 948315.2266 kW/93.172 kW3.1142 kVAr83.6575%
Bus 22465
Bus 33118
The 50% load increaseBus 741822.9233 kW/136.94 kW5.8553 kVAr83.2603%
Bus 24445
Bus 34466
The 75% load increaseBus 840035.3814 kW/190.34 kW7.1415 kVAr81.4114%
Bus 13456
Bus 21395
The 100% load increaseBus 848550.8650 kW/254.02 kW10.3729 kVAr79.9759%
Bus 23489
Bus 24302
Average Loss Reduction (%)82.0762%
Table 5. A brief description of this work’s primary benefits and differences for GA optimization.
ReferenceBasic ObjectivesBenefitsDifferences with Other Works
Zakaria et al., 2020 [42]To determine the optimal capacity and location of DG by using genetic algorithm (GA) and ant colony algorithm (ACA).Optimal DG location and capacity can reduce active power losses.Its application is not in real systems but in IEEE systems with 57 buses. Otherwise, the load used is a fixed load.
Alinejad-Beromi et al., 2007 [43]Optimal DG allocation to improve the voltage profile and reduce power losses.The maximum average voltage occurs when DG is placed on bus 13, and the total active power losses occur when DG is placed on bus 9 and bus 13.The load used in the study is a fixed load.
Naderipour et al., 2021 [44]Allocation of capacitors and DG to minimize energy losses, peak losses, and capacitor costs in grid-connected and islanded modes, considering different load levels.The total cost, loss costs, and load power losses at fixed loads are lower than other types of loads.
-
Capacitors only inject reactive power and tend only to rectify the voltage, slightly reducing losses.
-
The study focuses on costs.
Wang and Zhong [45]The allocation of DGs and capacitors takes the voltage profile into account.DG is more influential in the improvement of the voltage profile.
-
Capacitors only inject reactive power.
-
The system applied is the IEEE 41-bus model (not a real field application).
-
The load used is a fixed load.
-
DG placement without taking into account power losses.
Rao et al., 2013 [46]The use of network reconfiguration in the utilization of DG.Effect of the number of DG locations in reducing losses for different loads.
-
Deployment of DG and also network reconfiguration.
-
The system applied is the IEEE standard system.
-
Uses the sensitivity factor (LSF) in determining DG location candidates
-
The position of DG is fixed with increasing load.
Kashyap et al., 2017 [47]Optimal allocation of DG using the GA.The GA provides a higher percentage
-
The system implemented are the standard IEEE 33 bus system and 69 bus system, not considering the increase in load.
Nayeripour et al., 2013 [48]Optimal location and capacity of multiple DG objects for transient stability.Considers different safety and load types.The system implemented is a Standard IEEE 33 bus system.
Yammani et al., 2016 [49]Multi-objects for optimal DG allocation.Combination of several functions of the power loss object, voltage profile, and cost.
-
The system implemented is a standard system: 33-bus.
-
Different load models.
-
Research conducted without considering the increase in load.
Imran et al., 2014 [50]DG optimal allocation and network reconfiguration.Power losses and voltage profiles.Applied for IEEE standard systems, which are not real systems in the field.
Prabha and Jayabarathi, 2016 [51]DG placement and capacity.Reducing power losses and improving voltage profiles.
-
The system implemented is the IEEE standard system: 33-bus and 69-bus.
-
Uses the sensitivity factor (LSF) in determining DG location candidates.
-
The research applied to the load model is different.
Mistry and Roy, 2014 [52]Increased loading with DG placement.Increased loading capacity without violating the voltage range limit.
-
The system implemented is a standard system: 33-bus.
-
The simulation is carried out for the development of loads for 4 years.
Moradi et al., 2014 [53]Placement of the optimal location and capacity of DG and capacitors with the hybrid method.Decreased power losses and increased voltage profile.The system applied is a standard system: 33-bus IEEE.
Doagou-Mojarrad et al., 2013 [54]Optimal DG location and capacity for energy losses, total cost of electricity, and total emissions as a multi-object.Reducing overall electrical energy waste, overall electrical energy expense, and overall created pollution.The system applied is a standard system: 33-bus IEEE.
Biswas et al., 2012 [55]Optimal DG placement with technical and economic constraints.Effect of DG placement on voltage sag disturbance.
-
The system applied is the IEEE standard system.
-
System condition during voltage sag disturbance.
Esmaili, et al. [56]Placing and sizing of DGs to improve voltage stability and reduce losses.Multiple DG placements do not always reduce losses.
-
The system applied is the IEEE standard system.
-
The type of DG used is the one that injects reactive power.
Gitizadeh et al., 2012 [57]Distribution network expansion planning with DG.Can reduce Investment and Operational (I&O) and Unsupplied Energy (ENS) costs.
-
The simulation is carried out for the development of loads for 4 years.
-
Hybrid particle swarm optimization (PSO); shuffled frog leaping (SFL) algorithm.
El-Zonkoly, 2011 [58]DG placement with PSO.Improved voltage profile and large losses.
-
The method used is the PSO approach.
-
The system applied is the IEEE standard system.
-
The research applied to the load model is different.
-
Uses the weighting method for multi-function objects.
Biswas, 2014 [59]Placement and location, apart from reducing power losses and improving the voltage profile, are also large harmonics and voltage profiles.In addition to obtaining the optimal DG location and capacity, total harmonic distortion (THD) results below 5% were also obtained.
-
The method used is the PSO approach
-
The system applied is the IEEE standard.
Kim, et al., 2008 [60]Determine DG location and capacity to obtain minimum power loss and improve voltage profile.The total energy losses and DG capacity can be reduced if the load voltage characteristics are taken into account.
-
Multi-objects set to fuzzy goal programming (FGP) and traced with the GA.
-
The system applied is the IEEE standard.
Vita, 2017 [61]Location and DG capacity are needed to reduce power losses and improve the voltage profile.Shows the effect of two different types of DG, namely photovoltaic (PV) and wind turbines.
-
The system applied is the IEEE standard.
-
There is a DG type which, on the contrary, lowers the voltage.
Kalantari and Kazemi, 2011 [62]Location and capacity of DG and capacitor bank with the GA.Could reduce power losses and improve the voltage profile.
-
Requires a capacitor in the application.
-
Its application in different systems.
Parizad et al., 2010 [63]Optimal location and capacity with the sensitivity method.Demonstrates the efficiency of this method for improvement of the voltage profile, reduction in power losses, as well as increasing power transfer capacity, maximum load, and voltage stability margin.
-
The system applied is the IEEE standard.
-
Separately, one by one it is carried out, such as minimizing power losses and then improving the voltage profile.
Aman et al., 2014 [64]The location and capacity of DGs in improving the loading system without violating the limits.The penetration of 40% can reduce losses by 60–75%, the maximum loading increases by 15–40%, and, in general, the voltage improvement increases.Radial distribution test on: Standard IEEE 16 bus systems: 16 bus, 33 bus and 69 bus system.
Rath et al., 2023 [65]Genetic algorithm method for determining the location and size of DG on a radial distribution network.Reducing power losses results in better results at higher penetrations and without violating the permissible voltage limits.Starting from a simple radial system to the standard IEEE system.
El-Zonkoly, 2011 [66]With multi-function objects, determine optimal DG location and capacity for different load models.
-
Increased voltage for different load models.
-
There are lines whose loading is fixed, decreases, and increases, but the loading is still within the allowable limits.
-
Short-circuit current level before and after DG.
-
Loading capacity increases, and voltage stability margin increases.
The system applied is the standard IEEE 30 bus system.
Moradi and Abedini, 2012 [23]Determination of the optimal DG location and capacity to reduce power losses with the GA–PSO hybrid method.Determination of its location using the GA and determination of its capacity using PSO:
-
Number of iterations and running time.
-
Output variances.
-
Objective function values.
-
Stability and voltage regulation.
The system applied are the standard IEEE 33 bus and 69 bus system.
Radosavljevi et al., 2020 [67]Placement and DG capacity from combined PV and wind.Minimizing energy losses and increasing profits.
-
The system implemented is an IEEE standard system, not a real feeder system.
-
Performed for daily load variations and four season influences.
Karunarathne et al., 2020 [68]Refinement of premature convergent algorithms, output accuracy, and complexity.Reduction in power losses.
-
System applied to IEEE model system and 54-bus rail system (on Malaysian 54-bus feeder).
-
The load used is a fixed load.
Siregar et al., 2020 [69]Determining the optimal location and capacity of the DG using the GA and determining the size of the PV with an artificial neural network (ANN).
-
Optimal DG location and capacity result in low power losses and a good voltage profile.
-
Determination of PV size based on ANN.
Without considering the increase in load.
Essa et al., 2021 [70]Determine the best conditions for the reconfiguration and combination of DG with shunt capacitors.
-
Can reduce active power losses.
-
Increasing DG and capacitors do not always give the best results, such as an increase in system costs, maintenance, and distance of gas supply.
-
The system applied is not a real system but an IEEE 33- and 69-bus system.
-
The load used has light, nominal, and heavy load conditions.
-
Through reconfiguration and combination of DG with shunt capacitors.
-
Uses the binary particle swarm optimization (BPSO) method.
Abbas et al., 2022 [71]Optimal DG allocation for 24 h load variations.
-
The best allocation for each hour.
-
Best allocation for all hours.
-
Applied to the CIGRE MV Benchmark Model.
-
Calculated for load development 24 h (a day).
-
Applied for DG PV and wind types.
Ntombela et al., 2023 [72]Reduce computation time in DG optimal allocation and reconfiguration.Attempting to reduce power loss and correct voltage requires less computation time.
-
The system implemented is the IEEE 30-bus standard system, not a real system.
-
Without considering the increase in load.
Alizadeh et al., 2023 [73]Determine optimal capacity and location in PV applications to reduce power losses and improve voltage profiles.Improved voltage profile and reduced power losses.
-
The system applied is not a real system but an IEEE 33- and 69-bus system.
-
Study of the effect of changes in power factor.
Proposed approaches:Minimizing power losses for sitting and sizing on DGs, considering the voltage profile at different loads using a genetic algorithm.Power losses can be reduced by an average of 81.1695% for each load condition, and the voltage profile is maintained within the allowable range, namely between 0.95 and 1.05 p.u. (better).
-
The system implemented is a real system in the field.
-
Performed a simulation with a large variation in the load.
-
Average losses reduced by 80% (better).
-
Better voltage profile close to 1 p.u. (better).
-
DG generating active power can reduce power losses and improve the voltage profile.
Table 6. Comparison of the performance results of genetic algorithm (GA), harmony algorithm search (HSA), and firework algorithm (FWA).
CaseLoad Level
Light (0.5)Nominal (1.0)Heavy (1.6)
Genetic Algorithm (GA)
(37-bus Lingke Krueng Cut)
Size of DG in MW (Bus Number)0.207 (11)0.190 (18)0.418 (7)
0.207 (17)0.463 (20)0.445 (24)
0.492 (22)0.370 (32)0.466 (34)
Power Loss (kW)2.9825 9.9443 30.9055
% Loss Reduction78.793381.811480.3287 (80.3111)
Minimum Voltage (p.u.)0.99250.99070.9713
Harmony Search Algorithm (HSA)
(33-bus IEEE) [46]
Size of DG in MW (Bus Number)0.1303 (18)0.1370 (18)0.1939 (18)
0.1777 (17)0.5724 (17)0.9108 (17)
0.5029 (33)1.0462 (33)1.6115 (33)
Power Loss (kW)23.2996.76260.97
% Loss Reduction50.552.2654.63 (52.4633)
Minimum Voltage (p.u.)0.98310.96700.9437
Firework Algorithm (FWA)
(33-bus IEEE) [50]
Size of DG in MW (Bus Number)0.2948 (14)0.5897 (14)0.9441 (14)
0.0947 (18)0.1895 (18)0.3013 (18)
0.5072 (32)1.0146 (32)1.6784 (32)
Power Loss (kW)21.3788.68238.07
% Loss Reduction54.5856.2458.57 (56.4633)
Minimum Voltage (p.u.)0.98440.96800.9484
Table 7. Comparison of performance results using genetic algorithm (GA) and particle swarm optimization (PSO).
ReferenceParameterPerformance Result
Genetic Algorithm (GA) (33-bus IEEE) [47]DG optimum location6
DG optimal size (kW)2600 kW (2.6 MW)
Power Loss (kW)111.03
% Loss Reduction47.39
Minimum Voltage (p.u.)0.9425
PSO (33-bus IEEE) [74,75]DG optimum location6
DG optimal size (kW)3150 kW (3.15 MW)
Power Loss (kW)115.29
% Loss Reduction45.36
Minimum Voltage (p.u.)-
Disclaimer/Publisher’s Note: The statements, opinions and data contained in all publications are solely those of the individual author(s) and contributor(s) and not of MDPI and/or the editor(s). MDPI and/or the editor(s) disclaim responsibility for any injury to people or property resulting from any ideas, methods, instructions or products referred to in the content.