1. Introduction
Motivation of research. Many nations have set tight energy efficiency (EE) [
1] and greenhouse gas (GHG) emission [
2,
3] targets and determined sustainable energy development pathways [
4,
5,
6] following the Paris Agreement in 2015 [
7], giving a special role to renewable energy sources (RES). Among them, solar photovoltaic (PV) energy has been gaining great attention as a sustainable source [
8,
9,
10], which, in addition, could aid to reduce dependence on fossil fuels [
9,
11], limit carbon emissions [
11,
12,
13], and alleviate the effects of the climate crisis [
14]. Following the Russian invasion of Ukraine, the European Union (EU) endorsed the REPowerEU plan [
15], with a focus on triangular energy savings, the diversification of energy imports, and the use of RES to replace fossil fuels and accelerate Europe’s clean energy transition. Special emphasis is placed on advanced technologies, including on new solar PV systems, the installed capacity of which is set to increase by 320 GW by 2025 and by 600 GW by 2030. As part of the REPowerEU plan, the European Solar Rooftop Initiative [
16] was established to unlock the vast and underutilized solar energy potential of rooftops. The EU Solar Energy Strategy [
17] highlights the combination of the installation of solar energy systems and renovation interventions to optimize the energy performance of buildings.
In Lithuania, the National Energy Independence Strategy (NEIS) [
18] mandates that by 2030, 70%, and by 2050, 100%, of domestically generated electricity must be from RES, by giving priority to wind farms [
19]. However, in 2022, amendments to this legislation were initiated [
20], according to which, by 2030, the total installed RES capacity in Lithuania is expected to be 7 GW, of which 1.4 GW will come from offshore wind, 3.6 GW from onshore wind, and 2 GW from solar. It is stressed that this is the only sustainable way to ensure the country’s independence and energy security [
20]. In addition, NEIS [
18] denotes that of all electricity consumers, 30% have to be generating prosumers by 2030, and this number should reach 500,000 if evaluated according to the current market size. The prosumer model is pursued through multiple schemes, with the most accessible being private rooftop solar PV or remote community solar farms. In contrast to conventional fossil fuel generation, under these approaches solar energy is highly decentralized and sparse in geographical density, although covering vast areas at installation sites. Where land has greater value and opportunity costs, such as in cities and urban areas, the determination of suitable space is essential for the procurement of solar energy technology. The distribution grid’s infrastructure is expensive, and may be a limiting factor for remote solar farms; therefore, city-wide distributed solar energy is viewed as the most rational approach, whereby energy is generated and consumed onsite and distribution infrastructure is adequate.
Novelty of the paper. However, solar plant deployment requires strategic planning and the detailed evaluation of land resources, roof areas, and the solar PV capacity that is potentially available, from technical, economic and market points of view. The methodologies employed for evaluating the accessible solar energy potential on land vary, and some studies have analyzed the expected efficiency and land occupation of PV technologies while also considering land competition [
21,
22], while other studies examine the possibility of using comprehensive Geographical Information System (GIS) grids of 1 km
2 and thorough resource modeling [
23]. Moreover, extensive studies focusing on Europe have discussed evaluation chains that consider technical, economic, social and environmental factors [
24]. Researchers have weighed the aforementioned factors in conjunction with geographical elements such as the slope, land use, urban extent, population distribution and proximity to the power grid, and produced 1 km-resolution suitability maps for PV power plants. On the other hand, roof and facade surface area have not been widely assessed, and have only been studied using estimation methodologies specific to each country or city. Novel studies have attempted to maintain accuracy, but simplified their evaluation computations by analyzing solar radiation and the shapes of urban skylines, modeling the coverage [
25] and analyzing the overshadowing effects on the tops of buildings, as well as inter-building solar reflections [
26].
Most studies evaluating solar potential utilize building topology and correlate it with geographical solar radiation data, and these techniques are becoming more accessible as tools that can be used to accurately simulate solar irradiation and to precisely model PV installation designs for building-integrated PV, which have thus advanced significantly [
27]. Although much has been done on this topic [
28,
29,
30,
31,
32,
33,
34,
35,
36,
37,
38,
39,
40,
41,
42,
43,
44,
45,
46,
47,
48,
49] (see
Section 2), in terms of the assessment methods proposed, assumptions made, data used, countries covered, results achieved, etc., there is no unified agreement on methodologies, and further, the Lithuanian case has never been considered comprehensively; therefore, little is known about the potential of using rooftop solar PV systems, about the approaches and methods applied [
50,
51], or about the contributions to policy formation and implementation. In addition, for the first time, factual LiDAR and actual consumption data have been blended and used in line with [
52] technical and economic potential assessments. These were carried out due to their utility in identifying areas capable of supporting high levels of renewable energy development. The production capabilities of rooftop PV systems were analyzed because there is evidence that this can reduce the need for electrical grids and improve network efficiency, by reducing distribution losses [
49]. The Lithuanian case is worth investigating because of the increasing energy prices [
21] in the country and the lack of a need for additional investment in infrastructure related to rooftop solar PV systems.
The scientific problem—How do we assess the technical and economic potential of urban rooftop solar PV systems at a country-wide level?
This paper aimed at assessing the technical and economic potentials of urban rooftop solar PV systems in Lithuania.
In seeking this aim, the following tasks were defined:
To analyze the technical features of apartment (AP), public (PUB) and commercial (COM) urban buildings in relation to their suitability for solar PV system installation;
To propose methods for assessing the technical and economic potential of solar PV systems;
To establish country-specific assumptions relating to this assessment;
To assess the technical (MW) and economic (EURct/kWh) potentials of solar PV systems on the rooftops of urban buildings;
To compare the results of the research with those from the literature reviewed.
The following outlines the methods applied and the data used. A literature review was undertaken to approach the problem. Various categories of buildings were studied using LiDAR and photogrammetry data on building topologies, and we also used Geographical Information Systems (GIS), digital maps for rooftop measurements, factual PV performance modeling and the levelized cost of energy (LCOE) method. This allowed for quantifying the potential power and amount of energy generated, evaluating the fraction of consumption on-site, and drawing insights into the percentage of roof area suitable for solar PV development, as well as the assessment of the investment requirements and the costs of solar energy.
The main contribution of this paper is in the fact that, for the first time, a detailed spatial roof analysis of the country has been carried out to identify the area of rooftop suitable for solar PV installations and building type-related estimates of the required area per installed PV unit (m
2/kW). Next, we used the developed model to assess the rooftops’ full capacity to take solar PV systems, and the price of such installations. The solar PV capacity was assessed for three types of buildings, including AP, PUB and COM buildings, which covers types that are both in and out of the scope of current support systems used to scale up solar PV installations in the country. Next, the role of electric vehicles (EVs) in consumption pattern was assessed. While wind energy production costs are well-documented in the literature [
53], the cost of deriving energy from solar PV systems on rooftops of buildings remains highly variable. The findings of this paper provide a fundamental reference point for urban rooftop PV in Lithuania, and can be used by actors in the energy and construction sectors, by regulators, and by policy-makers to evaluate development opportunities, and thus to guide strategic and sustainable energy investments. In detail, the findings presented in the paper could be used to support solar power development in Lithuania, while helping it to meet electricity demand in the future and achieve EE, RES and GHG emissions targets.
The rest of the article is organized as follows.
Section 2 reviews the literature on the assessment of various potential types of solar PV systems.
Section 3 introduces the research methods applied.
Section 4 presents the results of the analysis of selected building categories, and is followed by
Section 5, which presents the assumptions that were made.
Section 6 is dedicated to presenting the estimates of the technical and economic potential of rooftop solar PV systems, and
Section 7 discusses the results. In
Section 8, conclusions are drawn.
2. Literature Review
A literature review was conducted to help us understand the methodological principals of an assessment of the potential of rooftop solar PV systems, the applicability of methods to the national context, the assessed potentials, and based on these, the roles the rooftop solar PV systems could play in solving the issues of energy and climate policy.
The available literature on the potential of solar energy is broad [
28,
29,
30,
31,
32,
33,
34,
35,
36,
37,
38,
39,
40,
41,
42,
43,
44,
45,
46,
47,
48,
49,
50,
51] in terms of approaches, techniques and models applied, data used, regions, countries and cities analyzed, policies considered, constraints added, types of potentials assessed, etc. No consensus has been achieved in any of the assessments.
In the studies [
28,
29], the potential of solar energy in the context of other RES was quantified. The results demonstrate that solar has the greatest technical potential. In study [
30], the potentials of different solar technologies were estimated. The results reveal that solar PV systems have the greatest potential. There is a large amount of literature [
31] dealing with the potential of ground-mounted and rooftop solar PV systems, the latter being the concern of this paper and discussed below.
Worldwide, the technical potential of solar PV systems is assessed most widely and most comprehensively [
25,
28,
30,
31,
32,
35,
36,
37,
38,
40,
43,
45,
47], followed by the technical and economic potential [
33,
34,
46], the technical and market potential [
41], the theoretical potential [
49], the economic potential [
29], and the theoretical, practical and economic potential [
42]. Historically, Lithuanian scientists [
50,
51] have paid attention to the technical and market potential of solar PV systems in the country. In detail, in [
50], barriers limiting the rapid development of solar power in Lithuania were identified, and in [
51], 16–30 kW solar PV systems were modeled based on the results of analyses of the rooftops of residential buildings. Although this is a relevant sector, not all buildings are covered by this analysis, and nor is economic potential.
The potential of different solar PV systems was assessed by employing different methodologies, including top-down [
37] and bottom-up [
49] approaches, high-resolution satellite image analysis techniques [
35], spatial analysis [
28], high-resolution geospatial energy supply modeling [
32], geospatial analysis modeling [
29,
44,
45], 3D city models combined with modeling functions [
34], the NREL System Advisor Model [
38], Dynamic Energy Atlas software [
31], statistical analysis [
36], the GIS method [
30,
36,
43], machine learning [
33,
45], statistical methods [
47] and LCOE [
49]. In [
48], a methodology combining machine learning algorithms with GIS and physical models was applied. Simplified methods have been used too. Calcabrini et al. [
25] proposed a general model to compute the annual irradiation and energy yield of PV systems in complex urban areas. It is based on the correlation between solar radiation components and the skyline profile. They found that simplicity helped them in achieving high accuracy in their estimates, and in reducing the time that is required for modeling. Prasanna et al. [
40] proposed the parcel-scale assessment of rooftop solar PV technical potential, which was determined to be an accurate and low-effort approach when assessing technical potential in cities and communities in the United States (US). Low- to medium- [
46] and high- [
24,
32,
35] spatial resolution methodologies exist for estimating the potential. As was stated by [
46], methodologies are restricted by data availability. The methods were found to be dependent on the context analyzed, including the global, national, city or county levels, and on data availability.
The applied methods were provided with satellite and statistical data [
33], satellite imagery and weather data [
45], temperature data [
37], light detection and ranging (LiDAR) data [
36,
39], geographic information [
38], data on the availability and quality of renewable resources, technical system performance [
28], differences in local resources, the cost and revenue potential of technology-specific sites [
29], the long-term distribution of solar resources (global horizontal irradiation and direct normal irradiation), the configuration of the PV system, the conversion efficiency of PV panels, the shading and soiling of the panels [
42], high-spatial–temporal resolution climate data, the most common PV modules, the technical, policy and economic constrains [
43], data on solar resource availability, panel efficiency, spacing factors and available area [
30], cadastral and land use data [
46] and economic data [
49]. Constraints were added related to policy frameworks and regulations at the level of regions in the country [
31], topography, environmental concern and land-use [
28]. The feasibility factor was applied to avoid overestimations [
31].
The potentials were assessed at the global [
32,
37,
42], regional [
30,
32,
33], country [
28,
29,
31,
36,
38,
39,
40,
41,
43,
45,
46,
48,
49] and county [
34,
47] levels. The results show that solar PV/T installed on residential and commercial/public rooftops has enormous global potential [
32]. About 60% of the suitable building rooftops could be installed with PV/T collectors to offset most of the local energy demand. Covering 75% of suitable roofs with PV/T could enable us to meet the building’s energy needs. The global LCOE was estimated at 0.06–0.26 USD/kWh, with over 75% of the evaluated global area scoring below 0.12 USD/kWh [
42]. In the EU, solar energy systems on rooftops could cover 25% of the electricity consumption based on the 2016 level [
33]. The economic potential of the entire EU is about 467 TWh of electricity per year, i.e., the rooftop PV could potentially cover 16.8% of total electricity consumption [
33]. Despite similarities in areas, regions in Africa have different levels of technical potential. Eastern and South Africa have the largest solar PV potential, i.e., 219.5 PWh and 162.8 PWh per year. The total technical potential is 656.7 PWh per year. Among the different countries, the US and China have been widely analyzed. Scientists have estimated that the technical potential is 419.7 GW or 547.65 TWh per year in US, and small buildings showed the largest technical potential of 190 GW (45%) [
39]. The results for China show that, with the existing technological capabilities, the installed solar PV capacity potential is about 45.6 billion kW and the generation potential is about 66.3 PWh, which together cover 9 times the electricity demand in the country in 2020. In Europe, cases have been presented in Belgium [
31], Switzerland [
48], Ireland [
45] and Turkey [
49]. Belgium has a rooftop solar PV system technical potential of 99.44 GW, corresponding to a maximum theoretical electricity generation of about 108.76 TWh per year. The national and regional renewable energy goals for 2030, set in the National Energy and Climate Plan (NECP) for PV, can be covered by utilizing approximately 6% of the calculated technical potential yielded by PV on roofs. The findings for Switzerland [
48] reveal that solar PV panels could be fitted to 55% of the rooftop area. Even if they were installed on south-oriented rooftops, this could cover more than 40% of the electricity demand in the country. Switzerland’s annual rooftop PV potential has been estimated at 24 ± 9 TWh. The modeling of a scenario with 6 PV panels on suitable rooftops in Ireland [
45] showed a technical potential of 2.5 GW, or 21% of the existent power system’s size; 22% of all residential demand could thus be satisfied. This could further increase if 10 PV panels were used, placed on every suitable home. The potential of the latter scenario has been estimated to be 13 GW, or 113% of the size of the power system. The theoretical potential of rooftop PV systems in Turkey [
49] is 55 GW (if the total area of south-oriented rooftops is used), and the total technical potential was shown to be 14.9 GW. It is expected that this capacity could produce 22 TWh of electricity a year. About 70% of the total potential capacity of rooftop PV systems was derived from residential buildings. The LCOE (4–9 USDct/kWh) of these systems for residential buildings was estimated to be 30–50% higher than the grid tariff. The estimated total cost of investments for rooftop PV systems is USD 20.8 billion.
Thus, a review of the literature has shown that most of the previous studies have mainly focused on analyzing the potential of solar energy use on a local scale, and are usually based on the country scale but applying different methods and their combinations. However, innovative methods are needed to determine the potential of solar PV production at the city and regional levels, and these methods require more accurate assessments. There is little research on the potential capacity in Lithuania in the context of it meeting its targets regarding RES and solar, which will require additional estimations.
3. Research Method
The methodology established and the research undertaken were focused on answering specific scientific questions:
To what extent is it technically possible to install solar PV systems on the roofs of selected categories of buildings in Lithuanian urban areas? What would be the investment requirements and energy costs of these solar PV systems?
3.1. Object of Research
Six categories of buildings were analyzed in the paper. These were apartment (AP), commercial (COM) (shopping centers (SHC)) and public (PUB) buildings, the latter divided into schools (SCH), higher education (HE), nursery and preschool (NP), as well as hospital (H) buildings. In total, 39 buildings in Vilnius city (54.6872° N, 25.2797° E) were assessed, from which 19 AP buildings were selected on the premise that they had been built before the end of 2018, and thus currently have smart meters installed. In addition, a set of 10 buildings from the largest and most widespread commercial chains and shopping buildings, and a set of 10 primary and secondary education institutions, were analyzed. Furthermore, 20 COM buildings, 25 educational institutions including 5 universities, and 10 H buildings were considered, all of which were situated across six cities in Lithuania, these being Vilnius, Kaunas, Klaipeda, Siauliai, Panevezys and Alytus.
In addition, the public electric vehicle (EV) charging infrastructure was analyzed. Typically, car parking lots near to COM and PUB access buildings have Level 2 or fast charging stations. While it is postulated that in the near future regular Level 2 charging stations could be installed in blocks of AP buildings as well, it is predicted that by 2025, EVs will represent 10% of global passenger vehicle sales, rising to 28% in 2030 and 58% in 2040 [
54]. However, according to the statistics distributed by the Ministry of Transport and Communications, by 1 March 2023, there were 8413 battery electric vehicles (BEVs) and 5580 plug-in hybrid electric vehicles (PHEVs) registered in Lithuania [
55]. Together, this corresponds to about 1% of the total fleet, and of all new vehicle sales, BEVs comprise in 6.6% Lithuania, as estimated by the European Alternative Fuels Observatory [
56]. Growth trends were observed, although it must be considered that when comparing the share of registered passenger vehicles and EVs, Lithuania is at the early stages of the transition to electric transportation. In all markets, charging developments have had a major influence on the scale of EV adoption. The charging network in Lithuania is also developing, led by a leading market player that operates more than 70 charging points, of which 54 are in Vilnius city, represented by 2 × 50 kW DC and 1 × 43 kW AC connectors.
In addition, solar PV systems with a 30 kWp rating, installed at the distribution level in Vilnius and Klaipėda (55.7033° N, 21.1443° E), were evaluated too. These systems represent typical rooftop PV installations in urban environments, upon which solar panels are either directly mounted or are elevated by 10 to 15 degrees using angular construction, depending on the roofing material and slope. Due to variations in roof orientation, the generation profiles of these systems were aggregated into a series of mean values, thus allowing us to construct a conservative solar energy generation profile.
3.2. Primary Data, Their Collection and Processing
This paper employed actual hourly measured power data derived from automated smart meters. Data for the entire of 2019 were extracted from the database of the distribution system operator (DSO) “Energijos skirstymo operatorius” (ESO).
The extracted metering data of solar PV systems were formatted to data frames using Pyhton Pandas libraries to facilitate flexible data manipulation and analysis. Based on date keys in the listed data, an algorithm detected the season, thus constructing an hourly generation model and mean models for daily, seasonal, and yearly cycles. The models were created based on a reference solar panel that is widely deployed in installations, built by one of the largest energy companies in the Baltic States—the Longi Solar Hi-Mo4 commercial module, with 365 W nominal power and 19% to 20.4% manufacturer-specified efficiency. Initially, the difference in the expected generation between the east and west of Lithuania was validated. A set of 6 solar PV systems in Klaipeda and a set of 9 solar PV systems in Vilnius city were selected, all of which were installed during 2012–2013, when a policy scheme promoting solar energy development was active. Analyses revealed that western PV systems generated around 16% more energy per year in comparison to eastern PV systems. For the purpose of maintaining co-localization with the analyzed AP buildings and to enable objective consumption–generation comparisons, the solar PV system profile was modeled after the systems installed in Vilnius city. The obtained solar generation profile showed an annual output of 26,148.2 kWh, corresponding to a yield of 871.6 kWh/kWp in a year (for comparison, the Solargis Prospect modeling tool predicted the 30 kWp system’s output at 28,350.7 kWh under optimal performance conditions in Vilnius city, with 26,499.7 kWh as the long-term average for 25 years of plant operation (883.3 kWh/kWp a year)). Therefore, the model offers conservative and a realistic analysis. In the further analysis steps, this generation model was used as the base for potential generation, in each case being proportionally scaled to the relevant rooftop installation size.
In a similar manner, the actual 2019 consumption data were obtained for each metering point in all of the selected buildings, as traced using the smart meter object identifiers in the ESO database. In AP buildings, such metering points correspond to each consumer per apartment. For the COM and PUB buildings, the metering points correspond to the distribution grid feeder or substation connection positions. Using proprietary algorithms in Python Pandas library to compute power over time in the format standardized to the generation data, hourly instantaneous consumption profiles were assembled for each building location, and the mean consumption was computed on daily, seasonal and yearly scales. On the daily profile, a general household consumption pattern could be observed for AP buildings, with peaks reached between 6:00 p.m. and 8:00 p.m. and the lowest consumption occurring from 1:00 a.m. to 4:00 a.m. Considering seasonality, the AP buildings consumed approximately 20% to 50% more energy in autumn and winter seasons compared to summer, mostly for heating systems. For COM buildings, such as shopping centers and supermarkets, the daily pattern was spread over the operating hours, generally between 6:00 a.m. and 9:00 p.m., dropping to a baseload level for the night period. The seasonal difference in daily peaks is minimal, with summer months showing higher consumption in shopping centers during the day due to the operation of air conditioning systems. On the other hand, school buildings’ consumption was characterized by a peak early in the day, at the time that lessons and lectures begin, which gradually decreased towards the end of working hours. Occasionally, in some schools, a lower second peak could be observed around 6:00 p.m. or 7:00 p.m., when evening events and extracurricular activities take place in school buildings. Moreover, the seasonal differences are substantial, as the schools close during the summer months for student holidays, and consumption drops to the base level for the following months. The divergences in consumption profiles suggest that each category of building can show different shares of its energy demand being covered by solar energy, and these levels will vary in relation to local self-consumption.
Vilnius city’s public charging stations were analyzed using actual 2019 consumption data provided by the distribution grid operator. The EV charging usage data were formatted to the standardized hourly profile with the algorithms discussed earlier, and averaged over all the locations to obtain a mean profile. The obtained models represent the average charging energy consumption per day, season and year, for each unit of the charging station in Vilnius. In the main algorithm, a binary selector variable has been used that either excludes EV charging in specific buildings or adds the consumption for EV charging to the studied locations of COM and PUB buildings. In general, the on-site EV chargers, specifically with smart control mechanisms, have the potential to improve the local self-consumption of solar energy during the day, and contribute to reducing the impact of intermittency on solar energy supply.
3.3. Research Methods
3.3.1. Analysis of Selected Urban Building Categories
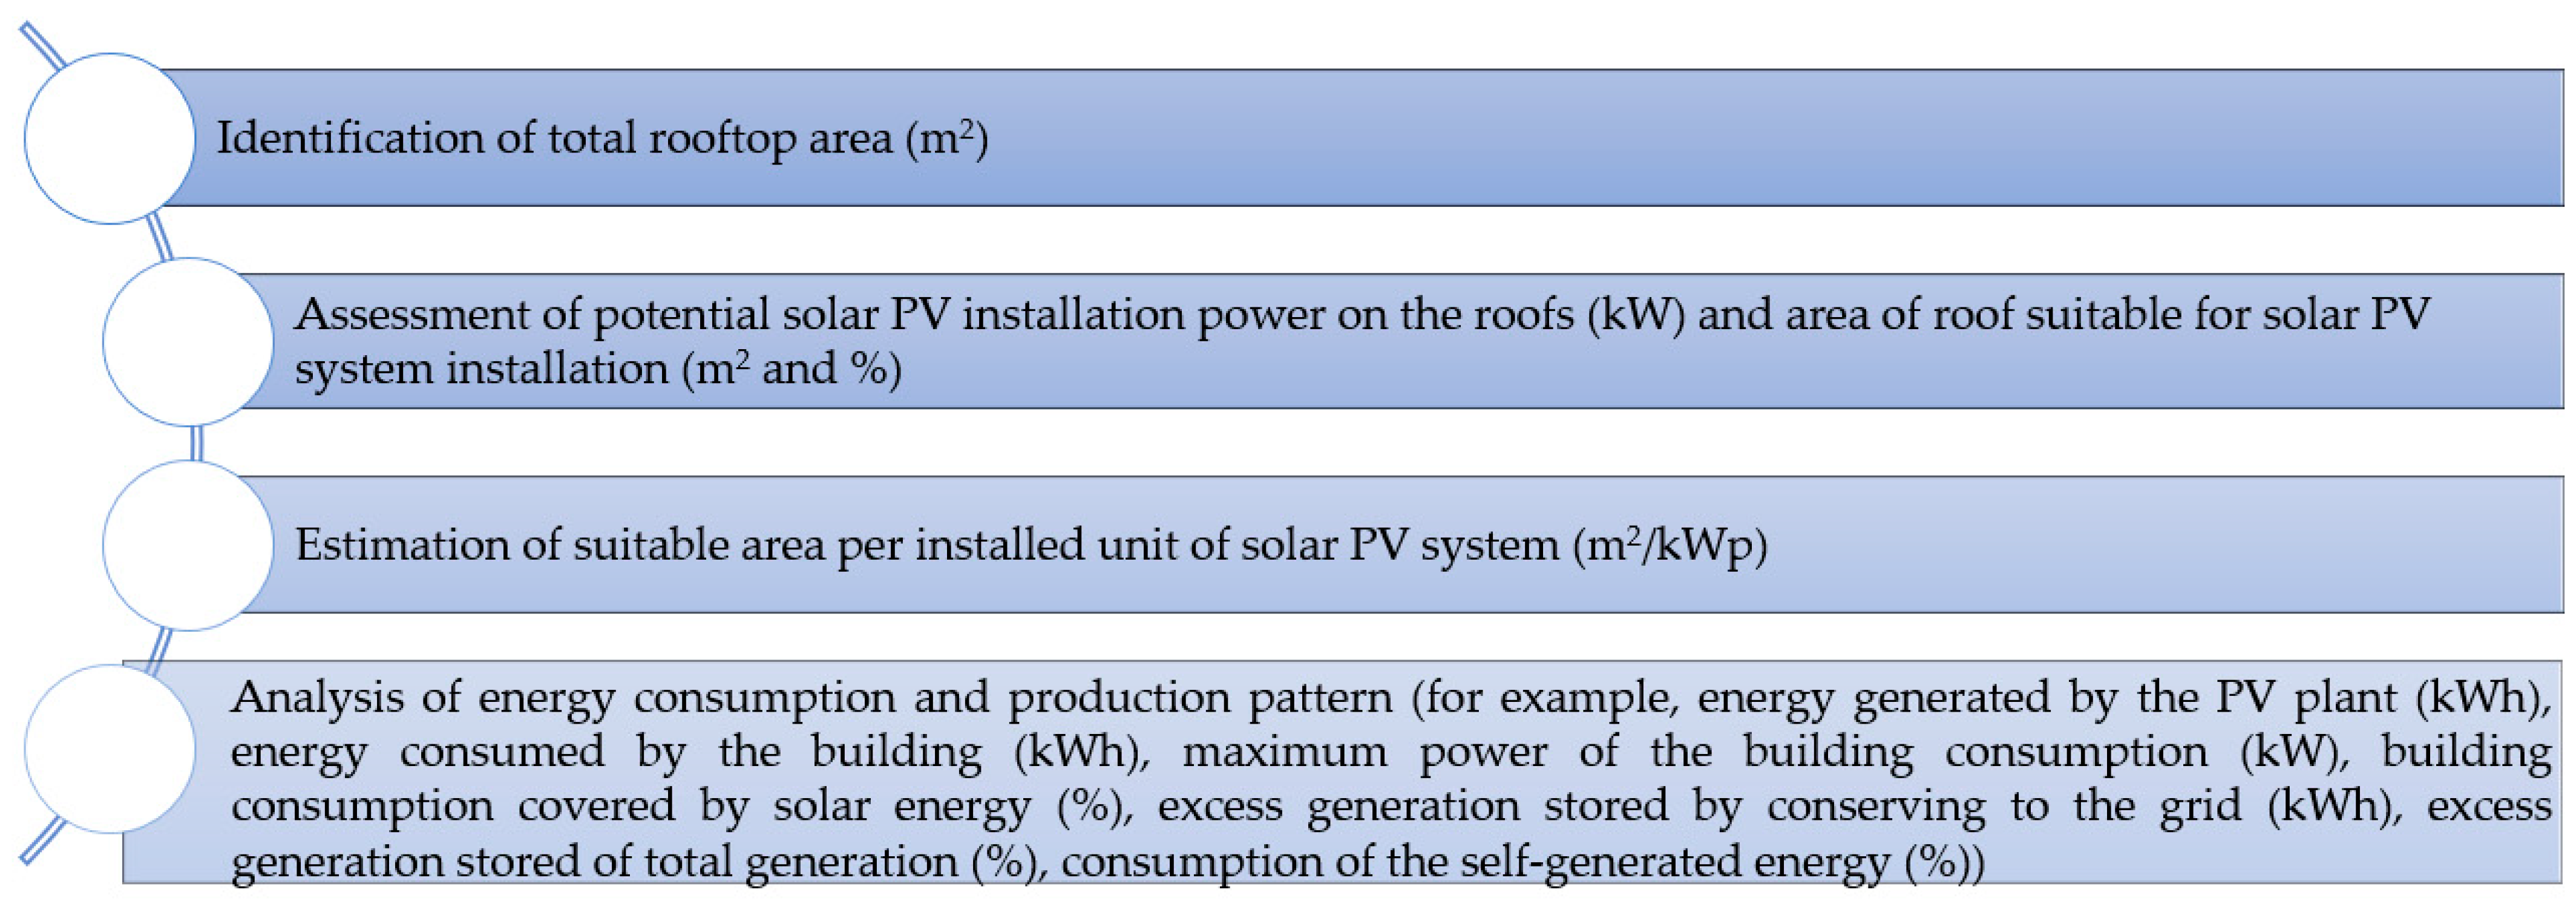
An analysis of the selected building categories was initiated to assess the suitability of each building category’s roof for the installation of solar PV systems, and the resulting amounts and shares of solar energy production and consumption. This analysis was undertaken via the following steps described below (
Figure 1).
Firstly, the total rooftop area of the selected buildings in Vilnius city was determined. Typically, such an analysis involves the use of a broad array of resources, such as vector cartographic maps, digital cadastral services, state geographic information systems (GIS), digital elevation and digital surface models, and aerial photos. These sources provide rich information on the buildings’ size, shape, height and footprint, as well as an accurate location, and other urban features, though the need for precision models of cities has driven the use of photogrammetry and LiDAR point cloud mapping. Up to 2020, vast image and orthographic projection data of Vilnius city were collected, and the municipal government has published an openly accessible three-dimensional GIS projection map of the entire city (3D Vilnius [
57]). The rooftops of the selected buildings were thus measured using this three-dimensional map and its built-in spatial analytics functions. The total roof area was measured via the detailed selection of the planar layer in the projection, and validated with top-view area measurements performed on another ArcGIS platform that visualizes topographic data (maps.lt).
It was assumed, however, that a solar PV system cannot cover the whole roof area, and we also considered lighting and shadows, existing obstacles such as chimneys, heating, ventilation, and air-conditioning (HVAC) apparatus, angle, slope, compass orientation, and required margins for safety and maintenance operations. Accordingly, the area of roof suitable for solar PV system installation was investigated. For this purpose, the internal Solar Potential Calculator, provided by a leading energy utility company in the Baltics, was used. This tool was developed as a GIS application visualizing the potential space for solar PV panels on selected roofs. The Calculator is based on comprehensive externally supplied data on solar irradiation and very precise spatial projections of buildings in Vilnius city. It was configured to simulate solar PV systems with a reference 365 kWp module, of the size 1052 × 1776 mm. The Calculator allowed for investigating both the area of suitable roof and the resulting potential solar PV installation power on the roofs of the analyzed buildings, meaning that each roof (m
2) was assigned a potential PV system power (kW).
Figure 2 illustrates the steps of the analysis, with projections of buildings and their roofs, for a building in each of the analyzed categories.
Thirdly, the suitable area per installed unit of power (m2/kWp) was calculated by dividing the roof area suitable for a solar PV system by the size of the unit possibly installed on the roof.
Fourthly, to ensure a precise assessment of the solar energy consumed and the length of the assembled data frames regarding building consumption, the time required for EV charging consumption and solar PV generation were checked. If discrepancies were found, an algorithm adjusted the start and end data periods, while parsing the exact day and hour identifiers to the central program. Given the consumption profiles for each of the analyzed cases, the main algorithm of the program was developed, whereby, during each hour of the year, instantaneous consumption and solar generation models were analytically equated and compared. In case the total for generation per specific hour exceeded the consumption, that difference in energy was characterized as excess generation energy, meaning it was classified as virtually stored electricity, even though it is physically transferred back to the distribution grid. The maximum value of the discrepancy between solar energy and building usage was classified as the highest power of the excess feed in, which enabled an assessment of the admissibility of the present distribution feeder’s connection capacity. In addition, the algorithm captured maximum hourly solar PV power for the entire year from the simulated model, giving insights into the operation effectiveness of the plant with a known nominal rated power. Similarly, the maximum power of building consumption and, if selected, the EV charging consumption per whole year were saved. Furthermore, the algorithm was specialized to compute specific energy parameters:
The amount of solar energy generated and energy consumed during a year;
The total amount of conserved energy and its fraction relative to total generation;
The proportion of consumption covered by solar energy;
The proportion of immediately self-consumed solar energy.
To visualize the energy flows in both directions, the algorithm was used to produce figures of energy consumed and energy generated by the solar PV plant as an aggregate of each day (
Figure 3), while also automatically depicting the amount of conserved excess energy during each day (
Figure 4). For instance, the assessment of apartment building one (AP1) is illustrated in
Figure 3,
Figure 4 and
Figure 5.
As is shown in
Figure 3, if a solar PV plant is installed on the rooftop of building AP1, it generates the most energy in June (up to 80 kWh per day), but this month also shows the lowest level of energy consumption in a year (up to 260 kWh). Little amounts of energy are generated in November–January, when the highest amounts of energy are consumed in the building.
As is shown in
Figure 4, in building AP1, most of the solar energy (3.2 kWh) is fed to the grid for excess conservation during a single day in June, but no solar energy is fed to the grid from the middle of August to March, suggesting that when installing solar PV plants on the roof, it is possible to connect more RES to a limited grid.
Figure 5 shows the mean energy consumption and generation profiles for each season.
As is shown in
Figure 5, solar energy generation and consumption in building AP1 is seasonal. AP1 consumes the most energy in autumn and winter, but the least in summer. The amount of energy produced by a solar PV plant is less in comparison to energy consumption during every season, proving that grid services are used rarely. The solar generation pattern is well matched to the consumption profile. During a day, energy consumption increases at 4 a.m. and starts decreasing at 8 p.m. With the onset of sunrise, solar energy generation increases, and it diminishes at sunset.
The results of the analyses of selected building categories were averaged and tailored to establish assumptions, and later, to assess the technical and economic potential of solar PV systems in Lithuanian urban areas.
3.3.2. Method Used to Assess the Technical Potential of Solar PV Systems
An assessment of the total potential productivity of rooftop solar PV systems in urban areas was carried out using the results of a case study on area of suitable roof and PV installation size, as well as national statistical data on AP, COM and PUB buildings in Lithuania. In this paper, an approach applied in [
46] was used. According to this, the total technical potential of rooftop solar PV systems was calculated as a function of the number of candidate buildings, their area of suitable roofing for the installation of a solar PV system, and the ratio of the latter to a power unit, using Equation (1):
where
is the total technical potential of rooftop solar PV systems, kW;
is the number of buildings in category
k, units;
represents the quantity of building suitability in category
k, %;
denotes the suitable area on rooftops within building category
k, m
2;
is the required area per installed unit of solar PV system, m
2/kW.
A value of
that would represent the entire country was identified using several sources. The ESO study (Reference is confidential) and the statistical data of “Busto energijos taupymo agentura” were used to identify the number of AP buildings. Regarding the commercial centers and shops, data were gathered from the websites of the six largest retail companies. The numbers of preschools, as well as primary, secondary, and higher (tertiary) education institutions, were collected from the databases of Lithuanian Official Statistics [
59] and the Education Management Information System [
60]. Lastly, the Institute of Hygiene under the Ministry of Health [
61] provided data on the number of general hospitals and outpatient clinics.
An analysis was initiated since the AP buildings that were selected for analysis were generally newly constructed apartment blocks; however, based on preceding assessments undertaken by ESO, it was assumed that older houses could be used for the installation of solar PV systems too. Nevertheless, not every AP building is equally suited to be fit with a solar PV system. Therefore, to assess the suitability of such buildings, a collection of 1000 houses in Pilaite district, located in western Vilnius, was analyzed using the Solar Potential Calculator. The potential power and solar resource criteria were applied—if less than 2 kWp could be installed on rooftops on which solar radiation is below 700 kWh/kWp per year, the rooftops were classified as unsuitable. On the other hand, COM and PUB buildings feature broadly different roof structures and technologies, and they are difficult to evaluate for their suitability. Therefore, internal discussions and consultations with specialists at leading energy utility companies in the Baltics were initiated on solar PV installations suitable for non-residential customers.
Data on the and were derived after analyzing the selected categories of buildings and taking their average values.
3.3.3. Method Used to Assess the Economic Potential of Solar PV Systems
In line with [
33,
46], the economic potential of a solar PV system was assessed by calculating the total investment required to extract the technical potential and the levelized cost of energy (LCOE) of a solar PV system on the rooftop of a selected building category. The LCOE method was selected because it is sufficiently sophisticated, widely adaptable, and has a reduced cost [
62]. It allows for a comparison of the results achieved by solar technology with those yielded by grid electricity [
46] or other technologies [
63]. Such comparisons could be undertaken regardless of differences in life spans, capital costs, the sizes of the projects, and the risks associated with each technology [
64].
The total investment (
) required to extract the technical potential was calculated using Equation (2):
here,
k is the building category;
is the assessed technical potential of solar PV systems on the rooftops of building category
k, kW;
is the investment required for the installation of a solar PV system on a rooftop of a building in category
k, EUR/kW.
The LCOE was calculated using Equation (3) [
47,
64,
65,
66]:
here,
It is investment at time step
t, EUR;
O&Mt is operation and maintenance cost at time step
t, EUR;
ISt is investment subsidy, EUR;
CI is installed capacity, kW;
LF is load factor, %;
DE is degradation coefficient, %;
d is discount rate, %;
t is time period, years.
The LCOE assesses all the costs of a solar PV system, namely, total life cycle costs and total lifetime energy production. The life cycle costs of the system include initial investment costs, operational and maintenance (O&M) costs, fuel costs, and other costs; however, assessments of the solar PV system did not account for fuel costs, as the PV system’s primary energy source—solar radiation—is free [
65]. In detail, the LCOE considered the costs of the PV panel and the acquisition of a balance of system (BOS), including inverters, cables, structures, a lightning protection system and other things [
66]. The share of BOS in the total investment increased from 29% to 51% between 2007 and 2014 [
67].
O&Mt costs were calculated according to Equation (4) [
68]:
here,
FCt is fixed costs, EUR/kW/year;
VCt is variable costs, EUR/kWh.
In [
63],
FCt is considered 1% of the capital cost.
VCt is the cost of electricity storage. Typically, the electricity storage costs are calculated by use of the net-metering method employed by prosumers, which yields the payment for installed capacity (EUR/kW/month) or the price of energy recovered from the grid (EURct/kWh). The findings of analyses of energy consumption–production in selected buildings show that almost all solar electricity produced will be consumed by the buildings; therefore, this means that
VCt = 0.
The value of
d was calculated according to Equations (5) and (6) [
69]:
here,
WACCl is the weighted average cost of capital under financing strategy
l, %;
RE;l is the cost of equity, %;
El is the amount of equity financing, EUR;
Dl is the amount of debt financing, EUR;
RD;l is the cost of debt financing, %;
Tincome is income tax, %.
The values of
WACCl, which were calculated according to Equations (5) and (6) and have been applied in the paper, are shown in
Table 1.
The three levels of discount rates allowed us to assess the minimum, maximum and average LCOE values for each financing strategy.
4. Outcomes of Assessment of Selected Buildings and Their Categories
The outcomes of the analyses of the selected buildings in Vilnius and other cities in Lithuania are presented in
Table 2 and
Table 3, and in
Figure 5 and
Figure 6.
As is shown in
Table 2, while flat rooftops with no protruding structures allow for the greatest coverage with solar PV systems (for instance, buildings AP8 and AP9, with more than 78% of the whole rooftop being usable), AP buildings have a roof area that is suitable for PV system installation of about 59% on average. Similarly, 60% of the roof area of NP buildings could be used for solar PV systems, while hospital buildings show a suitable roof area of just under 50%, mostly due to the fact that their direction of slope is away from the optimal direction, as well as their highly fractured and tilted surfaces. SCH and HE buildings were found to have generally well-suited and spacious roofs, with a roof area of 74% that is suitable. Nevertheless, the extensive and flat rooftops of COM buildings, with 87% of their total area being suitable for solar PV systems, were the most suited. That said, typically, solar PV systems are best installed with a tilt angle on a flat roof, which creates overshadowing and increases the degree of row spacing; hence the coverage on rooftops of COM buildings—18 m
2 per installed kW—is higher than the range of 15 m
2 to 16 m
2 per installed kW achieved by residential AP and PUB buildings.
As regards AP buildings, solar energy is consumed locally with highly variable factors (
Figure 6).
As is shown in
Figure 6, AP buildings consume anywhere from almost 100% of solar energy generated down to less than 35% in some cases. Specifically, buildings AP1, AP3, AP4, AP5 and AP16 consumed almost all of their self-generated solar electricity, while little was consumed by buildings AP6 and AP8. Moreover, on the roofs of buildings AP6 and AP8, solar PV systems could be installed that provide more than 3 times their consumption. In these cases, the solar energy produced will have to be supplied to grid. In contrast, on the roofs of buildings AP1, AP3, AP4, AP5 and AP16, the only solar PV systems that could be installed would only yield half their consumption, resulting in the additional supply of electricity from grid services. In general, the assessment of AP buildings shows that installing a large solar PV system on the roof of a low-consumption house results in over 60% of the generated energy being transferred back to the grid. On the other hand, all generated energy is immediately consumed on site when the rated solar plant produces less than half of the maximum power flow required by the building. The indicators and estimates for the most widely differing cases are presented in
Table 3.
The results in
Table 3 show that buildings AP8 and AP4, which are similar in total roof area, have different potentials for carrying solar PV systems. In detail, AP8 has the potential to carry a solar PV system twice as large. On AP8, the solar PV system could satisfy 91.9% of energy demand, in comparison to 12.1% achieved by that on AP4. However, for AP8, more than 65% of the generated solar energy would be fed to the distribution grid, saturating the feeder lines leading to this district, while AP4 would consume 99.7% of the solar energy produced without feeding it to the grid.
Figure 7 presents the self-consumption of solar energy by the COM and PUB buildings with and without EV chargers.
As is shown in
Figure 7, all the analyzed COM buildings were found to use 97% and more of their own self-generated solar energy, if we excluded the EV charging locations from the simulation. Even though the COM buildings’ consumption pattern showed a greater match with the solar energy generation profile, these COM buildings required much more energy in general to power the refrigeration systems, lighting and air conditioning, among other powered apparatus, which consumption levels in AP buildings were much smaller. This means that the generated electricity would be instantaneously consumed without flowing back into the grid. Thus, the investment required in order to construct solar generation technology represents an opportunity to reduce the energy and electricity bills for commercial consumers, as solar energy generation would cover a part of their consumption profile. Moreover, the energy produced and consumed at the site of the solar PV system would not require additional network investments, and would additionally reduce network losses, i.e., it would reduce the amount of energy transmitted in direct proportion to the amount of energy consumed by the power plant on the roof of the building. However, SCH buildings would use the solar energy generated on their roofs ineffectively, with about a 40% self-consumption rate. The share of the generated solar energy that is self-consumed is brought down significantly in the weekends and summer season, as these are periods when the least electricity is consumed, but solar irradiation is the highest here, and leads to an abundance of solar PV energy. Locating an EV charger on the premises of COM or PUB buildings could improve the localized consumption of solar energy. Using solar energy with a simulated EV charging pattern, the local consumption of SCH buildings could be improved by a maximum of 9% for PUB9 (on average, 3.9% for all 10 schools), although for COM buildings, a single EV charging station increases local solar energy usage by less than 1%. The unity ratio of the nominal power of a solar PV system to the maximum power consumed in a building during an hour (on the
x axis) refers to a case in which the rated PV installation’s power is equal to the measured maximum power drawn off by the entire building, and a ratio of 2 would indicate a solar PV system two times as large with the same power consumption. For all the analyzed COM buildings, the potential for solar PV power production was at most 1.25 times greater than the maximum power measured at the building connection. It can be observed that the most optimally suited PV plant would achieve at least 98% on-site consumption. The rooftops of the SCH buildings could host solar PV systems yielding at most about 2 times more than their maximum consumption flow, but would in almost all cases feed 50% or more of the generated energy to the grid.
Furthermore, most of the buildings could potentially meet a significant amount of their energy needs using the solar PV system (
Figure 8).
Figure 8 shows that, in the case of AP3, COM1 and COM5, 7% to 8% of yearly energy consumption could potentially be covered by the establishment of a suitable rooftop solar PV installation. AP buildings with solar PV plants could generate up to 90% of their required energy, while COM buildings could generate about 20% of the energy they consume during the year. For SCH buildings, the solar electricity generated per year typically covers more than half of the total annual consumption (65% on average of the analyzed set); however, due to the very different profiles, most electricity is transferred to the distribution grid and reclaimed later.
Thus, the analysis of the current status of buildings and their categories has provided relevant insights into the role of solar PV systems in satisfying energy consumption, and their significance in relation to supplemented investment into the grid. These are relevant when establishing assumptions, and when assessing the technical and economic potential of rooftop solar PV systems.
5. Assumptions
The assessment of the technical potential of solar PV systems in Lithuanian urban areas was carried out based on the established assumptions, which are summarized in
Table 4.
There are 19,256 buildings in Lithuanian urban areas (
Table 4). AP buildings account for 88%, followed by shops (4%), schools (3%), nurseries and preschools (3%) and other (2%). The analysis of AP buildings in Pilaite district (Vilnius) revealed that 86% of AP buildings are suited to the installation of solar PV systems. After discussions with specialists at leading energy utility companies in the Baltics, it was assumed that 66% of the non-residential buildings maybe be suitable for the installation of solar PV systems. This indicator was selected given that one out of every three roofs of non-residential buildings does not have the infrastructure required to mount and support the additional structures and commonly required tilted framework, mainly due to construction and safety regulations. Preschools and nurseries are occasionally established within larger buildings; thus, they do not have a dedicated rooftop. Therefore, for this subcategory of PUB buildings, a suitability factor of 44% was assigned. AP buildings have the smallest area of rooftop suitable for solar PV installations (279 m
2). Shopping centers have the greatest suitable space (19 430 m
2), followed by HE (3872 m
2), H (2225 m
2), COM (2087 m
2), SCH (1437 m
2) and NP buildings (536 m
2). Thus, the assessed buildings’ rooftops have a total space of 6,496,100 m
2 available for the installation of solar PV systems. The calculated average of suitable roof area per installed unit of power (m
2/kW) is building category-dependent. It is 15.4 m
2/kWp for AP buildings, 18.1 m
2/kWp for COM, and on average 15.4 m
2/kWp for PUB. It was derived after the detail assessment of buildings in Vilnius city and other urban areas. The estimates are presented in
Table 4 and
Table 5.
The assessment of the economic potential of solar PV systems in Lithuanian urban areas was carried out based on the assumptions summarized in
Table 5. The investment (excluding cost of network development) required for building solar PV systems on the rooftops of each building category in Lithuania was calculated based on expert judgements made during 2023 Q1. The experts indicated the following investments per installation capacity: <30 kW—950 EUR/kWp, 30–100 kW—850 EUR/kWp, 100–500 kW—800 EUR/kWp and >500 kW—750 EUR/kWp. These investments were proposed considering that the price of solar PV panels is volatile. In
Figure 9, the distribution of investments is outlined. Based on the expert judgements from 2023 Q1, it was accepted that BOS represents 71%, while the share of PV panels is 29% in Lithuania.
Considering that rooftops vary greatly in terms of angles and orientation, it was not expected that we would be able to predefine the difference in power generation among different types of rooftops. A generalized approach was taken.
7. Discussion
Rooftop solar PV systems in Lithuanian urban areas could be scaled up by 417 MW at a cost of 2.34–5.25 EURct/kWh for the self-consumption of energy, and without an additional load on the grid, as the research results demonstrate. The total volume of solar PV systems in Lithuania was found to be small in comparison to other countries worldwide. In [
32], it was estimated that the global technical potential of PV/T systems could reach up to 47.5 PWh, with the possibility of doubling this by 2060. In [
33], it was estimated that in the EU, rooftop solar PV systems could generate about 680 TWh of electricity per year. Specifically, in Ireland, the technical potential is 2.5–13.0 GW [
45], while in Turkey, 55 GW could be installed after massive investments (USD 20.8 billion) [
49]. The costs of the energy produced by such installations were calculated, and found to be in exceedance of the grid tariff by almost half [
49]. Our paper demonstrates that the cost of producing energy could be lower than the price for the consumer. This is due to differences in investment (EUR/kW), which in the case of Lithuania were several times lower than in Turkey. Both research papers have demonstrated that the largest technical potential is derived from residential buildings (65–70%). In [
32], it was shown that if 75% of suitable roofs were to be covered with PV/T, the buildings’ energy needs would be met. Rooftop solar PV systems could satisfy up to 77% of the electricity consumption in a German county [
34], while satisfying 25% in an EU county [
33] and 39–70% in the US [
36,
41]. The analyses of buildings AP1 and AP8 in Lithuania reveal that 12.1–91.9% of the energy consumption in buildings could be covered by rooftop solar PV systems.
The assessment of the technical potential of solar PV systems has revealed that reaching the strategic RES capacity objectives through the deployment of urban solar PV poses several challenges:
Firstly, about one-third of analyzed buildings may not be suited to baring the additional equipment and the weight of the solar power plant structures. This finding suggests a rather large share in comparison to [
36], who found that in the US, the nationwide percentage of buildings suitable for at least some PV deployment is high: 82% for buildings smaller than 5000 ft
2 and over 99% for buildings larger than that. In [
31], it was accepted that 40% of the total residential roof area is suited to the installation of PV systems. Our findings expand, clarify, and support the conclusion of [
24], stating that the degree of solar PV system suitability in Lithuania is low in the context of other EU countries from the perspective of a set of biophysical and socio-economic factors;
Secondly, the residents of AP buildings could potentially be poorly informed about the possibilities of installing solar PV plants. Without adequate knowledge about the technical specifications of their installation and the benefits that sustainable solar energy provides, they may not be willing to express consent, or may oppose solar PV development. This may be implied by the findings of [
73], who surveyed customers of rooftop solar PV systems and identified consumer issues in adopting PV systems, such as high capital costs, long-term returns on investment and a lack of information, as well as institutional issues such as the limited role of energy companies and the absence of government financing mechanisms. Therefore, based on Swedish experience [
74] showing that information campaigns had a significantly positive effect on PV adoption rates in the country, we could argue that policy-makers in Lithuania could launch similar campaigns to elevate solar PV adoption rates;
Thirdly, the scheme for connecting a solar PV plant on an AP building rooftop is complicated. It is not practical to connect individual apartments to electricity networks, as this attainable only through a connection using a separate line, operated according to the remote prosumer model. Besides hits, the high initial investment cost and the composition of network usage costs related to the conserved excess energy for prosumers can result in long payback periods for the solar power plant [
73].
Thus, the results of the economic potential assessment show that rooftop solar PV systems have potential utility in Lithuanian urban areas, and could contribute to the implementation of national and EU level targets, especially those that are RES-related. The estimated economic potential in terms of LCOE in Lithuania was found at the lower end of the broad ranges established by [
37,
42], but was higher than that estimated for Turkey [
49]. This difference mainly relates to investment costs, which were assessed to be lower in Lithuania given the decreases in the prices of technology in recent years. The finding of economic potential in Lithuanian urban areas is contradicted by the identification of zero economic potential in Bali [
46]. In [
46], it was shown that this country has a technical potential of 22.9 TWh per year, but does not possess the economic potential because the costly solar PV systems cannot compete with conventional generation methods here. Therefore, they concluded that support measures are required to extract economic potential.
In order to reach the strategic RES goals established for the Lithuanian energy sector, the development of solar PV systems must occur through several pathways. The innovative community solar platform or remote PV plants could be expanded further, increasing the utility of solar energy plants, and offering all consumers access to sustainable solar energy. Another pathway that should be followed to effectively achieve the goals set by the National Energy Independence Strategy [
18] is to encourage the installation of RES (solar power plants) on the roofs of city buildings. There is a possibility of efficiently exploiting the urban space and the electricity grid capacity at substations within cities. As research shows, on average, 60% (potentially more for COM and AP buildings) of on-site-generated energy would be consumed locally, and the flow of power to the grid would decrease. This opens the opportunity of adjusting the electricity network tariffs for prosumers with rooftop solar systems, thus enabling financial incentives to be leveraged. At the time of analysis, the conserved excess energy cost was 0.05203 EUR/kWh, which makes up about 35% of the standard electricity price—0.149 EUR/kWh. Thus, the investment in and development of urban rooftop solar plants could be incentivized via subsidies and the abatement of the fraction of network cost out of the electricity price. Prosumer schemes are subsidized by up to 323 EUR/kW, and with equivalent subsidies, the DSO estimates that an urban rooftop solar plant would need 7 years to achieve payback. However, in addition to the subsidy, it is proposed to abate the transmission and distribution network operation costs for prosumers, bringing them a benefit of 80% per kWh and reducing the PV plant payback time to about 5 years. Hence, adequate and favorable financial conditions would aid in accelerating the deployment of solar PV energy in Lithuania, reducing the burden on the environment and establishing a modern, sustainable and equitable energy system.
8. Conclusions
This paper substantiates the significance of rooftop solar PV systems in urban Lithuanian areas in relation to meeting energy and climate policy goals and targets. Specifically, it has revealed how many solar PV systems can be connected to the grid without creating an additional load, or on the other hand, unloading the grid as a result of the self-consumption of solar energy at the time that it is generated. For this purpose, the analyses of selected building categories, and their technical and economic potentials, were undertaken.
A four-step analysis of the features of AP, PUB and COM urban buildings in relation to their suitability for solar PV system installation showed that the identified building categories have different impactions for the scaling-up of the solar PV systems on their rooftops. In detail, it was estimated that the rooftop area per installed PV unit is 14.1–18.3 m2/kW in AP buildings, followed by 18.0–18.6 m2/kW in COM and 6.1–18.3 m2/kW in PUB buildings, and the rooftop suitability factor for solar PV system installation varied in ranges of 31.5–85.4%, 48.9–99.4% and 50.1–88.2%, respectively. Rooftop solar energy is locally self-consumed, and only small amounts of energy are fed to the grid.
This paper proves that there is a reasonable way to increase solar PV deployment potential, by considering installations with significant self-consumption effects. By accessing open LiDAR data and, upon request, the available consumption profiles, detailed solar PV capacities can be estimated. In seeking to assess the potential of solar PV systems on rooftops in urban areas, a combination of methods focusing on their technical and economic aspects were proposed. It was found that the LCOE and estimations of the indicator of technical potential are sufficient and accurate methods for assessing the economic and technical potentials of rooftop solar PV systems in urban areas. The superiority of the proposed methods lies in their simplicity and adaptability to the outcomes of comprehensive analyses of building categories.
The analysis of technical potential revealed that the AP, COM and PUB buildings could achieve 417 MW of potential capacity on their available rooftop areas. By far the largest potential is represented by AP buildings, reaching 272 MW of installed capacity. To determine whether this potential would be fully deployed requires analyses of energy system integration, the economic environment and the business framework, which this study has not covered explicitly.
The analysis of economic potential showed that EUR 332.7 million should be invested to extract technical potential. Subject to financing, the energy costs of solar PV systems could be 2.34–5.25 EURct/kWh, and remain below the electricity market and retail prices, which were 23 EURct/kWh and 24 EURct/kWh (with governmental support) in Lithuania in 2022.
Moreover, the conducted research was limited to topological rooftop area analyses, whereby the area was modeled with planar segments parallel to the ground, while slanted and oblique measurements could produce results with greater accuracy. Furthermore, the study was constrained to modern AP buildings, thus the suitability of older AP buildings or those under renovation has not been characterized precisely. In acknowledging these shortcomings, directions for further studies can be outlined, and a more thorough analysis of the solar potential of older AP blocks may be proposed, for a broader set of urban building categories, as well as the assessment of rooftop structural integrity related to potential PV installation. Nevertheless, the evaluation of the suitable area resource defines the scope for future RES deployment. These findings can guide energy utility companies and other energy sector actors in Lithuania in formulating informed development strategies and sustainable energy policies in the upcoming years.


 ,
, 


