Article

Effect of Reactive and Non-Reactive Additive Treatment on the Recovery of Phosphorus from Biogas Digestate

1
State Institute of Agricultural Engineering and Bioenergy, University of Hohenheim, 70599 Stuttgart, Germany
2
Key Laboratory of Clean Utilization Technology for Renewable Energy, Ministry of Agriculture, Department of Agricultural Engineering, China Agricultural University, Beijing 100083, China
3
Institute of Agricultural Engineering, Tropics and Subtropics Group, University of Hohenheim, 70599 Stuttgart, Germany
*
Authors to whom correspondence should be addressed.
Energies 2023, 16(14), 5464; https://doi.org/10.3390/en16145464
Submission received: 15 June 2023 / Revised: 4 July 2023 / Accepted: 17 July 2023 / Published: 18 July 2023

Abstract

:
The annual phosphate (PO43−) utilization has increased, leading to a depletion of existing sources of phosphorus (P). To overcome this, digestate as a source to recover P is being investigated. Due to the abundance of nutrients, the digestate from an agricultural biogas plant is used as fertilizer for crops. The separation of solids and liquids from the digestate by a screw press is the simplest form of concentrating, therefore, recovering PO43−. This is the most commonly employed method in existing biogas plants. However, the separation is not very efficient as only 20–30% of P is recovered in the solid phase. The goal of this study is to increase the separation efficiency and recover more P into the solid phase, in order to improve the transportability. For this, separation trials at a laboratory scale were performed for five experimental groups, with biochar and straw flour as non-reactive additives and kieserite as a reactive additive. In addition, untreated digestate was studied as a control. The control and the treatment with biochar and straw flour were carried out at 25 °C, while the treatment with kieserite was performed at 25 °C and 50 °C. The separation trails were performed at treatment times of 0 h, 1 h, 2 h, 8 h, and 20 h. The results showed that the treatment with additives had a beneficial effect on the recovery of P. It was noted that kieserite treatment at 25 °C and 50 °C bound about 61% of the total P present in the digestate to the solid phase. A sequential extraction was performed to study the effect of additives on the recovery of different P species. The results concluded that, compared to biochar and straw flour, kieserite was efficient in recovering the non-labile fractions (NaOH-P and HCl-P) of P, which act as slow-release fertilizers. This study shows that the use of additives, especially kieserite, has a positive influence on recovering P from digestate, and further research to optimize the recovery process would be beneficial.

1. Introduction

In recent years, it was noted that the current P flow as well as the use of mineral P fertilizer has become a one-way flow, leading to a decrease in the mineral P reserves [1]. The distribution of mineral P reserves is not uniform in the world. Nearly 73% of P rock reserves are found in Morocco and Egypt [2]. This uneven distribution makes the world dependent on these nations for the supply of fertilizers. In the current economic and political situation, countries are looking for self-sufficient options for the supply of P fertilizers. Therefore, in this study, the focus was on efficiently recovering P from biogas digestate.
Anaerobic digestion is a reliable technology used for the treatment of biowastes [3,4]. During anaerobic digestion, the organic matter is converted into methane. Simultaneously, nutrients such as nitrogen (N), phosphorus (P), potassium (K), and magnesium (Mg) are released into the solution, converted, and recombined during digestion [5,6]. Due to the presence of these nutrients, digestate is a valuable fertilizer and is usually used directly on agricultural lands surrounding biogas plants [7,8]. Although rich in nutrients, 80–90% of the digestate consists of water [9,10]. This makes its transport over long distances expensive and difficult, which can lead to nutrient accumulation on agricultural lands in the plant vicinity [11,12,13,14].
To overcome the problem of transportation costs, technologies such as chemical precipitation, ammonia stripping, membrane separations, and so on are applied to the digestate to recover nutrients. These recovery methods increase the nutrient concentration and enable targeted spreading on agricultural lands [9,15]. Existing biogas plants are opting for a solid–liquid separation approach using a screw press to economically manage the distribution of nutrients in the digestate. The solid phase separated by a screw press has a dry matter content in the range of 30% to 35% [9,16]. An investigation on the typical separation efficiency of screw presses on different components showed that only 20–30% of total P is found in the solid phase, while the remaining P (80–70%) is still present in the liquid phase of the digestate [10,17,18].
The focus of this study is to increase the shift of total P to the solid phase with the use of additives. The treatment of digestate with the additives makes it possible to efficiently and economically transport the nutrient-rich solid phase to the nutrient-deficient fields, while the liquid phase can be spread around the plant without oversaturating the soil. In this manuscript, different additives, namely, kieserite, biochar, and straw flour, were used to shift more P into the separated solid phase of the digestate. These additives were chosen for the separation trails as they are usually available on farms, making this technique economical.
Kieserite is a magnesium sulfate monohydrate salt (MgSO4·H2O), which is used as a fertilizer in agriculture. It is a water-soluble fertilizer and acts as a source of both magnesium (Mg) and sulfur (S) [19,20]. Biochar is a carbon material produced by the pyrolysis of biomass at temperatures higher than 400 °C under anaerobic conditions [21,22]. Application of biochar to soils enhances its quality by retaining nutrients, soil pH, microbial activity, and moisture [23,24]. In addition, materials adsorbed on biochar are directly available for plant uptake [25,26]. Straw flour produced by the grinding of straw is used as mulch in the in the fields to boost soil fertility and promote crop productivity [27]. It is also commonly used as a bedding material in animal rearing [28]. The materials chosen as additives in this study are often directly applied on the fields as fertilizers. Therefore, utilization of these materials to shift P to the solid phase increases the fertilizer value of the separated solid phase.
The three additives are classified into reactive (kieserite) and non-reactive additives (biochar and straw flour) based on their activity in partitioning of P between the liquid and the solid phase, as determined after solid–liquid separation. Since kieserite is an Mg2+ salt, it chemically reacts with the P and N in the digestate to form magnesium ammonium phosphate (MAP). MAP is a crystalline precipitate composed of Mg2+, PO43−, and NH4+ in an equimolar ratio (1:1:1). The precipitation of MAP occurs according to the equation given below [29,30,31]:
M g 2 + + N H 4 + + H P O 4 2 + 6 H 2 O M g N H 4 P O 4 · 6 H 2 O
The treatments with non-reactive additives (biochar and straw flour) were carried out to increase P binding to solid phase by adsorption and to achieve better separation, respectively. The pore size and sorption properties of biochar play a major role in the adsorption of P [32,33]. The adsorption capacities of biochar are dependent on the raw materials used during pyrolysis [34]. The treatment with straw flour was carried out to improve the dewatering performance during solid–liquid separation.
According to the literature, the solubility of MAP increases until it reaches a temperature of 40 °C, and then it decreases [35]. In another study regarding the solubility of MgSO4, solubility increases until a temperature of 80 °C and then shows a decrease [36]. However, the literature does not provide information on a suitable reaction temperature for MAP formation. In MAP formation, most of the research has discussed the influence of pH and the amount of Mg2+ salt added to the digestate, but not the treatment time. In most studies, the digestate was maintained at a pH of 8.0–9.0 and the treatment time was 5 min [37,38]. In the studies involving biochar as an additive, variations of biochar, such as the effect of biochar produced from pyrolyzing different biomass sources, biochar impregnated with Mg2+ and Ca2+ ions, and the pore size on nutrient recovery, were tested [5,32,34].
Henceforth, the term “P recovery” used in this paper refers to the shift of P from unseparated digestate to the solid phase after solid–liquid separation. The separation trials in this study were performed at the laboratory scale. In this study, two different temperatures (25 °C and 50 °C) were tested to study the efficiency of P recovery with kieserite treatment. In the case of biochar and straw flour, the treatment was carried out at 25 °C. Since kieserite is a MgSO4 salt, the investigation of the temperature effect on P recovery is of interest. As biochar and straw flour are non-reactive additives, they were only tested at 25 °C. Moreover, the temperatures were chosen based on the mesophilic (30 °C–40 °C) and thermophilic (50 °C–60 °C) temperatures of anaerobic digestion. In addition to temperature, the effect of the treatment time on P recovery with all the additives was also investigated. In this research, different P species in the separated digestate phases were analyzed using a sequential chemical extraction based on a method developed by Hedley et al. (1982) [39,40]. This method was initially developed to characterize P in soil samples. Later, it was adapted several times by various researchers for use on different substrates [41,42]. The sequential chemical extraction method used in this research was developed by Dinkler et al. (2021) to characterize P species in the digestate [40].
To summarize, this manuscript focuses on examining the effect of reactive and non-reactive additive treatments on P recovery into solid phase. In addition, the influence of the temperature and treatment time on recovery of different P species was also studied. The goal of the experiments performed here was to increase the shift of P into the solid phase using existing separation technologies and additives.

2. Materials and Methods

2.1. Substrate

The digestate was collected from the digestate storage at the biogas research plant Unterer Lindenhof of the University of Hohenheim. The biogas plant comprises two digesters that were fed with approximately 14.1% of solid manure (mixture of solid cow and horse manure), 46.8% of liquid manure (mixture of liquid manure from cow and pig), and 39.1% of energy crops (mixture of corn silage, grass silage, grain, and sugar beet). The first digester had a working temperature of 42 °C with a hydraulic retention time of 75 days, and the second reactor had a temperature of 55 °C with a hydraulic retention time of 35 days. After digestion, the digestate from both digesters was pumped into a storage tank, where it was stored at ambient temperature for future applications. By the time of collection, the digestate had already been stored in the storage tank for 180 days. The collected digestate was stored at 5 ± 1 °C for further use in experiments. Table 1 shows the main characteristics of the stored digestate.

2.2. Additives

Kieserite, i.e., hydrous magnesium sulfate (MgSO4∙H2O) (ESTA®Kieserit gran., K + S Minerals and Agriculture GmbH, Kassel, Germany), was used in the digestate treatment. It is a water-soluble, granular mineral fertilizer, with a grain size ranging from 2.0 to 5.0 mm, comprising 75% MgSO4, 18% crystal H2O, and the remaining 7% containing other sulfates and chlorides.
Biochar (CarboVit, EM-Technologie Zentrum-Süd GmbH, Haldenwang, Germany) produced from the pyrolysis of beechwood was used in the experiments. For a defined particle size that would be large enough to be held back during separation, it was sieved to a particle size of 1.0–2.0 mm using a vertical vibration sieve (Fritsch® Analysette 3 spartan pulverisette 0, Fritsch GmbH, Idar-Oberstein, Germany).
Straw was added in the form of straw flour (Straw-flour, Cordes-Grasberg, Grasberg, Germany) with a particle size of less than 0.54 mm. The straw flour used in this study was produced by the grinding, sieving, and dedusting of rye straw.

2.2.1. Reactor

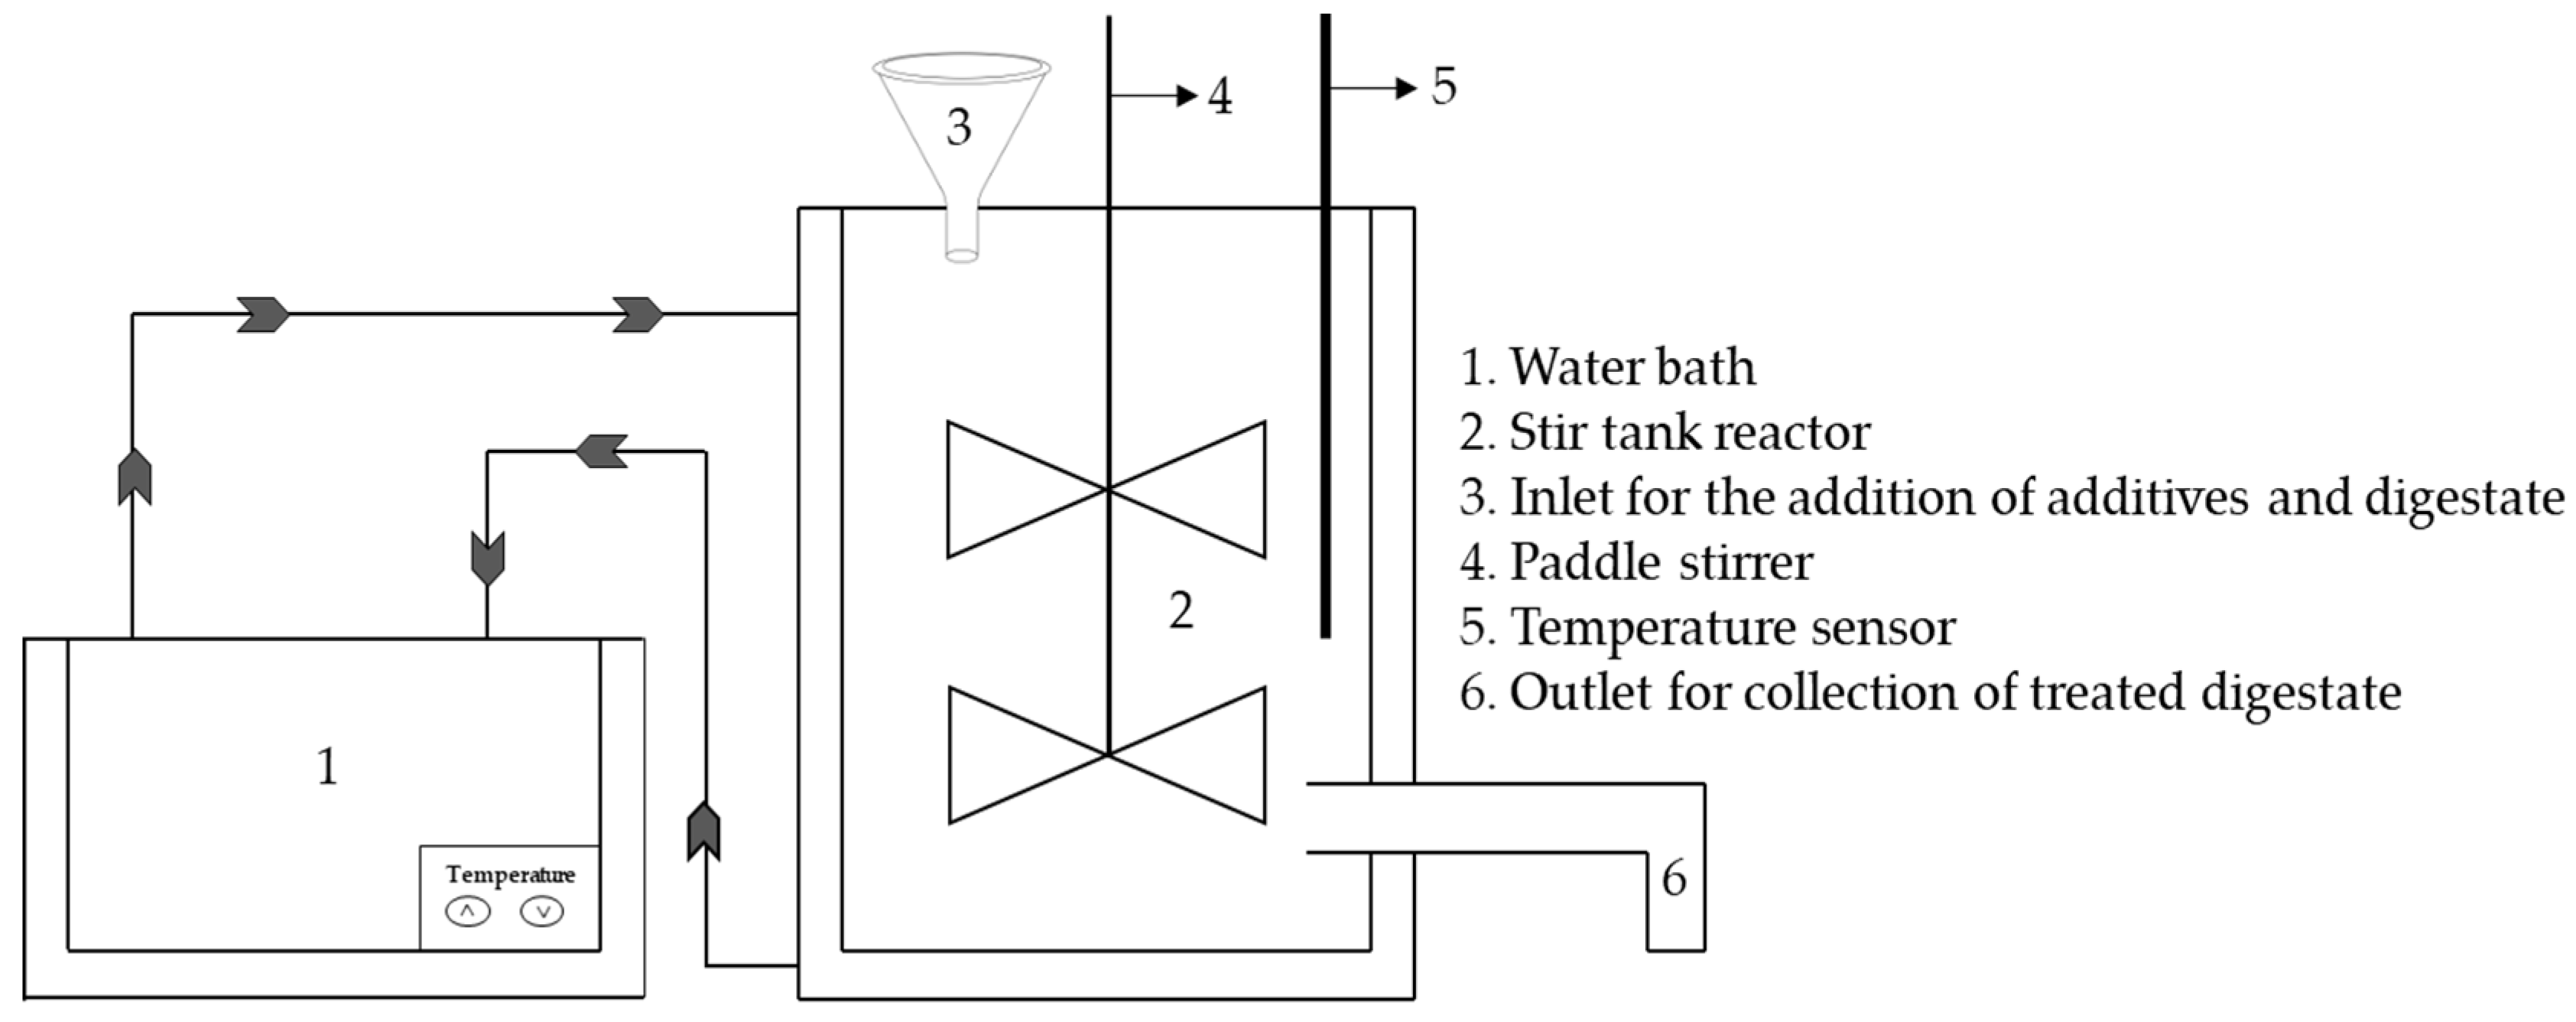
The experiments in this study were performed at the laboratory scale using a jacketed reactor with a working volume of 17 L, which was used as the reaction vessel. The reactor was connected to a water bath with a recirculation pump (Julabo 26, Julabo GmbH, Seelbach, Germany) to maintain the temperature of the reactor at 25 °C or 50 °C, depending on the treatment. First, the reactor was filled with the digestate and then heated until it reached the set temperature. Subsequently, additives were added to the reactor. The amount of additive added was based on different factors. For kieserite, a 1:1 stoichiometric ratio of Mg:P was adjusted. In the case of biochar and straw flour, the amount of additive was equivalent to 1%FM of the digestate. After the required treatment time, the digestate was collected (approximately 1.20–1.50 kg) from the reactor through the provided outlet. The setup and the scheme of the stir tank reactor are shown in Figure 1 and Figure 2, respectively.

2.2.2. Mechanical Solid–Liquid Separation

Solid–liquid separation was carried out using a hydraulic tincture press (DPH 2/5, Doninger Maschinenbau & CNC-Technik, Acher, Germany). The press has a combination of a spindle and a hydraulic system to compress the sample, thereby forcing liquid through a sieve, which holds back the solid particles. To achieve a better separation efficiency, the sieve inside the tincture press was accompanied with a press filter bag. The pressure used for the separation was set to 5 MPa and was held for 120 s.

2.3. Experimental Setup

The treatments comprised addition of the additives (kieserite, biochar, and straw flour) to the digestate for different treatment times (0 h, 1 h, 2 h, 8 h, and 20 h) at set temperatures (25 °C and 50 °C), followed by solid–liquid separation. Since kieserite is a reactive additive, the treatment with kieserite was carried out at 25 °C and 50 °C, while the treatment with biochar and straw was performed only at 25 °C. A control treatment was also carried out at 25 °C. All the treatments were carried out in triplicate. The experimental setup of the digestate treatment performed in this study is provided in Table 2.
Hereafter, the kieserite treatments at 25 °C and 50 °C are referred to as KIS 25 and KIS 50, respectively. The treatments with biochar and straw flour are indicated as BIC 25 and STF 25, respectively. The amount of total phosphorus in the digestate is referred to as Ptot.

2.4. Analytical Methods

The dry matter content of the separated digestate in relation to fresh matter was determined by differential weighing before and after drying the samples at 105 °C for 24 h, according to standard methods [43]. Elemental analysis was performed on separated solid and liquid phases using the ICP-OES elemental analyzer (Agilent 5110 ICP-OES Agilent, Santa Clara, CA, USA) to detect the concentrations of Al, Ca, Fe, K, Mg, and P.
The total P bound to the solid phase of the digestate after solid–liquid separation is presented as the percentage of P (%PSP). In this paper, the term “P recovery” refers to the total P bound to the solid phase of the digestate after solid–liquid separation and was calculated as:
% P S P = P   i n   s o l i d   p h a s e   o f   d i g e s t a t e P   i n   u n s e p a r a t e d   d i g e s t a t e · 100

2.5. Sequential Chemical Extraction

The extraction of different P species in the separated solid and liquid phases was performed according to the adapted Hedley fractionation developed by Dinkler et al. (2021) [40]. The sequential extraction resulted in four different extractant fractions: H2O-P, NaHCO3-P, NaOH-P, and HCl-P. The H2O-P and NaHCO3-P fractions together are considered labile fractions of P, i.e., P readily available for plants. The H2O-P and NaHCO3-P fractions account for the amount of water-soluble P and the mineralizable P present in the digestate [39,44,45]. These fractions are easily desorbed from the surfaces of particles. For this reason, these fractions are exchangeable within each other [6,45]. NaOH-P and HCl-P fractions are non-labile fractions of P and are considered slow-release fertilizers. The non-labile fractions represent the P bound to metal ions such as Mg, Ca, Fe, and Al [39,44,45]. These fractions are decomposed and metabolized by the microorganisms present in the plant root and are available to plants based on their need [45]. The analysis of the extracts was carried out using a photometer (DR 3900, Hach Lange GmbH, Düsseldorf, Germany) at 709 nm.

2.6. Statistical Analysis

Data were processed and visualized using Microsoft Excel 2021 and OriginPro 2022b. The statistical analysis was carried out using the post hoc Tukey’s HSD test, as described in the literature [46,47].

3. Results and Discussion

3.1. Total Phosphorus Recovery

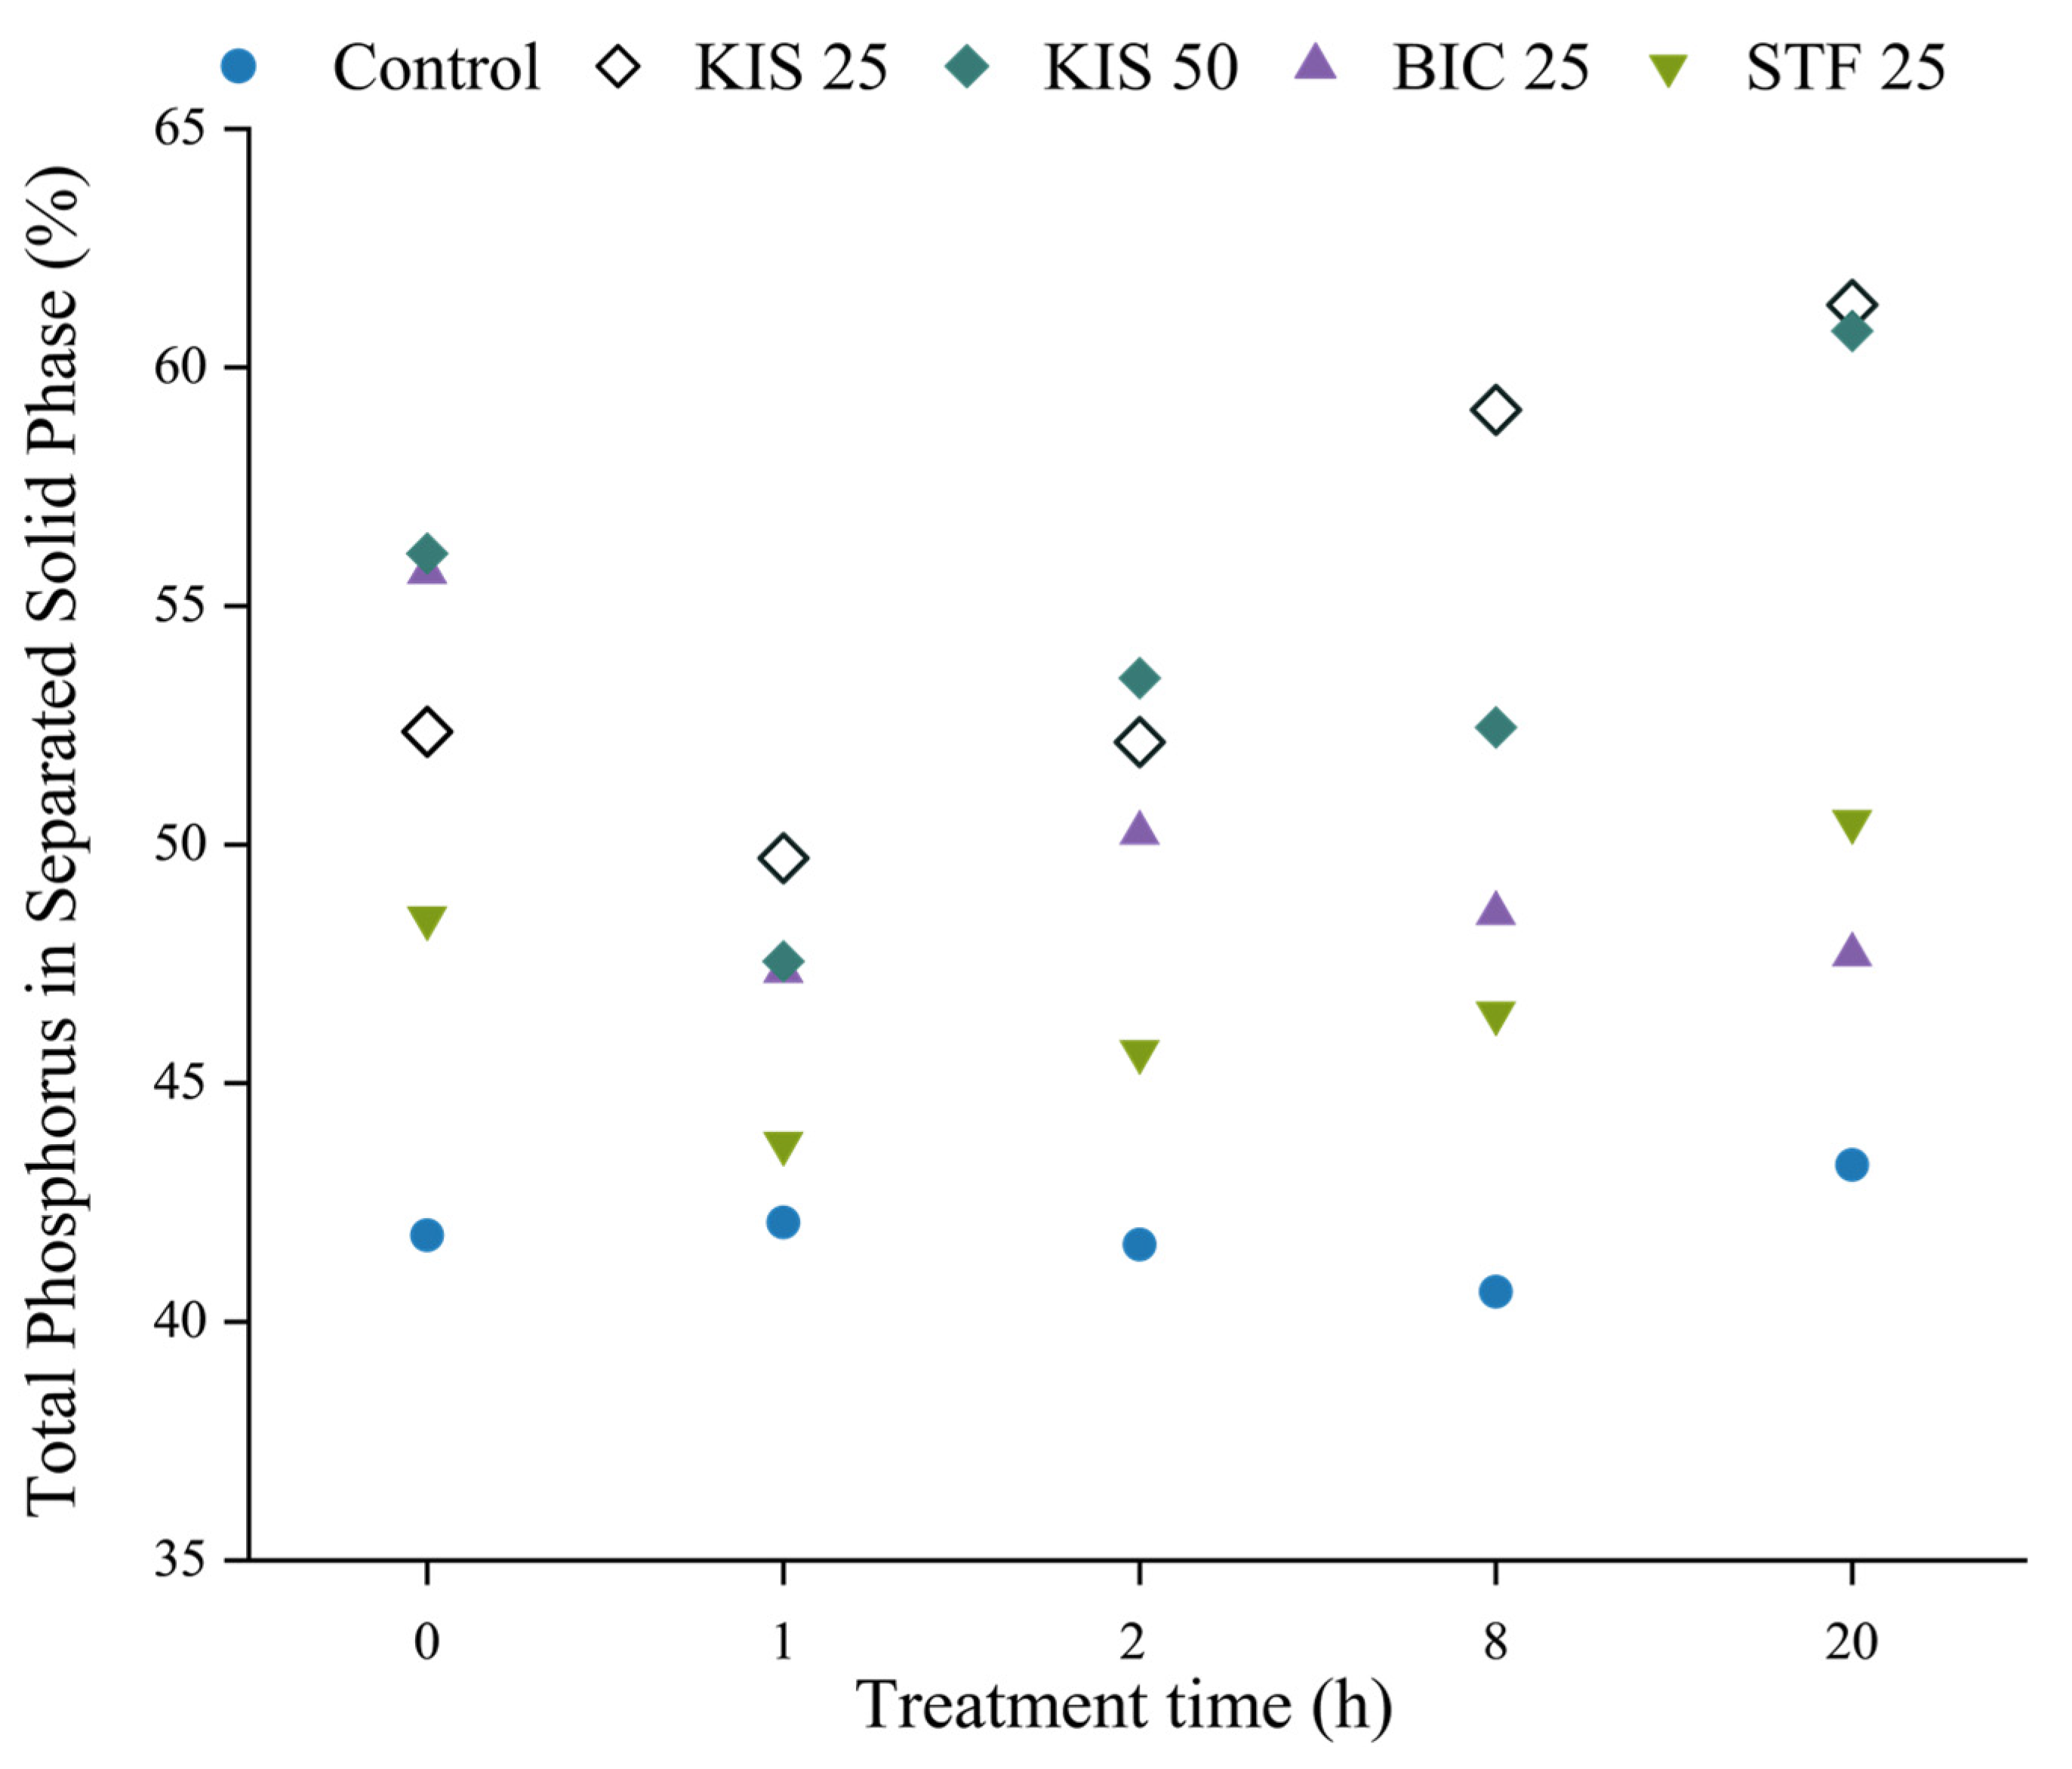
The term “P recovery” used in this section refers to the amount of Ptot shifted into the solid phase after solid–liquid separation. Figure 3 shows the percentage of P in the separated solid phase (%PSP) after the additive treatment.
In Figure 3, the %PSP in the control was in the range of 41.8% to 43.3%. Overall, the additive treatment, both reactive and non-reactive, had a positive effect on P binding to the solid phase. KIS 25 and KIS 50 treatments were more effective in P recovery compared to the treatment with non-reactive additives. After 20 h, KIS 25 and KIS 50 indicated nearly a 40.9% increase in %PSP compared to the control. Treatments with BIC 25 and STF 25 after 20 h showed a 10.2% and 16.6% increase in the %PSP compared to the control, respectively.
In Figure 3, KIS 25 and KIS 50 treatments had an 17.1% and 8.3% increase in the %PSP, respectively, after a 20 h treatment time, compared to 0 h. After a 2 h treatment time, the %PSP of KIS 50 and KIS 25 was 53.5% and 52.2%, respectively. After 8 h, the %PSP for KIS 50 was similar to that at the 2 h treatment time, whereas for KIS 25, a steady increase in %PSP was observed. However, after 20 h, both the KIS 25 and KIS 50 treatments had similar amounts of %PSP. As mentioned before, kieserite is a MgSO4 salt, which increases the Mg2+ concentration in the digestate, promoting the formation of MAP [29,31]. According to a study conducted by Bhuyian et al. (2007), the solubility of MAP at 50 °C was higher compared to that at 25 °C [35], which means that at 50 °C, the MAP was more likely to move into the liquid phase of the digestate than it was at 25 °C. This is a likely explanation for the 11.25% decrease in %PSP at 8 h after the KIS 50 treatment compared to KIS 25. It should, however, be noted that even though there was increased solubility at 50 °C, increasing the treatment time had a positive effect on the recovery of P. This indicates that temperature is a less significant influencing factor in P recovery with kieserite, in comparison to treatment time.
In Figure 3, with biochar treatment, initially (0 h), the %PSP was 55.7%. After 20 h, it decreased to 47.7%. The BIC 25 treatment showed that the %PSP decreased by 14.8% after the 20 h treatment, compared to 0 h, whereas the STF 25 treatment showed a 4.2% increase in the %PSP after 20 h, compared to 0 h.
Since kieserite itself is a fertilizer, the treatment of unseparated digestate with it helps in increasing the fertilizer value of the separated solid phase. The formation of MAP using kieserite, apart from just recovering P into the solid phase, also caused the sulphate ions (SO42−) to become freely available in the digestate, thus adding to the fertilizer value of the digestate. It is to be also noted that such an availability of SO42− ions is only possible when we used kieserite and not any other Mg salts. Both biochar and straw flour are traditionally used for improving solid separation from biogas digestate. These materials provide a surface for the adsorption of solids. Usually, kieserite and straw flour are available on the farms, making the P recovery process economical. The increased shift of P to the solid phase due to the additive treatment enabled the spreading of the P-rich solid digestate to distant fields.
Compared to all the treatments performed, KIS 25 has the potential to be the most economic option in terms of material availability and efficiency in P recovery. The STF 25 treatment did not significantly increase P recovery compared to kieserite treatment. However, unlike the treatment with BIC 25, it did not increase the share of Ptot in liquid phase.

3.2. Effect of Additve Treatment on P Fractionation and Distribution

For gaining further understanding of the effect of additives on the P shift in the digestate, various P species present in the additive-treated digestate were analyzed using sequential extraction [40]. The sequential extraction used for P characterization resulted in four different extractant fractions (H2O-P, NaHCO3-P, NaOH-P, and HCl-P).

3.2.1. Comparison of P Extractant Fractions after Additive Treatment

The distributions of H2O-P, NaHCO3-P, NaOH-P, and HCl-P fractions in the separated solid phase, initially (0 h) and at the end (20 h) of the additive treatment, are presented in Figure 4. It should be noted that the depictions in Figure 4 correspond to the proportion of each fraction in the %PSP and are not indicative of the absolute values of %PSP in each fraction. Therefore, a relative drop in the share of any one fraction does not necessarily indicate a drop in the amount of P recovered into the solid phase.
As mentioned previously, H2O-P and NaHCO3-P fractions are labile fractions, whereas NaOH-P and HCl-P are non-labile in nature. Therefore, H2O-P and NaHCO3-P fractions are more reactive compared to NaOH-P and HCl-P fractions.
In the control, the NaOH-P and HCl-P fractions at 0 h (Figure 4a) and 20 h (Figure 4b) were similar. The same observation can also be made for BIC 25 and STF 25. This indicates that in the control as well as in the non-reactive experiment groups, the non-labile fractions of P did not change with the treatment time. This can be attributed to the absence of any chemical process in these cases, which can facilitate a shift from labile to non-labile fractions. As the biochar used in this study was not impregnated with any mineral ions, such as Mg2+ or Ca2+, it did not lead to any adsorption of NaOH-P or HCl-P fractions on its surface. However, since H2O can still be adsorbed by the biochar, in BIC 25, the fraction of H2O-P increased at 20 h compared to 0 h of treatment.
The interaction between the Mg2+ ions in kieserite with P in digestate resulted in the formation of MAP [29,30,31]. According to Bhuyian et al. (2007) and Krumgalz (2018), MAP and MgSO4 have higher solubility at 50 °C [35,36]. In the KIS 25 and KIS 50 treatments, the NaHCO3-P fraction notably changed from 0 h (Figure 4a) to 20 h (Figure 4b). Due to the increased solubility of MAP at 50 °C, the KIS 50 treatment led to a drop in the H2O-P fraction, and as a consequence, an increase in the NaHCO3-P fraction. Whereas, at 25 °C, the opposite trend was observed. As mentioned above, at 25 °C, the solubility of MgSO4 was lower compared to 50 °C, which may cause the freely available Mg2+ ions to move into the liquid phase at 50 °C. Since the Mg2+ ions which bind to the PO43− ions manifest in the non-labile fractions, this could subsequently lead to a decrease in the share of non-labile fractions in the KIS 50 experiment group. This can be clearly seen in the case of the decrease in the NaOH-P fraction for the KIS 50 treatment at 20 h, compared to the 0 h treatment time. Therefore, it should be appreciated that KIS 25 shifted P into the non-labile fractions more effectively than KIS 50. Since non-labile fractions act as slow-release fertilizers, KIS 25 is, in comparison, a better alternative.

3.2.2. Effect of Treatment Time on the Distribution of P Extractant Fractions

In this section, the effects of the treatment time on the distribution of the P extractant fractions produced from the sequential extraction analysis are discussed. Since the reactive additive treatment resulted in a better shift of total P to the solid phase, the findings for the reactive additives and the control are discussed for all the extractant fractions. In the case of the non-reactive additives, the P shift in the solid phase was mainly observed in the labile fractions (H2O-P and NaHCO3-P). Therefore, in this section, for the BIC 25 and STF 25 treatments, only the labile fractions are discussed. The results from the non-labile fraction of BIC 25 and STF 25 are provided in the Supplementary Materials.
a.
Control
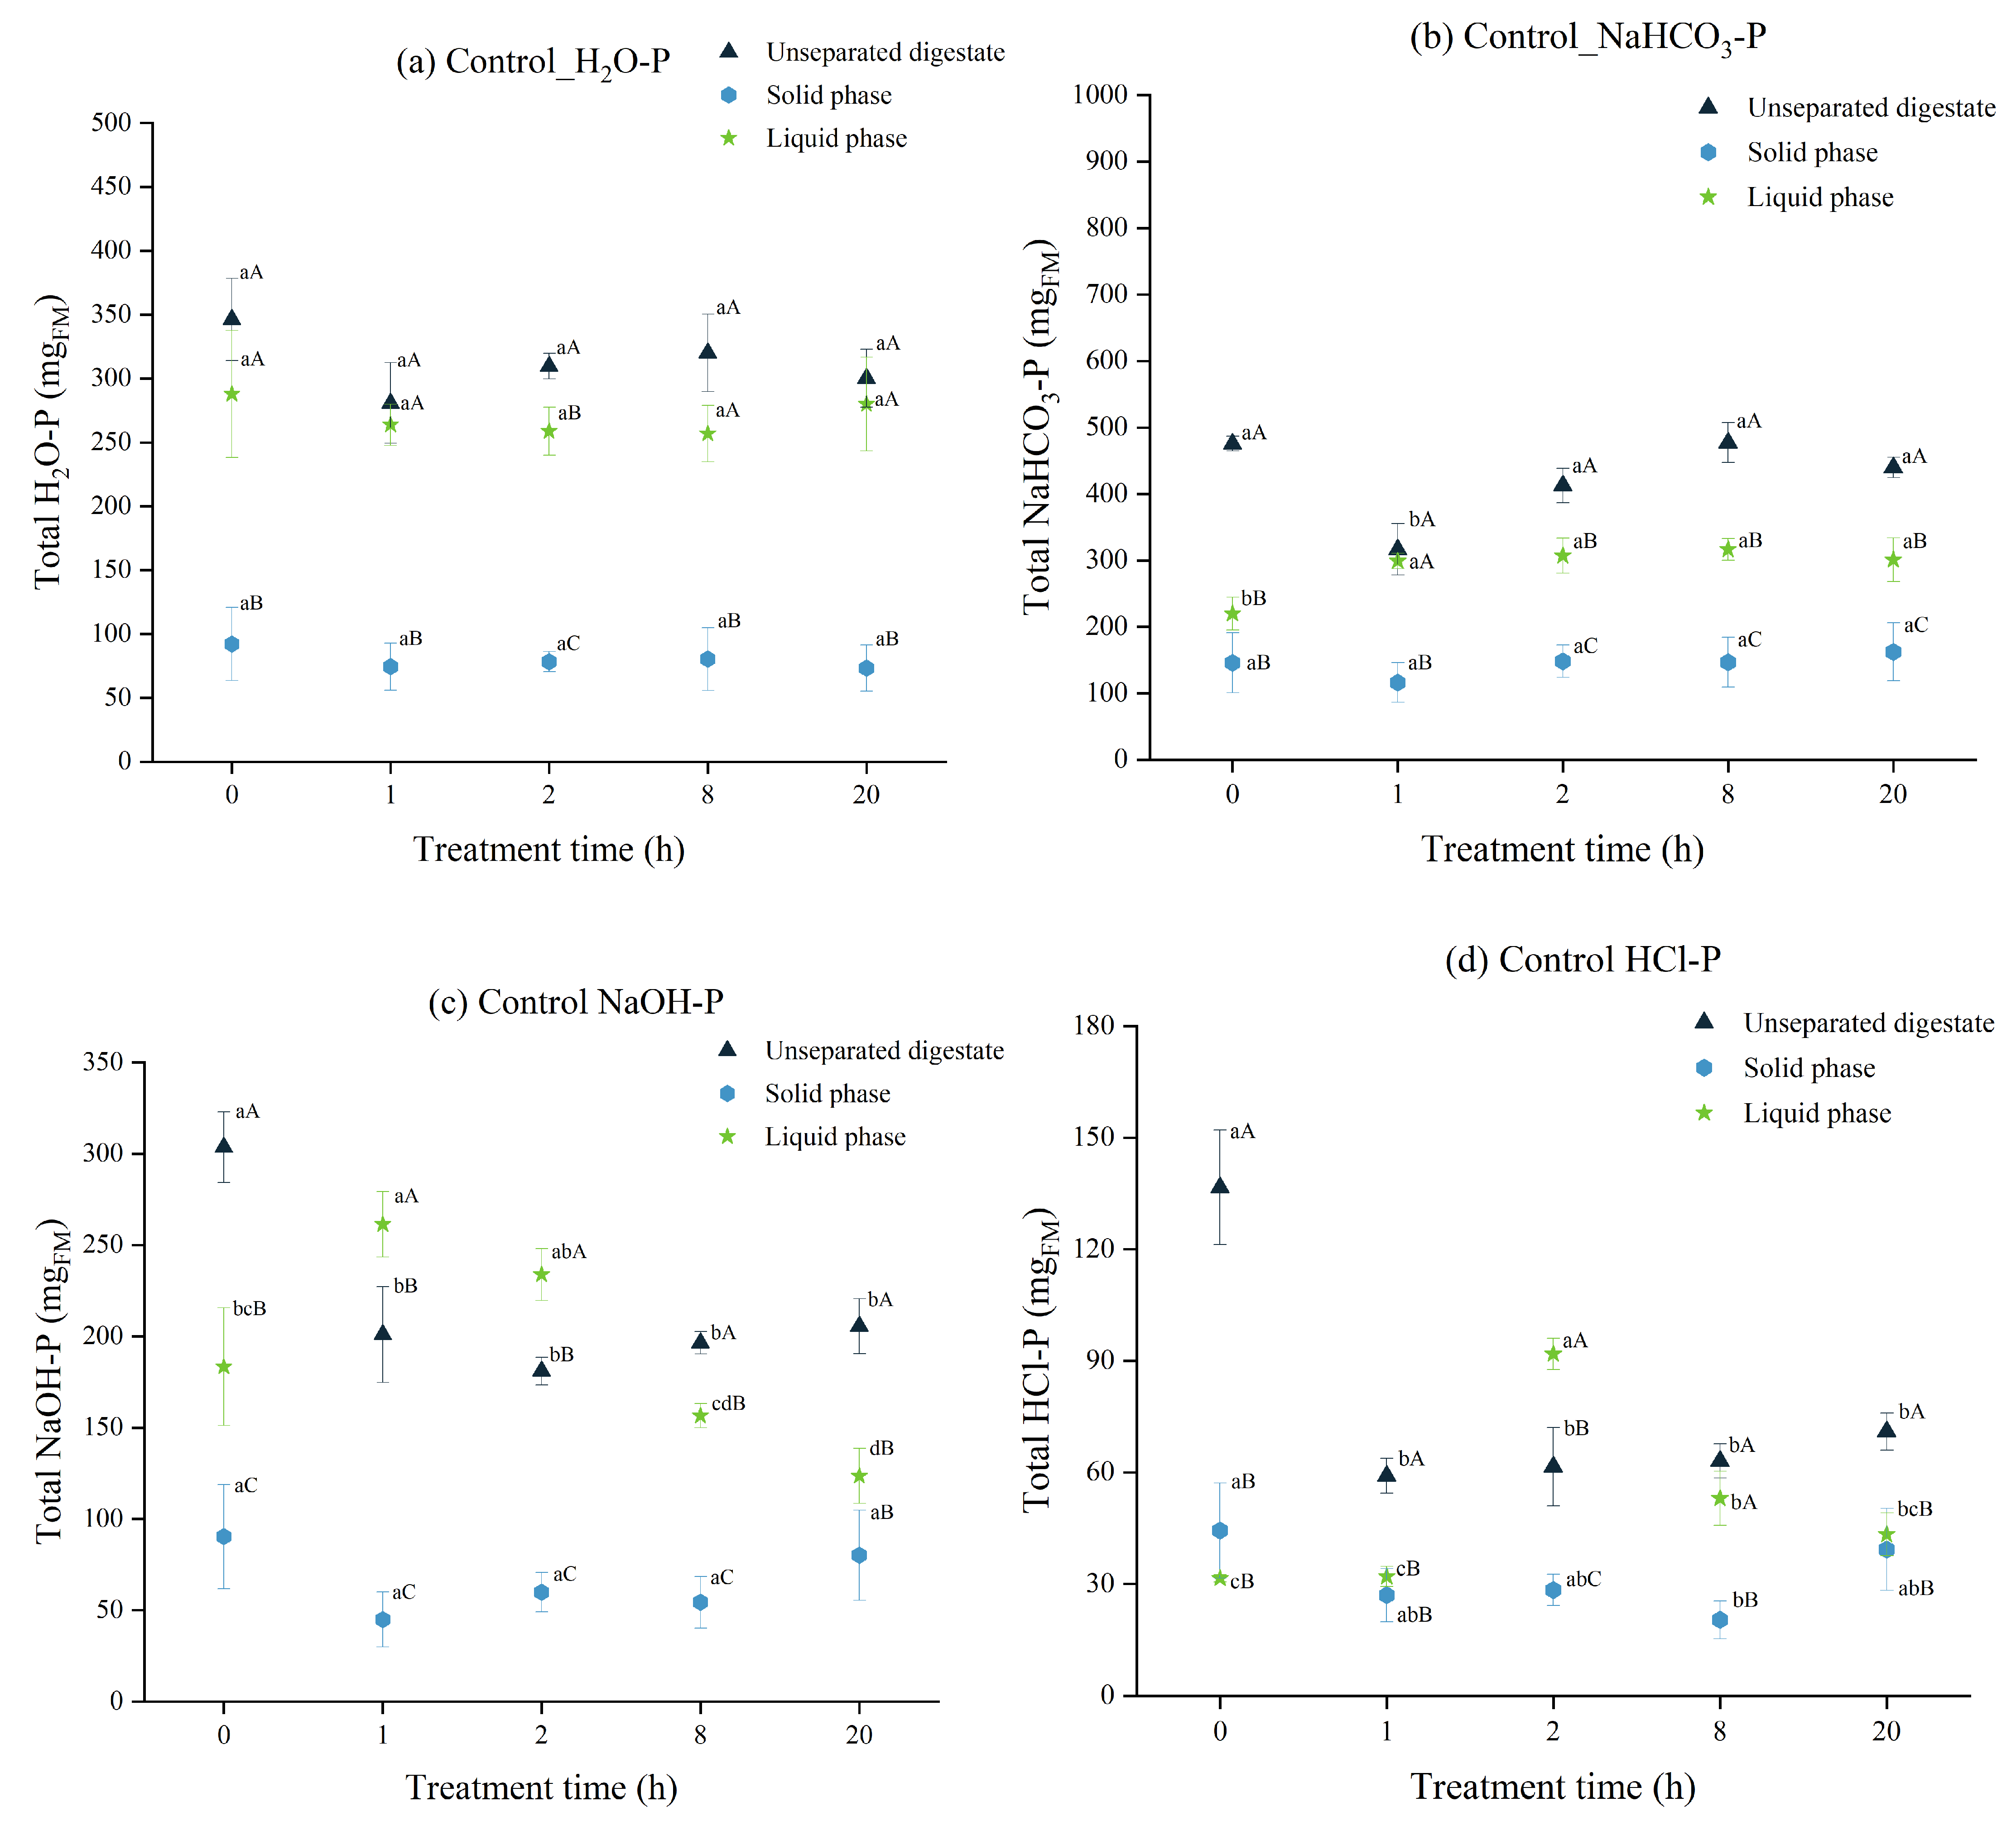
The distributions of H2O-P, NaHCO3-P, NaOH-P, and HCl-P fractions in the unseparated digestate, solid, and liquid phases of the control are presented in Figure 5.
In Figure 5a, the changes in H2O-P content are shown. At different treatment times, a similar H2O-P content was observed in the solid and liquid phases. The H2O-P fraction represents the water-soluble, and thus, the readily reactive fraction of P. Therefore, the content of H2O-P in the liquid phase and the unseparated digestate was higher compared to that in the solid phase. In Figure 5b, it can be seen that the NaHCO3-P fraction had a slight increase of the P content in the liquid phase between 0 h and 1 h, which corresponded to a slight descrease of the P content in the liquid phase for the H2O-P fraction. As mentioned in Section 3.2.1, there was a shift of the P content within these two labile fractions.
As seen in Figure 5c, the NaOH-P content in the solid phase was not significantly different at the different treatment times tested in this study. This was also observed for HCl-P (Figure 5d). Whereas, in the liquid phase, unlike in H2O-P and NaHCO3-P, variances were observed in the NaOH-P and HCl-P extractions. Since the digestate was not treated with any additives in the control, the mean P content in the separated solid phases of all fractions except NaOH-P did not show considerable changes over the treatment times tested.
b.
Kieserite treatment at 25 °C
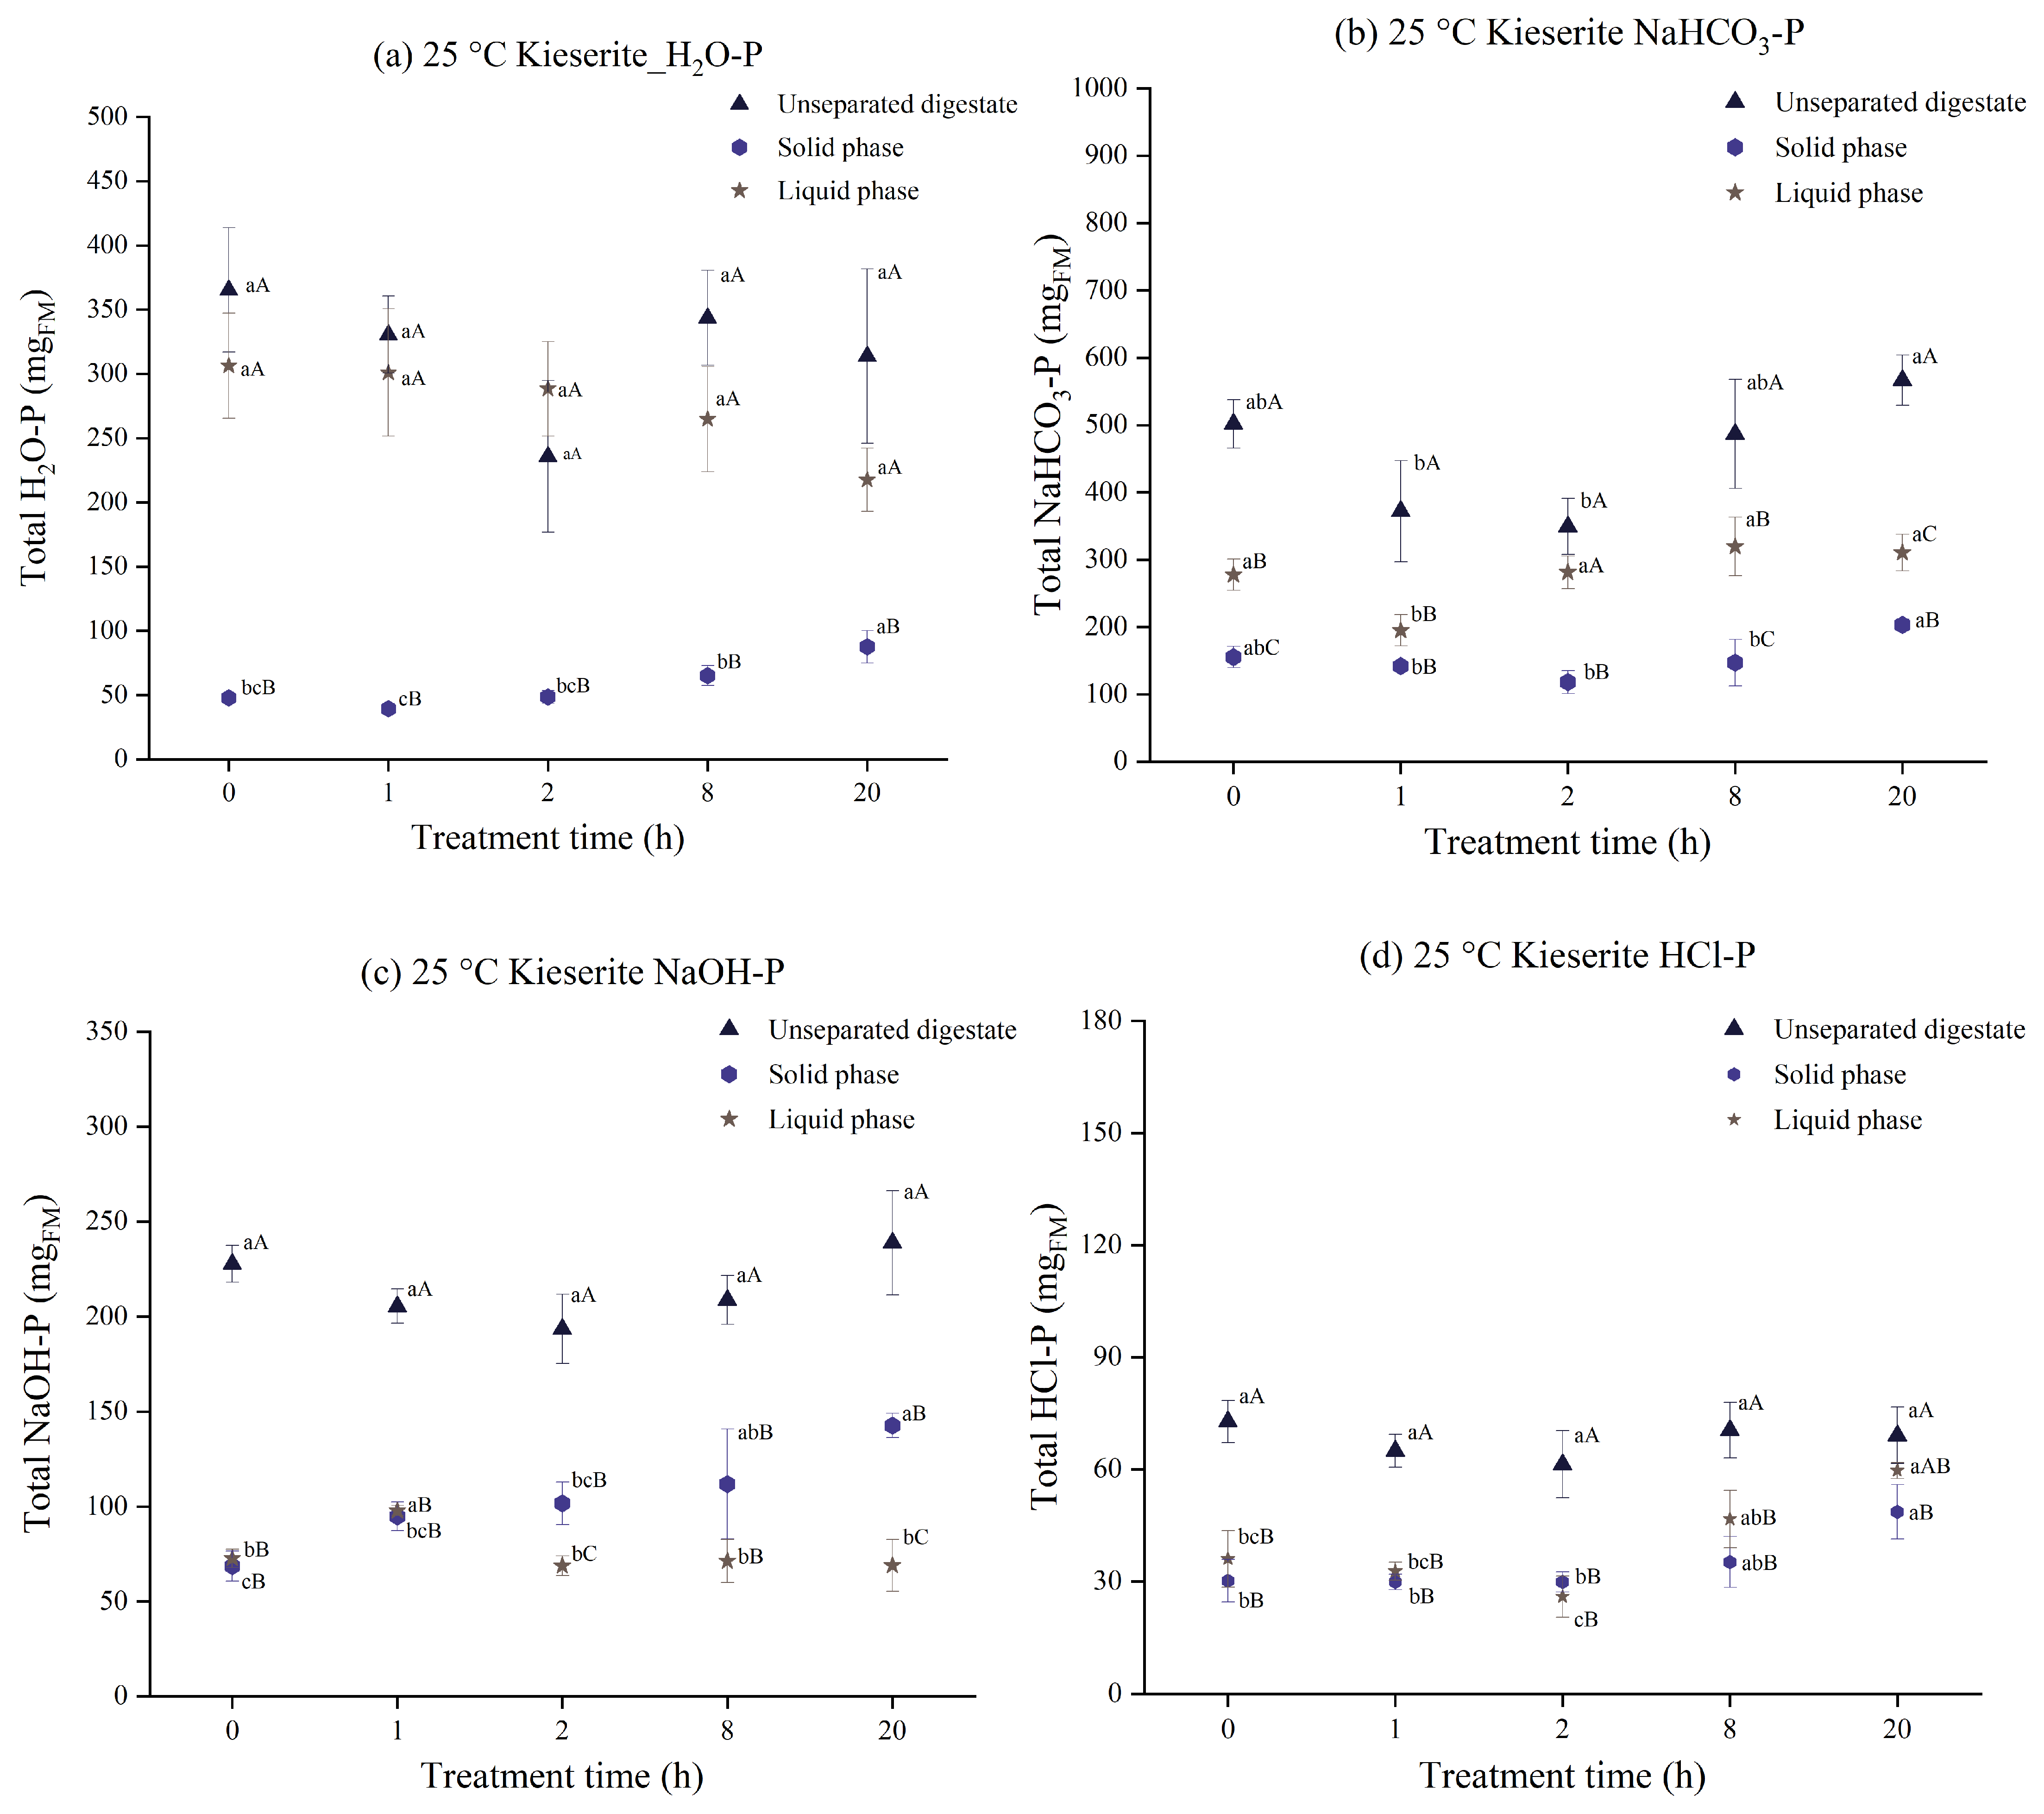
The distributions of H2O-P, NaHCO3-P, NaOH-P, and HCl-P fractions in the unseparated digestate, solid, and liquid phases with the KIS 25 treatment are presented in Figure 6.
The variation in the H2O-P content at different treatment times in the liquid phase and the unseparated digestate was similar (Figure 6a). At 20 h, the solid phase had an increase in the H2O-P fraction of 39.8 mg, which was 83.2% higher than that at 0 h. Since this is a labile fraction, kieserite had no chemical effect in the P recovery, and this increase of P in the solid phase can be attributed to the decrease of 88.9 mg (29.2% lower than at 0 h) in the liquid phase. Figure 6b shows that the NaHCO3-P fraction in the solid phase had a decreasing trend until 2 h, and later at 8 h and 20 h it showed an increase, which can be explained by a strikingly similar trend in the NaHCO3-P fraction of the unseparated digestate. This means that, in this case, there was likely no shift of P from the liquid phase to the solid, but rather from a different fraction to this one.
The NaOH-P fraction of the solid phase showed an increase with the increasing treatment time (Figure 6c). At 20 h, the solid phase had 142.67 ± 6.39 mg of the NaOH-P fraction, which was 107.7% higher compared to NaOH-P at 0 h. Even though the solid and liquid phases had similar NaOH-P fractions at 0 h, at 20 h, the liquid phase had a lower NaOH-P fraction than that in the solid phase. Similar to NaOH-P, the unseparated digestate in the HCl-P fraction (Figure 6d) also did not show significant differences with the increasing treatment time. At 20 h, the solid phase had a 60.7% increase in the HCl-P fraction compared to 0 h. As mentioned in Section 2.5, the NaOH-P and HCl-P fractions account for the P bound to metal ions of Fe, Al, Mg, and Ca [45]. As kieserite is a soluble salt, using it as an additive caused the Mg2+ ions to bind to the PO43− ions in the digestate to form MAP [29,30,31]. This MAP is a precipitate and thus becomes separated in the solid phase, which explains the above-discussed significant increase of NaOH-P and HCl-P in the solid phase.
c.
Kieserite treatment at 50 °C
The distributions of H2O-P, NaHCO3-P, NaOH-P, and HCl-P fractions in the unseparated digestate, solid, and liquid phases with the KIS 50 treatment are presented in Figure 7.
Unlike other additive treatments, the KIS 50 treatment showed a significant reduction in the H2O-P fraction of the unseparated digestate and the liquid phase with the increase in the treatment time (Figure 7a). The H2O-P fraction in the solid phase had a decrease of 35.3% at 20 h compared to the 0 h treatment time. This could be an indication that the increase in temperature had a considerable negative influence on the water-soluble P in the digestate with kieserite as the additive. The solid and liquid phases did not show a distinctive increase in NaHCO3-P content (Figure 7b) with the increasing treatment time. At 20 h, the NaHCO3-P content in the solid and liquid phases increased by 8.55% and 9.85%, respectively, compared to 0 h.
The NaOH-P fraction (Figure 7c) in the solid and liquid phases decreased over time. At 20 h, the liquid phase had a 36.6% decrease in NaOH-P compared to 0 h. The NaOH-P content in the solid phase also decreased with the increasing treatment time, whereby a decrease of 19.1% was observed between 0 h and 20 h. In terms of concentration, KIS 50 displayed an increased NaOH-P content in the liquid phase compared to KIS 25. HCl-P (Figure 7d) content was similar in the solid phase at all treatment times tested. In the liquid phase, HCl-P content steadily increased from 0 h to 8 h, and later, a drop was observed at 20 h, and an overall increase of 32.1% was recorded.
As previously mentioned, Krumgalz (2018) has studied the effect of temperature on MgSO4 solubility. In this study, it was concluded that at 50 °C, MgSO4 has higher solubility than at 25 °C [36]. In another thermodynamic study performed by Bhuiyan et al. (2007), it was concluded that MAP has a slightly higher solubility at 50 °C compared to 25 °C [35]. Due to these effects of the higher temperature on the solubility, KIS 50 showed a lower recovery of NaOH-P in the solid phase compared to the KIS 25 treatment. This also explains the significant increase of HCl-P in the liquid phase. Overall, it can be inferred that the use of kieserite as an additive treatment at 25 °C was more efficient in the recovery of P into the solid phase.
d.
Biochar treatment
The distribution of the H2O-P and NaHCO3-P fractions in the unseparated digestate, solid, and liquid phases with the BIC 25 treatment are presented in Figure 8.
In the liquid phase, H2O-P increased with the increasing treatment time. The liquid phase and the unseparated digestate had similar variations of H2O-P content with the increasing treatment time. The solid phase of the H2O-P fraction remained similar during the increasing treatment time. The NaHCO3-P (Figure 8b) fraction in the solid and liquid phases decreased with the increasing treatment time. From 0 h to 20 h, the liquid and solid phases showed decreases of 5.87% and 26.60%, respectively. However, these decreases can mainly be attributed to the decrease in the unseparated digestate itself in the NaHCO3-P fraction. It can thus be clearly seen that for both the H2O-P and NaHCO3-P fractions, the P that shifted to the solid phase did not significantly vary with the increase in the treatment time. Moreover, the surface properties of biochar play a key role in P recovery [5,32,33]. The brittle nature of the biochar used in this study is likely to have caused it to drop into the liquid phase, thus resulting in an increase of the recovered P in the liquid phase.
e.
Straw flour treatment
The distributions of the H2O-P, NaHCO3-P, NaOH-P, and HCl-P fractions in the unseparated digestate, solid, and liquid phases with the STF 25 treatment are presented in Figure 9.
Figure 9a shows that the H2O-P fraction in the solid and liquid phases increased with the increase in the treatment time. However, this increase was not very remarkable. The NaHCO3-P fraction was similar in the solid and liquid phases (Figure 9b) across all the treatment times tested, and in this case, the increase in the P content was not significant at the end of treatment (20 h). Straw flour is a non-reactive additive which was used for better filter cake formation during solid–liquid separation, and therefore, the recovered P content did not vary much with the treatment time.
Similar to biochar, which is also a non-reactive additive, the straw flour treatment had higher labile P fractions than non-labile P fractions.
f.
Summary of findings from the sequential extraction process
Considering the treatments performed, the fractions of HCl-P and NaOH-P, which are slow-release fertilizers, showed that KIS 25 had a higher P recovery. After 20 h of treatment, KIS 25 had HCl-P and NaOH-P fractions of 48.59 ± 7.29 mg and 142.67 ± 6.39 mg, respectively, which indicate an increase of 107.7% and 60.7% compared to 0 h, respectively. Within the KIS 50 treatment, the amount of HCl-P bound to the solid phase decreased. As mentioned in previous sections, at 50 °C, MgSO4 and MAP have higher solubility [35,36]. Due to this, at 50 °C, NaOH-P and HCl-P fractions had a higher P content in the liquid phase. The labile fractions (H2O-P and NaHCO3-P) in KIS 25 were higher in the liquid phase, whereas for non-labile fractions (NaOH-P and HCl-P), the solid phase had an increased P content. The effects of non-reactive additives, both BIC 25 and STF 25, were not very different from each other. In both the above non-labile fractions, the absence of any metal ions in the additive resulted in a poor shifting of P from the liquid to the solid phase. With these additives, the labile and non-labile P fractions mostly remained stable over the treatment time, showing no effect of time on P recovery. However, they did achieve an increase compared to the control, proving that the additives did enhance P adsorption and filtration.

4. Conclusions

The digestate from anaerobic digestion is a rich source of phosphorus but has water content in the range of 80% to 90%, thus making it difficult for transportation. Solid–liquid separation is thus crucial to effectively concentrate phosphorus from the digestate. The phosphorus recovery efficiency increases when additives are added to the digestate before separation. This paper focused on three different additives and their effectiveness in shifting phosphorus into the solid phase by formulating five experimental groups. At 25 °C, the control, biochar (non-reactive), straw flour (non-reactive), and kieserite (reactive) treatments were tested, and kieserite was also tested at 50 °C. The additive treatments and solid–liquid separation were carried out in a laboratory-scale setup. Additionally, a sequential extraction analysis was performed to estimate the quantities of labile (H2O-P and NaHCO3-P) and non-labile (NaOH-P and HCl-P) fractions. It was seen that all the additive treatments had a positive influence on shifting total phosphorus to the solid phase. The treatment with kieserite at both 25 °C and 50 °C resulted in an increase of 40.9% in the shift of phosphorus to the solid phase, compared to the control. This increase was smaller for the case of both the non-reactive additives, biochar (10.2%) and straw flour (16.6%). The results from the sequential extraction indicated that kieserite treatment at 25 °C had increased NaOH-P and HCl-P fractions compared to the other additive treatments used in this study. These two fractions are non-labile and act as slow-release fertilizers, thereby making kieserite treatment at 25 °C the most effective in this study. Further research should focus on the effect of different process parameters, such as pH or the ratio of additive to digestate, to optimize phosphorus recovery. It would also be of interest to study the performance of the additives in phosphorus recovery in a full-scale biogas plant.

Supplementary Materials

The following supporting information can be downloaded at: https://www.mdpi.com/article/10.3390/en16145464/s1. Figure S1. Distribution of NaOH-P fraction in unseparated, solid, and liquid phases of digestate after biochar treatment. Error bars indicate standard deviation between four replications. Lowercase letters represent the significant differences of each fraction along all treatment times. Uppercase letters compare the significant differences between each fraction at a particular treatment time (p > 0.05). Figure S2. Distribution of HCl-P fraction in unseparated, solid, and liquid phases of digestate after biochar treatment. Error bars indicate standard deviation between four replications. Lowercase letters represent the significant differences of each fraction along all treatment times. Uppercase letters compare the significant differences between each fraction at a particular treatment time (p > 0.05). Figure S3. Distribution of NaOH-P fraction in unseparated, solid, and liquid phases of digestate after straw flour treatment. Error bars indicate standard deviation between four replications. Lowercase letters represent the significant differences of each fraction along all treatment times. Uppercase letters compare the significant differences between each fraction at a particular treatment time (p > 0.05). Figure S4. Distribution of HCl-P fraction in unseparated, solid, and liquid phases of digestate after straw flour treatment. Error bars indicate standard deviation between four replications. Lowercase letters represent the significant differences of each fraction along all treatment times. Uppercase letters compare the significant differences between each fraction at a particular treatment time (p > 0.05).

Author Contributions

Conceptualization, N.S.T.U. and K.D.; data curation, N.S.T.U.; formal analysis, N.S.T.U.; funding acquisition, J.G., J.M. and H.O.; methodology, N.S.T.U. and K.D.; supervision, J.G., J.M. and H.O.; visualization, N.S.T.U. and K.D.; writing—original draft, N.S.T.U.; writing—review and editing, N.S.T.U., K.D., X.R., J.G., J.M. and H.O. All authors have read and agreed to the published version of the manuscript.

Funding

Financial support for the present study was received from the Deutsche Forschungsgemeinschaft (DFG, German Research Foundation), 328017493/GRK 2366 (International Research Training Group “Adaptation of maize-based food-feed-energy systems to limited phosphate resources”), and the National Key Research and Development Plan, Ministry of Science and Technology, China (Grant No. 2018YFD0800100).

Data Availability Statement

Data are available from the authors upon reasonable request.

Acknowledgments

The authors would like to thank the technicians at the State Institute of Agricultural Engineering and Bioenergy for their assistance and support during the work.

Conflicts of Interest

The authors declare no conflict of interest.

References

  1. Steffen, W.; Richardson, K.; Rockström, J.; Cornell, S.E.; Fetzer, I.; Bennett, E.M.; Biggs, R.; Carpenter, S.R.; De Vries, W.; De Wit, C.A.; et al. Planetary boundaries: Guiding human development on a changing planet. Science 2015, 347, 1259855. [Google Scholar] [CrossRef] [Green Version]
  2. USGS 2022 Mineral Commodity Summaries 2022—Phosphate. Available online: https://pubs.usgs.gov/periodicals/mcs2022/mcs2022-phosphate.pdf (accessed on 18 April 2023).
  3. Ren, Y.; Yu, M.; Wu, C.; Wang, Q.; Gao, M.; Huang, Q.; Liu, Y. A comprehensive review on food waste anaerobic digestion: Research updates and tendencies. Bioresour. Technol. 2018, 247, 1069–1076. [Google Scholar] [CrossRef] [PubMed]
  4. Chen, L.; Wei, J.; Wang, W.; Wang, C. Combination of microalgae cultivation with membrane processes for the treatment of municipal wastewater. Water Sci. Technol. 2013, 68, 2374–2381. [Google Scholar] [CrossRef]
  5. Morozova, I.; Lemmer, A. Nutrient Recovery from Digestate of Agricultural Biogas Plants: A Comparative Study of Innovative Biocoal-Based Additives in Laboratory and Full-Scale Experiments. Molecules 2022, 27, 5289. [Google Scholar] [CrossRef] [PubMed]
  6. Li, B.; Dinkler, K.; Zhao, N.; Ran, X.; Sobhi, M.; Dong, R.; Müller, J.; Xiong, W.; Huang, G.; Guo, J.; et al. Response of phosphorus speciation to organic loading rates and temperatures during anaerobic co-digestion of animal manures and wheat straw. Sci. Total. Environ. 2022, 838 Pt 1, 155921. [Google Scholar] [CrossRef]
  7. Ma, H.; Guo, Y.; Qin, Y.; Li, Y.-Y. Nutrient recovery technologies integrated with energy recovery by waste biomass anaerobic digestion. Bioresour. Technol. 2018, 269, 520–531. [Google Scholar] [CrossRef]
  8. Mai, D.T.; Kunacheva, C.; Stuckey, D.C. A review of posttreatment technologies for anaerobic effluents for discharge and recycling of wastewater. Crit. Rev. Environ. Sci. Technol. 2018, 48, 167–209. [Google Scholar] [CrossRef]
  9. Drosg, B.; Fuchs, W.; Al Seadi, T.; Madsen, M.; Linke, B. Nutrient Recovery by Biogas Digestate Processing; IEA Bioenergy: Dublin, Ireland, 2015. [Google Scholar]
  10. Bauer, A.; Mayr, H.; Hopfner-Sixt, K.; Amon, T. Detailed monitoring of two biogas plants and mechanical solid–liquid separation of fermentation residues. J. Biotechnol. 2009, 142, 56–63. [Google Scholar] [CrossRef]
  11. Severin, M.; Fuß, R.; Well, R.; Hähndel, R.; Weghe, H.V.D. Greenhouse gas emissions after application of digestate: Short-term effects of nitrification inhibitor and application technique effects. Arch. Agron. Soil Sci. 2016, 62, 1007–1020. [Google Scholar] [CrossRef]
  12. Möller, K.; Müller, T. Effects of anaerobic digestion on digestate nutrient availability and crop growth: A review. Eng. Life Sci. 2012, 12, 242–257. [Google Scholar] [CrossRef]
  13. Nkoa, R. Agricultural benefits and environmental risks of soil fertilization with anaerobic digestates: A review. Agron. Sustain. Dev. 2014, 34, 473–492. [Google Scholar] [CrossRef] [Green Version]
  14. Rehl, T.; Müller, J. Life cycle assessment of biogas digestate processing technologies. Resour. Conserv. Recycl. 2011, 56, 92–104. [Google Scholar] [CrossRef]
  15. Shi, L.; Simplicio, W.S.; Wu, G.; Hu, Z.; Hu, H.; Zhan, X. Nutrient Recovery from Digestate of Anaerobic Digestion of Livestock Manure: A Review. Curr. Pollut. Rep. 2018, 4, 74–83. [Google Scholar] [CrossRef]
  16. Digestate as Fertilizer. Available online: https://www.biogas.org/edcom/webfvb.nsf/id/BJHCPA-DE-Digestate-as-Fertilizer (accessed on 15 March 2023).
  17. KTBL. Umweltgerechte, Innovative Verfahren zur Abtrennung von Nährstoffen aus Gülle und Gärrückständen—Technologischer Stand, Perspektiven und Entwicklungsmöglichkeiten; Deutschen Bundesstiftung Umwelt, erstellt durch das Kuratorium für Technik und Bauwesen in der Landwirtschaft (KTBL): Darmstadt, Germany; Institut für Technologie und Biosystemtechnik der Bundesforschungsanstalt für Landwirtschaft (FAL): Braunschweig, Germany, 2008. [Google Scholar]
  18. Lyons, G.A.; Cathcart, A.; Frost, J.P.; Wills, M.; Johnston, C.; Ramsey, R.; Smyth, B. Review of Two Mechanical Separation Technologies for the Sustainable Management of Agricultural Phosphorus in Nutrient-Vulnerable Zones. Agronomy 2021, 11, 836. [Google Scholar] [CrossRef]
  19. Finch, H.; Samue, l.A.M.; Lane, G. Fertilisers and manures. In Lockhart & Wiseman’s Crop Husbandry Including Grassland; Elsevier: Amsterdam, The Netherlands, 2014; pp. 63–91. [Google Scholar]
  20. ESTA® Kieserit Gran.—K+S Aktiengesellschaft. Available online: https://www.kpluss.com/de-de/geschaeftsfelder-produkte/landwirtschaft/produkte/de-esta-kieserit-gran/ (accessed on 15 March 2023).
  21. Laird, D.A.; Brown, R.C.; Amonette, J.E.; Lehmann, J. Review of the pyrolysis platform for coproducing bio-oil and biochar. Biofuels Bioprod. Biorefining 2009, 3, 547–562. [Google Scholar] [CrossRef]
  22. Wolff, G.A.; Billett, D.S.M.; Bett, B.J.; Holtvoeth, J.; FitzGeorge-Balfour, T.; Fisher, E.H.; Cross, I.; Shannon, R.; Salter, I.; Boorman, B.; et al. The Effects of Natural Iron Fertilisation on Deep-Sea Ecology: The Crozet Plateau, Southern Indian Ocean. PLoS ONE 2011, 6, e20697. [Google Scholar] [CrossRef] [Green Version]
  23. Novotny, E.H.; de Freitas Maia, C.M.B.; de Melo Carvalho, M.T.; Madari, B.E. Biochar: Pyrogenic carbon for agricultural use—A critical review. Rev. Bras. Ciência Solo 2015, 39, 321–344. [Google Scholar] [CrossRef] [Green Version]
  24. Ahmad, M.; Rajapaksha, A.U.; Lim, J.E.; Zhang, M.; Bolan, N.; Mohan, D.; Vithanage, M.; Lee, S.S.; Ok, Y.S. Biochar as a sorbent for contaminant management in soil and water: A review. Chemosphere 2014, 99, 19–33. [Google Scholar] [CrossRef]
  25. Alling, V.; Hale, S.E.; Martinsen, V.; Mulder, J.; Smebye, A.; Breedveld, G.D.; Cornelissen, G. The role of biochar in retaining nutrients in amended tropical soils. J. Plant Nutr. Soil Sci. 2014, 177, 671–680. [Google Scholar] [CrossRef]
  26. Joseph, S.D.; Camps-Arbestain, M.; Lin, Y.; Munroe, P.; Chia, C.H.; Hook, J.; van Zwieten, L.; Kimber, S.; Cowie, A.; Singh, B.P.; et al. An investigation into the reactions of biochar in soil. Soil Res. 2010, 48, 501–515. [Google Scholar] [CrossRef]
  27. Chen, L.; Sun, S.; Yao, B.; Peng, Y.; Gao, C.; Qin, T.; Zhou, Y.; Sun, C.; Quan, W. Effects of straw return and straw biochar on soil properties and crop growth: A review. Front. Plant Sci. 2022, 13, 986763. [Google Scholar] [CrossRef] [PubMed]
  28. Tuyttens, F.A.M. The importance of straw for pig and cattle welfare: A review. Appl. Anim. Behav. Sci. 2005, 92, 261–282. [Google Scholar] [CrossRef]
  29. Schoumans, O.; Ehlert, P.; Regelink, I.; Nelemans, J.; Noij, I.; van Tintelen, W.; Rulkens, W.; Food, W.A. Chemical Phosphorus Recovery from Animal Manure and Digestate: Laboratory and Pilot Experiments; Wageningen Environmental Research: Wageningen, The Netherlands, 2017. [Google Scholar] [CrossRef] [Green Version]
  30. Ye, Y.; Ngo, H.H.; Guo, W.; Liu, Y.; Li, J.; Liu, Y.; Zhang, X.; Jia, H. Insight into chemical phosphate recovery from municipal wastewater. Sci. Total. Environ. 2017, 576, 159–171. [Google Scholar] [CrossRef]
  31. Campos, J.L.; Crutchik, D.; Franchi, Ó.; Pavissich, J.P.; Belmonte, M.; Pedrouso, A.; Mosquera-Corral, A.; Val del Río, Á. Nitrogen and Phosphorus Recovery from Anaerobically Pretreated Agro-Food Wastes: A Review. Front. Sustain. Food Syst. 2019, 2, 91. [Google Scholar] [CrossRef] [Green Version]
  32. Lehmann, J. Bio-energy in the black. Front. Ecol. Environ. 2007, 5, 381–387. [Google Scholar] [CrossRef] [Green Version]
  33. Alberto, D.R.; Tyler, A.C.; Trabold, T.A. Phosphate adsorption using biochar derived from solid digestate. Bioresour. Technol. Rep. 2021, 16, 100864. [Google Scholar] [CrossRef]
  34. Kizito, S.; Wu, S.; Kirui, W.K.; Lei, M.; Lu, Q.; Bah, H.; Dong, R. Evaluation of slow pyrolyzed wood and rice husks biochar for adsorption of ammonium nitrogen from piggery manure anaerobic digestate slurry. Sci. Total. Environ. 2015, 505, 102–112. [Google Scholar] [CrossRef]
  35. Bhuiyan, M.I.H.; Mavinic, D.S.; Beckie, R.D. A solubility and thermodynamic study of struvite. Environ. Technol. 2007, 28, 1015–1026. [Google Scholar] [CrossRef]
  36. Krumgalz, B.S. Temperature Dependence of Mineral Solubility in Water. Part 3. Alkaline and Alkaline Earth Sulfates. J. Phys. Chem. Ref. Data 2018, 47, 23101. [Google Scholar] [CrossRef]
  37. Urbanowska, A.; Polowczyk, I.; Kabsch-Korbutowicz, M. Struvite precipitation from the liquid fraction of the digestate of a municipal waste biogas plant. Environ. Prot. Eng. 2021, 47, 85–99. [Google Scholar] [CrossRef]
  38. González-Morales, C.; Fernández, B.; Molina, F.J.; Naranjo-Fernández, D.; Matamoros-Veloza, A.; Camargo-Valero, M.A. Influence of pH and Temperature on Struvite Purity and Recovery from Anaerobic Digestate. Sustainability 2021, 13, 10730. [Google Scholar] [CrossRef]
  39. Hedley, M.J.; Stewart, J.W.B.; Chauhan, B.S. Changes in Inorganic and Organic Soil Phosphorus Fractions Induced by Cultivation Practices and by Laboratory Incubations. Soil Sci. Soc. Am. J. 1982, 46, 970–976. [Google Scholar] [CrossRef]
  40. Dinkler, K.; Li, B.; Guo, J.; Hülsemann, B.; Becker, G.C.; Müller, J.; Oechsner, H. Adapted Hedley fractionation for the analysis of inorganic phosphate in biogas digestate. Bioresour. Technol. 2021, 331, 125038. [Google Scholar] [CrossRef]
  41. Bachmann, S.; Wentzel, S.; Eichler-Löbermann, B. Codigested dairy slurry as a phosphorus and nitrogen source for Zea mays L. and Amaranthus cruentus L. J. Plant. Nutr. Soil Sci. 2011, 174, 908–915. [Google Scholar] [CrossRef]
  42. Dou, Z.; Toth, J.D.; Galligan, D.T.; Ramberg, C.F.; Ferguson, J.D. Laboratory Procedures for Characterizing Manure Phosphorus. J. Environ. Qual. 2000, 29, 508–514. [Google Scholar] [CrossRef]
  43. Baird, R.B.; Eaton, A.D. (Eds.) . Standard Methods for Examination of Water and Wastewater, 23rd ed.; American Public Health Association: Washington, DC, USA, 2017. [Google Scholar]
  44. Levy, E.T.; Schlesinger, W.H. A comparison of fractionation methods for forms of phosphorus in soils. Biogeochemistry 1999, 47, 25–38. [Google Scholar] [CrossRef]
  45. Li, B.; Dinkler, K.; Zhao, N.; Sobhi, M.; Merkle, W.; Liu, S.; Dong, R.; Oechsner, H.; Guo, J. Influence of anaerobic digestion on the labile phosphorus in pig, chicken, and dairy manure. Sci. Total. Environ. 2020, 737, 140234. [Google Scholar] [CrossRef]
  46. Hsu, J.C.; Peruggia, M. Graphical Representations of Tukey’s Multiple Comparison Method. J. Comput. Graph. Stat. 1994, 3, 143. [Google Scholar] [CrossRef]
  47. Piepho, H.P. Letters in mean comparisons: What they do and don’t mean. Agron. J. 2018, 110, 431–434. [Google Scholar] [CrossRef] [Green Version]
Figure 1. Reactor setup used for treatment of the digestate with additives.
Energies 16 05464 g001
Figure 2. Scheme of the stir tank reactor used for the additive treatments.
Energies 16 05464 g002
Figure 3. Distribution of total phosphorus in the solid phase of the digestate after the additive treatment.
Energies 16 05464 g003
Figure 4. Distribution of H2O-P, NaHCO3-P, NaOH-P, and HCl-P fractions in the solid phase at (a) 0 h and (b) 20 h after the additive treatments. Error bars indicate the standard deviation between four replications.
Energies 16 05464 g004
Figure 5. H2O-P, NaHCO3-P, NaOH-P, and HCl-P distributions in the unseparated, solid, and liquid phases of the control. Error bars indicate the standard deviation between four replications. Lowercase letters represent the significant differences of each fraction across all treatment times. Uppercase letters compare the significant differences between each fraction at a particular treatment time (p > 0.05).
Energies 16 05464 g005
Figure 6. H2O-P, NaHCO3-P, NaOH-P, and HCl-P distributions in the unseparated, solid, and liquid phases of the digestate after kieserite treatment at 25 °C. Error bars indicate standard deviation between four replications. Lowercase letters represent the significant differences of each fraction across all treatment times. Uppercase letters compare the significant differences between each fraction at a particular treatment time (p > 0.05).
Energies 16 05464 g006
Figure 7. H2O-P, NaHCO3-P, NaOH-P, and HCl-P distributions in the unseparated, solid, and liquid phases of the digestate after kieserite treatment at 50 °C. Error bars indicate standard deviation between four replications. Lowercase letters represent the significant differences of each fraction across all treatment times. Uppercase letters compare the significant differences between each fraction at a particular treatment time (p > 0.05).
Energies 16 05464 g007aEnergies 16 05464 g007b
Figure 8. H2O-P and NaHCO3-P distributions in the unseparated, solid, and liquid phases of the digestate after biochar treatment. Error bars indicate standard deviation between four replications. Lowercase letters represent the significant differences of each fraction across all treatment times. Uppercase letters compare the significant differences between each fraction at a particular treatment time (p > 0.05).
Energies 16 05464 g008
Figure 9. H2O-P and NaHCO3-P distributions in the unseparated, solid, and liquid phases of the digestate after the straw flour treatment. Error bars indicate standard deviation between four replications. Lowercase letters represent the significant differences of each fraction across all treatment times. Uppercase letters compare the significant differences between each fraction at a particular treatment time (p > 0.05).
Energies 16 05464 g009
Table 1. Characteristics of the digestate collected from Unterer Lindenhof.
TSVSNPK
(%)(%)(g kgTS−1)(g kgTS−1)(g kgTS−1)
Digestate5.43 ± 0.143.64 ± 0.170.79 ± 1.040.60 ± 0.065.08 ± 1.08
TS = total solids, VS = volatile solids, N = total nitrogen, P = total phosphorus, K = total potassium (n = 3, mean value ± standard deviation).
Table 2. Experimental setup of the digestate treatment with additives.
AdditiveTemperature, °CTreatment Time,
h
012820
KIS 25Kieserite25
KIS 50Kieserite50
BIC 25 Biochar (1–2 mm)25
STF 25Straw flour25
ControlNone25
Disclaimer/Publisher’s Note: The statements, opinions and data contained in all publications are solely those of the individual author(s) and contributor(s) and not of MDPI and/or the editor(s). MDPI and/or the editor(s) disclaim responsibility for any injury to people or property resulting from any ideas, methods, instructions or products referred to in the content.