Abstract
Difficulty in water injection during the water injection development (water injection production refers to the injection of water into the reservoir from injection wells during the development process of an oil field; due to its good economic efficiency and high feasibility, it has become the main method of oil field development) process of the G block reservoir is an important problem to solve. Three cores of the G block are used as the object of this study, and the laser particle size test is conducted on the target core to obtain the particle size distribution of the core. X-ray diffraction mineral content analysis is used to obtain the proportion of different mineral contents. On this basis, online nuclear magnetic technology is used to carry out the research on the change of reservoir physical properties during the high-magnification water injection process. The experiment shows that three cores (cores 8-2, 16-1, and 9) are identified as medium sandy fine sandstone with silt (the three-level naming method was adopted and the name has been changed to medium sandy fine sandstone containing silt, because the proportion of fine sand is greater than 50%, the content of medium sand is between 25%~50%, and the content of silt is between 10%~25%), medium sandy fin sandstone containing silt, and silt fine sandstone, by laser particle size testing. Their clay mineral contents are 2.47%, 2.51%, and 4.76%, respectively; the permeability (water) of the three cores continues to decrease with the increase in water injection, but the nuclear magnetic porosity and the signal intensity of different fluids in the nuclear magnetic T2 and nuclear magnetic two-dimensional spectrum show different variation patterns with the increase in water injection. The clay minerals of core 8-2 and core 16-1 are relatively small. The nuclear magnetic porosity increases rapidly to the maximum value and then decreases slowly with the increase in water injection. The right peak signal intensity in the T2 spectrum rises first and then drops, while the clay mineral content of core 9 is relatively high. The change trend of nuclear magnetic porosity is firstly decreasing and then increasing, and the signal intensity of the right peak in the T2 spectrum decreases first and then increases. The research concludes that in the early stage of water injection, clay minerals undergo hydration and a small amount of particle migration; in the later stage of water injection, due to the scouring effect of water, the fine silt and clay minerals in the cement easily fall off and migrate to the pore throat to the block. Some damage to the pore throat leads to a decrease in permeability, thus affecting the development effect.
1. Introduction
Block G of the J D Oilfield is a typical layered structural lithologic reservoir with a burial depth of 2800 m–3000 m. The reservoir has strong heterogeneity, medium porosity, and low permeability, with an average porosity of 18.1% and an average permeability of 58.8 × 10⁻³ D. The lithology of the reservoir is mainly composed of medium and fine-grained mixed sandstones, followed by unequal mixed sandstones. Clay minerals are mainly kaolinite and montmorillonite. Due to the nonuniformity of sediments on multiple scales, similar sediments are well used to understand and predict the nonuniformity of sedimentary structures [1,2]. The reservoir has entered an ultra-high water cut stage, so problems such as increased injection pressure of water wells and difficulties in water injection have occurred during the water injection production process. In order to analyze the characteristics and causes of changes in reservoir physical properties during the water injection process, a high-magnification water injection experiment based on two-dimensional NMR technology was carried out.
At present, scholars mainly research fine particle migration damage using sand-packed models and core displacement experiments. During water injection, clay minerals fall off after expanding due to water absorption, and the migration, precipitation, and blockage of particles are important reasons for reservoir damage [3,4,5]. Jing and Li et al. [6,7] used velocity sensitivity experiments and forward and reverse displacement experiments to determine the migration status of core particles, which indicates that particle migration in reservoirs is one of the main factors causing reservoir damage. Li et al. [8] demonstrated that the presence of obvious particle migration in reservoirs is one of the main factors leading to difficulties in water injection in water injection wells, through multiple sets of core volume flow experiments. You and Cui and Li et al. [9,10,11] proved through displacement experiments that reservoir particles can block the reservoir, resulting in a decrease in reservoir permeability. Luo et al. [12] expounded the migration mechanism of formation particles and the migration state of particles after the expansion of clay minerals, which indicated that the joint action of particles and clay minerals has a great impact on core permeability. Li and Dong et al. [13] found that when clay minerals come into contact with water, they will swell after absorbing water, shed due to destabilization, disperse, and migrate, leading to a decrease in the volume of the seepage channel. An and Xie et al. [14,15] found that the type and content of clay minerals directly affect the T2 spectrum itself, which in turn has an undeniable impact on NMR porosity, bound water saturation, and permeability.
NMR technology has been widely applied to studying fluid distribution in water flooding processes. Wu et al [16] conducted a high-magnification water drive experiment. They used the NMR instrument to perform T2 spectrum testing and slice imaging detection at each stage of the core experiment. These proved that under high-magnification water drive, the oil displacement efficiency increases with the increase in injection multiples. Di et al. [17] carried out NMR visualization research on core microflow, optimized the domestically produced low-magnetic resonance imaging core displacement device, eliminated interference factors, and obtained high-resolution oil–water distribution images. Qu et al. [18] extracted one-dimensional relaxation spectra of water from diffusion relaxation two-dimensional spectra of different oil saturations, and obtained the distribution of oil and water in different pores, which solved the problem of difficulty in distinguishing oil and water using one-dimensional relaxation spectra alone. Ding et al. [19] established the relationship between core NMR T2 spectrum and pore distribution, combining them with core displacement experiments of different fluids and using the transformed nuclear magnetic pore throat distribution to obtain the relationship between core pore structure and the distribution of movable fluids and remaining oil. Liu [20] analyzed the changes in T2 spectra of oil flooding and water flooding oil in low-porosity and low-permeability rock cores under experimental conditions, and implemented the method of calculating the oil-bearing factor of water-flooded layers using T2 spectra. The actual oil-bearing factor calculated from nuclear magnetic logging data is consistent with the water-flooded level to a relatively high degree. Hou et al. [21] evaluated the oil recovery effect of low-salinity water flooding in the G oilfield based on NMR technology, demonstrating that low-salinity water has a good displacement effect on oil in smaller pores and contributes to the expansion and migration of clay in the core. Cheng [22] solved the technical problems that occurred in integrating domestic NMR imaging equipment and core flow experimental instruments, preliminarily formed a core flow nuclear magnetic resonance imaging testing method, and carried out research on visualizing the fluid distribution in the core during displacement.
Accurate characterization of pore throat characteristics is the foundation for studying reservoirs, but traditional research methods cannot achieve accurate characterization of micro- and nanoscale pore throats. A large number of scholars have conducted relevant research on the understanding of micro- and nanoscale pore throats in reservoirs. Zou et al. [23] used CT technology to discover for the first time that nanoscale pores had a significant impact on the research and understanding of micropore structures. Li et al. [24] conducted research on the characteristics of nanopore structure using the nuclear magnetic resonance freeze–thaw method (NMRC), accurately detecting the pore structure within the nano range of rock cores. Xu and Zhang and Wu et al. [25,26,27] conducted research on the pore structure of shale reservoirs based on NMR and X-CT, calculated the effective porosity of shale based on the T2 cutoff value of NMR, and analyzed the percentage of movable fluids in shale reservoirs.
Based on the above domestic and international research, it can be seen that most scholars conduct research on reservoir physical properties changes based on displacement experiments. Some scholars also use the T2 cutoff method in nuclear magnetic technology to calculate porosity and fluid saturation. However, the determination of T2 cutoff value is influenced by various parameters, which has certain drawbacks. Moreover, previous studies on particle size and mineral composition, as well as fluid distribution under high water injection rates, have been relatively limited because NMR technology has the characteristics of high precision (the accuracy of uCT is micrometers, and the conversion of T2 distribution to pore radius in nuclear magnetic resonance can be accurate to 3–5 nm) and nondestructive samples [28,29], and the pore throat structure of rocks can be reflected in the obtained T2 spectrum [30,31,32]. The objectives of this study are (i) to conduct laser particle size testing and X-ray diffraction mineral content analysis on the target rock core, (ii) to conduct high-power water injection experiments (high-magnification water injection experiment refers to a water injection experiment where the volume ratio of water injection is much greater than the pore volume ratio) based on nuclear magnetic resonance technology, and to obtain fluid permeability, nuclear magnetic porosity, T2 spectrum, and two-dimensional spectrum under different water injection rates in order to analyze the changes in reservoir physical properties and their reasons.
2. Core Attribute Parameters
This study analyzed three cores from well G78-12 in the target block. The gas porosity measured using Boyle’s law was 22.565%, 21.137%, and 19.495%, respectively. The Klinkenberg permeability refers to the permeability of a rock sample obtained after correction for slip effect. The correction method measures the permeability of the rock sample under different pressures, and then uses the permeability values at each pressure value and the reciprocal of the pressure values to create a relationship curve. The intersection point between the curve and the permeability axis is the Klinkenberg permeability value of the rock sample, which is equivalent to the theoretical absolute permeability value of the rock sample. The Klinkenberg permeability was 34.395 mD, 102.6 mD, and 84.892 mD, respectively. The specific basic data of the cores are shown in Table 1.

Table 1.
Basic core data.
Three target cores were tested for mineral content by X-ray diffraction. The highest mineral content of core 8-2 is plagioclase (43.26%), the smallest is pyrite (0.20%), and then clay minerals (2.41%). In core 16-1, plagioclase accounts for 44.88% of the mineral content, dolomite accounts for 1.34% of the mineral content, and clay minerals account for 2.57%, and core 9 has a maximum of 42.34% plagioclase, a minimum of 0.99% hematite, and a relatively high of 8.76% clay minerals. The specific mineral contents of the cores are shown in Table 2.
Table 2.
Mineral content of core X-ray diffraction (%).
The particle size distribution and sorting of cores are a measurement of transport capacity and a good indicator of the natural geography environment and hydrodynamics at deposition time. Moreover, the oil storage properties of cores are closely related to their particle sizes. The laser particle size test was conducted on three target rock cores. Core 8-2 is a sandy fine sandstone containing silt, with 41.608% fine sand, 8.4% fine silt, and 0.804% clay. Core 16-1 is a silt-bearing medium sandy fine sandstone, with 39.022% fine sand, 9.904% fine silt, and 0.948% clay. Core 9 is a silt fine sandstone with 24.876% fine sand, 23.122% fine silt, and 2.062% clay. The results of the specific particle size analysis of the cores are shown in Table 3.
Table 3.
Core laser grain size analysis results (%).
3. Experiment
3.1. Experimental Equipment
The experimental instruments mainly include an NMR instrument and a displacement pump. The NMR appliance is a Newman nuclear magnetic resonance analyzer, model Ver4.0. The magnetic field intensity of the NMR instrument is 0.5 T, the radio frequency pulse frequency is 1–30 MHz, and the radio frequency control accuracy is 0.01 MHz. We set the device parameter to Te: 0.5 ms; RF delay: 0.05 ms; Tw (waiting time): 2000; Nech (number of echoes): 2048; Ns (accumulative frequency): 32 times; the pulse width was divided into 90° pulse width (P1 = 6.80) and 180° pulse width (P2 = 10.08); sampling frequency: 200 kHz.
The displacement pump is a constant speed and pressure pump, model ESV, with a pressure range of 0–60 MPa, a pump volume of 100 mL, and a continuous flow velocity range of 0.001–60 mL/min. It has precise measurements and can achieve continuous injection. In experiments, it is mainly used to inject simulated formation water into rock cores. The intermediate container used for displacement has a pressure range of 0–50 MPa, a volume of 200 mL, and a temperature resistance of 200 °C. Baihua Co., Ltd. manufactures the core gripper in Dongying District, Dongying City. It has a pressure range of 0–60 MPa, a temperature resistance of 100 °C, a length of 35 cm, and can be inserted into the core with a length range of 1.5–6.5 cm. The hand pump controls the experimental ring pressure, manufactured by Huaxing Petroleum Instrument Co., Ltd., with a pressure range of 0–50.0 MPa.
3.2. Classification of Fluid Types by Two-Dimensional Nuclear Magnetic Spectroscopy
The basis of NMR testing is the interaction between hydrogen atoms and magnetic fields, and the amount of signal reflects the fluid content in the core [33]. During the process of saturated water and water injection displacement in the core, due to the nuclear magnetic moment of the hydrogen nucleus in the water, which undergoes energy level splitting under the action of an external static magnetic field, at this time, a certain frequency of radio frequency field is applied to the rock core, and the nuclear magnetic moment undergoes an absorption transition, resulting in nuclear magnetic resonance. Subsequently, a signal with amplitude decaying over time can be received by removing the RF field. Due to the difficulty in distinguishing adsorbed water, irreducible water, and free water in pores using NMR T2 spectroscopy, this study is based on a combination of two-dimensional nuclear magnetic resonance technology and high-power water injection experiments, using nuclear magnetic resonance two-dimensional spectroscopy to distinguish the distribution of different fluids in pores.
In the two-dimensional nuclear magnetic spectrum, fluid types are classified based on the magnitude of T1 and T2 values. When 1 < T1/T2 < 100, 0.1 ms < T1 < 10 ms, T2 < 0.3 ms, it is water of crystallization and adsorption water; when 1 < T1/T2 < 10, T1 > 1 ms, 0.3 ms < T2 < 3 ms, it is irreducible water; when 1 < T1/T2 < 10, T1 > 10 ms, T2 > 3 ms, it is free water.
3.3. Design of High-Expansion Water Injection Scheme
- (1)
- Take target cores 8-2, 16-1, and core 9 for oil washing and drying.
- (2)
- Measure the target rock core’s length, diameter, porosity, and permeability.
- (3)
- Place the core in formation water with a mineralization of 5000 mg/L, with the formation water surface covering the top of the core, and vacuumize for 48 h a vacuum pump to fully saturate the experimental core with formation water (saturation water stage).
- (4)
- Place the core in a displacement device, inject water at a fixed flow rate of 1.0 mL/min, and record the water output and pressure.
- (5)
- Collect two-dimensional nuclear magnetic resonance when the cumulative water injection reaches 100 PV, 500 PV, and 1000 PV. The experiment ends when the accumulated water injection reaches 1000 PV.
- (6)
- Calculate the permeability of water according to the recorded water output and pressure.
4. Result and Discussion
Characteristics of Nuclear Magnetic Porosity and Permeability Changes during High-Fold Water Injection
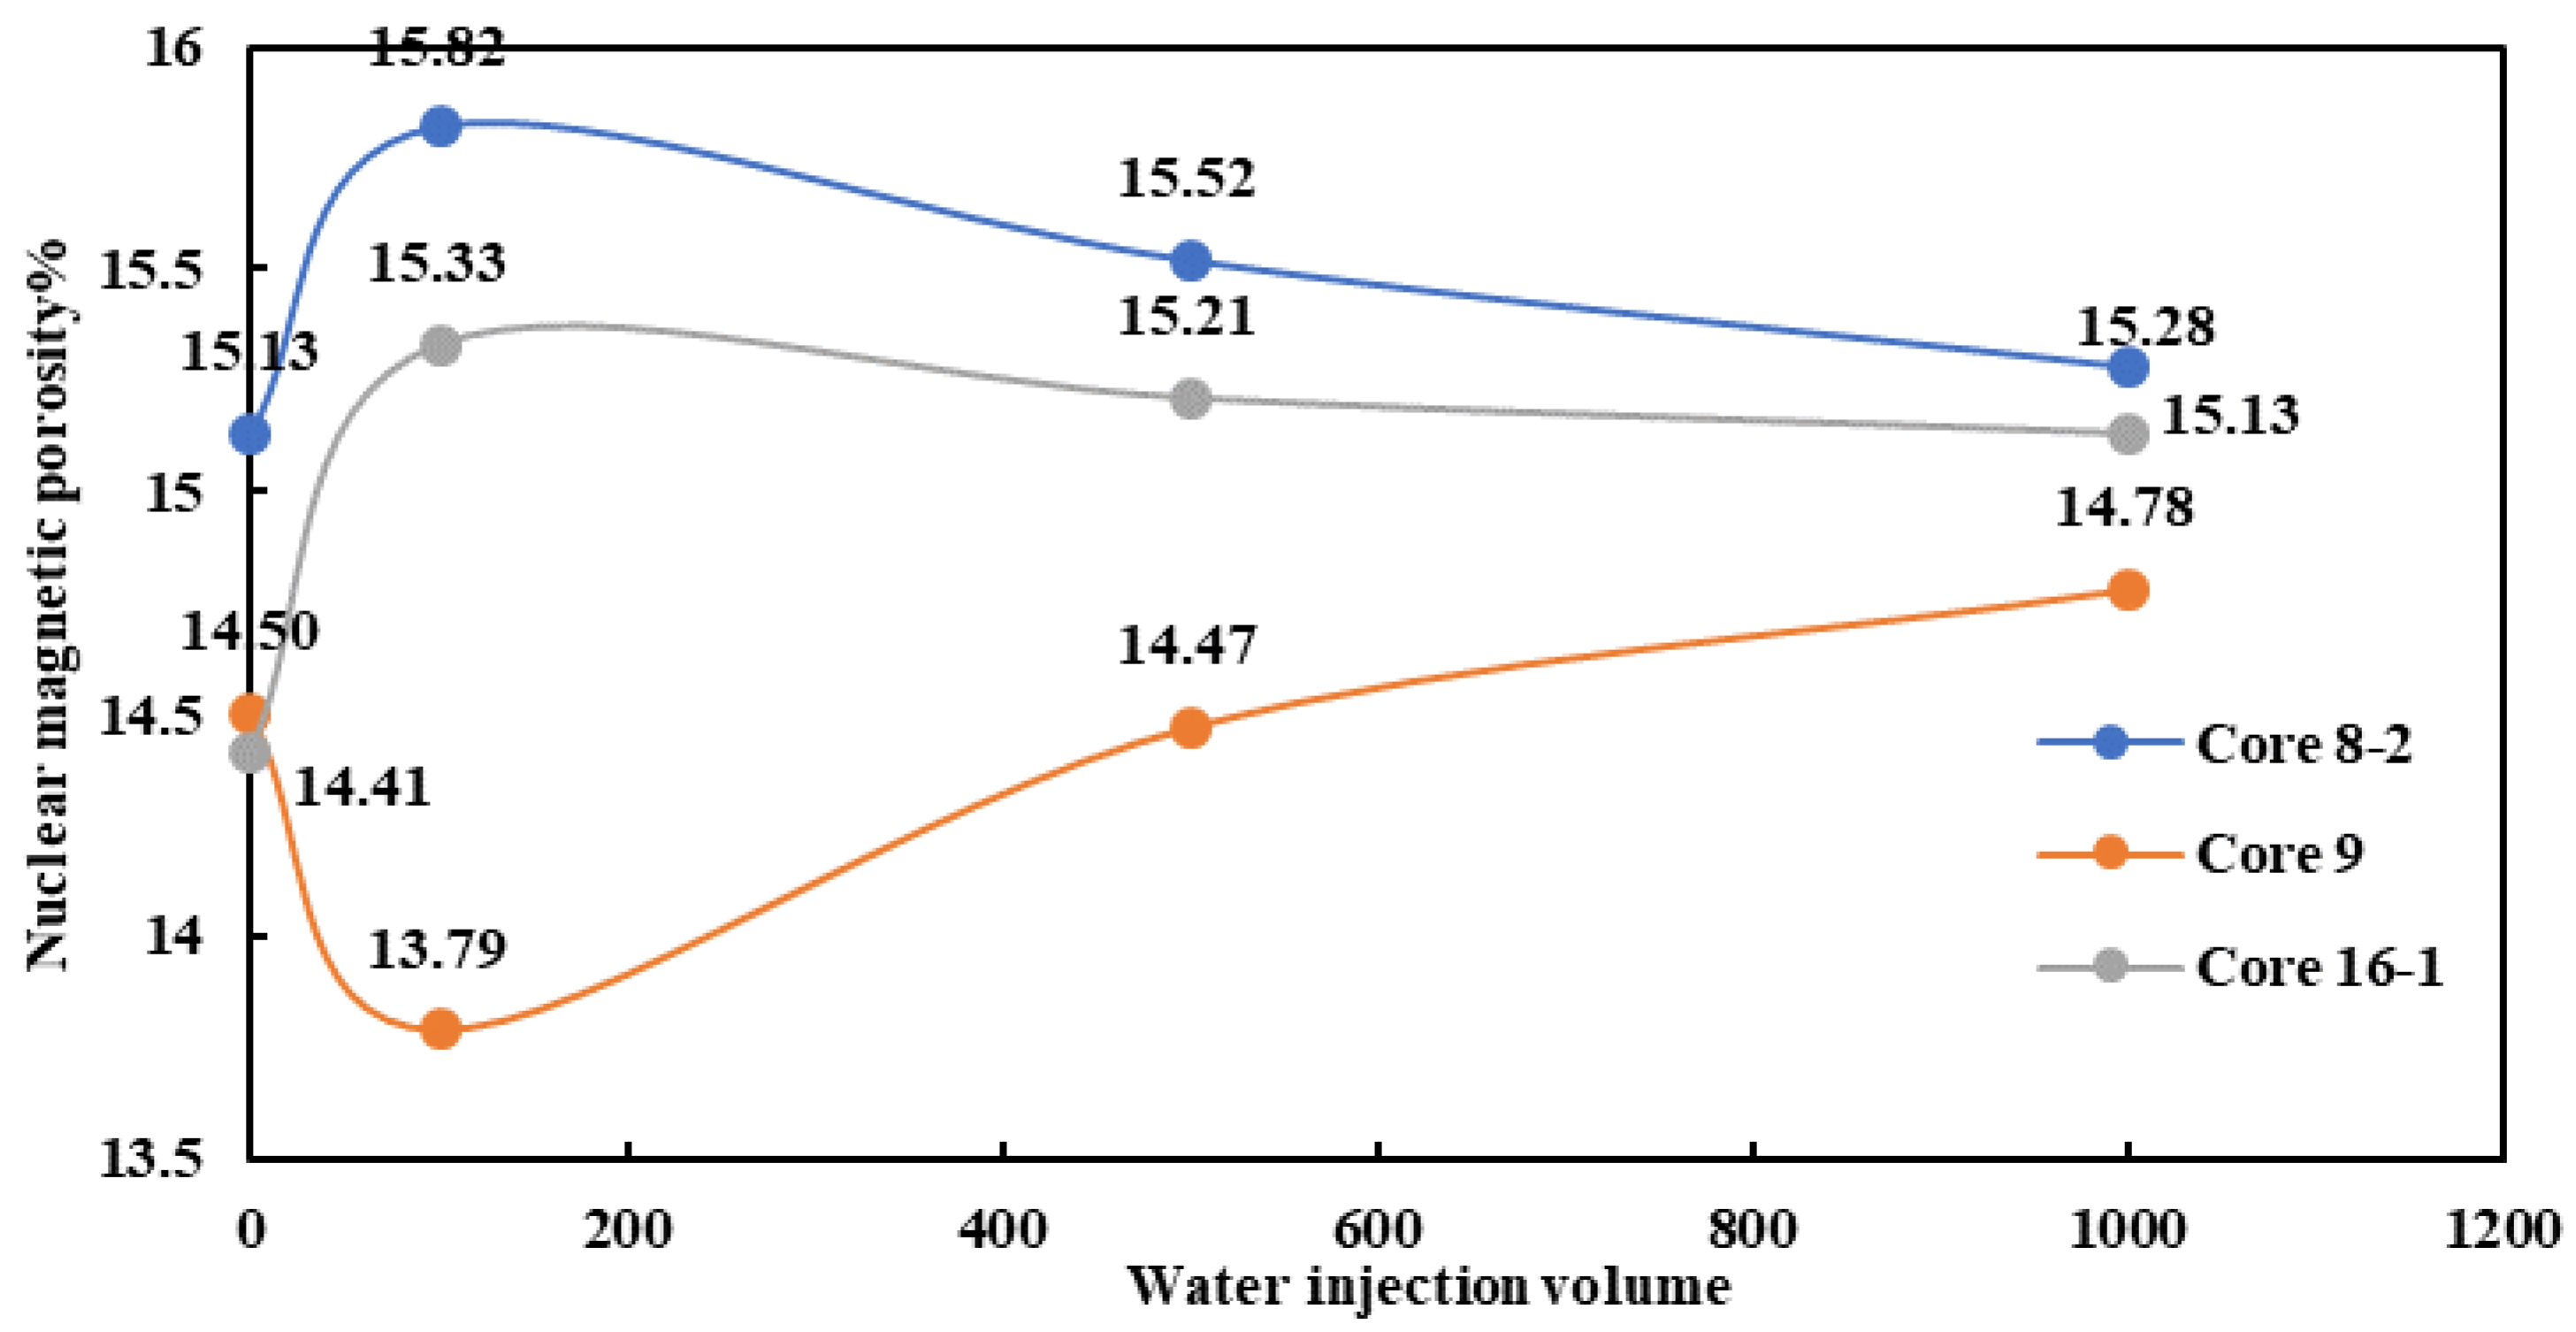
Due to the proportional relationship between the amplitude of the nuclear magnetic signal and the number of hydrogen nuclei (i.e., fluid content) contained in the sample (pore), the T2 spectrum of nuclear magnetic resonance can be used to calculate the nuclear magnetic porosity. The method for measuring porosity this time is the peak method. Firstly, we measured the nuclear magnetic resonance T2 spectrum of the standard sample (with porosity of 1%, 2%, 5%, 10%, 15%, 20%, and 25%, respectively), established a scale system between the nuclear magnetic resonance signal amplitude and porosity, and then measured the rock sample. We substituted its signal amplitude into the scale relationship equation to calculate the nuclear magnetic resonance porosity. Figure 1 shows the relationship between the cumulative water injection volume of the core and the nuclear magnetic porosity. The figure shows that the nuclear magnetic porosity changes of the three target cores exhibit different patterns of change. In the first stage (saturated water state—cumulative water injection of 100 PV), the NRM porosity of core 8-2 and core 16-1 shows an upward trend with the increase in water injection, increasing from 15.13% and 14.41% to 15.82% and 15.33%, respectively, while the NRM porosity of core 9 decreases from 14.5% to 13.79%. In the second stage (cumulative water injection of 100–1000 PV), with the increase in cumulative water injection, the NRM porosity of core 8-2 and core 16-1 decreases from 15.82% and 15.33% to 15.28% and 15.13%, respectively, while the porosity of core 9 increases from 13.79% to 14.78%.
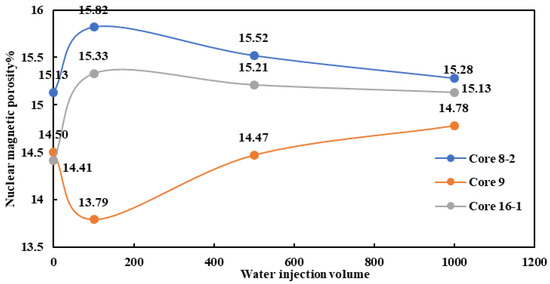
Figure 1.
Curve of water injection volume and nuclear magnetic porosity.
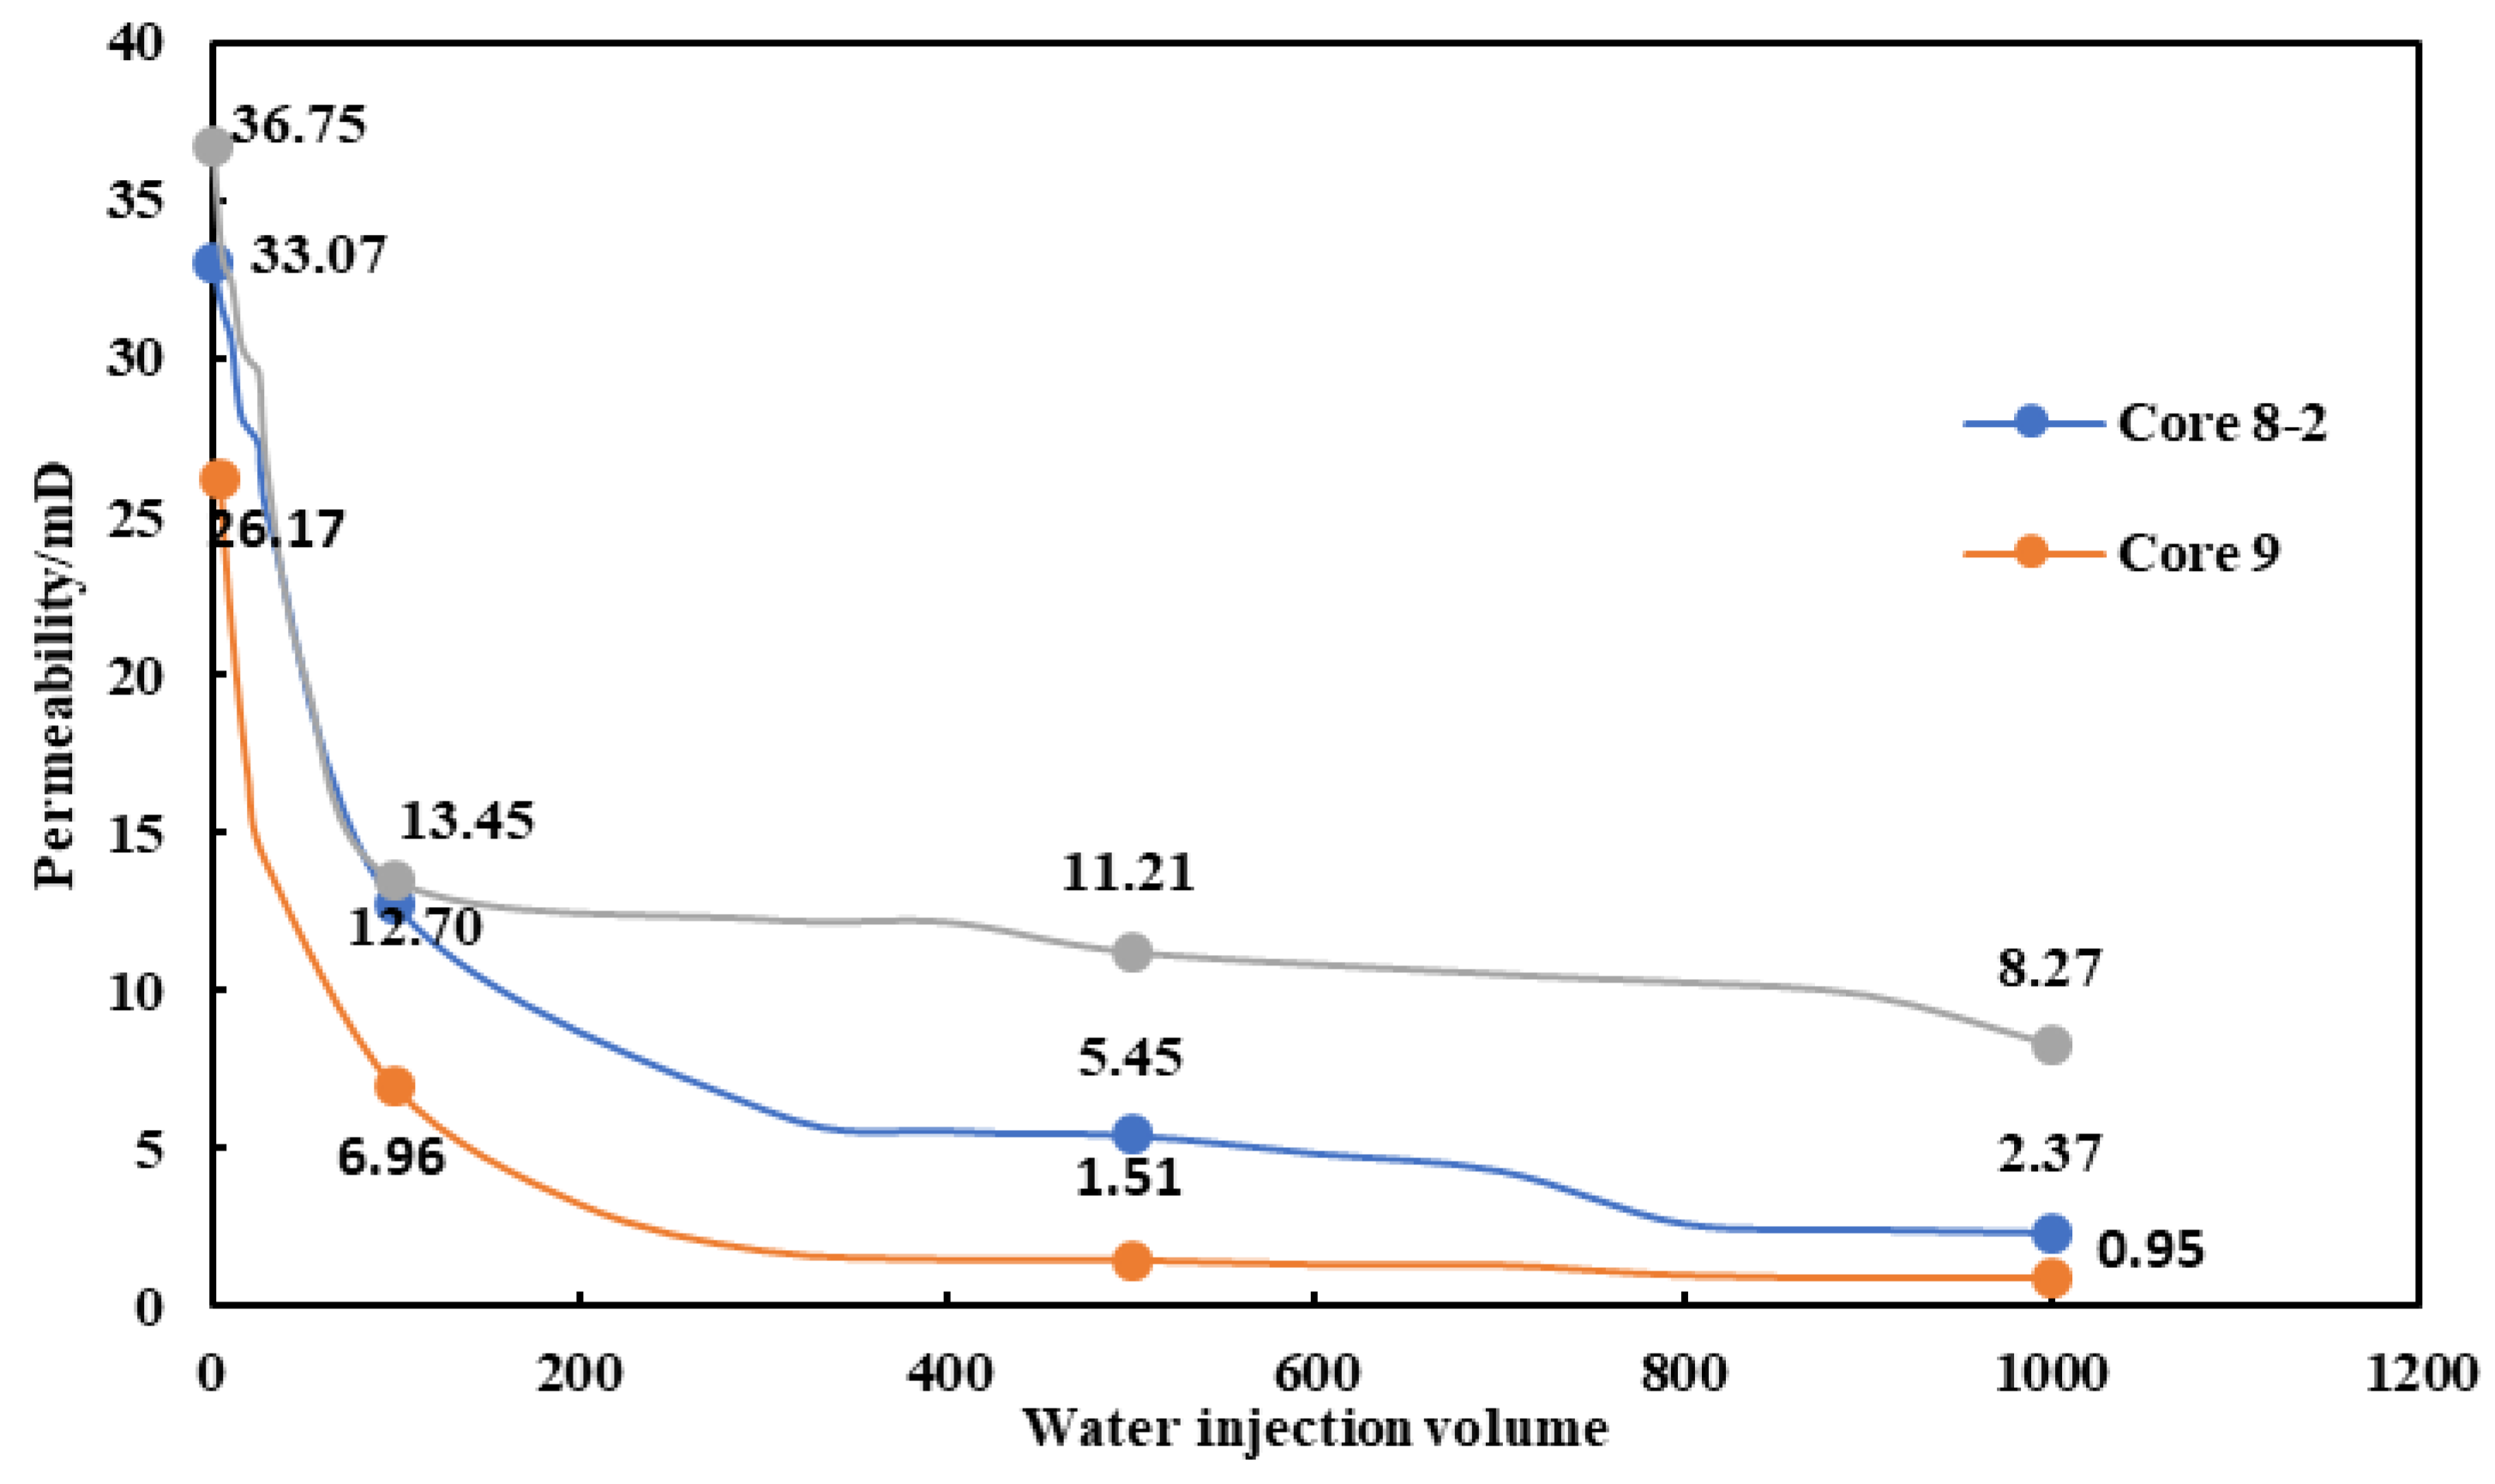
Figure 2 shows the relationship between the cumulative injection rate of the core and the permeability (water). The variation pattern of permeability shows that with the continuous increase in cumulative water injection, the overall permeability shows a downward trend. In the first stage (saturated water state—cumulative water injection of 100 PV), the permeability of the three core water blocks decreased significantly, from 33.07 mD, 26.17 mD, and 36.75 mD to 12.70 mD, 6.96 mD, and 13.45 mD. In the second stage (cumulative water injection of 100–1000 PV), the permeability decreased slightly with the cumulative water injection account increase, and the decrease was 10.33 mD, 6.01 mD, and 5.18 mD, respectively. The reason for this phenomenon is that flowing water transports detached clay minerals and particles, leading to a decrease in core permeability. Low permeability reduces the ability of water to transport clay minerals and particles (low permeability weakens the fluidity of water, and water can transport fewer particles with smaller radii). Therefore, the change pattern of core permeability with water injection rate is that it decreases rapidly in the early stage of water injection, and gradually stabilizes after a slow decrease in the later stage of water injection.
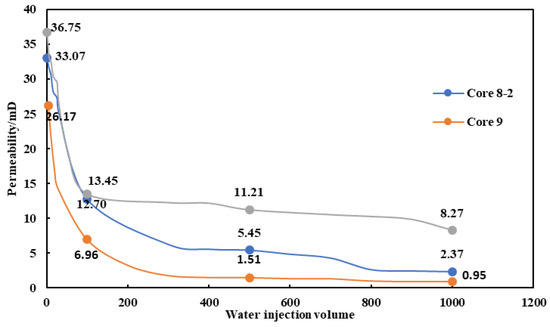
Figure 2.
Curve of water injection volume and permeability.
5. Characteristics of Nuclear Magnetic Reaction under Different Displacement Ratios
5.1. NMR T2 Spectrum Reaction Characteristics
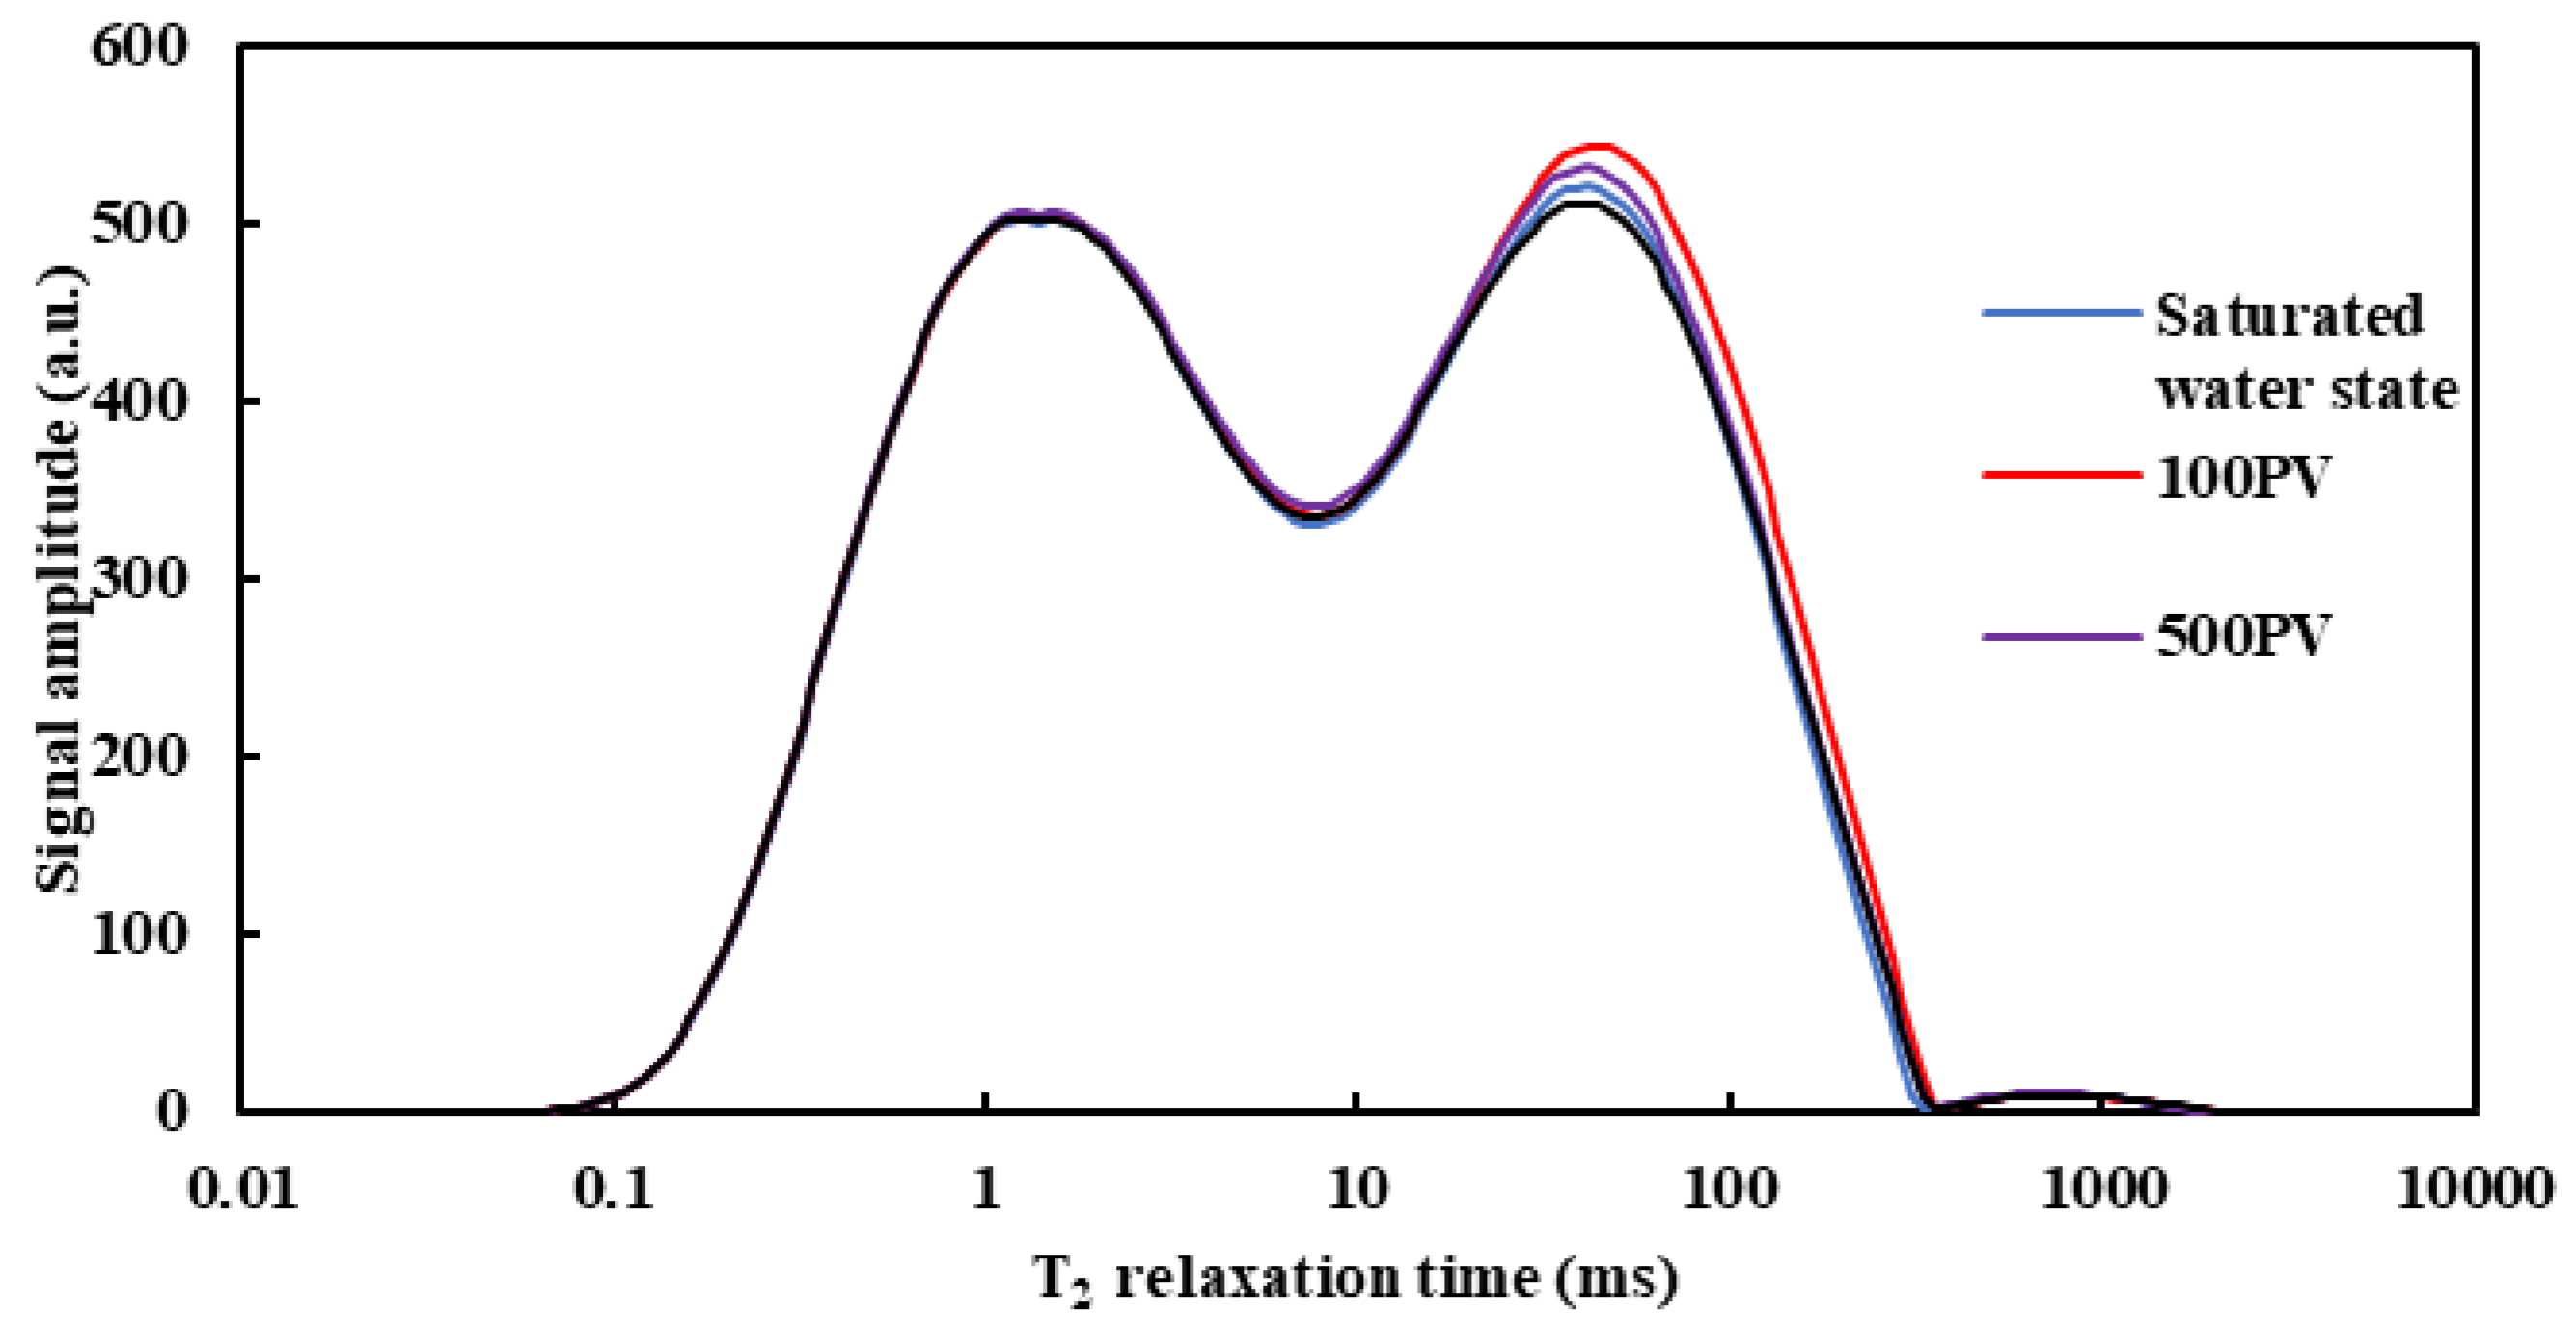
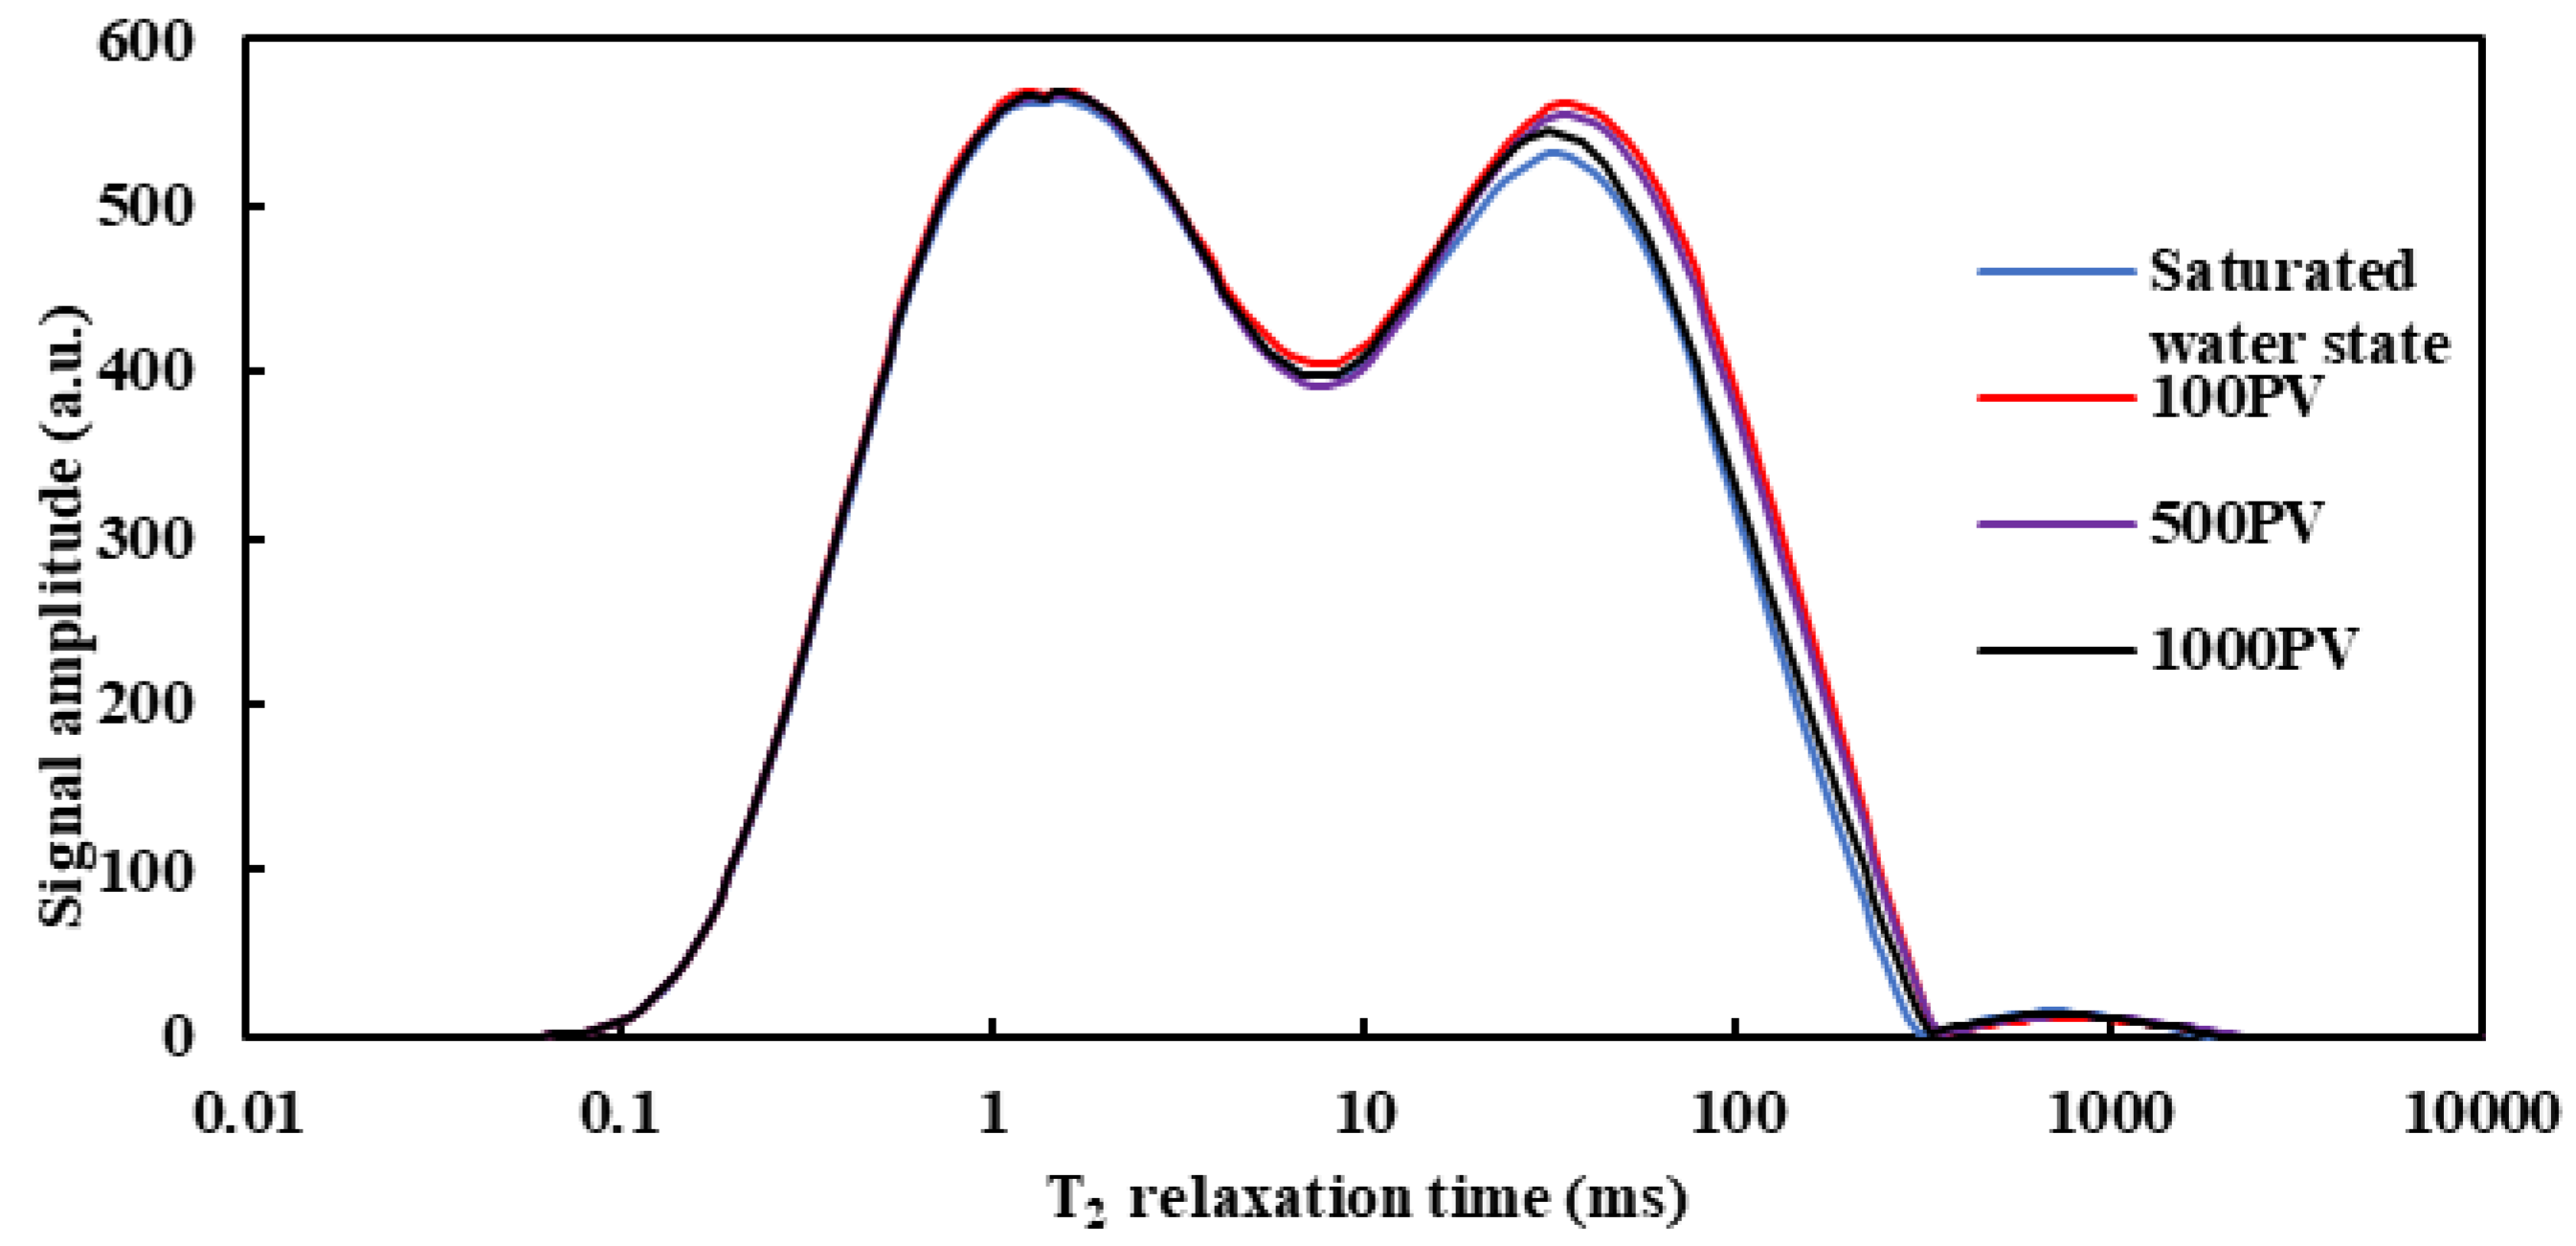
Figure 3 and Figure 4 show the NRM T2 spectra of cores 8-2 and 16-1 at different water injection multiples, respectively. It can be seen that the T2 spectra of the cores are in double-peak state after saturation with water. The left peak is distributed in the small pores (T2 < 10 ms), and the signal intensity does not change with the increasing water injection. The right peak is mainly distributed in medium and large pores (10 ms < T2 < 100 ms, T2 > 100 ms), and the signal intensity increases significantly from the saturated water state to the cumulative water injection volume of 100 PV. During the subsequent continuous water injection process, the signal intensity decreases as the cumulative water injection increases. The right endpoint value in the T2 spectrum and the curves corresponding to the medium and large pores shift to the left. The change law of the nuclear magnetic T2 spectrum under different water injection multiples indicates that during the water injection process, the signal intensity in the small pores changes little because water enters the medium and large pores preferentially, and only a small part of water enters the small pores. The signal intensity in the medium and large pores changes more due to the increased water volume in the core caused by the hydration of clay minerals. Later on, under the effect of continuous water injection scouring, the medium and large pores are blocked due to the shedding and migration of fine silt and clay minerals after expansion, resulting in a decrease in the radius and water content of medium and large pores, so the signal intensity decreases. By comparison, the change law of the T2 spectrum of the two cores is the same as that of the nuclear magnetic porosity, which increases first and then decreases with the increase in cumulative water injection. The main reasons for the decrease in permeability are the hydration of clay minerals, and the shedding, migration, and blocking pores of fine silt and clay minerals after expansion under scouring.
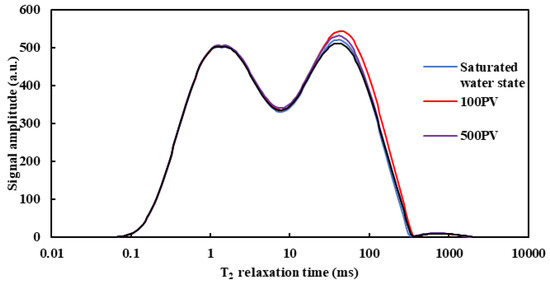
Figure 3.
Core 8-2T2 spectrum.
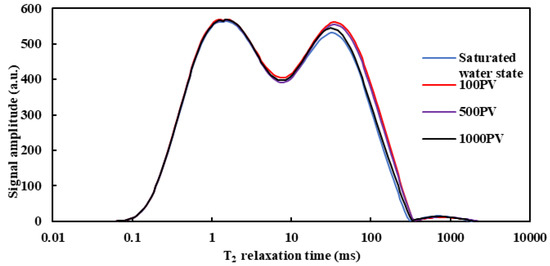
Figure 4.
Core 16-1T2 spectrum.
Figure 5 shows the NMR T2 spectrum of core 9 under different water injection multiples. It can be seen that in the state of cores saturated with water, its T2 spectrum is double-peak. The signal intensity is the highest under conditions in small pores, and the signal intensity decreases from the saturated water state to the cumulative water injection volume of 100 PV. The signal intensity remains unchanged basically during the subsequent continuous water injection process. The signal intensity in medium and large pores decreases first and then increases with the increase in water injection volume. The signal intensity decreases from the saturated water state to the cumulative water injection volume of 100 PV and gradually increases during the subsequent water injection process. The change law of the NMR T2 spectrum under different water injection multiples shows that in the first stage (saturated water state—cumulative water injection volume of 100 PV), due to the high content of clay minerals in the core (up to 4.76%), the volume of clay minerals becomes larger after water swelling during water injection, leading to the reduction of pore volume, water content in pores, and signal intensity; In the second stage (cumulative water injection volume of 100–1000 PV), with the continuous increase in cumulative water injection, the clay minerals and particles that fall off after water swelling migrate (migrate to the outlet section), resulting in an increase in water volume in this range, an increase in the signal intensity, and a right shift in the corresponding curve. The change law of the T2 spectrum is consistent with the trend of nuclear magnetic porosity.
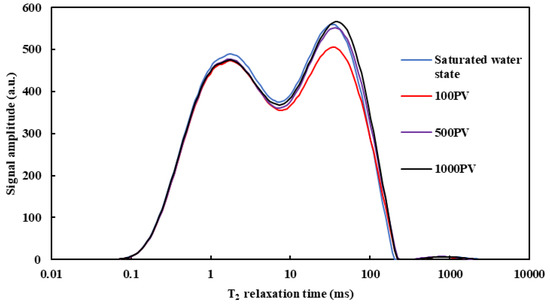
Figure 5.
Core 9T2 spectrum.
5.2. Characteristics of Two-Dimensional Nuclear Magnetic Reaction in Rock Cores
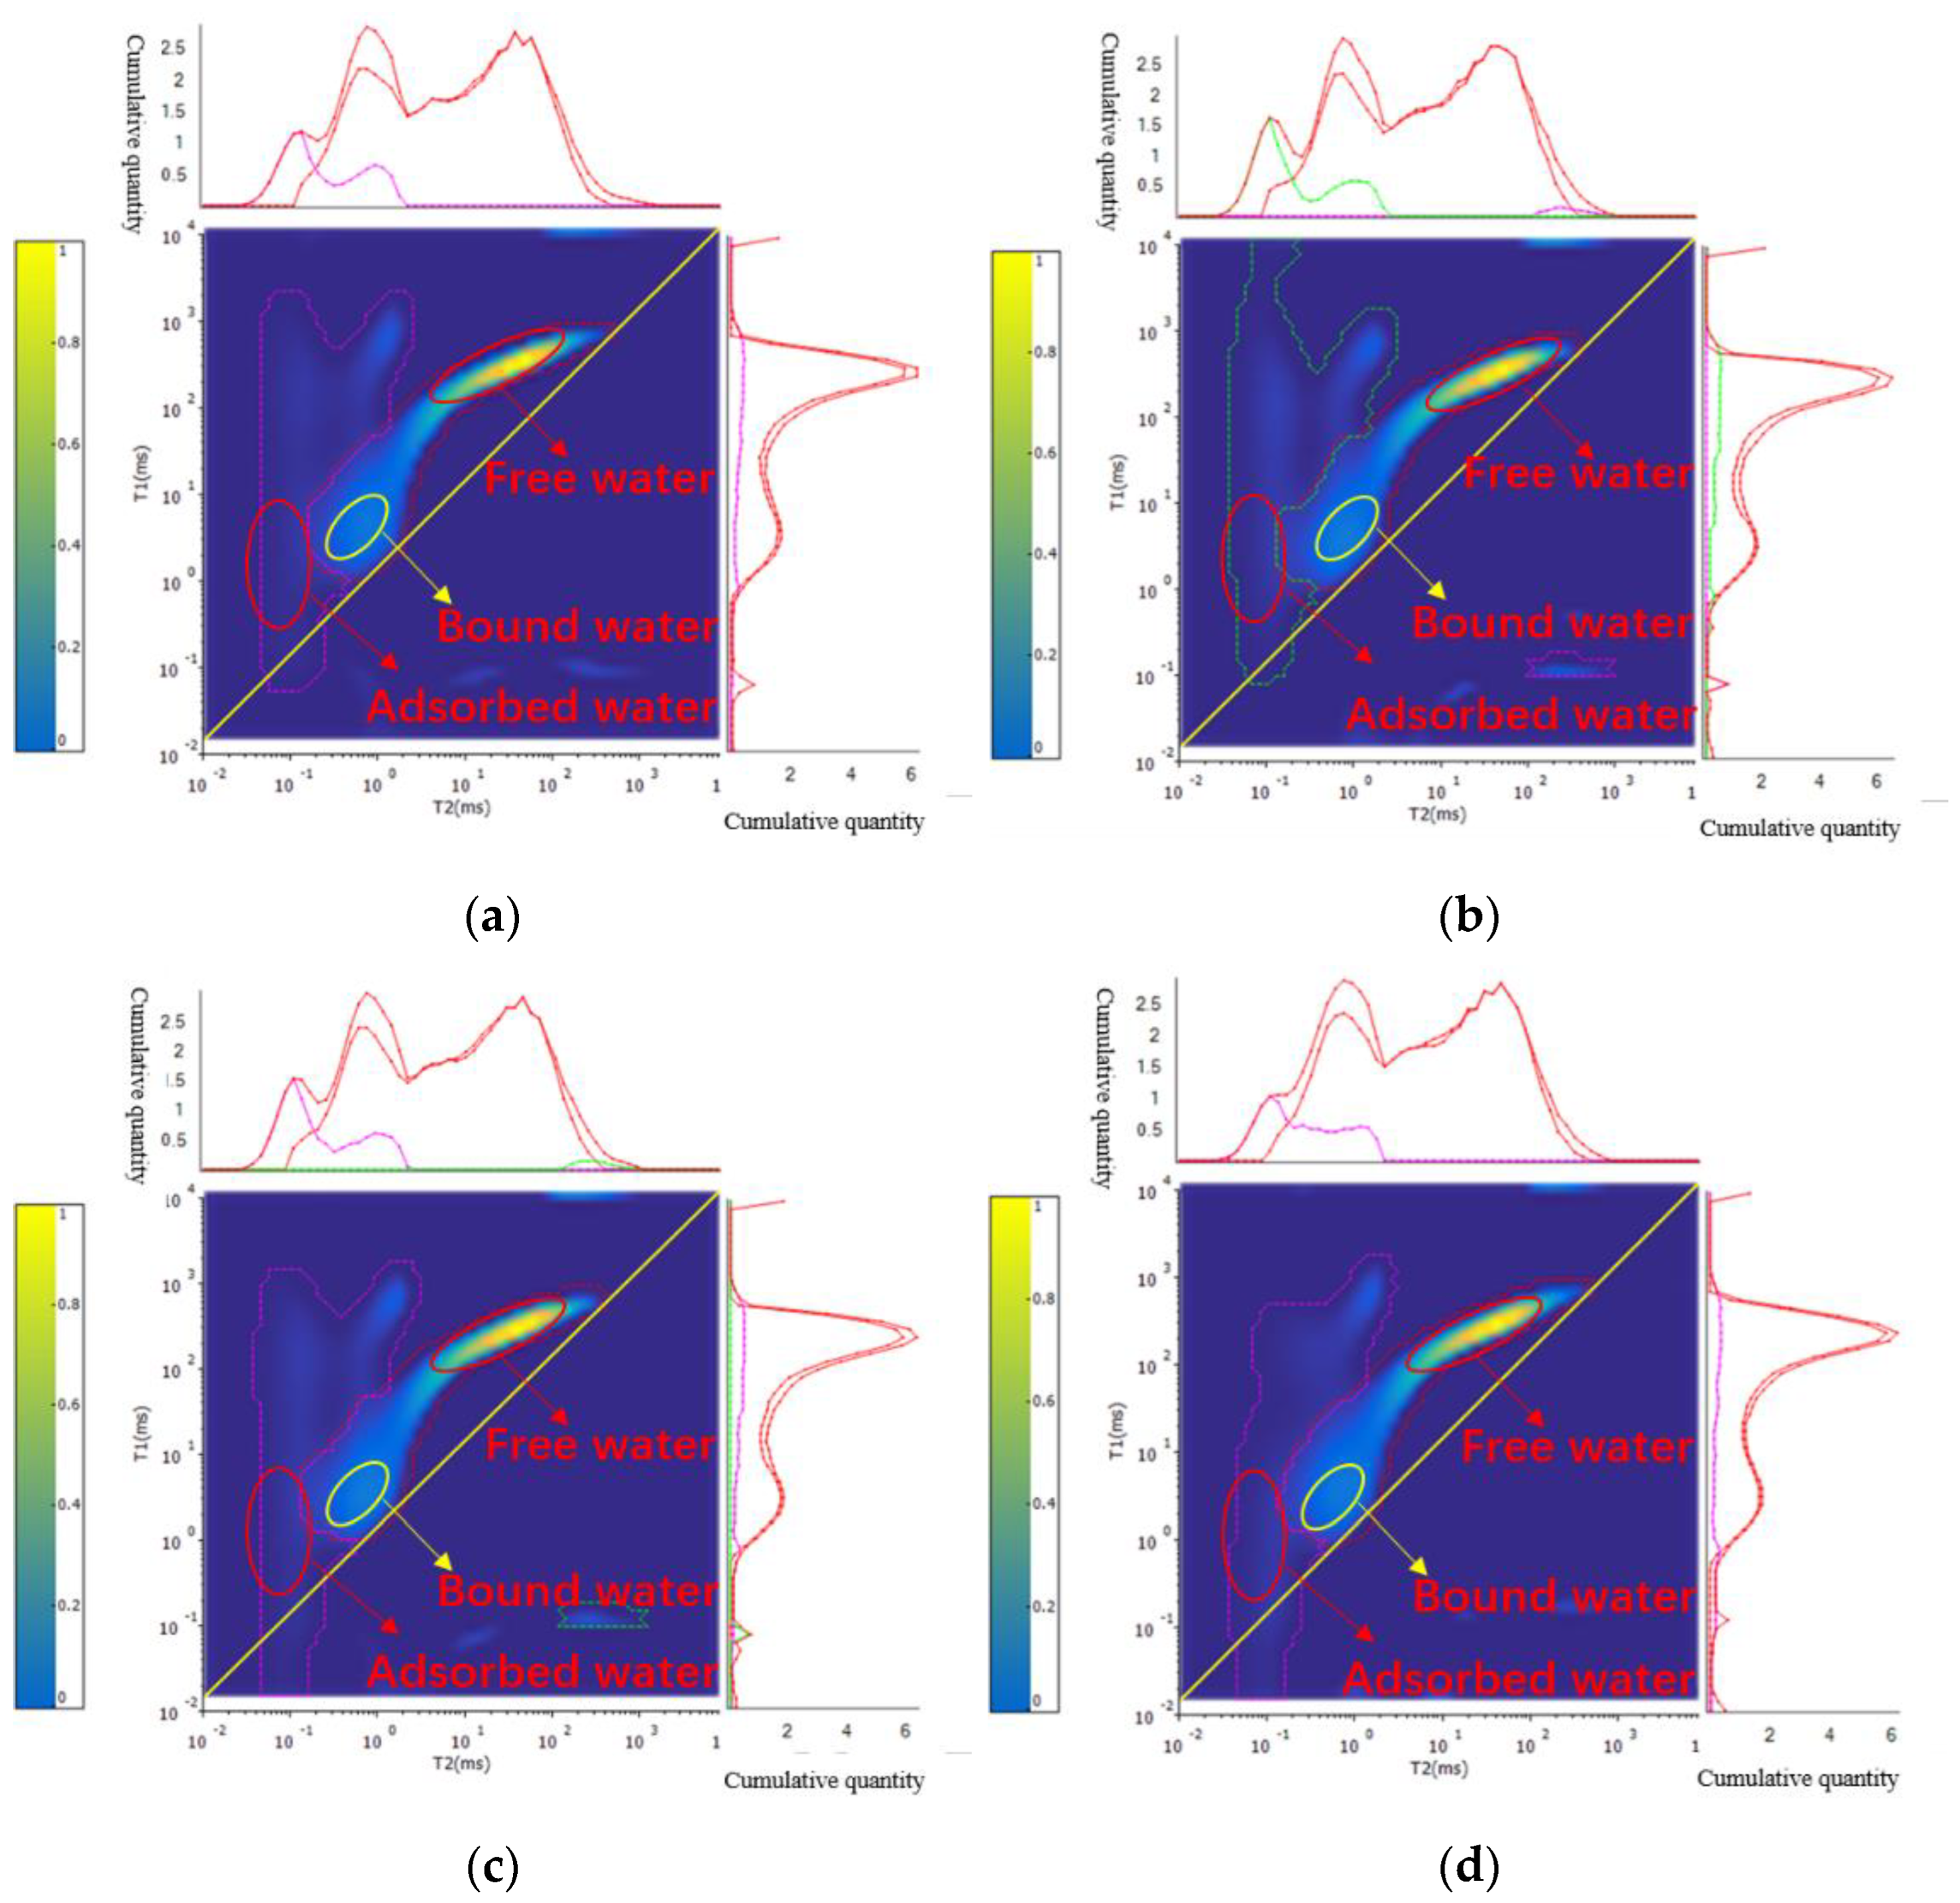
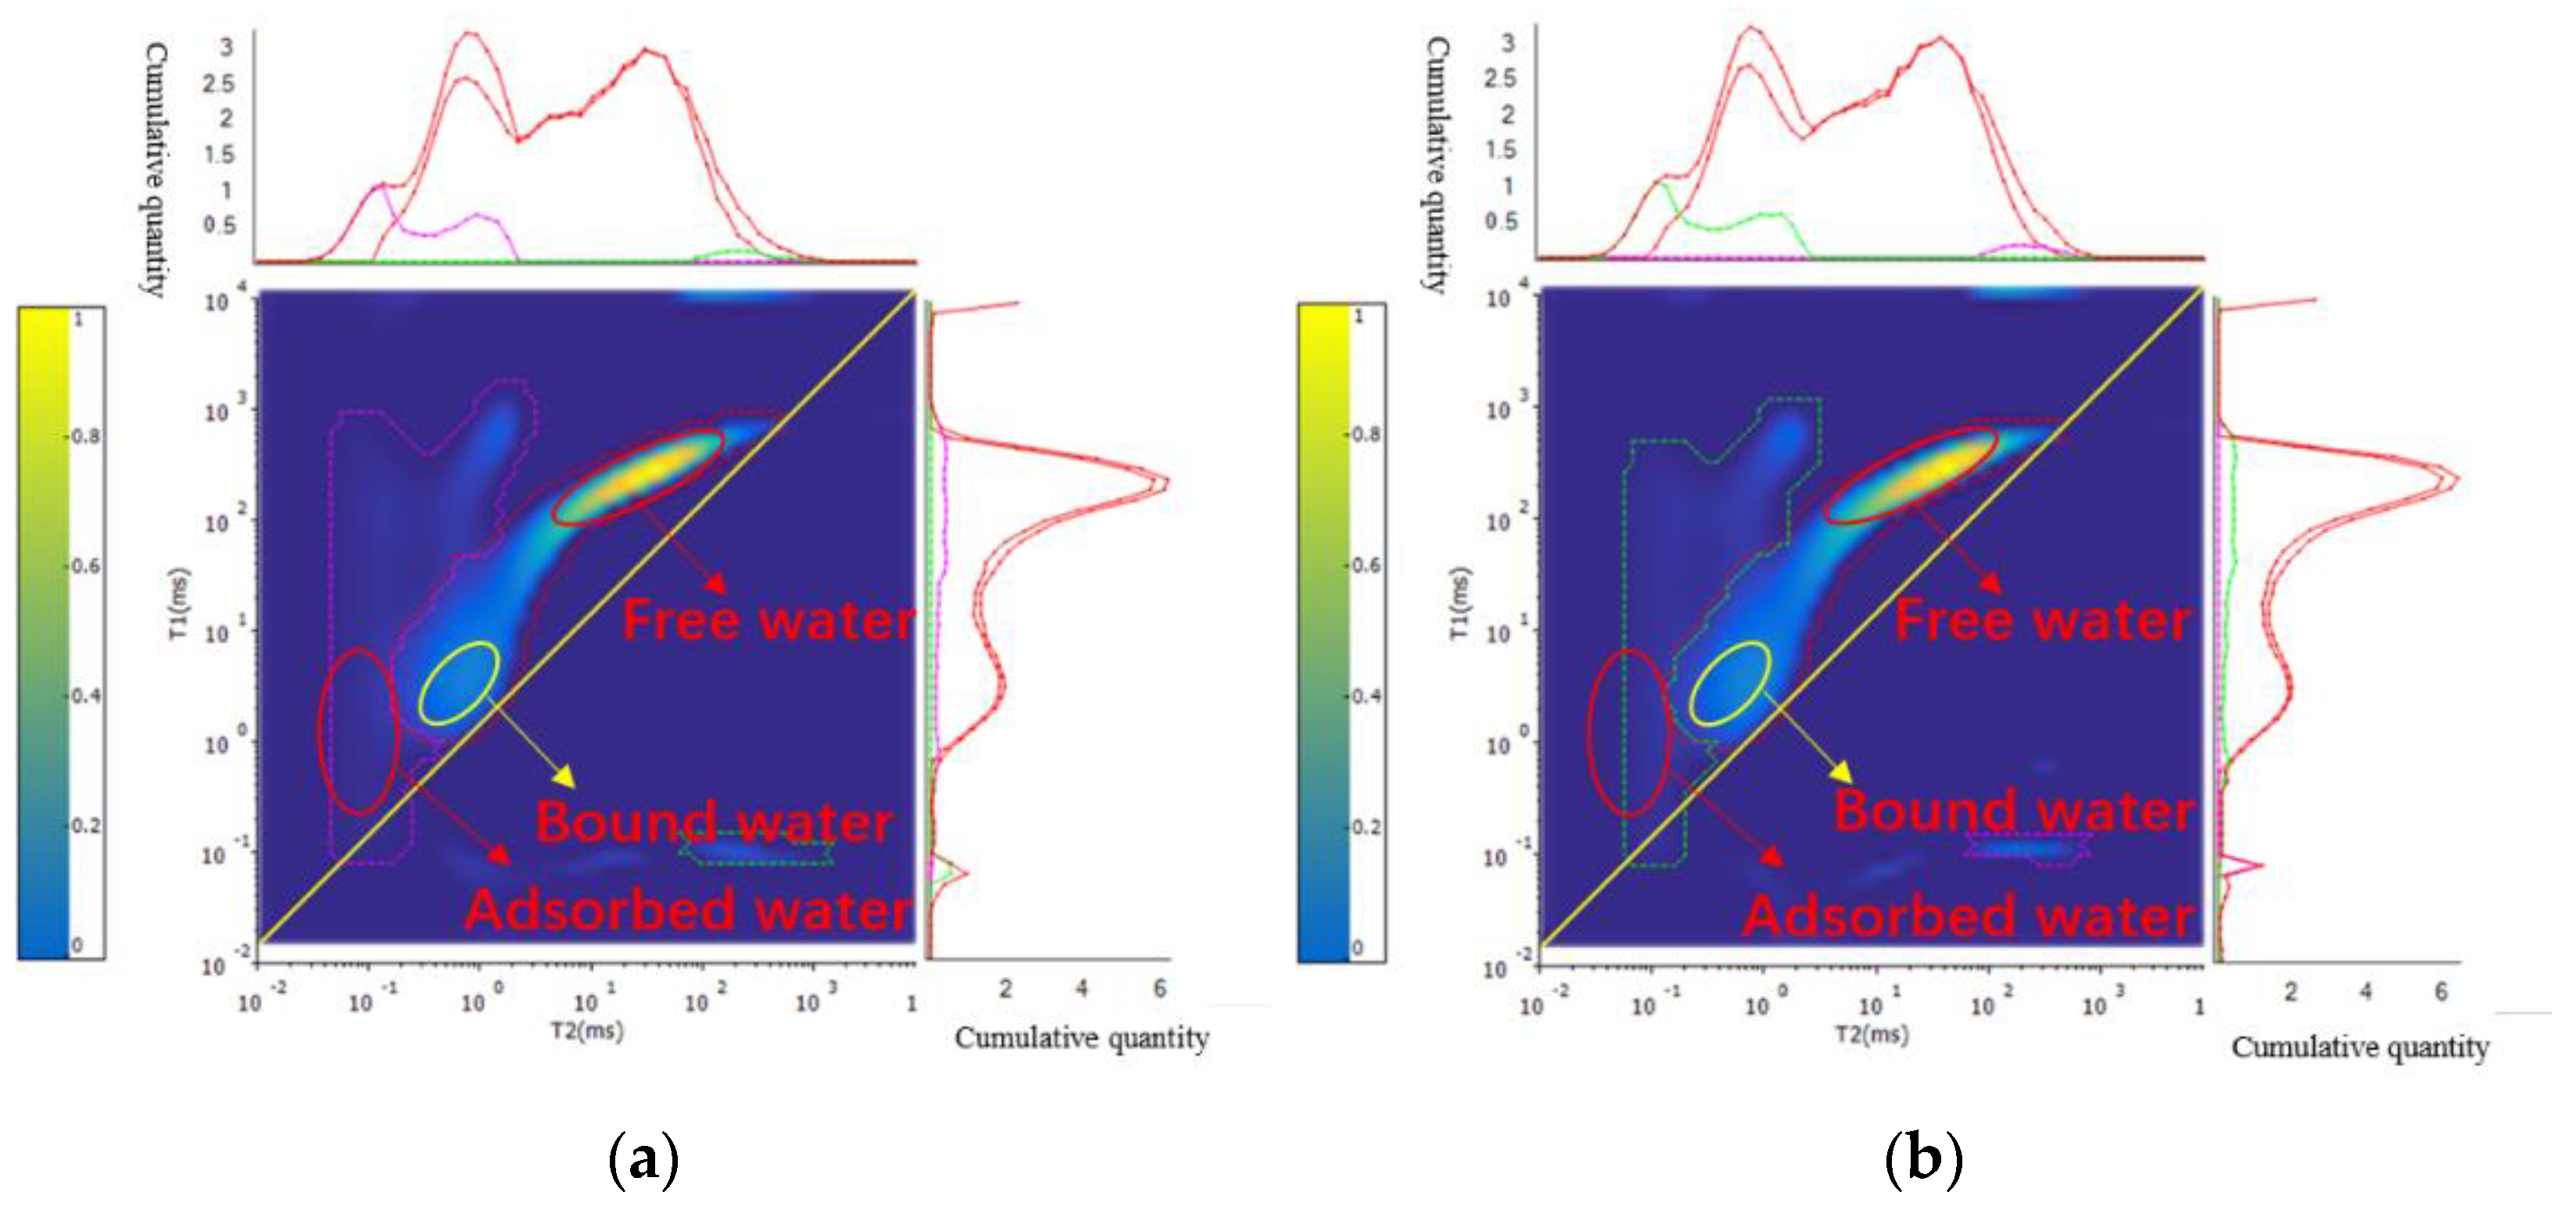
Figure 6 and Figure 7 show the two-dimensional NMR spectra of cores 8-2 and 16-1 under different injection multiples. As this experiment is a high-injection-rate experiment, the fluid signal is not clearly reflected in the two-dimensional nuclear magnetic resonance spectra. Therefore, this article quantifies the different fluid signal intensities, as shown in Table 4. It can be seen that during the water injection process, the signal intensity of adsorbed water and bound water continuously increases, while the signal intensity of free water first increases and then decreases. The reason for this phenomenon is that the injected water enters the pores in the early stage and undergoes weak hydration with clay minerals, and the particles in the medium and large pores migrate (to the outlet section or small pores) under the action of water flow, leading to an increase in the volume of free water in the medium and large pores, resulting in an increase in signal strength. Additionally, the presence of foreign particles in the small pores increases the signal strength of adsorbed water and bound water content. With the continuous increase in accumulated water injection in the later stage, a large amount of clay minerals in the pores fall off after water absorption and expansion, as well as the migration of fine silt, which has a certain blocking effect on the pore throat. This leads to a decrease in the content of free water in the medium and large pores, and a gradual decrease in signal strength. Due to the blockage of the pore throat, the fluidity of the rock core water decreases and the nonflowing water content increases, resulting in an increase in the water content adsorbed on the clay minerals. Therefore, the adsorbed water and the binding water signal intensity continues to increase.
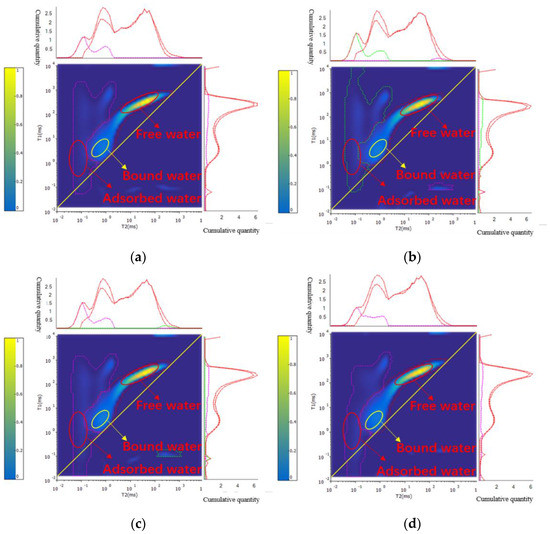
Figure 6.
Core 8-2 NMR 2D spectra. (a) Saturated water state; (b) water injection of 100 PV; (c) water injection of 500 PV; (d) water injection of 1000 PV.
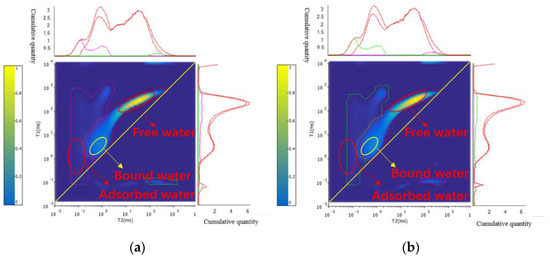
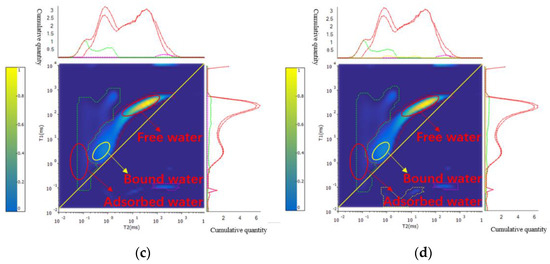
Figure 7.
Core 16-1 NMR 2D spectra. (a) Saturated water state; (b) water injection of 100 PV; (c) water injection of 500 PV; (d) water injection of 1000 PV.
Table 4.
Signal intensities of different fluids in rock cores.
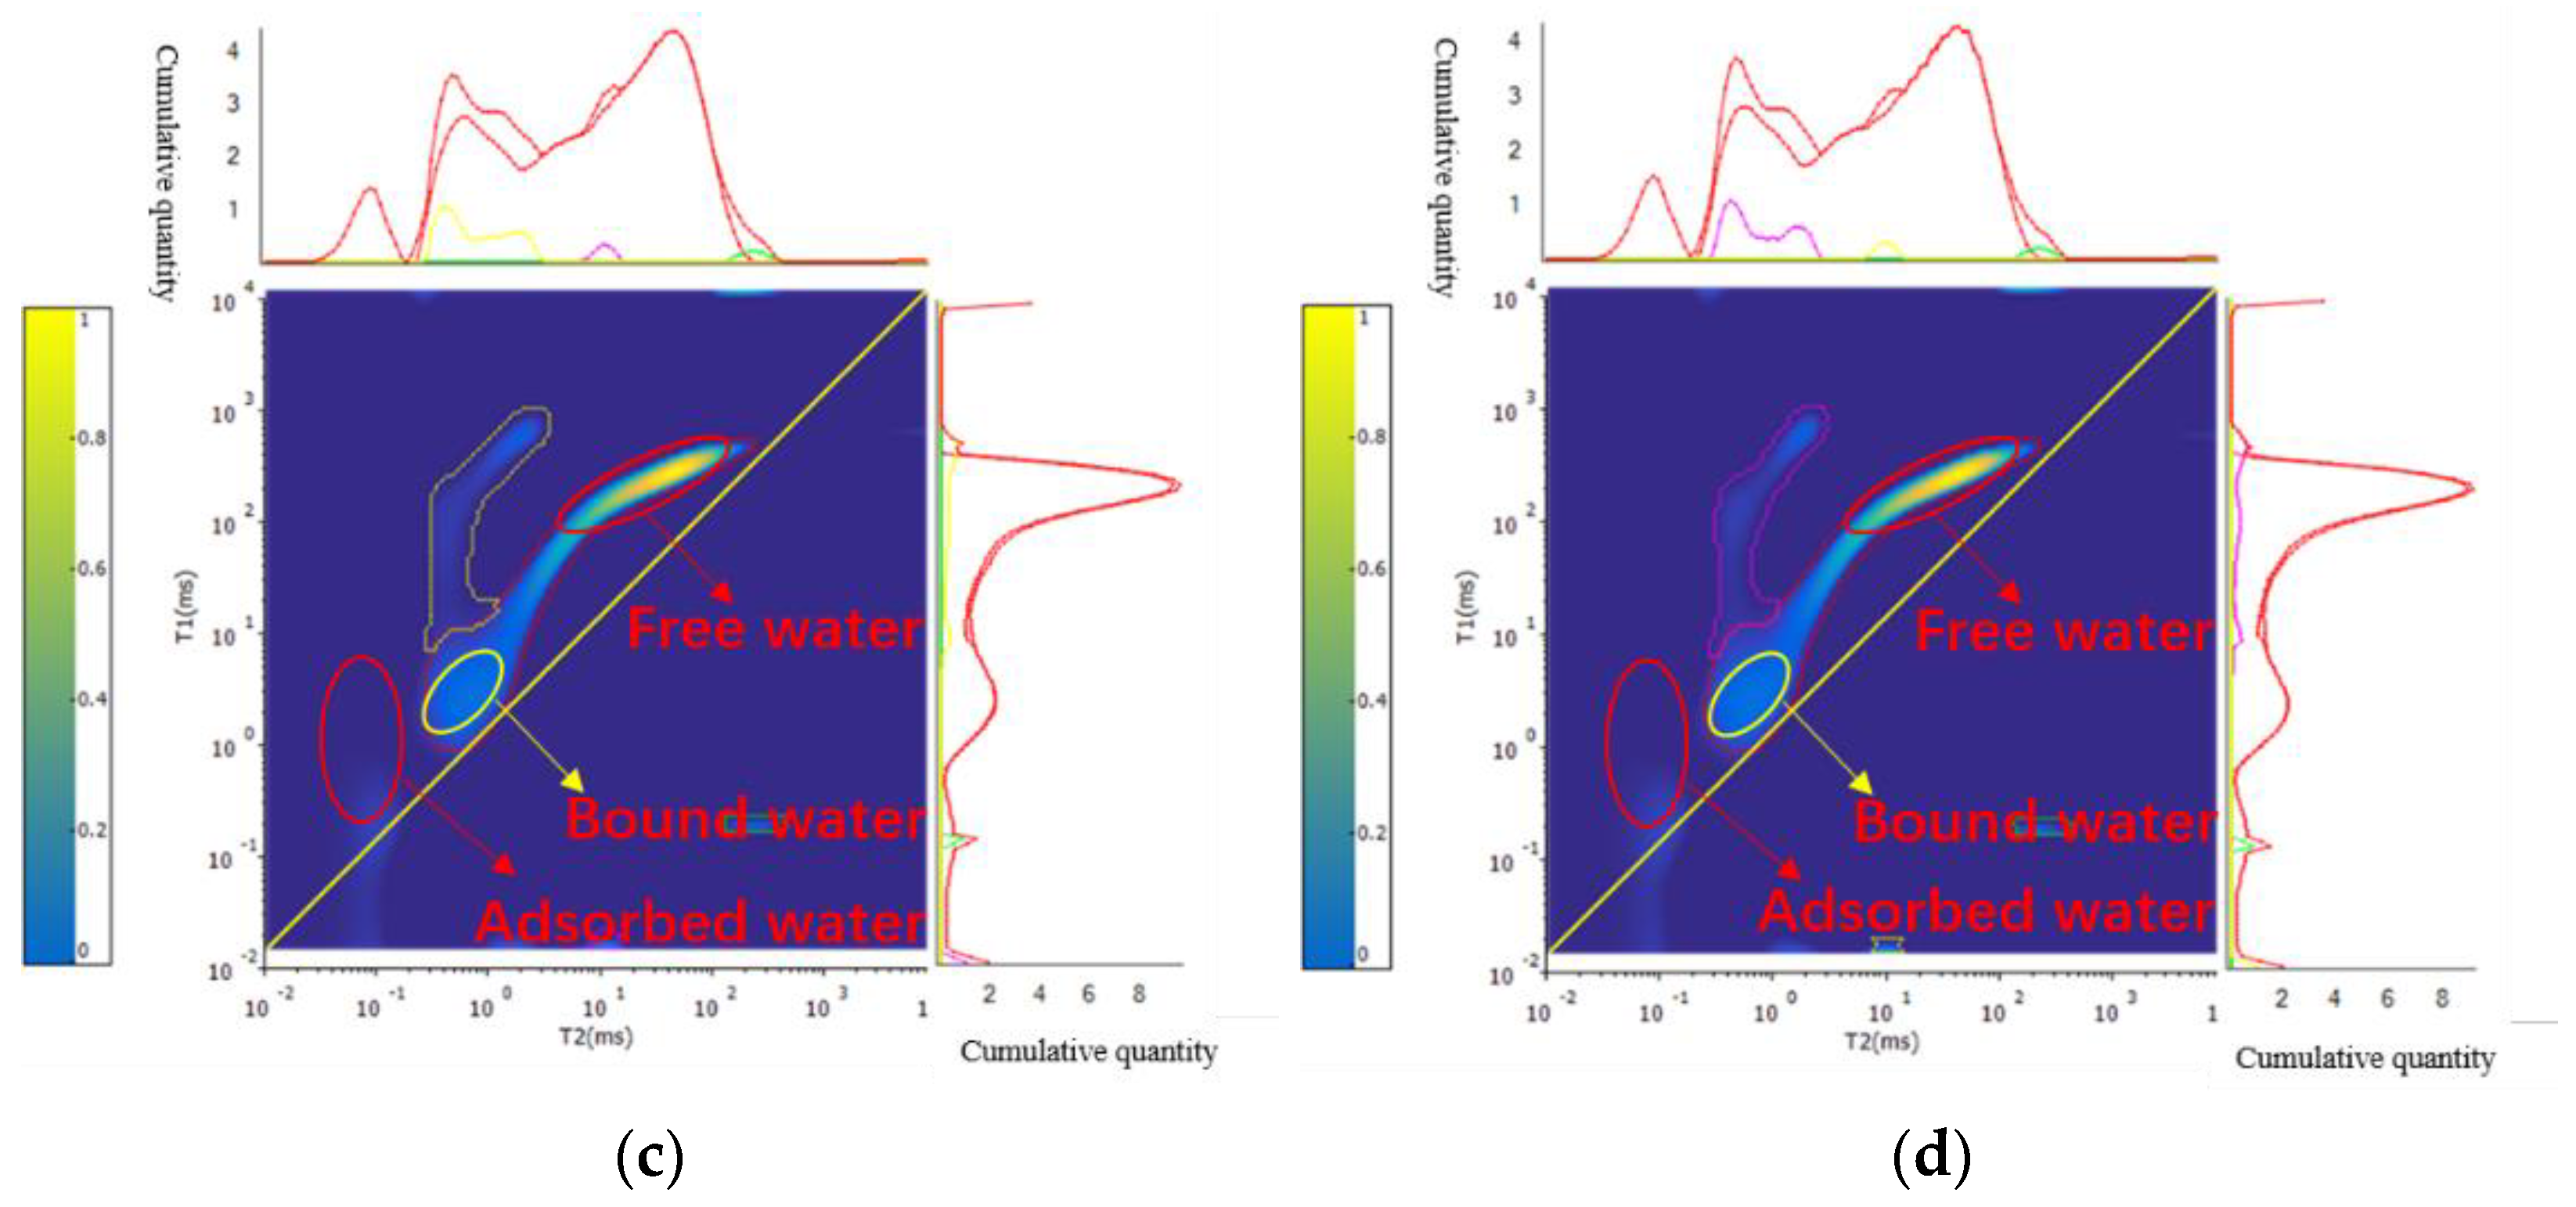
Figure 8 shows the two-dimensional NMR spectrum of core 9 under different injection multiples. When the saturated water state reaches a cumulative injection of 100 PV, the free water signal in the graph becomes significantly brighter. There is basically no significant change in the two-dimensional NMR spectrum from the cumulative injection of 100 PV to 1000 PV. The corresponding quantified signal intensity is shown in Table 4. In the first stage (saturated water state—cumulative water injection volume of 100 PV), due to the fact that the clay minerals and fine sand in this core account for more than the other two cores, and the proportion of fine sand is as high as 23.122%, this process mainly involves the increase in volume of clay minerals after water absorption and expansion, as well as the migration of fine sand under the action of water. The migration occurs at this point in the pore channel, where clay minerals and particles occupy a certain volume in the pores. This leads to a decrease in the proportion of fluid volume in the pores, resulting in a decrease in the signal strength of adsorbed water, bound water, and free water. In the second stage (with a cumulative water injection volume of 100–1000 PV), this process continues to increase with the continuous increase in water injection. The expanded clay minerals continue to absorb water and then fall off. The detached clay minerals and particles (fine sand) migrate (to the outlet end) under the continuous action of water flow, resulting in a decrease in the proportion of clay mineral particles in the pores and an increase in the fluid content in the pores, resulting in adsorbed water and bound water, and the signal strength of free water gradually increases.
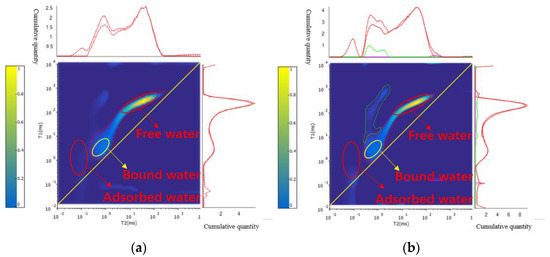

Figure 8.
Core 9 NMR 2D spectra. (a) Saturated water state; (b) water injection of 100 PV; (c) water injection of 500 PV; (d) water injection of 1000 PV.
6. Conclusions
- (1)
- The target block belongs to a medium–low-permeability reservoir. Through the analysis of the X-ray diffraction mineral and laser particle size of the cores, it is known that the target cores 8-2, 16-1, and 9 have clay minerals accounting for 2.41%, 2.57%, and 4.76%, respectively. The three cores are, respectively, classified as medium sandy fine sandstone containing silt, medium sandy fine sandstone containing silt, and silt fine sandstone. They are subject to long-term water flooding in the later stage of production, and fine silt particles and clay minerals in cement easily fall off and migrate.
- (2)
- During the high-magnification water injection experiment, the nuclear magnetic porosity and NRM T2 spectrum of the three cores changed consistently with the increase in water injection volume, and the permeability decreased rapidly in the early stage and less so in the later stage in the process of the continuous water injection. This is the main reason for the increased water injection pressure and difficulty in water injection in the target block (a block is a larger development unit in oilfield development, usually a relatively independent area of an oil reservoir or oilfield, separated by geological boundaries, or a part of a large oil reservoir that has a relatively concentrated production time due to step-by-step development; it can also be an independent oil reservoir) during the water injection process.
- (3)
- Through the analysis of nuclear magnetic porosity, T2 spectrum, and two-dimensional NMR maps at different water injection multiples during the water injection process, it is believed that the hydration of clay minerals occurred in the early water injection process. With the continuous scouring of the injected water, the particles of fine silt and clay minerals fall off due to water swelling and then migrate to the throat to produce precipitation and blockage, resulting in the reduction of permeability.
Author Contributions
Conceptualization, J.Y. and C.C.; methodology, Z.W.; software, X.M.; validation, J.Y., C.C. and Z.W.; formal analysis, M.J.; investigation, J.Y.; resources, M.J.; data curation, C.C.; writing—original draft preparation, J.Y.; writing—review and editing, J.Y.; visualization, X.M.; supervision, C.C.; project administration, M.J.; funding acquisition, C.C. All authors have read and agreed to the published version of the manuscript.
Funding
This research received no external funding.
Data Availability Statement
No new data were created or analyzed in this study. Data sharing is not applicable to this article.
Acknowledgments
This research is financially sponsored by the National Natural Science Foundation of China (No. 51974343).
Conflicts of Interest
The authors declare no conflict of interest.
References
- Pini, R.; Benson, S.M. Characterization and scaling of mesoscale heterogeneities in sandstones. Geophys. Res. Lett. 2013, 40, 3903–3908. [Google Scholar] [CrossRef]
- Colombera, L.; Mountney, N.P.; Medici, G.; West, L.J. The geometry of fluvial channel bodies: Empirical characterization and implications for object-based models of the subsurface. AAPG Bull. 2019, 103, 905–929. [Google Scholar] [CrossRef]
- Priisholm, S.; Nielsen, B.L.; Haslund, O. Fines migration, blocking, and clay swelling of potential geothermal sandstone reservoirs, Denmark. SPE Form. Eval. 1987, 2, 168–178. [Google Scholar] [CrossRef]
- Baudracco, J. Variations in permeability and fine particle migrations in unconsolidated sandstones submitted to saline circulations. Geothermics 1990, 19, 213–221. [Google Scholar] [CrossRef]
- Baudracco, J.; Aoubouazza, M. Permeability variations in Berea and Vosges sandstone submitted to cyclic temperature percolation of saline fluids. Geothermics 1995, 24, 661–677. [Google Scholar] [CrossRef]
- Jing, M.X.; Luo, L.Q. Experimental judgment of particle migration in reservoirs. Nat. Gas Explor. Dev. 2005, 2, 50–53+2. [Google Scholar]
- Li, X.R.; Yang, L.H.; Li, D.J.; Yao, Y. Experimental study on particle migration caused by water injection in Xifeng Oilfield. Fault Block Oil Gas Field 2008, 2, 81–82. [Google Scholar]
- You, Z.; Badalyan, A.; Yang, Y.; Bedrikovetsky, P. Hand, Fines migration in geothermal reservoirs: Laboratory and mathematical modelling. Geothermics 2019, 77, 344–367. [Google Scholar] [CrossRef]
- Cui, C.Z.; Wei, Z.J.; Liu, L.J.; Li, X.J.; Peng, L.L. The mechanism of particle transport and its development effect in low salinity water flooding. J. Eng. Sci. 2019, 41, 719–730. [Google Scholar] [CrossRef]
- Li, L.; Sun, J.; Chen, W.H.; Liu, Q.; Shu, G. Study on the mechanism of particle migration damage in Permian basalt reservoirs in the Sichuan Basin. Henan Sci. 2021, 39, 403–411. [Google Scholar]
- Luo, C.Q. The impact of clay minerals and formation particles on the development of low permeability oilfields. Today Keyuan 2010, 18, 77–78+80. [Google Scholar]
- Li, L.; Jun, B.S.; Jiang, H.Y.; Di, P. Reservoir particle migration and its impact on reservoir physical properties. Zhongguo Energy 2011, 16, 50–54. [Google Scholar]
- Dong, Y.W. Study on the Microscopic Mechanism of Reservoir Damage during the Production Process of Low Permeability Sandstone Reservoirs. Master’s Thesis, Changjiang University, Wuhan, China, 2021. [Google Scholar] [CrossRef]
- An, S. Experimental Study on the Influence of Clay Mineral Types and Content on Nuclear Magnetic Resonance Measurement. Master’s Thesis, China University of Petroleum (Beijing), Beijing, China, 2009. [Google Scholar]
- Xie, R.H.; Xiao, L.Z.; Zhao, T.P. Research on standard samples for nuclear magnetic resonance core experimental analysis. Nucl. Electron. Detect. Technol. 2007, 194–198+206. [Google Scholar]
- Wu, Y.L.; Wang, C.S.; Kang, L.; Ao, W.J.; Tian, J.J.; Fu, Y.C.; Sun, J. Study of High magnification Water Drive Characteristics Using Nuclear Magnetic Resonance Technology. Petrochem. Appl. 2019, 38, 15–19+35. [Google Scholar]
- Di, Q.F.; Hua, S.; Guo, C.Y.; Ye, F.; Pang, D.S.; Jiang, F.; Yang, P.Q. Nuclear magnetic resonance visualization of core micro flow. Exp. Fluid Mech. 2016, 30, 98–103. [Google Scholar]
- Qu, Y.T.; Jiang, Z.M.; Shi, J.S.; Zhu, T.T.; Meng, X.H.; Wang, W.M. Nuclear magnetic resonance two-dimensional spectroscopy study of water flooding process. J. Spectrosc. 2012, 29, 51–59. [Google Scholar]
- Ding, B.; Luo, J.H.; Geng, X.F.; Jia, C.; He, L.P.; Wang, P.M.; Peng, B.L. Research on the “visualization” evaluation method of fluid in core based on low field nuclear magnetic resonance technology. Oilfield Chem. 2018, 35, 170–175. [Google Scholar] [CrossRef]
- Liu, X.J.; Wang, Z.L.; Li, G.R.; Wen, X.F.; Wu, J.H.; Zhao, B.H. Research on quantitative identification method of low-permeability flooded layer based on nuclear magnetic resonance logging. Prog. Geophys. 2021, 36, 618–624. [Google Scholar]
- Cheng, Y.C. Visualization of Fluid Distribution in Core Based on Low Field Nuclear Magnetic Resonance Imaging Technology. Master’s Thesis, Shanghai University, Shanghai, China, 2014. [Google Scholar]
- Zou, C.N.; Zhu, R.K.; Bai, B.; Yang, Z.; Wu, S.T.; Su, L.; Dong, D.Z.; Li, X.J. The first discovery of nanopores in oil and gas reservoirs in China and its scientific value. J. Petrol. 2011, 27, 1857–1864. [Google Scholar]
- Li, Z.Q.; Sun, Y.; Hu, R.L.; Zhao, Y.; Peng, Y. Research on structural characteristics of shale nano pores based on nuclear magnetic resonance. J. Eng. Geol. 2018, 26, 758–766. [Google Scholar] [CrossRef]
- Han, W.X.; Gao, C.H.; Han, X. The Application of Nuclear Magnetic Resonance and Micro/Nano CT Techniques in the Study of Tight Reservoirs: Taking the Chang 7 Member of the Ordos Basin as an Example. Fault Block Oil Gas Field. 2015, 22, 62–66. [Google Scholar]
- Xu, Z.X.; Guo, S.B. Research on pore structure of shale reservoirs based on NMR and X-CT. Prog. Earth Sci. 2014, 29, 624–631. [Google Scholar]
- Zhang, C.L. Research on T2 Cut-Off Value of NMR Logging Rock Experiment and Application of Reservoir Evaluation. Master’s Thesis, Yangtze University, Jingzhou, China, 2016. [Google Scholar]
- Wu, C.H.; Zhao, X.S. Determination of nuclear magnetic resonance T2 cutoff value and lower limit of movable fluid throat in tight sandstone reservoirs: Taking the Wucangbao Lower Combination Chang 9 Reservoir as an example. Unconv. Oil Gas 2017, 4, 91–94+102. [Google Scholar]
- Kleinberg, R.; Vinegar, H.J. NMR properties of reservoir fluids. Log. Anal. 1996, 37, 20–32. [Google Scholar]
- Gong, G.; Sun, B.; Liu, M.L.; Ye, C.H.; Gao, B.J. NMR relaxation of the fluid in rock porous media. Chin. J. Magn. Reson. 1996, 23, 380–394. [Google Scholar]
- Williams, J.L.A.; Taylor, D.G.; Maddinelli, G.; Enwere, P.; Archer, J.S. Visualisation of fluid displacement in rock cores by NMR imaging. Magn. Reson. Imaging 1911, 9, 767–773. [Google Scholar] [CrossRef]
- Gleeson, J.W.; Woessner, D.E.; Jordan, C.F., Jr. NMR imaging of pore structures in limestones. SPE Form. Evalu. 1993, 8, 123–127. [Google Scholar] [CrossRef]
- Cowan, B. Nuclear Magnetic Resonance and Relaxation; Cambridge University Press: Cambridge, UK, 1997. [Google Scholar]
- Yao, Y.B.; Liu, D.M. Physical and fluid characterization of coal reservoir rocks based on nuclear magnetic resonance relaxation spectroscopy. Coal Sci. Technol. 2016, 44, 14–22. [Google Scholar] [CrossRef]


Disclaimer/Publisher’s Note: The statements, opinions and data contained in all publications are solely those of the individual author(s) and contributor(s) and not of MDPI and/or the editor(s). MDPI and/or the editor(s) disclaim responsibility for any injury to people or property resulting from any ideas, methods, instructions or products referred to in the content. |
© 2023 by the authors. Licensee MDPI, Basel, Switzerland. This article is an open access article distributed under the terms and conditions of the Creative Commons Attribution (CC BY) license (https://creativecommons.org/licenses/by/4.0/).