Abstract
For multi-modular nuclear power plants under the scheme of multiple nuclear steam supply system (NSSS) modules driving a single steam turbine, the NSSS modules are coupled tightly with each other by the common turbine, giving more complex normal operation with respect to the single-modular plants. To limit the operation cost of multi-modular plants, one operator is assigned to monitor and control two or more modules, whose feasibility should be verified. Combined with the characteristics of multi-module control rooms and multi-module running tasks, this paper designs a comprehensive situation awareness measurement method that combines SART, NASA-TLX (NASA Task Load Index), and eye movement tracking methods. The SART, NASA-TLX, and gaze entropy are adopted to measure the operators’ SA, and a series of accident handling experiments are performed on a full-scale simulator to gain enough data for analysis. The operators’ eye trajectories on the human–machine interface (HMI) during the experiments are all recorded for calculating the gaze entropy. Both the SART and NASA-TLX scales are filled by the operators after finishing the experiments. The experiment results show that the difference in operators’ workload and SA amongst all the experimental scenarios is limited, even between the toughest and tenderest scenarios, indicating the feasibility of one operator driving two NSSS modules simultaneously.
1. Introduction
During the operation of a nuclear power plant, the situation awareness of operators has a great influence on the safe, reliable, and efficient operation of the plant. Failure to correctly complete subsequent complex behaviors due to loss of situation awareness (LSA) may lead to disastrous consequences. For example, in the accident at Three Mile Island Nuclear Power Plant [1], the operator failed to maintain a correct understanding of the status of the primary circuit, leading to disastrous consequences. Endsely reports that 88% of human errors are caused by situation awareness [2]. In a nuclear power plant, if the operator’s situation awareness is improved, the human errors that cause accidents can be reduced.
So far, there are many methods to measure the level of situation awareness. Salmon and Stanton et al. [3] have compared and analyzed a variety of measurement methods. The results show that different methods have advantages and disadvantages and are suitable for different application fields. The methods with the highest comprehensive scores are the situation awareness global assessment technique (SAGAT) and the situation awareness rating technique (SART).
In order to measure the situation awareness of the operators in the main control room of multi-module high-temperature gas-cooled reactor nuclear power plants, a comprehensive measurement method of situation awareness is designed that combines SART, NASA-TLX (NASA Task Load Index), and eye movement tracking, which makes up for the shortcomings of these three methods and improves the accuracy of data analysis.
SART is a subjective measurement method that requires operators to fill out the questionnaire after each experimental scenario, so there is no need to pause the simulator during the experimental process. It has the advantages of no interference with the main task, easy operation, convenience, high accuracy, and easy acceptance by operators.
Bustamante [4] used SART to measure pilots’ situation awareness (SA) during critical weather events. The experimental results show that when the weather system fails to provide an indication of the weather event at the specified waypoint, the SA of pilots will decrease, and first officers (FO) will have higher situation awareness than Captains. Pilots’ workloads will significantly increase when they approach the weather event.
Stark [5] used SART to analyze the influence of the size of the synthetic visual display on the situation awareness of pilots. The results show that there is no significant difference in the performance of monitors of different sizes, and smaller display sizes will improve the situation awareness of pilots.
Burke [6] used SART to evaluate the situation awareness of 12 pilots using TAP software in a Piaggio Avanti flight test aircraft.
Although the SART method has many advantages, there are also some shortcomings, such as the fact that this method calculates the situation awareness of the operator in the experimental scenario based on the scale filled out by the operator. Therefore, it cannot achieve real-time monitoring of the situation awareness of the operator in the experimental scenario. The eye tracking method, as an objective measurement method, can record the operator’s performance in real time during the experimental process, making up for the shortcomings of the SART method and improving the accuracy of measurement.
Kilingaru [7] used dwell time entropy to distinguish the behavior of expert pilots and novice pilots. The results show that the dwell time entropy of expert pilots is significantly higher than that of novice pilots.
Koen [8] investigated pilots’ situation awareness using eye tracking. The results showed that pilots had low situation awareness and high gaze entropy during the experiment.
Ha et al. [9] proposed a novel method to infer the operator’s thoughts from his eye movement data and evaluated it with a nuclear power plant simulator. It was concluded that the operator’s thoughts can be inferred from the operator’s eye movement data. Analyzing operator situation awareness through eye movement data has great application potential in nuclear power plants.
NASA-TLX, like SART, belongs to subjective measurement methods and also has the advantages of no interference with the main task, easy operation, high accuracy, and easy acceptance by operators. According to the scale filled out by the operator, the workload of the operator in this experimental scenario can be calculated.
Selcon and Taylor [10,11] compared the accuracy and reliability of SART and NASA TLX within a computer-graphics flight simulation environment. Twelve RAF pilots took part in the experiment and were asked to rate a videotape of an air combat flight simulation sequence using TLX and SART technology. The experimental results show that the calculation results of SART and NASA TLX can reflect the difficulty of the task, and the results of the two scales have a certain correlation.
Dember et al. [12] used NASA-TLX to measure the workload of visual alert tasks. They reported that the workload would increase with the increase in working time.
The HTR-PM600 nuclear power plant is composed of six identical NSSS modules, as shown in Figure 1. The steam generated by the six NSSS modules is gathered in the main pipe to promote a steam turbine to generate electricity, which not only ensures the inherent safety of the high temperature reactor but also improves the economy of the power plant. It is the development trend of the high-temperature gas-cooled reactor nuclear power plant. The main control room of the HTR-PM600 nuclear power plant is different from that of the HTR-PM nuclear power plant [13,14,15]. The main control room operator team consists of five operators: (1) Reactor operator (1#RO), (2) reactor operator (2#RO), (3) reactor operator (3#RO), conventional island operator (CO) and shift supervisor (SO). Each RO needs to monitor two NSSS modules; the CO monitors conventional island systems and equipment; and the SO is the duty supervisor in the main control room. Each NSSS module has the same monitoring parameters and operating procedures, so the problem of situation awareness among operators in the multi-modular high-temperature gas-cooled reactor (HTGR) nuclear power plant is more prominent. When in power operation, due to the advantages of the digital control system, the system status and parameters change little, and the workload of the operator is relatively small. The main work of the operator during the operation of the nuclear power plant is “monitoring, decision, control”. When a reactor accident occurs, the system parameters change dramatically. Due to the “keyhole effect” [16], a large amount of information cannot be displayed on the same interface at the same time. If the operator cannot observe the change in parameters in time or cannot detect important alarm information in time, the possibility of accidents will increase.
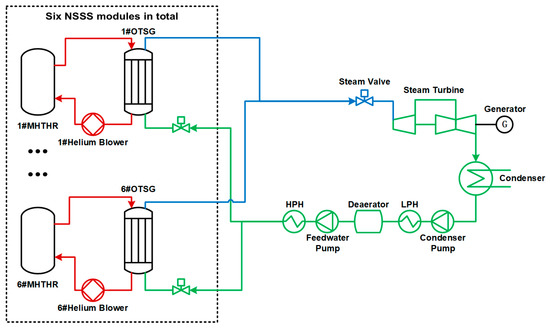
Figure 1.
System diagram of six-modular HTR-PM600 plant.
In this study, SART, NASA-TLX, and gaze entropy were used to measure the SA of operators, and a series of accident handling experiments were carried out on a full-scale simulator. Through the experimental data, the possibility of the operator monitoring two NSSS modules in the case of emergency failure of a nuclear power plant was analyzed, the law of eye transfer when the operator monitors two NSSS modules at the same time was explored, and the operation experience of a multi-modular nuclear power plant was summarized.
2. Experimental Methods
2.1. Experimental Participants
There were three operators in this experiment, all of whom are 10 WM reactor operators [17,18,19], one female and two male, aged 22–25 years old, with normal eyesight or corrected-to-normal vision in both eyes. Before the experiment, the operators participating in the experiment had been trained for a long time and had acquired the ability to operate the verification platform skillfully.
2.2. Verification Platform
The experiment is carried out on the verification platform of a six-module high-temperature gas-cooled reactor, as shown in Figure 2. The verification platform has the function of an engineering simulator, which can simulate the operation of the six-module high-temperature gas-cooled reactor in real time. All monitoring and operation of the verification platform are based on computer screens to maximize the flexibility of the platform. The engineering simulator can dynamically support operators in performing tasks such as start-up, shutdown, normal power operation, power increase and decrease, abnormalities, accident handling, and alarms on the reactor. Each NSSS module has the same human–machine interface (HMI), and the HMI of each NSSS module includes two large display screens, two computer display screens (VDU), emergency operation buttons, and other manual operation buttons (simulated through the touch screen), so each RO needs to monitor four large display screens, four computer display screens (VDU), and related manipulation buttons.
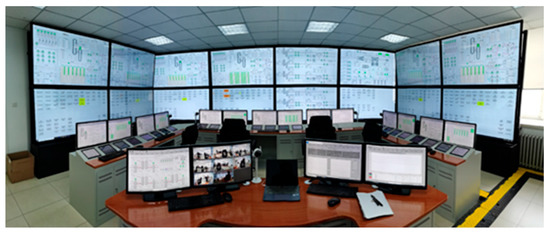
Figure 2.
Six-module high-temperature gas-cooled reactor verification platform.
2.3. Experimental Process
All the experimental scenarios were prepared in advance by experts; the experimental scenarios were randomly assigned; the completed experimental scenarios were not repeated; and all the operators participating in the experiment did not know the content of each experimental scenario.
At the beginning of each experimental scenario, all NSSS modules were running at full power. After continuous operation for a period of time, different numbers of operational accidents were inserted into the nuclear power plant, and the operator handled each operational accident. After the nuclear power plant was in stable operation, the experimental scenario ended. Therefore, each experimental scenario included two operational stages: the first being the full power operation stage of the nuclear power plant, and the second being the accident handling stage.
During the experiment, each RO wore an eye tracker to record eye movement data, as this experiment did not require any data on SO and CO, and SO and CO did not need to wear eye trackers. They only needed to cooperate with the experiment to ensure the safe operation of the nuclear power plant. At the end of each experimental scenario, three ROs were invited to fill out SART and NASA-TLX questionnaires. After the completion of all experimental scenarios, all eye movement data and questionnaires were compiled to calculate the operator’s SA, and the eye movement patterns of the operator monitoring two NSSS modules simultaneously were explored.
2.4. Experiment Scenarios
The selection of inserted accidents in the experimental scenarios is considered from the following perspectives: ① Covering all typical accidents; ② covering typical scenarios of I&C and HSI accidents; and ③ meeting the operation characteristics of “one person monitoring two reactors”. The criteria for passing the experiment scenario are: ① the operator can complete the required tasks in the scenario; and ② at the end of the scenario, the power plant is in a stable state (stable power operation or safe shutdown).
This experiment includes 30 experimental scenarios (as shown in Table 1). Scenario codes are S1 to S10, D1 to D10, and M1 to M10. Class S represents the operation scenario in which an accident occurs in a single NSSS module monitored by one operator. Class D represents the operation scenario in which accidents occur in double NSSS modules monitored by one operator at the same time. Class M represents the operation scenario in which accidents occur in multiple NSSS modules monitored by different operators at the same time. The difficulty of the task is the highest in class M, followed by class D, and the difficulty of the task is the lowest in class S. According to the needs of data analysis in this paper, we selected the eye movement data and questionnaires of ROs who need to deal with accidents in each experimental scenario. For example, when accidents occur in 1# and 2#NSSS modules, we need to select the questionnaires and eye movement data from 1#RO.

Table 1.
Classification and numbering of experimental scenarios.
3. Statistical Analysis Methods
The independent variables in this experiment are the number of NSSS modules in the accident and the operation accident inserted in the power plant. When the parameters of one NSSS module change, the parameters of the other NSSS modules change as well. The more NSSS modules have accidents, the more drastic changes there are in the parameters of other NSSS modules.
The operator’s performance and gaze entropy are used as dependent variables. The performance of the operator has two main components: ① whether the operator can pass the experimental scenario; and ② calculation results of the NASA-TLX and SART scales.
3.1. Rating Scale
3.1.1. Situation Awareness Rating Technique (SART)
SART is one of the questionnaire methods proposed by Taylor [20], and it was first used in the US Air Force’s air control system. Since then, SART has been gradually used in other fields, including aviation, cyber security, the military, surface transportation, and nuclear power plant control rooms. The SART concentrates on measuring the operator’s knowledge in three areas: (1) demands on attentional resources (D), (2) supply of attentional resources (S), and (3) understanding of the situation (U). The SA score is calculated as SA = U − (D − S).
3.1.2. NASA Task Load Index (NASA-TLX)
The NASA Task Load Index (NASA-TLX) is a multi-dimensional subjective workload rating technique [21]. On the NASA-TLX scale, the workload of operators can be quantified through six dimensions: Mental demand, physical demand, temporal demand, perceived performance, effort, and frustration level. Since its development, the NASA-TLX has been used to evaluate workloads in aircraft, automobiles, unmanned systems, nuclear power plants, laboratories, and healthcare. The advantages of the NASA-TLX method are ease of operation, high accuracy, and easy acceptance by operators. In addition, both the SART and NASA-TLX scales are filled out by the operator after each experiment scenario, so there is no need to suspend the experiment during the scenario experiment or interfere with the acquisition of eye-tracking data.
3.2. Gaze Entropy
During the operation of the nuclear power plant, operators must always pay attention to the operating parameters to understand the current state of the plant. Operators will build the operating state model of the power plant according to the power plant parameters and constantly modify the state model of the power plant through other parameters [2]. The behavior of the operator’s eye gaze is related to his mental model and indicative of his hypothesis regarding the state of the process. The extent of disorder in the operator’s eye-gaze pattern will indicate the extent of his situation awareness and therefore his ability to handle process disturbances in the experimental scenario [22,23]. Entropy is widely used to quantify the extent of order or disorder in the system; it is found that Markov entropy tends to decrease when SA is high [8,23,24].
This study used Markov entropy and dwell time entropy to analyze a participant’s gaze movement. During the operation of the power plant, the large screens handled by the operator are divided into different areas of interest (AOIs) according to the reactor system.
3.2.1. Markov Entropy
Markov entropy is a method to calculate entropy using a Markov chain model [25]. This is a stochastic model describing a series of possible events in which the probability of each event depends only on the state attained in the previous event. Markov entropy is obtained by using the state space at a specific time point and the transition matrix representing the transition probability between states. Markov entropy is calculated using the transition probability of eye stays on the AOIs [26,27]. Markov entropy has the advantage of including information on the direction of eye movement [23,28]. It is defined as follows [26,29]:
where the state set is defined as the set of initial probabilities of each AOI, and the transition matrix is defined as a matrix of transition probabilities between AOIs. The initial probability of the th AOI is a value obtained by dividing the fixation count of the th AOI by the total fixation count of all AOIs. The transition probability from the th AOI to the th AOI is obtained by dividing the number of movements from the th AOI to the th AOI by the total number of movements between all AOIs.
has a maximum value of when all gaze transition probabilities are equal. Therefore, we can define the relative gaze transition entropy, notated by as [23]:
where lies between 0 and 1. When , the probability that the operator’s gaze transitions to any other AOI is exactly the same, i.e., the operator’s gaze is perfectly disordered. At the limit when , the operator’s eye gaze is at a specific AOI, i.e., the operator’s gaze transitions are perfectly ordered. Therefore, the lower the Markov entropy, the more regular the operator’s gaze, and the higher the Markov entropy, the more irregular the operator’s gaze.
3.2.2. Dwell Time Entropy
Dwell time entropy is a method to reflect the time spent on each AOI, it is defined as follows [23,30]:
where is defined as the ratio of the fixation time of the th AOI to the total fixation time of all AOIs.
The maximum value of , notated as is . We define relative dwell time entropy , as [23]:
where lies between 0 and 1. A large value of indicates that the dwell time of the operator on most AOIs is almost equal, while a small value indicates that the operator is more focused on a few AOIs. Therefore, the lower the dwell time entropy, the more focused the operator is, and the higher the dwell time entropy, the less focused the operator is.
4. Results and Analysis
We use the S2 experimental scenario as an example to introduce the actions that three ROs need to perform during the experiment. The S2 experimental scenario is that the main helium fan of the 5#NSSS module mistakenly accelerates, causing an increase in primary circuit flow, reactor nuclear power, and cold helium temperature due to the unexpected acceleration of the main helium fan. If 3#RO found that the relevant parameters changed, he would timely adjust the rotating speed of the main helium fan to put the nuclear power plant in a safe operating state. If the adjustment failed, the action of the nuclear reactor protection device would be triggered, and the reactor emergency shutdown would be triggered, 3#RO would monitor the reactor shutdown action to ensure that all control rods dropped safely. Because the mHTGR nuclear power plant generates steam from six NSSS modules to jointly promote the turbine generator to generate electricity, the coupling induction will cause changes in the steam parameters of the other five NSSS modules when the 5#NSSS module experiences an accident. The three ROs need to adjust the steam parameters of the five NSSS modules in a timely manner to ensure the safe operation of the reactor.
4.1. Situation Awareness and Workload
Through the calculation of the SART and NASA-TLX scales filled in by operators. The results are shown in Figure 3. The results obtained through calculation are all dimensionless values, and the magnitude of the values can reflect the level of situation awareness and workload of the operator in the experimental scenario. Taking Figure 3 as an example, the Abscissa (1–10) of all figures in this paper only represent experimental scenarios under different classes, not a continuously increasing variable. The connecting lines between coordinate points are only for the convenience of distinguishing them and have no continuous relationship. Through the results of the SART and NASA-TLX scales, it can be found that the RO’s situation awareness decreases with the increase in difficulty of different classes of experimental scenarios, but the difference is not significant. It shows that the number of NSSS modules with accidents has little impact on operators. Due to the advanced degree of automation in the nuclear power plant, when accidents occur in the plant, the ROs do not need too much operation; they just need to constantly monitor the process parameter changes and confirm the status of the power plant. When operation accidents occur in nuclear power plants, ROs can monitor two NSSS modules and handle the corresponding tasks at the same time.
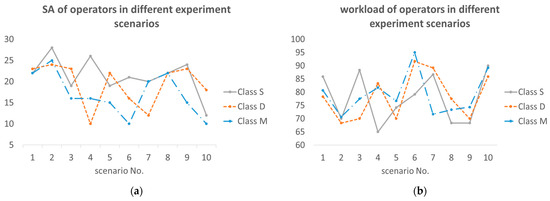
Figure 3.
(a) SA of operators in different experimental scenarios; (b) workload of operators in different experimental scenarios.
Figure 4 is a graph showing the average situation awareness and workload of ROs in different classes of accident scenarios. It can be seen that in the class M accident scenario, the operator’s workload is the highest and the situation awareness is the lowest, while in category S, the operator’s workload is the lowest and the situation awareness is the highest. Through the calculation of correlation:
and are the two groups of values involved in the calculation, and and are the average values of the two groups of values involved in the calculation. It can be calculated that there is a negative correlation between the operator’s situation awareness and workload (as shown in Table 2).
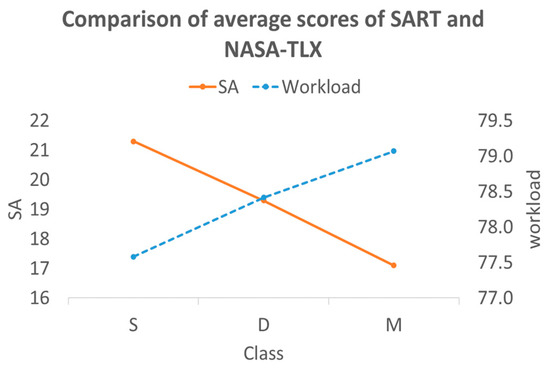
Figure 4.
Average SA and workload of operators in different classes of experimental scenarios.
Table 2.
The correlation between operator SA and workload in different classes.
4.2. Eye Tracker Hot Spot Map
We selected the experimental data from three experimental scenarios to show the difference in hot spot maps (as shown in Figure 5) of operators under different operating conditions. It can be seen from the figure that the operator can monitor the two NSSS under normal operating conditions.
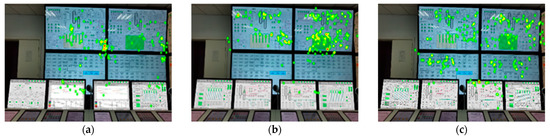
Figure 5.
(a) Normal operating conditions; (b) 2#NSSS have an accident; (c) both NSSS modules have accidents.
In case of an accident in 2#NSSS, the operator’s attention is focused on the malfunctioning 2#NSSS module, but the 1#NSSS module without an accident can also be monitored at the same time. When both NSSS modules have accidents, the RO will strengthen the monitoring of the two NSSS modules, and the points of view are also scattered.
Compared with the hot spot maps of the operators in the power operation phase and the accident operation phase, we know that the operators monitor more parameters in the accident operation phase, not just some key parameters.
Through the comparison of the three pictures, it can be found that the RO can monitor the two NSSS modules at the same time, regardless of whether there are accidents in the two NSSS modules.
4.3. Markov Entropy and Dwell Time Entropy
During the experiment, it was found that when the operator is monitoring two NSSS modules, the large display screens are usually used to monitor the process parameters, while the computer display screens are more used to operate the equipment of the nuclear power plant, and the interface will be switched frequently. In order to calculate the gaze entropy of the operator during the monitoring process, the two large display screens of each NSSS module are divided into 18 areas of interest (AOIs) according to the parameter content, so each operator needs to monitor 36 AOIs in total. The division of AOIs is shown in Figure 6.
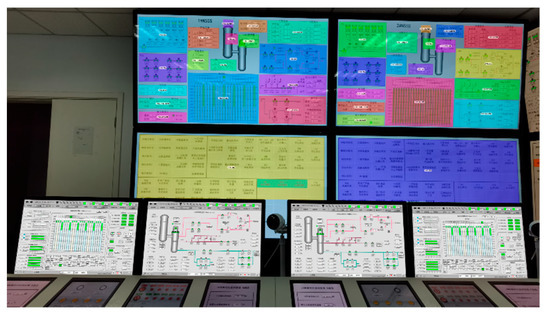
Figure 6.
AOIs of HMI.
Calculate the ROs’ Markov entropy and dwell time entropy in all experimental scenarios, and the results are shown in Figure 7. By comparison, it can be found that there is no significant difference in the ROs’ Markov entropy and dwell time entropy in different classes of experimental scenarios. This analysis result once again confirms the previous conclusion: “Even if two NSSS modules have accidents, ROs can monitor the two NSSS modules at the same time”.
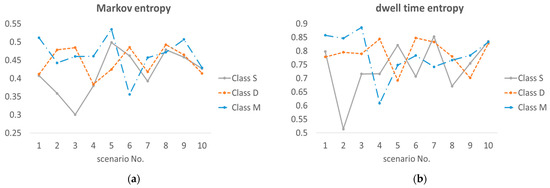
Figure 7.
(a) Markov entropy of operators in each experimental scenario; (b) dwell time entropy of operators in each experimental scenario.
Calculate the average value of the operators’ Markov entropy and situation awareness in each class of experimental scenario, and the results are shown in Figure 8. By comparison, it can be found that there is a negative correlation between the operator’s situation awareness and Markov entropy. When the operator’s situation awareness is high, the operator’s eyes do not need to pay attention to a lot of AOI; they only need to switch their eyes back and forth between some key AOI, so their Markov entropy will be relatively low.
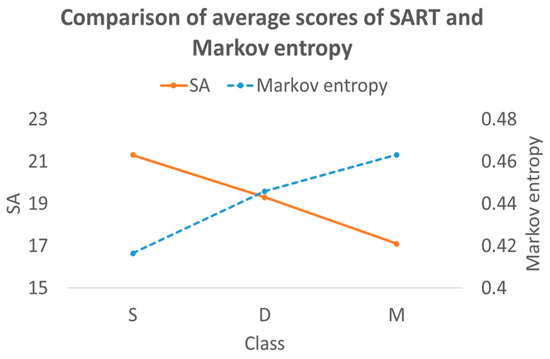
Figure 8.
Average SA and Markov entropy of operators in different classes of experimental scenarios.
Each experimental scenario includes two phases: The power operation phase and the accident operation phase. The Markov entropy and dwell time entropy of the power operation phase and the accident operation phase in all experimental scenarios are calculated separately, and the results are shown in Figure 9.
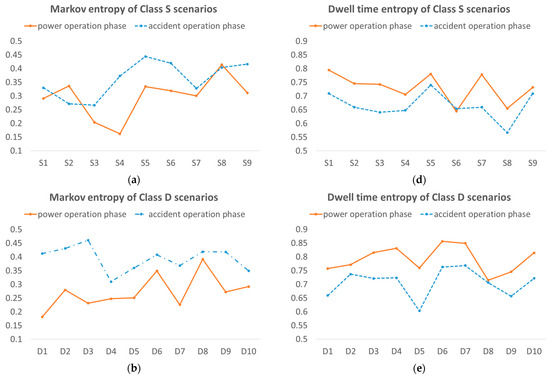
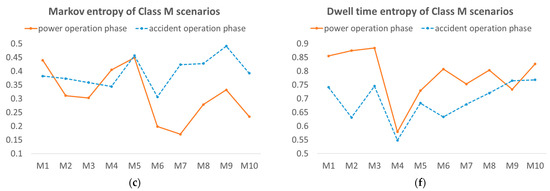
Figure 9.
(a) Markov entropy of class S scenarios; (b) Markov entropy of class D scenarios; (c) Markov entropy of class M scenarios; (d) dwell time entropy of class S scenarios; (e) dwell time entropy of class D scenarios; (f) dwell time entropy of class M scenarios.
Through the comparison of the data, it can be seen that in all the accident scenarios, the Markov entropy in the accident operation phase is greater than that in the power operation phase, indicating that the operators’ situation awareness in the accident operation phase is less than that in the power operation phase. ROs need to pay attention to more parameters to understand the status of the power plant. The dwell time entropy in the accident operation phase is less than that in the power operation phase, which indicates that the operator is more focused on a few AOIs and more time is spent changing key parameters in the accident operation phase. Combined with the hot spot maps in Figure 4, it can be seen that although the number of parameters concerned by operators during the accident operation phase has increased, the attention time is more concentrated on a few key parameters. Through comparison, it can be concluded that the parameters to which the operator has paid the most attention on the large screens are the primary system and pressure parameters, main feedwater parameters, hot helium parameters, primary circuit pressure, and steam parameters.
5. Conclusions
Combined with the characteristics of multi-module control rooms and multi-module running tasks, this paper designs a comprehensive situation awareness measurement method that combines SART, NASA-TLX (NASA Task Load Index), and eye movement tracking methods. A series of accident handling experiments are performed on a full-scale simulator to gain enough data for analysis. Through this method, the possibility of one operator monitoring two NSSS modules in the case of operation accidents in nuclear power plants is increased, which contributes to the further development of multi-modular high-temperature gas-cooled reactors.
The SART and NASA-TLX scales are used to measure SA and the workload of operators, while gaze entropy is used to indicate gaze movement. Under different accident scenarios, the ROs’ situation awareness and workload do not change significantly, indicating that even in the class M scenario with the heaviest tasks, the ROs still have the ability to monitor two NSSS modules at the same time. This conclusion can also be obtained from the analysis of hot spot map data and gaze entropy data. By analyzing the ROs‘ hot spot map data and gaze entropy data, we can know that: ① even if two NSSS modules have accidents at the same time, the RO can also monitor the two NSSS modules; ② when accidents occur, the number of parameters concerned by the RO will increase; and ③ when accidents occur, the RO will focus on some key parameters.
Therefore, from all the experimental data, we can observe that when accidents occur in the nuclear power plant, the RO can monitor the two NSSS modules and complete the relevant accident handling.
Author Contributions
Conceptualization, D.L. and Z.D.; methodology, Q.J. and R.M.; validation, R.M.; formal analysis, Q.J. and R.M.; investigation, Q.J. and R.M.; data curation, R.M.; writing—original draft preparation, R.M.; writing—review and editing, Q.J. and Z.D.; supervision, Q.J. and D.L.; project administration, Z.D.; funding acquisition, Z.D. All authors have read and agreed to the published version of the manuscript.
Funding
This work is jointly supported by National S&T Major Project of China (Grants No. ZX069), China Nuclear Corporation Multi-module High temperature reactor Supercritical Power Generation Technology Research Project 6 (Grants No. ZHJTJZYFGWD2020).
Data Availability Statement
Not applicable.
Conflicts of Interest
The authors declare no conflict of interest.
References
- Le Bot, P. Human reliability data, human error and accident models—Illustration through the Three Mile Island accident analysis. Reliab. Eng. Syst. Saf. 2004, 83, 153–167. [Google Scholar] [CrossRef]
- Radziwill, N.M. Designing for Situation Awareness: An Approach to User-Centered Design, Second Edition. Qual. Manag. J. 2017, 24, 56. [Google Scholar] [CrossRef]
- Salmon, P.; Stanton, N.; Walker, G.; Green, D. Situation awareness measurement: A review of applicability for C4i envi-ronments. Appl. Ergon. 2006, 37, 225–238. [Google Scholar] [CrossRef]
- Bustamante, E.A.; Fallon, C.K.; Bliss, J.; Bailey, W.R.; Anderson, B.L. Pilots’ workload, situation awareness, and trust during weather events as a function of time pressure, role assignment, pilots’ rank, weather display, and weather system. Int. J. Appl. Aviat. Stud. 2005, 5, 347–367. [Google Scholar]
- Stark, J.M.; Comstock, J.R.; Prinzel, L.J.; Burdette, D.W.; Scerbo, M.W. A Preliminary Examination of Situation Awareness and Pilot Performance in a Synthetic Vision Environment. Proc. Hum. Factors Ergon. Soc. Annu. Meet. 2001, 45, 40–43. [Google Scholar] [CrossRef]
- Burke, K.A.; Wing, D.J.; Haynes, M. Flight Test Assessments of Pilot Workload, System Usability, and Situation Awareness of Tasar. Proc. Hum. Factors Ergon. Soc. Annu. Meet. 2016, 60, 61–65. [Google Scholar] [CrossRef]
- Kilingaru, K.; Tweedale, J.W.; Thatcher, S.; Jain, L.C. Monitoring pilot ‘Situation Awareness’. J. Intell. Fuzzy Syst. 2013, 24, 457–466. [Google Scholar] [CrossRef]
- Van de Merwe, K.; van Dijk, H.; Zon, R. Eye Movements as an Indicator of Situation Awareness in a Flight Simulator Experiment. Int. J. Aviat. Psychol. 2012, 22, 78–95. [Google Scholar] [CrossRef]
- Ha, J.S.; Byon, Y.-J.; Baek, J.; Seong, P.H. Method for Inference of Operators’ Thoughts from Eye Movement Data in Nu-clear Power Plants. Nucl. Eng. Technol. 2016, 48, 129–143. [Google Scholar] [CrossRef]
- Selcon, S.J.; Taylor, R.M.; Shadrake, R.A. Multi-Modal Cockpit Warnings: Pictures. Words. or Both? Proc. Hum. Factors Soc. Annu. Meet. 1992, 36, 57–61. [Google Scholar] [CrossRef]
- Selcon, S.J.; Taylor, R.M.; Koritsas, E. Workload or Situation awareness?: TLX vs. SART for Aerospace Systems Design Evaluation. Proc. Hum. Factors Soc. Annu. Meet. 1991, 35, 62–66. [Google Scholar] [CrossRef]
- The Rate of Gain of Perceived Workload in Sustained Attention|Semantic Scholar. Available online: https://www.semanticscholar.org/paper/The-Rate-of-Gain-of-Perceived-Workload-in-Sustained-Dember-Warm/cfd83fe9855b67bc8212393fca8882bea134c96f (accessed on 23 November 2022).
- Zhang, Z.; Dong, Y.; Li, F.; Zhang, Z.; Wang, H.; Huang, X.; Li, H.; Liu, B.; Wu, X.; Wang, H.; et al. The Shandong Shidao Bay 200 MW e High-Temperature Gas-Cooled Reactor Pebble-Bed Module (HTR-PM) Demonstration Power Plant: An Engineering and Technological Innovation. Engineering 2016, 2, 112–118. [Google Scholar] [CrossRef]
- Zhang, Z.; Wu, Z.; Wang, D.; Tong, J. Development Strategy of High Temperature Gas Cooled Reactor in China. Chin. J. Eng. Sci. 2019, 21, 12–19. [Google Scholar] [CrossRef]
- Dong, Z.; Song, M.; Huang, X.; Zhang, Z.; Wu, Z. Module Coordination Control of MHTGR-Based Multi-Modular Nuclear Plants. IEEE Trans. Nucl. Sci. 2016, 63, 1889–1900. [Google Scholar] [CrossRef]
- Seong, P.-H. (Ed.) Reliability and Risk Issues in Large Scale Safety-Critical Digital Control Systems, 2009th ed.; Springer: London, UK, 2008. [Google Scholar]
- Wu, Z.; Lin, D.; Zhong, D. The design features of the HTR-10. Nucl. Eng. Des. 2002, 218, 25–32. [Google Scholar] [CrossRef]
- Yanhua, Z.; Zhipeng, C.; Han, Z. Preliminary study on HTR-10 operating at higher outlet temperature. Nucl. Eng. Des. 2022, 397, 111958. [Google Scholar] [CrossRef]
- Xu, Y.; Zuo, K. Overview of the 10 MW high temperature gas cooled reactor—Test module project. Nucl. Eng. Des. 2002, 218, 13–23. [Google Scholar] [CrossRef]
- Taylor, R. Situational Awareness Rating Technique (Sart): The Development of a Tool for Aircrew Systems Design. In Situational Awareness; Routledge: Oxfordshire, UK, 2011. [Google Scholar]
- Hart, S.G.; Staveland, L.E. Development of NASA-TLX (Task Load Index): Results of Empirical and Theoretical Research. Adv. Psychol. 1988, 52, 139–183. [Google Scholar]
- Ujita, H. Human characteristics of plant operation and man-machine interface. Reliab. Eng. Syst. Saf. 1992, 38, 119–124. [Google Scholar] [CrossRef]
- Bhavsar, P.; Srinivasan, B.; Srinivasan, R. Quantifying situation awareness of control room operators using eye-gaze behavior. Comput. Chem. Eng. 2017, 106, 191–201. [Google Scholar] [CrossRef]
- Allsop, J.; Gray, R. Flying under pressure: Effects of anxiety on attention and gaze behavior in aviation. J. Appl. Res. Mem. Cogn. 2014, 3, 63–71. [Google Scholar] [CrossRef]
- Lee, Y.; Jung, K.; Lee, H. Gender Characteristics on Gaze Movement in Situation Awareness. Appl. Sci. 2021, 11, 10281. [Google Scholar] [CrossRef]
- Shic, F.; Chawarska, K.; Bradshaw, J.; Scassellati, B. Autism, eye-tracking, entropy. In Proceedings of the 2008 7th IEEE International Conference on Development and Learning, Monterey, CA, USA, 9–12 August 2008; pp. 73–78. [Google Scholar]
- Shannon, C.E. A mathematical theory of communication. Bell Syst. Tech. J. 1948, 27, 379–423. [Google Scholar] [CrossRef]
- Lee, Y.; Jung, K.-T.; Lee, H.-C. Use of gaze entropy to evaluate situation awareness in emergency accident situations of nuclear power plant. Nucl. Eng. Technol. 2021, 54, 1261–1270. [Google Scholar] [CrossRef]
- Shiferaw, B.; Downey, L.; Crewther, D. A review of gaze entropy as a measure of visual scanning efficiency. Neurosci. Biobehav. Rev. 2019, 96, 353–366. [Google Scholar] [CrossRef] [PubMed]
- Lee, Y.; Jung, K.T.; Lee, H.C. A Basic Study on the Use of Eye Movement Entropy in the Emotional Satisfaction Evaluation of Design. J. Ergon. Soc. Korea 2020, 39, 487–500. [Google Scholar] [CrossRef]


Disclaimer/Publisher’s Note: The statements, opinions and data contained in all publications are solely those of the individual author(s) and contributor(s) and not of MDPI and/or the editor(s). MDPI and/or the editor(s) disclaim responsibility for any injury to people or property resulting from any ideas, methods, instructions or products referred to in the content. |
© 2023 by the authors. Licensee MDPI, Basel, Switzerland. This article is an open access article distributed under the terms and conditions of the Creative Commons Attribution (CC BY) license (https://creativecommons.org/licenses/by/4.0/).