Article

Optimization of Circulating Fluidized Bed Boiler Combustion Key Control Parameters Based on Machine Learning

1
School of Computer and Information Technology, Shanxi University, Taiyuan 030006, China
2
Department of Energy and Power Engineering, Tsinghua University, Beijing 100084, China
3
Department of Automation, Tsinghua University, Beijing 100084, China
4
School of Automation and Software, Shanxi University, Taiyuan 030006, China
*
Author to whom correspondence should be addressed.
Energies 2023, 16(15), 5674; https://doi.org/10.3390/en16155674
Submission received: 5 July 2023 / Revised: 22 July 2023 / Accepted: 25 July 2023 / Published: 28 July 2023

Abstract

:
During the coal-fired circulating fluidized bed unit participation in the peak regulation process of the power grid, the thermal automatic control system assists the operator to adjust the mode focusing on pollutant control and ignoring the economy so that the unit’s operating performance maintains a huge potential for deep mining. The high-dimensional and coupling-related data characteristics of circulating fluidized bed boilers put forward more refined and demanding requirements for combustion optimization analysis and open-loop guidance operation. Therefore, this paper proposes a combustion optimization method that incorporates neighborhood rough set machine learning. This method first reduces the control parameters affecting multi-objective combustion optimization with the neighborhood rough set algorithm that fully considers the correlation of each variable combination and then establishes a multi-objective combustion optimization prediction model by combining the online calculation of boiler thermal efficiency. Finally, the NSGAII algorithm realizes the optimization of the control parameter setting value of the boiler combustion system. The results show that this method reduces the number of control commands involved in combustion optimization adjustment from 26 to 11. At the same time, based on the optimization results obtained by using traditional combustion optimization methods under high, medium, and medium-low load conditions, the boiler thermal efficiency increased by 0.07%, decreased by 0.02%, and increased by 0.55%, respectively, and the nitrogen oxide emission concentration decreased by 5.02 mg/Nm3, 7.77 mg/Nm3, and 7.03 mg/Nm3, respectively. The implementation of this method can help better account for the economy and pollutant discharge of the boiler combustion system during the variable working conditions, guide the operators to adjust the combustion more accurately, and effectively reduce the ineffective energy consumption in the adjustment process. The proposal and application of this method laid the foundation for the construction of smart power plants.

1. Introduction

In response to the world energy crisis, China has put forward the major strategic decision of “carbon peaking and carbon neutrality” and plans to build a new type of power system with new energy as the main body through the vigorous development of new energy [1,2]. However, the intermittent and unstable characteristics of new energy make it a constant threat to the safety and stability of the power system. In order to ensure the safety and stability of the power grid and fully absorb new energy, coal power units, including CFB boiler units, must actively participate in deep peak shaving of the power grid. During the peak-shaving process, the thermal efficiency and pollutant gas emission of the CFB boiler will show huge differences compared with the design value. To maintain the high-efficiency operation of the unit and reduce pollutant emissions, power plant operators are required to make timely combustion adjustments according to the combustion conditions. Compared with automatic control, different operators have different cognitions on combustion adjustment, which makes their combustion adjustment operation strongly independent and not scalable. For this purpose, a combustion optimization method with general guidelines needs to be established. In the case of constant coal combustion characteristics, the main key parameters affecting the combustion of circulating fluidized bed boilers include coal volume, primary air volume, secondary air volume, air distribution mode, slag discharge volume, and material return volume. Obviously, the mechanism modeling of a circulating fluidized bed boiler combustion system, which is a nonlinear, large-lag, large-inertia, and strongly coupled thermodynamic system, which is very complicated and cumbersome. Moreover, the simulation results of the mechanism model are usually poor in practicability and are more suitable for trend characterization rather than control guidance. Therefore, inspired by artificial intelligence technology in recent years, it is proposed to study the combustion optimization of units from this perspective. Under the background of continuous development and improvement of DCS (Distributed Control System) and SIS (Supervisory Information System) systems in thermal power plants, a large amount of stored historical data provides a good foundation for in-depth data mining [3]. Combined with artificial intelligence technology, these huge data are deeply excavated and reused, to enhance the value of data and strengthen the construction of smart power plants.
The traditional data-based combustion optimization model uses a large number of operating variables, state variables, and target variables of the unit to complete the optimization task under historical conditions by establishing different optimization target strategies. With the development of artificial intelligence technology, a lot of work has been done on the application of artificial intelligence algorithms to the combustion optimization of units [4,5,6,7,8,9,10,11,12,13,14,15,16,17]. Xu et al. [18] established the combustion optimization model of the supercritical pulverized coal boiler unit with a short-term memory neural network based on improved particle swarm optimization. Taking boiler thermal efficiency and nitrogen oxide emission as optimization objectives, the optimized operation parameters were obtained through the improved multi-objective particle swarm optimization algorithm. Ma et al. [19] built a comprehensive model for boiler thermal efficiency and NOx/SO2 emissions using an extreme learning machine. After that, a kind of multi-objective modified teaching–learning-based optimization method was proposed to optimize the boiler combustion process parameters. Through this method, several sets of combustion parameters that increase boiler thermal efficiency and reduce pollutant gas emissions were found. Rahat et al. [20] first used the Gaussian process model to establish models for nitrogen oxide emission and unburned coal content. A novel evolutionary multi-objective search algorithm was utilized to discover the probabilistic trade-off front between NOx and UBC. Based on the search results, the ideal combustion operation parameters were ultimately obtained. Aparna Sinha et al. [21] proposed a data-driven predictive maintenance method. In this method, the Pearson coefficient was used for feature extraction to reduce the computational burden. Feng Hong et al. [22] proposed a novel performance evaluation framework, which conducted deep feature extraction by DBN and predicted performance state by LSSVM. It has been proven to have high efficiency and accuracy. Zhi Wang et al. [23] set up a lightweight convolutional neural network to predict NOx emissions. To avoid the curse of dimensionality, the random forest algorithm was utilized to select the model candidate variables. Shi Y et al. [24], taking a 600 MW ultra-supercritical coal-fired power plant as the research object, modeled the operation and emission characteristics of the boiler by combining CFD (Computational Fluid Dynamics) simulation with an artificial neural network. The gas distribution scheme of the boiler was optimized by a genetic algorithm. Thus, the boiler can achieve higher combustion thermal efficiency under certain NOx emission constraints. Haoyang Yu et al. [25] established a model of SO2-NOx emission concentration, bed temperature, and oxygen content based on a convolutional neural network with the bidirectional long short-term memory attention mechanism and used an improved quantum genetic algorithm to find the optimal input variables of the SO2-NOx emission model. The results indicate that it simulated the trends of actual operation data more accurately than other models. Tuo Ye et al. [26] proposed a novel multi-objective prediction framework based on feature fusion to provide the basis for the online combustion optimization of coal-fired boilers. Under this framework, an XGBoost model was generated, and a Bayesian optimization algorithm was used to optimize model parameters. The fused physical field information was obtained through CFD. The modeling results demonstrated that the prediction accuracy of thermal efficiency from the model with the fusion information was higher than from the model using the operational data. Xinying Xu et al. [27] established a combustion system model using an improved distributed extreme learning machine. The weighted coefficient method was used to solve the multi-objective optimization problem. The results show that the method can optimize the boiler combustion efficiency and NOx emissions by combining different weight coefficients as needed. Xiaobin Hu et al. [28] successfully constructed a sophisticated and stable deep hybrid neural network model to predict boiler performance. Built model performance is superior to that of the classical model.
In the process of combustion optimization, considering the great influence of data model input on the complexity and real-time performance of the model, the correlation coefficient method and mutual information method are usually used to reduce it [21,29,30,31,32,33,34,35].
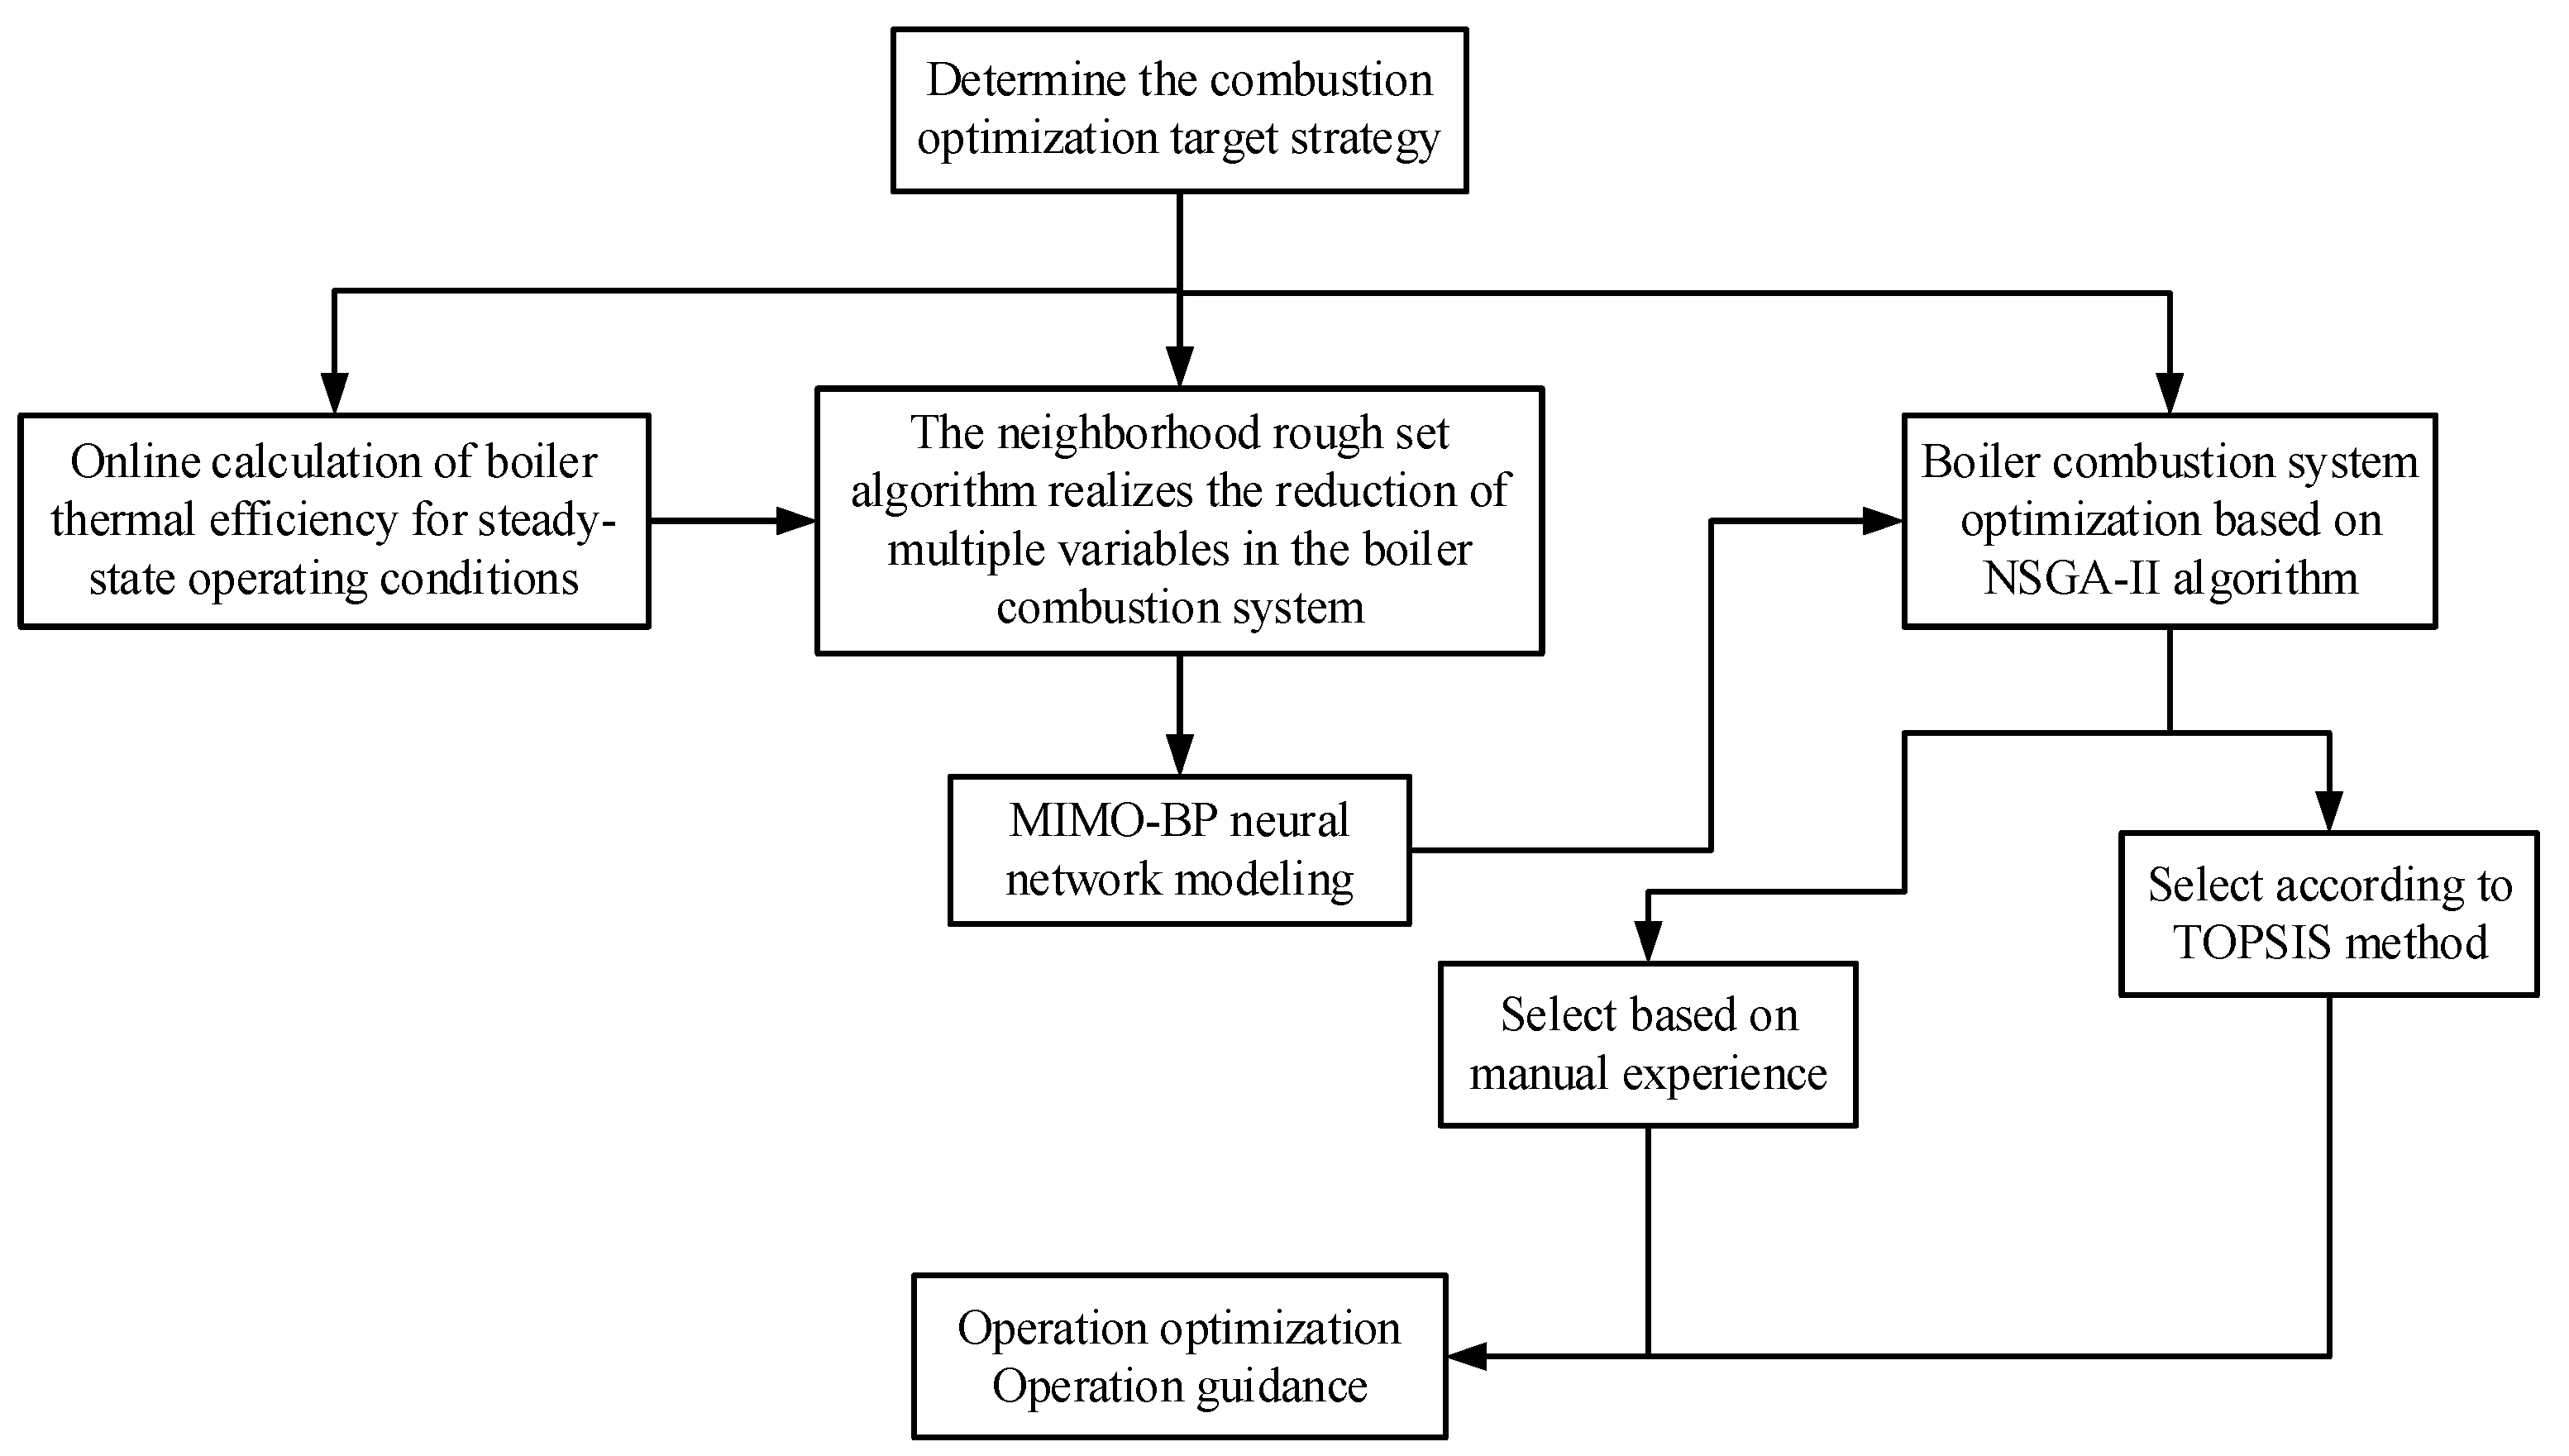
It is worth noting that the previous multi-objective combustion optimization research mainly focused on the pulverized coal boiler unit, including optimizing the state variables or operating variables of the unit. However, the optimization of the control parameter setting the value of the combustion system of the circulating fluidized bed unit is seldom carried out. In addition, in the feature selection of modeling, the existing literature focuses on the correlation between each variable and the target variable and does not take into account the influence of the combination of feature variables on the target variable. Therefore, this paper proposes an optimization method for key control parameters of circulating fluidized bed boiler combustion based on neighborhood rough set machine learning. In this method, the input parameters of the model are first reduced using the neighborhood rough set algorithm. Then, based on the reduced parameter set, a multi-objective model of the circulating fluidized bed unit under different load conditions is established. Finally, the NSGA-II algorithm is used to optimize the set value of each control parameter in the combustion process. This method provides an important guiding basis for the open-loop control optimization of the peak-shaving process of the circulating fluidized bed boiler combustion system. The logical block diagram of this paper is shown in Figure 1.

2. Methods

In order to realize the overall coordinated optimization control of multiple control loops of circulating fluidized bed boilers, the neighborhood rough set attribute reduction algorithm is used to reduce the input variables of the model, and then the BP neural network is used to establish a multi-objective combustion optimization model. Finally, the NSGA-II algorithm completes the multi-objective optimization control strategy solution.
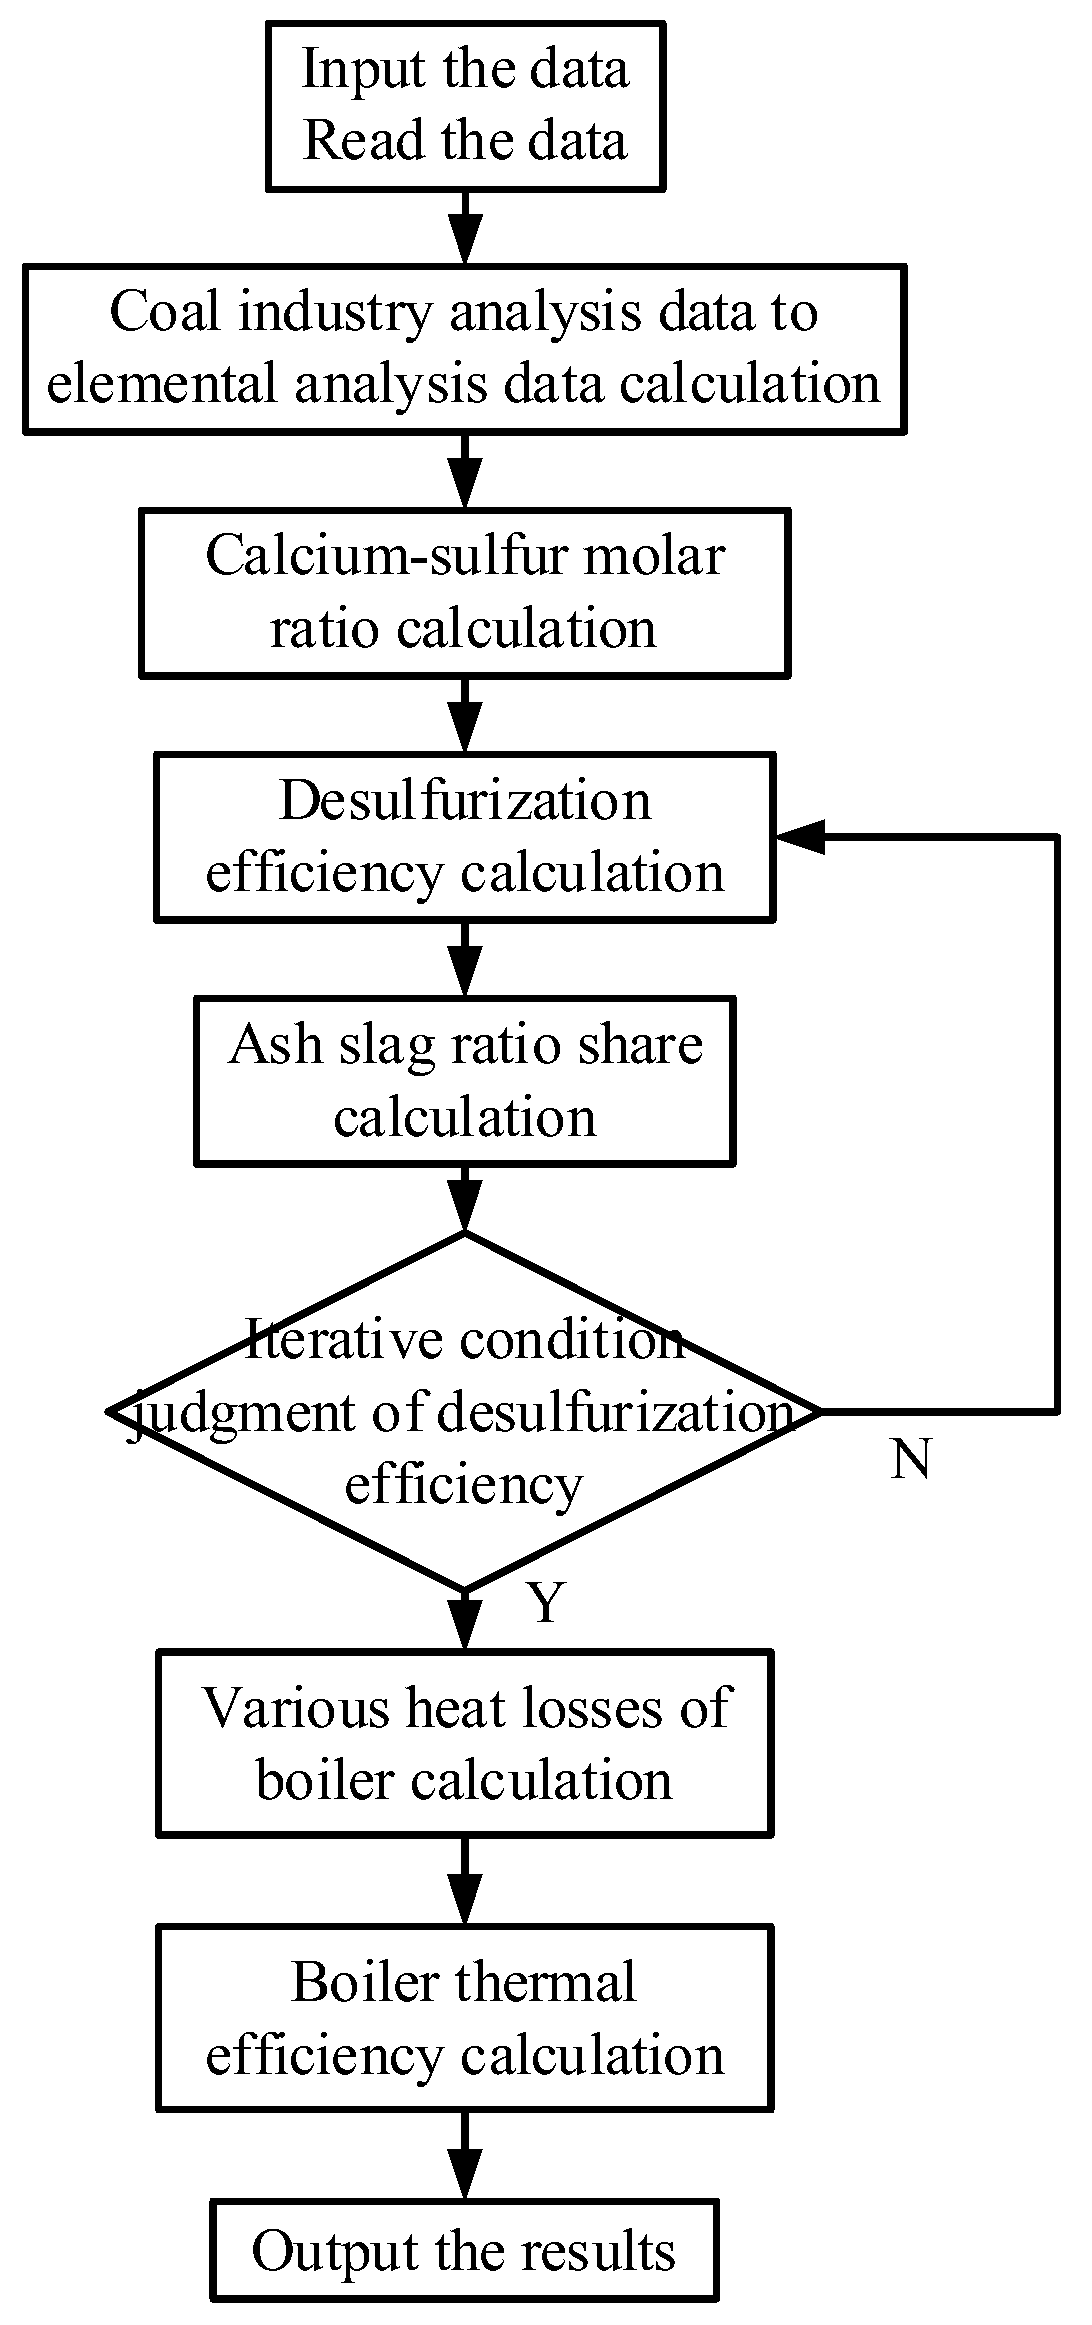
The flow chart of the machine learning-based optimization method for key combustion control parameters of circulating fluidized bed boilers during peak shaving is shown in Figure 2.

2.1. Based on Neighborhood Rough Set Attribute Reduction Algorithm

It is known that there are many variables in the circulating fluidized bed combustion system, and there are complex coupling relationships among the variables. The feature selection method based on the correlation between each variable and the target variable ignores the coupling relationship between variables, which will increase the computational complexity of the model. To this end, the neighborhood rough set algorithm is used to analyze the correlation between the main key control parameters that affect the combustion of circulating fluidized bed boilers, and the attribute set that considers the correlation between multiple variables is obtained by reduction. Considering that the data collected in this paper are numerical, the neighborhood rough set model is selected to process the data, which avoids the loss of data information caused by discretization in the process of using the traditional rough set algorithm.
Neighborhood rough set uses neighborhood relationships to divide the domain of discourse [36]. The specific mathematical relationship is defined as follows. Assume that an information system is expressed as I S = ( U , A , V , f ) , where, U is the domain of discourse of the system, which represents a finite set of samples; A is the attribute set of the system, A = C D and C D = , C and D represent the condition attribute and decision attribute, respectively; V is the value range; f : U × A V is a function that represents the mapping relationship between samples and attribute values. For any x i U , define its neighborhood as [37]:
δ ( x ) = { y Δ ( x , y ) δ , y U }
In the formula, δ is the neighborhood radius. Δ ( ) distances are calculated using the Euclidean method.
Δ ( x i , x j ) = ( k = 1 N ( f ( x i , a k ) f ( x j , a k ) ) 2 ) 1 2
According to the neighborhood relationship, the upper and lower approximate relationships are defined, and the specific expressions are as follows.
N ¯ X = x i | δ ( x i ) X , x i U
N _ X = x i | δ ( x i ) X , x i U
In addition, the positive domain and negative domain relations are defined in the neighborhood rough set.
P o s ( X ) = N _ X
N e g ( X ) = U N ¯ X
The attribute reduction process based on the neighborhood rough set algorithm is realized by judging the necessity of the attribute in the decision-making system, and the attribute importance needs to be calculated in a specific implementation way. Assume B C , a B , if satisfies γ B ( D ) γ B { a } ( D ) , it indicates that the attribute a in the set B is necessary for the decision attribute D . If any attribute a in the set B has such a relationship, then the set B is independent of D . Among them, γ B ( D ) is the attribute dependence degree, which can be calculated by the following Formula (7):
γ B ( D ) = P o s B ( D ) U
When B C , a C B , then the attribute importance of a relative to B and D is:
S I G ( a , B , D ) = γ B ( D ) γ B ( a ) ( D )
To sum up, the result of attribute reduction is obtained by the forward greedy method. The specific process of the algorithm is shown in Algorithm 1.
Algorithm 1. Neighborhood Rough Set Attribute Reduction Algorithm.
Input: A complete collection of information table
Step 1 Normalize the information table entered;
Step 2 Calculate the neighborhood radius for each conditional attribute δ ;
Step 3 Calculate the positive domain of the entire attribute relative to the decision attribute Pos C ( D ) , let R E D be ϕ ;
Step 4 Take any one a ( C RED ) and calculate the importance of each attribute separately, namely S i = Sig ( a , C RED , D ) ;
Step 5 Select the attribute with the greatest importance of the reduction attribute, then there is Sig ( a , C RED , D ) = max i S i ;
Step 6 Compare the size of Sig ( a , C RED , D ) and sigctrl , if Sig ( a , B , D ) >   sigctrl ,
Then   RED = RED a   , return to Step 4;
Output: A reduced collection of the information table

2.2. Based on BP Neural Network Combustion Optimization Model

Due to the complexity of the thermal system of a circulating fluidized bed boiler, it is very difficult to establish an accurate mechanism model, and in the real-time performance of the mechanism model, it is difficult to meet the needs of online optimization. Therefore, the BP neural network is used to establish a multi-input and multi-output model that takes the neighborhood rough set attribute reduction set as the model input, and takes the boiler thermal efficiency and nitrogen oxide emission concentration as the model output. In the actual production process, it is difficult to directly measure the thermal efficiency of the boiler, and the inverse balance method is generally used to calculate the value [38].
η = 100 ( q 2 + q 3 + q 4 + q 5 + q 6 + q 7 )
In this paper, in order to realize the online calculation of boiler thermal efficiency, the online calculation model of industrial analysis composition to elemental analysis composition, the online calculation model of desulfurization efficiency and the online calculation model of ash and slag share are respectively programmed.
The online calculation process of boiler thermal efficiency is shown in Figure 3.
In this paper, a three-layer feed-forward neural network with a hidden layer as the tansig function, an output layer as the purelin function, and error backpropagation is used to construct the model. The dynamic characteristics of the model can be expressed as:
y ( n ) = f [ y ( n 1 ) , y ( n n y ) , u ( n 1 ) , u ( n n u ) ]
In the formula, n represents the n t h moment of the system output, n y represents the past n y time of the output value, and n u represents the past n u time of the control value.
In the BP neural network model, the learning rate is an important hyperparameter. If the learning rate is too small, the network convergence speed is slow and it is easy to fall into local optimum. Conversely, if the learning rate is too large, the network will not converge. Therefore, this paper adopts the method of repeated adjustment to finally determine the parameter in the model.

2.3. Based on NSGA-II Algorithm Multi-Objective Optimization Solution

Combustion optimization of circulating fluidized bed boilers is used to make the boiler operating state optimal by changing the operating parameter instructions that affect the boiler combustion optimization goals in the safe and stable operating conditions of the boiler.
In this paper, the goal of combustion optimization is to improve the thermal efficiency of the boiler and reduce the emission concentration of nitrogen oxides. The objective function is shown in Formula (11):
J = max f g l , min f n o x
In Formula (11), f g l indicates boiler thermal efficiency. f n o x indicates the concentration of nitrogen oxide emissions.
Through theoretical analysis, when the thermal efficiency of the boiler is improved, the combustion in the furnace is more complete, and the generation of nitrogen oxide gas will increase. Therefore, the two optimization objectives of improving boiler thermal efficiency and reducing the concentration of nitrogen oxide gas emissions are contradictory, and it is difficult to obtain the optimal solution. Multi-objective compromise optimization is required to obtain a compromise solution.
In this paper, the NSGA-II algorithm is used to solve the proposed multi-objective optimization problem. NSGA-II is a genetic improvement algorithm proposed by Professor Deb [39]. Its core idea is a fast non-dominated multi-objective optimization algorithm with an elite retention strategy. Before the selection, crossover, and mutation operations in the algorithm, a fast non-dominated sort is performed to determine the dominance and non-domination relationship between populations. In addition, the diversity of the population is guaranteed by crowding degree calculation and elite strategy selection.
Compared with other multi-objective optimization algorithms, such as multi-objective particle swarm optimization algorithm, multi-objective differential evolution algorithm, multi-objective genetic algorithm, etc., this algorithm avoids problems such as premature convergence, poor population diversity, and easy fall into local optimum. It is suitable for solving the dual-objective optimization problem in this paper. The NSGA-II algorithm process used for the multi-objective optimization solution is shown in Figure 4.
In the multi-objective optimization process using the NSGA-II algorithm, the non-dominated solution set will constitute the Pareto front. Generally speaking, all the solutions on the front can be used as optimization results, but it is usually necessary to optimize again to obtain an optimal solution. Optimization methods based on multi-objective optimization results include the AHP (analytic hierarchy process), the TOPSIS (Technique for Order Preference by Similarity to Ideal Solution), etc. The AHP is highly subjective and will be affected by the preferences of decision makers and limited by the number of samples. However, the method is simple and easy to accept. In order to analyze the optimization results more objectively and systematically and make automatic selections, this paper adopts the TOPSIS to screen out the compromise solution under the optimization objective from the optimal solution set of the Pareto frontier. The specific steps of TOPSIS are as follows [40]:
(1)
Standardize processing to obtain the decision matrix B = ( b i j ) n × m .
b i j = f i ( x j ) f i min f i max f i min
In the formula, m is the total number of non-inferior solutions on the Pareto frontier, f i ( x j ) is the function value of the non-inferior solution x j with respect to the target i , f i max and f i min represent the maximum and minimum values of the target i , respectively.
According to the decision matrix and the target weight W i , the weighted standardized decision matrix V = ( v i j ) n × m is obtained, where v i j = b i j × W i .
(2)
Determine the positive ideal point A + and the negative ideal point A .
A + = ( v 1 + , v 2 + , , v i + ) , v i + = max ( v i 1 , v i 2 , , v i m ) A = ( v 1 , v 2 , , v i ) , v i = m ix ( v i 1 , v i 2 , , v i m )
In, i = 1 , 2 , , n .
(3)
Use the Euclidean distance method to calculate the distance between each non-inferior solution and the positive and negative ideal points.
d j + = i = 1 n ( v i + v i j ) 2
d j = i = 1 n ( v i v i j ) 2
(4)
Calculate the relative closeness of each non-inferior solution and then take the maximum value in the order of relative closeness from large to small as the optimal compromise solution.
T j = d j d j + + d j
In the formula, d j + , d j represent the Euclidean distance between the non-inferior solution x j and A + , A , respectively.
The relative closeness of each non-inferior solution is calculated by the TOPSIS. The larger the value is, the closer it is to the positive ideal point, so this value is taken as the compromise solution.

3. Case and Study

3.1. Variable Selection

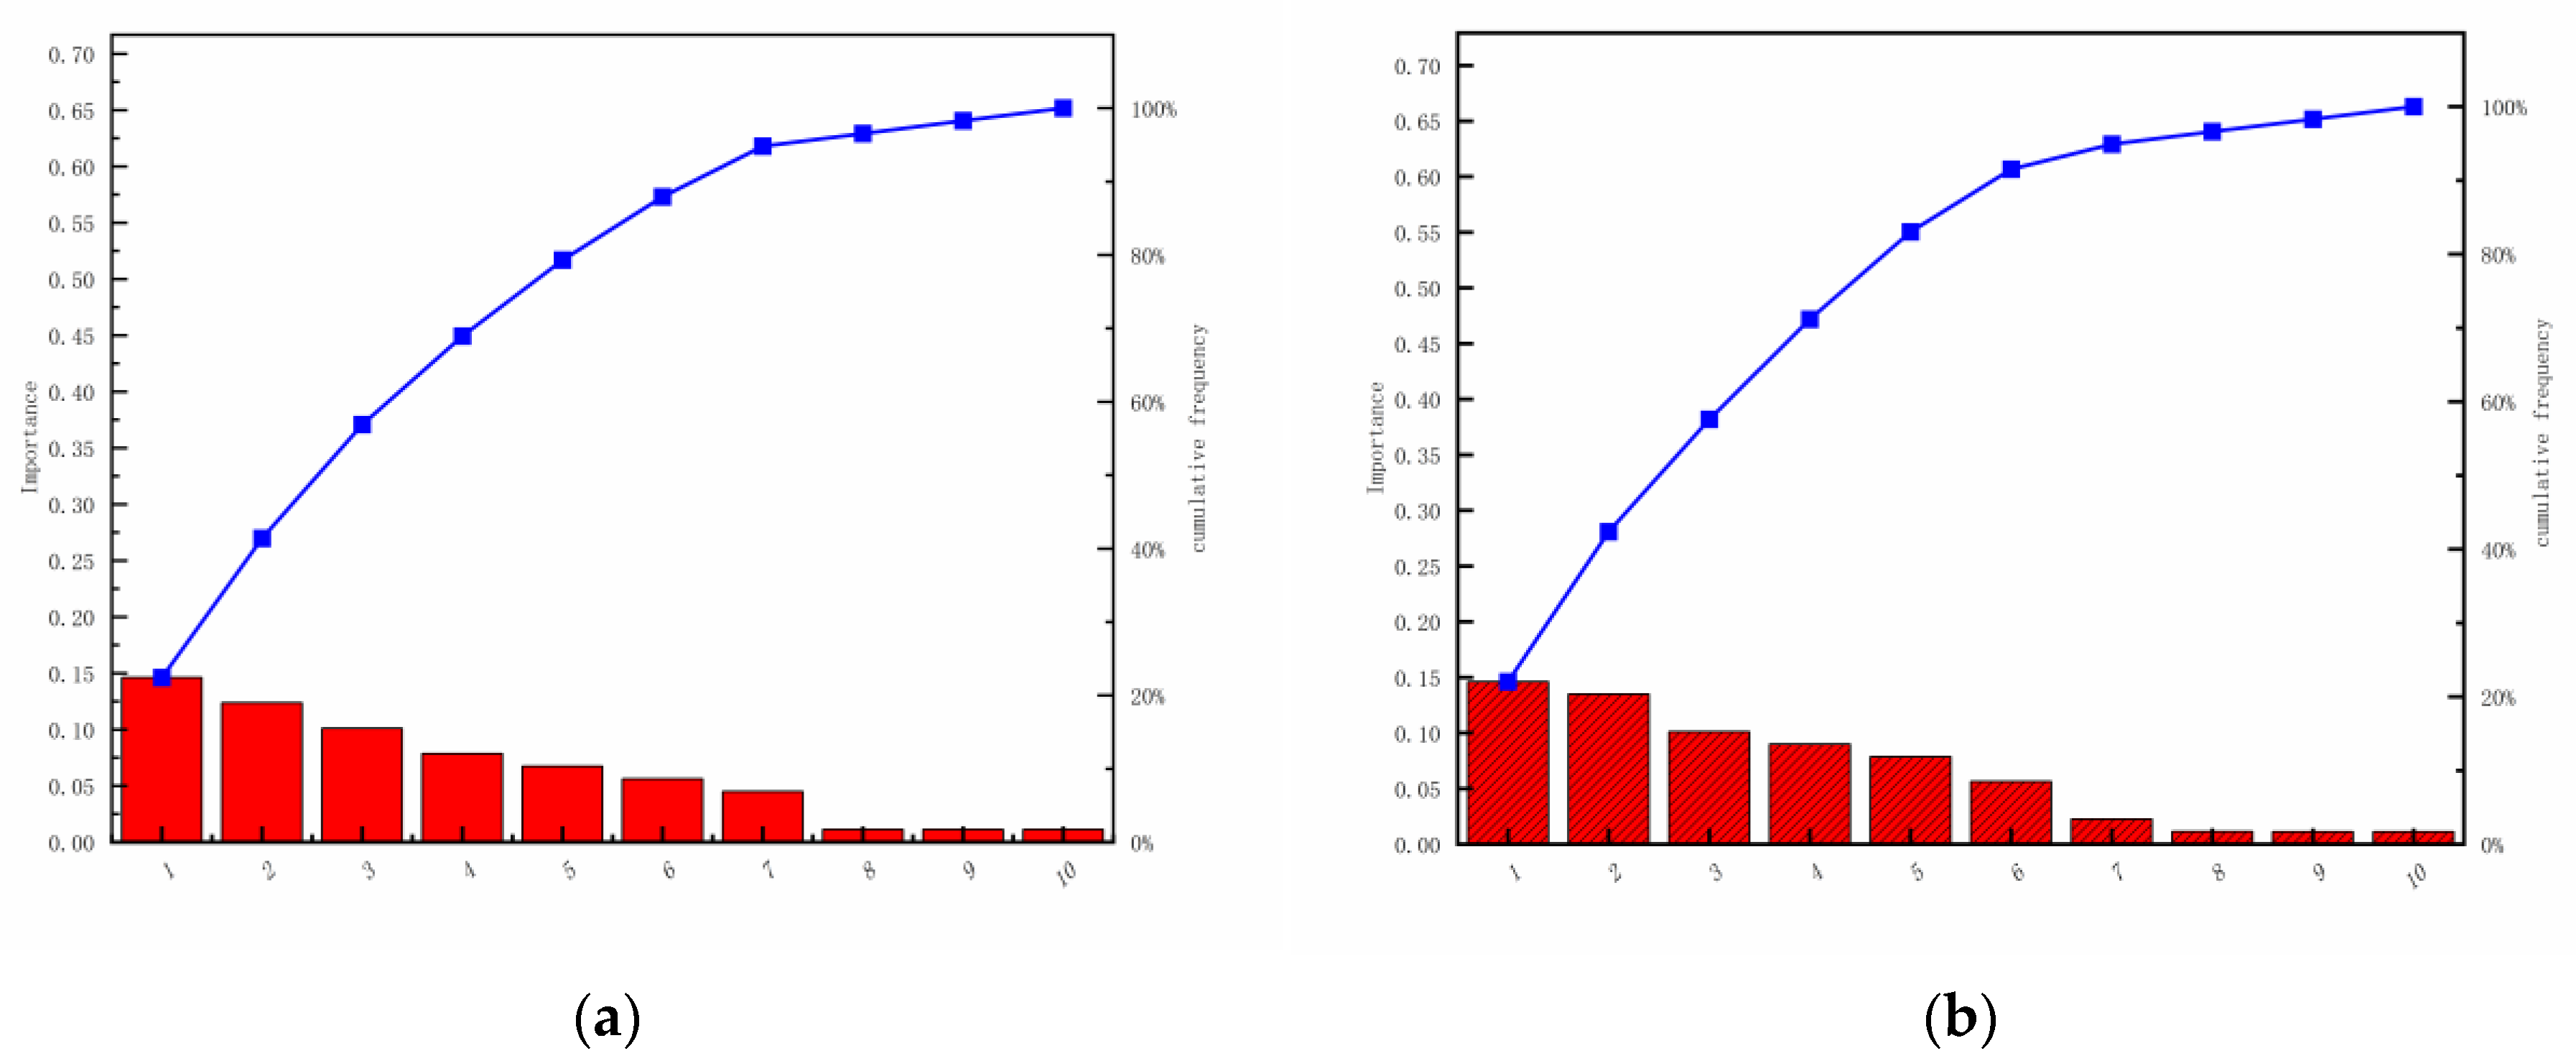
According to the established combustion optimization objectives, combined with the relevant mechanism analysis, the control parameters that affect the coal volume, air volume, slag discharge volume, and air distribution mode are selected as the initial input variables of the model. Specifically, it includes two primary fan frequency conversion instructions ( x 1 , x 2 ), two secondary fan frequency conversion instructions ( x 3 , x 4 ), eight coal feeder coal supply instructions ( x 5 x 12 ), six slag cooler frequency conversion instructions ( x 13 x 18 ), and eight secondary air baffle opening instructions on the left and right walls ( x 19 x 26 ). There are 26 variables in total. In order to better reduce the complexity of the model and improve the calculation efficiency of the model, the neighborhood rough set attribute reduction method is used to select the input variables of the model and reduce the dimension of the input variables. In the attribute reduction process, the size of the neighborhood radius of each attribute is directly related to the attribute reduction result. The size of the neighborhood radius is closely related to the parameter λ in the attribute reduction algorithm. If the value of λ is too large, the result of attribute reduction is an empty set. Reversely, if the value of λ is too small, the program will report an error. After debugging, parameter λ was set to 3.0. The parameter that controlled the importance lower limit of the algorithm was empirically valued at 0.01. The results of the importance of each variable in the attribute reduction process were shown in Table 1. Figure 5a shows the attribute ranking results of nitrogen oxide emission concentration, and Figure 5b shows the attribute ranking results of boiler thermal efficiency.
Boiler thermal efficiency and NOx emission concentration were taken as decision-making attributes, and 26 control parameter instructions were used as conditional attributes to perform attribute reduction. The results of attribute reduction are shown in Table 1. After synthesis, 1# primary fan frequency conversion instruction ( x 1 ), 1# secondary fan frequency conversion instruction ( x 3 ), 2 # secondary fan frequency conversion instruction ( x 4 ), 1# and 2# coal feeder coal supply instructions ( x 5 , x 6 ), 1# slag cooler frequency conversion instruction ( x 13 ), secondary air baffle opening instruction on left front wall lower part ( x 20 ), secondary air baffle opening instruction on left rear wall upper part ( x 21 ), secondary air baffle opening instruction on left front wall lower part ( x 22 ), secondary air baffle opening instruction on right front wall upper part ( x 23 ), and secondary air baffle opening instruction on right rear wall upper part ( x 25 ) were selected as the model input variables after attribute reduction.

3.2. Optimization of High Load Combustion Regulation Instructions in the Unit

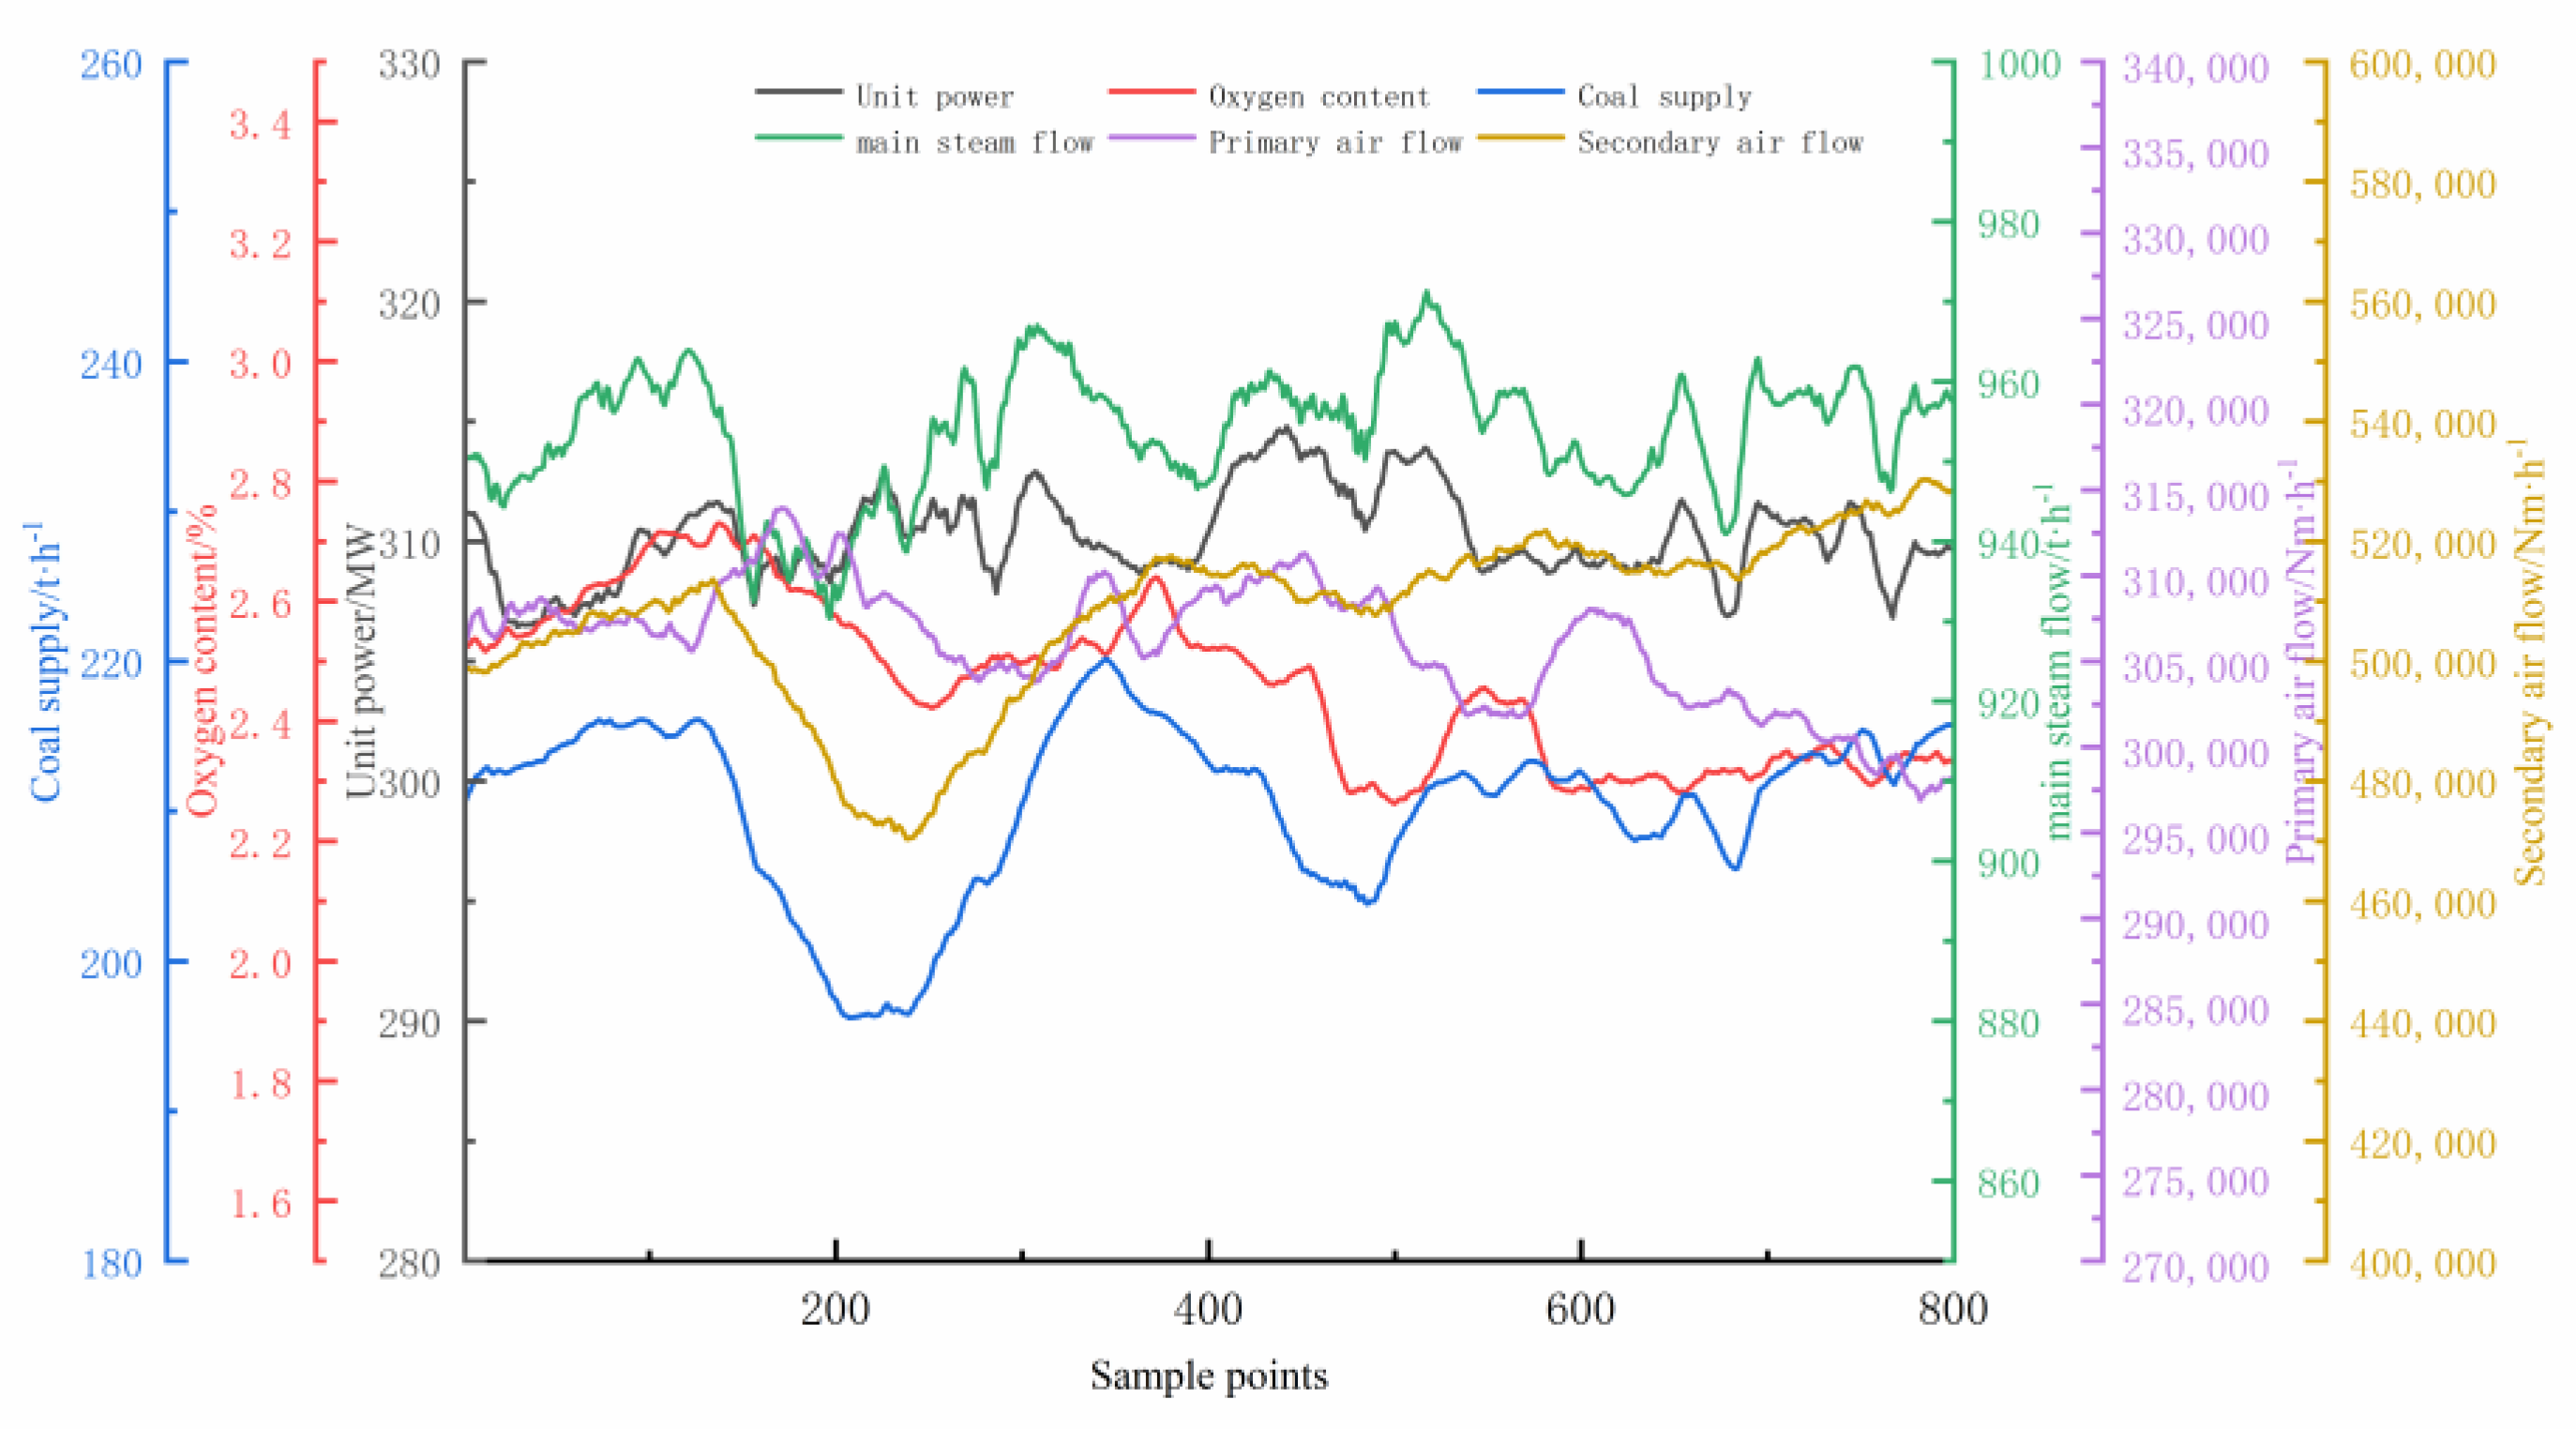
The process is as follows: View the load history operation curve of a 330 MW circulating fluidized bed boiler unit. Then select the steady-state operating interval data of one of the sections with an average load of about 310 MW for optimization and analysis. Among them, the sampling period of the data is 5 s. The actual operating parameter curve of the unit is shown in Figure 6 below.
By observing the six main operating parameter curves of unit power, oxygen content, coal supply, main steam flow, primary air flow, and secondary air flow in Figure 6, it can be found that they basically maintain a small range of fluctuations, which is consistent with the characteristics of stable operation of the unit.
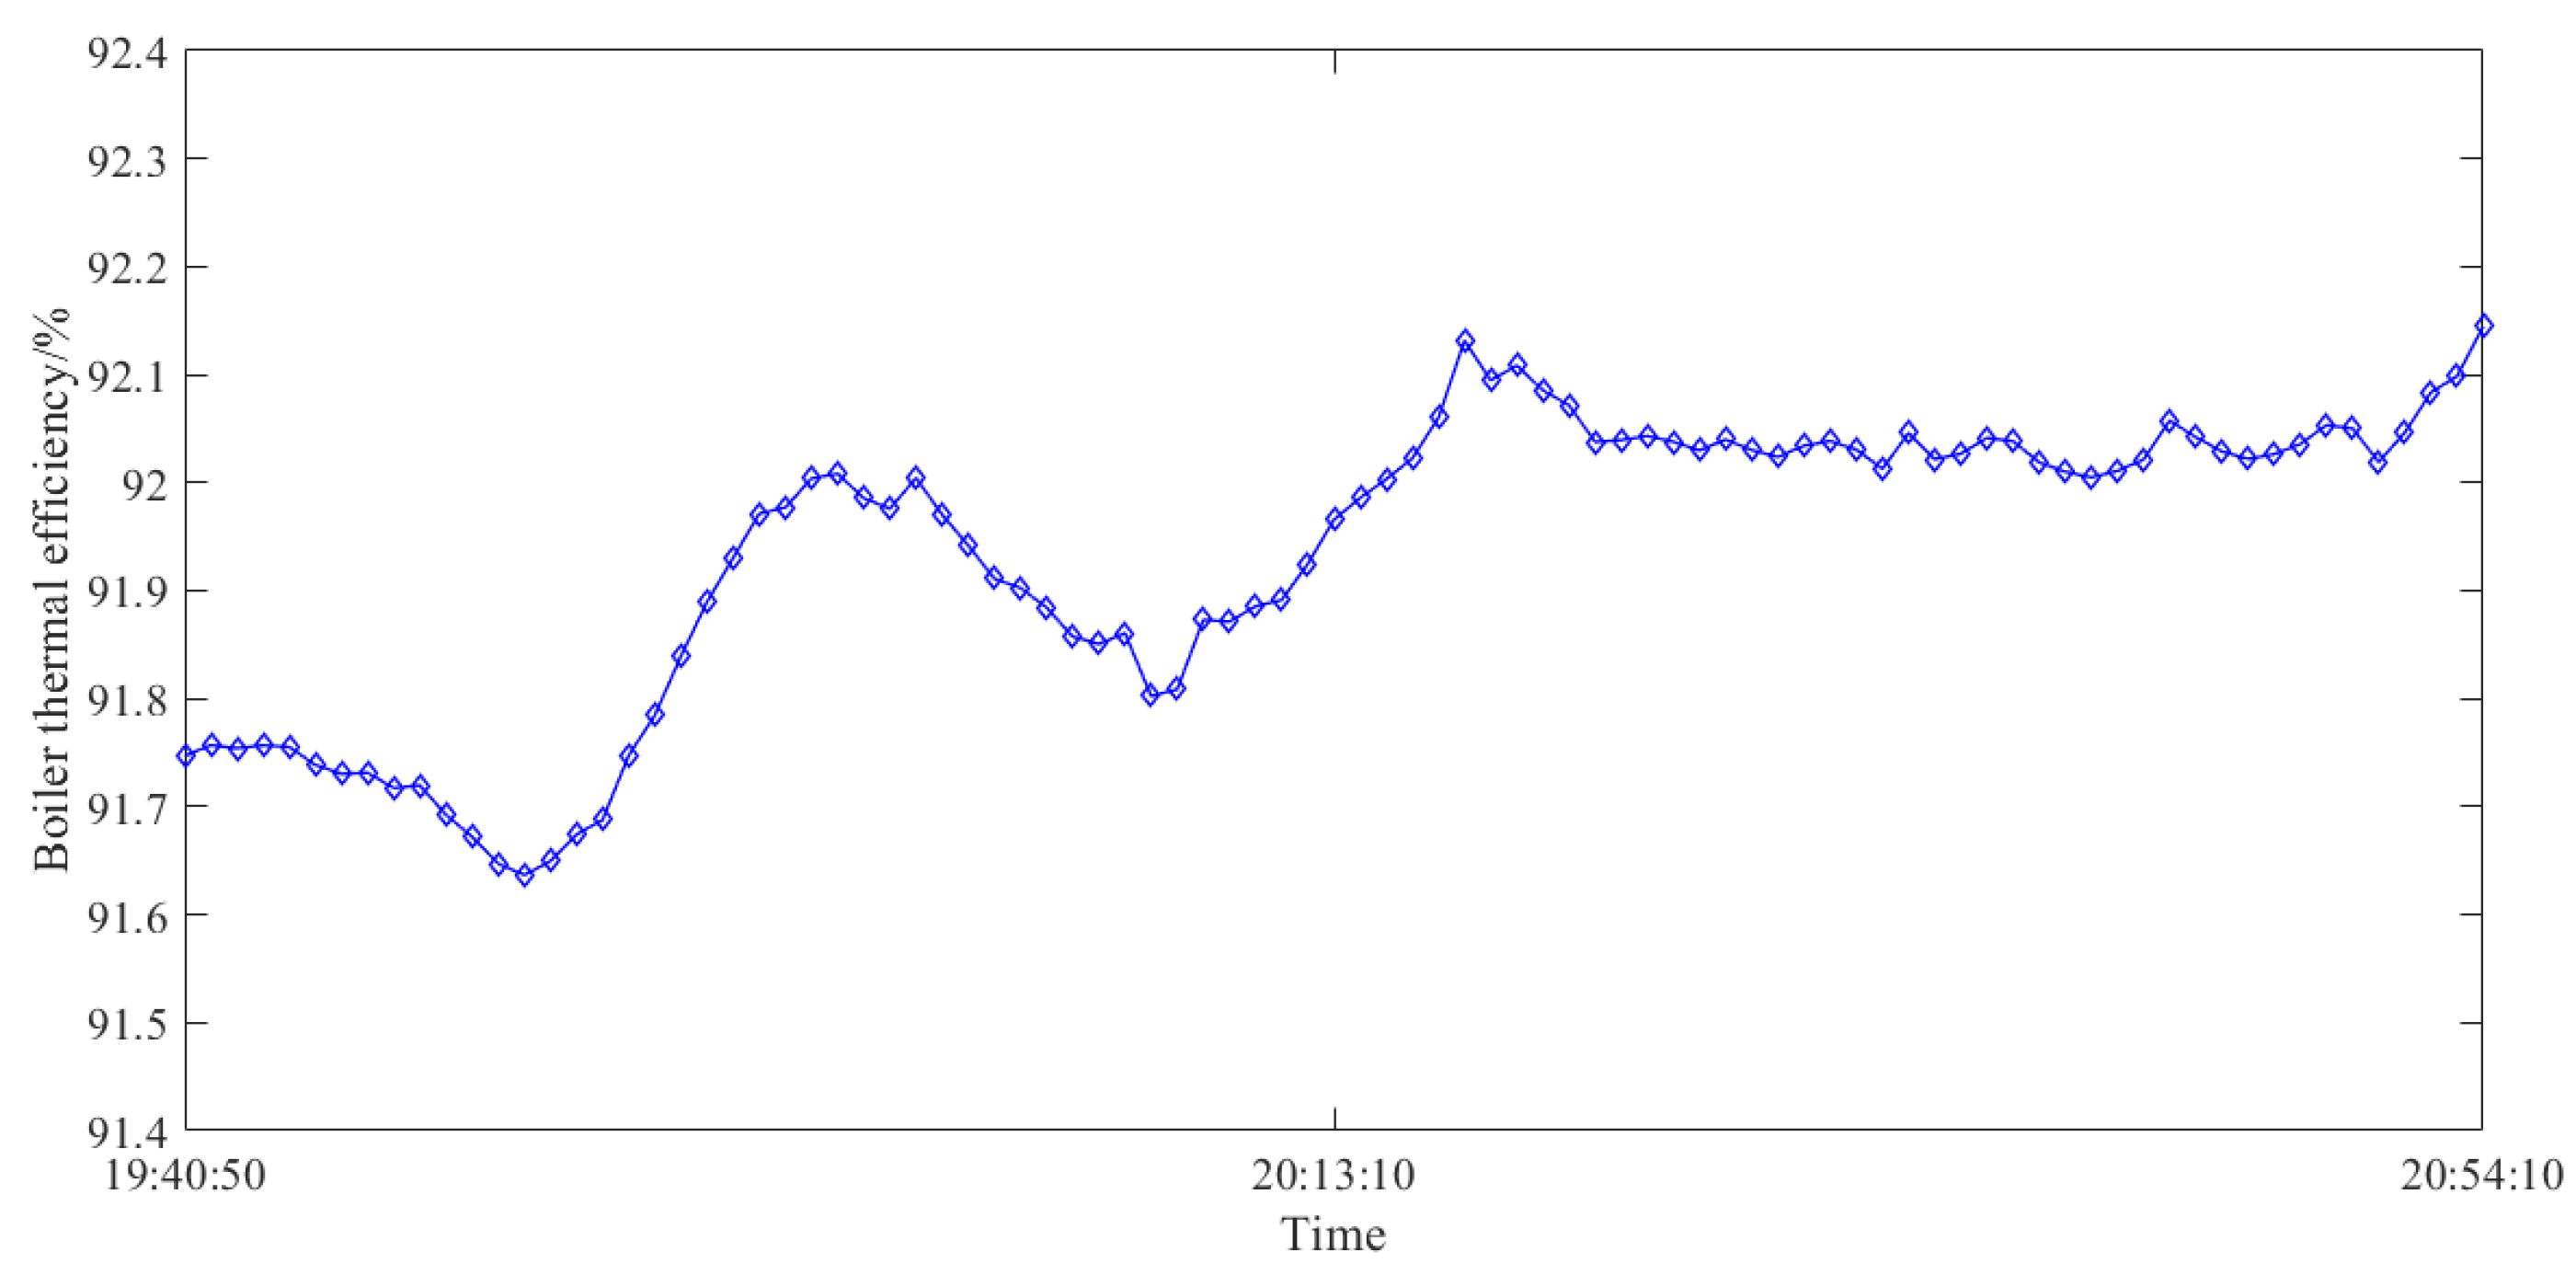
Based on the online calculation model of boiler thermal efficiency, the boiler thermal efficiency was calculated under the steady load condition of 310 MW. In this process, considering the large amount of data collected and the stability of the operating conditions, the data sampling frequency was adjusted to 50 s. The input data for the model were as follows. The industrial composition results of the furnace coal, the coal volume, the inlet temperature of the slag cooler, the outlet temperature of the slag cooler, the cooling water flow rate of the slag cooler, the cooling water inlet temperature, the cooling water outlet temperature, the sulfur dioxide concentration of the desulfurization island inlet, the oxygen content of the flue gas, the exhaust temperature, and the ambient temperature. The calculation results of the boiler thermal efficiency are shown in Figure 7.
The calculation results of the boiler thermal efficiency presented in Figure 7 indicate that it remained basically stable during this time period, with values fluctuating between 91.64% and 92.14%. The boiler thermal efficiency increased slightly due to the gradual decrease of unit exhaust temperature.
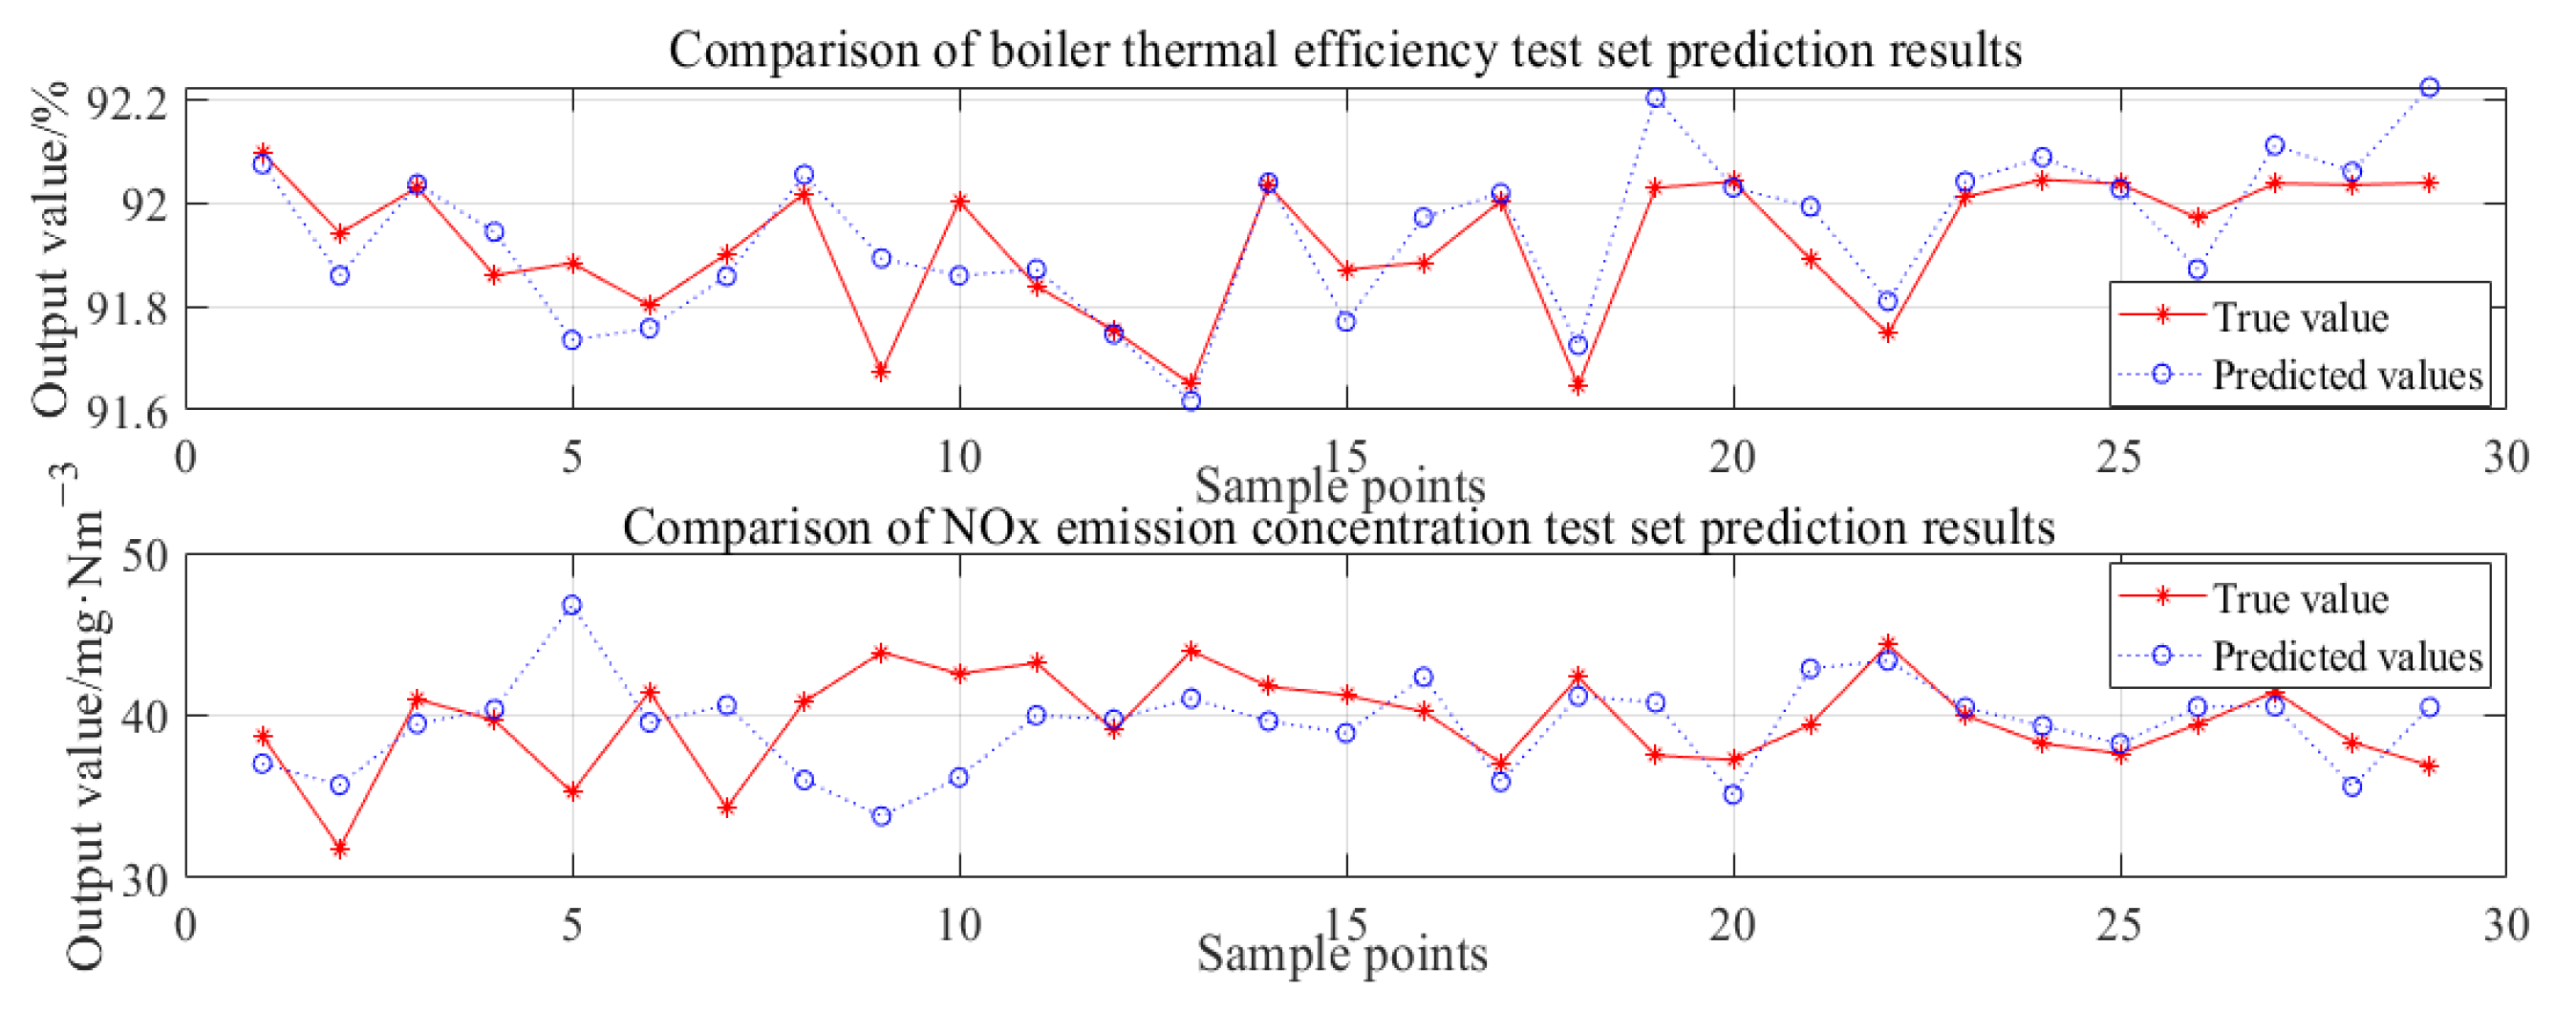
The variable set after attribute reduction was used as the input variable of the boiler combustion model and the multi-input/multi-output model was established using the BP neural network. The output of the model was the boiler thermal efficiency and the concentration of nitrogen oxide emissions. A total of 89 sets of historical data were collected for modeling, and 60 sets of data were randomly selected as the model training set. The remaining 29 sets of data were used as the model verification set. Finally, after repeated debugging, the root mean square error and correlation coefficient were used to determine the number of nodes in the hidden layer of the model. The model learning rate was set to 0.8. The empirical formula for calculating the number of nodes in the hidden layer of the BP neural network is: j = i + k + a . In the formula, j represents the number of nodes in the hidden layer of the model; i represents the number of nodes in the input layer of the model; k represents the number of nodes in the output layer of the model; a is a random number, generally ranging from 1–10. Table 2 counts the evaluation index values of the BP neural network when selecting different hidden layer nodes.
In Table 2, the first 10 sets of data are the evaluation index results obtained after taking values based on empirical formulas. In these results, when the number of hidden layer nodes was selected as 7, the correlation coefficient between the model prediction results and the real value reached 0.9179, and the mean square errors of boiler thermal efficiency and nitrogen oxide emission concentration were 0.0889% and 2.905 mg/Nm3, respectively. Considering that the number of model input nodes was 11, if the number of hidden layer nodes in the model was less than this value, underfitting might occur. Therefore, the debugging was continued based on taking the empirical formula as the maximum value, and the final number of hidden layer nodes was determined to be 21. At this time, the correlation coefficient reached 0.9246, and the prediction effect of the model was better. Figure 8 shows the results of model validation.
Figure 8 shows that the predicted output values of the neural network model coincide with the actual values. Then statistical analysis was conducted on the prediction results of boiler thermal efficiency and nitrogen oxide emission concentration, recorded in Table 3. Between them, the root mean square error of the boiler thermal efficiency prediction result is 0.0899%, the average absolute error is 0.0692%, the maximum absolute error is 0.2191%, and the minimum absolute error is 0.0058%. The root mean square error of the NOx emission concentration prediction result is 3.942 mg·Nm−3, the average absolute error is 2.921 mg·Nm−3, the maximum absolute error is 11.5311 mg·Nm−3, and the minimum absolute error is 0.4826 mg·Nm−3. The error in boiler thermal efficiency and the nitrogen oxide emission concentration is within the permissible range and relatively small, indicating that the model has good prediction generalization ability.
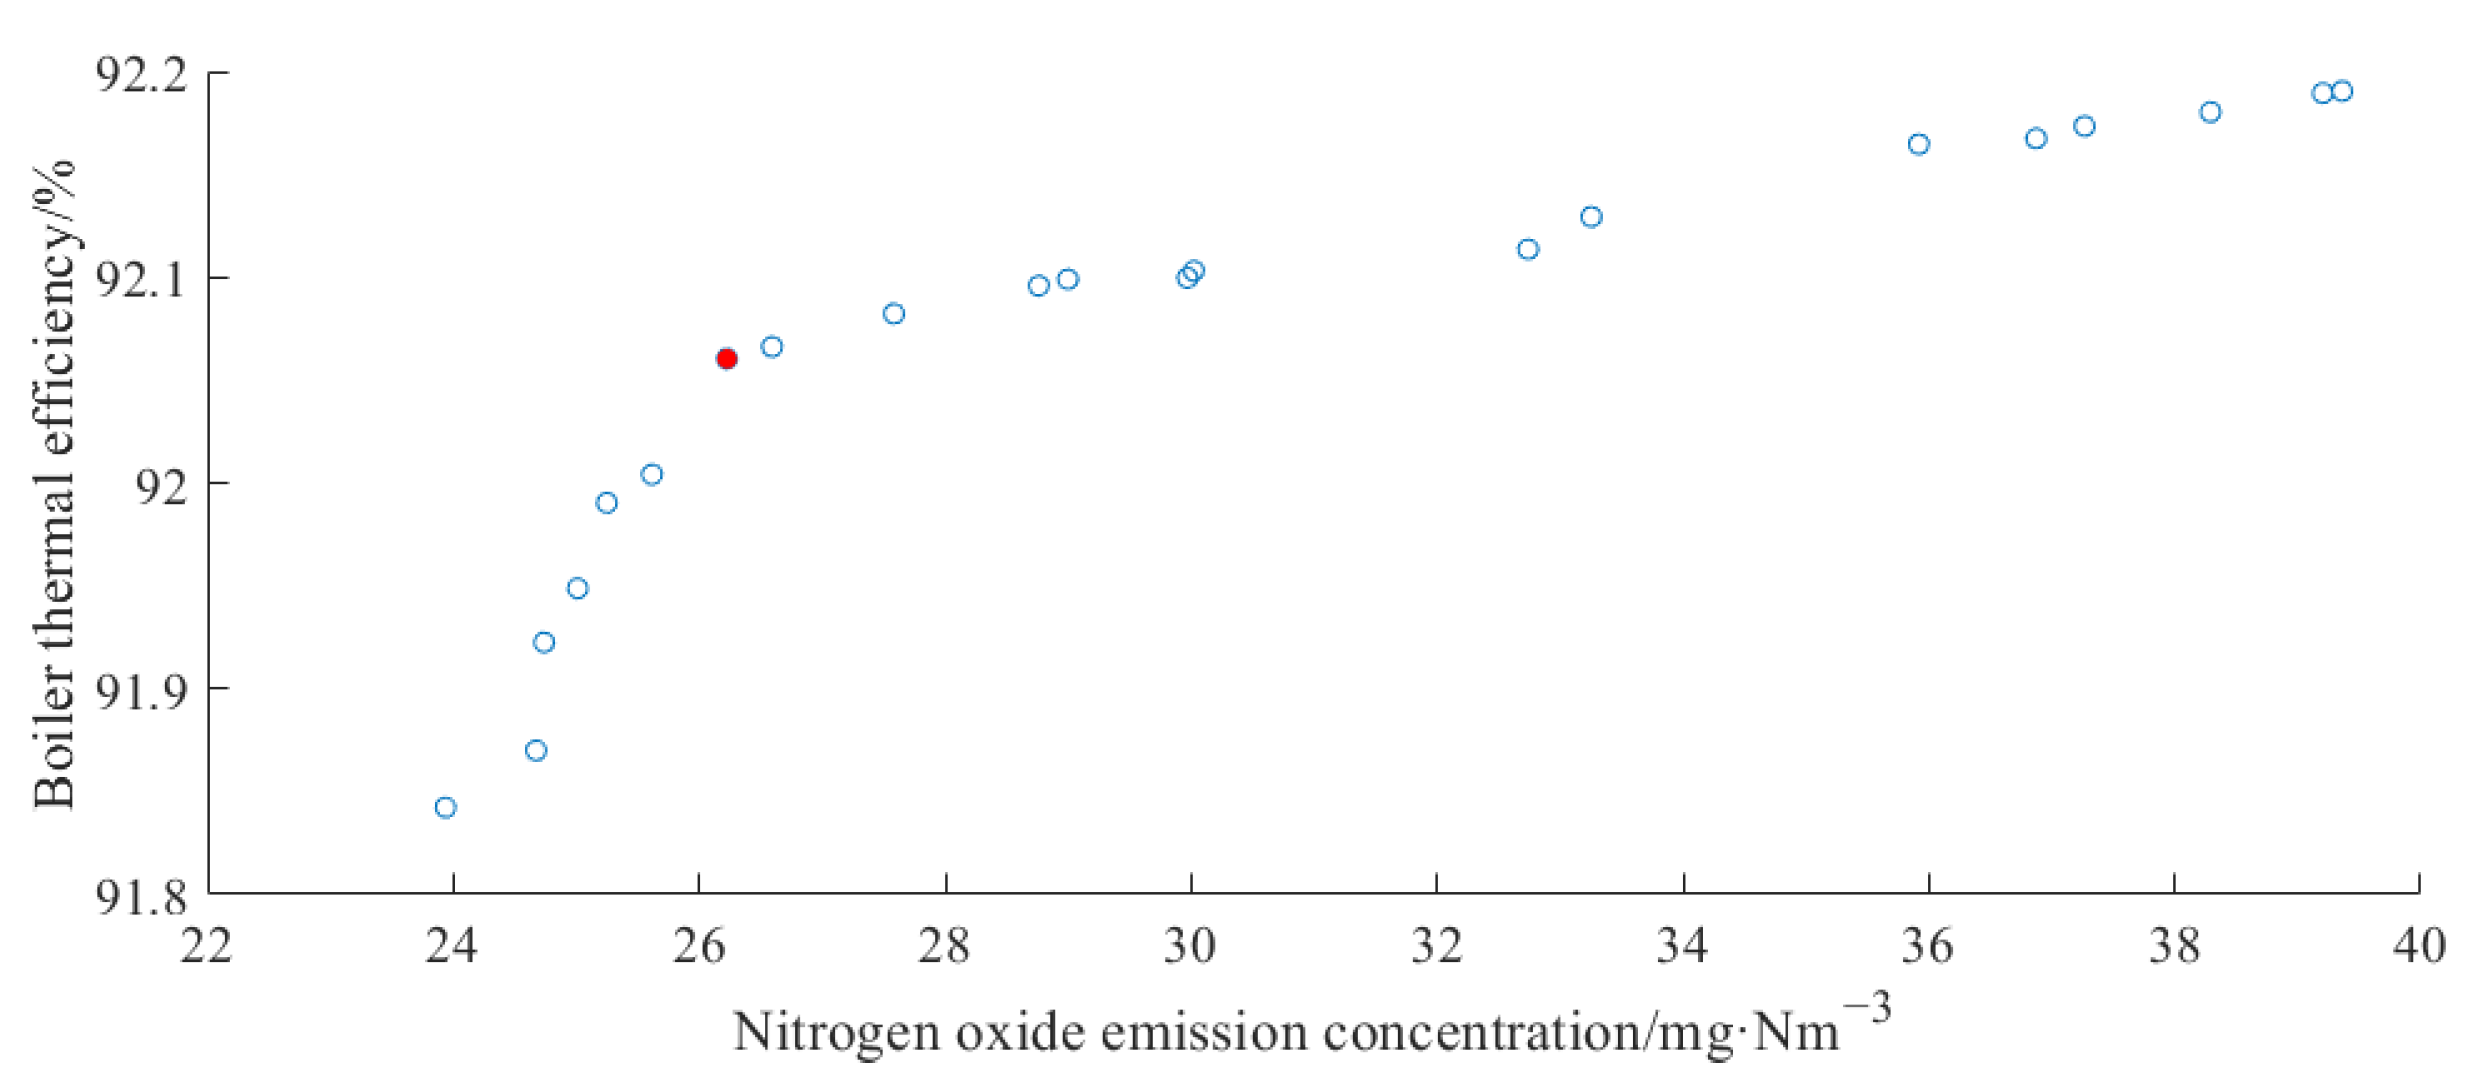
The operating parameter instructions in this model included the inverter command and the secondary air baffle opening instruction. Typically, the frequency converter could be adjusted from 0 Hz to 50 Hz, and the secondary air baffle opening adjustment range was 15% to 100%. Considering the requirements of stable operation and bed temperature stability, combined with the operating value of each parameter under the unit’s 310 MW load condition, the regulation range of the parameters for multi-target optimization was set to ±30%. In the multi-objective optimization algorithm, the population size was set to 70. The crossover probability was 0.6. The mutation probability was 0.4. The number of iterations was 200.
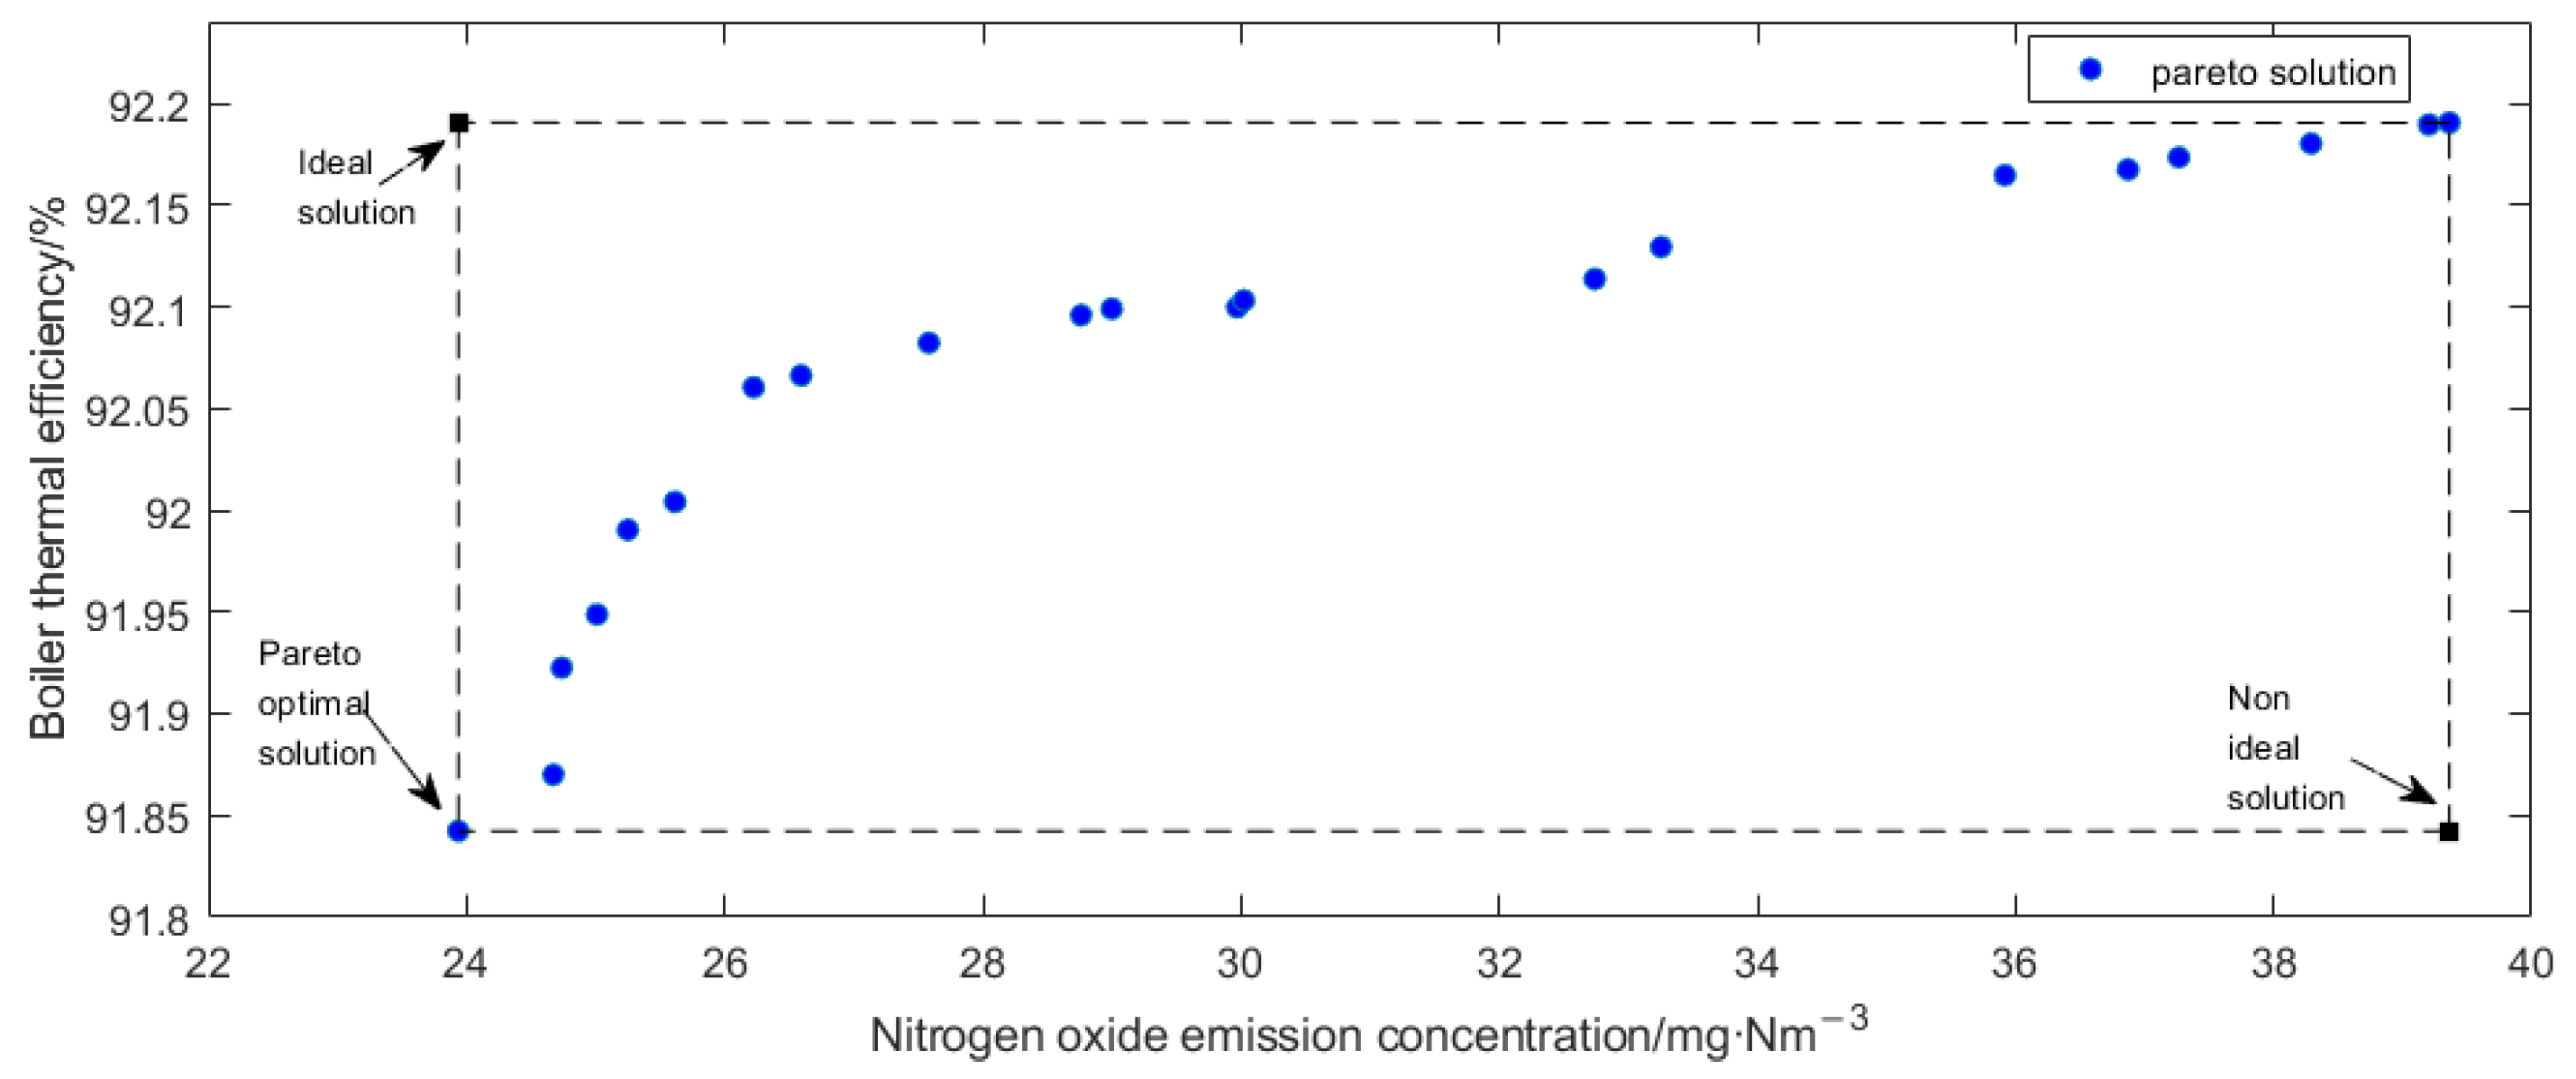
In Figure 9, the changing trend of the Pareto front shows that the higher the thermal efficiency of the boiler, the greater the concentration of nitrogen oxide emissions, which is consistent with the conclusion of the qualitative analysis of the mechanism of nitrogen oxide emissions [41,42,43,44,45]. The point marked red on the front surface of Pareto was selected as the operation guidance point. The boiler thermal efficiency was 92.07%, and the NOx emission concentration was 26.59 mg·Nm−3. Then, the optimization results were compared with boiler thermal efficiency of 92.00% and NOx emission concentration of 31.61 mg·Nm−3 obtained by the traditional combustion optimization method. The thermal efficiency of the boiler was increased by 0.07%. The NOx emission concentration was reduced by 5.02 mg·Nm−3. Despite the fact that each point on the Pareto front may be chosen as the result of multi-objective optimization, this work proposed to automatically screen each point on the Pareto front based on the TOPSIS in order to avoid the directional problem of manual selection. By calculating the distance between each point on the Pareto front and the positive ideal point and negative ideal point, the target point, which is the closest to the positive ideal point and away from the negative ideal point was obtained. This point was also a compromise optimal solution.
In Figure 10, the Pareto optimal solution was determined by computing the relative proximity of the non-inferior solutions on the Pareto front using the TOPSIS method and choosing the point with the highest relative closeness. At this point, the boiler thermal efficiency was 91.84%, and the nitrogen oxide emission concentration was 23.94 mg·Nm−3. The nitrogen oxide emission concentration was reduced by 7.67 mg·Nm−3 and the boiler thermal efficiency was reduced by 0.16% when compared to the target point established using the conventional combustion optimization approach. Between them, strategy 1 was a manual selection method, which selected a non-inferior solution closest to the positive ideal point from the Pareto front based on experience as the target solution. Strategy 2 was the target solution obtained by the TOPSIS method. The statistical results are shown in Table 4.
To more intuitively reflect the regulation of the fan, the relationship between the fan frequency conversion instruction, the fan speed, and the fan volume was drawn by the measured data.
In Figure 11, the relationship between the fan frequency conversion instruction and the fan speed was identified by the measured data. They were approximately linear from the figure. The linear relationship could be expressed as y = 30*x − 2.5.
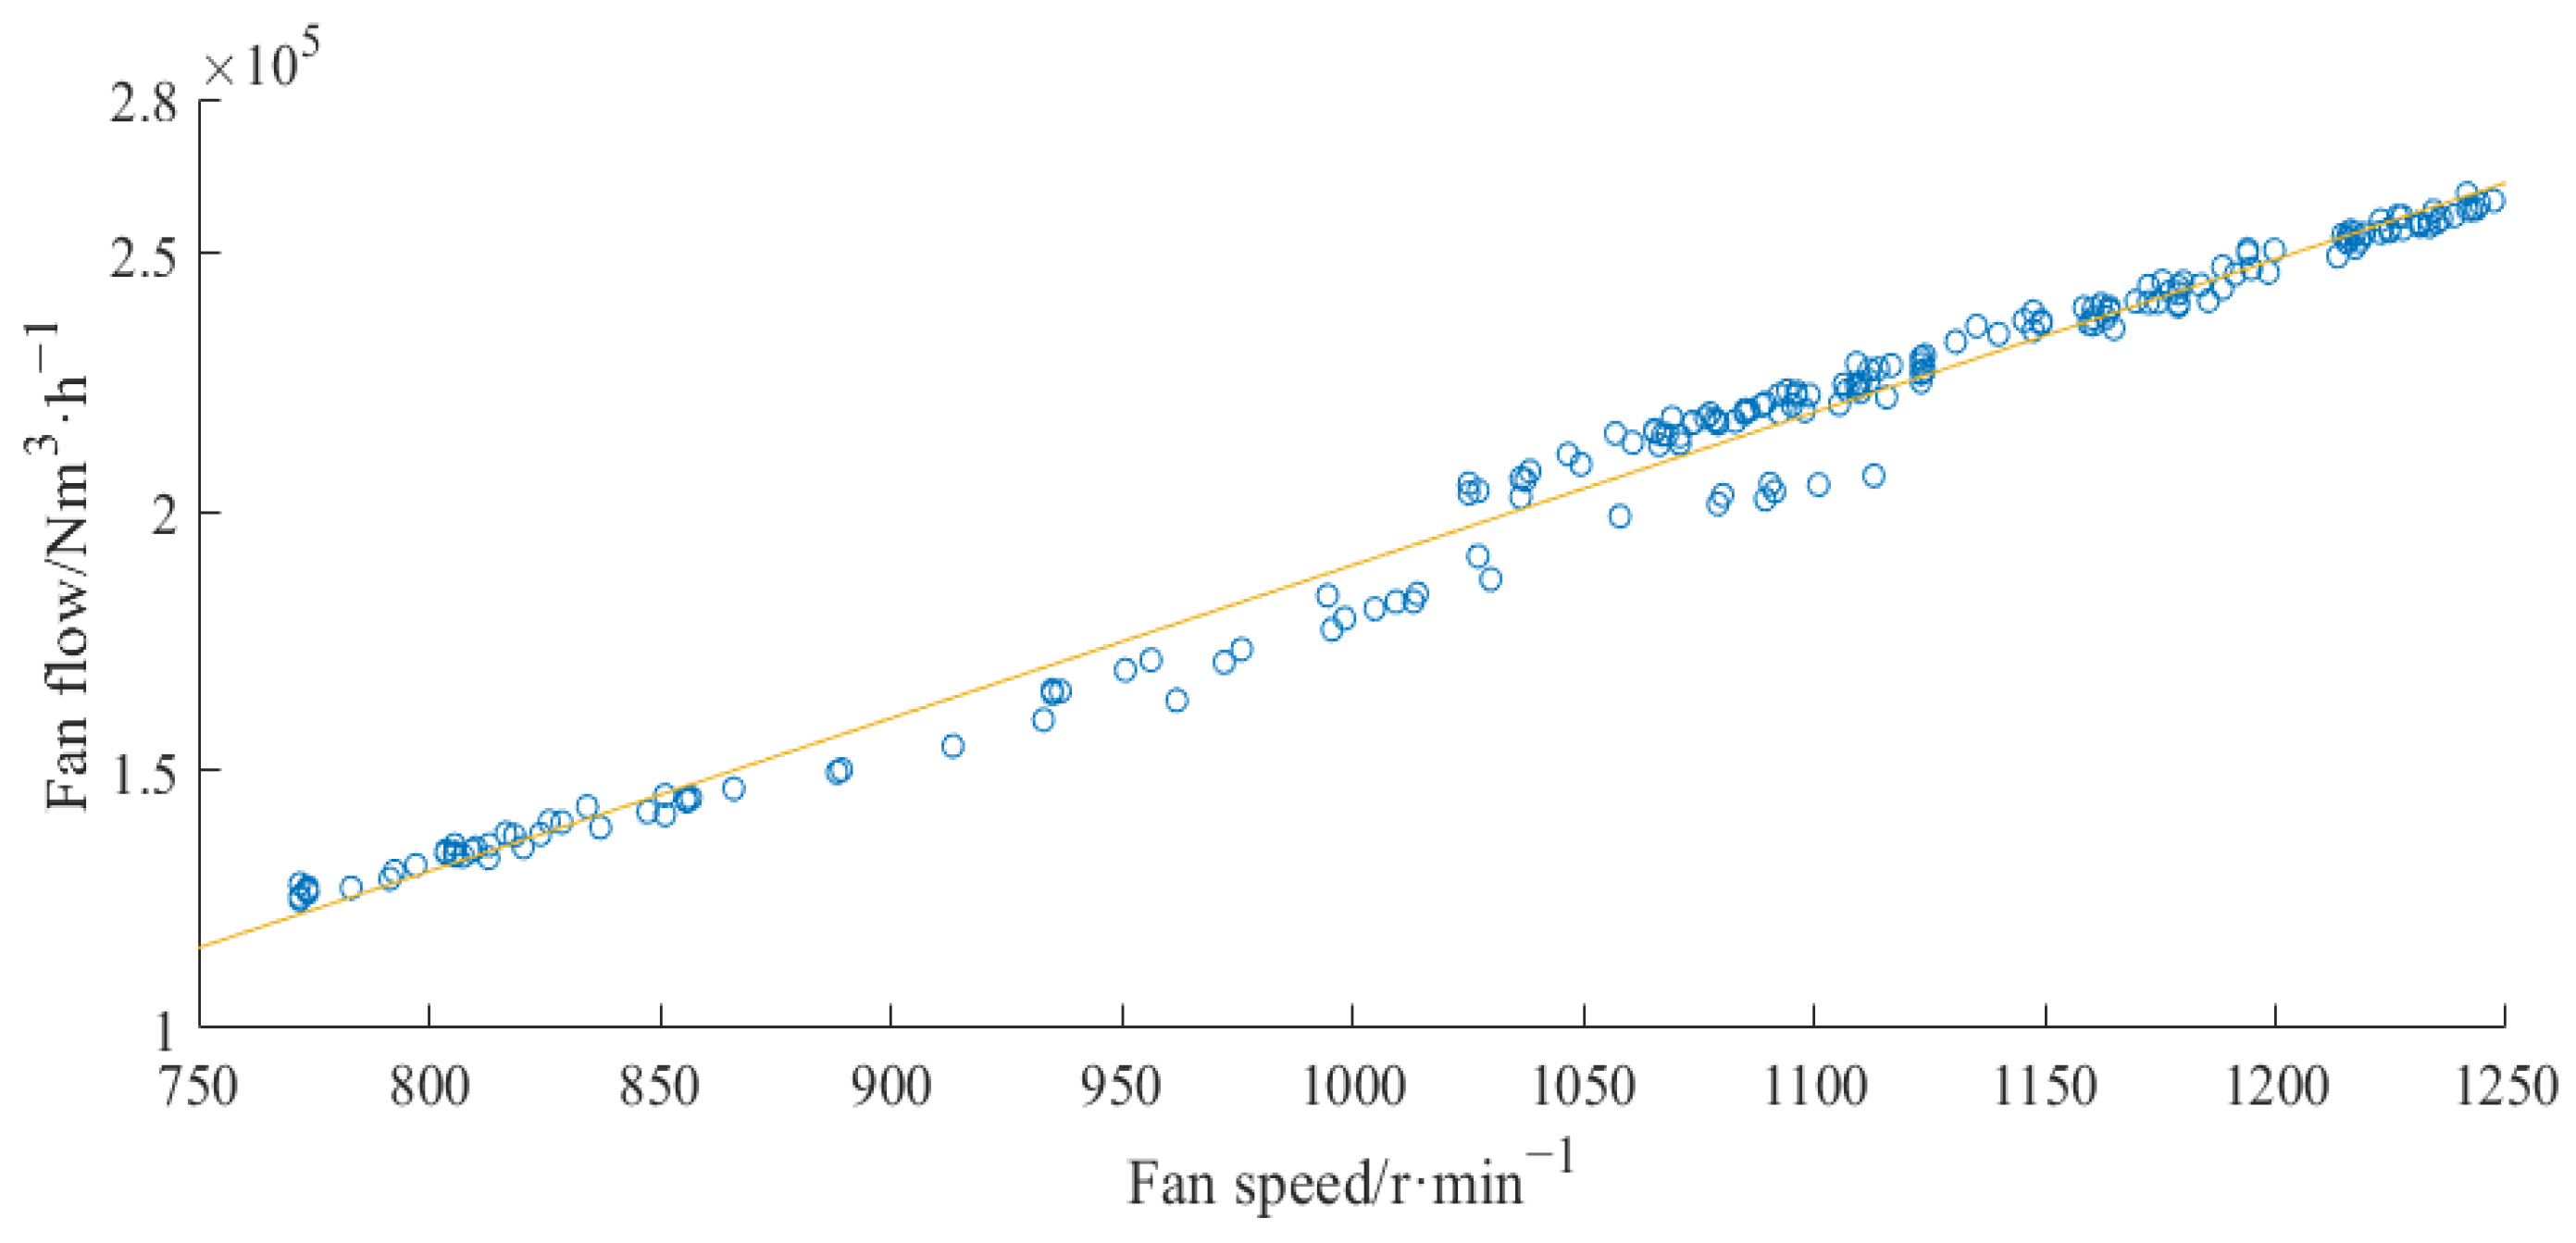
Similarly, in Figure 12 the relationship curve between the fan speed and the fan volume was obtained by fitting the measured data. They were representedby the linear function relationship y = 300*x – 110,000.
The changes before and after the optimization of the main operating parameter instructions are compared in Table 4. Under the Strategy 1 scenario, the frequency conversion instruction of the 1# primary fan was increased by 0.43 Hz, the frequency conversion instruction of the 1# secondary fan was increased by 0.51 Hz, and the frequency conversion instruction of the 2# secondary fan was increased by 0.45 Hz. From the relationship function between the fan frequency conversion instruction, fan speed, and air volume, the air volume of the 1# primary fan increased by 3870 Nm3/h, and the total air volume of the secondary fan increased by 8640 Nm3/h. The 1# coal feeder coal supply instruction increased by 1.45 t·h−1, while the 2# coal feeder coal supply instruction decreased by 0.23 t·h−1, and the total coal volume increased by 0.4 t·h−1. After optimization, the unit’s coal volume, primary air volume, and secondary air volume increased accordingly, but the increase in primary and secondary air volumes was more significant. The upper part of the furnace would have more distributed charcoal particles participating in the exothermic reaction of combustion, thereby improving the combustion efficiency in the furnace. At the same time, the increased air volume made the flue gas flow in the furnace faster and removed a lot of heat, shortened the residence time of carbon residue particles in the furnace, and reduced the initial nitrogen oxide generation to a certain extent.
When Strategy 2 was adopted, the frequency conversion instruction of the 1# primary fan was reduced by 0.9 Hz, that is, the primary air volume was reduced by 8100 Nm3/h. The 1# and 2# secondary frequency conversion instructions were reduced by 0.11 Hz in total, and the secondary air volume could be reduced by 990 Nm3/h after calculation. The 1# and 2# coal feeder coal supply instruction cumulatively increased by 0.24 t·h−1. Compared with the optimization scheme of Strategy 1, the reduced primary air volume and the increased coal volume worsened the fluidization state of the materials in the furnace, and the combustion of residual carbon particles was incomplete, which would cause a decrease in the thermal efficiency of the boiler. The reduced secondary air volume reduced the oxidizing atmosphere in the furnace, which was more conducive to promoting the formation of nitrogen oxides. Compared with the traditional combustion optimization method, the combustion optimization scheme 1 and 2 mentioned in this paper can better balance the pollutant gas emission and combustion economy.

4. Discussion

4.1. Effect of Feature Selection on Prediction Results

In order to further illustrate the importance of using feature selection and appropriate feature selection methods, the combustion optimization models without feature selection and after feature selection were established for comparison and analysis in light of the high-load operating conditions of the unit.
The input variables in the combustion optimization model without feature selection are 26 initial input variables selected. For the modeling process using feature selection, the Spearman feature variable reduction method is first used for comparative analysis. The correlation coefficients of 26 initial input variables of the model and boiler thermal efficiency and nitrogen oxide emission concentration, respectively, are calculated. When the target variable is the boiler thermal efficiency, the variables whose correlation coefficient value is greater than 0.4 are selected to form a reduced set, and the results are 1# secondary fan frequency conversion instruction (0.54), 2# secondary fan frequency conversion instruction (0.53), 1# coal feeder coal supply instruction (0.512), 8# coal feeder coal supply instruction (0.523), 2# slag cooler frequency conversion instruction (0.510), 4# slag cooler frequency conversion instruction (0.450), 6# slag cooler frequency conversion instruction (0.411), secondary air baffle opening instruction on the left front wall lower part (0.625), secondary air baffle opening instruction on the left rear wall upper part (0.429), secondary air baffle opening instruction on the left rear wall lower part (0.774), secondary air baffle opening instruction on the right front wall upper part (0.404), and secondary air baffle opening instruction on the right front wall lower part (0.808). When the target variable is nitrogen oxide emission concentration, the correlation coefficient values are all small, and the results with a value greater than 0.2 are selected, including the secondary air baffle opening instruction on the left rear wall lower part (0.385), the secondary air baffle opening instruction on the right front wall lower part (0.26), and the secondary air baffle opening instruction on the right rear wall upper part (0.334). In this case, there are only two intersections of the reduction results of the two target variables. The main reason is that this method only considers the degree of correlation between the variable and the target variable, and does not analyze from the perspective of the influence of the variable combination on the target variable. Therefore, the feature selection based only on the value of the correlation coefficient is likely to result in inaccurate reduction results. However, the reduction results based on the neighborhood rough set method proposed in this paper fully consider the influence of variable combinations on the target variable so that there are 9 intersections of the reduction results of the two target variables.
Afterward, the combustion optimization model A without feature selection and the combustion optimization model B with neighborhood rough set feature selection are respectively established, and the prediction effects of the two models are compared and analyzed with four evaluation indicators: root mean square error, mean absolute error, maximum absolute error, and minimum absolute error, as shown in Table 5. All models have adopted the neural network structure of MIMO, and the set network parameters and the proportion of divided data sets are also the same.
It can be seen from Table 5 that model B is basically the same as model A for the prediction results of boiler thermal efficiency. For the prediction of nitrogen oxide emission concentration, the root mean square error of the main performance index in model B is smaller than that in model A. It is further illustrated that the variable selection method using neighborhood rough sets can not only reduce the number of variables but also improve the prediction accuracy of the model.

4.2. Optimization of Medium and Medium-Low Load Combustion Regulation Instructions in the Unit

The traditional combustion optimization method is based on the historical combustion adjustment data of the unit to be optimized. This method is limited by the combustion adjustment experience of previous operators, which makes the optimization results under this method not representative. The combustion optimization method proposed in this paper is used to excavate the potential reasonable optimization space of the unit, and then scientifically guide the unit to carry out combustion adjustment. This method has been verified under the high-load conditions of the unit. In order to verify the applicability of the method more effectively, the unit is selected to be in the medium load condition and the medium-low load condition. The average load under medium load condition was about 245 MW, and the average load under medium-low load condition was about 194 MW. Under the 245 MW load condition, the thermal efficiency of the boiler determined by the traditional combustion optimization method was 91.23%, and the nitrogen oxide emission concentration was 25.56 mg·Nm−3. In the process of multi-objective optimization using the NSGA-II method under this working condition, the adjustment range of the manipulated parameter was ±30%, the population size was set to 50, with the crossover probability 0.2, the variation probability 0.1, and the number of iterations 100. After the optimization, the boiler thermal efficiency at a certain operation guidance point was 91.21%, and the nitrogen oxide emission concentration was 17.79 mg·Nm−3. Compared with the traditional optimization results, the boiler thermal efficiency was increased by 0.02%, and the NOx emission concentration was reduced by 7.77 mg·Nm−3. Similarly, the results obtained by the traditional combustion optimization method were used as the reference point, and the changes in the manipulated operating parameters before and after optimization were counted.
It could be seen from Table 6 that during the optimization process under this working condition, the frequency conversion command of the 1# and 2# secondary fans increased by a total of 1.76 Hz. According to the calculation of the relationship function between the fan frequency conversion command and the air volume, the secondary air volume would increase by 15,840 Nm3/h. The 1# and 2# coal feeder coal supply instructions increased by a total of 2.71 t·h−1. While the frequency conversion command of 1# slag cooler increased by 0.16 Hz, the secondary air baffle opening instruction on the left rear wall upper part decreased by 0.5%, the secondary air baffle opening instruction on the right front wall upper part decreased by 0.36%, and the secondary air baffle opening instruction on the right rear wall upper part was reduced by 1.52%. Usually, the air-to-coal volume adjustment needs to follow the set air-to-coal ratio principle. In the current combustion optimization process, the increase in the coal supply did not match the increase in the secondary air volume, which was specifically manifested in a slightly larger increase in the secondary air volume. However, the opening of the secondary air baffle in the furnace was significantly reduced compared with that before optimization. Additionally, the reducing atmosphere space in the furnace relatively increased, and the overall nitrogen oxide emissions were reduced.
When the unit was operating at a load of 194 MW, the thermal efficiency of the boiler determined by the traditional combustion optimization method was 90.77%, and the nitrogen oxide emission concentration was 21.22 mg·Nm−3. Using the NSGA-II algorithm to achieve multi-objective optimization, the parameters were set as follows: the range of manipulated parameters was ±30% with population size 70, crossover probability 0.2, variation probability 0.1, and the number of iterations 200. The boiler thermal efficiency at the operation guidance point selected after optimization was 91.32%, and the NOx emission concentration was 14.19 mg·Nm−3. Compared with the traditional optimization results, the boiler thermal efficiency increased by 0.55%. The NOx emission concentration decreased by 7.03 mg·Nm−3. The changes in operating parameters before and after optimization were counted, and the specific results are shown in Table 7.
From the statistical results in Table 7 above, it could be seen that before and after combustion optimization under 194 MW, the frequency conversion instruction of the 1# primary fan was reduced by 0.28 Hz, that is, the primary air volume was reduced by 2520 Nm3/h. The 1# and 2# secondary air frequency conversion instruction cumulatively increased by 4.08 Hz, and the secondary air volume increased by 36,720 Nm3/h after conversion. The 1# and 2# coal feeder coal supply instruction increased by 1.94 t·h−1 cumulatively. The 1# slag cooler frequency conversion instruction was reduced by 5.47 Hz. For the secondary air baffle, except for the opening on the right rear wall upper part, increased by 0.82%; the opening on the left front wall lower part, the opening on the left rear wall upper part, and the opening on the left rear wall lower part were reduced by 2.29%, 1.81%, 2.88%, and 1.00%, respectively. The reduction of primary air volume and slag discharge would concentrate the combustion area more in the lower part of the furnace. With the increased coal volume and secondary air volume, the bed temperature in the furnace would greatly increase under lower load conditions, providing a good combustion environment for the full combustion of residual carbon particles. In addition, reducing the secondary air baffle opening on the upper part of the furnace increased the proportion of the reduced atmosphere space in the furnace, thereby suppressing the formation of nitrogen oxides.

4.3. Analysis of the Law of Different Load Combustion Regulation Instructions of the Unit

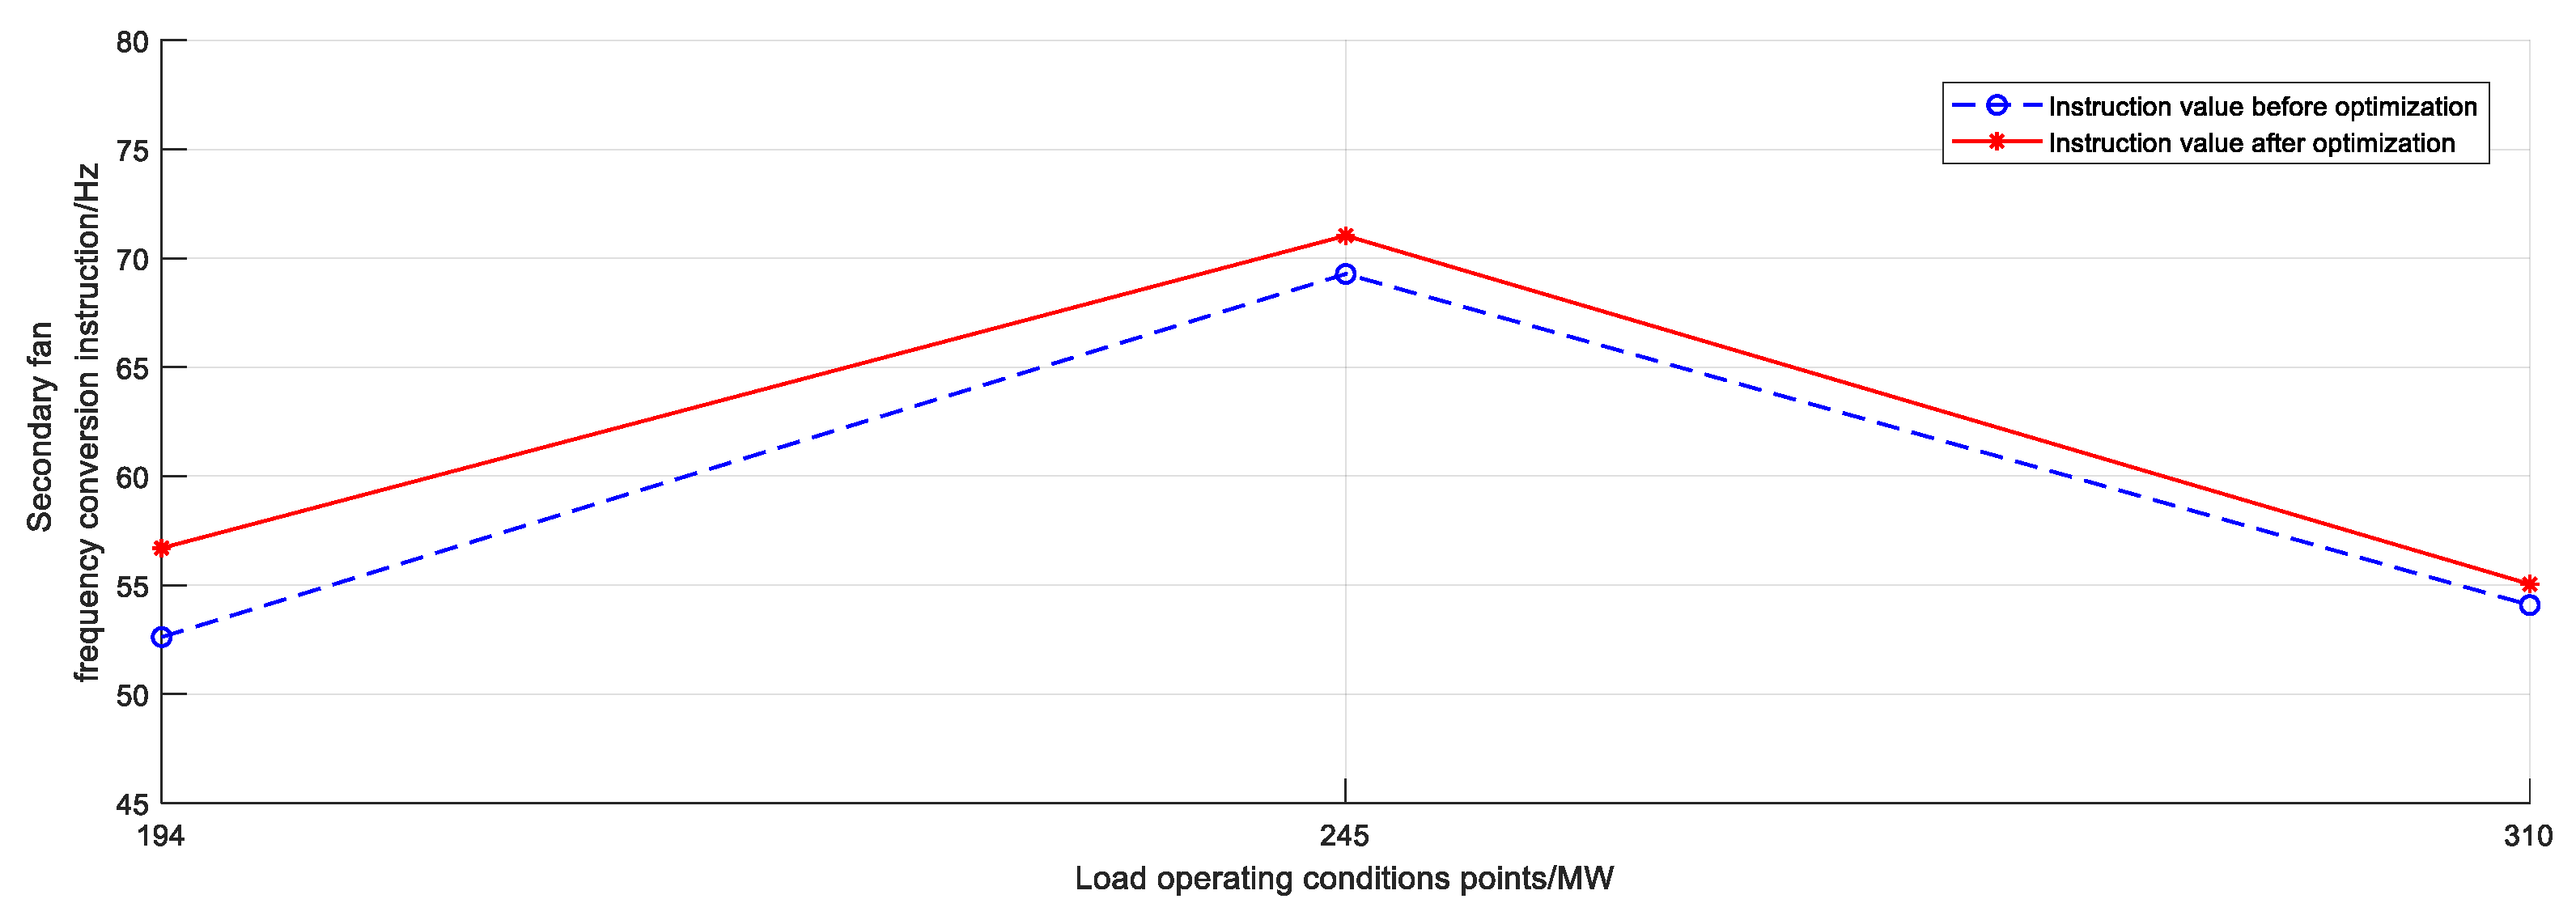
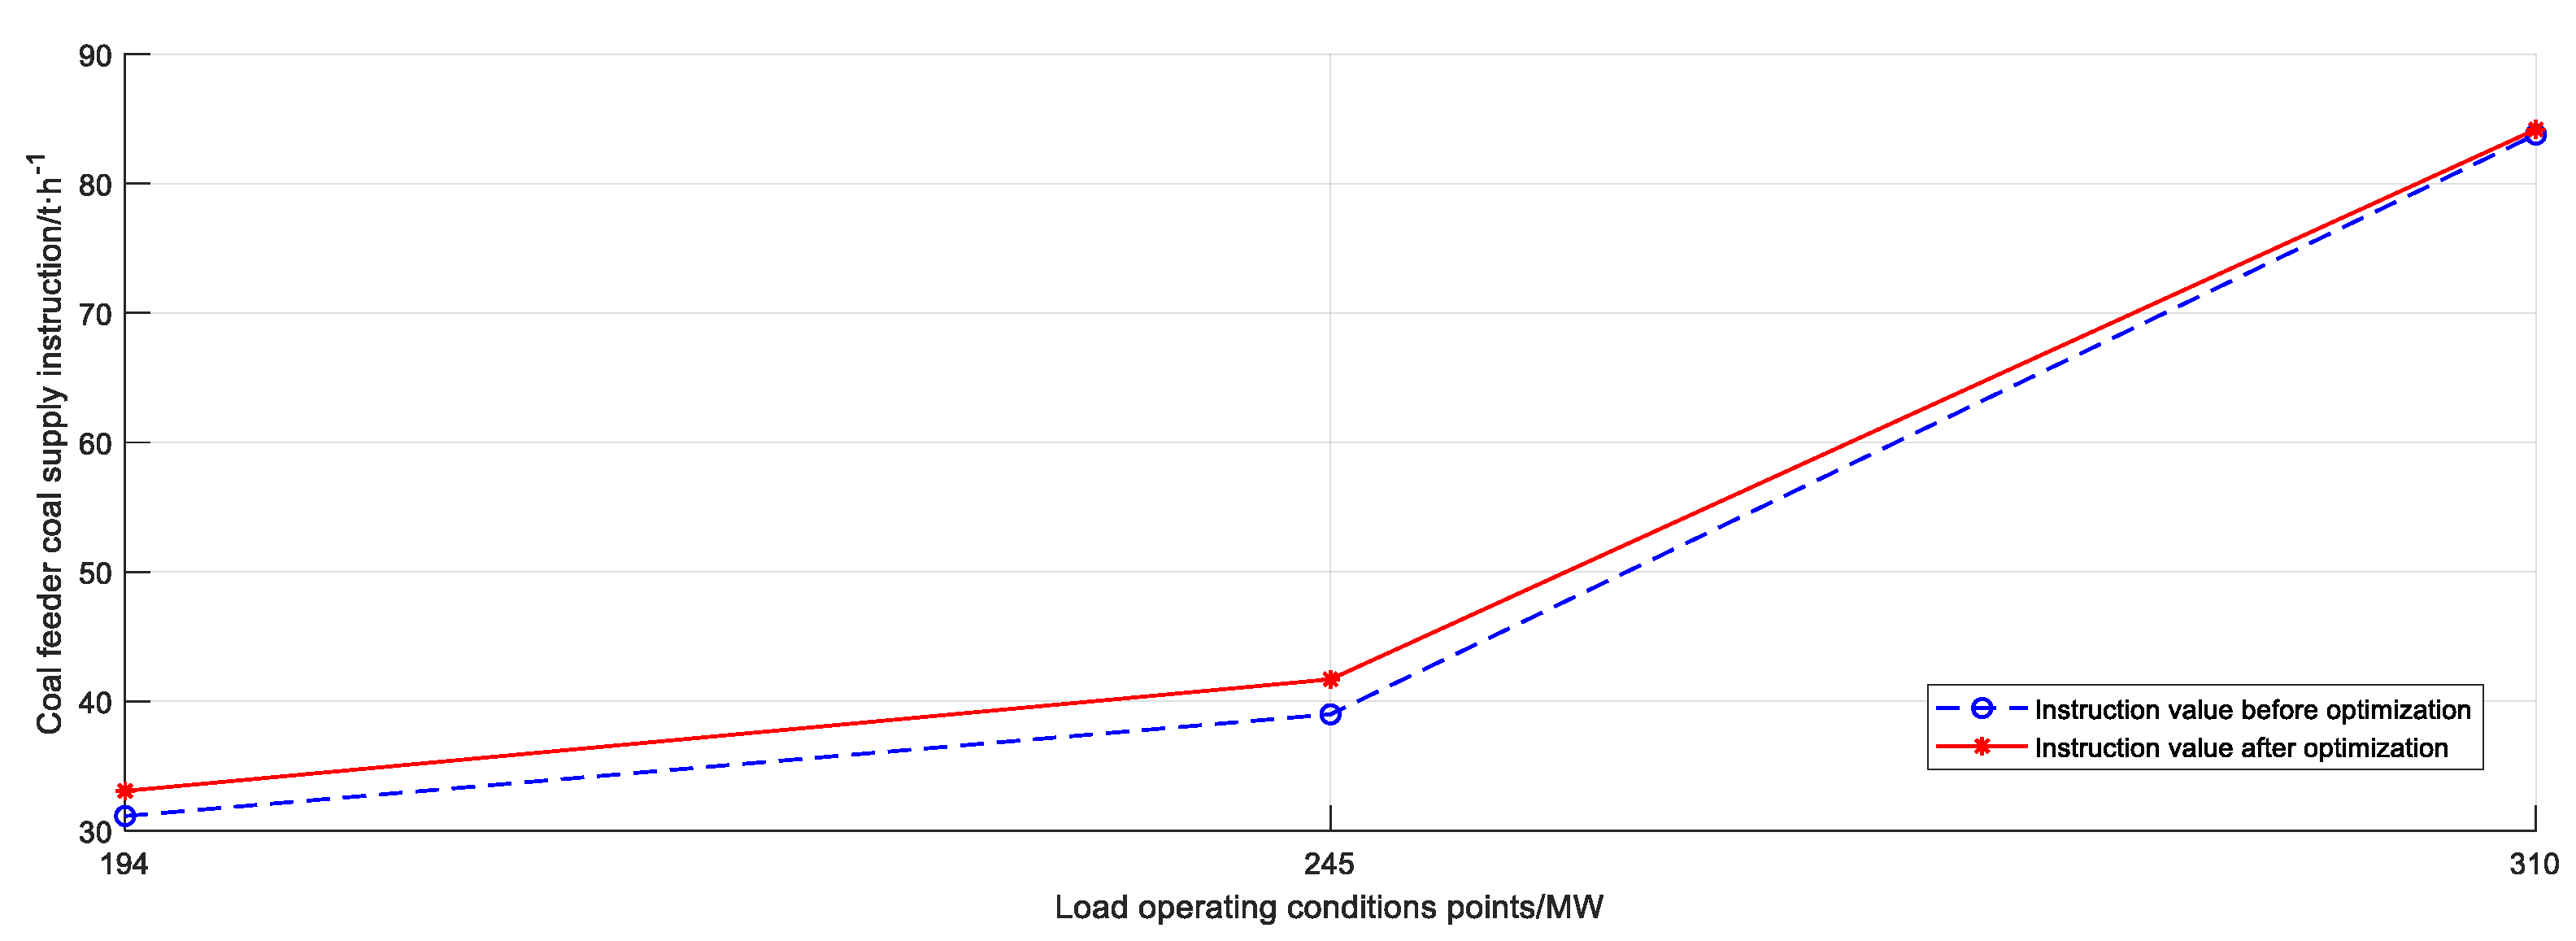
Combined with the regulation of operating parameter instruction in the unit combustion optimization process under high, medium, and low load conditions studied in this paper, the control parameter instruction regulation function suitable for different load conditions of the unit was fitted. Although the combustion optimization and adjustment measures were different under different load conditions, the slag discharge and secondary air baffle opening adjustment measures would participate in the medium load and medium-low load conditions. Generally speaking, the main operating parameters that affect the optimization of boiler combustion performance are coal volume and secondary air volume. Their changing trends with load conditions before and after optimization are shown in Figure 13 and Figure 14.
Figure 13 and Figure 14 show that the control command values of the secondary fan and coal feeder increased to a certain extent compared with before optimization values. The functional relationships of the secondary fan frequency conversion instruction and the coal feeder coal supply instruction are respectively fitted.
The functional relationship between the frequency conversion instruction of the secondary fan and the coal supply instruction of the coal feeder with the change of load conditions is respectively fitted. As shown in Formulas (17) and (18), these functional relationships could be used as a reference in instruction regulation optimization during the unit’s changing load process.
y e c f j = 0.2812 ( x 194 ) + 56.7 , 194 M W x 245 M W y e c f j = 0.2462 ( x 245 ) + 71.04 , 245 M W x 310 M W
y g m = 0.1692 ( x 194 ) + 33.07 , 194 M W x 245 M W y g m = 0.6535 ( x 245 ) + 41.7 , 245 M W x 310 M W
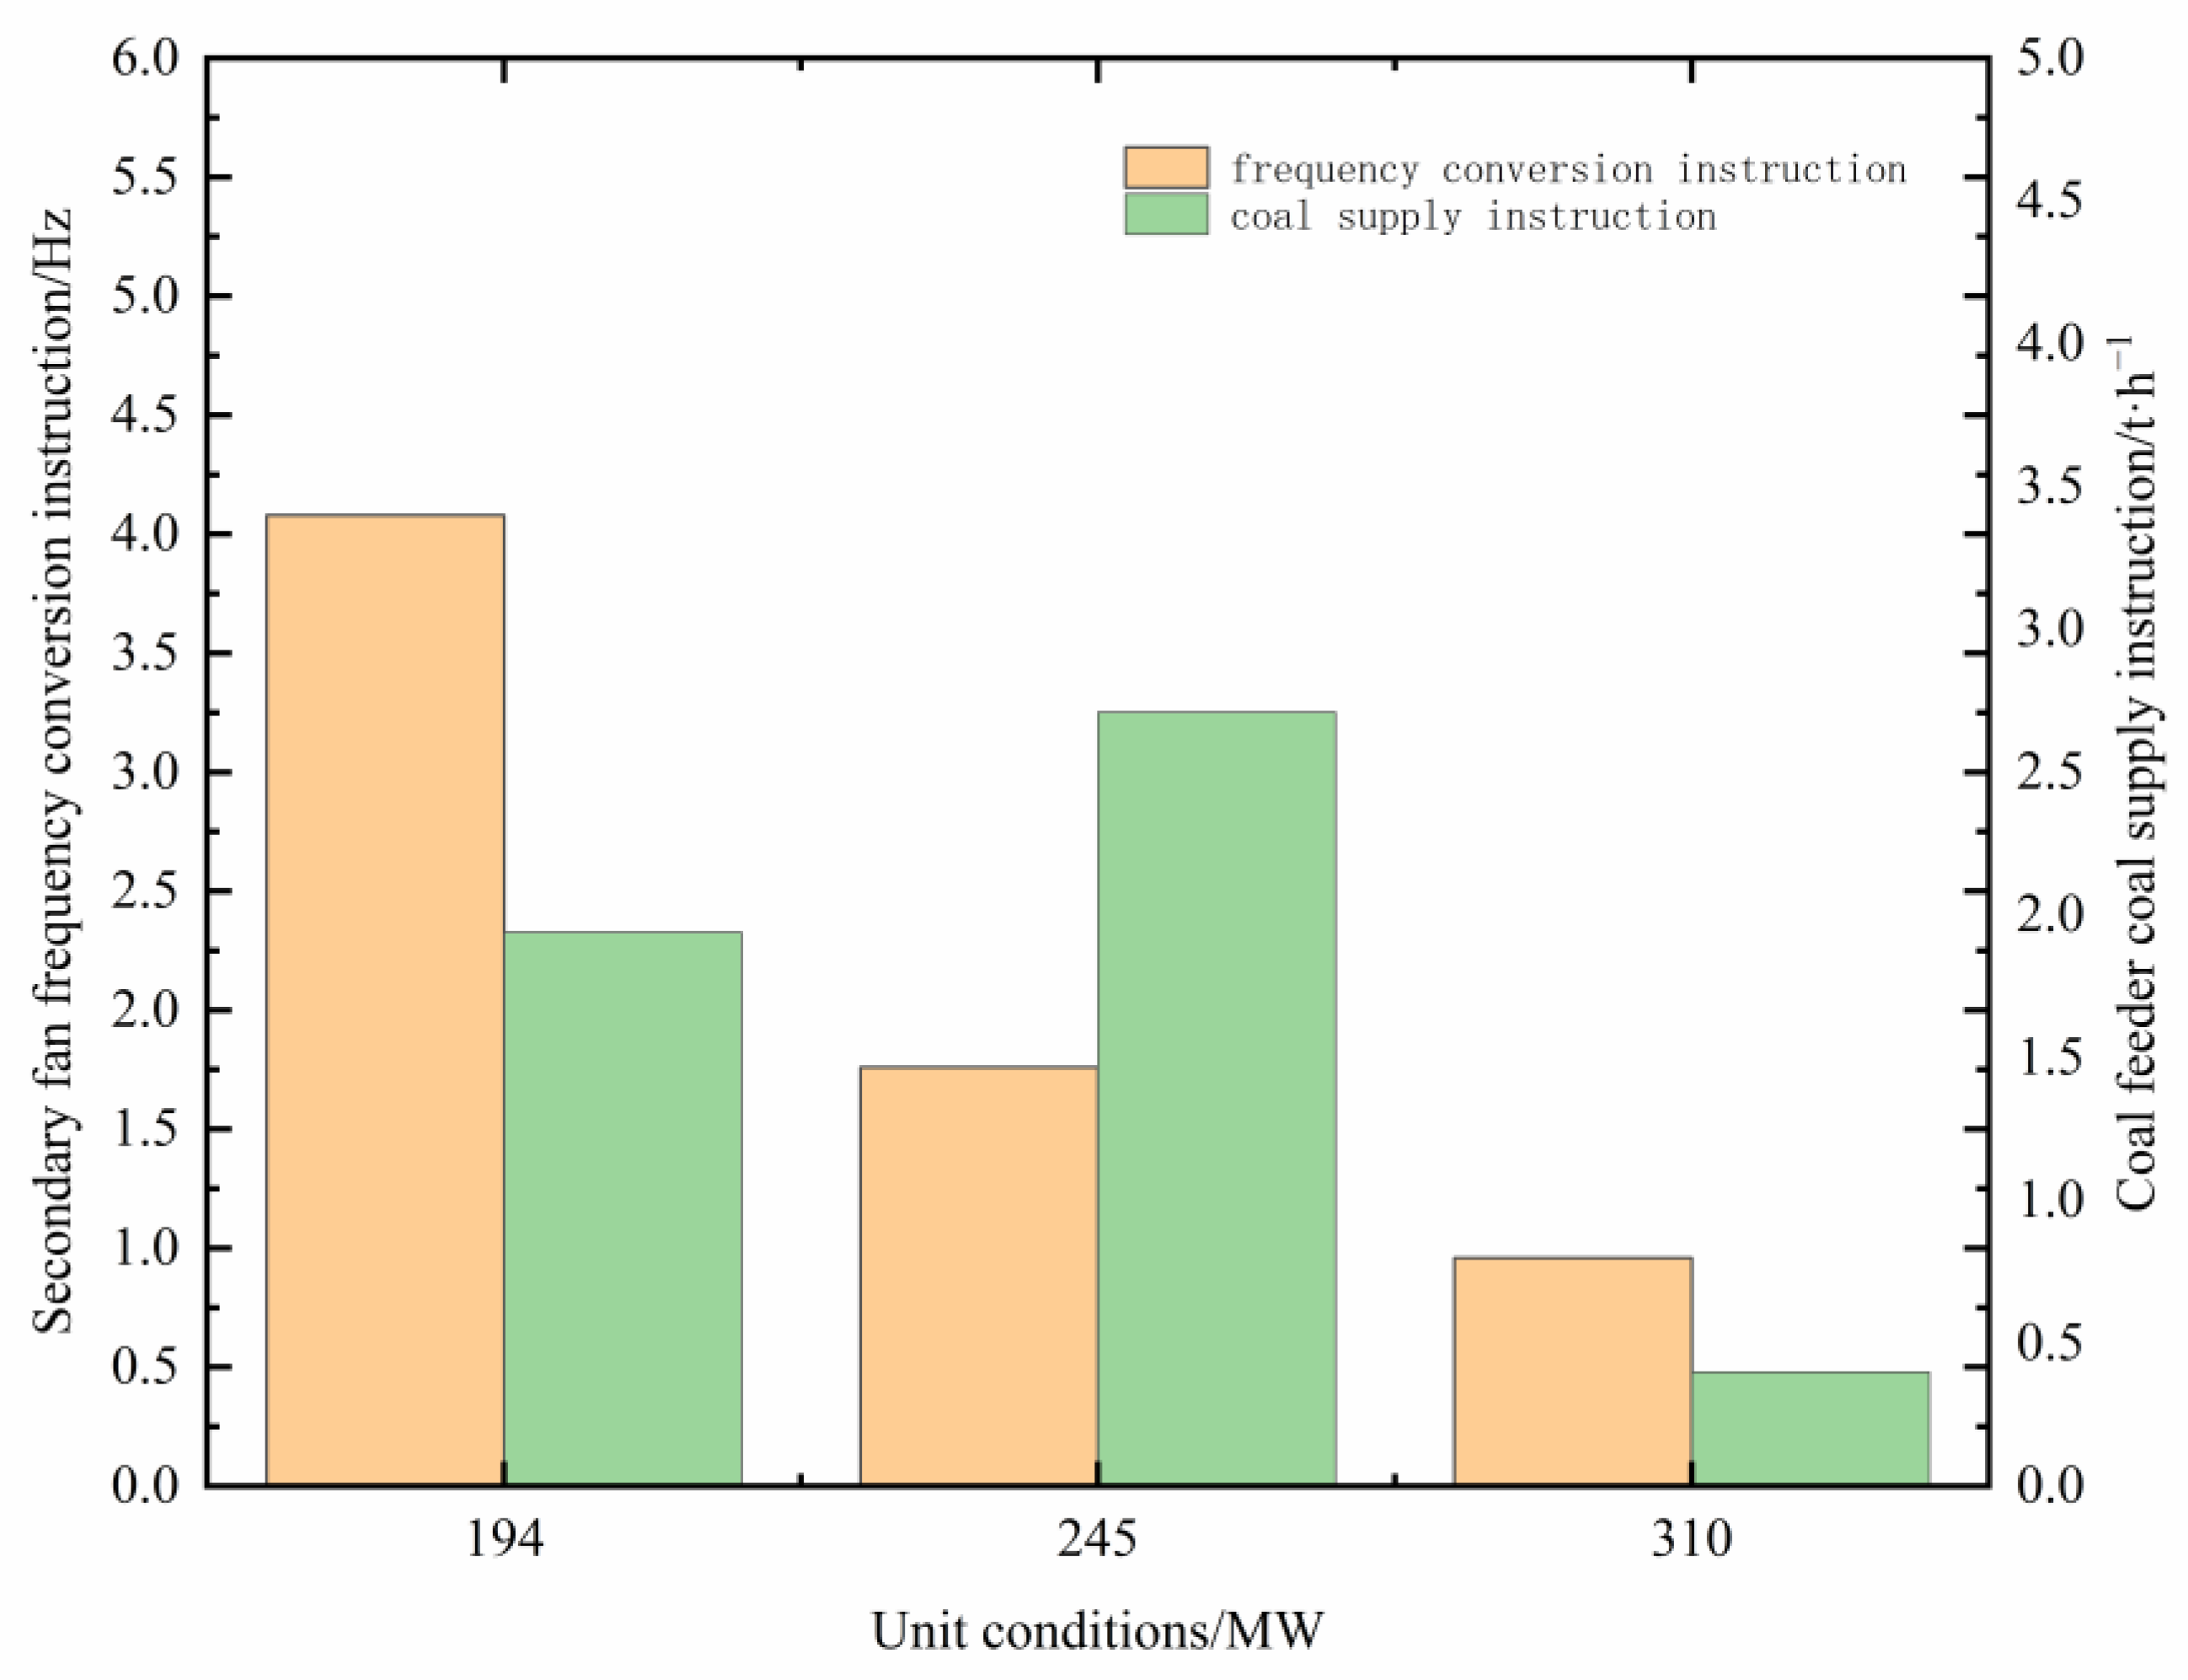
From the analysis of the statistical results in Figure 15, it could be seen that in order to further optimize the combustion performance of the boiler, it was necessary to improve the operating performance of the boiler by increasing the secondary air volume and coal volume. The core idea was to re-match the air-to-coal ratio and the air distribution method of the boiler combustion, to optimize the distribution of the combustion share in the furnace and control the oxidation-reduction atmosphere in the furnace. The difference was that the variation of the secondary fan frequency conversion command decreased gradually with the increase of the load, while the variation of the coal feeder coal supply instruction showed a trend of rising first and then falling. The main reason was that, in the actual process, it was expected that the load condition of the unit was close to the rated load condition. When the unit was in the medium load condition, the combustion in the furnace could be enhanced by increasing the coal volume. For the combustion optimization of the remaining working conditions of the unit, it was necessary to reasonably adjust the coal volume, secondary air volume, opening of the secondary air baffle or slag discharge volume, and controlling the bed temperature and the oxidation-reduction atmosphere in the furnace. These measures would help to increase boiler thermal efficiency, reduce the initial generation of nitrogen oxides, and promote their reduction [46,47,48,49,50,51]. All optimization adjustments that need to be paid attention to have a certain range. For example, the increase in slag discharge can reduce the bed pressure drop and bed material stock in the furnace, and the timely discharge of large particles of ash accumulated at the bottom of the furnace can improve the internal circulation in the furnace, which has a positive impact on the thermal efficiency of the boiler. However, when the heat loss taken away by the boiler slag discharge exceeds the improved combustion conditions in the furnace due to the adjustment of the slag discharge, the increase in the slag discharge and the boiler thermal efficiency presents a negative relationship.

5. Conclusions

In view of the normalized mode of CFB boiler units participating in power grid peak regulation under the new situation, it is very important to adjust the key control parameters of the unit combustion system in a timely manner. Previous studies mainly established a data model between combustion optimization objectives and operating parameters and provided references for operating parameter adjustments based on model optimization results. However, they did not directly conduct optimization guidance from the perspective of control parameter instructions. This paper proposes an optimization method for key control parameters of CFB boiler combustion systems based on machine learning. Through this method, the optimal and simplest control parameter set that affects the boiler combustion adjustment is obtained, based on which the operator is guided to carry out the combustion optimization work, and the efficiency of the unit combustion optimization is improved.
At present and even in the future, the participation of coal-fired power units in power grid peak shaving will become the norm under the new situation. Actively carrying out combustion optimization of units certainly will become a long-term objective in the operation of power plants. Only by continuously improving the unit’s operation level, we can improve the development dilemma of thermal power enterprises. In this paper, the unit’s optimal operating state and associated manipulated parameter set with combustion optimization have been identified through the in-depth mining of the historical data of the circulating fluidized bed unit combined with the artificial intelligence algorithm. Based on this, the operator will be guided to carry out the unit’s combustion optimization work, thereby improving the efficiency of the combustion optimization. The proposal of this method is of great significance for the construction of smart power plants.
Under the unit’s different working conditions and the same combustion optimization strategy, the optimization results obtained by the combustion optimization method proposed in this paper are better than the traditional combustion optimization method. The applied neighborhood rough set machine learning method could reduce many attributes affecting the combustion system by establishing an equivalence relationship while maintaining the original data classification ability. In turn, the key manipulated parameter set has been identified, which is associated with the unit’s combustion operation. This method simplifies the unit’s combustion adjustment rules, reduces the uncertainty of adjustment based on the operator’s experience, and decreases the invalid adjustment in the combustion adjustment process. In the unit’s combustion adjustment verification, the 26 manipulated parameters are reduced to a set of 11. The method markedly reduces blindness in the regulation process. At the same time, the optimization instruction values are accurate to 0.01, and the regulation direction is clarified. These would significantly reduce the energy consumption of the combustion optimization process.
There are also certain deficiencies in this method. First, it is necessary to establish a combustion optimization model in the process of combustion optimization. The error of the model will have an important impact on the results of optimization, so improving the accuracy of the model is a long-term goal. In addition, ensuring the continuous reliability of the intelligent algorithm used in this method is also the research focus of future engineering applications.
The machine learning method proposed in this paper provides a decision-making model for the autonomous control optimization of the CFB boiler combustion system under variable operating conditions, which is of great significance to the development of smart power plants.

Author Contributions

Conceptualization, L.H., L.W. and H.Y.; methodology, L.H. and C.J.; software, L.H. and C.J.; validation, L.H. and Y.L.; formal analysis, L.H.; investigation, L.H.; data curation, L.H.; writing—original draft preparation, L.H.; writing—review and editing, L.W., H.Y., C.J., E.M., Y.L. and S.Y.; visualization, L.H. and L.W.; supervision, L.W. and E.M.; project administration, L.W.; funding acquisition, L.W. and E.M. All authors have read and agreed to the published version of the manuscript.

Funding

This research was funded by the National Natural Science Foundation of China, grant number U1810126, and the Shanxi Province key Research and Development Plan Projects, grant number 201903D421009.

Data Availability Statement

The data are available from the corresponding author upon reasonable requests.

Acknowledgments

The authors acknowledge the technical support of the Shanxi Electric Power Research Institute and Jinkong Electric Power Shanxi Tongda Thermal Power Co., Ltd.

Conflicts of Interest

The authors declare no conflict of interest.

References

  1. Gaspari, M.; Lorenzoni, A.; Frías, P.; Reneses, J. Integrated Energy Services for the industrial sector: An innovative model for sustainable electricity supply. Util. Policy 2017, 45, 118–127. [Google Scholar] [CrossRef]
  2. Perdan, S.; Azapagic, A. Carbon trading: Current schemes and future developments. Energy Policy 2011, 39, 6040–6054. [Google Scholar] [CrossRef]
  3. Chen, S. Development Status and Prospect of Intelligent Power Station. In Proceedings of the 2013 Annual Conference on Intelligent Power Station Technology Development and Power Station Automation, Shanghai University of Electric Power. Shanghai, China, 12–13 October2013; pp. 37–47. [Google Scholar]
  4. Immonen, E.; Lauren, M.; Roininen, L.; Särkkä, S. Multiobjective model-based optimization of diesel injection rate profile by machine learning methods. In Proceedings of the 2020 IEEE International Systems Conference (SysCon), Montreal, QC, Canada, 24 August–20 September 2020; pp. 1–6. [Google Scholar]
  5. Bao, X.; Li, Y.; Zhu, C. Deep deterministic policy gradient-based combustion optimization method for coal-fired boiler. In Proceedings of the 2021 40th Chinese Control Conference (CCC), Shanghai, China, 26–28 July 2021; pp. 6255–6260. [Google Scholar]
  6. Zhang, P.; Jiang, Y.; Wang, M.; Fei, M.; Wang, L.; Rakić, A. Furnace Temperature Prediction Using Optimized Kernel Extreme Learning Machine. In Proceedings of the 2021 40th Chinese Control Conference (CCC), Shanghai, China, 26–28 July 2021; pp. 2711–2715. [Google Scholar]
  7. Pan, G. Research progress of coal-fired power plant pulverization and combustion optimization based on machine learning. Energy Energy Conserv. 2021, 113–115. [Google Scholar] [CrossRef]
  8. Aminmahalati, A.; Fazlali, A.; Safikhani, H. Multi-objective optimization of CO boiler combustion chamber in the RFCC unit using NSGA II algorithm. Energy 2021, 221, 119859. [Google Scholar] [CrossRef]
  9. Yao, Z.; Romero, C.; Baltrusaitis, J. Combustion optimization of a coal-fired power plant boiler using artificial intelligence neural network. Fuel 2023, 344, 128145. [Google Scholar] [CrossRef]
  10. Wang, C.; Liu, Y.; Zheng, S.; Jiang, A. Optimizing combustion of coal fired boilers for reducing NOx emission using Gaussian Process. Energy 2018, 153, 149158. [Google Scholar] [CrossRef]
  11. Wei, Z.; Li, X.; Xu, L.; Cheng, Y. Comparative study of computational intelligence approaches for NOx reduction of coal-fired boiler. Energy. 2013, 55, 683–692. [Google Scholar] [CrossRef]
  12. Wu, F.; Zhou, H.; Zheng, L.; Cen, K.F. Multi-objective optimization of coal-fired boiler combustion based on nondominated sorting genetic algorithm. Proceed CSEE 2009, 29, 7–12. [Google Scholar]
  13. Wei, Z.; Chao, W.; Yajun, Y.; Yongfei, Z. Multi-objective combustion optimization based on data-driven hybrid strategy. Energy 2019, 191, 116478. [Google Scholar]
  14. Perazzini, H.; Perazzini, M.T.B.; Meili, L.; Freire, F.B.; Freire, J.T. Artificial neural networks to model kinetics and energy efficiency in fixed, fluidized and vibro-fluidized bed dryers towards process optimization. Chem. Eng. Process. Process Intensif. 2020, 156, 108089. [Google Scholar] [CrossRef]
  15. Safdarnejad, S.M.; Tuttle, J.F.; Powell, K.M. Dynamic modeling and optimization of a coal-fired utility boiler to forecast and minimize NOx and CO emissions simultaneously. Comput. Chem. Eng. 2019, 124, 62–79. [Google Scholar] [CrossRef]
  16. Zhang, J.; Zhang, X.; Wang, Z. Modeling and optimization of boiler combustion system in power station. MATEC Web Conf. 2018, 232, 04073. [Google Scholar] [CrossRef] [Green Version]
  17. Li, X.; Niu, P.; Liu, J. Combustion optimization of a boiler based on the chaos and Levy flight vortex search algorithm. Appl. Math. Modell. 2018, 58, 3–18. [Google Scholar] [CrossRef]
  18. Xu, W.; Huang, Y.; Song, S.; Chen, B.; Qi, X. A novel online combustion optimization method for boiler combining dynamic modeling, multi-objective optimization and improved case-based reasoning. Fuel 2023, 337, 126854. [Google Scholar] [CrossRef]
  19. Ma, Y.; Wang, H.; Zhang, X.; Hou, L.; Song, J. Three-objective optimization of boiler combustion process based on multi-objective teaching-learning based optimization algorithm and ameliorated extreme learning machine. Mach. Learn. Appl. 2021, 5, 100082. [Google Scholar] [CrossRef]
  20. Rahat, A.A.M.; Wang, C.L.; Everson, R.M.; Fieldsend, J.E. Data-driven multi-objective optimization of coal-fired boiler combustion systems. Apply Energy 2018, 229, 446–458. [Google Scholar] [CrossRef] [Green Version]
  21. Sinha, A.; Das, D.; Palavalasa, S.K. dClink: A data-driven based clinkering prediction framework with automatic feature selection capability in 500 MW coal-fired boilers. Energy 2023, 276, 127448. [Google Scholar] [CrossRef]
  22. Hong, F.; Wang, R.; Song, J.; Gao, M.; Liu, J.; Long, D. A performance evaluation framework for deep peak shaving of the CFB boiler unit based on the DBN-LSSVM algorithm. Energy 2022, 238, 121659. [Google Scholar] [CrossRef]
  23. Wang, Z.; Peng, X.; Cao, S.; Zhou, H.; Fan, S.; Li, K.; Huang, W. NOx emission prediction using a lightweight convolutional neural network for cleaner production in a down-fired boiler. J. Clean. Prod. 2023, 389, 136060. [Google Scholar] [CrossRef]
  24. Shi, Y.; Zhong, W.; Chen, X.; Yu, A.B.; Li, J. Combustion optimization of ultra supercritical boiler based on artificial intelligence. Energy 2019, 170, 804–817. [Google Scholar] [CrossRef]
  25. Yu, H.; Gao, M.; Zhang, H.; Yue, G.; Zhang, Z. Data-driven optimization of pollutant emission and operational efficiency for circulating fluidized bed unit. Energy 2023, 281, 128338. [Google Scholar] [CrossRef]
  26. Ye, T.; Dong, M.; Long, J.; Zheng, Y.; Liang, Y.; Lu, J. Multi-objective modeling of boiler combustion based on feature fusion and Bayesian optimization. Comput. Chem. Eng. 2022, 165, 107913. [Google Scholar] [CrossRef]
  27. Xu, X.; Chen, Q.; Ren, M.; Cheng, L.; Xie, J. Combustion optimization for coal fired power plant boilers based on improved distributed ELM and distributed PSO. Energies 2019, 12, 1036. [Google Scholar] [CrossRef] [Green Version]
  28. Hu, X.; Niu, P.; Wang, J.; Zhang, X. Multi-objective prediction of coal-fired boiler with a deep hybrid neural networks. Atmos. Pollut. Res. 2020, 11, 1084–1090. [Google Scholar] [CrossRef]
  29. Li, W.; Zhuang, L.; Wang, H. GCNs–FSMI: EEG recognition of mental illness based on fine-grained signal features and graph mutual information maximization. Expert Syst. Appl. 2023, 228, 120227. [Google Scholar] [CrossRef]
  30. Wang, J.; Liu, P.; Lu, S.; Zhou, M.; Chen, X. Decentralized plant-wide monitoring based on mutual information-Louvain decomposition and support vector data description diagnosis. ISA Trans. 2023, 133, 42–52. [Google Scholar] [CrossRef] [PubMed]
  31. Hassani, H.; Hallaji, E.; Razavi-Far, R.; Saif, M. Unsupervised concrete feature selection based on mutual information for diagnosing faults and cyber-attacks in power systems. Eng. Appl. Artif. Intell. 2021, 100, 104150. [Google Scholar] [CrossRef]
  32. Chen, H.; Chang, X. Photovoltaic power prediction of LSTM model based on Pearson feature selection. Energy Rep. 2021, 7, 1047–1054. [Google Scholar] [CrossRef]
  33. Jebli, I.; Belouadha, F.-Z.; Kabbaj, M.I.; Tilioua, A. Prediction of solar energy guided by Pearson correlation using machine learning. Energy 2021, 224, 120109. [Google Scholar] [CrossRef]
  34. Nicoulaud-Gouin, V.; Mourlon, C.; Tanaka, T.; Le Dizes-Maurel, S.; Garcia-Sanchez, L.; Attard, J.C.; Zorko, B.; Mora, J.C.; Simon-Cornu, M. Sensitivity analysis in a radiological impact assessment of a nuclear power plant discharge. A comparison of the Morris, Spearman and Sobol’ approaches. J. Environ. Radioact. 2022, 242, 106770. [Google Scholar] [CrossRef]
  35. Yin, L.; Xie, J. Multi-feature-scale fusion temporal convolution networks for metal temperature forecasting of ultra-supercritical coal-fired power plant reheater tubes. Energy 2022, 238 Pt A, 121657. [Google Scholar] [CrossRef]
  36. Ren, X.; Xue, F. Heuristic attribute reduction algorithm based on fuzzy neighborhood rough set. Comput. Eng. Appl. 2018, 54, 47–53+212. [Google Scholar]
  37. Ren, Y.; Xu, C. Analysis of missing material data based on neighborhood rough set and neural network. Firepower Command Control 2022, 47, 132–138. [Google Scholar]
  38. DL/T 964-2005; Performance Test Code for Circulating Fluidized Bed Boiler. National Development and Reform Commission: Beijing, China, 2005.
  39. Deb, K.; Pratap, A.; Agarwal, S.; Meyarivan TA, M.T. A fast and elitist multi objective genetic algorithm: NSGA-II. IEEE Trans. Evol. Comput. 2002, 6, 182–197. [Google Scholar] [CrossRef] [Green Version]
  40. Jayakumar, D.N.; Venkatesh, P. Glowworm swarm optimization algorithm with topsis for solving multiple objective environmental economic dispatch problem. Appl. Soft Comput. 2014, 23, 375–386. [Google Scholar] [CrossRef]
  41. Liu, Y. The Latest Boiler, Pressure Vessel, Pressure Pipeline Design, Operation and Inspection of Common Data and Standard Specification Quick Reference Manual; Contemporary China Audio-Visual Press: Beijing, China, 2004; pp. 110–112. [Google Scholar]
  42. Hou, X.; Li, J.; Zhang, H.; Zhao, S.; Lv, J.; Yue, G. Limestone effects on NOx formation and emission in CFB combustors. Power Plant Syst. Eng. 2005, 21, 5–7+16. [Google Scholar]
  43. Li, J.; Zhang, M.; Liu, Q.; Guo, X.; Zhang, J. Theory and practice of ultra-low NOx emission in circulating fluidized bed boilers. Clean Coal Technol. 2020, 26, 139–145. [Google Scholar]
  44. Mollo, M.; Kolesnikov, A.; Makgato, S. Simultaneous reduction of NOx emission and SOx emission aided by improved efficiency of a Once-Through Benson Type Coal Boiler. Energy 2022, 248, 123551. [Google Scholar] [CrossRef]
  45. Li, J.; Heng, P.; Wang, B.; Wang, B.; Liu, N.; Wang, X. Initial unimolecular decomposition of 3,4-bis(3-fluorodinitromethylfuroxan-4-yl) furoxan from quantum mechanics and ReaxFF molecular dynamics simulation. FirePhysChem 2023, 3, 149–157. [Google Scholar] [CrossRef]
  46. Li, S.; Xu, T.; Hui, S.; Wei, X. NOx emission and thermal efficiency of a 300 MWe utility boiler retrofitted by air staging. Appl. Energy 2009, 86, 1797–1803. [Google Scholar] [CrossRef]
  47. Liu, X.; Yin, W.; Wang, P.; Yang, H. Effect of bed pressure drop on combustion efficiency of CFB boiler. J. Coal Sci. Eng. 2016, 41, 2484–2489. [Google Scholar]
  48. Li, J.; Yang, H.; Lv, J.; Zhang, J.; Cao, P.; Zhao, Y.; Bai, Y. Low NOx emission characteristic of low energy consumption CFB boiler. Combust. Sci. Technol. 2013, 19, 293–298. [Google Scholar]
  49. Ke, X.; Zhang, M.; Yang, H.; Lyu, J.; Guo, X.; Li, J.; He, H. Research progress on the characteristics of NOx emission in circulating fluidized bed boiler. Proc. CSEE 2021, 41, 2757–2770. [Google Scholar]
  50. Ji, Z.; Song, G.; Yang, Z.; Xiao, Y.; Yang, X.; Wang, C.; Zhang, X. Effect of post-combustion air distribution on NOx original emission and combustion characteristics of 75 t/h coal slime circulating fluidized bed boiler. J. Energy Inst. 2021, 99, 154–160. [Google Scholar] [CrossRef]
  51. Ke, X.; Zhu, S.; Huang, Z.; Zhang, M.; Lyu, J.; Yang, H.; Zhou, T. Issues in deep peak regulation for circulating fluidized bed combustion: Variation of NOx emissions with boiler load. Environ. Pollut. 2023, 318, 120912. [Google Scholar] [CrossRef] [PubMed]
Figure 1. Logic block diagram.
Energies 16 05674 g001
Figure 2. Method flow chart.
Energies 16 05674 g002
Figure 3. Online calculation process of boiler thermal efficiency.
Energies 16 05674 g003
Figure 4. Multi-objective optimization process based on NSGA-II algorithm.
Energies 16 05674 g004
Figure 5. Attribute reduction process feature sorting. (a) NOx attribute sorting results; (b) boiler thermal efficiency attribute sorting results.
Energies 16 05674 g005
Figure 6. The 310 MW steady-state parameter operation curve of the unit.
Energies 16 05674 g006
Figure 7. Calculation curve of boiler thermal efficiency.
Energies 16 05674 g007
Figure 8. The model prediction results.
Energies 16 05674 g008
Figure 9. Multi-objective optimization results.
Energies 16 05674 g009
Figure 10. Multi-objective optimization results based on the TOPSIS method.
Energies 16 05674 g010
Figure 11. The relationship between the fan frequency conversion instruction and the fan speed.
Energies 16 05674 g011
Figure 12. The relationship between the fan speed and the fan volume.
Energies 16 05674 g012
Figure 13. Change the trend of frequency conversion instruction of the secondary fan.
Energies 16 05674 g013
Figure 14. Change the trend of coal feeder coal supply instruction.
Energies 16 05674 g014
Figure 15. Regulation variation of each instruction under different load conditions.
Energies 16 05674 g015
Table 1. Attribute reduction process importance results.
Decision AttributeParameters in Condition AttributeImportance
NOx emission concentration1# Primary fan frequency conversion instruction0.1461
2# Secondary fan frequency conversion instruction0.1236
Secondary air baffle opening instruction on the left rear wall upper part 0.1011
1# Slag cooler frequency conversion instruction0.0786
Secondary air baffle opening instruction on the left front wall lower part0.0674
Secondary air baffle opening instruction on the right front wall upper part0.0562
Secondary air baffle opening instruction on the right rear wall upper part0.0449
1# Coal feeder coal supply instruction0.0113
Secondary air baffle opening instruction on the left rear wall lower part0.0113
1# Secondary fan frequency conversion instruction0.0112
Boiler thermal efficiency2# Secondary fan frequency conversion instruction0.1461
1# Primary fan frequency conversion instruction0.1348
1# Slag cooler frequency conversion instruction0.1011
Secondary air baffle opening instruction on the left front wall lower part0.0899
Secondary air baffle opening instruction on the left rear wall upper part0.0786
Secondary air baffle opening instruction on the right front wall upper part0.0562
Secondary air baffle opening instruction on the right rear wall upper part0.0225
2# Coal feeder coal supply instruction0.0113
1# Secondary fan frequency conversion instruction0.0112
Secondary air baffle opening instruction on the left rear wall lower part0.0112
Table 2. Evaluation index of BP neural network with a different number of hidden layer nodes.
Hidden Layer NodesRMSE of Boiler
Thermal
Efficiency/%
RMSE of NOx
Emission
Concentration/mg·Nm−3
R
Correlation Coefficient
Hidden Layer NodesRMSE of Boiler Thermal Efficiency/%RMSE of NOx
Emission
Concentration/mg·Nm−3
R
Correlation Coefficient
50.09544.1870.8768120.06673.3280.8182
60.08893.2600.7096130.08875.0020.3741
70.08892.9050.9179140.09833.9500.8166
80.13.0670.4635180.10305.9490.6380
90.09803.3310.7686200.134.4960.7847
100.08933.6790.9094210.08993.9420.9246
110.09103.4850.8094
Table 3. Prediction Error Analysis of Neural Network Model.
ProjectRMSEMean Absolute
Error
Maximum Absolute
Error
Minimum Absolute
Error
Boiler thermal efficiency/%0.08990.06920.21910.0058
NOx emission concentration/mg·Nm−33.9422.92111.53110.4826
Table 4. Variation results of manipulated parameters before and after optimization of 310 MW load.
Main
Manipulated Parameter
1# Primary Fan Frequency
Conversion
Instruction/Hz
1# Secondary Fan Frequency
Conversion
Instruction/Hz
1# Secondary Fan Frequency
Conversion
Instruction/Hz
#1 Coal Feeder Coal Supply
Instruction
/t·h−1
#2 Coal Feeder Coal Supply
Instruction
/t·h−1
Before optimization41.6727.0427.0442.1641.63
Strategy 1: After optimization42.127.5627.4943.6140.57
Instruction
difference under strategy 1
0.430.510.451.45−1.05
Strategy 2: After optimization40.7726.4527.5443.4840.55
Instruction
difference under strategy 2
−0.9−0.60.491.31−1.07
Table 5. The prediction effect of different models.
Method of PredictionBoiler Thermal Efficiency/%NOx Emission Concentration/mg·Nm−3
E R M S E E M A E E A E max E A E min E R M S E E M A E E A E max E A E min
Model A0.07160.04950.25490.00104.25503.133712.29400.1387
Model B0.08990.06920.21910.00583.9422.92111.53110.4826
Table 6. Variation results of manipulated parameters before and after optimization of 245 MW load.
Manipulated ParameterBefore OptimizationAfter OptimizationInstruction Difference
1# Secondary fan frequency conversion instruction/Hz34.6535.420.77
2# Secondary fan frequency conversion instruction/Hz34.6335.620.99
1# Coal feeder coal supply instruction/t·h−120.021.41.4
2# Coal feeder coal supply instruction/t·h−119.0020.301.31
1# Slag cooler frequency conversion instruction/Hz32.0632.220.16
Secondary air baffle opening instruction on the left rear wall upper part/%58.8358.32−0.50
Secondary air baffle opening instruction on the right front wall upper part/%58.9558.59−0.36
Secondary air baffle opening instruction on the right rear wall upper part/%59.6358.11−1.52
Table 7. Variation results of manipulated parameters before and after optimization of 194 MW load.
Manipulated ParameterBefore OptimizationAfter OptimizationInstruction Difference
1# Primary fan frequency conversion instruction/Hz38.4238.14−0.28
1# Secondary fan frequency conversion instruction/Hz26.4428.381.94
2# Secondary fan frequency conversion instruction/Hz26.1828.322.14
1# Coal feeder coal supply instruction/t·h−115.5616.911.35
2# Coal feeder coal supply instruction/t·h−115.5716.160.59
1# Slag cooler frequency conversion instruction/Hz37.0931.62−5.47
Secondary air baffle opening instruction on the left front wall lower part/%20.7218.43−2.29
Secondary air baffle opening instruction on the left rear wall upper part/%31.1529.34−1.81
Secondary air baffle opening instruction on the left rear wall lower part/%20.1517.27−2.88
Secondary air baffle opening instruction on the right front wall upper part/%29.9428.93−1.01
Secondary air baffle opening instruction on the right rear wall upper part/%29.230.020.82
Disclaimer/Publisher’s Note: The statements, opinions and data contained in all publications are solely those of the individual author(s) and contributor(s) and not of MDPI and/or the editor(s). MDPI and/or the editor(s) disclaim responsibility for any injury to people or property resulting from any ideas, methods, instructions or products referred to in the content.