Article

The Operation Strategy of the MIDC Systems for Optimizing Renewable Energy Integration of Jeju Power System

School of Electrical Engineering, Korea University, Anam-ro, Sungbuk-gu, Seoul 02841, Republic of Korea
*
Author to whom correspondence should be addressed.
Energies 2023, 16(15), 5699; https://doi.org/10.3390/en16155699
Submission received: 29 June 2023 / Revised: 17 July 2023 / Accepted: 27 July 2023 / Published: 30 July 2023

Abstract

:
The power system on Jeju Island currently faces challenges due to an imbalance between power supply and demand owing to increasing renewable energy (RE) generation. Consequently, the multi-infeed high-voltage direct-current (MIDC) systems are expected to play an important role in reducing RE curtailment and increasing RE penetration. However, despite the balance between power supply and demand, transmission line (TL) overloads on Jeju Island, which has a low permissible rating, may lead to RE curtailment. We propose an operational strategy for the MIDC systems to mitigate TL overloading and RE curtailment. This strategy was aimed at managing the possible congestion of TLs, maintaining a power supply–demand balance, and increasing the penetration level of RE. In this paper, we present a scheme for calculating the operating points of the MIDC systems and allocating RE curtailment using optimization with security constraints to mitigate TL overloading. The proposed optimization model simplifies solving the mathematical equations involved by employing a sensitivity factor called the power transfer distribution factor (PTDF), using which linear programming (LP) optimization can be performed. To verify the feasibility of the operational strategy, case studies are conducted using an actual Jeju Island power system with a power system analysis tool—Power System Simulator for Engineering (PSS/E). The optimization problem was solved using MATLAB.

1. Introduction

With escalating climate change and an urgent need to achieve carbon neutrality, the role of power systems has become increasingly crucial. As societies worldwide respond to the challenges posed by climate change, one of the most significant steps is a substantial increase in renewable energy (RE) [1]. In response to these changes, power systems that have traditionally relied on fossil fuels are shifting toward greater use of RE, such as solar and wind power, to provide sustainable and environmentally friendly alternatives to promote the transition to a low-carbon future. Accordingly, a significant increase in RE is central to this transformation, leading to profound effects on the power systems.
The impacts of increasing the penetration of RE, which has characteristics different from those of conventional power generation, was presented in [2,3]. These include issues such as power supply imbalance and instability owing to the intermittency and uncertainty of weather-dependent RE, as well as transmission line (TL) congestion arising from the location of RE power plants. In addition, [3] provides solutions and strategies for each stage of RE expansion and mentions that curtailment is necessary when RE increases above a certain level, and that RE curtailment is already experienced in many countries and is increasing [4,5,6].
As a country experiencing rapid growth in RE, South Korea is aiming to achieve its greenhouse gas reduction targets [7]. The South Korean government plans to promote the deployment of RE, reaching 108.3 GW (45.3% of the total power mix) by 2036 [8]. They also introduced measures to address the challenges associated with increasing penetration level of RE.
In Jeju Island, the largest island in South Korea, Jeju Special Self-Governing Province established the vision of Carbon-Free Island Jeju 2030 (CFI 2030) in 2012, with the goal of reducing greenhouse gas emissions and achieving energy self-sufficiency. The province has been pursuing consistent policies, and in 2019 [9], it developed a detailed implementation plan for CFI 2030 to promote the deployment of 4085 MW of RE (106% of the electricity demand) by 2030. As of 2021, RE is connected to the Jeju power system with a capacity of 1178 MW, accounting for 54.4% of the total power generation [8]. Owing to the high proportion of RE, its generation has been curtailed since 2015 to ensure power supply balance and frequency stability, and is gradually increasing. However, with the continuous increase in RE and the growth in power demand, it is expected that there will be a need for RE curtailment due to TL congestion [2]. Additionally, factors such as public complaints and geographical conditions make TL construction difficult and time-consuming, further exacerbating these issues [10].
The Jeju power system is interconnected and operated in conjunction with the mainland through two high-voltage direct-current (HVDC) links, and an additional HVDC link is under construction, scheduled to be completed in 2023 [8,11]. A system that connects multiple HVDC links in an asynchronous grid is referred to as a multi-infeed HVDC (MIDC) system. One notable distinction between DC and AC systems is their ability to control power flow through TLs. This implies that the traditional impedance-based representation, commonly used in AC operating and planning approaches, cannot fully capture systems using HVDC. Instead, the controllable power flow results in additional optimization variables that need to be considered. Furthermore, while AC power flow calculations provide accurate results, their application in the power industry is limited owing to nonlinearity, which leads to computational obstacles in optimization and control problems, such as difficulty in convergence, inconvenience in congestion analysis, and low computational efficiency [12]. These disadvantages limit the application of AC power flow calculations in system optimization. Therefore, a linear power flow model is of great interest, because it offers reasonable accuracy and robustness for power system analysis. Such a linear model can also be beneficial for solving optimization problems [13] by allowing them to be transformed into linear programming (LP) problems [14,15].
The DC power flow model is one of the most widely used linear power flow models in power systems. Because it is a linear, non-iterative model with reasonable accuracy in terms of active power flow, it has considerable analytical and computational appeal compared to the AC power flow model [16]. The classical DC power flow model was derived based on the assumptions of a lossless active power flow and a flat bus voltage profile [17]. These assumptions are relatively reasonable because the bus voltage magnitude in actual power systems operates at nearly 1 p.u. Most of the absolute values of phase angle differences across TLs are within 10° [18,19], and the reactance values of TLs are significantly larger than their resistance values. From the DC power flow calculations, sensitivity factors are derived—so-called power transfer distribution factors (PTDFs). Estimating the changes in line flows based on the power variations at the buses is possible using PTDFs [20]. Based on the advantages of DC power flow calculations using PTDFs, as mentioned earlier, PTDFs are widely used to determine the operating points of embedded HVDC in power systems [21].
Many studies have been conducted to increase the penetration level of RE in the Jeju power system [22,23,24,25,26]. In [22,23], a method of increasing RE penetration by reducing the number of must-run generators by applying a synchronous condenser with a flywheel and battery energy storage system has been proposed. In [24], a stability analysis according to the type of HVDC applied to the MIDC systems and a plan to increase the penetration limit of RE accordingly were presented. To enhance the reliability and efficiency of the power system when integrating large scale wind power, [25] proposed a probabilistic security limit analysis of the power grid. In [26], a method for calculating the maximum wind power penetration in an island power system connected to the mainland via HVDC is presented, and an operational strategy for the HVDC system to ensure power system reliability and stability is proposed. The papers mentioned above primarily discuss approaches from the power balance perspective and stability perspective to increase the penetration level of RE. However, with the expected continuous increase in RE, TL congestion is anticipated to occur. Consequently, there will be an increased need for RE curtailment. In such a scenario, the need for flexible solutions in power system operation to effectively tackle these challenges is of paramount importance. Furthermore, to the best of our knowledge, there are no island power system with three HVDC interconnections to the mainland.
Therefore, in this paper, we propose an optimal method for determining the operating points of the MIDC systems and minimizing RE curtailment to alleviate TL congestion in an island power system integrated with MIDC systems. To achieve this, we linearized the variation in power flow in the TLs by applying a sensitivity factor derived from DC power flow calculations and developed an LP-based optimization model. To validate the accuracy and robustness of the proposed method, we performed simulations for various scenarios in an actual Jeju power system and analyzed the results. In this analysis, we compared the proposed results with the benchmark results obtained using AC power flow calculations. In the Jeju power system, RE curtailment is conducted in a predetermined order for each power plant. This introduces uncertainty regarding when, where, and to what extent the generators will be curtailed. and the operating point of MIDC systems is determined based on the total sum of the operating point of each HVDC. To obtain results that incorporate these uncertainties, the Monte Carlo [27] approach was performed, and it was compared with the proposed method.
The remainder of this paper is organized as follows. Section 2 provides a brief introduction of Jeju Island’s power system and the current status of RE. In Section 3, the equations used to calculate the sensitivity factors and the proposed optimization model are described. Several cases were analyzed to demonstrate the accuracy and robustness of the proposed method in comparison with the AC power flow calculation, and the Monte Carlo approach was used to validate the performance of the proposed model. Finally, the conclusions are presented in Section 5.

2. Jeju Power System Description

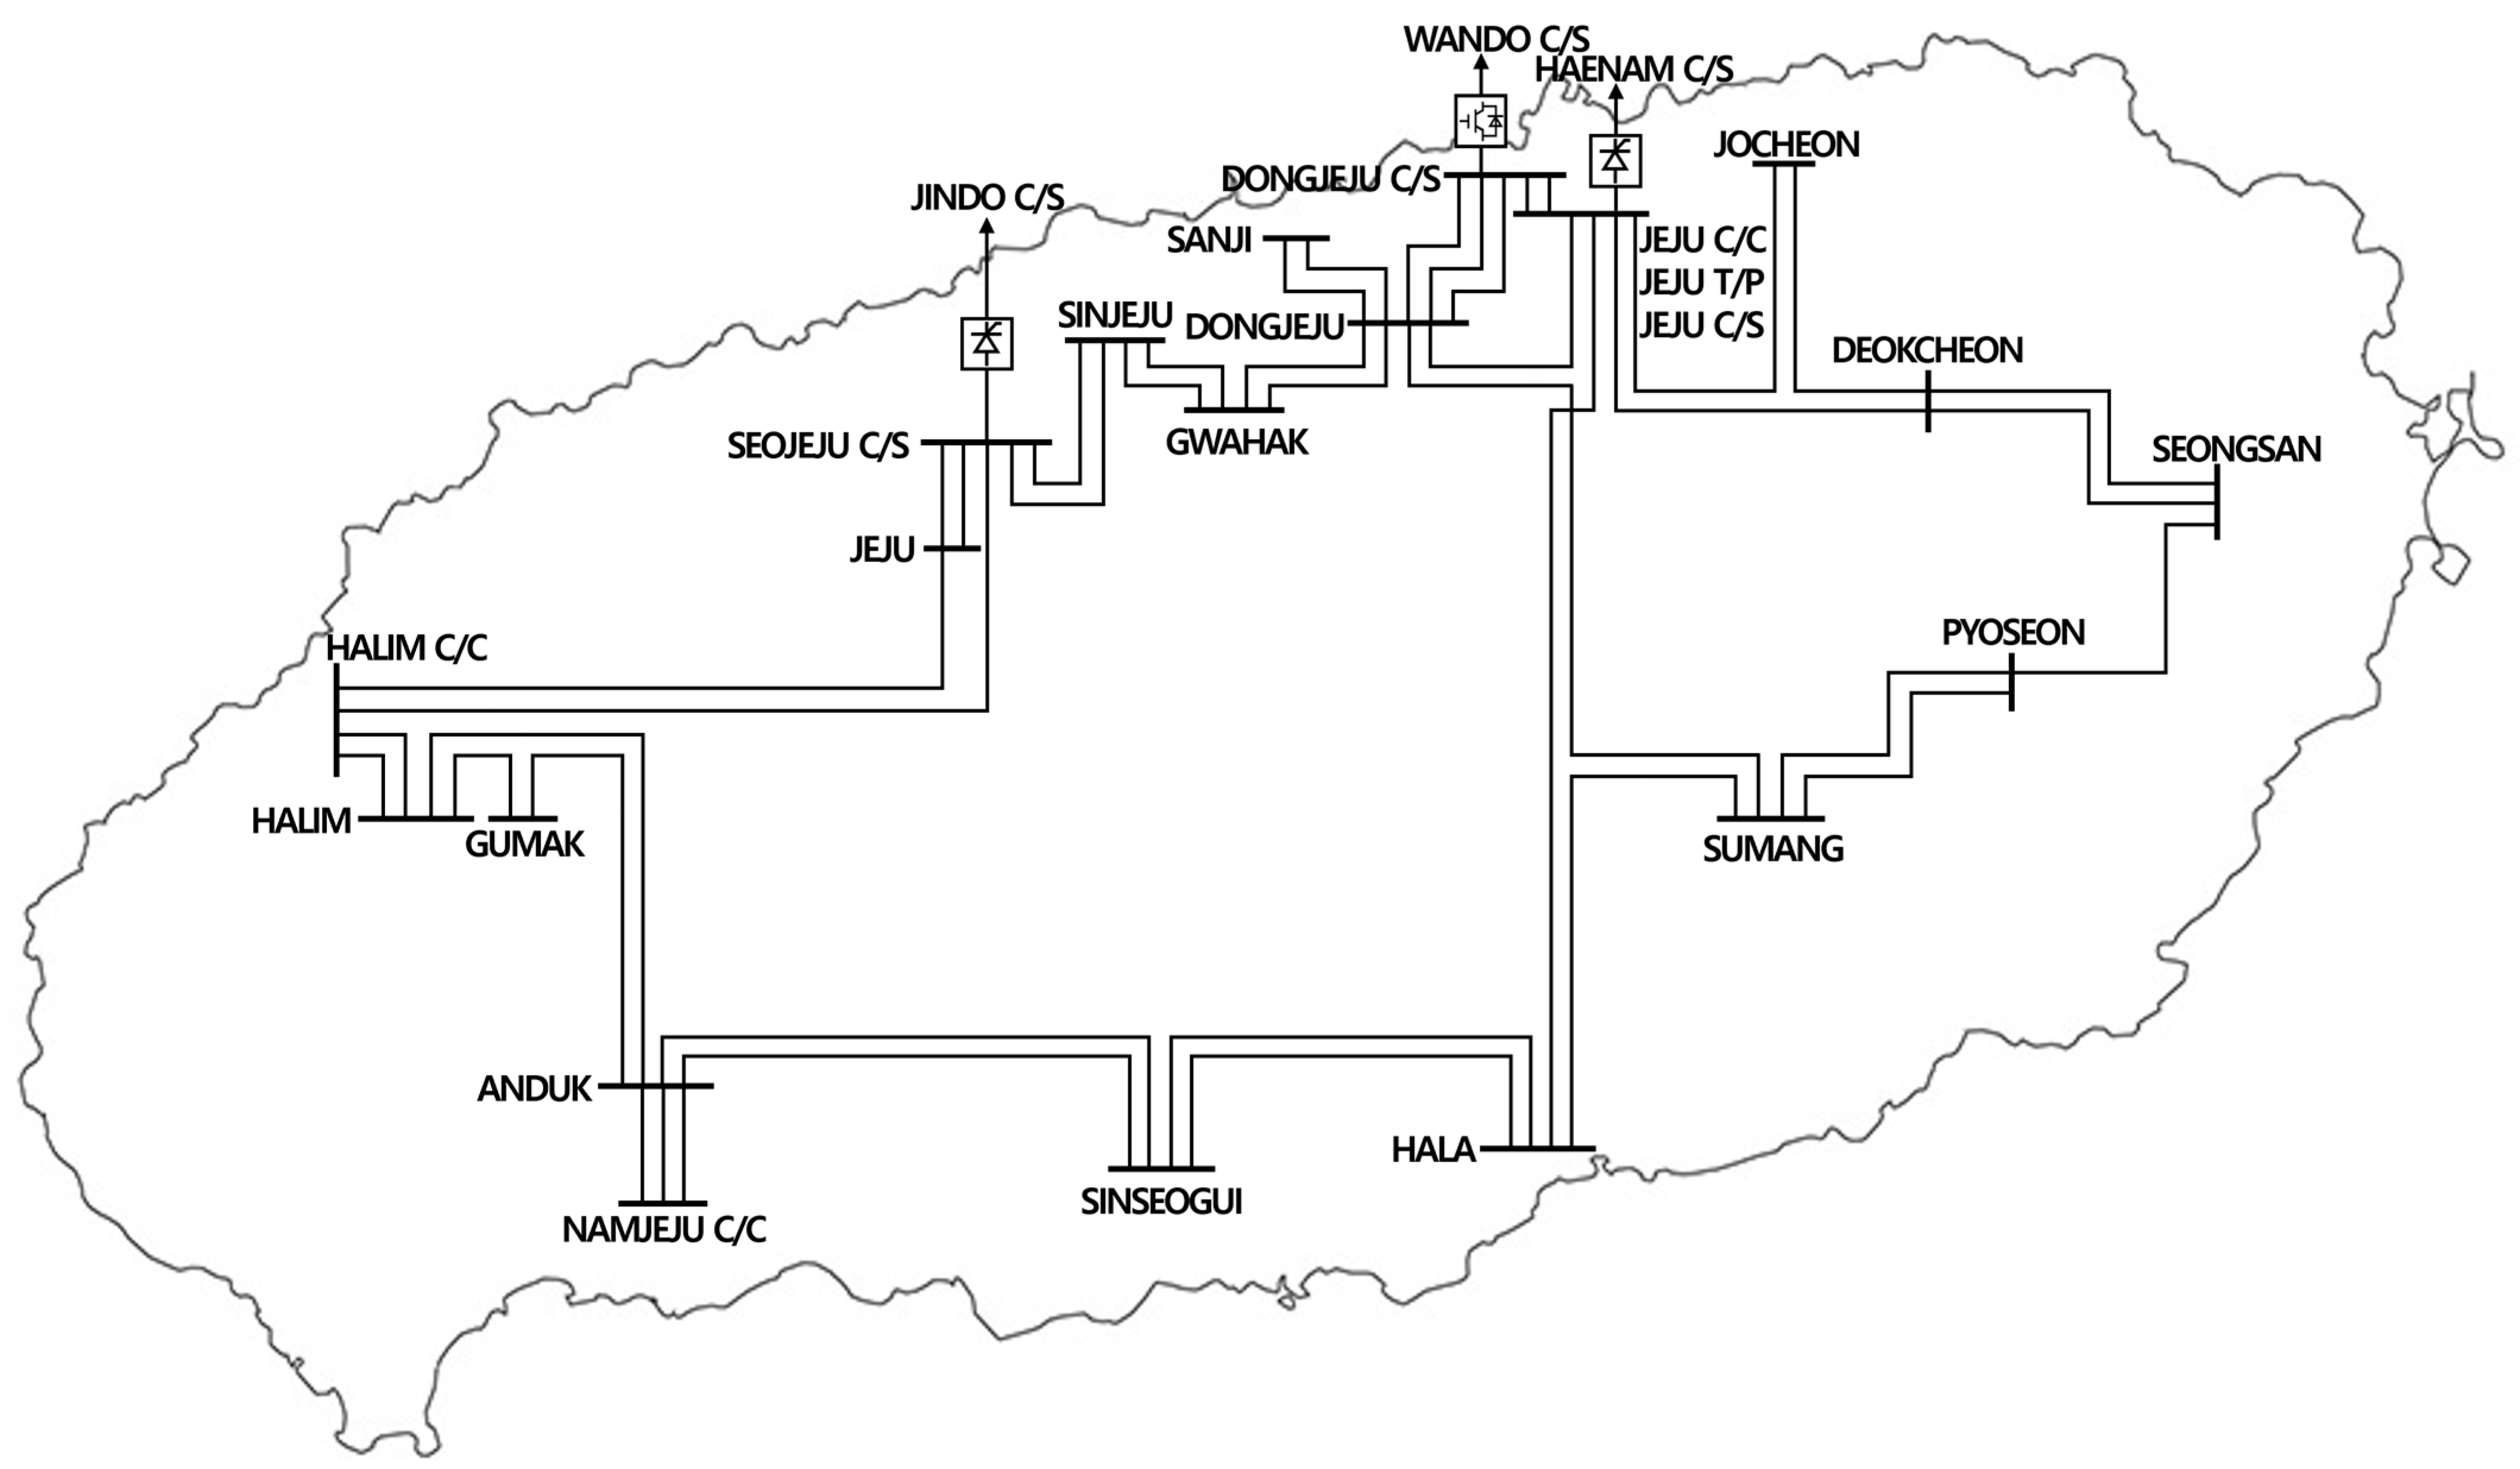
Jeju Island is the largest island in South Korea, with a power demand of 1036 MW in 2021, which is approximately 1/10th that of the mainland’s demand (91,141 MW). The power demand on Jeju Island is projected to increase to 1656 MW by 2036, with an average annual growth rate of approximately 2.9%. Power generation capacity is expected to increase from 1764 MW in 2021 to 5781 MW by 2036 [8]. Because of the large unit capacity of the power generation facilities compared to the system size, Jeju Island faces a higher risk of power outages owing to frequency degradation. To address this issue, two HVDC connections are currently operational between Jeju Island and the mainland [28]. To meet this growing demand, the construction of a third HVDC connection, scheduled for completion in 2023, is underway [8,11]. A schematic diagram of the Jeju power system is shown in Figure 1, and details regarding the facilities (conventional generators, TLs and REs) and the three HVDC connections to the mainland are provided in Appendix A and Table 1, respectively. Furthermore, driven by the substantial presence of renewable energy resources on Jeju Island, Jeju Special Self-Governing Province has set forth an ambitious vision to transform the island to carbon-free by 2030 [9]. Accordingly, the proportion of RE is significant compared to the system size, and this is expected to continue increasing. As of 2021, the installed capacity of RE was 1178 MW, which is projected to increase to 4445 MW by 2036 [8].
As mentioned earlier, the Jeju power system has a large capacity for generation facilities compared with the demand level. Therefore, it is necessary to adjust the generation output to maintain a supply–demand balance. However, because the Jeju power system relies heavily on HVDC connections and is thus considered weak, must-run generators are designated and operated to ensure a minimum level of robustness [28]. As a result, there is a limitation on the maximum generation capacity for RE in order to achieve a balance in power supply and demand, as shown Equation (1):
P R E m a x P L P G P H V D C
where P R E m a x , P L , P G and P H V D C represent the maximum achievable capacity of RE output, the demand, the generation output of the conventional generator and the operating point of the HVDC, respectively. Furthermore, operational measures such as operating conventional generators at minimum output, adjusting transformer taps, and implementing HVDC reversal of the power flow from Jeju to the mainland are being implemented to accommodate the increasing RE. Ultimately, RE curtailment is being implemented to effectively manage the integration of RE, and as the integration of RE increases, the need for curtailment will continue to rise [29]. The degree of RE curtailment is shown in Table 2.
Until now, RE curtailment has been implemented to maintain balance in the power supply. However, with the completion of the #3 HVDC connection, challenges are expected to arise in RE curtailment owing to factors such as HVDC reverse transmission from Jeju Island to the mainland, increased integration of RE, and increased demand. These factors can lead to TL constraints that require RE curtailment. Furthermore, as indicated in Appendix A, the TLs of the Jeju power system typically have a low capacity of around 200 MVA, and the construction of additional TLs is challenging and time-consuming due to geographical constraints and concerns of the civic community. As a result, RE curtailment due to TL capacity constraints is expected to increase gradually. However, HVDC is flexible to control; thus, by adjusting the operating points of the three HVDC systems, RE curtailment can be alleviated.

3. Determination of MIDC Operation Points

3.1. Derivation of Sensitivity Factors of Power Systems

In general, unlike AC systems, the MIDC systems offer more flexibility in adjusting the operating points [30], and an inverter-based RE can adjust its output as well [31]. The impact of adjusting operating points of the MIDC systems and RE curtailment in TLs can be computed after understanding the power injection and withdrawal sensitivities to the line flow. The sensitivity of the power flow in TLs is known as the PTDF. For the DC power flow method, the following assumptions are used [17].
  • The magnitude of voltage in all buses is equal to 1 ( V i = V j 1 ).
  • The voltage angle difference across a TL is small ( sin θ i j θ i θ j , cos θ i j 1 ).
  • The reactive power is not considered when calculating the real power line flow.
  • The shunt reactance to the ground at the bus and charging reactance to the ground of the line are not considered either ( r i j 0 ).
Using the given assumptions, the power flow from bus i to bus j can be linearized and expressed via the following equation:
P i j = g i j V i V i V j cos θ i j b i j V i V j sin θ i j = θ i θ j x i j
where P i j , θ i j , g i j , b i j , and x i j represent the power flow, voltage angle difference, conductance, susceptance, and reactance, respectively, between buses i and j . V i and θ i are the voltage magnitude and angle of bus i , respectively, and V j and θ j are the voltage magnitude and angle of bus j , respectively. The PTDF is derived from Equation (2) and is expressed as Equation (3):
P T D F l , k = P F l P k
where P T D F l , k denotes the sensitivity of line l to changes in power flow caused by power variations at bus k , and P F l and P k represent changes in power flow at line l and power variations at bus k , respectively. Herein, the PTDF does not consider reactive power, so P F l can be seen as the variation in active power flow. However, it is necessary to use approximations, because TL loading is based on the apparent power, while the variation in the power flow of TL calculated using PTDF is in terms of the active power. These approximations are provided in Appendix B, and according to Appendix B, the apparent power flow variation in the TL can be linearized using the PTDF and is expressed as Equation (4). (Hereinafter, the term “apparent power flow” is used to refer to the power flow.) When there are power variations at multiple nodes, the superposition principle can be used to express this, as shown in Equation (5):
P F l = P F l i n i + P F l = P F l i n i + P T D F l , k × P k
P F l = P F l i n i + ( P T D F l , k × P k )       k
where P F l and P F l i n i represent the power flow and the initial power flow of line l , respectively, and denotes all buses of the system.

3.2. Model for the Optimal Operation Point of the MIDC Systems

An optimal operation point of the MIDC systems is proposed in this section to determine the steady-state optimal operation point of each HVDC to minimize RE curtailment based on the linear programming (LP) model and PTDF.

3.2.1. Objective Function

The objective function of the proposed LP model considers the minimization of RE curtailment, as follows:
min i P R E , i                     i
where P R E , i represents the variance in RE, that is, the amount of RE curtailment of bus i .

3.2.2. Constraints

  • Conventional Generator Constraints
For conventional generators, the maximum and minimum outputs are determined based on the mechanical characteristics of each generator. Thus, the following constraints were used:
P G , i m i n P G , i P G , i m a x
where P G , i represents the power output of the generator at bus i .
2.
RE Constraints
The power generation of RE is restricted by its rated value as follows (8) and can be reconfigured using the initial value of the power output and variance in RE as per (9):
0 P R E , i P R E , i m a x
0 P R E , i P R E , i i n i
where P R E , i and P R E , i i n i represent the power output and initial power output of RE at bus i , respectively.
3.
HVDC Operation Range Constraints
The operation range of HVDC must be determined to account for its characteristics, as shown in Equation (10):
P H V D C , i m i n P H V D C , i P H V D C , i m a x
where P H V D C , i represents the operation point of HVDC at bus i . In addition, the frequency control in the Jeju power system is primarily carried out by the MIDC systems [28]. This implies that even in the event of a fault in one of the HVDC system within the MIDC systems, the remaining HVDC systems must be capable of compensating for it. Therefore, the operating point of the MIDC systems needs to be determined within a range that ensures they do not exceed the frequency stability limits, as defined by Equation (11):
P H V D C , i P M I D C F S
where P M I D C F S denotes the frequency stability limit of the MIDC systems. Equations (10) and (11) can be reconstructed into (12) and (13), respectively, using the initial operating point and variation in HVDC:
P H V D C , i m i n P H V D C . i i n i P H V D C , i P H V D C , i m a x P H V D C . i i n i
P H V D C , i P M I D C F S P H V D C , i i n i
where P H V D C , i i n i and P H V D C , i represent the initial operation point and variance in HVDC at bus i , respectively.
4.
Power Balance Constraints
The sum of the amount of power generated equals the sum of the demand to maintain the power balance, as described by Equation (14). Herein, to maximize RE integration, minimizing the power output of conventional generators and maximizing the operating point of the MIDC systems are necessary from Jeju Island to the mainland. Therefore, Equation (14) can be reformulated as Equation (15):
P L , i + P H V D C , i = P G , i + P R E , i
P L , i + P H V D C , i m a x = P G , i m i n + P R E , i m a x
where P L , i represents the load demand at bus i . Assuming that the load demand and power output of the conventional generator do not change, Equation (15) can be expressed as the variance in HVDC and RE, as shown in Equation (16).
P H V D C , i = P R E , i
5.
Transmission Line Capacity Constraints
Power flow through the line is limited by the heat capacity of the TL:
P F l S l m a x                       l B
where B denotes all the lines of the system. Equation (17) can be reconstructed into Equation (18) using the initial power flow of the line, variance in active power at the bus, and sensitivity of the line to the bus. Herein, since PTDF-based DC power flow has an error compared to AC power flow, weight factor γ is applied to supplement this.
γ S l m a x P F l i n i P T D F l , i × P i γ S l m a x P F l i n i 0 γ 1

3.3. Procedure to Minimize RE Curtailment and Alleviate Transmission Line Overloading

In these simulations, a Monte Carlo simulation to determine the operating point of the MIDC systems is applied as a base case for comparison with the proposed method. A flowchart of the simulation for each case is shown in Figure 2. The simulation procedure is as follows.

3.3.1. Monte Carlo Approach

  • Generate random variables between 0 and 1 to adjust the operating point of the MIDC systems and RE outputs, respectively. In this case, because the sum of the variations in HVDC and RE should be equal, as stated in (16), the sum of each random variable should also be equal:
    m = 1 N H V D C α m = m = 1 N R E β n
    where α m and β n are random variables for HVDC and RE, respectively, and N H V D C and N R E represent the number of buses in which HVDC and RE are integrated, respectively.
  • Solve the AC power flow and check for the presence of overloaded TLs. If there are overloaded TLs, alleviate the overload by multiplying the random variables generated in Step 1 by the supply variation:
    P H V D C , m = P H V D C , m α m P
    P R E , n = P R E , n β n P
    where P represents the supply variation.
  • Repeat Step 2 until the overload is resolved. Once the overload is alleviated, proceed to the next iteration.
  • Repeat Steps 1, 2 and 3 until the designated iteration is completed.

3.3.2. Proposed Simulation Based on LP

  • Calculate PTDF based on the network structure.
  • Determine the maximum operation point of the MIDC systems that satisfies the HVDC operation range constraints in Section 3.2.
  • Solve the LP model that minimizes RE curtailment while satisfying all constraints.

4. Case Study

4.1. System Configuration and Simulation Setup

4.1.1. Simulation Cases

The Jeju power system was used to validate the effectiveness of the proposed method. In this study, simulations were conducted by arbitrarily constructing cases in which TL overload occurred. Moreover, because the power output of RE has regional variability associated with factors such as solar radiation and wind speed, the cases were constructed by dividing the area into east and west regions and altering the power output of RE. The detailed conditions for the three simulation cases are listed in Table 3.
Each case has the same conditions except for the ratio of RE generation between the western and eastern regions. The power flow of each HVDC is from Jeju to the mainland, which acts as a load from the perspective of the Jeju power system. Furthermore, it is assumed that the mainland can accommodate both the HVDC current flow and its variations. For each case, the results of the AC power flow calculation indicated an overloaded TL, as shown in Table 4. From these results, we can observe that the degree of TL overload and TLs experiencing overload vary depending on the density of RE.

4.1.2. Simulation Setup

To solve the proposed LP model, PTDF values need to be calculated in advance to predict the variance in TL loading for power injections and withdrawals at each bus. In addition, the maximum operating point of the MIDC systems must be computed in advance. As mentioned previously, PTDF remains the same as long as the network topology remains unchanged; therefore, it only needs to be calculated once.
The sensitivity of each TL to power variations in HVDC buses, as determined from the PTDF calculation results, is shown in Figure 3. Figure 4 shows the sensitivity of the overloaded TLs (9th, 19th, and 20th) depending on the location of RE integration. By referring to Figure 2 and Figure 3 as well as Table 4, we can assess and infer the importance of the locations of HVDC and RE integration in terms of their impact on TL overloads. For TLs 19 and 20, the importance of alleviating TL overloads is as follows: HVDC in the order of #2–#3–#1, and RE in the order of #10–#4,5,19–#11 (the order below is omitted). For TL 9, because the current flow is in the opposite direction to the reference direction, the order of importance for alleviating line overloads is as follows: HVDC in the order of #3–#1–#2, and RE in the order of #17–#2,3,15–#13–#1,14 (the order below is omitted).
The maximum operating point of the MIDC systems can be determined by analyzing the HVDC specifications and frequency stability. As mentioned earlier, the frequency of the Jeju power system is highly dependent on the control of the MIDC systems. Therefore, the operating point of the MIDC systems is determined such that the remaining HVDC can compensate for the failure of one HVDC system. The operation scenario where #1 HVDC operates at its rated capacity of 300 MW is considered the most severe in terms of system operation. This is because, in the event of a failure, the #1 HVDC would be considered a complete loss with both lines, whereas the #2 HVDC would be considered a partial loss with only one line.
Therefore, the failure of the #1 HVDC in this situation has a more severe impact on the system than that of the #2 HVDC. The maximum operating point of the MIDC systems ( P M I D C F S ), determined by the frequency stability and specifications of each HVDC shown in Table 1 is 600 MW. The results of the frequency stability analysis are shown in Figure 5. As shown in Figure 5, if the MIDC systems operate beyond their maximum operating point, there may be insufficient downward reserve capacity to manage contingencies. Consequently, in the event of a fault, the frequency may exceed the over-frequency limit of 61.7 Hz, leading to a blackout caused by the tripping of all generators [32].
In Figure 6, the combinations of the maximum operating regions based on each HVDC specification are illustrated. As an illustration, in the scenario where #1 HVDC operates at 100 MW while #2 HVDC operates at 300 MW, the operating point of #3 HVDC corresponds to 200 MW, while if #1 HVDC operates at 300 MW alongside #2 HVDC at 300 MW, the operating point of #3 HVDC is 0 MW.

4.2. Simulation Results

We performed the simulation based on the three cases categorized in Table 3 according to the Monte Carlo approach and the proposed LP-based optimization method. Section 4.2.1 presents the influence of the change in the operating point of the MIDC systems on TL loading based on the PTDF. Section 4.2.2 includes a comparison of the simulation results for the AC power flow calculations and the results obtained by using the PTDF. Additionally, a comparison between the simulation results obtained by applying the Monte Carlo approach and the proposed LP-based optimization method is presented in Section 4.2.3. The AC power flow calculations and the Monte Carlo approach were conducted using the Power System Simulator for Engineering (PSS/E) Ver.33with Python automation code, whereas the proposed optimization method was implemented using MATLAB.

4.2.1. Impact of Change of Operating Point of the MIDC Systems

The calculated variation and rate of power flow in each TL using the previously calculated PTDF and the combinations of operating point of the MIDC systems are shown in Figure 7 and Figure 8, respectively.
By adjusting the HVDC operating points, the power flow in the TLs can be varied from a minimum of 0% (0 MW) to a maximum of approximately 64.4% (128.8 MW). Furthermore, the magnitude of power flow fluctuations resulting from the change of operating point of the MIDC systems increases as the electrical distance between the MIDC systems and the TL decreases. Based on these results, we anticipate that TL overloading can be alleviated by implementing operational strategies for the MIDC systems.

4.2.2. Comparison between AC Power Flow Calculations and PTDF-Based Calculations

In this section, the proposed method, depicted in Figure 2, is utilized to derive the optimal operation point of the MIDC system and minimize RE curtailment. Furthermore, to validate the accuracy of the results and make the necessary corrections, AC power flow calculations and PTDF-based calculations were performed using the optimization results.
The optimized operating point of the MIDC system and the locations and curtailment quantities of RE requiring control for each case obtained using the proposed method are presented in Table 5.
A weighting factor γ of 1 is applied to the constraint Equation (18) to mitigate the errors associated with power flow calculations using PTDF during the optimization process. From Table 5, the optimization results can be inferred to satisfy the constraints, including the maximum and minimum constraints for each variable, the constraints on the maximum operating point of the MIDC systems related to the frequency stability of the Jeju power system, and the constraint that the sum of variations in the operating point of the MIDC systems and curtailment quantities of RE is equal. Furthermore, as mentioned in Section 4.1.2, it can be observed that the adjustment of operating points for each HVDC and the control of RE output were performed in accordance with the order of importance.
To analyze the accuracy of the proposed optimization using PTDF data, AC power flow calculations were performed as the benchmark using data extracted from the optimization results. Using the results of the AC power flow based on the optimization data, the error for each case is calculated as follows:
ε P i = P F P T D F i P A C i ε P F i = P F P T D F i P F A C i ε L i = L P T D F i L A C i
where ε P i , ε P F i and ε L i represent the errors of MW flow, MVA flow, and MVA rating, respectively, for the i th line, between the results obtained from the PTDF-based calculations and the AC power flow calculations. P F P T D F i represents the power flow of the i th line calculated using PTDF, while P A C i and P F A C i represent the MW and MVA flows of the i th line calculated using AC current calculations, respectively. PTDF is a sensitivity measure for MW flow, but in this paper, it was also used to calculate errors in MVA flow calculations. Table 6 presents the current calculation results and error calculations for the overloaded lines, and Table 7 shows the average errors calculated for all TLs.
As shown in Table 6, when using the optimization result data for the AC power flow calculations, TL overloads were alleviated. Therefore, it can be observed that there is no need to adjust the weighting factor γ of constraint Equation (18). However, if the TL overloads are not resolved, it would be possible to adjust the weighting factor γ proportionally to the error ratio in order to mitigate the overloads. Additionally, from Table 6 and Table 7, it can be observed that, according to the characteristics of PTDF calculations, larger system variations can result in larger errors, especially in cases with severe line overloads. Moreover, because the variations in the reactive power are disregarded, the errors in the MVA flow calculations tended to be smaller than those in the MW flow calculations.

4.2.3. Comparison of Monte Carlo Approach and Proposed Method

In this section, the effectiveness of the proposed method is validated by comparing it with the Monte Carlo approach. The implementation of each method followed the flow shown in Figure 2. For the Monte Carlo approach, the results were obtained through 100,000 iterations.
Figure 9 and Table 8 show the total amount of RE curtailment calculated by applying the Monte Carlo approach and the proposed method for each case. As observed from Figure 9 and Table 8, when applying the proposed method, it can be confirmed that the proposed method achieves a reduction in RE curtailment ranging from a minimum of 4.3% to a maximum of 32.2%. From these results, it can be observed that controlling the operating point of the MIDC systems points and RE curtailment in the order that significantly impacts TL overloading is more effective rather than randomizing them.

5. Conclusions

Previous studies proposed methods for determining the operating points of embedded HVDC systems, as well as methods for determining the operating points of the MIDC systems and the capacity of RE integration from the perspectives of stability and robustness. This paper analyzed the impact of the operating point of the MIDC systems on TL congestion and power flow variations in an islanded system interconnected solely with a bulk power system. It presents an approach for minimizing RE curtailment by determining the optimal operating point of the MIDC systems. Thus, this paper proposes a methodology for determining the operating point of the MIDC systems and minimizing the amount of RE curtailment by considering the system stability and TL overloading criterion. In order to verify the effectiveness of the proposed method, we applied the methodology to the Jeju power system. As a result, the effectiveness of controlling the operation point of the MIDC system in mitigating TL congestion and reducing RE curtailment has been confirmed, as follows.
The power flow in the TLs can be adjusted within a range of 0% to approximately 64.4% by manipulating the HVDC operating points. As the electrical distance between the MIDC systems and the TLs decreased, the power flow fluctuations became more pronounced. This implies that implementing operational strategies for the MIDC systems can help alleviate TL overload. The optimization process successfully satisfied various constraints and prioritized the adjustment of the operating point of the MIDC systems and the control of RE output. The accuracy of the proposed optimization was validated through AC power flow calculations, which revealed that larger system variations led to larger errors, particularly in cases with severe TL overloads. However, the errors in the MVA flow calculations were smaller than those in the MW flow calculations owing to the exclusion of reactive power variations. A comparison with the Monte Carlo approach demonstrated that the proposed method effectively reduced RE curtailment by 4.3–32.2%. These findings confirm the effectiveness of the proposed optimization method for minimizing RE curtailment and addressing TL congestion in real power systems. Future research will focus on incorporating reactive power and voltage magnitude considerations to enhance the accuracy.

Author Contributions

Conceptualization, methodology, software, validation, formal analysis, investigation, resources, data curation, writing—original draft preparation, writing—review and editing, and visualization, H.S.; supervision, G.J. All authors have read and agreed to the published version of the manuscript.

Funding

This work was supported by Korea Institute of Energy Technology Evaluation and Planning (KETEP) grants funded by the South Korean government (MOTIE) (20191210301890 and 20210501010010).

Data Availability Statement

The data are not publicly available due to confidentiality restrictions.

Conflicts of Interest

The authors declare no conflict of interest.

Appendix A

The data of the Jeju power system include the data of conventional generators, TLs, REs, and the classification of the region, respectively.
Table A1. Conventional generators in the Jeju power system.
GeneratorsBus NamePmax (MW)Pmin (MW)
Jeju T/P#2Jeju C/C7542
Jeju T/P#37542
Jeju C/C#111078
Jeju C/C#211078
Jeju D/P#13828
Jeju D/P#23828
Namjeju T/P#1Namjeju C/C9550
Namjeju T/P#29550
Namjeju C/C15553
Halim C/CHalim C/C9543
Table A2. TLs in the Jeju power system.
NumberNameLine Rating (MVA)NumberNameLine Rating (MVA)
1Jeju C/C—Hala20021Halim C/C—Halim#1315
2Jeju C/C—Jocheon20022Halim C/C—Halim#2315
3Jeju C/C—Dongjeju C/S#129223Anduk—Namjeju C/C#1226
4Jeju C/C—Dongjeju20024Anduk—Namjeju C/C#2226
5Jeju C/C—Deokcheon20025Anduk—Namjeju C/C#3226
6Jeju C/C—Dongjeju C/S#229226Anduk—Sinseogui #1200
7Donjeju—Sanji#122127Anduk—Sinseogui #2200
8Donjeju—Sanji#222128Anduk—Halim200
9Dongjeju—Sumang20029Anduk—Gumak200
10Dongjeju—Gwhak#120030Sinsegui—Hala#1200
11Dongjeju—Gwhak#220031Sinsegui—Hala#2200
12Donjeju—DonjejuC/S#129132Hala—Sumang200
13Donjeju—DonjejuC/S#229133Seongsan—Pyoseon225
14Donjeju—DonjejuC/S#329134Seongsan—Deokcheon#1200
15Sinjeju—Seojeju C/S#120035Seongsan—Deokcheon#2200
16Sinjeju—Seojeju C/S#120036Pyoseon—Sumang#1200
17Sinjeju—Gwahak#120037Pyoseon—Sumang#2200
18Sinjeju—Gwahak#220038Deokcheon—Jocheon200
19Halim C/C—Seojeju C/S20039Halim—Gumak200
20Halim C/C—Jeju200
Table A3. Initial generation of RE by case.
CaseNumberBusPini (MW)NumberBusPini (MW)NumberBusPini (MW)NumberBusPini (MW)
A1Jocheon15.666Jocheon16.6111Anduk162.8116Sanji0.39
2Jocheon14.237Jocheon14.2412Sinseogui34.2617Sumang47.45
3Pyoseon37.968Donjeju9.9513Hala47.0518Jeju6.12
4Halim39.279Sinjeju20.3114Seongsan72.8319Halim296.17
5Halim248.7310HalimC/C88.3315Pyoseon64.4420Jocheon43.19
B1Jocheon10.446Jocheon11.0711Anduk186.0716Sanji0.26
2Jocheon9.497Jocheon9.4912Sinseogui39.1517Sumang31.63
3Pyoseon25.318Donjeju6.6313Hala31.3718Jeju6.99
4Halim44.889Sinjeju23.2214Seongsan48.5519Halim338.48
5Halim284.2710HalimC/C100.9515Pyoseon42.9620Jocheon28.79
C1Jocheon41.766Jocheon44.2911Anduk46.5216Sanji1.04
2Jocheon37.967Jocheon37.9612Sinseogui9.7917Sumang126.53
3Pyoseon101.238Donjeju26.5313Hala125.4818Jeju1.75
4Halim11.229Sinjeju5.8014Seongsan194.2119Halim84.62
5Halim71.0710HalimC/C25.2415Pyoseon171.8420Jocheon115.16
Table A4. Classification of the region.
Western RegionEastern Region
Sinjeju, Jeju, Halim C/C, Halim, Anduk,
Sinseogui
Donjeju, Sanji, Jocheon, Seongsan, Pyoseon, Hala, Sumang, Deokcheon

Appendix B

Since TL loading is based on the apparent power, while the variation in the power flow of TL calculated using PTDF is in terms of the active power, in this paper, the following approximations were performed based on the utilization of the initial current calculation results:
  • Approx 1: P F l = P l i n i + ( P T D F l , k × P k ) 2 + Q l i n i 2
  • Approx 2: P F l = P l i n i 2 + Q l i n i 2 + ( P T D F l , k × P k ) = P F l i n i + ( P T D F l , k × P k )
where P l i n i and Q l i n i represent the initial flow of active and reactive power, respectively. In Approx 1, the reactive power is kept fixed at its initial value, while only the active power is allowed to vary. In Approx 2, the variation in active power is considered equivalent to the variation in apparent power. Figure A1 illustrates the effects of the two approximations on the variation in TL loading in two scenarios of TL loading with initial values of 129.7% and 115.1% to the IEEE 9-bus test system.
Figure A1. An illustration of the accuracy of TL loading variation under different approximations.
Energies 16 05699 g0a1
It is evident that the approximation used in this paper (Approx 2) shows proximity to the AC power flow calculation results in both cases. Although there are slight discrepancies (0.49% and 1.05% in the two cases), these errors are minimal. It can be observed that if TL overloading is resolved using the approximation method, TL overloading can also be resolved in the AC power flow calculations.

References

  1. IEA. Power Systems in Transition: Challenges and Opportunities Ahead for Electricity Security; International Energy Agency (IEA): Paris, France, 2020; Available online: https://iea.blob.core.windows.net/assets/cd69028a-da78-4b47-b1bf-7520cdb20d70/Power_systems_in_transition.pdf (accessed on 1 October 2020).
  2. Cole, W.; Frazier, W. Impacts of increasing penetration of renewable energy on the operation of the power sector. Electr. J. 2018, 31, 24–31. [Google Scholar] [CrossRef]
  3. IEA. Getting Wind and Sun onto the Grid: A Manual for Policy Makers; International Energy Agency (IEA): Paris, France, 2017; Available online: https://www.iea.org/reports/getting-wind-and-solar-onto-the-grid (accessed on 1 March 2017).
  4. Revuelta, J.; Fernández, J.C.; Fernández, J.L. Large scale integration of renewable energy sources in the Spanish power system. Curtailment and market issues. In Proceedings of the 2011 8th International Conference on the European Energy Market, Zagreb, Croatia, 25–27 May 2011. [Google Scholar]
  5. Kang, C.; Chen, X.; Xu, Q.; Ren, D.; Huang, Y.; Xia, Q.; Wang, W.; Jiang, C.; Liang, J.; Xin, J.; et al. Balance of power: Toward a more environmentally friendly, efficient, and effective integration of energy systems in China. IEEE Power Energy Mag. 2013, 11, 56–64. [Google Scholar] [CrossRef]
  6. Bird, L.; Cochran, J.; Wang, X. Wind and Solar Energy Curtailment: Experience and Practices in the United States; NREL: Denver, CO, USA, 2014.
  7. Korean Ministry. 2030 Nationally Determined Contribution (NDC); Korean Ministry: Seoul, Republic of Korea, 2021.
  8. Korean Ministry of Trade, Industry and Energy. The 10th Basic Plan for Long-Term Electricity Supply and Demand (2022~2036); Korean Ministry of Trade, Industry and Energy: Sejong, Republic of Korea, 2023.
  9. Jeju Special Self-Governing Province. Carbon-Free Island Jeju 2030 (CFI 2030); Jeju Special Self-Governing Province: Jeju, Republic of Korea, 2012. [Google Scholar]
  10. KEEI. A Study on the Reasonable Cost Recovery of the Power Transmission Network; KEEI: Ulsan, Republic of Korea, 2015. [Google Scholar]
  11. KEPCO. 10th Long-Term Grid Reinforcement Plan; KEPCO: Naju, Republic of Korea, 2023; Available online: https://home.kepco.co.kr/kepco/PR/ntcob/ntcobView.do?pageIndex=1&boardCd=BRD_000117&boardSeq=21061873&menuCd=FN06030103 (accessed on 1 May 2023).
  12. Cheng, X.; Ovebye, T.J. PTDF-based power system equivalents. IEEE Trans. Power Syst. 2005, 20, 1868–1876. [Google Scholar] [CrossRef]
  13. Li, F.; Bo, L. DCOPF-Based LMP Simulation: Algorithm, Comparison with ACOPF, and Sensitivity. IEEE Trans. Power Syst. 2007, 22, 1475–1485. [Google Scholar] [CrossRef]
  14. Zhang, H.; Heydt, G.T.; Vittal, V.; Quintero, J. An improved network model for transmission expansion planning considering reactive power and network losses. IEEE Trans. Power Syst 2013, 28, 3471–3479. [Google Scholar] [CrossRef]
  15. Stott, B.; Marinho, J.L. Linear Programming for Power-System Network Security Applications. IEEE Trans. Power App. Syst. 1979, PAS-98, 837–848. [Google Scholar] [CrossRef]
  16. Stott, B.; Jardim, J.; Alsac, O. DC power flow revisited. IEEE Trans. Power Syst. 2009, 24, 1290–1300. [Google Scholar] [CrossRef]
  17. Wood, A.J.; Wollenberg, B.F. Power Generation, Operation and Control; Willy: New York, NY, USA, 1996. [Google Scholar]
  18. Fatemi, S.; Abedi, S.; Gharehpetian, G.; Hosseinian, S.; Abedi, M. Introducing a novel dc power flow method with reactive power considerations. IEEE Trans. Power Syst. 2015, 30, 3012–3023. [Google Scholar] [CrossRef]
  19. Van Hertem, D.; Verboomen, J.; Purchala, K.; Belmans, R.; Kling, W. Usefulness of dc power flow for active power flow analysis with flow controlling devices. In Proceedings of the 8th IEE International Conference on AC and DC Power Transmission, London, UK, 28–31 March 2006; pp. 58–62. [Google Scholar] [CrossRef]
  20. Sauer, P.W. On the formulation of power distribution factors for linear load flow methods. IEEE Trans. Power App. Syst. 1981, PAS-100, 764–779. [Google Scholar] [CrossRef]
  21. Lee, J.; Yoon, M.; Hwang, S.; Jeong, S.; Jung, S.; Jang, G. Development of A Loss Minimization Based Operation Strategy for Embedded BTB VSC HVDC. Appl. Sci. 2019, 9, 2234. [Google Scholar] [CrossRef] [Green Version]
  22. Jung, J.; Park, J.; Lee, H.; Lee, B. Evaluation of inertia resource for securing nadir frequency in HVDC interconnected system with high penetration of RES. In Proceedings of the 3rd ICPEE, Singapore, 29–31 December 2022; pp. 1374–1383. [Google Scholar] [CrossRef]
  23. Lee, C.; Im, S.; Jung, J.; Lee, B. BESS Deployment Strategy in Jeju Carbon-Free Islands for Reducing Renewable Energy Curtailment. Energies 2020, 13, 6082. [Google Scholar] [CrossRef]
  24. Jung, S.; Yoon, M. An Optimal HVDC Type Study to Increase Wind Power Capacity in Multi-Infeed HVDC Systems. IJET 2018, 7, 527–530. [Google Scholar]
  25. Kim, S.; Hur, J. Probabilistic Approaches to the Security Analysis of Smart Grid with High Wind Penetration: The Case of Jeju Island’s Power Grids. Energies 2020, 13, 5785. [Google Scholar] [CrossRef]
  26. Yoon, M.; Yoon, Y.; Jang, G. A Study on Maximum Wind Power Penetration Limit in Island Power System Considering High-Voltage Direct Current Interconnections. Energies 2015, 8, 14244–14259. [Google Scholar] [CrossRef] [Green Version]
  27. Valenzuela, J.; Mazumdar, M. Monte Carlo Computation of Power Generation Production Costs Under Operating Constraints. IEEE Trans. Power Syst. 2001, 16, 671–677. [Google Scholar] [CrossRef]
  28. KPX. Electricity Market Operation Rules; KPX: Naju, Republic of Korea, 2023; Available online: https://new.kpx.or.kr/board.es?mid=a11002010000&bid=0030 (accessed on 3 May 2013).
  29. KPX. Monthly New & Renewable Energy Generation Curtailment on Jeju Island; KPX: Naju, Republic of Korea, 2022; Available online: https://www.data.go.kr/data/15100208/fileData.do (accessed on 10 May 2022).
  30. ENTSO-E. HVDC Links in System Operations: Technical Paper; ENTSO-E: Brussels, Belgium, 2019. [Google Scholar]
  31. Impram, S.; Nese, S.V.; Oral, B. Challenges of renewable energy penetration on power system flexibility: A survey. Energy Strategy Rev. 2020, 31, 100539. [Google Scholar] [CrossRef]
  32. IEEE Power Engineering Society. IEEE Std C37.106™-2003: IEEE Guide for Abnormal Frequency Protection for Power Generating Plants; IEEE: New York, NY, USA, 2004. [Google Scholar] [CrossRef]
Figure 1. Schematic diagram of the Jeju power system.
Energies 16 05699 g001
Figure 2. Flowchart for the implementation of the Monte Carlo and proposed method.
Energies 16 05699 g002
Figure 3. Sensitivity factor of transmission lines to HVDC variations.
Energies 16 05699 g003
Figure 4. Sensitivity factor of congested transmission lines accordance with RE locations.
Energies 16 05699 g004
Figure 5. Frequency stability analysis in case of #1 HVDC failure.
Energies 16 05699 g005
Figure 6. Maximum operating point of the MIDC systems.
Energies 16 05699 g006
Figure 7. Variation in power flow in transmission lines.
Energies 16 05699 g007
Figure 8. Variation rate of power flow in transmission lines.
Energies 16 05699 g008
Figure 9. Comparison of the total amount of RE curtailment for each method.
Energies 16 05699 g009
Table 1. Specifications of the high-voltage direct-current (HVDC) systems on Jeju Island.
HVDCRouteTypeVoltage (kV)Capacity (MW)Start of Operation
#1Jeju–HaenamLCC±180±150 × 2March 1998
#2Seojeju–JindoLCC±250±200 × 2April 2014
#3Dongjeju–WandoVSC±150±200December 2023 (planed)
Table 2. Degree of RE curtailment in the Jeju power system.
Year20152016201720182019202020212022
Number of events361415467765132
Amount (MWh)15025013001370923019,45012,05028,850
Table 3. Details for simulation cases.
CaseDemand (MW)HVDCini (MW)Generation (MW)
#1HVDC#2HVDC#3HVDCConventional *REini
WestEast
A860200200200180896384
B1024256
C2561024
* Operating units: Jeju T/P#2, Jeju T/P#3, Namjeju C/C and Halim C/C.
Table 4. Congested transmission lines for each case.
CaseViolated Transmission LineP
(MW)
PF
(MVA)
Line Rating
(MVA)
Loading
(%)
NumberName
A19Halim C/C–Seojeju C/S258.30258.41200129.21
20Halim C/C–Jeju258.30258.41200129.21
B19Halim C/C–Seojeju C/S290.09290.17200145.08
20Halim C/C–Jeju290.09290.17200145.08
C9Dongjeju–Sumang 213.66 * 214.92 *200107.46
* A negative sign indicates that the power flow is in the opposite direction.
Table 5. Optimal results for operating point of the MIDC system and RE curtailment.
Monitor ElementInitial Value (MW)OPT Value (MW)
Case ACase BCase C
HVDC#1200300300300
#22004040400
#3200120.6821.343−116.161
Renewable Energy#439.2740039.274
#5248.734237.024191.443248.734
#1088.3300088.330
#17126.535126.535126.535115.374
Table 6. Results of power flow and error calculations.
CaseLine P A C P F A C P F P T D F L A C L P T D F ε P ε P F ε L
AHalim C/C–Seojeju C/S197.59197.6720098.831002.412.331.17
Halim C/C–Jeju197.59197.6720098.831002.412.331.17
BHalim C/C–Seojeju C/S195.70195.8520097.921004.304.152.08
Halim C/C–Jeju195.70195.8520097.921004.304.152.08
CDongjeju–Sumang198.67198.9320099.461001.331.070.54
Table 7. Average errors of power flow calculations.
Error IndicatorsCase ACase BCase C
Average error of MW flow ( ε P , MW)7.448.114.12
Average error of MVA flow ( ε P F , MVA)2.513.431.90
Average error of line loading ( ε L , %)1.101.560.86
Table 8. Simulation cases.
Simulation MethodRE Curtailment (MW)
Case ACase BCase C
Monte Carlo approachMin25839666
Max552570156
Mean378.28502.8696.73
Proposed method139.31238.6611.16
Disclaimer/Publisher’s Note: The statements, opinions and data contained in all publications are solely those of the individual author(s) and contributor(s) and not of MDPI and/or the editor(s). MDPI and/or the editor(s) disclaim responsibility for any injury to people or property resulting from any ideas, methods, instructions or products referred to in the content.

