Article

Low-Carbon Economic Optimization of Integrated Energy System Considering Refined Utilization of Hydrogen Energy and Generalized Energy Storage

School of Electrical and Electronic Engineering, North China Electric Power University, Beijing 102206, China
*
Author to whom correspondence should be addressed.
Energies 2023, 16(15), 5700; https://doi.org/10.3390/en16155700
Submission received: 29 June 2023 / Revised: 17 July 2023 / Accepted: 27 July 2023 / Published: 30 July 2023

Abstract

:
In order to improve the level of new energy consumption in the system and utilize the clean and efficient characteristics of hydrogen energy, an integrated energy system (IES) scheduling model considering refined utilization of hydrogen energy and generalized energy storage is proposed. Firstly, the two-stage hydrogen energy utilization model of power-to-gas (P2G) is finely modeled, and the waste heat of the P2G methanation reaction is innovatively coupled with the Kalina cycle to improve the thermoelectric decoupling capability of the combined heat and power (CHP) unit. Secondly, integrated demand response, electric vehicles, and hydrogen-containing multi-source energy storage equipment are used as generalized energy storage resources to cut peaks and fill valleys. Then, on the basis of considering the ladder-type carbon trading mechanism, the IES conventional operation model is constructed with the minimum operating cost of the system as the objective function. Furthermore, considering the source-load uncertainty of IES operation, a multi-energy complementary optimal scheduling model of hydrogen-containing IES based on conditional value-at-risk was established. Through simulation analysis, it can be seen that the proposed model takes into account both economic and environmental benefits and improves the system’s ability to “peak cutting and valley filling” and measure risk levels.

1. Introduction

With the further promotion of the “dual carbon” goal, a higher proportion of clean energy is connected to the power grid [1,2]. How to build an efficient, low-carbon, and clean energy system has become the key to solving environmental pollution and the energy crisis [3]. The IES integrates data processing [4], energy transmission, and other technologies that can achieve multi-energy collaborative optimization scheduling, facilitate energy cascade utilization, promote new energy accommodations, and reduce carbon emissions [5].
As a clean energy source with no carbon emissions and high combustion heat, hydrogen energy can be combined with different energy sources in IES to achieve low-carbon and efficient scheduling. Through P2G technology, the surplus electric energy can be converted into methane [6], and the reference [7] refines the P2G operation model on this basis by adding electric to hydrogen and hydrogen to electricity links to realize the interaction between electrical energy and hydrogen energy. In [8], the waste heat from hydrogen to methane is recovered and used as heating power, while the hydrogen-containing natural gas pipeline network and hydrogen fuel cell vehicles are added to further improve the utilization of hydrogen energy. In [9,10], IES recovers methanation waste heat by using carbon capture equipment to improve the energy efficiency of the system and introduces a green certificate-carbon trading mechanism to increase hydrogen production and wind power accommodation. The above references mostly study the hydrogen energy utilization model of IES and schedule the waste heat from P2G methanation directly as heating heat without considering its utilization by synthesizing new energy forms through energy transition equipment. Meanwhile, the impact of source-load uncertainty on the scheduling model of hydrogen-containing IES with generalized energy storage has not been further investigated.
Conventional CHP units have the problem of determining power by heat [11], resulting in a low energy utilization rate. At present, many scholars have conducted research on this problem. In [12], a CHP unit model with an adjustable heat-to-electricity ratio is proposed, which dynamically adjusts the heat-to-electricity ratio according to the energy price to realize thermoelectric decoupling. In [13], electric boilers and heat storage devices are added to the CHP side to realize thermoelectric decoupling of multiple CHP units and promote wind power accommodation. The organic Rankine cycle (ORC) is introduced in [14], which uses the waste heat of gas turbines (GT) to generate electricity and improve the flexibility of the energy supply. However, the Kalina cycle, with its higher thermal energy utilization [15], has better thermoelectric decoupling capacity than ORC. Therefore, this paper introduces the Kalina cycle and couples it with the P2G waste heat recovery device to further improve the thermoelectric decoupling capacity of the CHP unit and the new energy consumption capacity of the IES. Meanwhile, the impact of the CHP thermoelectric decoupling model on IES carbon emissions under the ladder-type carbon trading mechanism is further analyzed.
Energy storage equipment can reduce the impact of source-load uncertainty. At present, many scholars have studied generalized energy storage (GES). In [16], flexible electric and thermal loads as well as electric and thermal energy storage are involved in economic scheduling as GES resources, and the regulation characteristics of different GES are analyzed. In [17], integrated demand response (IDR) and pipeline energy storage are used as virtual energy storage to improve system flexibility, and a distribution robust optimization method based on the Wasserstein metric is used to measure the system uncertainty. As a virtual energy storage resource, electric vehicles (EVs) provide fast backup power for IES and improve the consumption level of clean energy for IES. References [18,19] consider the operating cycle of EVs and determine the type of battery that maximizes the energy efficiency and battery life of EVs. In [20,21] electric vehicles and air-conditioning clusters are regarded as GES, and the energy supply stability of the system is effectively improved through multi-time scale scheduling and GES collaborative optimization. Reference [22] quantifies the potential of flexible load demand response (DR) in GES and proves through example analysis that the new energy consumption level of the power grid can be improved by joint planning of distributed generation and GES. The GES model proposed in [23] includes user-side schedulable resources and multi-source energy storage systems that take into account electricity, heat, and cold energy. The proposed optimal scheduling model can achieve the optimal allocation of multiple energy sources in the system. The actual energy storage models in the above references mainly consider electric energy and thermal energy; they do not consider gas storage or hydrogen storage models. The joint optimization operation of EV and IDR in terms of virtual energy storage is also ignored.
In summary, this paper first proposes a refined utilization model of hydrogen energy, innovatively coupling the P2G reaction waste heat with the Kalina cycle to improve the energy utilization efficiency of IES. Secondly, IDR and EV are used as GES resources for peak shaving. Then, on the basis of considering the ladder-type carbon trading mechanism, the IES conventional operation model is constructed. In order to further consider the impact of system operation uncertainty, an IES operation optimization model combining the scenario analysis method and conditional value-at-risk (CVaR) is proposed. Finally, the effectiveness and superiority of the proposed model are demonstrated by solving and analyzing numerical examples.

2. Materials and Methods

2.1. IES Structure Considering GES and Hydrogen Energy Utilization

In this paper, IES includes three links: the energy supply side, the energy conversion side, and the load demand side. At the same time, the regulation role of actual energy storage and virtual energy storage is considered to realize the multi-energy coupling optimization operation of IES. The supply side includes wind turbines (WT), photovoltaic (PV), gas grids, and the superior power grid. On the energy conversion side, the electricity-hydrogen coupling link includes methane reactors (MR), electrolyzers (EL), hydrogen fuel cells (HFC), and P2G waste heat recovery devices. In addition, the GT and Kalina cycles can be used to generate electricity. Waste heat boilers (WHB), gas boilers (GB), and power-to-heat (P2H) are used for heat production. Electricity storage (ES), gas storage (GS), thermal storage (TS), and hydrogen storage (HS) devices can be used as actual energy storage devices. On the load demand side, EV charging and discharging models and IDR can be used as virtual energy storage resources to flexibly schedule multiple energy sources in IES. The system structure diagram is shown in Figure 1.
EL produces hydrogen by electrolysis of water, which is the key equipment in the electricity-hydrogen coupling link. EL is beneficial for IES to utilize the pollution-free and good combustion performance characteristics of hydrogen energy. Meanwhile, the current research shows that the energy conversion efficiency of EL electrolytic hydrogen production can reach 80%, which is much higher than the efficiency of electrolytic natural gas production. Therefore, this paper improves the cleanliness and efficiency of IES energy use through the electricity-hydrogen coupling link.

2.2. Energy Conversion Equipment Model

2.2.1. Electricity-Hydrogen Coupling Link

The electricity-hydrogen coupling link models the two-stage hydrogen energy utilization model of P2G, including electrolytic hydrogen production and hydrogen energy utilization. The hydrogen energy utilization link includes the hydrogen to methane conversion process of MR and the thermal and electrical conversion process of HFC, which can realize the cascade utilization of hydrogen energy. In addition, in order to improve the efficiency of energy utilization, this paper introduces a P2G waste heat recovery device to recycle the waste heat of the hydrogen methanation reaction.
  • EL equipment model
EL uses water as the raw material and converts electric energy to hydrogen energy through the electrolytic hydrogen production process. The resulting hydrogen energy flows into MR, HFC, and HS, respectively. The equipment model for EL is as follows:
{ P H , EL , t = P EL , t η EL P EL min P EL , t P EL max Δ P EL min P EL , t + 1 P EL , t Δ P EL max
where P EL , t and P H , EL , t denote the input electric power and output hydrogen energy of EL at time t; η EL is the hydrogen production efficiency of EL; P EL max and P EL min are the maximum and minimum power consumption of the EL; Δ P EL max and Δ P EL min are the upper and lower limits of the ramp rate of EL.
2.
MR equipment model
MR converts the hydrogen energy input from EL into CH4 through the methanation reaction and supplies it to the gas load and gas unit. The MR equipment model is as follows:
{ P g , MR , t = P H , MR , t η MR P H , MR min P H , MR , t P H , MR max Δ P H , MR min P H , MR , t + 1 P H , MR , t Δ P H , MR max
where P H , MR , t and P g , MR , t denote the input hydrogen power and output gas power of MR at time t; η MR is the CH4 generation efficiency of MR; P H , MR max and P H , MR min are the maximum and minimum hydrogen consumption powers of MR. Δ P H , MR max and Δ P H , MR min are the upper and lower limits of the ramp rate of MR.
3.
HFC equipment model
HFC uses hydrogen energy to generate electricity and heat directly, reducing the energy loss caused by hydrogen energy through multiple energy conversions. The thermoelectric ratio of HFC can be flexibly adjusted by adjusting the heat dissipation cycle rate. The HFC device model is as follows:
{ P e , HFC , t + P h , HFC , t = η HFC P HFC , t P HFC min P HFC , t P HFC max Δ P HFC min P HFC , t + 1 P HFC , t Δ P HFC max k HFC min P h , HFC , t / P e , HFC , t k HFC max
where P HFC , t , P e , HFC , t , and P h , HFC , t are, respectively, the hydrogen energy input and the electricity and heat energy output of HFC at time t; η HFC is the energy conversion efficiency of HFC; P HFC max and P HFC min are the maximum and minimum hydrogen consumption power of HFC; Δ P HFC max and Δ P HFC min are the upper and lower limits of the ramp rate of HFC. k HFC max and k HFC min are the upper and lower limits of the adjustable heat-to-electric ratio of HFC.
4.
P2G waste heat recovery device model
The chemical reaction process of P2G in two-stage operation is shown in Equations (4) and (5).
{ H 2 O electrify H 2 + 1 2 O 2 CO 2 + 4 H 2 catalyst CH 4 + 2 H 2 O
Δ H = 165.01 kJ / mol
where Δ H is the entropy of a chemical reaction. When its value is negative, it means that the chemical reaction is exothermic.
Formula (5) shows that P2G releases heat during the methanation reaction. In order to avoid heat waste and improve energy efficiency, the waste heat from the P2G reaction is recovered by the waste heat recovery device. The heat released by the P2G methanation reaction in unit time H CH 4 is calculated by the following formula:
H CH 4 = ( P EL   / v H 2 ) ρ H 2 1.44 × 10 4 Δ H M H 2 η CH 4
where Δ H and P EL   are methanation reaction heat release and EL power consumption; v H 2 is the rate of electrolytic hydrogen production; ρ H 2 and M H 2 are the density and molar mass of hydrogen; η CH 4 is the proportion of reaction heat recovered by the heating network. According to Equation (4), P2G can recover 0.1188 kW·h of reaction heat for every 1 kW·h of electric energy consumed.
Based on this, the thermal power of P2G waste heat recovery is obtained as follows:
P h , P 2 G , t = η P 2 G P EL , t
where η P 2 G and P h , P 2 G , t are P2G waste heat recovery efficiency and heat power recovered at time t.

2.2.2. Thermoelectric Decoupling Model of CHP Unit

Traditional CHP units are prone to high forced power output when meeting thermal loads, resulting in issues such as determining power by heat and energy waste. In this paper, the thermoelectric decoupling model of CHP units is introduced by coupling the P2G waste heat recovery device with the Kalina cycle.
  • Gas turbine
{ P e , GT , t = P GT , t η gte P h , GT , t = P GT , t η gth P h , GT , t = P WHB , t + P h , KLN , t P GT min P GT , t P GT max Δ P GT min P GT , t P GT , t 1 Δ P GT max
where P GT , t , P GT max , and P GT min are the input gas power of GT and its upper and lower limits; P e , GT , t and P h , GT , t are the electric power and thermal power output by GT; P WHB , t and P h , KLN , t denote the thermal power flowing into WHB and Karina cycles, respectively; η gte and η gth are the gas-to-electricity and gas-to-thermal efficiency of GT, respectively. Δ P GT max and Δ P GT min are the upper and lower limits of the ramp rate of GT.
2.
Waste heat boiler model
{ P h , WHB , t = η whb   P WHB , t P WHB min P WHB , t P WHB max P h , CHP , t = P h , WHB , t
where P WHB , t , P WHB max , and P WHB min denote the input power of WHB and its upper and lower limits; η whb   and P h , WHB , t denote the waste heat recovery efficiency and output thermal power of WHB; P h , CHP , t denotes the thermal power output of the CHP.
3.
Coupling model of Kalina cycle and P2G waste heat recovery device
In this paper, the waste heat of GT power generation and P2G methanation waste heat are recovered, and waste heat power generation is carried out through the Kalina cycle to realize secondary utilization of energy, further improve the energy supply flexibility of CHP units, and achieve the optimal ratio of heating and power supply.
{ P e , KLN , t = η kln   ( P h , KLN , t + P h , P 2 G , t ) P KLN min P e , KLN , t P KLN max P e , CHP , t = P e , GT , t + P e , KLN , t
where P e , KLN , t , P KLN max , and P KLN min denote the output power of Kalina cycle and its upper and lower limits; η kln   denote the thermoelectric conversion efficiency of the Kalina cycle; and P e , CHP , t is the output power of CHP.

2.2.3. P2H and GB Model

P2H converts electric energy into heat energy during periods of low electricity prices, which can effectively utilize the curtailment of wind and photovoltaic power and adjust the power load curve. GB outputs thermal power by burning natural gas and compensates for thermal energy when waste heat boiler heat is insufficient. The power model of P2H and GB is shown in Equation (11).
{ P h , i , t = P i , t η i P i min P i , t P i max Δ P i min P i , t P i , t 1 Δ P i max
where P i , t and P h , i , t denote the input power and output thermal power of device i at time t, respectively, i { P 2 H , GB } ; η i is the energy conversion efficiency of device i; P i max and P i min are the maximum and minimum power consumption of the device i; Δ P i max and Δ P i min are the upper and lower limits of the ramp rate of device i.

2.3. Generalized Energy Storage Model

2.3.1. Actual Energy Storage Model

The multi-source energy storage model in this paper includes ES, TS, GS, and HS with similar charging and discharging models, which can be expressed by the following equations.
S i , t = S i , t 1 ( 1 μ i ) + ( η i , ch P i , ch , t P i , dis , t / η i , dis ) Δ t  
S i min S i , t S i max
S i , 0 = S i , 24
where i is the type of actual energy storage device, i { ES , TS , GS , HS } ; S i , t and μ i are the capacity and energy self-loss coefficient of the energy storage device at time t; P i , ch , t and P i , dis , t are the charging and discharging power of the energy storage device at time t; S i , 0 and S i , 24 are the energy of the energy storage device at the beginning and end of a day, respectively.

2.3.2. IDR Model

Different flexible loads have different responses to electricity price changes and incentive subsidies. In this paper, the electric load and gas load are affected by price factors. Therefore, the IDR of electric load and gas load includes price-based, incentive-based, and alternative DR. Heat load DR only considers transferable, flexible heat loads.
  • Price-based DR
The price elasticity matrix is used to realize the time shift of flexible electric load and gas load, which promotes users to realize “peak cutting and valley filling”. The price elasticity coefficient m i , t , k is calculated as follows:
m i , t , k = Δ P i , t P i , 0 q i , k , 0 Δ q i , k , i { e , g }
where i is the type of energy, e denotes electric energy, and g denotes gas energy; m i , t , k denotes the energy price elasticity coefficient between time t and time k of load i; P i , 0 and Δ P i , t are the initial load and the load response after DR; q i , k , 0 and Δ q i , k are the initial energy price at time k and the change of energy price after DR.
Furthermore, the mathematical model of price-type electrical load and gas load DR is obtained.
{ Δ P i , TS , t = P i , t , 0 k = 1 T [ M i ( t , k ) Δ q i , k q i , k , 0 ] 0 | Δ P i , TS , t | Δ P i , TS , t max t = 1 T Δ P i , TS , t = 0
where P i , t , 0 and Δ P i , TS , t denote the energy i load before the price-based DR and the load change after the DR; Δ P i , TS , t max is the upper limit of the change in the DR of energy i at time t; M i denotes the price elasticity matrix of energy i, which is composed of m i , t , k ; T is the scheduling period, which is set to 24 h.
2.
Incentive DR
(1)
Electric load and gas load Incentive DR
Users can sign a contract with the power system to reduce a certain amount of electric and gas load within a specified time range and obtain compensation, the formula is as follows:
{ Δ P i , cut , t = P i , t , 0 P i , cut , t | t = 1 T Δ P i , cut , t | φ c t = 1 24 P i , t , 0
where Δ P i , cut , t and P i , cut , t are the total reduction and load of energy i after DR at time t; φ c is the upper limit of the total change rate of the load.
  • (2)
    Heat load DR
Transferable flexible heat loads are considered in the heat load DR, such as the air-conditioning heat load, which can adjust its operation period according to the peak and valley characteristics of the load. The mathematical model of the flexible heat load is as follows:
P h , load , t = P h , load , t 0 P h , out , t + P h , in , t
t = 1 24 P h , out , t = t = 1 24 P h , in , t
P h , out , t P h , in , t = 0
where P h , load , t and P h , load , t 0 denote the heat load before and after the DR at time t; P h , out , t and P h , in , t denote the heat load transferred out and transferred in at time t, respectively.
IES provides incentive compensation to users according to the peak shaving effect of heat load DR, and the formula is as follows:
C DR , h , t = ζ 1 [ max ( P h , load , t 0 ) max ( P h , load , t ) ]
where C DR , h , t is the total compensation cost of heat load DR; ζ 1 is the compensation cost per unit of peak regulation power.
3.
Alternative demand response
The alternative demand response does not affect the user’s energy use experience, and the user can choose the appropriate energy use mode according to the electricity price and gas price data published by the operator. The formula is as follows:
Δ P re , g , t = ε e , g Δ P re , h , t
ε e , g = v e φ e v g φ g
Δ P re , i , t min Δ P re , i , t Δ P re , i , t max , i { e , g }
where Δ P re , g , t and Δ P re , h , t denote the corresponding increments of gas load and electric load at time t; v e and v g are the unit calorific value of electric energy and gas energy, respectively; φ e and φ g are the energy efficiency of electric energy and gas energy; ε e , g is the conversion coefficient of electric energy and gas energy; Δ P re , i , t min and Δ P re , i , t max are the lower limit and upper limit of the alternative quantity of load i.
Therefore, the electric load and gas load can be expressed by Equation (25).
P i , load , t = P i , t , 0 + Δ P re , i , t Δ P i , cut , t + Δ P i , TS , t , i { e , g }

2.3.3. Charging and Discharging Models of EV

EV grid-connected models include disordered charging and ordered charge-discharge models. Among them, EV disordered charging models are unscheduled resources, and the probability density function of the EV return time and the all-day driving distances obey the normal distribution. Therefore, the load calculation method for EV disordered charging can be referred to [24].
EVs based on V2G technology can be used as virtual energy storage devices and are regarded as flexible power loads to regulate load fluctuations [25]. The IES dispatching center predicts the travel demand of EV users based on historical statistical data and formulates reasonable charging and discharging strategies that are conducive to peak shaving and valley filling of the power grid. This paper mainly studies the electric energy interaction models with IES charging stations when EVs are connected to the grid based on V2G technology, as shown in Equation (26).
{ 0 P ch , k , t EV δ ch , k , t P ch , k EV , max 0 P dis , k , t EV δ dis , k , t P dis , k EV , max δ ch , k , t + δ dis , k , t = σ k , t S k , t EV = S k , t 1 EV + ( P ch , k , t EV η ch EV P dis , k , t EV η dis EV ) Δ t S k EV , min S k , t EV S k EV , max S k , 0 EV = S k , 24 EV
where δ ch , k , t and δ dis , k , t are 0–1 variables, when δ ch , k , t and δ dis , k , t take 1, it means EV is in charging and discharging states, respectively; otherwise, it takes 0; σ k , t is the state of EV. In addition, σ k , t = 1 and σ k , t = 0 denote the grid-connected and off-grid state of EV k at time t; P ch , k , t EV and P dis , k , t EV   denote the charging and discharging power of EV k at time t; P ch , k EV , max and P dis , k   EV , max are the maximum charging and discharging power of the EV k; S k , t EV is the battery capacity of the EV k at time t; η ch EV and η dis EV are the charging and discharging efficiency of EV. S k EV , min and S k EV , max are the minimum and maximum battery capacities of EV k.
The subsidy incentive C mot EV for EVs discharge is shown in Equation (27).
C mot EV = k = 1 N t = 1 T P dis , k , t EV p e
where p e is the subsidized unit price of IES for EVs discharge power.

2.4. IES Low-Carbon Economic Scheduling Model

2.4.1. Scenario Analysis Considering Source-Load Uncertainty

The scenario analysis method includes scenario generation and scenario reduction. In the scenario generation, the actual values of renewable energy output and load power are superimposed by their predicted values and error values, where the prediction error obeys the normal distribution, that is, ε ~ N ( 0 , σ 2 ) . A large number of scenarios satisfying the prediction error probability distribution can be generated by the Latin Hypercube sampling method with high sampling accuracy. Then, the scenario reduction is carried out by the backward reduction method based on Kantorovich distance [26], and finally, k typical scenarios of wind-photovoltaic load are obtained.

2.4.2. Stepped-Type Carbon Trading Mechanism

Compared with the traditional carbon trading mechanism, the stepped-type carbon trading mechanism adopted in this paper sets multiple carbon emission intervals with increasing prices. The larger the carbon emission rights purchased, the higher the purchase price of the corresponding interval. The method of carbon emission quota allocation in IES is shown as follows:
E c = β e P buy , t + β h P h , GB , t + β h ( β e , h P e , GT , t + P h , WHB , t )
where P buy , t is the amount of electricity purchased at time t; β e and β h denote the carbon emission quota of the unit power and heat. β e , h denotes the electric-thermal conversion coefficient.
The cost of ladder-type carbon trading is shown in Formula (29) [27].
F CO 2 = { λ ( E a E c ) , E a E c + d λ d + ( 1 + ρ ) λ ( E a E c d ) , E c + d < E a E c + 2 d ( 2 + ρ ) λ d + ( 1 + 2 ρ ) λ ( E a E c 2 d ) , E c + 2 d < E a E c + 3 d ( 3 + 3 ρ ) λ d + ( 1 + 3 ρ ) λ ( E a E c 3 d ) , E c + 3 d < E a E c + 4 d ( 4 + 6 ρ ) λ d + ( 1 + 4 ρ ) λ ( E a E c 4 d ) , E a > E c + 4 d
where F CO 2 is the ladder-type carbon transaction cost; E a is the actual carbon emissions; λ and ρ are the base price and price growth rate of carbon trading; d is the length of the carbon emission interval.

2.4.3. IES Basic Scheduling Model

This paper comprehensively considers the low-carbon and economy of IES operation, so the objective function is composed of IES operation cost and carbon transaction cost. The operation cost of IES includes energy purchase cost F BUY , IDR cost F IDR , and equipment operation and maintenance cost F OM . The objective function is shown as follows:
F = min ( F BUY + F IDR + F OM + F CO 2 )
where F BUY , F IDR , and F OM are shown in Formulas (31)–(33); F CO 2 is shown in Equation (29).
F BUY = t = 1 T χ e , t P buy , t + t = 1 T χ h , t P h , buy , t
where χ e , t and χ h , t are the unit prices of electricity and gas at time t; P h , buy , t is the amount of natural gas purchased at time t.
F IDR = i { e , g } t = 1 T ( c i , TS | Δ P i , TS , t | + c i , re | Δ P re , h , t | + c i , cut Δ P i , cut , t ) + t = 1 T C DR , h , t + C mot EV
where c i , TS , c i , re , and c i , cut are the unit power compensation prices of users participating in IDR.
F OM = x U t = 1 T ψ x P x , t
where U denotes the set of all devices in IES; x is the device type; P x , t and ψ x are the unit operation and maintenance costs of device x and the output of device x at time t.

2.4.4. IES Economic Scheduling Model Considering CVaR

CVaR can be used to measure the risks in the course of IES operations and assess the loss range of IES under specific risks. The scenario probability obtained by the scenario generation method is φ k . Therefore, the expected operating cost of IES under scenario k is as follows:
f ( k ) = F BUY , k + F IDR , k + F OM , k + F CO 2 , k
where F BUY , k , F IDR , k , F OM , k , and F CO 2 , k are the energy purchase cost, IDR cost, equipment operation and maintenance cost, and carbon transaction cost in scenario k, respectively.
The CVaR mathematical model of IES economic scheduling is as follows:
F CVaR = α + 1 1 β k = 1 K φ k [ f ( k ) α ] +
where α is the VaR value; β is the confidence level; K is the number of scenarios; [ f ( k ) α ] + = max { f ( k ) α , 0 } .
Through the risk preference coefficient δ , the expected costs of IES are combined with the average loss costs, δ ( 0 , 1 ) . The overall objective function is as follows:
{ min f = ( 1 δ ) F EX + δ F CVaR F EX = k = 1 K φ k f ( k )
where F EX is the expected operating costs of IES.

2.4.5. Constraint Conditions

1.
Electrical power balance constraints
0 P buy , t P buy max
P buy , t + P WT , t + P PV , t = P e , Load , t + P e , ch , t P e , dis , t + P P 2 H , t + P EL , t P e , HFC , t P e , GT , t P e , KLN , t + n ( P ch , k , t EV P dis , k , t EV )
where P buy max is the upper limit of purchased power; P WT , t and P PV , t are the wind power and photovoltaic power at time t; n is the number of scheduled EVs in IES.
2.
Gas power balance constraints
0 P g , buy , t P g , buy max
P g , buy , t + P g , MR , t = P g , Load , t + P g , ch , t P g , dis , t + P GT , t + P GB , t
where P g , buy max is the upper limit of purchased gas power.
3.
Thermal power balance constraint
P h , CHP , t + P h , P 2 H , t = P h , Load , t + P h , ch , t P h , dis , t P h , GB , t P h , HFC , t
4.
Hydrogen power balance constraint
P H , EL , t = P H , MR , t + P HFC , t + P H , ch , t P H , dis , t
5.
WT and PV constraints
0 P WT , t P DG max
0 P PV , t P PV max
where P WT max and P PV max are the upper limit values of WT and PV output.
6.
Energy storage constraints
{ 0 P i , ch , t U i , ch , t P i , ch , t max 0 P i , dis , t U i , dis , t P i , dis , t max U i , ch , t U i , dis , t = 0
where i { ES , TS , GS , HS } ; U i , ch , t and U i , dis , t are 0–1 variables, when U i , ch , t and U i , dis , t take 1, it means the EV is in charging and discharging states, respectively; otherwise, it takes 0.

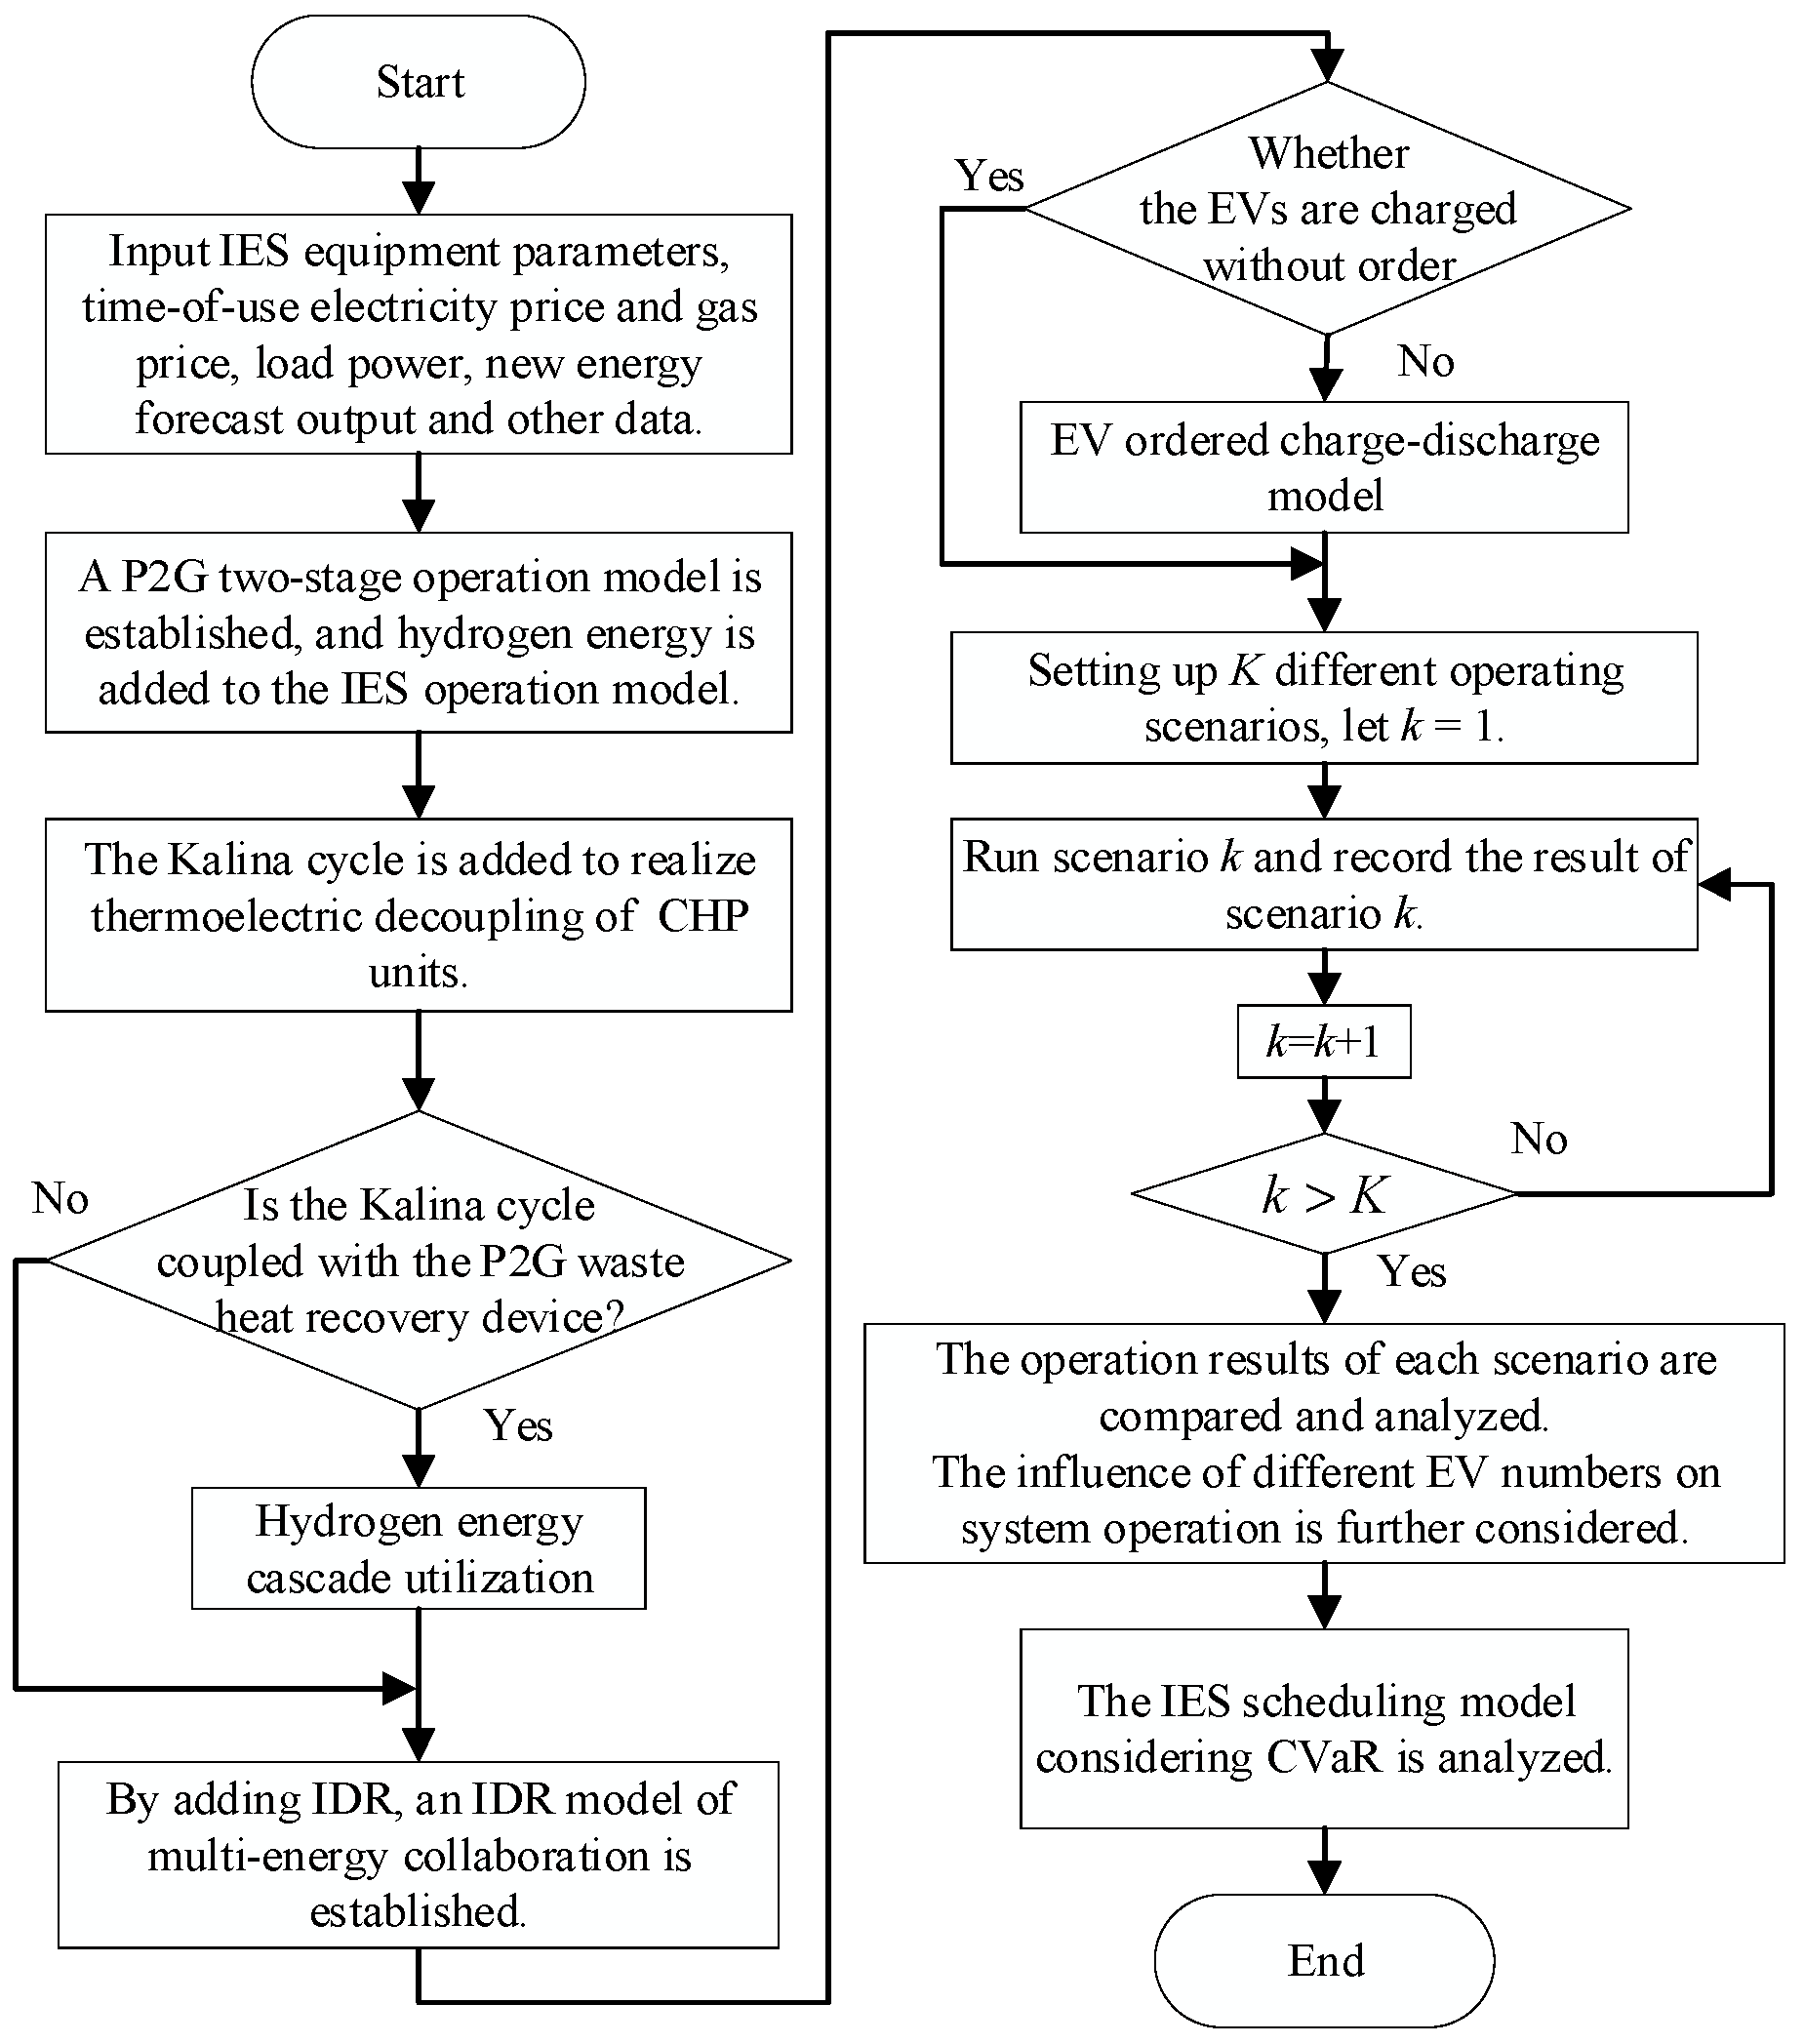
2.4.6. Solution Process

The two-stage optimization model constructed in this paper considers the refined utilization of hydrogen energy in the first stage. The second stage considers the role of IDR and EV virtual energy storage on the basis of the first stage. The model solution uses the YALMIP toolbox of the Matlab platform for compilation, and the solver part uses Gurobi. The solution flow chart is shown in Figure 2.
As shown in Figure 2, in the first stage, the P2G two-stage operation is first modeled. Secondly, the Kalina cycle is added to realize the thermoelectric decoupling of the CHP unit. Finally, the P2G waste heat recovery device is coupled with the Kalina cycle to realize the cascading utilization of hydrogen energy. In the second stage, the charging and discharging models of EVs and IDRs are regarded as virtual energy storage resources to realize peak cutting and valley filling. On this basis, typical scenarios are set up to analyze the conventional operation model. Finally, considering the influence of source-load uncertainty, the IES operation model considering CVaR is analyzed.

3. Case Study

3.1. Parameter Settings

In this paper, a park-level integrated energy system in northern China during the winter heating period is selected as the research object. The IES topology adopted is shown in Figure 1. Among them, equipment parameters and actual energy storage parameters are shown in Table A1 and Table A2, respectively. The PV, WT, and multi-source load forecasting curves are shown in Figure 3, and the time-of-use electricity price and gas price curves are shown in Figure 4. The park contains 60 scheduled EVs, and the operating parameters of EVs are shown in Table A3. In the ladder-type carbon trading mechanism, the base price of carbon trading is 0.250 yuan/kg, the interval length is 2000 kg, the price growth rate of each ladder is 25%, and the actual carbon emissions calculation parameters can be referred to [28].
As shown in Figure 3 and Figure 4, the wind power output is large at night, and the electric load demand is small, which makes it easy to cause wind curtailment. Meanwhile, the heat load output is large, and the energy supply pressure is large. During the daytime, the demand for electricity and gas is large, and the price of electricity and gas is also high. Therefore, the cost of purchasing electricity and gas is high. Meanwhile, the disordered EV charging load will further increase the power supply pressure.

3.2. Simulation Results and Analysis

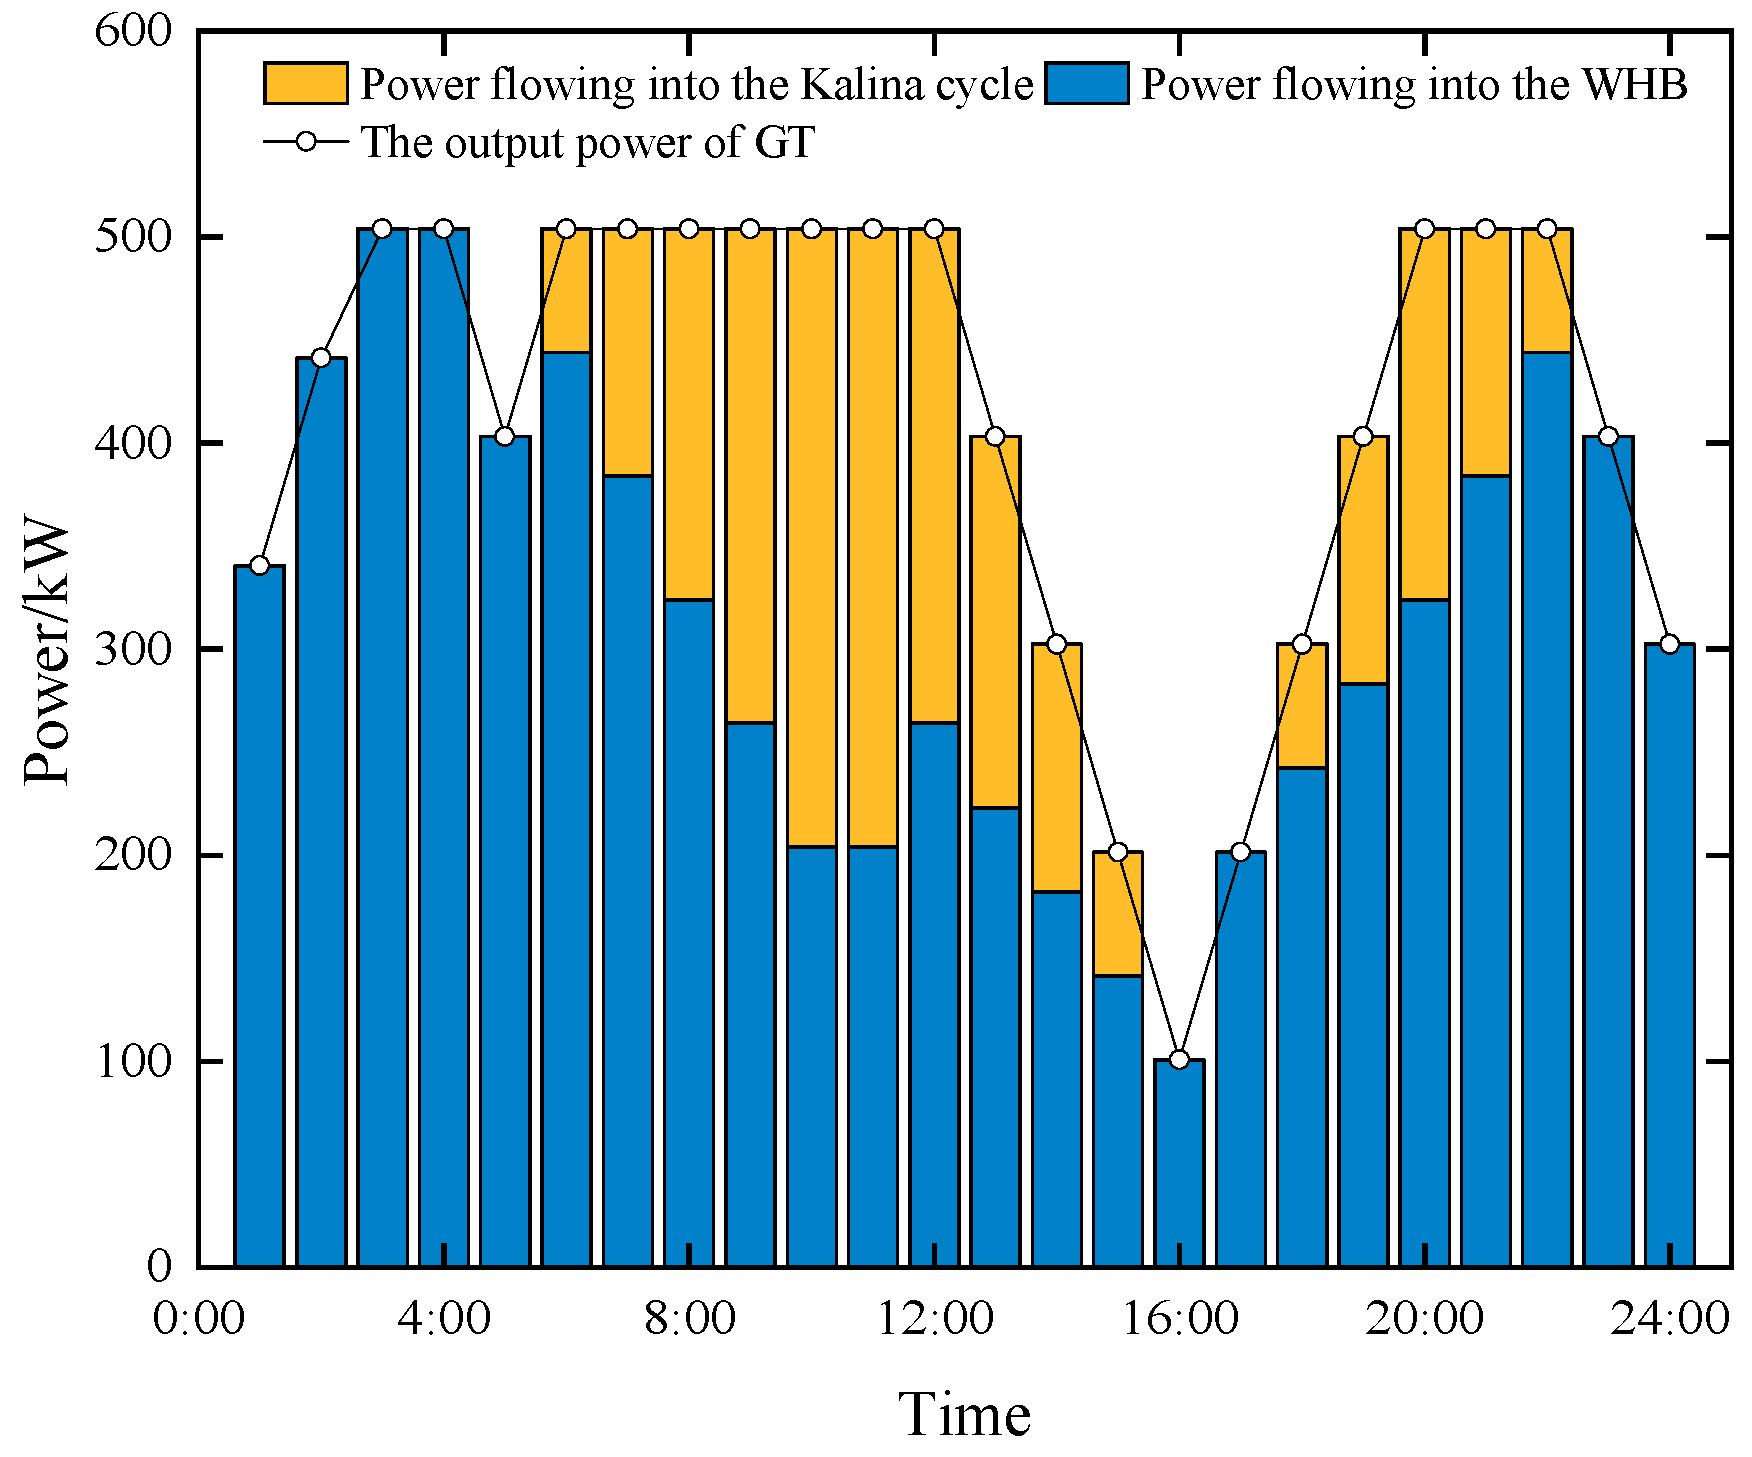
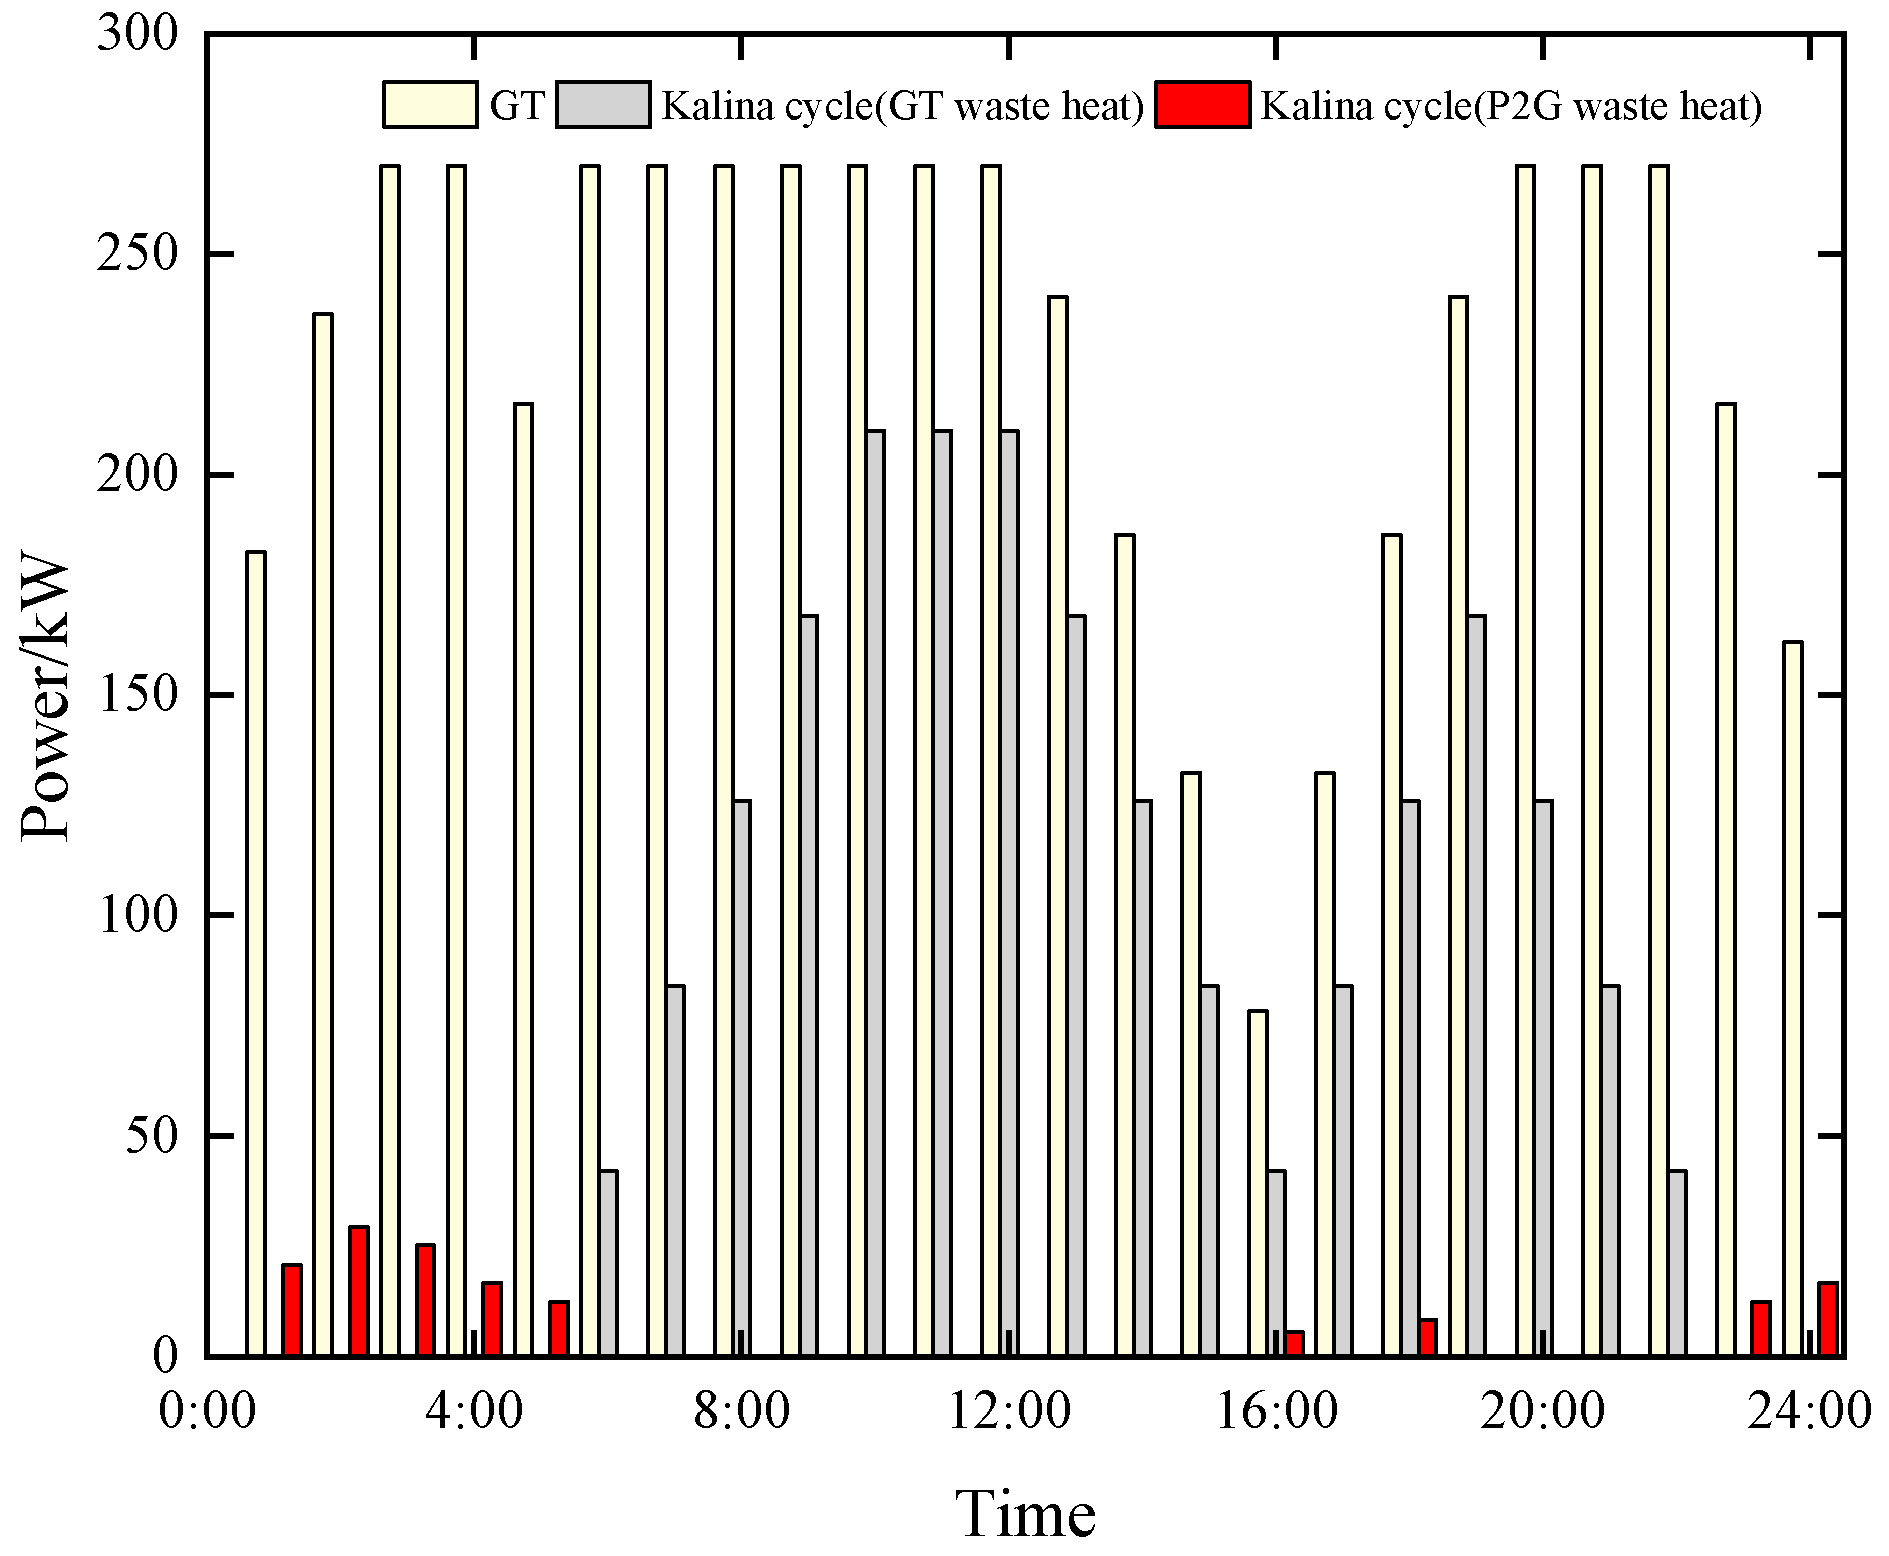
3.2.1. Analysis of the Combined Operation of Kalina Cycle and Electricity-Hydrogen Coupling Link

To verify the validity of the model proposed in this paper, the influence of uncertain factors on IES is first ignored, and the conventional basic operation scenarios are analyzed by using renewable energy and load forecasting power. On the basis of considering the ladder-type carbon trading mechanism and the disordered charging load of EVs, the following four scenarios are set to analyze the joint operation of the Kalina cycle and the electricity-hydrogen coupling link.
Scenario 1: Only the electricity-hydrogen coupling link is considered. Scenario 2: The Kalina cycle is added on the basis of Scenario 1. Scenario 3: A P2G waste heat recovery device is added and coupled with the Kalina cycle. The running results of scenarios 1 to 3 are shown in Table 1.
  • Comparative analysis of Scenario 1 and Scenario 2
Compared with Scenario 1, Scenario 2 considers the Kalina cycle and dynamically adjusts the electrothermal ratio of CHP units through the Kalina cycle to achieve thermoelectric decoupling of CHP units. The GT output thermal power distribution diagram in Scenario 2 is shown in Figure 5.
As can be seen from Figure 5, during the low electricity price period, the heat load demand is large, and all the heat generated by GT is recovered by WHB. Therefore, the electric power of the CHP unit is output by GT. In order to reduce the power purchase cost of the system during the peak period of electricity prices, the proportion of GT output thermal power flowing into the Kalina cycle continues to increase, so that it can reach maximum power generation. When wind curtailment occurs, the Kalina cycle can extract part of the steam for heat production, increasing the new energy consumption space by reducing the forced electrical output of the units. According to Table 1, compared with Scenario 1, the total operating cost of Scenario 2 is reduced by 812.3 yuan, the carbon emissions are reduced by 508.27 kg, and the consumption rate of new energy is increased by 5.18%.
2.
Comparative analysis of Scenario 2 and Scenario 3
Based on Scenario 2, Scenario 3 considers the coupling effect of the Kalina cycle and P2G waste heat recovery device, and the electric power of the CHP unit in Scenario 3 is shown in Figure 6.
As can be seen from Figure 6, the law of GT thermal power flowing into the Kalina cycle is the same as that in Scenario 2. However, in Scenario 3, the Kalina cycle can also use the waste heat output power of the methanation reaction in P2G during the night low period from 23:00 to 5:00 to increase the output power of the CHP unit. In Scenario 3, the Kalina cycle increases the output power of the CHP unit while ensuring that the output power of WHB and GT is not reduced. Compared to Scenario 2, Scenario 3 reduced the electricity purchase cost by 160.69 yuan. Therefore, in Scenario 3, the scheduling enthusiasm of P2G is improved, and the power of EL electrolytic hydrogen production is improved, which is conducive to the consumption of wind power at night. It can be seen from Table 1 that, compared with Scenario 2, the total cost of Scenario 3 is reduced by 184.01 yuan and the carbon emissions are reduced by 180.75 kg. In addition, Scenario 3 effectively reduces operating costs by 996.31 yuan compared to Scenario 1. Compared with the method of directly utilizing P2G waste heat for heating in the literature [8], the strategy proposed in this paper effectively reduces the operating cost by 115.01 yuan and the carbon emission by 134.41 kg, which proves that the method proposed in this paper has obvious advantages.

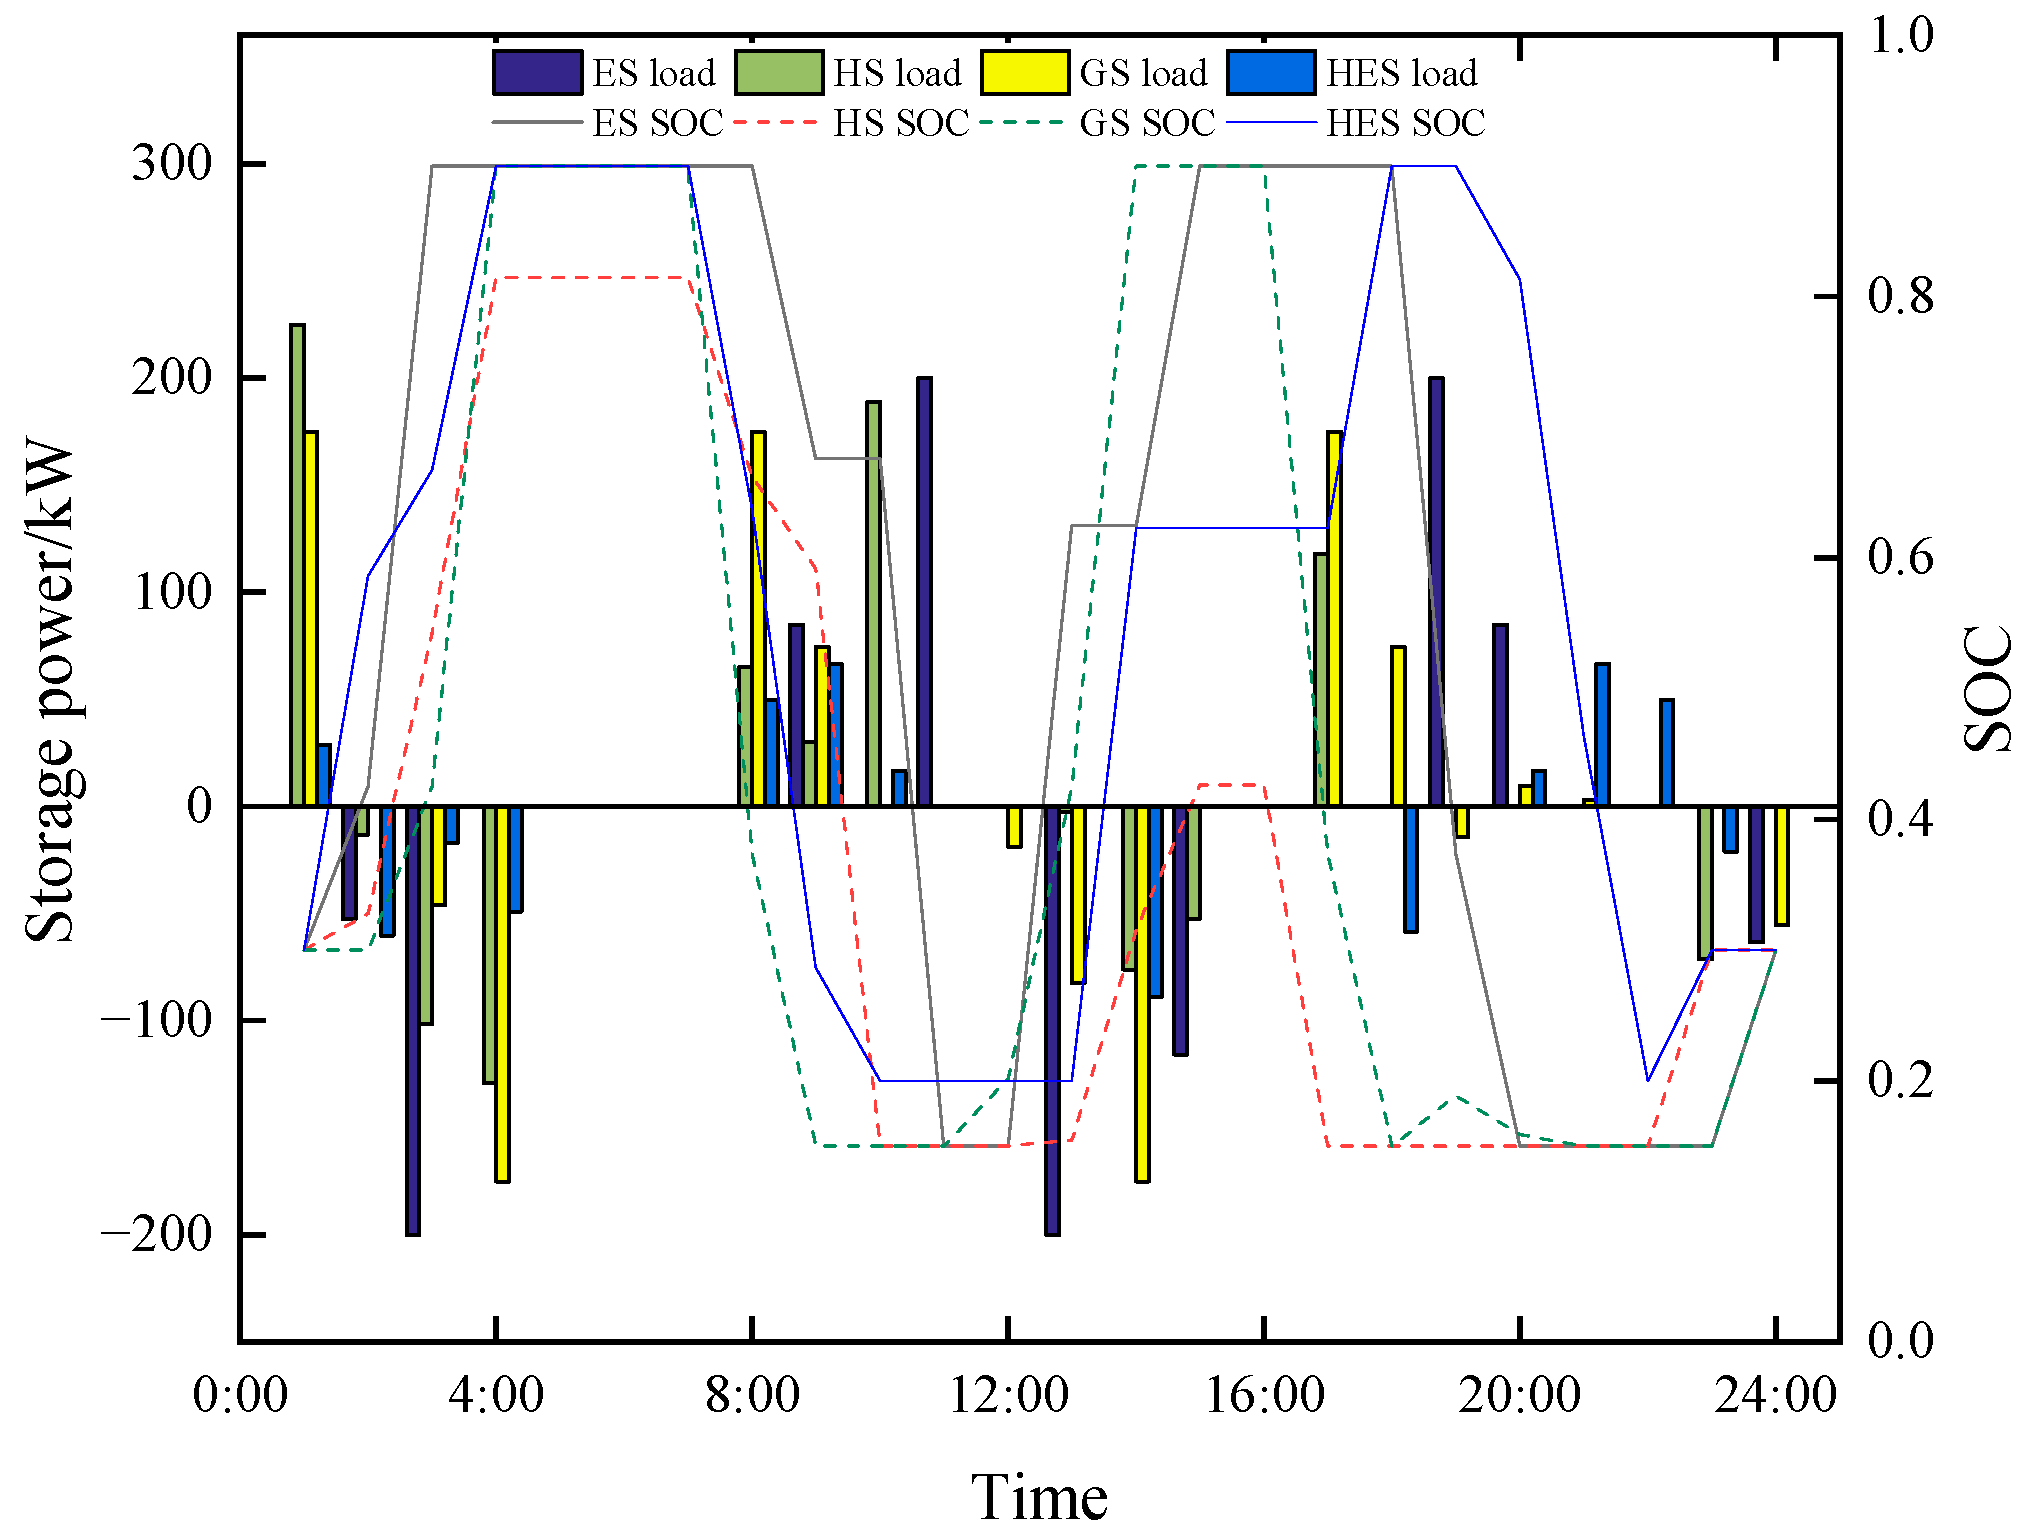
3.2.2. Ladder-Type Carbon Trading and GES Operation Analysis

In order to analyze the impact of ladder-type carbon trading mechanisms and GES on the operation of IES, Scenarios 4 to 6 are set. Scenario 4: Based on Scenario 3, only the traditional carbon trading mechanism is considered. Scenario 5: IDR is added on the basis of Scenario 3. Scenario 6: Based on Scenario 5, the EV charging and discharging model is considered. The running results of scenarios 4 to 6 are shown in Table 2.
  • Comparative analysis of Scenario 3 and Scenario 4
Compared with Scenario 4, Scenario 3 considers the ladder-type carbon trading mechanism, and the cost of electricity purchase has increased, while the cost of gas purchase has decreased significantly. The reason is that in Scenario 4, the gas unit is in a state of high energy consumption, so the amount of gas purchased is large, while in Scenario 3, the carbon price of carbon emissions beyond the rated range presents a step growth. Therefore, IES increases the proportion of power purchased to reduce the output of gas units with large carbon emissions. As can be seen from Table 2, the equivalent carbon price of Scenario 4 is lower, so the carbon transaction cost of Scenario 3 is only reduced by 91.64 yuan, but the carbon emission of Scenario 3 is reduced by 8499.98 kg, and the total cost is reduced by 2907.92 yuan.
2.
Comparative analysis of Scenario 3, Scenario 5 and Scenario 6
Based on Scenario 3, Scenario 5 proposes IDR strategies to improve the sensitivity of users to electricity and gas prices released by operators, encourage users to adjust energy use mode and energy use period, relieve energy supply pressure during peak hours, and realize peak cutting and valley filling. As can be seen from Table 1 and Table 2, compared with Scenario 3, Scenario 5 significantly reduces the cost of electricity and gas purchases by 3261.56 yuan and carbon emissions by 286.11 kg. Although Scenario 5 increases IDR cost by 960.17 yuan, it is far less than the economic and environmental benefits brought by IDR. Scenario 6 considers EV charging and discharging models on the basis of Scenario 5. As a virtual energy storage device, EV can not only reduce the electricity load during peak hours but also implement discharge operations, further reduce the cost of electricity purchase, and play the roles of peak cutting and valley filling. In Table 2, the IDR cost includes the EV subsidy incentive of 382.97 yuan. Compared with Scenario 3, Scenario 6 effectively reduces operating costs by 3407.47 yuan and carbon emissions by 620.13 kg. It can be seen from Table 2 that even if the IDR cost in Scenario 6 is higher, Scenario 6 still has the best operating economy and the lowest carbon emissions, which proves the effectiveness of the strategy adopted in this paper.

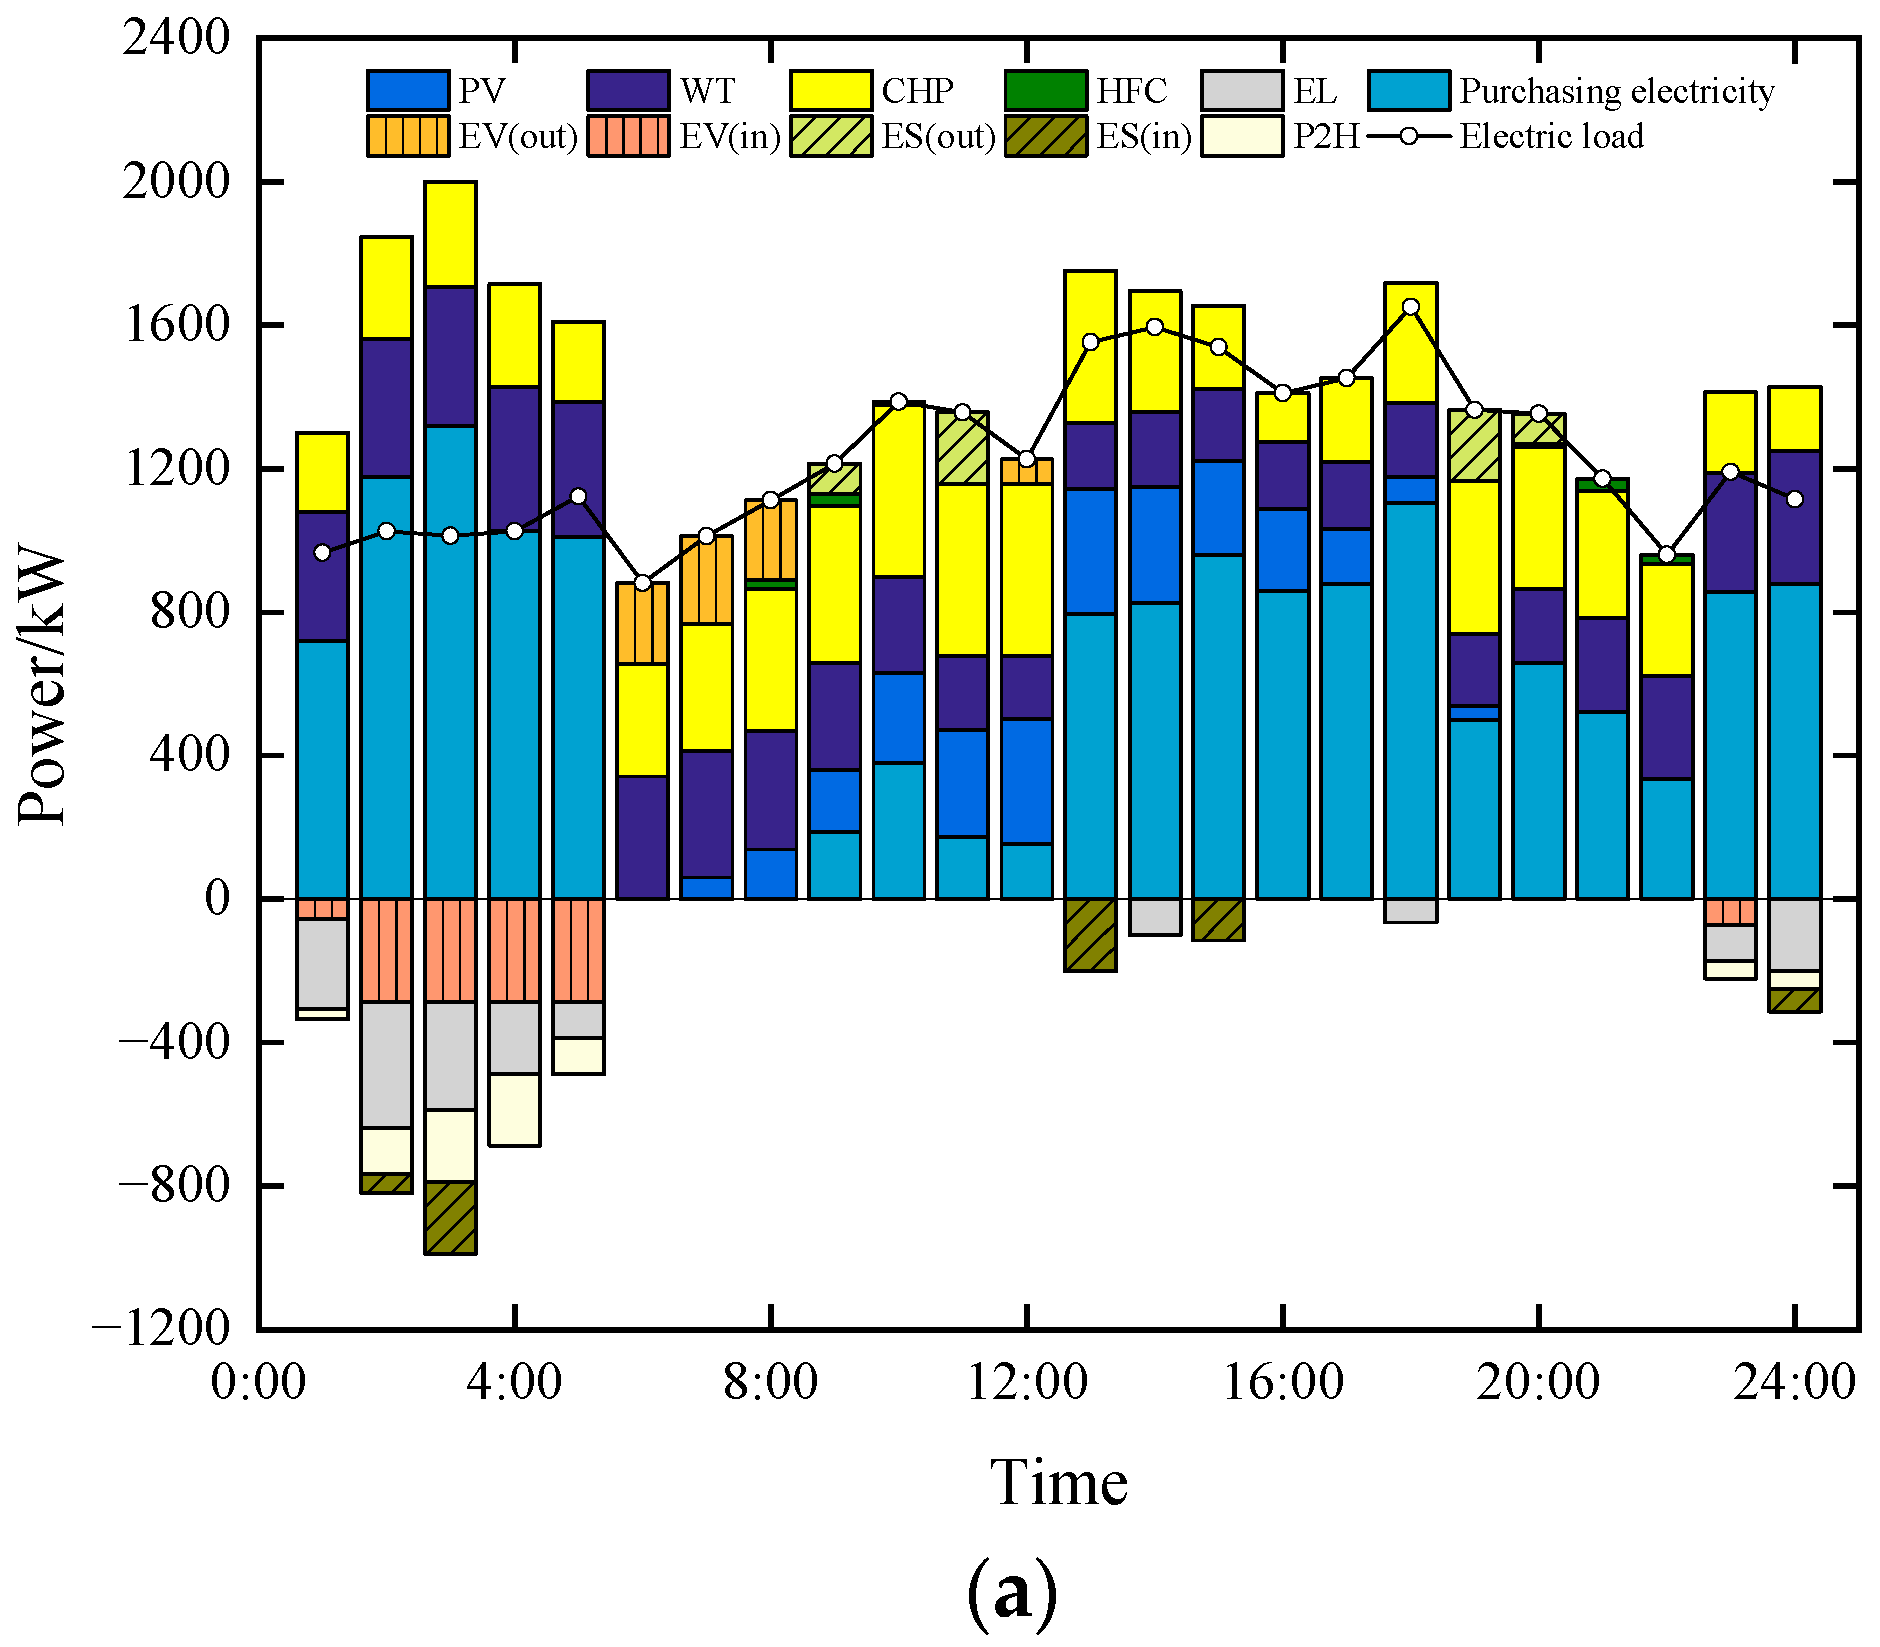
3.2.3. Analysis of IES Scheduling Results

Figure 7 shows the power balance diagram of each energy source in Scenario 6. Combined with the optimization results of multi-source energy storage in Figure 8, the following analysis can be performed.
As shown in Figure 7 and Figure 8, from 23:00 to 5:00, the valley period of electricity prices, IES mainly meets the electricity demand through power purchase and wind power generation. Both ES and EVs are charged, while EL produces hydrogen to reduce costs. At the same time, the heat load demand at night is large, the CHP units and the P2H output are large, and the TS stores heat during this period. The gas load demand is met by gas purchases, GS, and MR, and the hydrogen energy required by MR is provided by EL and HS. ES, EV, and HFC output electric energy, and GT output gradually increases during the peak periods of electricity prices from 06:00 to 12:00 and 19:00 to 22:00. As a result, the amount of electricity purchased is gradually decreasing. The heat load demand is reduced, and the heat is mainly provided by CHP and GB. Meanwhile, TS and HFC produce thermal energy. The gas purchase of IES increases, but the gas price is high during this time, so GS mainly releases energy. In 13:00 to 18:00, which is the normal period for electricity prices, the proportion of photovoltaic power generation in IES gradually increases, and ES stores excess electric energy. At this time, the heat load demand is reduced, and the gas purchase amount is also reduced. GS stores gas from 13:00 to 14:00, which is the normal period for gas prices. As can be seen from Figure 8, the state of charge (SOC) of ES and HS tends to be the same because, in periods of low electricity prices, the wind power output is large, so both ES and HS are stored energy. During the peak period of energy supply, ES discharges. Meanwhile, the HFC outputs electric and thermal energy, and the hydrogen consumption is provided by HS. In summary, the IES scheduling model proposed in this paper reduces energy purchase costs and makes multi-source energy storage equipment play a role in peak regulation.
As shown in Figure A1, the optimization curves of electricity, heat, and gas loads before and after IDR are shown. Through IDR, the electricity and gas load in the peak period of electricity and gas prices are transferred to the low period and normal period to reduce the operating costs of IES. At the same time, the heat load with higher power at night is partially transferred to daytime by IDR. After IDR optimization, the peak-to-valley differences of electricity, gas, and heat loads are reduced by 6.51%, 21.28%, and 7.13%, respectively, so IDR has the effect of suppressing load peaks and “cutting peaks and filling valleys”.

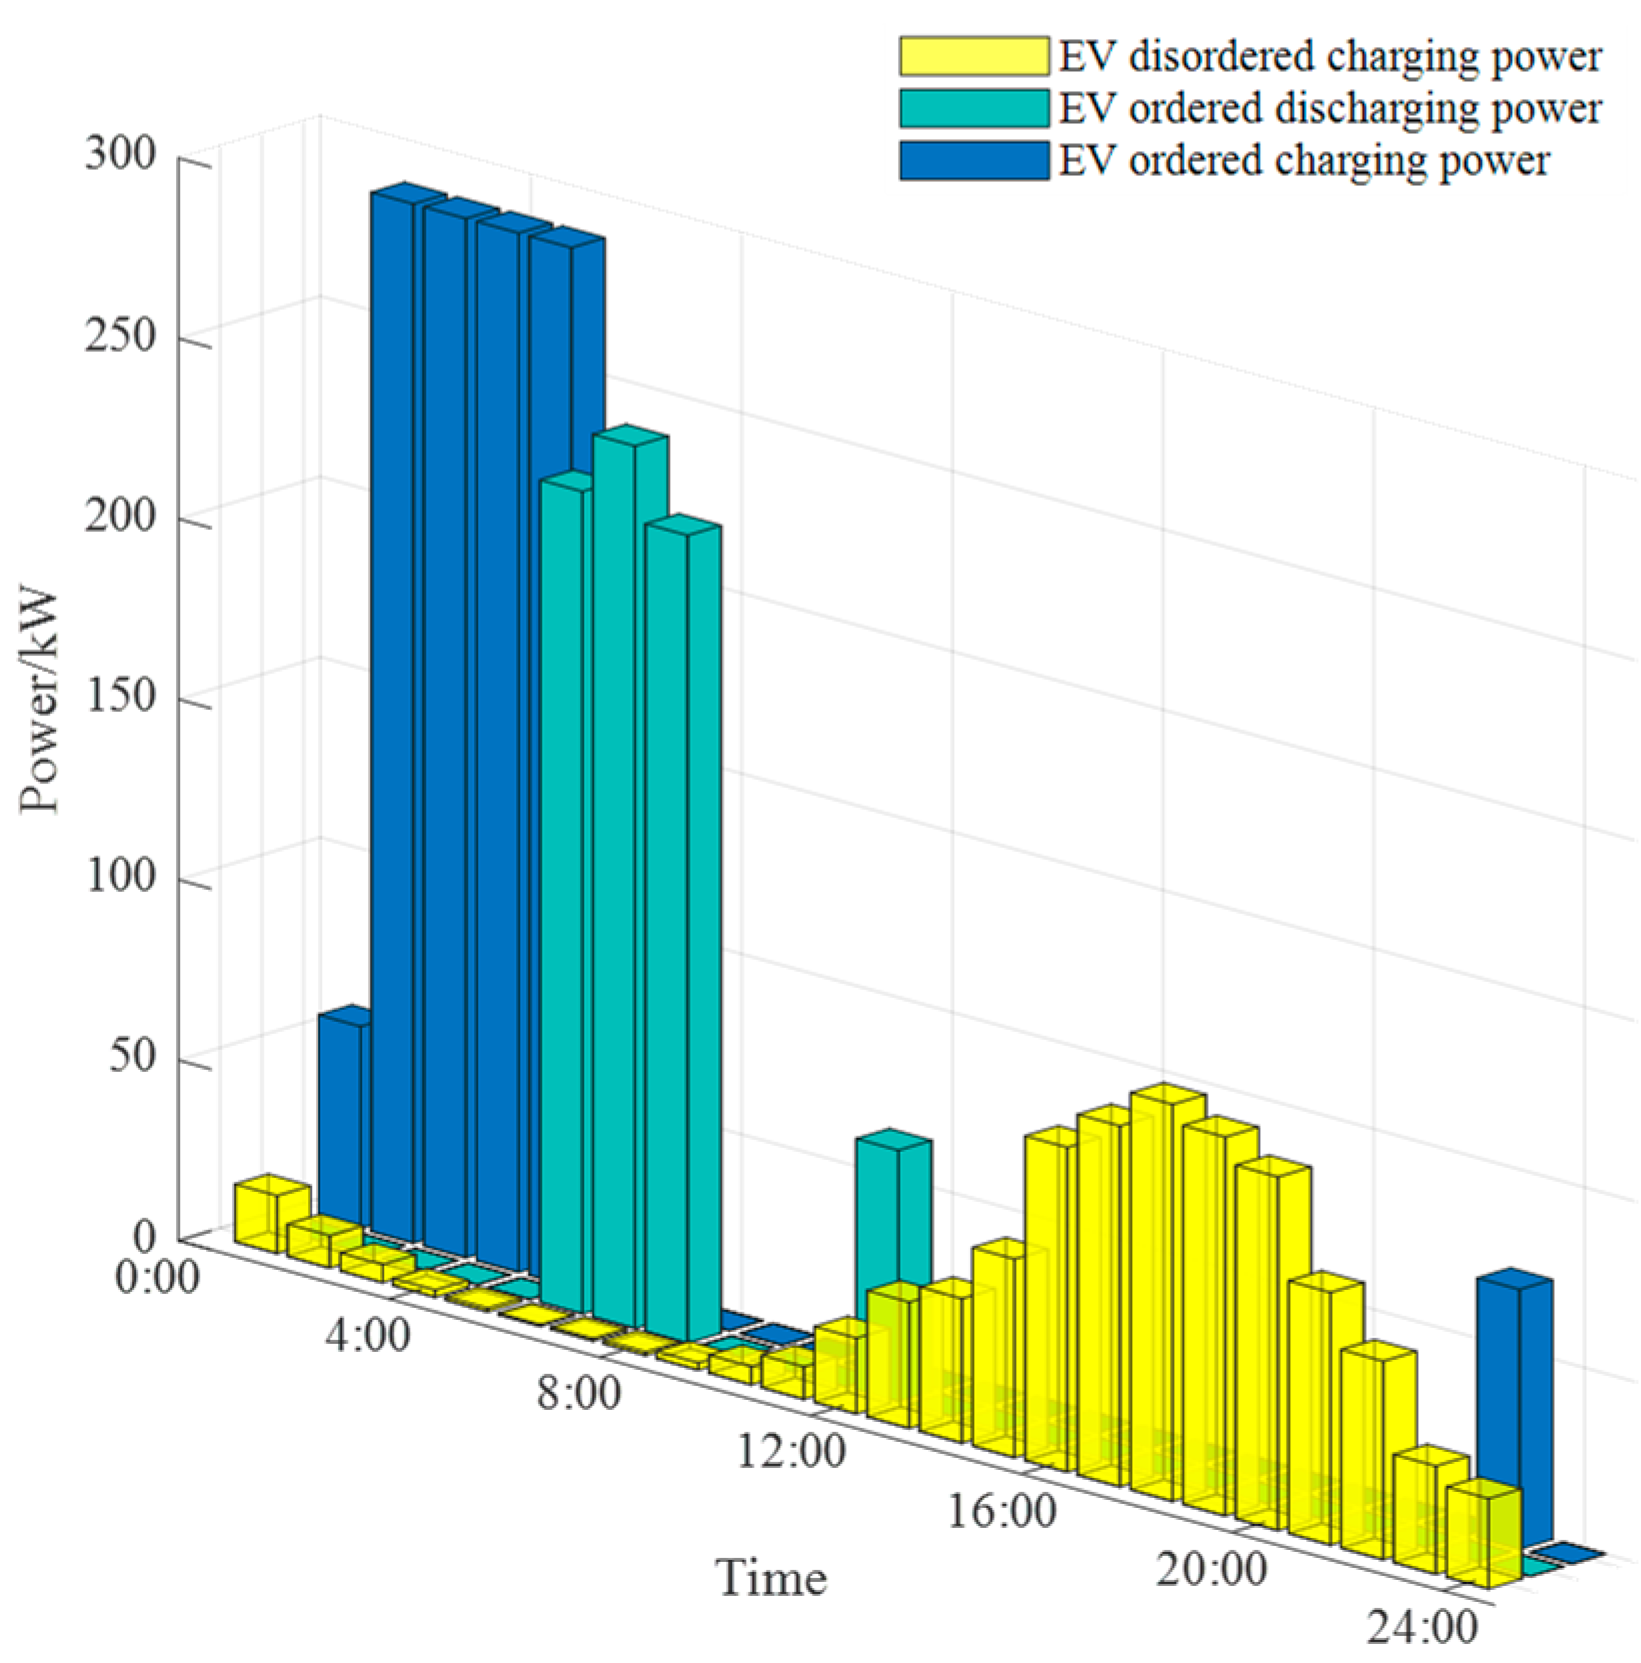
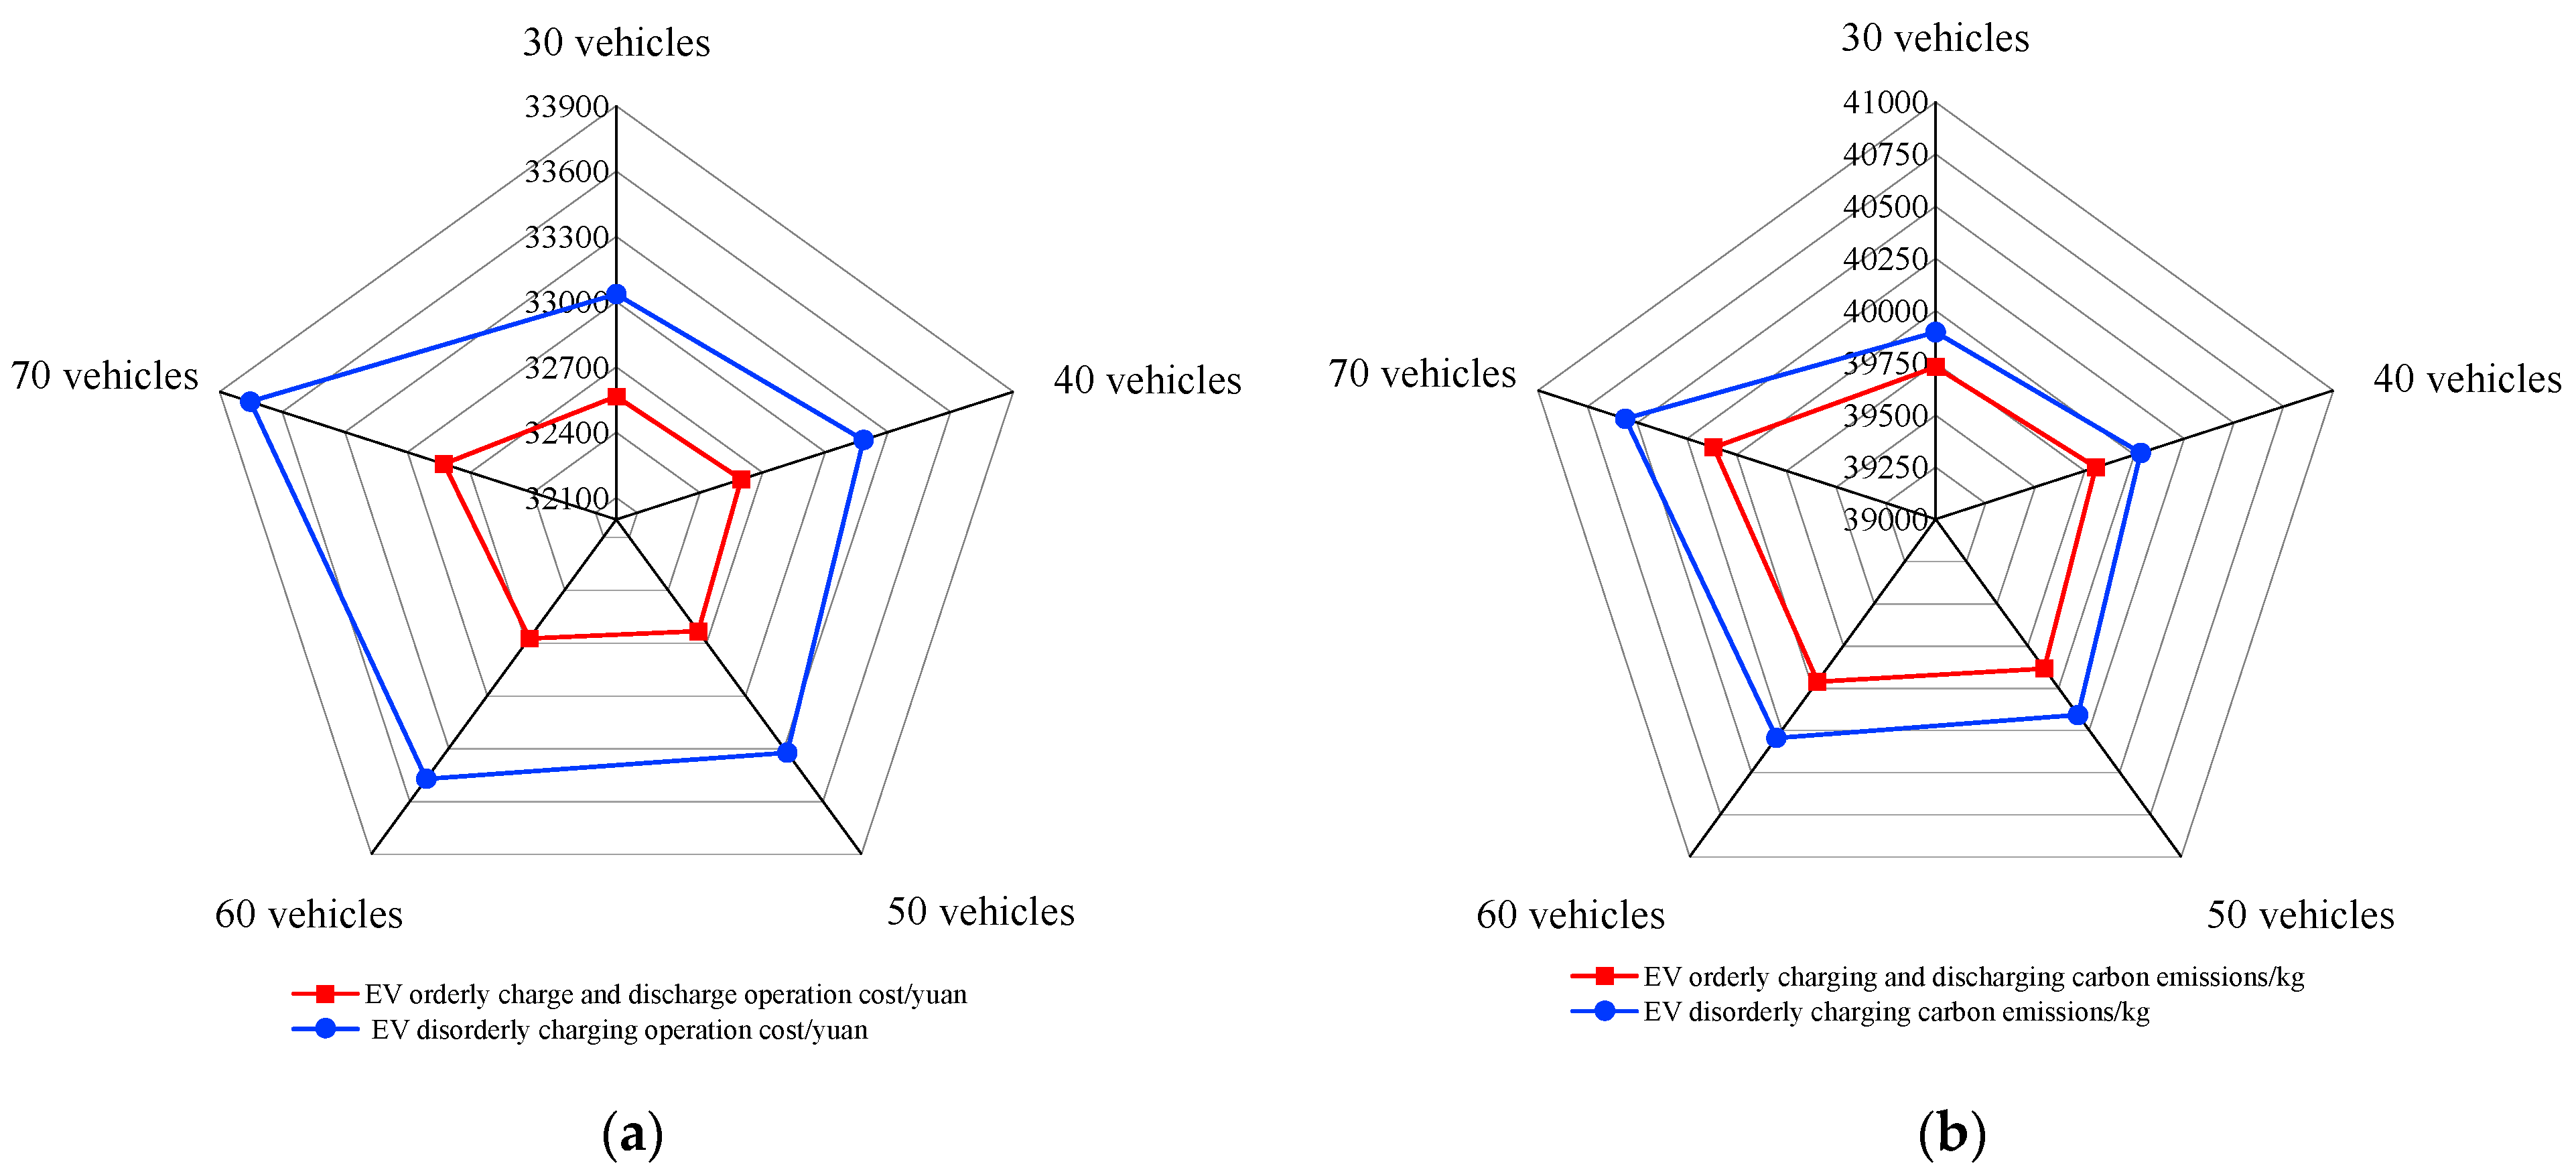
3.2.4. The impact of Electric Vehicles on GES

According to Table 2, EV mainly changes the electric power balance of IES. Therefore, by comparing and analyzing the power dispatching situations of Scenario 5 and Scenario 6, the further effect of EV on GES can be seen. Figure 9 shows the EV schedule in different ways, as shown in Figure A2, which is the electric balance diagram of Scenario 5.
As is shown in Figure 9 and Figure A2, compared with the electric power balance diagram of Scenario 6 in Figure 7a, the peak period of disordered EV charging is from 15:00 to 22:00, during which the demand for electric load is large and the electricity price is high. The disordered EV charging load increases the power load. IES needs additional power purchases and increases the output of CHP units to meet the power load demand. It can be seen from Table 2 that the power purchase cost of Scenario 5 is 1148.60 yuan higher than that of Scenario 6. EVs, as generalized energy storage devices, operate charging and discharging during valley and peak periods of electricity prices, respectively, reducing the output of coal-fired units and GTs and reducing carbon emissions by 334.02 kg. By adjusting the number of EVs, the impact of EVs on GES is further analyzed, as shown in Figure 10.
As shown in Figure 10a, the IES operating cost increases as the number of EVs increases. Meanwhile, the difference between the operating cost of EV ordered charging and disordered charging increases gradually, and the advantage of EV ordered charging and discharging is more obvious. When the number of EVs rises from 60 to 70, the IES operating cost increases substantially in both EV operating modes. According to Figure 10b, the carbon emissions of different EV quantities also have the same trend. Therefore, by charging and discharging EVs in an orderly manner and in the range of 60 units, IES can ensure efficient operation of each unit and realize optimum economy.

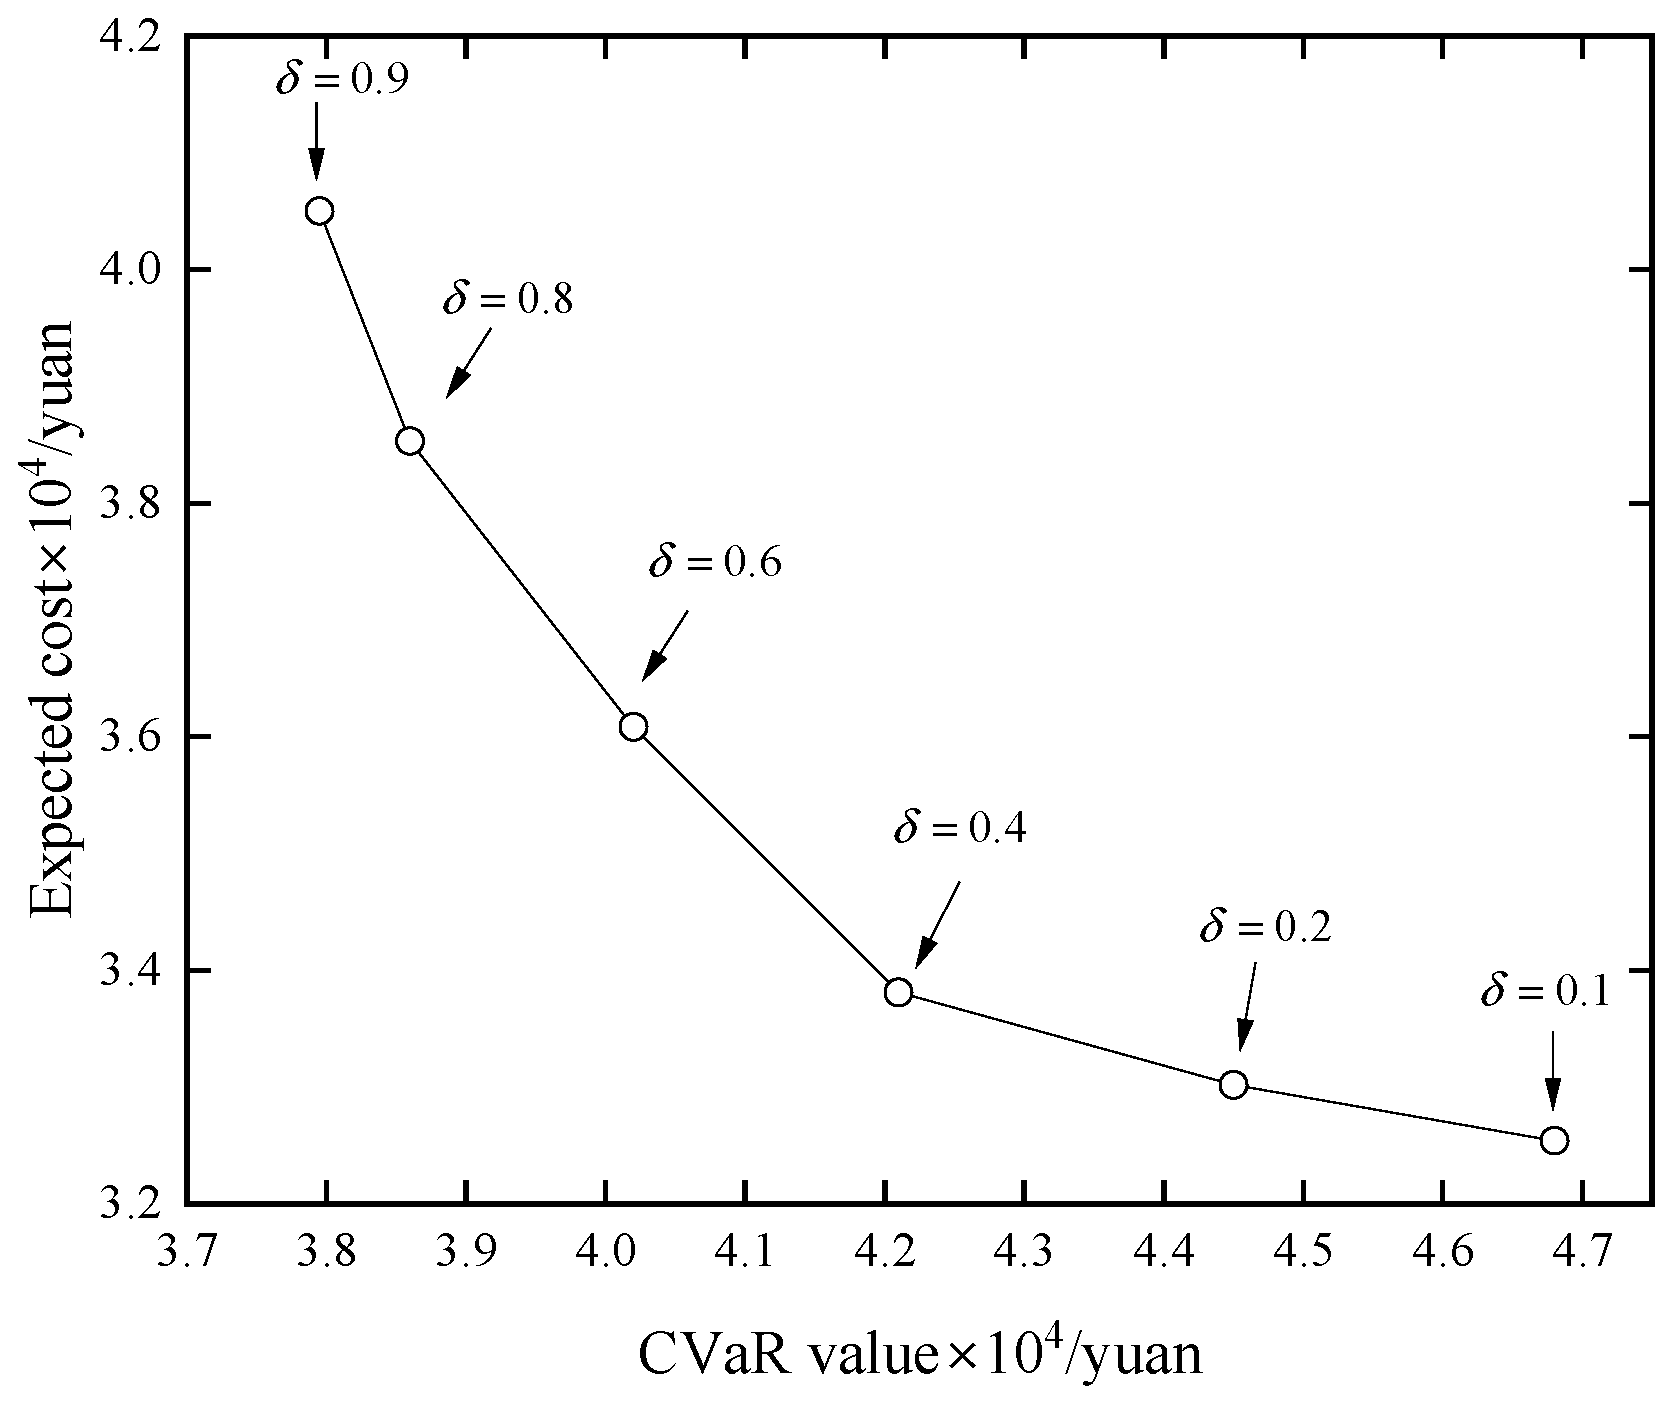
3.2.5. Uncertainty Analysis Considering CVaR

Combined with the new energy output and load power forecast data for the region, 2000 random scenarios are generated by LHS, and 100 typical scenarios are obtained after scenario reduction. To consider the effect of source-load uncertainty, β is taken as 0.90, and the relationship curve between IES expected costs and CVaR values under different risk preference coefficients is obtained by combining typical scenarios, as shown in Figure 11.
As shown in Figure 11, the corresponding CVaR values of IES operating costs decrease as the risk preference coefficients δ increase, and the IES expected operating cost and the CVaR value can be obtained from Equations (34)–(36) on the basis of the generated scenarios. When δ is small ( δ takes 0.1, 0.2), it represents that IES operators are more aggressive investors, preferring to take greater operational risks in order to obtain lower expected costs. When δ is large ( δ takes 0.9, 0.8), it represents that the investment preference of IES operators is conservative, raising the expected costs to obtain smaller risk losses. The inflection point of the relationship curve occurs when δ = 0.4 . If δ is reduced at this point, the expected costs will be stabilized. Therefore, choosing the appropriate risk preference coefficients is beneficial for IES to reduce the operating risks and the operating costs of the system.

4. Conclusions

This paper improves the low-carbon and economic performance of multi-energy coupled IES. Kalina cycles and GES are introduced on the supply side and demand side, respectively, to participate in optimal dispatching, and the basic scheduling model is established. Meanwhile, considering the influence of source-load uncertainty, a multi-energy complementary optimal scheduling model of hydrogen-containing IES based on CVaR was established. After analysis, the following conclusions are obtained:
(1)
In this paper, the hydrogen energy utilization model is refined, and the waste heat of the P2G methanation reaction is recovered and coupled with the Kalina cycle to further improve the thermoelectric decoupling capacity of CHP units. While increasing the consumption rate of new energy to 93.88%, the operation cost was reduced by 996.31 yuan, effectively improving the energy utilization rate and operation economy of IES.
(2)
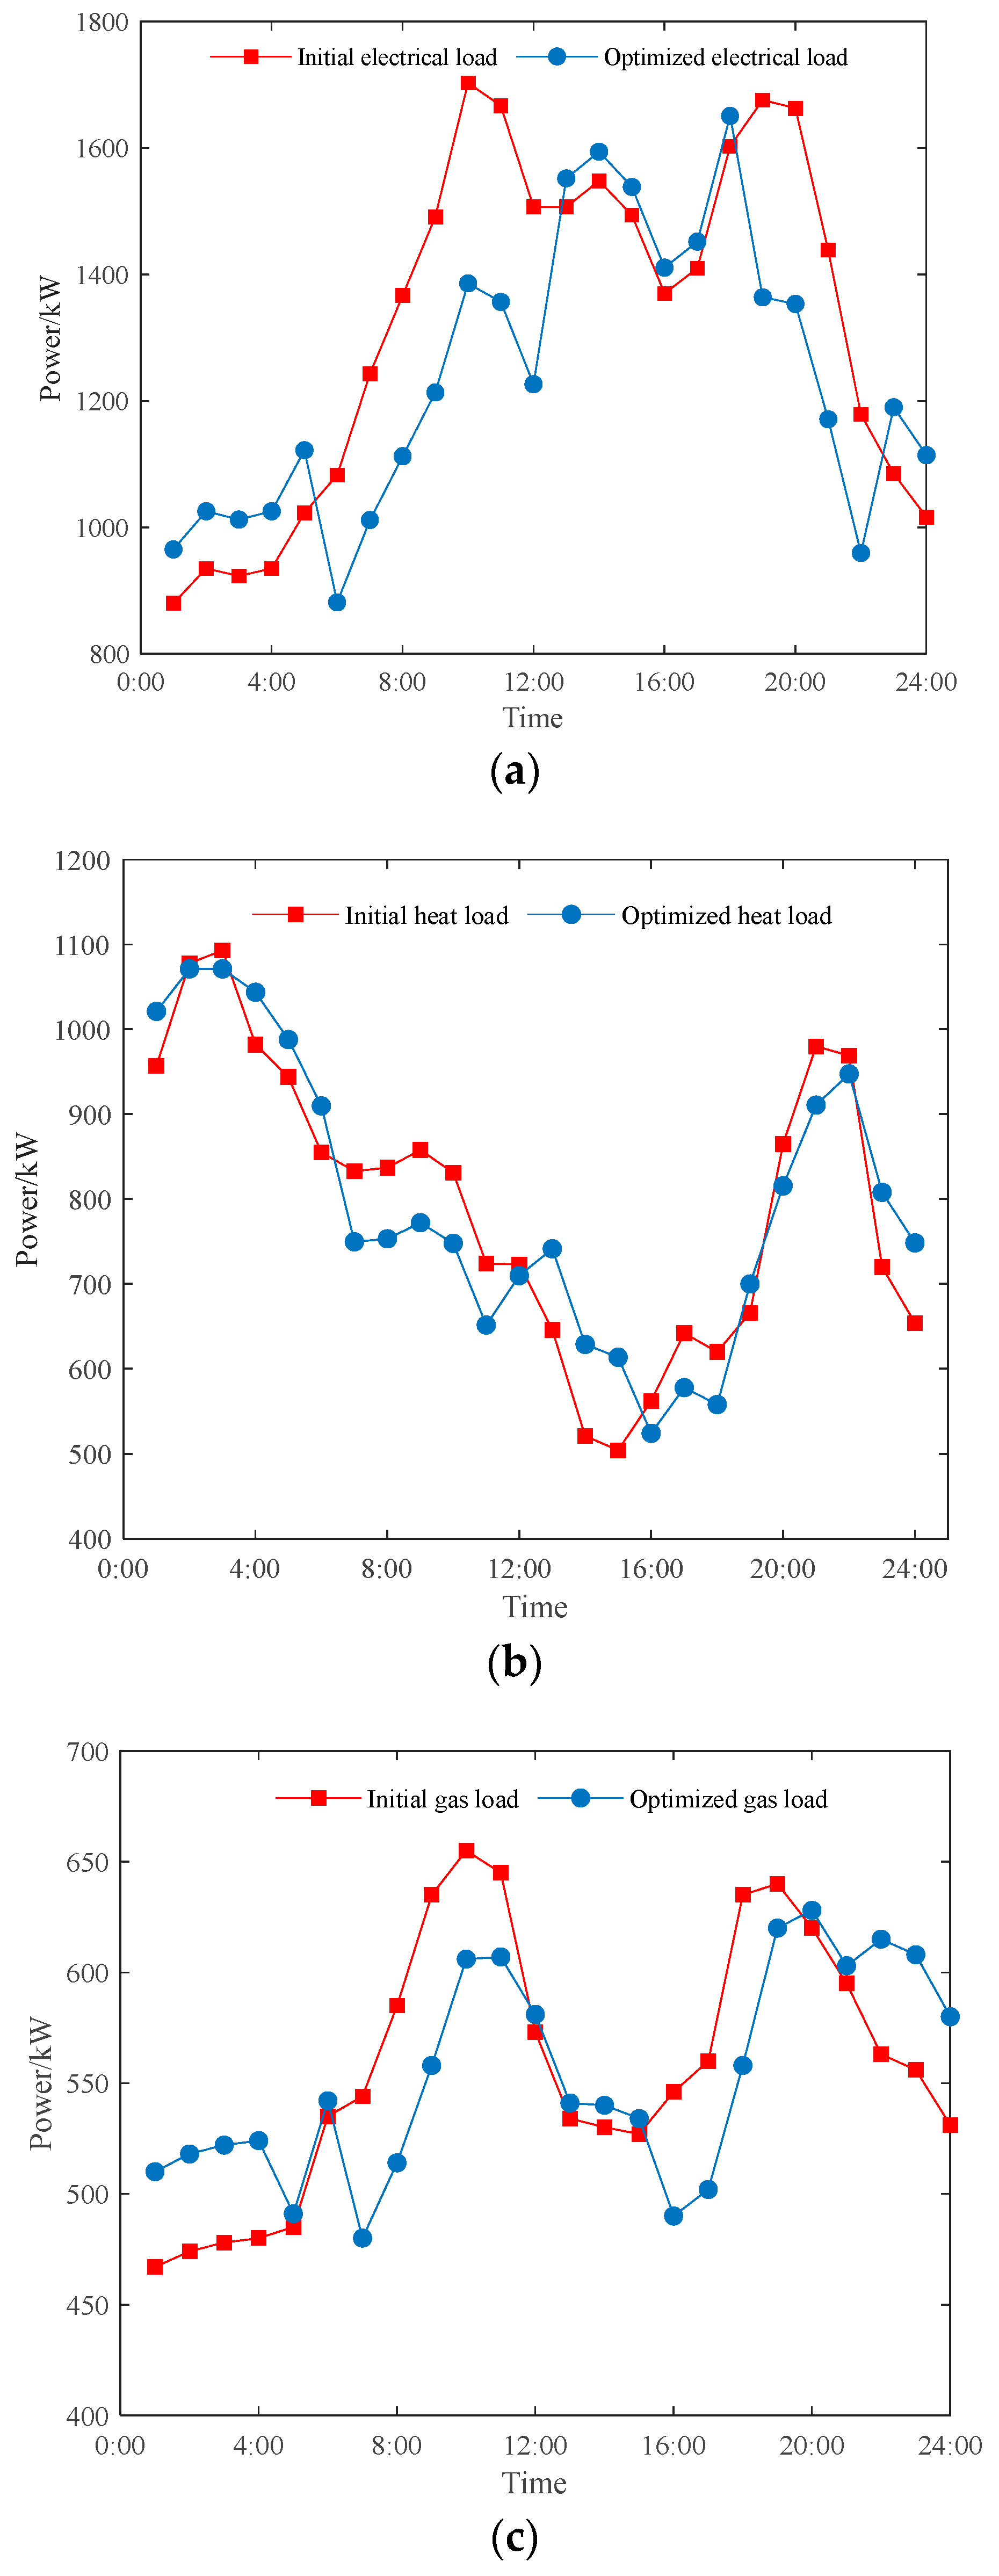
In the GES, IDR and EV can cooperate with the actual energy storage equipment to adjust the load peak-to-valley difference of the system. After IDR optimization, the peak-to-valley differences of electricity, gas, and heat loads are reduced by 6.51%, 21.28%, and 7.13%, respectively, realizing the “peak cutting and valley filling” of the load. Although the IES needs to pay 1343.23 yuan for the user’s virtual energy storage scheduling, the total cost is reduced by 3407.47 yuan. Therefore, virtual energy storage improves the users’ sensitivity to energy prices, reduces IES operating costs, and achieves an all-win situation for both the users and the IES operators.
(3)
CVaR is used to measure the risk losses from uncertainty in IES. IES operators can choose appropriate risk appetite coefficients to reduce the risk losses and system operation costs of IES.
The IES scheduling model established in this paper provides a strategy for IES to achieve refined utilization of hydrogen energy and low-carbon economic operation. However, due to the influence of users’ travel and consumption habits, both EV travel and user response behavior have uncertainty and randomness. In the future, further research will be conducted to address the uncertainties surrounding integrated demand response and EV travel.

Author Contributions

Conceptualization, Z.L. and C.L.; methodology, Z.L.; software, C.L.; validation, Z.L. and C.L.; formal analysis, C.L.; investigation, Z.L.; resources, Z.L.; data curation, C.L.; writing—original draft preparation, C.L.; writing—review and editing, Z.L. and C.L.; visualization, C.L.; supervision, Z.L. and C.L.; project administration, Z.L.; funding acquisition, Z.L. All authors have read and agreed to the published version of the manuscript.

Funding

This research was funded by the National Natural Science Foundation of China, grant number 51977074.

Data Availability Statement

Not applicable.

Conflicts of Interest

The authors declare no conflict of interest.

Appendix A

Table A1. Equipment parameters.
TypeMaximum Output Power/kWRamp Rate Constraints/%Efficiency/%Unit Operation and Maintenance Cost/(yuan/kW·h)
P2H20010%89%0.025
GT90020%30% (Gas to electricity)/56% (Gas to heat)0.040
Kalina cycle30020%70%0.023
WHB55020%85%0.025
GB60020%86%0.020
HFC25020%95%0.026
MR25020%80%0.012
Table A2. Actual energy storage equipment parameters.
TypeCapacity/kW·hCharging and Discharging Efficiency/%Upper and Lower Limit
Constraints of Capacity/%
ES40095%15%/90%
TS45095%15%/90%
GS35095%15%/90%
HS20095%15%/90%
Table A3. EV operating parameters.
ParameterValue
Battery capacity/kW·h23.8
Maximum charging and discharging power/kW4.8
Charging and discharging efficiency/%0.90
Maximum value of SOC0.15
Minimum value of SOC0.95
Figure A1. Electricity, heat, and gas load optimization curves before and after IDR: (a) electricity load curves; (b) heat load curves; (c) gas load curves.
Energies 16 05700 g0a1
Figure A2. Scenario 5 electric power balance diagram.
Energies 16 05700 g0a2

References

  1. Chen, Y.; Wang, Y.; Kirschen, D.; Zhang, B. Model-free renewable scenario generation using generative adversarial networks. IEEE Trans. Power Syst. 2018, 33, 3265–3275. [Google Scholar] [CrossRef] [Green Version]
  2. Song, Y.; Wang, D.; He, W.; Xiong, H.; Wang, P.; Lei, Y. Research on multi-objective stochastic planning of a micro energy grid with multiple clean energy sources based on scenario construction technology. Power Syst. Prot. Control. 2021, 49, 20–31. [Google Scholar]
  3. Falsafi, H.; Zakariazadeh, A.; Jadid, S. The role of demand response in single and multi-objective wind-thermal generation scheduling: A stochastic programming. Energy 2014, 64, 853–867. [Google Scholar] [CrossRef]
  4. Zhou, J.; Wu, Y.; Wu, C.; Deng, Z.; Xu, C.; Hu, Y. A hybrid fuzzy multi- criteria decision-making approach for performance analysis and evaluation of park-level integrated energy system. Energy Convers. Manag. 2019, 201, 112134. [Google Scholar] [CrossRef]
  5. Li, H.; Kong, Z.; Tao, C. Reliability Evaluation of electric-gas integrated energy system considering the multi-state model of natural gas pipeline network. Proc. CSEE 2022, 42, 6247–6260. [Google Scholar]
  6. Pan, C.; Jin, T.; Li, N.; Wang, G.; Hou, X.; Gu, Y. Multi-objective and two-stage optimization study of integrated energy systems considering P2G and integrated demand responses. Energy 2023, 270, 126846. [Google Scholar] [CrossRef]
  7. Chen, J.; Hu, Z.; Chen, Y.; Chen, J.; Chen, W.; Gao, M.; Lin, M.; Du, Y. Thermoelectric optimization of integrated energy system considering ladder-type carbon trading mechanism and electric hydrogen production. Electr. Power Autom. Equip. 2021, 41, 48–55. [Google Scholar]
  8. Gao, Y.; Wang, Q.; Chen, Y.; Ye, W.; Liu, G.; Yin, X. Optimal dispatch of integrated energy system with hydrogen considering demand response and cascade energy utilization. Autom. Electr. Power Syst. 2023, 47, 51–59. [Google Scholar]
  9. Liu, X.; Nie, F.; Yang, D.; Wang, Y.; Xu, Y. Low carbon economic dispatch of integrated energy systems considering green certificates-carbon trading mechanism under CCPP-P2G joint operation model. Power Syst. Technol. 2023, 47, 2207–2222. [Google Scholar]
  10. Yang, X.; Zhang, Z.; Mei, L.; Wang, X.; Deng, Y.; Wei, S.; Liu, X. Optimal configuration of improved integrated energy system based on stepped carbon penalty response and improved power to gas. Energy 2023, 263, 125985. [Google Scholar] [CrossRef]
  11. Wang, H.; Hua, P.; Wu, X.; Zhang, R.; Granlund, K.; Li, J.; Zhu, Y.; Lahdelma, R.; Teppo, E.; Yu, L. Heat-power decoupling and energy saving of the CHP unit with heat pump based waste heat recovery system. Energy 2022, 250, 123846. [Google Scholar] [CrossRef]
  12. Shi, J.; Xu, J.; Zeng, B.; Zhang, J. A bi-level optimal operation for energy hub based on regulating heat-to-electric ratio mode. Power Syst. Technol. 2016, 40, 2959–2966. [Google Scholar]
  13. Chen, Y.; Ma, Y.; Zheng, G.; Sun, Z.; Chen, D.; Gao, Y. Units Considering demand response coordinated planning of thermo-electrolytic coupling for multiple CHP. Power Grid Technol. 2022, 46, 3821–3832. [Google Scholar]
  14. Kang, L.; Wang, J.; Yuan, X.; Cao, Z.; Yang, Y.; Deng, S.; Zhao, J.; Wang, Y. Research on energy management of integrated energy system coupled with organic Rankine cycle and power to gas. Energy Convers. Manag. 2023, 287, 117117. [Google Scholar] [CrossRef]
  15. Kalan, A.S.; Heidarabadi, S.; Khaleghi, M.; Ghiasirad, H.; Skorek-Osikowska, A. Biomass-to-energy integrated trigeneration system using supercritical CO2 and modified Kalina cycles: Energy and exergy analysis. Energy 2023, 270, 126845. [Google Scholar] [CrossRef]
  16. Ye, C.; Cao, K.; Ding, K.; Chen, Q.; Qian, Y. Uncertain optimal dispatch strategy based on generalized energy storage for multi-energy system. Trans. China Electrotech. Soc. 2021, 36, 3753–3764. [Google Scholar]
  17. Chen, C.; Wu, X.; Li, Y.; Zhu, X.; Li, Z.; Ma, J.; Qiu, W.; Liu, C.; Lin, Z.; Yang, L.; et al. Distributionally robust day-ahead scheduling of park-level integrated energy system considering generalized energy storages. Appl. Energy 2021, 302, 117493. [Google Scholar] [CrossRef]
  18. Malozyomov, B.V.; Martyushev, N.V.; Kukartsev, V.A.; Kukartsev, V.V.; Tynchenko, S.V.; Klyuev, R.V.; Zagorodnii, N.A.; Tynchenko, Y.A. Study of Supercapacitors Built in the Start-Up System of the Main Diesel Locomotive. Energies 2023, 16, 3909. [Google Scholar] [CrossRef]
  19. Shchurov, N.I.; Dedov, S.I.; Malozyomov, B.V.; Shtang, A.A.; Martyushev, N.V.; Klyuev, R.V.; Andriashin, S.N. Degradation of Lithium-Ion Batteries in an Electric Transport Complex. Energies 2021, 14, 8072. [Google Scholar] [CrossRef]
  20. Wang, R.; Wu, J.; Cai, Z.; Liu, G.; Zhang, H.; Cai, J. Three-stage collaborative optimal scheduling of electricity-gas-heat in virtual power plant with generalized energy storage. Power Syst. Technol. 2022, 46, 1857–1868. [Google Scholar]
  21. Zhu, X.; Yang, J.; Liu, Y.; Liu, C.; Miao, B.; Chen, L. Optimal scheduling method for a regional integrated energy system considering joint virtual energy storage. IEEE Access 2019, 7, 138260–138272. [Google Scholar] [CrossRef]
  22. Liu, Z.; Yu, P.; Li, J. Planning of distributed generation and generalized energy storage in distribution network considering operation characteristic. Electr. Power Autom. Equip. 2023, 43, 72–79. [Google Scholar]
  23. Li, H.; Fang, Y.; Xiao, B. Research on Optimized Operation of Regional Integrated Energy System Considering Generalized Energy Storage. Power Syst. Technol. 2019, 43, 3130–3138. [Google Scholar]
  24. Yang, Y.; Li, Q.; Pu, Y.; Chen, X.; Chen, W. Optimal configuration of CHHP island IES considering different charging modes of electric vehicles. Power Syst. Technol. 2022, 46, 3869–3880. [Google Scholar]
  25. Li, D.; Zhang, K.; Yao, Y.; Lin, S. Day-ahead demand response scheduling strategy of an electric vehicle aggregators based on information gap decision theory. Power Syst. Prot. Control. 2022, 50, 101–111. [Google Scholar]
  26. Tan, Z.; Ju, L.; Li, H.; Li, J.; Zhang, H. A two-stage scheduling optimization model and solution algorithm for wind power and energy storage system considering uncertainty and demand response. Int. J. Electr. Power Energy Syst. 2014, 63, 1057–1069. [Google Scholar] [CrossRef]
  27. Qin, T.; Liu, H.; Wang, J.; Feng, Z.; Fang, W. Carbon trading based low-carbon economic dispatch for integrated electricity-heat-gas energy system. Autom. Electr. Power Syst. 2018, 42, 8–13, 22. [Google Scholar]
  28. Lv, X.; Liu, T.; Liu, Y.; He, C.; Nan, L.; Zeng, H. Low-carbon economic dispatch of multi-energy park considering high proportion of renewable energy. J. Shanghai Jiaotong Univ. 2021, 55, 1586. [Google Scholar]
Figure 1. IES structure considering refined utilization of hydrogen energy and GES.
Energies 16 05700 g001
Figure 2. Flow chart of model solution.
Energies 16 05700 g002
Figure 3. PV, WT, and multi-source load forecasting curves.
Energies 16 05700 g003
Figure 4. Time-of-use electricity and gas prices.
Energies 16 05700 g004
Figure 5. Thermal power allocation of GT output in Scenario 2.
Energies 16 05700 g005
Figure 6. Electrical power output of the CHP unit in Scenario 3.
Energies 16 05700 g006
Figure 7. IES optimal scheduling results considering electricity-hydrogen coupling and GES: (a) electric power balance; (b) thermal power balance; (c) gas power balance.
Energies 16 05700 g007aEnergies 16 05700 g007b
Figure 8. Scenario 6 multi-source energy storage optimization results.
Energies 16 05700 g008
Figure 9. Different ways of EV scheduling.
Energies 16 05700 g009
Figure 10. Scheduling results for different numbers of EVs: (a) operating costs for different EV quantities; (b) carbon emissions for different EV quantities.
Energies 16 05700 g010
Figure 11. Relationship curve between IES expected costs and CVaR values.
Energies 16 05700 g011
Table 1. Running results from Scenario 1 to Scenario 3.
ScenariosOperation and Maintenance Cost/YuanElectricity Purchase Cost/YuanGas
Purchase Cost/Yuan
Carbon
Emissions/Kg
Carbon Transaction Cost/YuanNew Energy Consumption Rate/%Total Cost/Yuan
1887.1916,454.9412,118.6241,270.217618.0187.3637,078.76
2883.5715,106.5012,896.1140,761.947380.2892.5436,266.46
3886.1914,945.8112,903.4840,581.197346.9793.8836,082.45
Table 2. Scenario 4 to Scenario 6 run results.
ScenariosOperation and Maintenance Cost/YuanElectricity Purchase Cost/YuanGas
Purchase Cost/Yuan
Carbon
Emissions/Kg
Carbon Transaction Cost/YuanDemand Response Cost/YuanTotal Cost/Yuan
41084.9814,385.6516,081.1349,081.177438.61038,990.37
5911.5211,767.2312,820.5040,295.087004.31960.1733,463.73
6910.6110,618.6312,830.1339,961.066972.381343.2332,674.98
Disclaimer/Publisher’s Note: The statements, opinions and data contained in all publications are solely those of the individual author(s) and contributor(s) and not of MDPI and/or the editor(s). MDPI and/or the editor(s) disclaim responsibility for any injury to people or property resulting from any ideas, methods, instructions or products referred to in the content.

