Article

Experimental Comparison of Hydrogen Refueling with Directly Pressurized vs. Cascade Method

1
Department of Mechanical, Energy and Management Engineering, University of Calabria, Arcavacata di Rende, 87036 Cosenza, Italy
2
Department of Technology, Hydrogen Research and Fueling Facility, California State University Los Angeles, Los Angeles, CA 90032, USA
3
Hydrogen Research and Fueling Facility, California State University Los Angeles, Los Angeles, CA 90032, USA
*
Authors to whom correspondence should be addressed.
Energies 2023, 16(15), 5749; https://doi.org/10.3390/en16155749
Submission received: 11 July 2023 / Revised: 29 July 2023 / Accepted: 31 July 2023 / Published: 1 August 2023
(This article belongs to the Section A5: Hydrogen Energy)

Abstract

:
This paper presents a comparative analysis of two hydrogen station configurations during the refueling process: the conventional “directly pressurized refueling process” and the innovative “cascade refueling process.” The objective of the cascade process is to refuel vehicles without the need for booster compressors. The experiments were conducted at the Hydrogen Research and Fueling Facility located at California State University, Los Angeles. In the cascade refueling process, the facility buffer tanks were utilized as high-pressure storage, enabling the refueling operation. Three different scenarios were tested: one involving the cascade refueling process and two involving compressor-driven refueling processes. On average, each refueling event delivered 1.6 kg of hydrogen. Although the cascade refueling process using the high-pressure buffer tanks did not achieve the pressure target, it resulted in a notable improvement in the nozzle outlet temperature trend, reducing it by approximately 8 °C. Moreover, the overall hydrogen chiller load for the two directly pressurized refuelings was 66 Wh/kg and 62 Wh/kg, respectively, whereas the cascading process only required 55 Wh/kg. This represents a 20% and 12% reduction in energy consumption compared to the scenarios involving booster compressors during fueling. The observed refueling range of 150–350 bar showed that the cascade process consistently required 12–20% less energy for hydrogen chilling. Additionally, the nozzle outlet temperature demonstrated an approximate 8 °C improvement within this pressure range. These findings indicate that further improvements can be expected in the high-pressure region, specifically above 350 bar. This research suggests the potential for significant improvements in the high-pressure range, emphasizing the viability of the cascade refueling process as a promising alternative to the direct compression approach.

1. Introduction

Concerns about the economic and geopolitical ramifications of potential oil shortages as a pillar of our globalized, transport-based society, as well as the need to reduce greenhouse gas emissions in the transportation sector, are driving the search for alternative fuels [1].
Among the various proposals of the scientific community for new alternative fuels, hydrogen is gaining attention from both the research and industrial communities. The Clean Hydrogen Partnership is a distinctive partnership between the public and private sectors that supports hydrogen technology research and innovation (R&I) throughout Europe, a successor of the Fuel Cells and Hydrogen Joint Undertaking (FCHJU). In 2022 [2], the partnership examined a European battery electric vehicles (BEV)–fuel cell electric vehicles (FCEV) ecosystem. The analysis determined that a 100% BEV ecosystem only might cost EUR 3 to EUR 5 trillion more in infrastructure by 2050 than the ecosystem with a combination of both. Multiple technology development with both BEVs and FCEVs reduces resource exhaustion and implementation constraints. In 2020, in another report [3], the partnership estimated a 17% fuel cell truck market share in 2030, based on a significant cost-reduction trajectory. FCH heavy-duty trucks (FCH HDT) could match diesel trucks in daily range, refueling time, cargo capacity, and total cost of ownership due to scaled-up manufacturing and hydrogen prices < 6 EUR/kg. The report recommended short-term R&I projects and policies to overcome such impediments.
Other tailored studies on fuel cell-based mobility in specific countries have been deployed, such as in UK [4] and in Poland [5]. Hydrogen, according to proponents of a global hydrogen economy, can be an ecologically cleaner energy carrier for end users, especially in transportation applications [6,7], without emitting pollutants such as particulate matter or carbon dioxide [8]. The future success of FCEVs also depends on the presence of adequate infrastructures, such as hydrogen refueling stations (HRS), so that this technology can be introduced to a large market [9]. Currently, HRS installation and availability are one of the most significant obstacles to the proliferation of these vehicles [10,11], as the number of installed and functioning stations, while increasing, is still much fewer than the number of conventional refueling stations [12,13].
Before being supplied into the tanks, hydrogen is supplied at 35 MPa (for “Bus” uses) or 70 MPa (for FCEV applications) in refueling stations [14,15]. This is necessary to ensure vehicle performance over a range of around 450 km and a full-tank refilling duration in about 5–7 min, thanks to a hydrogen precooling of about −40 °C [16,17], achieving state of charge in high nineties [18,19].
However, the high pressure needed for the onboard hydrogen storage and the intense precooling require the installation of energy-demanding components, such as high-pressure compressors and chillers [20,21]. These components account for most of the energy required during a refueling process. According to the NREL composite data, hydrogen compression requires an average of 1.31 kWh/kg, while the hydrogen chiller requires about 1.35 kWh/kg on average for more than 500 kg dispensed [22]. The European Union identified the station energy efficiency as of the key performance indicators (KPI) to be improved with further research and development actions, as well as with new approaches to energy management. The overall refueling process energy consumption is expected to decrease from 5 kWh/kg referring to 2020 to about 3 kWh/kg in 2030 [23].
The scientific community can support this goal and transition by investigating technologies, energy management strategies, and approaches to the operation of an HRS to improve its energy efficiency and decrease energy consumption [24,25].
Elgowainy et al. [26] proposed a new approach to decrease the hydrogen compression energy expenditure, saving about 60% of energy thanks to a new technique called “pressure consolidation” by using trailers to consolidate the pressure in different tanks. Reddi et al. [27] further expanded this approach, proposing a “two-tier pressure consolidation strategy”. Kuroki et al. [28] proposed a dynamic modeling method to optimize and simulate a real refueling procedure and predict the transient temperature and pressure levels. Handa et al. [29] presented a new hydrogen refueling method, different from the SAE J2601 [30], called “MC Multi Map”, which is an improvement of the MC Formula refueling method [31]. The authors found out that it may be possible to lower the hydrogen precooling temperature to −20 °C instead of −40 °C, while retaining a filling time of around three minutes. Chen et al. [32] proposed the introduction of a turbo-expander in the station layout. This configuration allowed an energy decrease of more than 50% at the chiller while meeting the fueling requirements established by the SAE J2601 [33,34]. Xu et al. [35] presented a novel control procedure for the storage tanks, relying on three banks operating in sequence of decreasing pressure. This method increases the HRS refueling capacity by 5% compared to the conventional cascade refilling control technique. Genovese et al. [36] proposed a new approach to auxiliary cooling system tuning to reduce energy consumption at the station, lowering between 3 and 9% of the total energy needed for a single refueling.
Several authors investigated the management of the storage tank pressure levels to better operate the station with less energy expenditure [37,38]. Luo et al. [39] developed a mathematical tool in Matlab environment that identifies the optimal storage operating parameters for a less energy-demanding refueling process. The model identified the optimal parameters that can allow a reduction of about 11% of the hydrogen chiller energy consumption. Xiao et al. [40] identified that operating the HRS with three banks instead of only one can allow a reduction of about 34% in the station energy consumption. Similarly, Caponi et al. [41] investigated the adoption of multiple tanks in an HRS serving hydrogen buses.
The study revealed that the single-tank system generates 20% more heat compared to a multiple tanks system operating with varying pressure levels. This increase in heat is attributed to the Joule–Thomson effect, which occurs due to a larger pressure difference between the vehicle and storage tanks during refueling. Furthermore, the cascade refueling process demonstrated a 10% reduction in energy consumption for operating the compressor during refueling.
The lack of a comprehensive infrastructure for hydrogen refueling continues to be a major obstacle to the adoption of hydrogen fuel cell vehicles, despite the growing interest in them. The hydrogen refueling process must be optimized in order to handle this problem, both in terms of efficiency and security. In this sense, the cascade hydrogen refueling procedure has become a promising substitute for the conventional directly pressurized refueling procedure since it can lessen the station’s cooling and compression demands while also giving the vehicle a more steady pressure. As shown in the presented literature review, while several theoretical studies have looked at the advantages of the cascade refueling approach, there is a dearth of experimental evidence to support and contrast the effectiveness of the two procedures in practical settings.
This study addresses the research gap by comparing the cascade hydrogen refueling process with the directly pressurized hydrogen refueling method. It emphasizes the importance of conducting experimental activities to gather essential data and insights on the performance and energy efficiency of both processes in different operating scenarios. These findings have the potential to contribute to the development of more reliable and efficient hydrogen refueling systems. Specifically, the paper focuses on analyzing hydrogen refueling station (HRS) configurations during the refueling process, considering the current layout of the Hydrogen Research and Fueling Facility (HRFF) at California State University, Los Angeles (Cal State LA). The objective is to reduce energy consumption in HRS during refueling, aligning with the overarching goal of improving efficiency.
The purpose of the experimental activities described in this paper was to compare two different potential configurations during a vehicle refueling: the traditional process used to fill vehicles, known as the “directly pressurized” refueling, and an alternative approach, known as the “cascade” refueling, which aims to fuel the vehicle without the use of booster compressors. During the operation of boosters, compression causes an increase in the compressor outlet temperature. Even though Hydro-Pac (used at Cal State LA) designed its compressors with an intermediate cooling stage, the hydrogen temperature at the compressor outlet can easily reach 50–60 °C, which has a negative impact on the hose temperature down the stream, as previously investigated by the authors [36].
The goal and the novelty of the presented activities are therefore to investigate empirically and improve the nozzle outlet temperature trends and reduce the load on the hydrogen chiller. Additionally, the present research activity can clarify the viability, potential limitations, and prospective areas for improvement of the cascade refueling procedure.
The hydrogen refueling infrastructure designs and performance optimization could be considerably impacted by the availability of this experimental data and comparative analysis of these two approaches. Additionally, it might help scientists, engineers, and decision-makers create hydrogen refueling systems that are more efficient and affordable, promulgating a wider use of hydrogen vehicles. The proposed experimental activities have the potential to significantly contribute to the existing body of knowledge regarding the cascade hydrogen refueling process, thereby advancing the field of hydrogen fuel cell technology.

2. Materials and Methods

The Hydrogen Research and Fueling Facility (HRFF) is a hydrogen station for fuel cell electric vehicles on the California State University Los Angeles campus in the greater Los Angeles area that also serves as a research center for hydrogen infrastructure [42,43]. Since 2014, the HRFF staff have committed themselves to exploring station performance and operational configurations. The HRFF features on-site production via an alkaline water electrolysis unit with a 10 bar working pressure. Given that the maximum pressure ratio limit of the single-stage booster compressors is fixed at 8:1, the storage pressure of 400 bar (40 times) necessitates a two-stage compressor from production to local storage. The PDC diaphragm compressor with a suction pressure of 10 bar and delivery pressure of up to 400 bar performs the initial compression step to medium pressure storage. The compressed hydrogen is then stored in the tube storage of 3 tanks with a capacity of 20 kg each at about 400 bar. The HRFF also features two hydrogen booster compressors (BC), a −20 °C hydrogen precooling system (PCU), and four high-pressure buffer tanks (BT) as detailed in [44] and below. As fueling commences, the initial flow to the vehicle tank(s) is provided from the medium pressure storage tanks, and later, when the pressure inside the vehicle tank approaches the pressure of the hydrogen within the main ground storage [45], the booster compressors begin their operation.
During the upper range of refueling, two Hydro-Pac booster compressors draw hydrogen from the main storage tanks to refuel an FCEV at 700 bar. As recommended by SAE J2601 [46], hydrogen is cooled in a 70 MPa-rated chiller with a working fluid set to approximately −36 °C before entering the vehicle tank. This maintains a temperature of −20 °C for the dispensed hydrogen and ensures a rapid and secure refueling process [47]. This method of hydrogen dispensing is referred to as a “directly pressurized” refueling and is typically utilized by station operators, as depicted in Figure 1. Each of the two booster compressors is designed with a tube-in-tube interstage water cooling system, but the outlet temperature can easily reach 50–60 °C as described in [36], influencing both the energy consumption of the hydrogen chiller and the temperature of the dispenser nozzle outlet temperature.
Another potential option, utilized by stations with a different layout, is to refuel the vehicle by cascading hydrogen from about 900 bar of high-pressure local storage. Booster compressors are then used to fill the vehicles if the pressure level within the local storage is insufficient for a full tank refueling process (State of Charge (SOC) greater than 95% and final pressure greater than 650 bar) [48]. To simulate this potential operation, the station control was set to manual mode, and the buffer tanks were completely refilled by activating the booster compressors when no vehicle required refueling, as depicted in Figure 1. The boosters are then disabled, and the Air Operating Solenoid Valve (AOV) is controlled manually. As depicted in Figure 2, the AOV valve is located close to the buffer tanks so that hydrogen can be drawn from or added to them. Notably, the buffer tanks in this instance are not used to smooth the flow [49] but rather as high-pressure storage.
Table 1 describes the features of high-pressure buffer tanks that are installed at the HRFF. The tanks have a working pressure of 85 MPa and are tested to withstand a pressure of 127.5 MPa. The alloy used is chromium–molybdenum steel, which is hoop-wrapped using carbon fiber. The nominal water capacity of the tanks is 50 L, and their external diameter and length are 256 mm and 1800 mm, respectively. The nominal weight of the tanks is 221 kg. The tanks have an allowable temperature range of −40 °C to +65 °C. Overall, these tanks have been designed and tested to meet the demanding requirements of a hydrogen refueling process without pulsations, as described elsewhere [49], and their features have been carefully chosen to ensure their safety, reliability, and performance.
The hydrogen chiller, which is situated immediately behind the boosters’ discharge line, mostly consists of an evaporator using industrial ethylene glycol (60% aqueous concentration) as its coolant. The ethylene glycol mixture is kept at a uniform temperature, called the “target temperature”, in the refrigeration system 200 L barrel that contains a 72 m long stainless steel coil in which hydrogen being cooled flows [50].
The purpose of the experiments described in this paper was to compare two different ways to refuel a vehicle: a “directly pressurized” refueling, and a “cascade” refueling, which tries to fill the vehicle without using booster compressors.
Table 2 lists the conditions of the experiments. Three tests were executed:
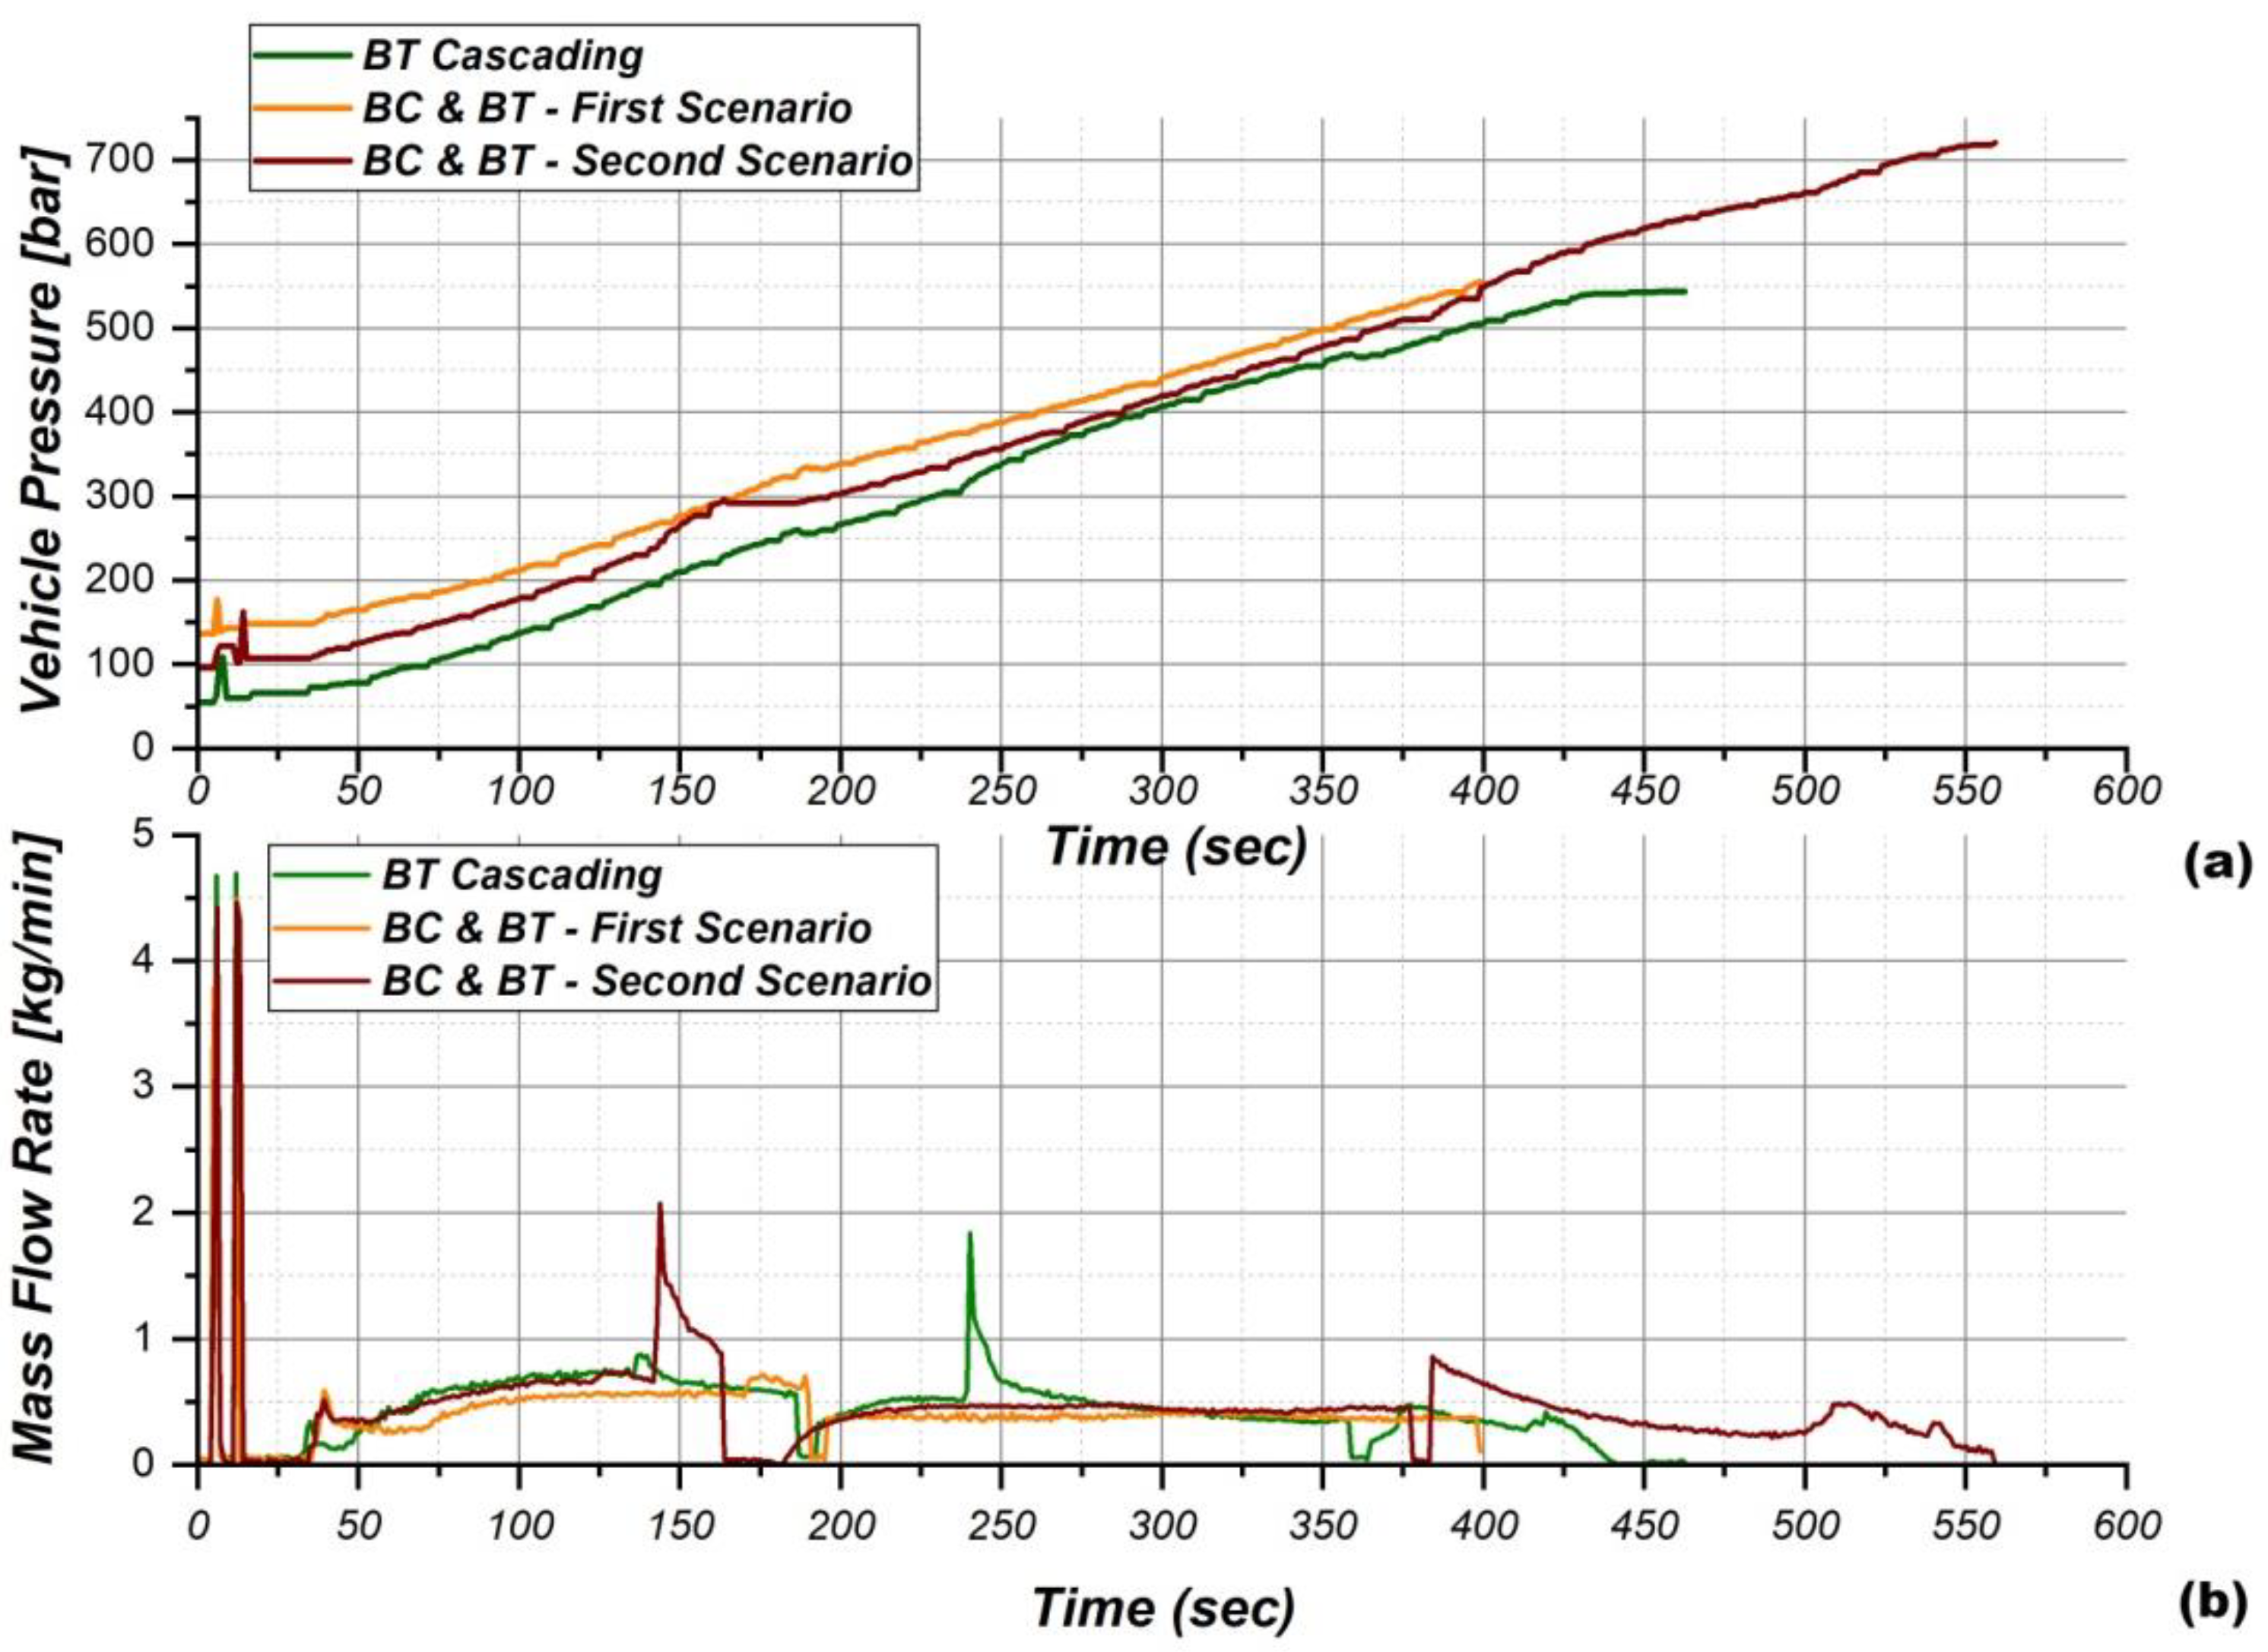
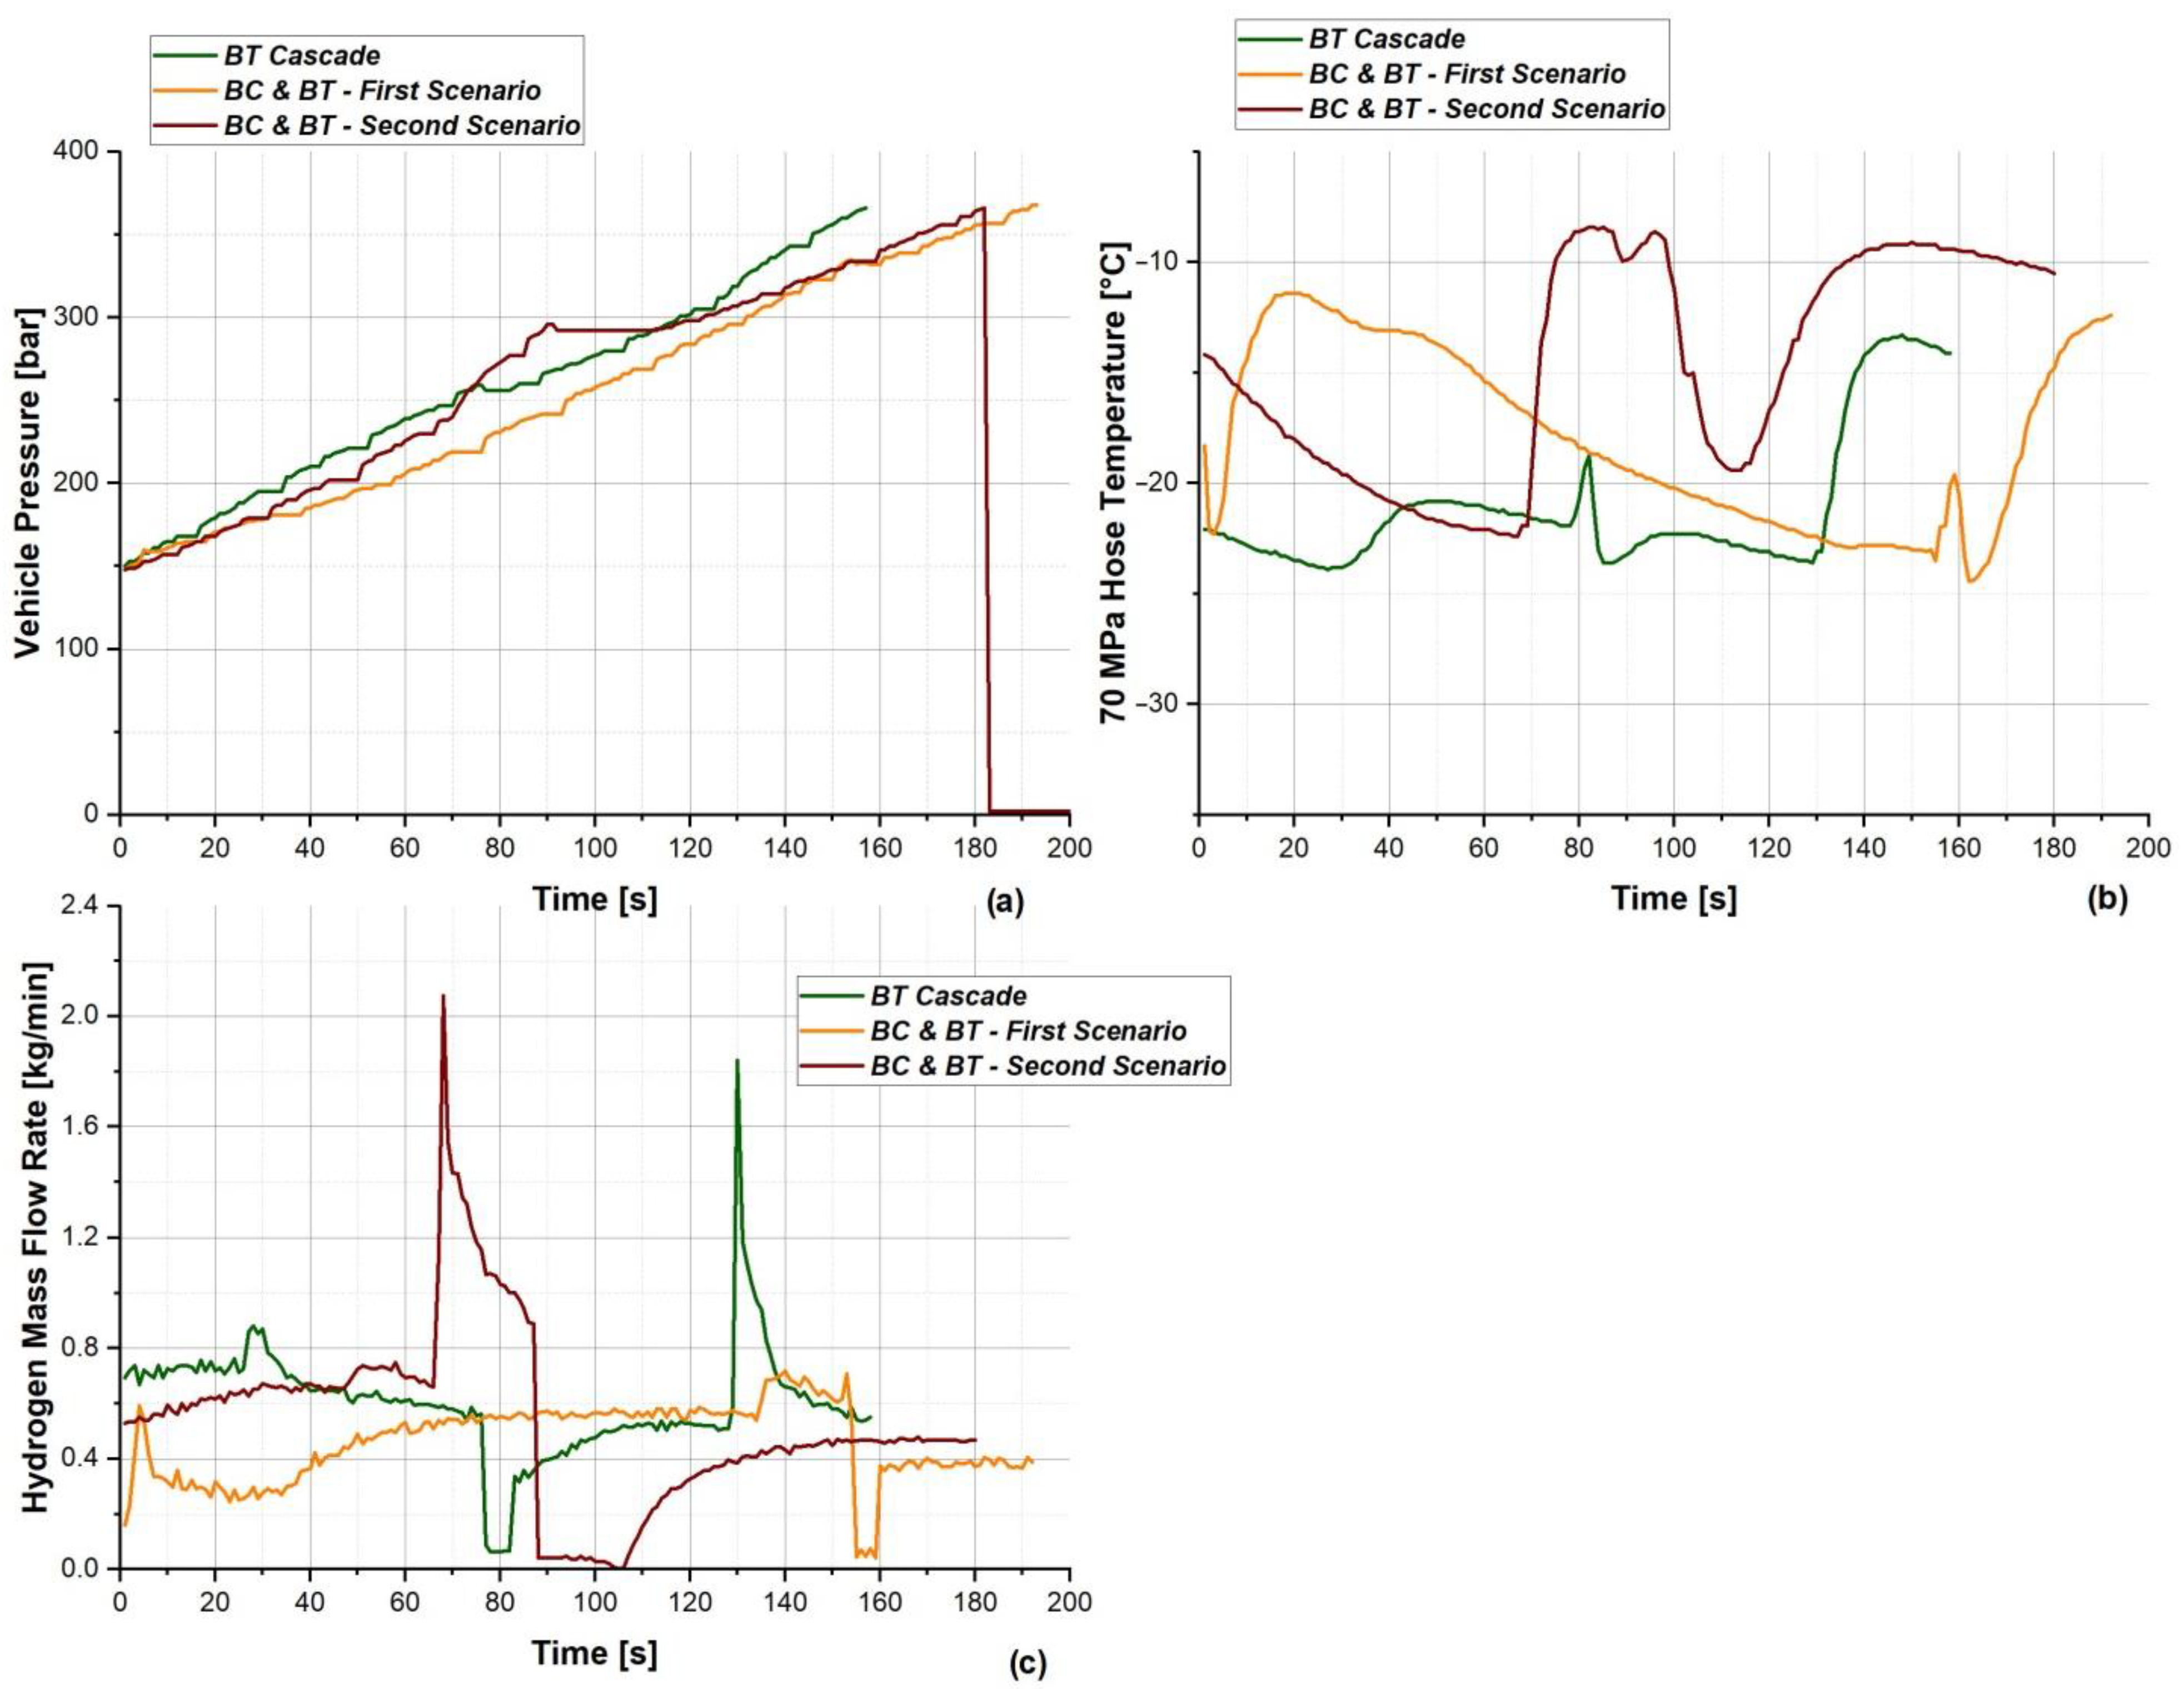
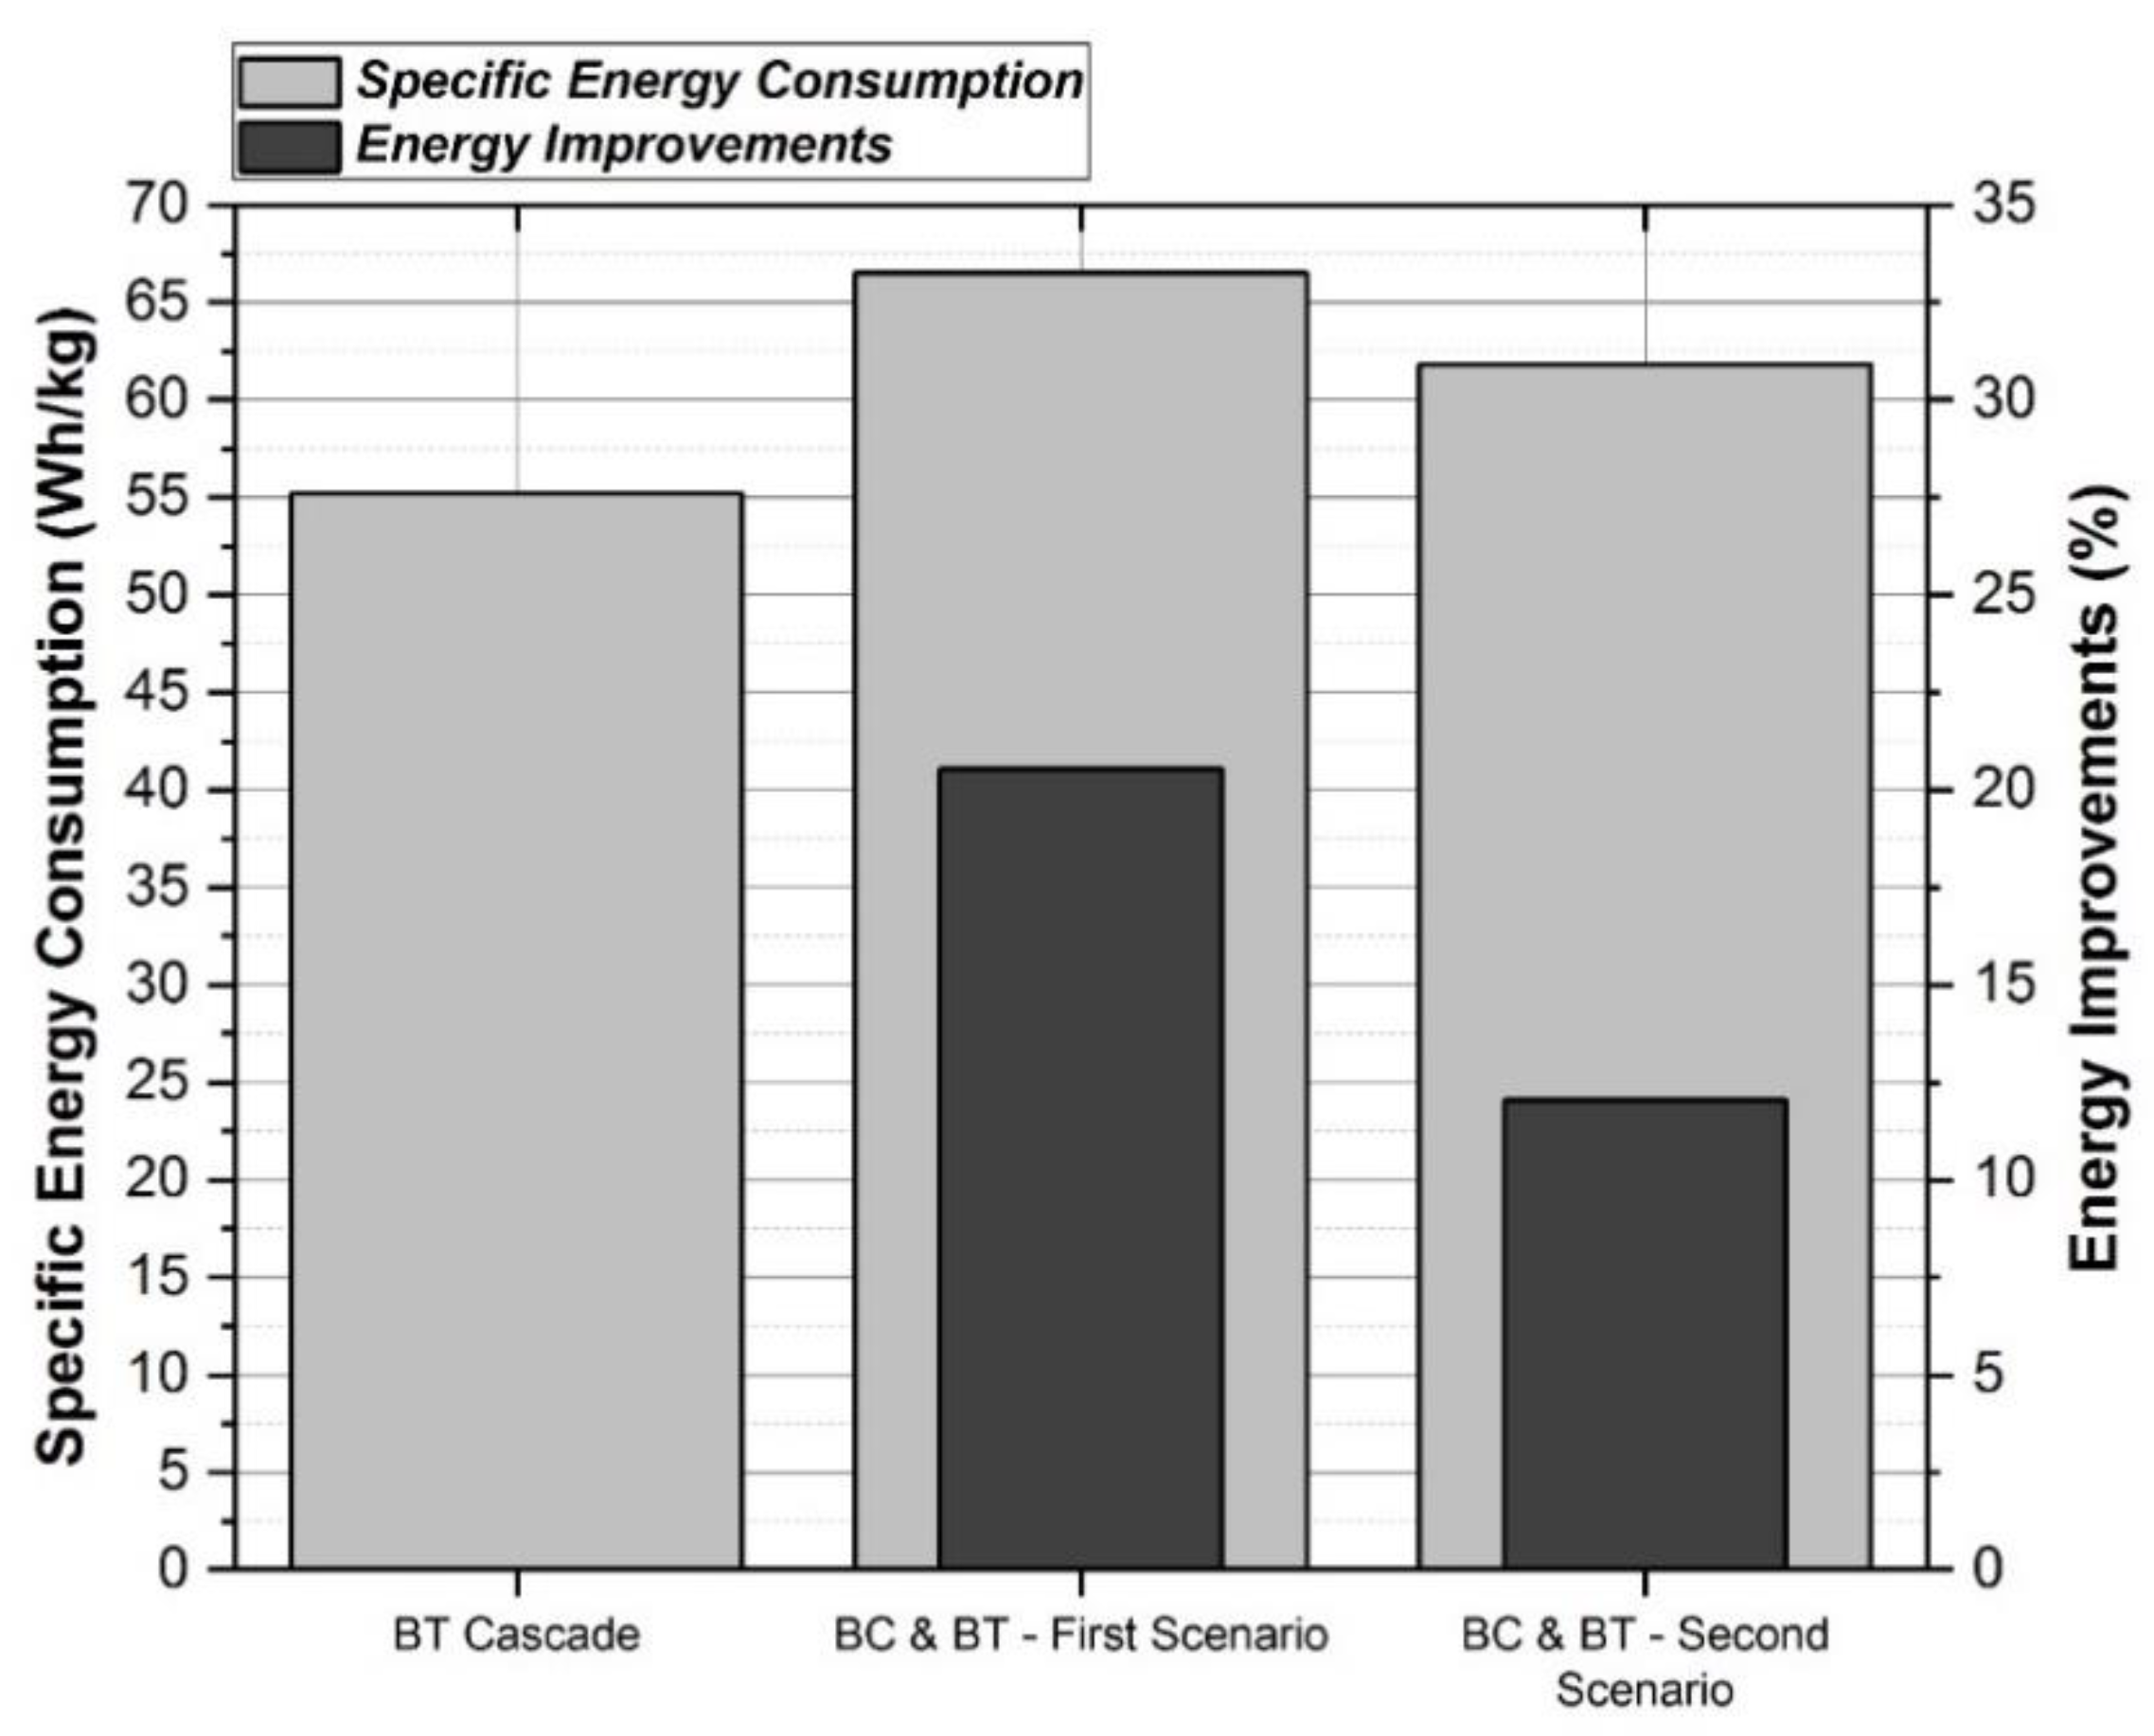
  • The first experiment, identified as “BT Cascade” in Table 1, was characterized by a cascade refueling process. The booster compressors were disabled, and the hydrogen was directly cascaded from the high-pressure buffer tanks. All four high-pressure buffer tanks were indeed used simultaneously. During the experiment, an equal level of pressure in each tank was maintained throughout the process, meaning they were all opened at the same time. There was no sequential change in connection according to the APRR.
  • The second experiment, identified as “BC and BT First Scenario” in Table 1, was characterized by a directly pressurized refueling process. The booster compressors were operated to directly fill vehicles, and the high-pressure buffer tanks had the sole role to prevent pressure pulsations.
  • The third experiment was essentially run with almost identical conditions to the second one, in order to have redundancy of data to be compared with.
During a vehicle filling, it was essential to monitor the chiller cooling conditions and ensure that the initial pressure and temperature of the vehicle were nearly identical to the benchmark configurations to maintain similarity (the hydrogen chiller coil temperature and hydrogen chiller target temperature). The vehicle refueling processes were carried out with nearly identical initial pressure and temperature conditions within the fuel tank, as well as nearly identical ambient temperature and APRR. In fact, the refueling procedure at the station adheres to the SAE J2601 Protocol, and a crucial model parameter is the ambient temperature, which influences the CoP of the hydrogen chiller and the operating pressure ramp rate of the J2601 tables (APRR). Real vehicles have been refueled during the described experiments, which had an overall capacity of 5 kg.
The purpose of the experiments was to fuel the vehicles with hydrogen cascading directly from the high-pressure buffer tanks. Due to the absence of boosters during the refueling process, the experimental setup aimed at reducing the temperature of the hose, thereby reducing the energy requirement of the hydrogen chiller.

3. Results

This section presents the results of a series of experiments focused on refueling processes and their impact on pressure and mass flow rate by providing a visual representation of the trends observed, highlighting the outcomes of utilizing booster compressors in the directly pressurized process versus the high-pressure buffer tank cascade in manual mode. After completing a series of successful experiments as previously discussed, Figure 3 illustrates the pressure and mass flow rate trends for the three refueling processes. During the two refueling events utilizing the booster compressors in the directly pressurized process, the vehicle tank pressures reached 550 bar and 710 bar, starting from initial pressures of approximately 140 bar and 100 bar, respectively. On the other hand, the refueling event conducted using the high-pressure buffer tank cascade, in manual mode, began with a buffer storage pressure of 800 bar and a mass of about 8 kg, and with a vehicle tank pressure of 55 bar and only achieved 550 bar. This outcome was anticipated due to limited capacity of the actual high-pressure storage. Consequently, this experiment was limited by insufficient hydrogen in the buffer tanks to attain the desired target pressure of around 72 MPa in the vehicle tank. Increases in the mass flow rate are associated with the dispenser checking for leaks. BC and BT Second Scenario and BT Cascade experienced prolonged pressure leaks, respectively close to 160 s and 360 s for the BC and BT Second Scenario and 180 s, 240 s, and 360 s for BT cascading. BC and BT’s First Scenario had a very rapid pressure leak at about 190 s, resulting in no peak in mass flow rate.
The vehicle temperatures, shown in Figure 4a, present levels under the safety thermal limit within the vehicle tanks, which is currently 80 °C. The chiller coil temperature trends, shown in Figure 4b, have almost the same temperature ramp rate, given the slight temperature delta between the three events for the initial chiller coil temperature (respectively of −34 °C, −34.6 °C, and −35.5 °C). Figure 4c reports the temperature trend at the receptacle (70 MPa hose), and it anticipates the benefits related to the cascading process with a lower nozzle outlet final temperature level (8 °C) than those resulting from the adoption of the directly pressurized refueling events.
For all of them, the hydrogen mass flow rate is stopped when the leak tightness integrity checks are performed, in accordance with the safety procedures. The nozzle outlet temperature increases that are shown in the trends displayed in Figure 4c are related to these safety procedures, namely the stopping of the hydrogen flow to perform the leak checks. The station is equipped with leak sensors, flame detectors, and other safety devices which constantly monitor the production and fueling process. A leak test is performed at every 3000 psi pressure increase during fueling. The test checks for leaks in the fueling hose, nozzle, and vehicle receptacle. To perform this test, the system periodically pauses and closes the hydrogen inlet valve to the dispenser. If no measurable drop in pressure is detected during a 5 s pause, this indicates the absence of leaks, and fueling is allowed to resume to completion. Leak checks, depending on the fueling conditions, could last also up to 30 s.
In order to conduct the cascade refueling experiment, the station was put in the manual mode, and the booster compressors were turned off. During the manual procedure, the booster power meter stopped its recording, also affecting the data collection.
To compare the three events from an energy point of view, a time shift has been performed by reporting the data related to the three refueling events starting from the same pressure level, 150 bar, up to 350 bar, to use the available data recorded during the experimental activities.
Figure 5 shows the re-organized trends after the time shift for the three refueling events, characterized by having dispensed in the analyzed window, respectively 1.58 kg (BT Cascade), 1.6 kg (BC and BT—First Scenario), and 1.62 kg (BC and BT—Second Scenario).
The pressure trends are illustrated in Figure 5a, and it is worth mentioning how the cascade fueling process provided the same amount of hydrogen in a lower elapsed time. The cascade refueling process indeed provided a more natural refueling given the absence of compressors during the fueling operation. The hydrogen mass flow rate has, in the first part of the fueling, higher values than the other two scenarios, as shown in Figure 5c. The nozzle outlet temperature trend, displayed in Figure 5b, resulted to have a lower level for the cascade configuration: the difference is more visible before the leak checks when a marked temperature delta has been found.
Figure 6 shows the power trends for the analyzed scenarios. The upper graph (Figure 6a) illustrates the booster power consumption recorded each second during their operation. The compressors reached almost 120 kW when working in phase and around 80 kW if out of phase. In economic terms, the energy required by the boosters is almost the same even for the cascade scenario: for the analyzed cases, the boosters were active before or after refueling, only to fill the high-pressure buffer tanks, but not during the process.
A different comparison must be made for the hydrogen chiller power consumption, shown in Figure 6b. The hydrogen chiller power consumption is measured every minute, and it is noteworthy to observe that the cascade refueling process resulted in lower power consumption for a shorter duration while dispensing the same amount of hydrogen. In fact, for the three fueling events, the average amount of hydrogen dispensed was about 1.6 kg per fueling.
This result can be primarily attributed to the absence of booster operation during the refueling process. The booster heat transfer heavily affects the hydrogen temperature at the compressor outlet and, therefore, the hydrogen chiller power consumption and the final temperature at the nozzle outlet.
Figure 7 shows the energy analysis for the pre-cooling unit. The overall hydrogen chiller demand, for the two directly pressurized refueling processes, resulted to be, respectively, 66 Wh/kg and 62 Wh/kg, while the cascading process required 55 Wh/kg, respectively 20% and 12% lower than the first and second scenarios with the boosters active during the fueling operation.

4. Conclusions

This study explores two potential station configurations during a refueling process: the classic process used to fill the vehicles, namely the “directly pressurized” refueling, and a different approach, called the “cascade refueling”, aiming at fueling the vehicle with or without boosters. Due to the facility’s lack of high-pressure storage capability, the experimental activities involved filling the high-pressure buffer tanks prior to the refueling process and subsequently cascading hydrogen into the vehicle. In this case, the buffer tanks are not used to smooth the flow, as intended by the design, but as a real high-pressure storage.
The analysis has shown that the actual size of the installed high-pressure buffer tanks did not allow the station to provide a “regular” refueling process, since the hydrogen quantity was not enough to guarantee a full tank for the vehicle. Part of the hydrogen mass—maximum up to 200 g as per SAE J2601 protocol—within the high-pressure buffer tanks has been also used for the pressure initial pulses.
However, even if the cascade refueling process did not reach the pressure target due to the limited size of BT, the nozzle outlet temperature trend showed improvement by about 8 °C by cascading hydrogen from the high-pressure buffer tanks, if compared to the normal operation of the station and by maintaining almost the same values. During a directly pressurized refueling process with booster compressors, the compressors’ outlet temperature can easily reach 60 °C, which has a negative effect on the hose temperature. On the contrary, in a cascade refueling process, the hydrogen flow is maintained at lower temperatures due to an opportunity for heat rejection to the environment.
Moreover, the hydrogen chiller showed a lower energy load, requiring between 12–20% less energy over the pressure range between 150 bar and 350 bar. The cascade configuration reached 550 bar as the maximum delivery pressure to the vehicle tank. Given the resulting trends, a more marked improvement in the high-pressure area is surely expected since a marked improvement in the nozzle outlet temperature has been found in the high-pressure zone (about 8 °C).
In economic terms, the energy used by the boosters was always the same: the boosters were active before or after refueling, only to fill the high-pressure buffer tanks, but not during the process. This is a very important aspect because it allows the boosters to consume the same amount of energy, meanwhile improving the nozzle outlet temperature trend and reducing the hydrogen chiller energy consumption.
A similar effect has been achieved by tuning the water closed-loop cooling system of the boosters, but requiring a more energy-demanding energy operation for the water circuit [36].
The results presented could be generalized for further investigations. It is in the future plans of the authors to verify the experimental results via numerical models. The modeling will aim to scale up the obtained results and investigate the implementation of a cascade refueling process in the whole pressure range of a refueling process.
These activities could further support the evolution of the station by providing guidelines on potential layouts to be taken into account if a station upgrade towards a bigger station capacity is considered. For instance, some insights can be related to a potential booster operation only for the initial pulses and for the high-pressure storage replenishing and then adopting bigger high-pressure storage to cascade hydrogen during refueling. Based on the current findings, the cascade refueling approach can be an effective alternative to the directly pressurized refueling of hydrogen vehicles. Specifically, this method can improve the nozzle outlet temperature trend and reduce the hydrogen chiller’s energy consumption. When designing or upgrading hydrogen refueling stations, it is advised to consider the potential benefits of the cascade refueling approach, which includes the use of high-pressure tanks for hydrogen storage and the cascading of hydrogen into the vehicle during the refueling process. In addition, the research results may provide guidelines for potential layouts of hydrogen refueling stations with varying capacity needs, serving hydrogen infrastructure with valuable design recommendations.

Author Contributions

Conceptualization, D.B., M.D. and M.G.; methodology, D.B., M.D. and M.G; validation, M.D. and M.G.; formal analysis, M.G.; investigation, M.D. and M.G; resources, D.B. and M.D.; data curation, M.G., F.P. and P.F.; writing—original draft preparation, D.B., M.G., F.P. and P.F.; writing—review and editing, D.B., M.G., F.P. and P.F.; visualization, M.G., F.P. and P.F.; supervision, D.B., M.D. and P.F.; project administration, M.D.; funding acquisition, D.B. All authors have read and agreed to the published version of the manuscript..

Funding

This research was supported by a U.S. Department of Energy grant (DE-EE0005890) and in part by the National Science Foundation Center for Advancement toward Sustainable Urban Systems with grant number NSF HRD- 2112554. The research was also supported by the grant PON RI 2014-2020 for Innovative Industrial PhD (CUP H25D18000120006 and Code DOT1305040), funded by the European Union and the Italian Ministry of Education, University and Research (MIUR).

Institutional Review Board Statement

Not applicable.

Informed Consent Statement

Not applicable.

Data Availability Statement

Not applicable.

Conflicts of Interest

The authors declare no conflict of interest.

References

  1. Navas-Anguita, Z.; García-Gusano, D.; Iribarren, D. Long-Term Production Technology Mix of Alternative Fuels for Road Transport: A Focus on Spain. Energy Convers. Manag. 2020, 226, 113498. [Google Scholar] [CrossRef] [PubMed]
  2. Clean Hydrogen Joint Undertaking. The Road to Net Zero: Study on the Strategic Deployment of Battery-Electric Vehicles and Fuel Cell-Electric Vehicles Infrastructure; Publications Office of the European Union: Luxembourg, 2022; ISBN 9789292463960.
  3. Fuel Cells and Hydrogen Joint Undertaking; Roland Berger. Study on Fuel Cells Hydrogen Trucks; Fuel Cell and Hydrogen Joint Undertanking: Brussels, Belgium, 2020. [Google Scholar]
  4. Kendall, K. Green Hydrogen in the UK: Progress and Prospects. Clean Technol. 2022, 4, 345–355. [Google Scholar] [CrossRef]
  5. Burchart-Korol, D.; Gazda-Grzywacz, M.; Zarębska, K. Research and Prospects for the Development of Alternative Fuels in the Transport Sector in Poland: A Review. Energies 2020, 13, 2988. [Google Scholar] [CrossRef]
  6. Yusaf, T.; Laimon, M.; Alrefae, W.; Kadirgama, K.; Dhahad, H.A.; Ramasamy, D.; Kamarulzaman, M.K.; Yousif, B. Hydrogen Energy Demand Growth Prediction and Assessment (2021–2050) Using a System Thinking and System Dynamics Approach. Appl. Sci. 2022, 12, 781. [Google Scholar] [CrossRef]
  7. Bethoux, O. Hydrogen Fuel Cell Road Vehicles and Their Infrastructure: An Option towards an Environmentally Friendly Energy Transition. Energies 2020, 13, 6132. [Google Scholar] [CrossRef]
  8. Reuß, M.; Dimos, P.; Léon, A.; Grube, T.; Robinius, M.; Stolten, D. Hydrogen Road Transport Analysis in the Energy System: A Case Study for Germany through 2050. Energies 2021, 14, 3166. [Google Scholar] [CrossRef]
  9. Genovese, M.; Fragiacomo, P. Hydrogen Refueling Station: Overview of the Technological Status and Research Enhancement. J. Energy Storage 2023, 61, 106758. [Google Scholar] [CrossRef]
  10. Hienuki, S.; Hirayama, Y.; Shibutani, T.; Sakamoto, J.; Nakayama, J.; Miyake, A. How Knowledge about or Experience with Hydrogen Fueling Stations Improves Their Public Acceptance. Sustainability 2019, 11, 6339. [Google Scholar] [CrossRef] [Green Version]
  11. Trencher, G.; Edianto, A. Drivers and Barriers to the Adoption of Fuel Cell Passenger Vehicles and Buses in Germany. Energies 2021, 14, 833. [Google Scholar] [CrossRef]
  12. Samsun, R.C.; Rex, M.; Antoni, L.; Stolten, D. Deployment of Fuel Cell Vehicles and Hydrogen Refueling Station Infrastructure: A Global Overview and Perspectives. Energies 2022, 15, 4975. [Google Scholar] [CrossRef]
  13. Speers, P. Hydrogen Mobility Europe (H2ME): Vehicle and Hydrogen Refuelling Station Deployment Results. World Electr. Veh. J. 2018, 9, 2. [Google Scholar] [CrossRef] [Green Version]
  14. Liu, C.; Lin, Z. Early Hydrogen Station Economics Analysis. World Electr. Veh. J. 2015, 7, 511–517. [Google Scholar] [CrossRef]
  15. Viktorsson, L.; Heinonen, J.T.; Skulason, J.B.; Unnthorsson, R. A Step towards the Hydrogen Economy—A Life Cycle Cost Analysis of A Hydrogen Refueling Station. Energies 2017, 10, 763. [Google Scholar] [CrossRef] [Green Version]
  16. Kim, Y.M.; Shin, D.G.; Kim, C.G. On-Board Cold Thermal Energy Storage System for Hydrogen Fueling Process. Energies 2019, 12, 561. [Google Scholar] [CrossRef] [Green Version]
  17. Li, S.; Guo, J.; Lv, X.; Deng, T.; Cao, B.; Wang, J. Research on High-Pressure Hydrogen Pre-Cooling Based on CFD Technology in Fast Filling Process. Processes 2021, 9, 2208. [Google Scholar] [CrossRef]
  18. Xiao, J.; Ma, S.; Wang, X.; Deng, S.; Yang, T.; Bénard, P. Effect of Hydrogen Refueling Parameters on Final State of Charge. Energies 2019, 12, 645. [Google Scholar] [CrossRef] [Green Version]
  19. Li, J.-Q.; Myoung, N.-S.; Kwon, J.-T.; Jang, S.-J.; Lee, T. A Study on the Prediction of the Temperature and Mass of Hydrogen Gas inside a Tank during Fast Filling Process. Energies 2020, 13, 6428. [Google Scholar] [CrossRef]
  20. Kavadias, K.A.; Kosmas, V.; Tzelepis, S. Sizing, Optimization, and Financial Analysis of a Green Hydrogen Refueling Station in Remote Regions. Energies 2022, 15, 547. [Google Scholar] [CrossRef]
  21. Park, S.; Nam, S.; Oh, M.; Choi, I.; Shin, J. Preference Structure on the Design of Hydrogen Refueling Stations to Activate Energy Transition. Energies 2020, 13, 3959. [Google Scholar] [CrossRef]
  22. NREL. Next Generation Hydrogen Station Composite Data Products: Retail Stations. Available online: https://www.nrel.gov/hydrogen/infrastructure-cdps-retail.html (accessed on 3 February 2020).
  23. Hydrogen Europe. Hydrogen Europe-Strategic Research & Innovation Agenda; Hydrogen Europe: Bruxelles, Belgium, 2019. [Google Scholar]
  24. Tian, Z.; Lv, H.; Zhou, W.; Zhang, C.; He, P. Review on Equipment Configuration and Operation Process Optimization of Hydrogen Refueling Station. Int. J. Hydrogen Energy 2022, 47, 3033–3053. [Google Scholar] [CrossRef]
  25. Li, J.-Q.; Song, B.-H.; Kwon, J.-T. A Cycle Analysis of Flow and Thermal Parameters in the Hydrogen Charging System at the Pressure of 50 MPa. Machines 2022, 10, 461. [Google Scholar] [CrossRef]
  26. Elgowainy, A.; Reddi, K.; Sutherland, E.; Joseck, F. Tube-Trailer Consolidation Strategy for Reducing Hydrogen Refueling Station Costs. Int. J. Hydrogen Energy 2014, 39, 20197–20206. [Google Scholar] [CrossRef] [Green Version]
  27. Reddi, K.; Elgowainy, A.; Rustagi, N.; Gupta, E. Two-Tier Pressure Consolidation Operation Method for Hydrogen Refueling Station Cost Reduction. Int. J. Hydrogen Energy 2018, 43, 2919–2929. [Google Scholar] [CrossRef]
  28. Kuroki, T.; Sakoda, N.; Shinzato, K.; Monde, M.; Takata, Y. Dynamic Simulation for Optimal Hydrogen Refueling Method to Fuel Cell Vehicle Tanks. Int. J. Hydrogen Energy 2018, 43, 5714–5721. [Google Scholar] [CrossRef]
  29. Handa, K.; Oshima, S.; Rembutsu, T. Precooling Temperature Relaxation Technology in Hydrogen Refueling for Fuel-Cell Vehicles. Int. J. Hydrogen Energy 2021, 46, 33511–33522. [Google Scholar] [CrossRef]
  30. Reddi, K.; Elgowainy, A.; Rustagi, N.; Gupta, E. Impact of Hydrogen SAE J2601 Fueling Methods on Fueling Time of Light-Duty Fuel Cell Electric Vehicles. Int. J. Hydrogen Energy 2017, 42, 16675–16685. [Google Scholar] [CrossRef]
  31. Mathison, S.; Handa, K.; McGuire, T.; Brown, T.; Goldstein, T.; Johnston, M. Field Validation of the MC Default Fill Hydrogen Fueling Protocol. SAE Int. J. Altern. Powertrains 2015, 4, 130–144. [Google Scholar] [CrossRef]
  32. Chen, J.; Xiao, L.; Wu, Y.; Gao, X.; Chen, H.; Xie, J.; Shao, S. Dynamic Simulation of the Potential of Integrating a Turbo-Expander in a Hydrogen Refueling Station. Appl. Therm. Eng. 2022, 202, 117889. [Google Scholar] [CrossRef]
  33. J2601_202005; SAE J2601(2020): Fueling Protocols for Light Duty Gaseous Hydrogen Surface Vehicles. Society of Automotive Engineers (SAE): Warrendale, PA, USA, 2020.
  34. Schneider, J.; Meadows, G.; Mathison, S.R.; Veenstra, M.J.; Shim, J.; Immel, R.; Wistoft-Ibsen, M.; Quong, S.; Greisel, M.; McGuire, T.; et al. Validation and Sensitivity Studies for SAE J2601, the Light Duty Vehicle Hydrogen Fueling Standard. SAE Int. J. Altern. Powertrains 2014, 3, 257–309. [Google Scholar] [CrossRef]
  35. Xu, Z.; Dong, W.; Yang, K.; Zhao, Y.; He, G. Development of Efficient Hydrogen Refueling Station by Process Optimization and Control. Int. J. Hydrogen Energy 2022, 47, 23721–23730. [Google Scholar] [CrossRef]
  36. Genovese, M.; Blekhman, D.; Dray, M.; Fragiacomo, P. Improving Chiller Performance and Energy Efficiency in Hydrogen Station Operation by Tuning the Auxiliary Cooling. Int. J. Hydrogen Energy 2021, 47, 2532–2546. [Google Scholar] [CrossRef]
  37. Yu, Y.; Lu, C.; Ye, S.; Hua, Z.; Gu, C. Optimization on Volume Ratio of Three-Stage Cascade Storage System in Hydrogen Refueling Stations. Int. J. Hydrogen Energy 2022, 47, 13430–13441. [Google Scholar] [CrossRef]
  38. Sadi, M.; Deymi-Dashtebayaz, M. Hydrogen Refueling Process from the Buffer and the Cascade Storage Banks to HV Cylinder. Int. J. Hydrogen Energy 2019, 44, 18496–18504. [Google Scholar] [CrossRef]
  39. Luo, H.; Xiao, J.; Bénard, P.; Chahine, R.; Yang, T. Multi-Objective Optimization of Cascade Storage System in Hydrogen Refuelling Station for Minimum Cooling Energy and Maximum State of Charge. Int. J Hydrogen Energy 2022, 47, 10963–10975. [Google Scholar] [CrossRef]
  40. Xiao, L.; Chen, J.; Wu, Y.; Zhang, W.; Ye, J.; Shao, S.; Xie, J. Effects of Pressure Levels in Three-Cascade Storage System on the Overall Energy Consumption in the Hydrogen Refueling Station. Int. J. Hydrogen Energy 2021, 46, 31334–31345. [Google Scholar] [CrossRef]
  41. Caponi, R.; Ferrario, A.M.; Bocci, E.; Bødker, S.; del Zotto, L. Single-Tank Storage versus Multi-Tank Cascade System in Hydrogen Refueling Stations for Fuel Cell Buses. Int. J. Hydrogen Energy 2022, 47, 27633–27645. [Google Scholar] [CrossRef]
  42. Mesa, C.; Forest, L.; Niguel, L.; Motor, T.; Corporation, C.; Ramon, S.; Office, R.; Joaquin, S.; Energy, M.; Coast, W.; et al. Cal State LA Opens Largest US University Hydrogen Station. Fuel Cells Bull. 2014, 2014, 7–8. [Google Scholar] [CrossRef]
  43. Anonymous. Cal State LA Station First in State Certified to Sell Hydrogen to Public. Fuel Cells Bull. 2015, 2015, 8. [Google Scholar] [CrossRef]
  44. Cal State LA Cal State LA Hydrogen Research and Fueling Facility (H2 Station)-Equipment. Available online: https://www.calstatela.edu/ecst/h2station/equipment (accessed on 1 September 2021).
  45. Genovese, M.; Blekhman, D.; Dray, M.; Fragiacomo, P. Hydrogen Losses in Fueling Station Operation. J. Clean. Prod. 2020, 248, 119266. [Google Scholar] [CrossRef]
  46. Genovese, M.; Cigolotti, V.; Jannelli, E.; Fragiacomo, P. Hydrogen Refueling Process: Theory, Modeling, and In-Force Applications. Energies 2023, 16, 2890. [Google Scholar] [CrossRef]
  47. Genovese, M.; Blekhman, D.; Dray, M.; Fragiacomo, P. Hydrogen Station in Situ Back-to-Back Fueling Data for Design and Modeling. J. Clean. Prod. 2021, 329, 129737. [Google Scholar] [CrossRef]
  48. Genovese, M.; Blekhman, D.; Dray, M.; Fragiacomo, P. Multi-Year Energy Performance Data for an Electrolysis-Based Hydrogen Refueling Station. Int. J. Hydrogen Energy 2023, in press. [Google Scholar] [CrossRef]
  49. Genovese, M.; Blekhman, D.; Xie, C.; Dray, M.; Fragiacomo, P. Assuring Pulsation-Free Flow in a Directly Pressurized Fuel Delivery at a Retail Hydrogen Station. Int. J. Hydrogen Energy 2018, 43, 16623–16637. [Google Scholar] [CrossRef]
  50. Piraino, F.; Blekhman, D.; Dray, M.; Fragiacomo, P. Empirically Verified Analysis of Dual Pre-Cooling System for Hydrogen Refuelling Station. Renew Energy 2021, 163, 1612–1625. [Google Scholar] [CrossRef]
Figure 1. Hydrogen Refueling Process Methods.
Energies 16 05749 g001
Figure 2. Blueprint zoom on the circuit for high-pressure buffer tanks.
Energies 16 05749 g002
Figure 3. Pressure (a) and Mass Flow Rate (b) Trends for the Investigated refueling processes.
Energies 16 05749 g003
Figure 4. Temperature Trends for Vehicle Tank (a), Chiller Coil (b), and 70 MPa nozzle outlet (c).
Energies 16 05749 g004
Figure 5. Timeshift and Trend Comparisons for Vehicle Pressure (a), 70 MPa nozzle outlet temperature (b), and Hydrogen Mass Flow Rate (c).
Energies 16 05749 g005
Figure 6. Power Trends for Booster Compressors (a) and Hydrogen Chiller (b).
Energies 16 05749 g006
Figure 7. Specific Energy Consumption and Energy Improvements for the Hydrogen Chiller.
Energies 16 05749 g007
Table 1. Features of the high-pressure buffer tanks at the HRFF.
FeatureDescription
Working Pressure85 MPa
Test Pressure127.5 MPa
MaterialChromium–molybdenum steel, hoop-wrapped using carbon fiber
Water Capacity (nominal, L)50
External Diameter (D) (nominal, mm)256
Length (L) (nominal, mm)1800
Weight (nominal, kg)221
SpecificationsMinimum/maximum allowable temperature: −40 °C–+65 °C
StandardsCylinders for compressed hydrogen (according to ISO 11114-1)
Table 2. Experiment Conditions.
ParameterBT CascadeBC and BT
First Scenario
BC and BT
Second Scenario
Ambient Temperature [°C]23.522.223.0
CoP [-]1.051.071.06
Average Pressure Ramp rate [MPa/min]7.037.37.2
Vehicle Initial Pressure [MPa]13.69.65.5
Vehicle Initial Temperature [°C]8.34.16.3
Initial Chiller Coil Temperature [°C]−34−34.6−35.5
Disclaimer/Publisher’s Note: The statements, opinions and data contained in all publications are solely those of the individual author(s) and contributor(s) and not of MDPI and/or the editor(s). MDPI and/or the editor(s) disclaim responsibility for any injury to people or property resulting from any ideas, methods, instructions or products referred to in the content.

