1. Introduction
The global discourse revolves around the pressing issue of the energy crisis. Urgent measures are required to promote renewable energy sources and emphasize energy recovery from waste recovery and waste reuse, aiming to mitigate the emissions resulting from human activities reliant on fossil fuels. Renewable energy is a rapidly advancing field on multiple fronts. In Europe and Italy, the domain encompassing the energetic valorization of organic waste, particularly through biodigestion plants, has gained significant attention, creating a burgeoning market [
1,
2]. In this context, waste biomass emerges as a viable clean energy source, effectively reducing dependence on fossil fuels [
2,
3,
4,
5,
6,
7,
8]. Anaerobic digestion (AD) technology stands as a method to harness energy from organic waste, transforming the input substrate into a valuable byproduct known as biogas with a high methane content. The adoption of AD for organic waste management has become an established and ecologically sustainable practice, offering an environmentally friendly alternative for waste disposal. The perpetual nature of waste production, strongly correlated with population and quality of life, necessitates ongoing exploration of novel approaches to waste reduction, recycling, reuse, and energy valorization, ensuring waste’s perpetual status as an energy and renewable resource [
9,
10]. Hence, continual advancements in methodologies and technologies are imperative to enhance process and system efficiency, enabling increasingly rational utilization of waste resources.
AD is a biological process that converts organic waste into valuable energy sources while mitigating environmental pollution. This intricate process occurs in the absence of oxygen and relies on a diverse microbial community [
11,
12,
13]. AD involves a series of biochemical reactions that transform organic materials like agricultural residues, food waste, and sewage sludge. It unfolds through a cascade of interconnected biochemical transformations. Central to the process are the methanogenic bacteria, which play a pivotal role in synthesizing methane. Their metabolic activity facilitates the conversion of compounds into methane, leading to the production of biogas—a gas mixture primarily composed of methane and carbon dioxide with trace amounts of other gases like ammonia and hydrogen sulfide [
14,
15,
16]. The composition of biogas is variable, depending on the feedstock and process conditions. Generally, it contains 44% to 69% methane, 29% to 44% carbon dioxide, 0.1% to 13% nitrogen, 0.1% to 3% oxygen, hydrogen sulfide in the range 2–6570 ppmv, and up to 70 ppmv of ammonia [
16]. The AD process is sensitive to factors such as temperature, pH, organic loading rate, and substrate composition, all of which influence its performance.
The overall process can be modeled by a unique process, described by the Buswell reaction [
17,
18,
19,
20], as reported in expression (1).
Starting from the organics seen as a molecule of , treated by means of a stoichiometric quantity of water , structures such as molecules of methane, carbon dioxide, ammonia, and hydrogen sulfide are produced according to the stoichiometric quantities reported in reaction (1).
Understanding the intricacies of this process is essential for optimizing biogas production and managing organic waste effectively, leading to sustainable resource recovery and environmental benefits [
21,
22].
AD plants have gained significant attention as sustainable solutions for the generation of biogas and biomethane from organic waste materials. The resulting biogas can be harnessed as a renewable energy source. Moreover, through additional purification processes, biomethane with a high methane content can be obtained, making it suitable for injection into natural gas grids or as a transportation fuel [
23,
24,
25]. The implementation of AD plants not only helps in waste management by converting organic waste into valuable energy resources but also contributes to greenhouse gas reduction and the transition to a circular economy. However, challenges such as feedstock variability, process optimization, and digestate management need to be addressed to maximize the efficiency and environmental benefits of AD plants.
The AD process involves two main types of reactors [
26]: continuous mode and batch mode. Continuous-mode reactors are continuously or semi-continuously fed, with the average time that the substrate remains in the reactor known as the hydraulic residence time (HRT). These reactors can be either single-stage, where all process phases occur simultaneously in one reactor, or two-stage, where a primary reactor handles continuous feeding and all reactions while a secondary volume acts as a sludge thickener. On the other hand, batch processes involve loading fermenters and typically consist of a single-step operation. Batch reactors offer several advantages over continuous processes, including system flexibility and ease of expansion. Additionally, the presence of multiple fermenters reduces the risk of complete system failure in the event of individual unit malfunctions. Reactors are further categorized based on operating temperatures: psychrophilic (below 20 °C), mesophilic (20–40 °C), and thermophilic (above 40 °C) systems. Another classification considers the characteristics of the substrate, particularly its moisture and solid content. Wet digestion refers to substrates with less than 10% total solids; dry digestion involves substrates with more than 20% dry matter; and semi-dry digestion occurs when the solids content ranges between 15 and 20%.
Generically, a biogas plant that utilizes organic waste as feedstock exhibits distinct sections, all of which are appropriately depicted in the block diagram presented in
Figure 1. This diagram aligns with the hierarchical organization of sections and departments within the plant, providing a clear representation of its structure.
In brief, a typical AD plant is described as follows:
Section 1: This is essentially the reception section, where waste is received through transportation means. During the pretreatment phase, unwanted elements are removed to ensure the formation and preparation of the subsequent substrate to be fed into the central processes that involve pretreatment and actual biodigestion;
Section 2: This section houses the core processes. In the pretreatment block, the substrate is also preheated to gently thermally prepare the biomass. This block is dedicated to substrate preparation, where waste undergoes homogenization. In the subsequent block, anaerobic digestion takes place, where the organic matter is degraded into biogas through specific systems. This process is aimed at energy production, either in the form of electricity or heat, or the production of biomethane, which can be injected into the natural gas infrastructure after suitable upgrading methods;
Section 3: In this section, all postprocessing activities take place, such as dehydration of digested sludge, accelerated biostabilization, post-maturation for obtaining compost that can be used as a potential fertilizer, and refinement processes. Refinement involves the recovery of any metals, disposal of inert materials, and conversion of combustible fractions into Refuse-Derived Fuel (RDF). Additionally, the storage of products and residues occurs, which will be directed towards final disposal.
Currently, there is a noticeable upward trajectory in the utilization of solid-state anaerobic digestion plants, specifically focusing on dry-type processes. Dry-type AD systems are gaining increased applicability compared to the previous prevalence of wet-type systems. This shift is supported by several factors, including comparable productivity between the two types and the ability of high digestate viscosity to keep plastics and sands suspended, resulting in a less complex and costly pretreatment system compared to wet plants. Moreover, the dry matter output from dry-type AD lends itself well to blending with structuring matrices during the initiation of aerobic treatment, leading to additional economic benefits and energy recovery.
Further research and technological advancements are essential to enhance the overall performance, economic viability, and scalability of AD systems for biogas and biomethane production.
1.1. Noteworthy Data from the Literature
The section presents some useful information derived from research and review articles, as well as reports highlighting the significance of biogas and biomethane technology and its future perspective. This section specifically focuses on the European context. From the data analysis, it emerges that Europe is particularly attentive to the energy valorization of organic waste.
In recent years, Europe has witnessed a substantial rise in the number of biogas plants [
27]. Concurrently, there has been a significant surge in the production of biomethane, aligning with the progress of the biogas sector. In Europe alone, biomethane production experienced a remarkable 40% increase in 2016. The upgrading processes involved in converting biogas to biomethane have garnered increasing attention, both in Europe and Italy, owing to the numerous benefits associated with their utilization. These benefits include enhanced income generation derived from agricultural and agri-food activities. The advancement of biomethane production is further facilitated by incentive policies that ensure long-term growth and provide investment security. This favorable landscape has fostered the development and expansion of biomethane projects in the region.
The paper by Scarlat et al. [
28] offers a comprehensive examination of the progress of biogas-derived energy within the European Union (EU). Driven by renewable energy policies and motivated by economic, environmental, and climate advantages, biogas production in the EU has witnessed a substantial increase. By 2015, biogas production had reached an impressive 18 billion m
3 of methane (equivalent to 654 PJ), accounting for half of the global biogas production. Furthermore, the EU has emerged as the global frontrunner in biogas-generated electricity, boasting over 10 GW of installed capacity and a total of 17,400 biogas plants. In contrast, global biogas capacity in 2015 stood at 15 GW. It is also noteworthy that approximately 50% of the biogas consumption in Europe during that year was allocated to heat generation. Additionally, Europe has positioned itself as the leading producer of biomethane for transportation purposes and injection into the natural gas grid. In 2015, there were 459 biomethane plants producing 1.2 billion m
3 of biomethane, alongside 340 plants contributing to the gas grid with a capacity of 1.5 million m
3. Moreover, the availability of 697 biomethane filling stations facilitated the utilization of 160 million m
3 of biomethane as a transport fuel in 2015.
The proliferation of biogas has been driven by two primary factors: the implementation of supportive policies and the abundance of available feedstock. The European Commission’s introduction of the Green Deal, which aims to achieve climate neutrality by 2050, plays a pivotal role in promoting various initiatives for clean energy generation [
29]. The substantial availability of feedstock further solidifies anaerobic digestion as a highly favored method for energy production. Europe stands as the leading global biogas producer, with crop biomass (8 Mtoe) and animal manure (6 Mtoe) currently contributing significantly to the region’s substantial biogas output. Comparatively, municipal solid waste (3 Mtoe) and wastewater (1 Mtoe) make a relatively smaller contribution to the overall biogas production in Europe.
Germany holds the dominant position as the primary market for biogas infrastructure in Europe, housing a significant two-thirds of the region’s biogas plants. According to the IEA report for 2020 [
10], Germany boasts an impressive installed power generation capacity of 6.2 GW. A potential avenue for substantial future expansion lies in the process of upgrading biogas to biomethane. At present, about 30% of biogas, which is predominantly utilized for energy and cogeneration purposes, undergoes upgrading to biomethane before being blended into the gas grid. This biomethane is also extensively employed as a transport fuel, while finding application in buildings for cooking and heating purposes.
Bioenergy satisfies approximately 10% of the global energy demand, with biogas and biomethane collectively accounting for around 3% of the total bioenergy consumption. However, the utilization of biomass waste holds immense potential for the generation of clean gas. Biogas and biomethane can serve as valuable feedstock for the production of blue hydrogen, thereby facilitating the realization of negative emissions. Detailed analyses indicate that by 2050, all biomethane could be transformed into zero-emission renewable gas. Projections suggest that the supply of biomethane could rise to 370 TWh by 2030, eventually reaching an impressive 1170 TWh by 2050. Accomplishing this target would necessitate the establishment of approximately 30,000 large-scale biogas production facilities, as outlined in the Gas for Climate report of 2020 [
30].
In conclusion, through a substantial analysis of the existing literature in the sector, it emerged that there is a lack of studies focused on energy efficiency measures in existing biogas and biomethane production plants, as well as interventions aimed at their conversion or upgrading. The prospect of acting on this gap appears evident, thus contributing to research and, therefore, to improvement in the fields of resource rationality and system efficiency.
1.2. Contribution and Scope
In accordance with the consideration anticipated in the previous paragraph, the primary objective of this study is to enrich the current scientific literature by providing insights and perspectives regarding the operational efficiency of anaerobic digestion plants. The specific focus is to establish meaningful benchmarks for assessing plant performance, as conventional plant designs often rely on practical and empirical approaches. Hence, this research aims to stimulate critical reflection and enhance the understanding of AD plant operations.
In this scientific paper, we present a comprehensive investigation focused on enhancing the energy efficiency of a biomethane production plant. This study encompasses a redesign approach for specific sections of the plant, aimed at improving the overall energy dynamics within the system. To establish a robust foundation for the research, an extensive review of the existing literature is conducted, drawing upon a wealth of bibliographic resources to delineate the current state-of-the-art in the field. Building upon this knowledge, we applied fundamental thermophysical principles and power plant laws as the theoretical framework for the redesign efforts. Additionally, to provide a visual representation of the energy improvement achieved, commercial CAD software was utilized to generate a detailed rendering of the primary thermal provision conduit. This rendering serves to effectively illustrate the precise locations and methods employed for realizing the energy enhancement within the plant. Through this comprehensive methodology, we aim to present a holistic and scientifically rigorous exploration of optimizing energy efficiency in the context of biomethane production.
This study originated from a collaborative effort with the company Waste to Methane (W2M), which designs and manages biomethane production plants. W2M is a pioneering entrepreneurial venture situated in Rende—Cosenza, Italy, which originated from the concept of transforming organic waste sorted by Calabra Maceri & Servizi into valuable and environmentally friendly biomethane. The Calabra Maceri & Servizi enterprise deals with the management of municipal solid waste and is responsible for delivering direct services to approximately 500,000 individuals. Their operations encompass a range of facilities, including material recovery plants dedicated to recycling and reusing, a landfill, an eco-district, and a composting facility. Inside, a biomethane production plant is installed, which feeds gas into the SNAM national gas network. It handles the processing of approximately 950 tons of waste per day, ensuring that at least 80% of the waste undergoes recovery processes. Within their biomethane production plant, they process 50,000 tons of organic fraction annually, injecting approximately 4,200,000 Sm3 of biomethane into the SNAM network each year. Furthermore, the plant yields approximately 8000 tons of high-quality compost annually. Consequently, the focus of this research centers around the redesign and methodology for implementing energy efficiency measures specifically tailored to the aforementioned biomethane production plant.
2. Materials and Methods
The “Materials and Methods” section of this paper encompasses a comprehensive investigation into enhancing the energy efficiency of a biomethane production plant. The study entails a redesign approach targeting specific sections of the plant to improve overall energy dynamics. To establish a solid foundation, an extensive review of the relevant literature was conducted to assess the state-of-the-art in the field. Consequently, the initial phase of the methodology revolves around an extensive exploration of the bibliographic landscape and the existing literature within the field. This endeavor encompasses materials of the utmost relevance and quality, akin to those typically found in esteemed international journals. In order to conduct a thorough bibliographic search, prominent search engines such as the Web of Science, Scopus, and Google Scholar were utilized. This process involved sifting through a multitude of recent papers that have garnered scientific attention in the field, taking into account the evolving trend of citations.
The second part pertains purely to the energy analysis of the main thermal sections, devoted to understanding the thermal needs. Therefore, reference is made to the scientific methods of thermal engineering for energy definition. Thermophysical principles and power plant laws are employed as the theoretical framework for the redesign efforts, leveraging established scientific principles to optimize energy utilization. During the execution of this phase, the materials employed draw upon well-established laws and principles, forming the foundation of this study. The computational tools employed encompass a range of conventional electronic calculators, spreadsheets, and simulation software, which serve as aids in implementing energy models. These resources facilitate the analysis, processing, and interpretation of data, allowing for a comprehensive exploration of the energy dynamics within the system.
Additionally, commercial CAD software is employed to create a detailed rendering of the primary thermal provision conduit, visually representing the specific locations and methods used to achieve energy enhancement within the plant. This comprehensive methodology aims to provide a rigorous and holistic exploration of energy efficiency optimization in the context of biomethane production.
The methodologies and organization of the work performed are shown in the diagram in
Figure 2 below, according to the phases of study and bibliographic research, study of the problem, technical analysis, and design calculations.
Figure 3 provides a comprehensive breakdown of the analyses and calculations involved in the study. Starting from the core section of the biomethane production plant, which encompasses the anaerobic reactors, pretreatment, and feeding tank, careful evaluation of the thermal powers required becomes paramount. These evaluations serve to characterize the technical fluids and determine the sizing and calculation of service components and supply lines. Notably, the sizing of tube bundles plays a crucial role in ensuring efficient heat exchange within the volumes. Subsequently, the sizing of the heat generator and pumping systems for the technical fluid follows, enabling informed decision-making when selecting components available in the market. These technical assessments and dimensioning processes form essential elements of the study, facilitating a comprehensive understanding of the plant’s operational requirements.
3. Sections and Plant Layout
This paragraph provides a comprehensive analysis of the plant’s sections and layout in the biomethane system. The processes involved can be categorized into nine distinct phases, some of which play a central role while others provide auxiliary support:
Phase 1: Waste Delivery and Weighing: Upon the arrival of vehicles, a meticulous documentary verification of the Waste Identification Form, which contains information about the waste type, is conducted, followed by subsequent radiometric control. Subsequently, the waste delivered to the plant undergoes precise weighing and accounting procedures;
Phase 2: Unloading and Storage of Waste: The waste is unloaded in a dedicated storage and pretreatment shed, which comprises key elements such as a tank for temporary storage of the organic fraction of municipal solid waste and a specialized accumulation tank for internal process and washing water drainage. Additionally, an intake and air exchange circuit are established to ensure proper ventilation within the facility;
Phase 3: Shredding of Organic and Green Waste: A preliminary pretreatment line is implemented to eliminate the non-compostable inert fraction from the waste stream. This process involves the utilization of a screening section, followed by the deployment of sorting machines to effectively separate the inert materials present in the waste;
Phase 4: Pretreatment Tank: Within this tank, the waste undergoes a process of homogenization facilitated by a mixer, while pre-heating is accomplished through a coil that circulates hot water. This pretreatment ensures that the substrate being sent to the digesters is thermally prepared for the AD process, minimizing any thermal shock to the bacteria and enabling rapid attainment of the desired operating temperature. The tank has a capacity of 110 tons per day. Adjacent to the pretreatment tank is the feed tank, which serves the dual purpose of substrate storage and ensuring a continuous feed to the two reactors for a steady-state period of two days;
Phase 5: Substrate Loading, Anaerobic Digestion, and Unloading: The material from the feed tank is evenly distributed into the two digesters through a piston system capable of pumping at a rate of 0.2 ton·s−1. The pumping process is meticulously timed and occurs discreetly over a 24 h period. During the unloading phase of the exhausted material, an extraction pumping system is employed, comprising two pumps, one for each digester. These pumps are also engaged in the recirculation of the material, facilitating the overall process of substrate loading, anaerobic digestion, and subsequent unloading.
Anaerobic Digestion System: To ensure an efficient process, it is fundamental to maintain continuous feeding and optimal homogenization of the prepared substrate. Achieving process continuity involves introducing and extracting material at opposite points within the digester. Within the digesters, a movement/mixing system is implemented to facilitate slow and consistent mixing of the mass, ensuring optimal stripping of biogas and uniform distribution of substrate temperature. Furthermore, this mixing action prevents the formation of deposits on the bottom and surface crusts, guaranteeing the absence of sedimentation and precipitation phenomena. To maintain the required process temperature, similar to the feed tank, a tube bundle is integrated into the digester wall. This tube bundle receives water at a specific temperature from the thermal power plant and the heat recovery area. The upper part of each reactor is designed to store a portion of the biogas produced, which is then connected to a pressure-operated accumulator through a dedicated pipeline;
Phase 6: Biogas Extraction from the Digester: The biogas generated during the AD process is collected in the upper section of the digester, which incorporates a well-designed over- and under-pressure system. Two gasometers, each with a volume of 115 m3, are situated in the upper part of the digester. Ensuring the quality of the biogas is of paramount importance, so continuous monitoring takes place. Key parameters such as carbon dioxide (CO2), methane (CH4), oxygen (O2), and hydrogen sulfide (H2S) are regularly analyzed. As the biogas exits the digester, it undergoes an initial treatment to separate the condensates. This involves passing through a dedicated tank equipped with a hydraulic seal, and a biogas venting system is also implemented to address any potential blockages. The biogas leaves the digester at a pressure range of 20 to 25 mbarg. Estimated biogas production reaches approximately 20,500 Nm3·day−1;
Phase 7: Biogas Treatment Plant: The postprocessing of biogas involves a series of essential steps aimed at achieving dehumidification, desulfurization, and upgrading. The primary objectives of these steps are the elimination of particulate matter and moisture, as well as the reduction of H2S, known to be a dangerous compound that causes acid attacks on energy recovery systems. To achieve these objectives, specialized systems are employed, including the biological desulfurization system integrated within the digester itself. This apparatus facilitates the oxidation of hydrogen sulfide present in the anaerobic digester through autotrophic microorganisms from the thiobacilli family that exist within the biomass. These microorganisms enzymatically degrade hydrogen sulfide by utilizing molecular oxygen, effectively converting the unwanted by-product into sulfuric acid, water, and elemental sulfur. Additionally, the gas treatment plant incorporates a scrubber tower and a cooling system to efficiently remove particulate matter. The following reactions occur during the sulfur compound removal processes: (a) 2H2S + O2 → 2S + 2H2O; (b) H2S +2O2 → H2SO4; and (c) 2S + 3O2 + 2H2O → 2H2SO4.
Biological desulfurization within the digester is achieved by controlled ambient air insufflation, offering a cost-effective and dependable method to substantially reduce H2S levels (30–40%) within the reactor itself. This process not only addresses hydrogen sulfide removal but also facilitates the removal of ammonia. The biogas then undergoes an initial purification treatment outside the anaerobic digester using a water washing technology, commonly known as a scrubber. The scrubber, designed as a stainless steel washing tower, enables contact between the biogas and the washing liquid/reagent, facilitating the efficient removal of contaminants. It incorporates a packing material composed of plastic fillings to maximize the contact surface area between water and biogas, thus enhancing the transfer of H2S and particulate matter into the liquid phase. To further enhance biogas quality, a dehumidification unit is employed to extract water vapor. This unit utilizes a shell and tube exchanger, where the biogas is cooled to 4 °C by circulating glycol water maintained at a low temperature via a refrigeration unit. Subsequently, an activated carbon filter is utilized to convert H2S into elemental sulfur. As a safety measure, a torch is installed, which automatically ignites in the event of a malfunction or gas circuit shutdown triggered by a high-pressure alarm;
Phase 8: Biomethane Upgrading: Within the system, an upgrading section is dedicated to producing biomethane that meets the stringent requirements set by the national distribution network. This upgrading system encompasses several key components, including a biogas compressor, activated carbon pretreatment for reducing H2S concentration to 10 mg·Nm−3, a membrane section, and a control room. Once compressed to the desired operating pressure, the gas undergoes cooling for drying and the removal of ammonia. The compression process employs a multi-stage system with intermediate cooling and heat recovery, allowing for an operating pressure of up to 16 bar. This pressure level ensures the ability to overcome pressure losses along lines, surpassing the necessary 12 bar pressure required for entry into the SNAM network. To eliminate CO2, a membrane-based process is employed due to its ease of installation and operational reliability. Biogas upgrading membranes consist of materials that selectively allow the passage of carbon dioxide, water, and ammonia while retaining hydrogen sulfide, oxygen, and nitrogen if present in high concentrations;
Phase 9: Aerobic Treatment and Composting: The concluding stage of the process focuses on the treated material extracted from the digester. After exiting, this material contains a significant amount of ammonia, and it takes nearly three weeks to reach a stable state.
Figure 4 presents a simplified diagram of the biomethane production plant, emphasizing the key energy processes. This diagram succinctly captures and summarizes the previously mentioned and discussed phases of the process. In the figure, the core process flow (both energy and mass) is expressed, as are the main control lines devoted to measuring and monitoring the temperatures. An essential element within the system is the heat generator, which is responsible for supplying heat to the technical fluids. Its primary function is to ensure the thermal requirements of the processes, promoting their efficient and effective operation.
4. Energy Analysis and Sizing
Energy analysis and section dimensioning are fundamental aspects of the design and operation of a biomethane plant. Energy analysis involves assessing the energy inputs and outputs of the plant, examining the efficiency of the biogas production process, and identifying opportunities for energy optimization. This analysis helps in understanding the overall energy balance, maximizing process efficiency, and minimizing energy losses. On the other hand, section dimensioning focuses on determining the appropriate size and capacity of each section of the plant. Accurate section dimensioning ensures optimal performance, proper flow management, and efficient utilization of resources within the plant. By combining energy analysis and section dimensioning, operators can enhance the sustainability and profitability of a biomethane plant while minimizing environmental impact.
Accurate determination of energy rates is of utmost importance for quantifying the required thermal power necessary to sustain the energy processes. The sizing of different sections and components, including hydraulic circuits in delivery and return lines, tube bundles in heat exchangers, coils, heat transfer fluid handlers, and the heat generator itself, relies on an accurate energy analysis. This analysis is vital to ensuring optimal performance and efficiency throughout the system.
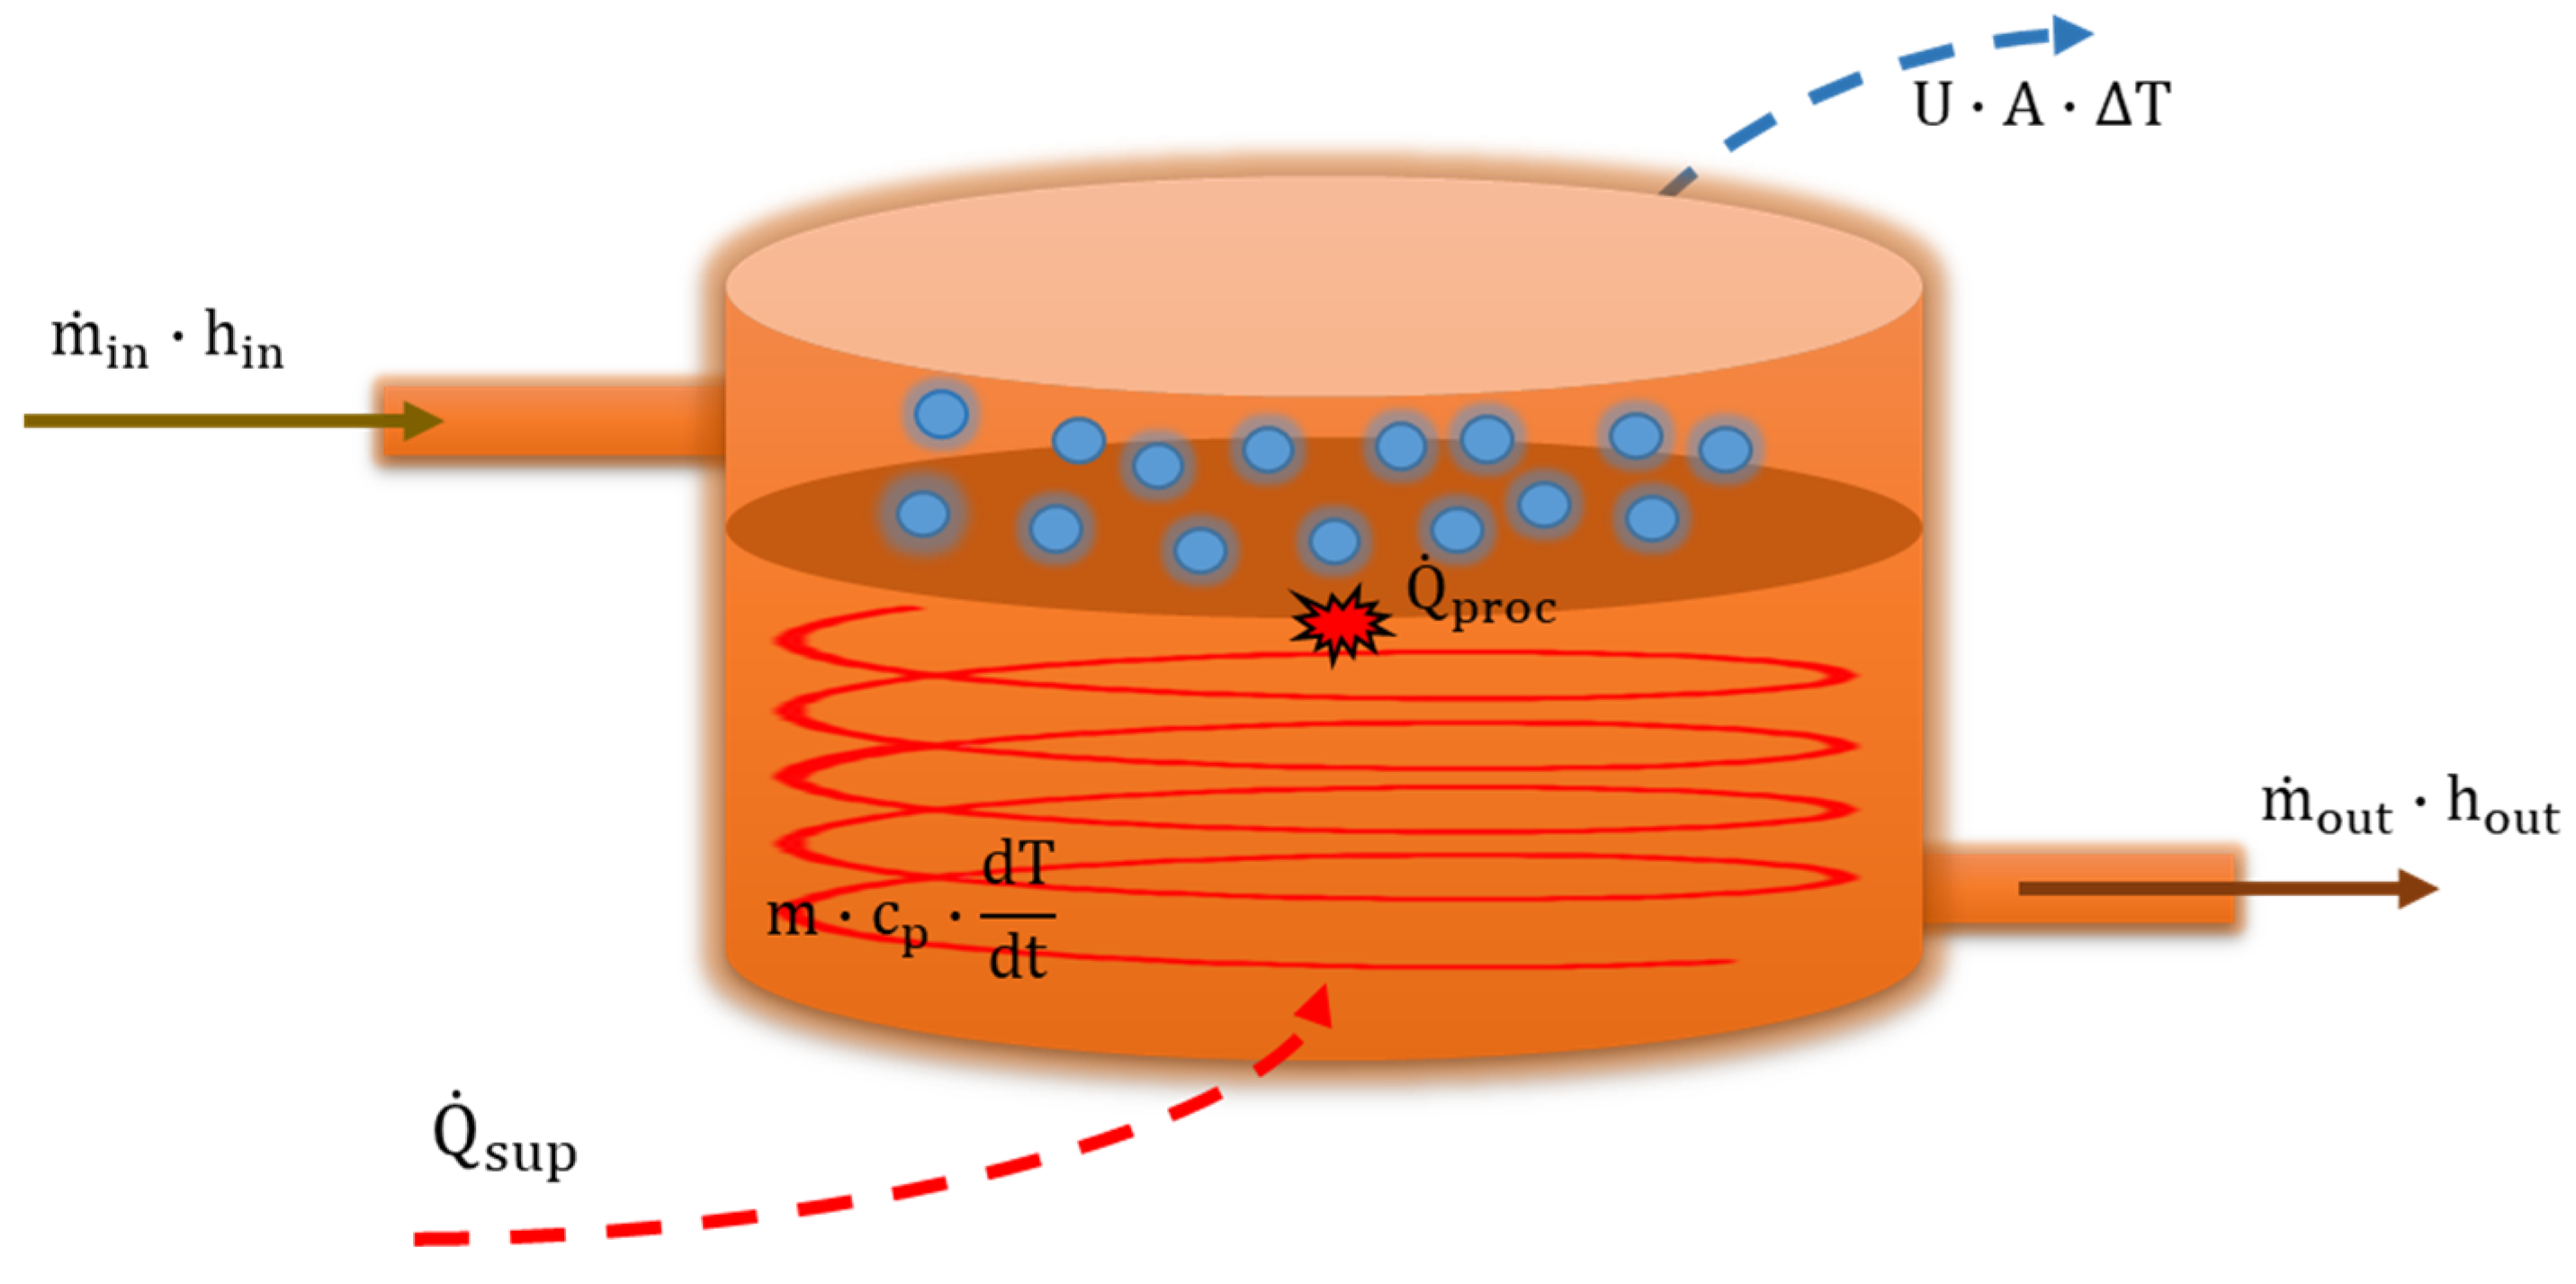
The cornerstone equation is presented in equation set (2) and serves as a guiding principle to determine the required thermal power,
, to be supplied to the system. This equation encapsulates the underlying concepts depicted in the illustrative diagram in
Figure 5.
The equation takes into account the enthalpy contributions associated with the incoming and outgoing flow of organic substrate, potential process heat (whether required or generated), and the thermal interaction with the external environment.
and
are the input and output powers associated with the various contributions, as the enthalpy energies of the flow rates (
and
), to the thermal supply (
), the possible thermal power generation (
), and to the heat exchange (
). In the equations,
represents the flow rate,
and
represent the thermal transmittance of the structure, and
the temperature difference in the heat exchange.
Hence, the approach to calculating the thermal power required for the system is shown in expression (3). In this expression, the steady-state nature of the process is considered, incorporating the heating of the organic substrate flow to the designated process temperature as per the established literature guidelines. Additionally, the rate of thermal dissipation into the surroundings is taken into account. It is important to emphasize that certain papers in the literature mention heat generated as a result of the biochemical processes occurring during anaerobic digestion [
31,
32,
33]. While the overall process is generally considered endothermic according to thermodynamic principles, some authors argue that internal heat generation should be considered. Poland [
31] states that energy released during conversion of the waste substrate released as heat during normal digestion is not sufficient to overcome heat losses from the system. The more exothermic response is attributed to the accumulation of volatile acids. Lindorfer et al. [
32] assert that the self-heating has to be traced back to microbial activity, although this issue is difficult to investigate. Luo et al. [
33] write in their paper that self-heating of lignocellulosic biomass has been reportedly observed when degraded under anaerobic conditions. This is also confirmed by the interviews conducted with managers of AD plants [
32]. This heat rate is difficult to investigate, even if observed. However, the above considerations justify the inclusion of the term
, which represents the internal heat generation.
Heat dissipation: The first energy rate considered in the energy balance pertains to heat dissipation occurring within the process tanks and along the pipelines. This rate accounts for the thermal power that needs to be supplied in order to compensate for the heat losses that arise between the internal environment (through walls) and the external surroundings. Determining this contribution involves considering several factors, such as:
- ■
Geometric properties and material composition of the equipment;
- ■
Average daily temperatures at the site;
- ■
Inlet temperatures of the fluid streams in different sections;
- ■
Temperature difference (ΔT) across the water in tube bundles and heat exchangers.
Calculating thermal dissipation relies on well-established thermal engineering formulas. A graphical representation of the thermal stratigraphy helps to construct the thermal model, as reported in
Figure 6. In equation set (4), the general thermal model is presented, highlighting the dispersed thermal power in room-to-room heat exchange, denoted as
. This power is determined by the thermal resistances (
) and, consequently, the thermal transmittance (
) of the stratigraphy.
in the equation set (4), the other symbols h, L, r, and λ, represent, respectively, the convective coefficient, length, radius, and conductive coefficient.
Thermal power requirement: signifies the energy flow necessary to ensure the attainment and sustenance of the desired process temperatures, which can be calculated using the widely recognized thermodynamic Equations (5) and (6):
in the equations, the variable “k” denotes the kth element or process. The power is determined using two distinct approaches intrinsic to the process itself, namely: based on the flowing flow rate, denoted as
or based on the mass contained and administered within k, referred to as
, over a specific time interval
. Additionally,
represents the temperature difference derived from the design considerations.
is the specific heat capacity of the fluid.
Thermal power required to heat the biomass within a 4 h cycle: Is determined based on the initial loading condition. This instruction serves as the starting point for the process. At the entrance of the pretreatment tank, the organic fraction prepared is expected to have a temperature of 10 °C. Therefore, heating the pretreatment tank involves raising its temperature to 35 °C. As for the biodigesters, the substrate leaving the pretreatment tank is considered, which means it is already close to the tank’s temperature. It then undergoes a further temperature increase of 9 °C to reach the desired anaerobic process temperature of 44 °C. The expression for calculating the thermal power required to heat the incoming substrate flow within the scheduled 4 h cycle (
) is formulated as given in expression (7).
Power required for thermal support of biomass: Since the fresh mass is continuously introduced, a plant engineering practice involves providing continuous heat when the process ambient temperature exceeds the cooling delta T of 1 °C,
. Expression (8) reports this contribution. In the startup phase, in addition to the biomass loading scheduled for the period
, the biomass to be loaded and heated is evaluated by considering the filling of the total volume of the process environment (
):
. Here, cr represents the filling coefficient.
Determination of flow rates and diameters: the flow rate (
) is calculated using the well-known thermodynamic expression derived from thermal power,
, as in (9).
The sizing is carried out using the well-known flow rate formula, as in expression (10), where ‘c’ represents the fluid velocity, ‘
’ is the mass density, and d is the diameter of the tube.
Sizing of tube bundles: the number of coils,
, relating to the room r
j is calculated using the formula as in (11).
The subscript tub,j refers to the pipe of tube bundle j. In the expression (11) represents the thermal transmittance, and the term is the perimeter of the room rj. , represents the average logarithmic average temperature in the exchanger.
Sizing of circulators: The sizing and selection of circulators are performed using the hydraulic methodology outlined in the set of Equations (12)–(15), taking into account the Bernoulli Equation (12) for incompressible fluids (written within the sections i and j), along with the computation of the necessary pressure losses (
) along the lines. The distributed pressure losses
, whose calculation depends on the diameter,
, type of material and quality of manufacturing processing,
, and the friction factor,
, as well as the length, L (calculated either through the Colebrook (14) correlation or using the Moody Chart—where Re is the Reynolds number), are determined using the well-known hydraulic formula (13), together with the concentrated losses
(15), based on the concentrated loss factor
. In Equation (12)
represents the hydraulic head of possible hydraulic machinery, z is the geodetic elevation, p is the gauge pressure, and c is the fluid velocity.
5. Settings
This paragraph presents the analysis parameters, showcasing the geometric attributes of the process environments (e.g., pipes, pre-tanks, and biodigesters) as well as the thermophysical properties of the fluids and materials involved. It includes flow rates, tank and digester specifications, volumes of the environments, and substrate masses within the process volumes.
Table 1 provides a comprehensive overview of these values. Further information will be progressively revealed during the analysis and comprehensively discussed in subsequent sections.
Further useful information on properties inherent to anaerobic digestion, such as energy flows and mass, can be found in [
34,
35,
36]. Concerning the self-heating rate, therefore, it seems likely to adopt a value around 3% of the thermal power possessed by the biomethane produced, according to [
31,
32].
6. Results: Energy Supplies and Dimensioning Sections
This paragraph conveys the focus on the outcomes obtained in terms of energy supplies and the dimensioning of various sections within the biomethane plant.
Understanding the external temperature is of paramount importance in energy analysis since it directly impacts the performance of energy systems. By incorporating external temperature data, energy analyses can accurately assess energy requirements. By considering external temperature patterns, energy analyses can optimize energy management strategies such as adjusting setpoints, scheduling operations, and implementing weather-dependent control algorithms. Therefore, the monthly average temperature data for the area of Cosenza, where the biomethane plant is located, are plotted in
Figure 7 for the purposes of the analysis. The graph collects the temperature data, considering the profiles of average temperatures, minimum average values, maximum average values, and minimum and maximum absolute values [
37].
The average data profile unveils a seasonal temperature range, with January exhibiting a minimum of 8.1 °C and July reaching a maximum of 26 °C. Notably intriguing is the historical record of an absolute minimum temperature of −10 °C, documented in January 1942, while July 1973 witnessed an exceptional high of 45 °C. Indeed, these temperatures have been increasingly prevalent in these latitudes, as the peak temperatures during the months of July and August routinely surpass 40 °C, frequently nearing remarkable peaks of approximately 43–44 °C. Although the analysis and sizing are typically predicated on average data, it is essential to acknowledge the likelihood of encountering extreme scenarios. Subsequent paragraphs will delve into the elucidation of analysis methodologies and section-specific sizing for the plant, shedding light on these aspects comprehensively.
6.1. Pretreatment Tank
In order to better highlight the design procedure, each section is reviewed, paying attention to the individual elements that contribute to the calculations. In this phase of energy optimization, this becomes mandatory, especially in the absence of initial data to rely on.
Thermal dispersion: the thermal dispersion is calculated based on data related to the construction’s stratigraphy, which, unlike the biodigester, is not insulated but solely made of reinforced concrete (with a thermal conductivity coefficient, λ, of 2.3 W·m−1·K−1 and a thickness, L, of 0.5 m).
- Side walls: In order to calculate the thermal transmittance, it is necessary to consider both the internal and external thermal resistances, Rsi and Rse, which are provided in tables (depending on the direction of the heat flow) in the UNI EN ISO 6946 standard per unit of surface area. The values derived from this reference indicate Rsi and Rse values of 0.13 and 0.04 m2·K·W−1, respectively. Therefore, the total resistance value is given by: , where corresponds to the resistance associated with the wall material, reinforced concrete. From this expression, the thermal transmittance, , can be derived.
- Roof slab: a similar stratigraphy to that of the side walls is assumed, with the only difference being the choice of internal and external convective resistance values for the upward heat flow direction.
- Subgrade floor: It is also necessary to calculate the resistance for the subgrade floor, which combines the resistance of the reinforced concrete base, Rca (According to the UNI EN ISO 6946 standard, the Rca values must be multiplied by a correction factor of 0.45), with that of the perlite and vermiculite layer, Rpv. The reference for the coefficients related to the subgrade floor is UNI 10351. This standard provides thermal conductivity coefficients of 0.73 W·m−1·K−1 and 0.73 W·m−1·K−1, respectively, for the reinforced concrete base and the perlite and vermiculite sublayer, with thicknesses of 0.1 m and 0.2 m, respectively. The total resistance value is given by: .
Once the resistance values are known, the thermal dispersion can be calculated as shown in Equation (16).
In the previous expression, the thermal transmittances are highlighted for the side walls, , subgrade floor, , and roof slab, . represents the temperature of the pretreatment tank, the ground temperature, and the ambient temperature.
The calculations resulted in a thermal transmittance value of 2.58 W·m−2·K−1 for the side walls, 0.27 W·m−2·K−1 for the subgrade floor, and 2.8 W·m−2·K−1 for the roof slab.
Considering the ambient temperature and the monthly average temperature values derived from the UNI 10349 standard, the contributions of thermal power dispersion during the months of the year are calculated.
Thermal power supply: It is important to consider that the thermal power supplied to the pretreatment tank should ensure the treatment of the substrate mass within the volume, which needs to be maintained at a constant and optimal temperature of 35 °C.
Figure 8 presents a graphical representation of the annual thermal contributions for the pre-tank, correlated with average external temperatures. It is observed that the heat requirements are lowest during the summer months, while the highest thermal support is required in January and December. The thermal losses along the supply pipes are almost negligible compared to other factors, whereas the heat losses within the treatment volume fluctuate between approximately 13 kW and 4 kW. During warmer months, the reduced temperature gradient between the process and the surroundings aids in retaining heat. This results in a fluctuating thermal power requirement ranging from 157 kW to 53 kW to heat the biomass and counteract heat loss.
Furthermore, it should be noted that the calculations take into account a daily mass of 110 quintals of organic substrate, which is continuously fed every 4 h and then distributed to the two downstream biodigesters.
6.2. Biodigesters
The biodigesters play a central role in the conversion of organic matter into biogas, serving as a pivotal section in the transformation process. Operating at an optimal temperature of 44 °C, the insulation phase assumes paramount importance in ensuring the uniform distribution of heat within the substrate mixture, thereby promoting thermal homogeneity throughout the digestion process.
Thermal dispersion: In this instance, we consider a specific stratification design aimed at minimizing heat dissipation towards the external environment. The insulation employed incorporates preformed sheets of sintered expanded polystyrene containing graphite particles, in accordance with the EN 13163:2013 standard. For our investigation, we utilized the GK800 A+ insulation product. Similar to the previous scenario, we proceeded to determine the thermal transmittance values for the side walls, roof slab, and ground-contacted floor. To perform these calculations accurately, it is essential to have prior knowledge of the convective heat transfer coefficient within the biomass, which influences the internal resistance. Additionally, the external convective heat exchange coefficient with ambient air is assumed to be 20 W·m−2·K−1.
Upon completing the proactive calculations, the thermal transmittance values for the side walls, floor, and roof are obtained. The resulting values indicate a thermal transmittance of 0.33 W·m−2·K−1 for the side walls, 0.27 W·m−2·K−1 for the floor, and 0.6 W·m−2·K−1 for the roof.
Thermal dispersion of the adduction line: An accurate assessment of thermal dispersion in the adduction section leading to the biodigester from the pretreatment tank is basic. As the biomass enters the digester, it experiences a gradual temperature decrease caused by heat dissipation into the surroundings. Therefore, to determine the precise temperature of the organic substrate at the biodigester inlet and gain insights into the thermodynamics of this pivotal section, it is essential to consider the pipe’s geometry, stratigraphy, thermophysical properties established during the design phase, and external thermal conditions.
To elucidate the thermal characteristics of the aforementioned pipe,
Figure 6 can be recalled to understand the modeling framework reported in equation set (17). These equations explicitly account for internal resistance
, pipe material resistance
, insulation resistance
, and external resistance
. By integrating these terms, a comprehensive analysis of thermal dispersions within this section is conducted, offering valuable insights into the biodigester’s thermotechnical aspects, which form the cornerstone of the entire energy plant:
The following properties are chosen for the adduction section in question: length 10 m, pipe internal diameter 0.1079 m, pipe external diameter 0.1143 m, pipe thermal conductivity coefficient 16 W·m−1·K−1, insulation thickness 0.052 m, insulation thermal conductivity coefficient 0.036 W·m−1·K−1.
The thermal dispersion in the adduction section from the pre-tank to the biodigesters is 136 W when calculated in the worst conditions of an external air temperature of −10 °C.
Thermal power supply: By determining the flow rates for each biodigester and establishing the desired temperature for the AD process, it becomes possible to calculate the thermal power requirement. This entails considering two key factors: the power needed to heat the incoming biomass and the power necessary to maintain its heat throughout the process.
A process environment filling factor of 0.75 is taken into account in these calculations. The daily input of organic substrate, denoted as , amounts to 55 tons per day, while the discharge rate is set at 50 tons per day for each biodigester. It should be noted that the 110 tons per day processed by the pretreatment tank are distributed equally between the two biodigesters. The reactors operate at a temperature of 44 °C.
To ensure accuracy, the calculations incorporate the heat loss experienced by the substrate during its journey through the adduction section. However, this loss is deemed insignificant. Nevertheless, the temperature of the biomass upon entering the biodigesters can be determined using the following expression: .
It is important to highlight that, in the field of plant engineering practice, the calculation of preserving thermal power follows an on/off mechanism based on the cooling of the substrate mash by 1 °C, similar to the pre-tank. As fresh substrate is introduced, the temperature tends to decrease. Therefore, assuming a continuous supply of moist biomass, the external heat supply must also be continuous.
Figure 9 presents a graphical representation of the thermal power trends. This includes the dispersion from the supply pipe, the dispersion within the reactors themselves, the preserving power, and ultimately, the total required thermal power. In January, the total thermal power reaches 64 kW and gradually decreases to 58 kW during the summer season. The graph provides an overview of the dynamic changes in thermal power throughout the year.
6.3. Input Thermal Power Calculation
With all the necessary data at hand, the next step involves assessing the overall thermal power, including the specific power to be provided by the new heat generator. The outcomes of these calculations are depicted in
Figure 10, where the results are graphically presented. This visual representation provides an understanding of and analysis of the system’s heating requirements.
Upon examination of the graph, it becomes evident that the required thermal power exhibits a varying pattern, ranging from a peak of 232 kW in January to a minimum of 115 kW in July. This information serves as a foundation for selecting the appropriate boiler system. However, to make an informed decision, it is essential to consider the boundary conditions. In this context, the thermal power values are derived by considering different thermal scenarios corresponding to the external ambient temperature. The comprehensive results of these calculations are presented in
Figure 11. These insights contribute significantly to the decision-making process when determining the optimal boiler configuration.
Considering the self-heating rate occurring inside the anaerobic reactors, the required thermal power is within the range 89–205 kW.
The calculations are carried out both in the worst conditions, assuming that the outside air temperature is considered to be at an all-time low of −10 °C, and as before, considering the average monthly variability.
The analysis of the figure reveals two distinct curves that illustrate the system’s thermal power requirements under limited conditions. These curves represent the upper and lower limits of the thermal power demands. Under the most extreme cold weather conditions, the system necessitates a maximum thermal power of approximately 320 kW. Conversely, during the most extreme hot weather conditions, the system’s thermal power requirement decreases significantly to around 9 kW. These findings provide valuable insights into the system’s performance across a range of temperature extremes, aiding in the development of appropriate strategies for maintaining optimal thermal operations.
7. Flow Rates and Diameters in the Distribution Network
In pursuit of energy process optimization, it becomes imperative to undertake a comprehensive assessment of the thermal energy distribution network. This involves redefining the network itself by recalibrating the flow rates of the heat transfer fluid and determining the appropriate pipe diameters.
Evaluation of water flow rate: Calculations for water flow take into account the following assumptions:
- ■
The thermal input power is based on worst-case scenarios;
- ■
A temperature difference (ΔT) of 5 °C is assumed for the water at the heat exchangers, with an inlet water temperature of 65 °C;
- ■
The temperature of the external environment is evaluated under extreme conditions.
The results indicate a flow rate of 2.68 kg·s−1 (9.63 m3·h−1) for the pretreatment tank and 5.69 kg·s−1 (20.49 m3·h−1) for the biodigesters. Notably, due to larger volumes and higher thermal demands, the circulation of water in the biodigesters is more than double that of the pretreatment tank.
Pipeline sizing: To ensure the efficient transportation of water and maintain the required process temperature, careful consideration is given to the sizing of pipes distributed across various environments. It is important to determine an appropriate velocity range that avoids issues such as erosion, excessive noise, and significant pressure losses. A velocity range of 1 to 2 m·s−1 is selected as a suitable criterion.
To choose the commercial pipe diameter closest to the calculated result, reference is made to a table outlined in the recognized standard (UNI EN 10224) for commercial steel pipes. This table provides information on the internal diameter and thickness of both welded and seamless pipes.
For the pipe connecting the pretreatment tank to the individual biodigesters, the analytical calculation yielded an internal diameter of 71 mm. As this exact value is not listed in the reference table, the nearest diameter is selected. Adhering to a precautionary approach, the next larger diameter is chosen. In this case, a DN 60–65 welded pipe is selected. According to the table, this pipe has an internal diameter of 70.3 mm (very close to the calculated 71 mm) and a thickness of 2.9 mm.
A similar assessment was conducted for the pipe section downstream of the boiler, which resulted in an internal diameter of 122 mm from the calculations. Consequently, a DN 125 pipe is chosen, providing an internal diameter of 132.5 mm and a thickness of 3.6 mm.
Following these determinations, the number of tube bundle rows is calculated to facilitate the transfer of the thermal power supplied to the pretreatment tank and biodigester environments.
Inizio modulo.
- Tube bundles: the tube bundle system comprises a series of stainless steel tubes (type 304), carefully selected for their ability to withstand temperature variations, erosion, acid corrosion, and pressure fluctuations. Through the application of the designated methodology, the calculations have determined the specific requirements for the tube lengths in both the pretreatment tank and the individual biodigester. The pretreatment tank necessitates a total pipe length of 115.44 m, divided into five coils. Similarly, the single biodigester requires an organized pipe configuration spanning a length of 365 m and also consisting of five coils. The choice of type 304 stainless steel material ensures long-term performance and reliability, as it possesses the necessary characteristics to endure the demanding operational conditions of the thermal energy plant. By employing this robust and corrosion-resistant material, the tube bundle system is poised to deliver efficient heat transfer and maintain the integrity of the overall system.
- Pipeline Sizing: heat generator—pretreatment tank and heat generator-digester sections: In a similar manner to the aforementioned approach, the sizing of the pipeline sections between the heat generator and the pre-tank, as well as between the heat generator and the digesters, follows a systematic procedure. Once the flow rates have been determined, the selection of an appropriate commercial diameter becomes fundamental. In both sections, a DN 100 diameter is chosen to meet the required specifications. However, it is essential to consider any potential thermal dispersion that may occur in these pipeline segments.
To enhance the overall efficiency of the system, particular attention is given to the sizing of the adduction pipeline while incorporating significant insulation measures. The insulation material assumes a pivotal role in this context. The thickness of the insulation is determined based on the thermal conductivity coefficient and the external diameter of the pipe. For the DN 100 diameter selected, the relevant standard provides a range of insulation thickness options between 40 mm and 84 mm. In this specific case, an insulation thickness of 52 mm is deemed appropriate, resulting in a thermal conductivity coefficient of 0.036 W·m−1·K−1. If further reduction of thermal dispersion is desired, increasing the insulation thickness is an option, albeit with associated cost implications.
The sizing of these pipeline sections, combined with the strategic insulation implementation, contributes to optimizing the system’s energy efficiency and minimizing heat losses during fluid transportation.
8. Choice and Sizing of Pumps
Once the calculations for pipe sizing, encompassing flow rate and diameter, have been completed, the next step involves appropriately sizing the circulators responsible for ensuring the smooth flow of the heat transfer fluid through the delivery and return lines in the process environments. In this context, the focus is on two circulators, each dedicated to a biodigester. As part of an effort to enhance overall system efficiency, the circulators are redefined to optimize the second phase’s heat transfer fluid supply lines.
- Selection of Circulators for Upstream Line: To determine the sizing and selection of the circulators, a hydraulic methodology incorporating the set of Equations (12)–(15), including Bernoulli’s equation for incompressible fluids, is employed. This methodology facilitates the calculation of pressure drops occurring within the lines by considering concentrated head losses resulting from valves, gate valves, sudden changes in section, pipe curvature, and distributed losses caused by viscous friction.
For the pipeline connecting to the biodigesters, a total of 20 bends at 45° with a value of k = 0.32 and 30 curves at 90° with a value of k = 0.6 are taken into account. A fluid velocity of 1.45 m·s−1 is considered. The hydraulic circuit’s length is determined using CAD plans of the available company spaces, enabling the selection of the most suitable trajectories. These lines are then meticulously redefined, designed, and visualized using appropriate software, as discussed in a subsequent paragraph. The total pressure loss resulting from the sum of the aforementioned contributions is calculated to be 12.68 m.
A CM-GE 65-1680/A/BAQE/3 T MCE30/C IE2 pump has been chosen (C: circulator; M: 4-pole motor; G: version with coupling; E: motor complete with inverter; 65: nominal diameter; 1680: maximum head [cm]; A: cast iron impeller; BAQE: type of seal, etc., and other specific information supplied).
- Selection of circulator for downstream line: In the process of choosing the main pump responsible for the return flow from the lines and back to the boiler, the entire water flow rate is carefully considered. Sizing considerations also encompass the following sections: the boiler-hydraulic separator section and the hydraulic separator-circulator section. Within these sections, various elements leading to concentrated losses are taken into account. These include 5 bends at 45° with a corresponding value of k = 0.32, 5 bends at 90° with a value of k = 0.6, and 5 concentric reductions with a value of k = 0.35. By considering the length of the return line, a total head loss of 5.62 m is calculated.
Following a similar procedure to the previous steps, the CM-GE-890/A/BAQE/1.5 T MCE30/C IE2 pump is selected as the appropriate choice for this application.
9. Heat Generator Selection
Continuing with the improvement measures, once the flow rates of the heat transfer fluid and the associated line sizing and fluid handlers are determined, the focus shifts to the redefinition of the heat generation system, which is responsible for delivering thermal energy. Energy considerations point towards the utilization of a condensing boiler, fueled by methane, as an optimal choice for the specific scenario. This kind of boiler exhibits high energy efficiency, employing advanced technologies that maximize heat output while minimizing gas consumption. The key components of such a boiler include: (1) the burner, responsible for heating the water; (2) the heat exchanger, facilitating the transfer of heat as cold water enters and hot water exits; (3) the gas supply unit for the burner; (4) the circulator, ensuring the circulation of heated water throughout the system; and (5) the expansion tank, designed to accommodate the expansion of hot water.
The selection of the appropriate boiler is determined based on the values derived from the previous assessments, specifically focusing on the total useful thermal power of the system. In the most unfavorable scenario, considering an external ambient temperature of −10 °C, the boiler sizing necessitates a minimum capacity of 320 kW. However, commercially available options tend to align with values in close proximity to the calculated requirement. Accordingly, a RAVASIO boiler from the 350 category is chosen.
To ensure a more comprehensive analysis, accounting for monthly temperature variations as outlined in the UNI 10,349 standard, it is observed that the average maximum thermal power demand is approximately 233 kW, occurring in January. Consequently, a category 300 (
https://www.schede-tecniche.it/schede-tecniche-caldaie/RAVASIO-scheda-tecnica-caldaia-MDL-70-300.pdf (accessed on 29 June 2023)) boiler is deemed a suitable compromise between typical operating conditions and extreme scenarios. The selected boiler model exhibits the following technical specifications: (1) boiler category: 300; (2) thermal efficiency: 98.2%; (3) labelable power range: 44–300 kW; (4) useful thermal power (max on LHV): 294.6 kW; (5) efficiency class: A; (6) working pressure (max–min): 6–1 bar; (7) maximum water delivery temperature: 85 °C; and (8) fuel: natural gas, specifically methane.
Gas Consumption in the Boiler
In this phase of enhancing energy efficiency, it is important to focus on the fuel gas consumption of the boiler () and assess the corresponding economic implications, whether the gas is procured externally or generated on-site as biomethane. Additionally, it is essential to evaluate the level of self-consumption in the case of internal gas supply, considering the plant’s role as a biomethane producer.
To ascertain the volumetric flow rate (
), the widely recognized formula prescribed by the UNI CIG 7129 standard, which incorporates the thermal efficiency of the boiler (
), is employed. This formula (18) serves as a reliable means to calculate the flow rates accurately.
is the mass density of the fuel, while
is its low heating value.
is the thermal power generated.
The existing boiler currently possesses a nominal power rating of 400 kW. Consequently, based on the recent calculations, it becomes evident that the boiler’s size is excessive. To determine the impact and value of the internal improvements in terms of resizing, the potential savings in methane gas consumption and the corresponding cost reductions are assessed below. This technical examination is conducted under the assumption that all thermal demands are met by the boiler and that the operational parameters align with the specifications outlined in the reference datasheets of both systems. The analysis is conducted over an annual timeframe. Simultaneously, the cost of methane required for energy production within the plant is determined by consulting the ARERA website (Regulatory Authority for Energy, Networks, and the Environment), considering the prevailing conditions during the calculations (2022 pre-war Russia–Ukraine conflict). The outcomes of this assessment are illustrated in
Figure 12, providing valuable insights into the economic implications.
Considering a methane price of EUR 0.8793 per Nm3 (pre-crisis Russia–Ukraine), in the post-intervention phase, the plant needs an annual supply of 164,000 Nm3 of methane for a cost of EUR 144 k.
10. Rendering of Thermal Power Lines
In order to complement the analysis of energy efficiency, a visualization process of the thermal power lines is subsequently undertaken. As previously mentioned, the CAD plans of the company spaces available are utilized to select the most suitable paths. The design of the distribution network encompassing the delivery and return pipes is carried out using AutoCAD software. Additionally, Inventor software is employed to support the design of the hydraulic circuits and various components defining the sections of the system that underwent efficiency improvements in the preceding sections. Subsequently, a graphic representation of the piping is created. To accurately assemble the components, specific 3D formats are sourced from appropriate graphic libraries.
The visual depiction in
Figure 13 provides a comprehensive overview of the system layout and highlights the arrangement of key components. It showcases the rendering of a piping section and manifolds, with numbered annotations as follows: (1) input/output manifold; (2) electric pump for biodigester 2; (3) electric pump for biodigester 1; (4) deaerator; (5) hot water flow meter; and (6) temperature sensor, (7) radial connection temperature gauge.
Figure 14 presents a visual representation depicting the layout of the boiler room, with corresponding numerical annotations. The numbers denote the following components: (1) boiler; (2) 500 L expansion tank; (3) DAB CM GE 80890 electric pump; (4) Bolly 500 XL heat exchanger; and (5) hydraulic separator, which serves to establish independent hydraulic circuits.
11. Analysis of Heat Recovery from the Compression Section
To enhance the comprehensiveness of the efficiency assessments, an additional consideration is made regarding the potential heat recovery from the biogas compression phase. As previously mentioned, the biogas undergoes compression to achieve optimal conditions for the injection of upgraded biomethane into the gas network. From a circular economy standpoint, this possibility aligns with the exploration of various avenues for energy generation from waste. In this context, the focus is on investigating the recuperation of thermal energy derived from the cooling fluids utilized in crucial stages.
The heat recovery process is intimately linked to the compression process itself, denoted as
, and its inherent irreversibilities, denoted as
. Moreover, there is an opportunity to recover thermal power from the sensible heat present in the compressed gas upon exiting the compressor (
). The methodology for recovering heat from the compression stages is reported in equation set (19), whereby the gas temperature in output is also determined.
in the equation set,
,
,
,
,
,
, and
, have the following meanings, respectively: biogas mass flow rate, compressor efficiency, isoentropic coefficient, universal gas constant, molecular weight of biogas, inlet temperature, and compression ratio.
,
, and
have the following meanings, respectively: heat recovery efficiency, reference temperature, and gas-specific heat.
is the temperature of the gas entering the heat exchanger.
However, the heat effectively recovered must account for the portion of heat dissipated through the district heating pipeline. Therefore, in this phase, it is necessary to design the supply and return circuits, taking into consideration the physical constraints and obstacles within the company premises. Through the examination of the ground plans, it was determined that a district heating network spanning 300 m is required to transport the thermal fluid from the compression section to the reactors. By considering the geometric properties of the district heating network and appropriately arranging the thermophysical components suitable for this purpose (such as selecting the appropriate piping and insulation), an engineering thermal model is established. This model evaluates the outlet temperature of the thermal fluid and, consequently, the actual amount of recovered heat that is transferred to the processes.
The employed compression solution involves the use of an oil-lubricated rotary screw compressor with the following specifications: model UVG 250 (
https://www.adicomp.com/wp-content/uploads/2022/10/2019_10-Brochure-BVG-UVG-EN_light.pdf (accessed on 29 June 2023)), working fluid: biogas, power: 250 kW, maximum pressure: 16.5 bar, and flow rate: 1400 Nm
3·h
−1. According to the compressor’s data sheet, it is indicated that up to 80% of the generated thermal power can be recovered. This recovery is achieved through the implementation of a suitable heat exchanger to transfer the heat to water, maintaining the desired temperature for the application. The water is then directed through the pipes, flowing towards the boiler room. Within the boiler room, temperature sensors are used to analyze whether the thermal fluid exhibits temperature gradients below the predetermined thresholds. Subsequently, the fluid is utilized to heat the biomass, and the water is introduced into the heating circuit of the system. For this purpose, the supply duct from the compressor to the boiler is sized based on the AustroPUR insulation system.
The characteristics of the supply line are as follows: a Pe-Xa type pipe with a thermal conductivity (λ) of 0.1967 W·m−1·K−1, a length of 300 m, an internal diameter of 0.0408 m, and a thickness of 0.0046 m. The pipe is insulated with two layers: the first layer is PUR insulation with a density of 60 kg·m−3 and a thermal conductivity of 0.022 W·m−1·K−1, and the second layer is XPE insulation with a density of 30 kg·m−3 and a thermal conductivity of 0.04 W·m−1·K−1. The external diameters of the insulation layers are 0.15 m and 0.2 m, respectively.
Using the formulas outlined in the energy-analysis section, the thermal performance of this intervention is calculated. The total thermal resistance of the system is determined to be 0.0309 K·W−1. Subsequently, the heat loss rate is calculated, taking into account the appropriate burial of the pipe. The thermal model verifies the supply of water at a temperature of 65 °C, considering a flow temperature of approximately 70 °C.
At this stage, the potential heat that can be effectively utilized is evaluated. By considering the technical and geometric characteristics of the pipe bundle that flows in correspondence with the digesters, the rate of thermal power to be supplied is calculated using the previously discussed formulation. The results of the analysis indicate that heat recovery from the compressor could provide a thermal power of 165 kW, significantly reducing the thermal load that would need to be supplied by the boiler. These findings are illustrated in
Figure 15, which highlights the net thermal power allocated to the boiler. It can be observed from the figure that the boiler is not used for approximately 6 months, and during peak moments, it is assigned approximately 68 kW. Considering the self-heating rate, the maximum thermal power to provide becomes about 42 kW while the boiler is not used for 7 months.
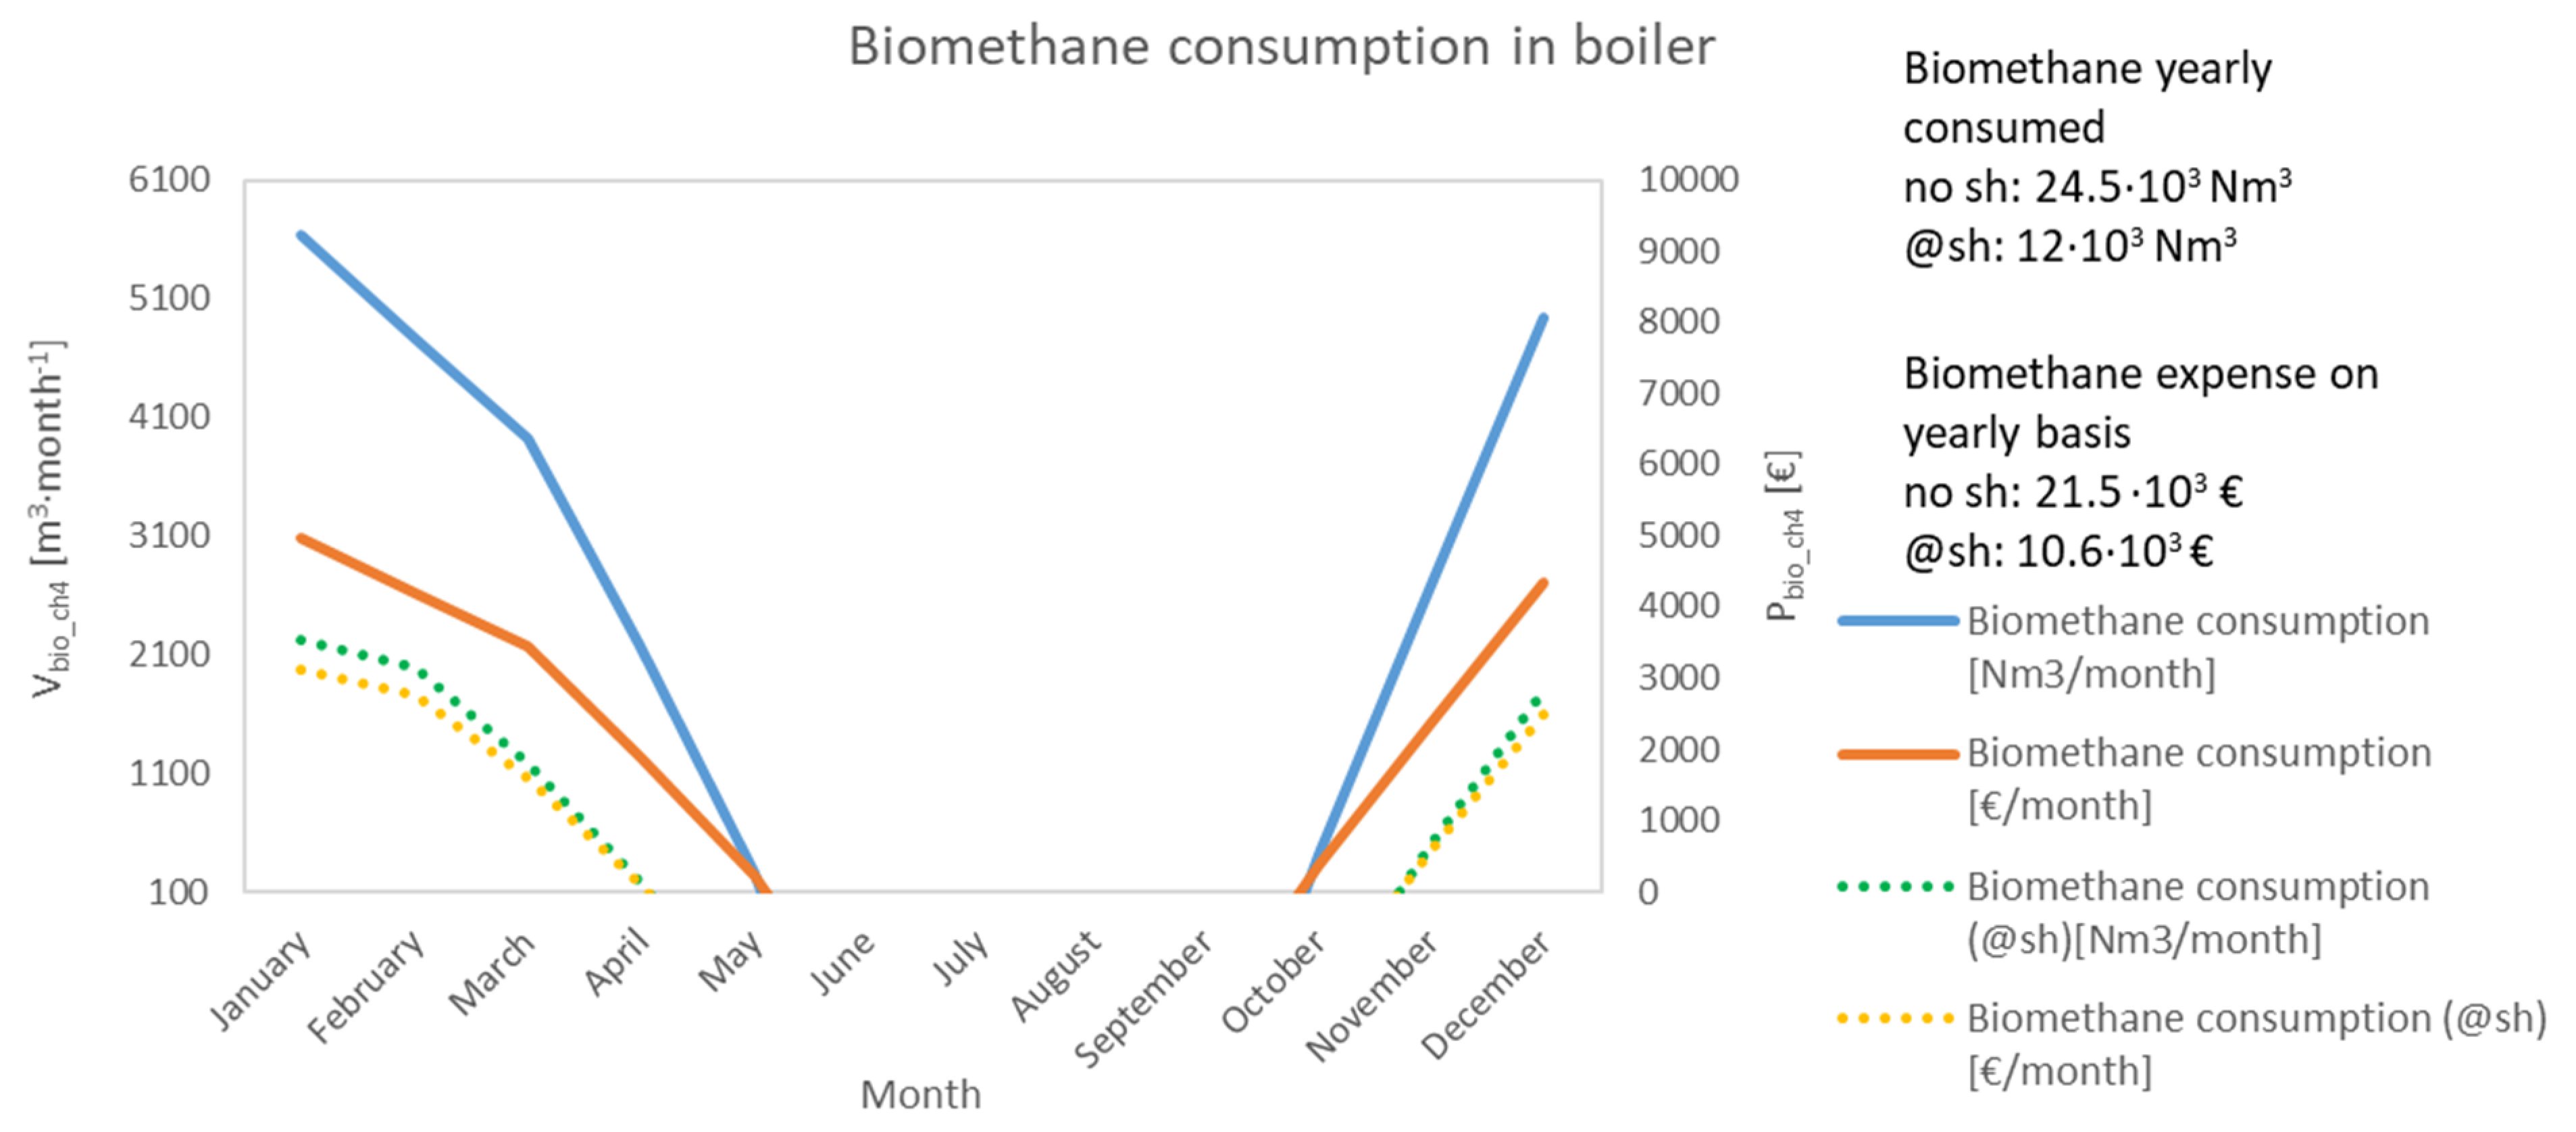
Contextually, methane consumption and its corresponding expenditure are computed. During the peak period, the boiler requires a methane flow rate of approximately 6000 Nm
3·month
−1, as illustrated in
Figure 16. With the recent efficiency intervention, the annual methane consumption has been reduced to 24,500 Nm
3, resulting in a cost of approximately EUR 21500. Considering the self-heating rate occurring during the anaerobic processes, the annual methane consumption is about 12,000 Nm
3, for an expense of approximately EUR 10600. This efficiency-enhancement intervention generates annual savings exceeding EUR 133000.
12. Conclusions
This paper investigated an existing biomethane production plant regarding the oversizing encountered in specific lines and components. Therefore, methodologies and calculations were employed to address this challenge and improve the energy efficiency of the system.
Special attention was directed towards the boiler-distribution-pre-tank line and the boiler-distribution-digesters line. Notably, evaluations were conducted on the pretreatment tank and digester sections, focusing on determining the required heat input for maintaining optimal process temperatures. These assessments revealed that the utilized boiler could be characterized by a lower nominal power, while the possibility of employing a condensing boiler was also explored, offering improved functionality, energy efficiency, and cost savings. Furthermore, the selection and evaluation of the tube bundle involved designing a distribution network within the various environments with the optimal number of rows to achieve the desired biomass temperature. In the case of the pretreatment tank and digesters, a reduction from the existing six coils to five was deemed sufficient, leading to additional cost savings by eliminating unnecessary piping. Moreover, the choice of components extended beyond the boiler and encompassed an assessment of circulation components for the technical fluid. These selections were made based on comprehensive evaluations of load losses, employing a more realistic and accurate methodology as opposed to simplified considerations commonly employed.
The thermal analysis conducted revealed that the anaerobic process and associated facilities required thermal power ranging from 89 kW to 205 kW throughout the year. As a precautionary measure, a 300 kW thermal boiler was deemed suitable, representing a reduction of 100 kW compared to the original project choice. Another significant energy efficiency intervention involved harnessing heat recovery from the biogas compression section, responsible for pressurizing the gas for integration into the national natural gas network. This additional measure contributed an extra 165 thermal kW, significantly alleviating the overall thermal system. Following this intervention, it was observed that the boiler was utilized for approximately 4–5 months, providing a peak thermal power of approximately 42 kW. The annual methane consumption in the boiler was estimated to be around 12,000 Nm3, resulting in an expenditure of approximately EUR 10600. The redesign intervention focused on enhancing energy efficiency led to annual savings exceeding EUR 133000.
Completing the redesign process, the final step involved rendering the thermal power lines in order to have a graphical visualization. Through targeted analyses and improvements in thermal management, the overall efficiency of the supplementary energy processes was significantly enhanced. The implementation of enhanced biomethane processes and the corresponding facilities enables the effective utilization of established energy techniques to produce energy in alignment with a sustainable global framework.

 ,
, 


