Abstract
A periodic pigging operation performed to clean off sediment and provide operators with detailed health information for a pipeline is mandatorily required. The research on pigging-induced issues for the steel catenary riser (SCR), one of the key parts in offshore hydrocarbon recovery pipelines between the floating production system and the seabed, has been scarce until now. As a result, there is an urgent need for theories to guide the pigging operation to ensure safe pigging is achieved in deepwater risers. In this paper, a study aiming to determine the effects of the pigging impact load and the pigging-induced slugging load on the dynamic response of the riser is reported. A SCR pigging model was established and proposed based on the finite element analysis (FEA) method. The stress distribution and displacement of the SCR were investigated under the pigging conditions, with the consideration of the effects of waves, currents, and floating platform movements. It was found that the pigging load has large effects on the stress and displacement of the touchdown zone (TDZ), especially the touchdown point (TDP). The displacement of the TDZ in the Y (vertical) direction is more significant than that in the X (horizontal) direction under pigging conditions, and the maximum displacement of the TDZ in the Y direction is proportional to the weight of the pig, as well as the length of the pigging-induced slugging.
1. Introduction
The use of pipelines is the most economic and efficient method of offshore oil and gas transportation. It is crucial to maintain oil and gas transportation pipelines with sound integrity and high efficiency. However, impurities such as wax and hydrates can build up after the long-term operation of the pipeline, leading to flow assurance issues. The flow line integrity can also be another major concern due to the corrosion and erosion that occurs in the pipe walls. To mitigate the issues above, a periodic pigging operation, which cleans off these sediments and provides operators with detailed health information for a pipeline, is mandatorily required.
A flexible riser such as a steel catenary riser (SCR) is frequently encountered in deepwater production systems, including as a connection between the floating production storage and offloading (FPSO) system and the production lines [1]. The SCR is joined via a sag bend section to a flow line that is placed on the seabed, and the touchdown point is the boundary between it and the SCR [2], as shown in Figure 1. The heave–pitch motions of the floating platform and the random motion of the waves can cause alternating movements of contact and separation between the touchdown zone (TDZ) of the riser and the seabed. This reciprocating motion often generates a large bending stress on the TDZ, leading to a high risk of fatigue damage [3,4]. Pigging of the SCR, especially the TDZ, in such conditions will increase the risk of riser failure and becomes a very tricky problem.
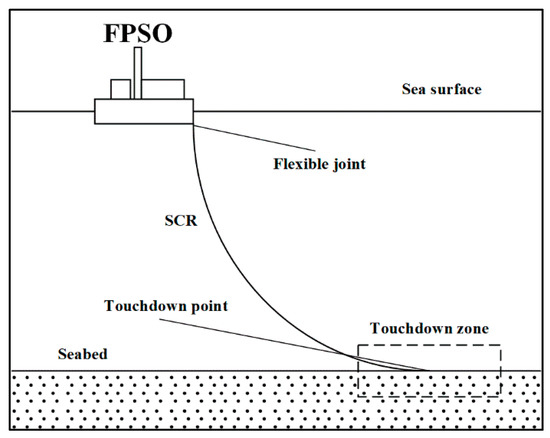
Figure 1.
Schematic diagram of the SCR structure.
Most of the early studies on steel catenary risers were based on experiments and can be divided into two categories, which are full-scale experiments and small-scale experiments. Furthermore, 2H Offshore Engineering maybe was the first company to investigate the interactions between the soil and pipes in the TDZ of a steel catenary riser with a full-scale model experiment [5]. Full-scale experiments can have advantages when simulating the actual conditions. However, they are impractical to carry out due to their high cost and time-consuming nature. The relatively low cost of small-scale experiments allows the flexibility to conduct more extensive experimental analyses and to also ensure a level of repeatability. Hodder and Byrne [6] conducted an indoor three-dimensional large-scale model test to investigate the groove formation mechanism. Elliott et al. [7,8] explored the pipe–soil interaction mechanism between a steel catenary riser and seabed by using a centrifuge model. It was found that groove formation can reduce the pipe bending stress and tensile stress so that the riser fatigue life can be improved. An experimental investigation was conducted by Gao et al. [9] to express the dynamic response of vortex-induced vibration on a flexible riser with helical strakes. Wang et al. [10] conducted an indoor large-scale model experiment and investigated the response of a truncated SCR under top vessel motion. Yao et al. [11] carried out a small-scale three-dimensional experiment in a water tank to obtain the stress variations in the pipeline under different types of top riser motion. Bai et al. [12] developed a test device based on an SCR scaled model to study the effects of the excitation frequency and seabed stiffness on the riser motion. Yu et al. [13] proposed a novel experimental platform to conduct dynamic loading tests on a truncated model steel catenary riser (SCR) within the touchdown zone (TDZ).
The development of the finite element method has made numerical simulations an important means of investigating deepwater risers. Finite element software programs such as ABAQUS, ANSYS, and ORCAFLEX can provide great convenience for research on SCR. Li and Low [14] studied the effects of the low-frequency motion of ships on the fatigue response of a steel catenary riser at the touchdown point. Guo et al. [15] established a hybrid truncated model of a deepwater riser and the reliability of the model was proven by finite element simulation and experimental tests. Shiri [16] investigated the effect of the formation of a seabed trench on the fatigue resistance of steel catenary risers. Yang and Xiao [17] revealed the non-linear dynamic responses of a top-tensioned riser (TTR) under the combined action of multi-frequency parameter excitation and vortex excitation. Elosta et al. [18] studied the influence of a submarine trench and geotechnical parameters on the dynamic response of a semi-submersible integrated riser. Dong and Sun [19] discussed the fatigue damage of an SCR in the touchdown zone based on the plastic seabed. Thorsen et al. [20] studied the fatigue damage from a time domain simulation under the combined effects of in-line and cross-flow vortex-induced vibrations. Bai et al. [21] took the pipe–soil interaction effect into consideration and studied the dynamic response of an SCR via numerical simulation. Kim and Kim [22] compared the dynamic behaviors of a traditional steel catenary riser and lazy-wave steel catenary riser under the same deepwater conditions. Zhang et al. [23] presented a parametric instability analysis of a top-tensioned riser (TTR) considering the variations in tension along the length. Gong and Xu [24] investigated the effects of pipe–soil interactions on the dynamic characteristics of a deepwater S-type riser under random sea conditions. Wang et al. [25] proposed a non-linear dynamic model for a characteristic analysis of an SCR under pipe–soil contact by using the Aqua module in ABAQUS. Sun et al. [26] investigated the static and dynamic characteristics of an SCR under an irregular seabed using a finite element method. Dong and Shiri [27,28] studied the node response and overall response of a non-linear contact model of a steel catenary riser with the seabed. Liu and Guo [29] studied the effects of the riser’s internal flow and wave current on the dynamic response of an SCR based on the slender model. Liu [30] proposed a method involving bypass pigs to mitigate the influence of severe slugging on the pigging process, and focused on the slug flow characteristics in the effects of the inlet mass flow rates and pig bypass fractions. Lucile et al. [31] proposed a framework for the design of SCRs, which has the potential to simplify the estimation of the SCR fatigue life within the touchdown zone. A dimensional analysis of SCR behavior was conducted to facilitate sensitivity analyses of any given parameters that govern SCR behavior.
The researches cited above were mainly focusing on the dynamics and fatigue damage analyses of the riser regarding the effects of environmental loading and platform or FPSO system movement. However, studies on the effect of the pigging loads, including the pigging impact load and the pigging-induced slugging, on the dynamic response of the riser are rare, and there are still many problems that must be solved in order to ensure a safe pigging operation being achieved in deepwater risers. Particularly, there is an urgent need for theories to guide the pigging operation [32].
In order to evaluate the pigging risks under different conditions, a steel catenary riser pigging model was established. The stress distribution and displacement of the SCR, especially the TDZ, were numerically investigated under pigging conditions with the combined action of waves, currents, and floating platform movements.
2. Materials and Methods
2.1. Model Introduction
A SCR pigging model was established in ABAQUS 6.14, as shown in Figure 2. The parameters of the SCR and ocean environment are shown in Table 1. In ABAQUS, the B21 beam element is used to simulate the riser and the plane strain element is used to simulate the seabed. Both ends of the riser are hinged, and hard contact is applied between the riser and the seabed.
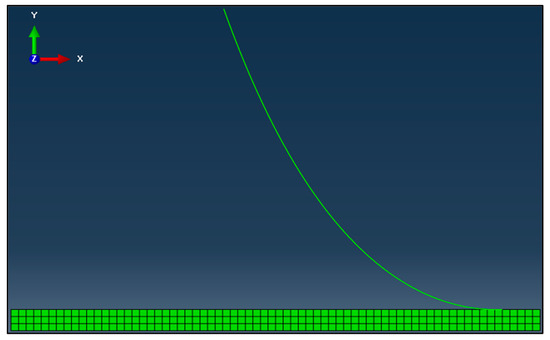
Figure 2.
Finite element model of an SCR.

Table 1.
Typical parameters of the SCR and ocean environment.
A grid independence analysis was then conducted to ensure the quality of the mesh was good enough to have no effect on the simulation accuracy. A condition was randomly set up for the grid independence analysis. The weight of the pig of 20 kg was applied on the node 1000 m away from the top of the riser, and the stress values of node 1190 within four cycles were extracted and averaged (node 1190 is the TDP). The stress values obtained from the model with different grid sizes are shown in Table 2. After the gird independence analysis, the SCR was divided into 1200 units (1201 nodes), with a length of 1 m for each unit. The seabed was divided into 2800 units at 2 m per unit in the contact area between the riser and the seabed, and a gradually increase from 2 m to 4 m for the meshing size was used in the area without contact.

Table 2.
Grid independence analysis for the simulation model.
The general form of the steel catenary riser was first calculated in a quasi-static manner using the catenary theory, ABAQUS, and OrcaFlex (https://www.orcina.com/orcaflex/) to preliminarily check this model. In ABAQUS, a vertical upward displacement load was applied to the top of SCR until it reached a height of 850 m, and then it was hinged to form a catenary shape. In OrcaFlex, the catenary shape of the riser was obtained by setting the distance between the two ends of the riser in the horizontal and vertical directions and applying a hinged boundary condition to both ends of the riser. The results are shown in Figure 3.
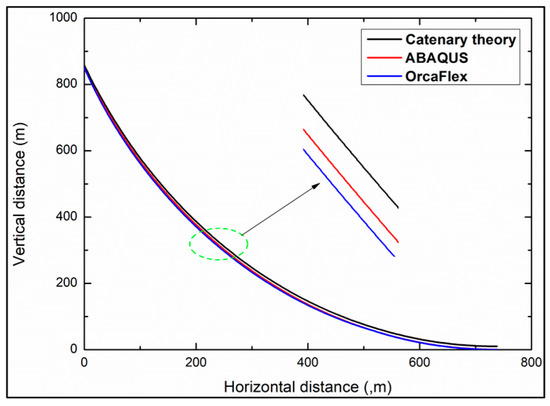
Figure 3.
Comparison of the overall shape of the catenary riser.
It can be seen from Figure 3 that the catenary posture of the riser obtained by the theoretical calculation is very close to that obtained by ABAQUS and OrcaFlex, and the deviation of these results is not large (2.9% relative error for ABAQUS and 3.9% relative error for OrcaFlex (point to point error)).
The stress and displacement of the steel catenary riser is affected by the pigging load, ocean currents, waves, gravity, FPSO system motion, and the riser’s own gravity and buoyancy. The force applied on the steel catenary riser is shown in Figure 4. The characteristics of the ocean current are as follows: the distance between the hinged point and seabed is 862 m, the acceleration of gravity is 9.8 m/s2, and the density of the fluid is 1021 kg/m3. The velocity of the ocean current is 0.3 m/s at 300 m above the seabed, 0.68 m/s at 600 m above the seabed, and 0.98 m/s at 862 m above the seabed. The wave is a Stokes wave. The wave amplitude is 1.2 m with a period of 8 s. The wave phase angle is 54.03° and the propagation direction is horizontally to the left. The settling motion and horizontal motion of the FPSO system are replaced by a sine function with an amplitude of 1.2 m and period of 8 s.
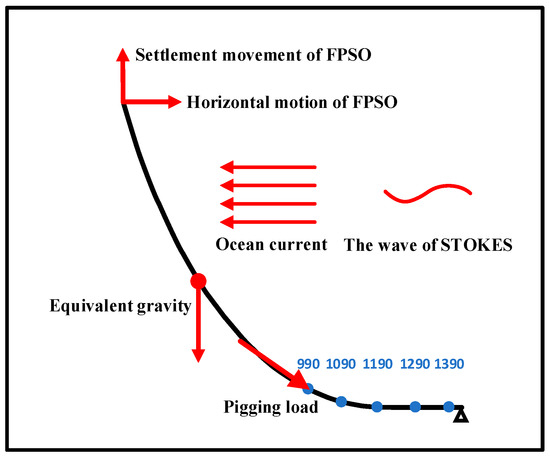
Figure 4.
Force diagram of the SCR pigging process without considering the slug load.
The pigging load consists of the pigging impact load and the pigging-induced slugging load. The pigging impact load on the riser can be divided into the load from its gravity and the load from the transient impact of the pig due to the sudden change in speed. The impact load (Fpig) was applied tangentially along the riser and the gravity load (Gpig) was applied in the vertical direction, as shown in Figure 5. Here, Fslug shown in Figure 5 represents the impact load resulting from the slug in front of the pig and Gslug represents the gravity load of the slug. Similar to the pigging impact load, Fslug was also applied tangentially along the riser.
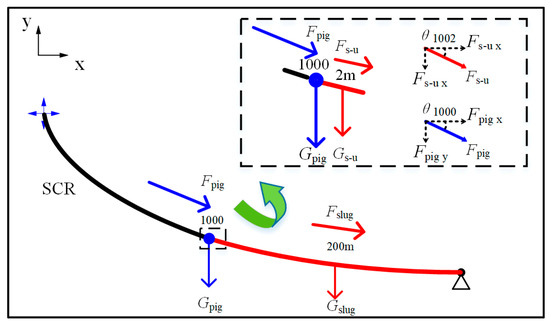
Figure 5.
Schematic diagram of an SCR applied with the pigging impact load and slugging load.
2.2. Model Validation
In order to verify the simulation results, a truncated and scaled-down experimental model of an SCR under pigging conditions was designed, as shown in Figure 6. This experimental rig consisted of an aluminum space frame (for modeling the pigging load), nylon tube (for modeling the SCR), two-dimensional motion control slide (for modeling the movement of the TDZ), fiber optic measurement system (for stress measurements), high-speed camera system (for displacement measurements), and data acquisition system. In order to assess the real motion of the TDZ in the experiment, the motions of node 990 were extracted from ABAQUS and entered into the two-dimensional motion control system to simulate its movement. Considering the experimental environment and the possibility for the acquisition of experimental materials, an experimental model was truncated first and then scaled down, and the scaling ratio selected in this experiment was 24.1 according to the calculation.
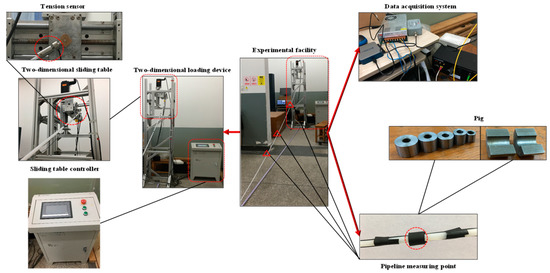
Figure 6.
The experimental rig of the SCR under pigging conditions.
The top tension data from the experiment were compared with the simulation data, as shown in Figure 7. It can be found that the experimental and simulation data agree with each other and are consistent with the sinusoidal motion law. Figure 8 shows the maximal von Mises stress values of six nodes along the SCR under pigging conditions obtained by the FBG (fiber Bragg grating) strain sensor. Compared with the experimental results, the numerical simulation results have a maximum error of 16.6% but a minimum error of 1.2%, which is acceptable at this stage.
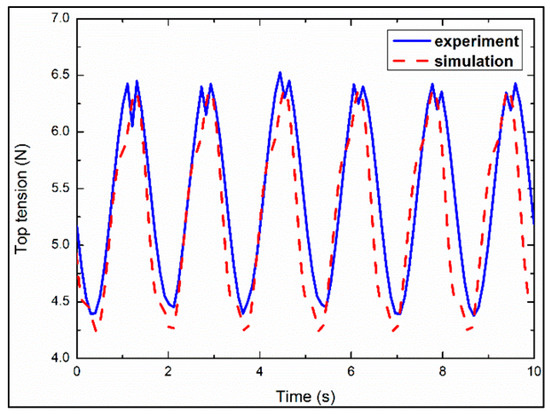
Figure 7.
Time traces of top tension values.
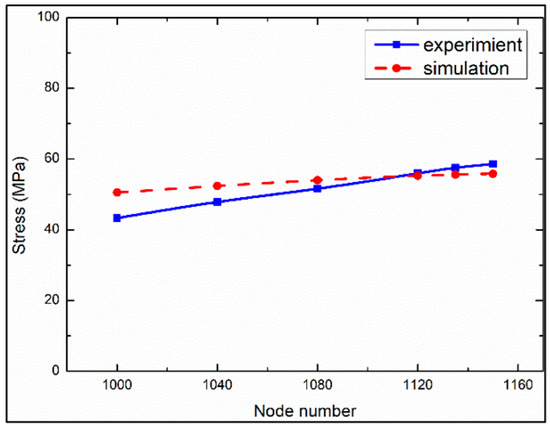
Figure 8.
Stress values at different nodes.
3. Simulation Results
Since the SCR pigging model was proven to be effective in predicting the dynamic response of the riser, different conditions are discussed in the following sections.
3.1. The Effect of the Pigging Impact Load on the SCR Stress Variation with no Pigging-Induced Slug Load
The pigging impact load is the impact load on the riser during pigging operation, and the load resulting from the pigging-induced slug is not considered in this case (Section 3.1).
In the riser pigging model, the pigging impact load applied on the riser can be simplified to be a nodal load, since the length of the pig is extremely small compared to the entire riser (0.07% of the overall length of SCR), and the pigging impact load consists of the pig’s gravity and the impact load on the riser during the movement. The maximum mass of the pig is estimated to be 80 kg according to the size of the riser, and the impact load of the pig is calculated by assuming that the initial speed of the pig decelerates to 0 m/s within 0.1 s. Pigging speeds of 1 m/s, 2 m/s, 3 m/s, 4 m/s, and 5 m/s were considered (the speed of the pig is usually within 1–5 m/s). As a result, the impact load of the pig can be predicted and applied on the riser. Five nodes (nodes 990, 1090, 1190, 1290, and 1390) located from the 990 m to 1390 m pipe section of the riser touchdown zone were selected to investigate the effect of the pigging impact load on the stress variations of the riser, as shown in Figure 4, and the loads applied on the riser are shown in Table 3.

Table 3.
Pigging loads applied on the riser.
The pigging process in a steel catenary riser is a dynamic and continuous process, and it is difficult to evaluate the pigging velocity at different positions. To solve this problem, it was assumed that the pig would stay in a certain position on the riser for a relatively long time (100 cycles of waves and FPSO motions) in the simulation to explore the extreme cases of equivalent stress changes at this point during the pigging process. The direction of the pig impact load is along the tangential direction of the riser node where the pig is located. In the simulation of steel catenary riser pigging, the top of the riser needs to be lifted to a predetermined position within 0–120 s. After the riser reaches the predetermined position, the above boundary conditions and loads are applied to simulate the riser pigging state, and the calculation time range is 120–1920 s. From 120 s to 920 s, the pig with different initial velocity rates and a mass of 80 kg passes through 5 nodes (nodes 990, 1090, 1190, 1290, and 1390) of the touchdown zone of the riser to study the stress and displacement variations in these nodes. Figure 9 shows a comparison of the equivalent stress variations of five research nodes in the TDZ of the riser with and without the impact load of the pig. The black solid line represents the equivalent stress variation without considering the pigging impact load, i.e., the original model, and the red dotted line represents the riser model of the equivalent stress variation considering the pigging impact load, i.e., the pigging model. It can be seen from Figure 6 that the equivalent stress values of different nodes in the riser TDZ increased certainly due to the pigging impact load. The closer to the touchdown point, the more obvious this trend is, and a 49.3% maximum stress increase can be found at node 1090. However, the periodic variation law of the equivalent stress due to the waves and FPSO motion is not affected by the pigging impact load.
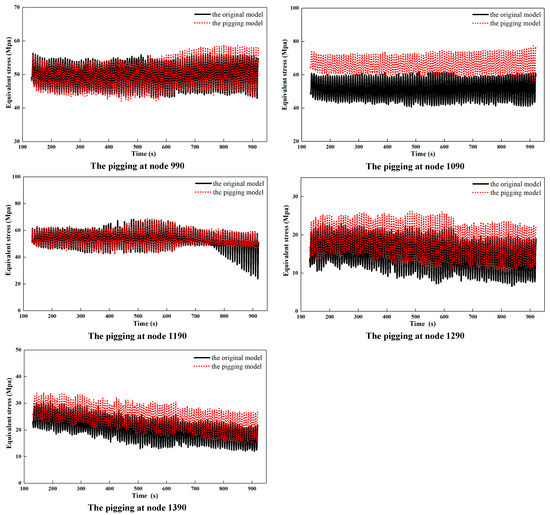
Figure 9.
Comparison of equivalent stress values of the SCR with and without the pigging impact load at different nodes.
In order to further investigate the variations in the equivalent stress values of the node in the effects of different pigging impact loads (different pigging velocity), the equivalent stress was extracted, as shown in Figure 10. It can be found that the pigging impact load has a larger effect on the left part of the touchdown point (nodes 990 and 1090) compared with the right part (nodes 1290 and 1390) at the 1 m/s and 2 m/s pigging velocity rates. Here, a 30.5% maximum increase occurs due to the pigging impact load on nodes 990 and 1090. However, a small increase can be found when the pigging velocity increased from 2 m/s to 5 m/s, due to the touchdown point shifting to the left. Nodes 990 and 1090 gain support from the seabed. For the right part of the touchdown point, a slight increase in the riser stress occurs with the increase in the pigging impact load.
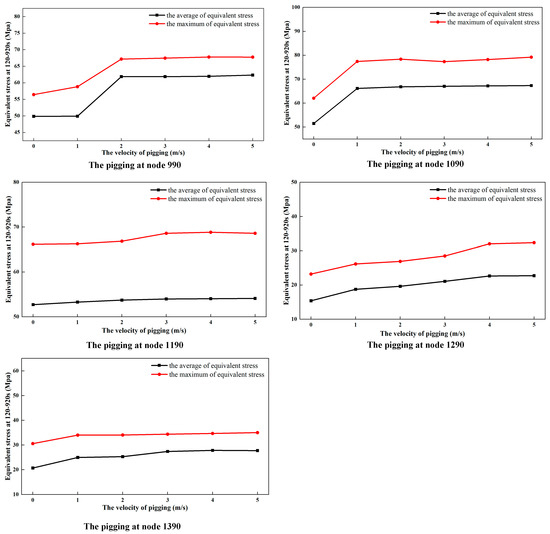
Figure 10.
Variations in the mean and maximum equivalent stress values with different pigging impact loads at different nodes.
3.2. The Effect of the Pigging Impact Load on the SCR Displacement Variation with no Pigging-Induced Slug Load
There are initial displacements at different nodes during the lifting of the SCR from horizontal riser to the catenary riser (0–120 s in the simulation). After applying the pigging impact load, the SCR will shift further based on the initial displacement. In order to study the displacement variations in the SCR riser’s TDZ under the coupling action of wave currents, a floating production platform, and the pigging impact load, the displacements of five nodes (nodes 990, 1090, 1190, 1290, and 1390) in the touchdown zone were investigated and the absolute displacements of these nodes were extracted, as shown in Figure 11. The black solid line represents the absolute displacement resulting from the original model (without the pigging impact load) in the X direction (the X/Y axis is shown in the upper left corner of Figure 5) and the red dotted line is the absolute displacement in the X direction from the pigging model. The blue solid line and the green dotted line represent the absolute displacements in the Y direction resulting from the original model and the pigging model, respectively.
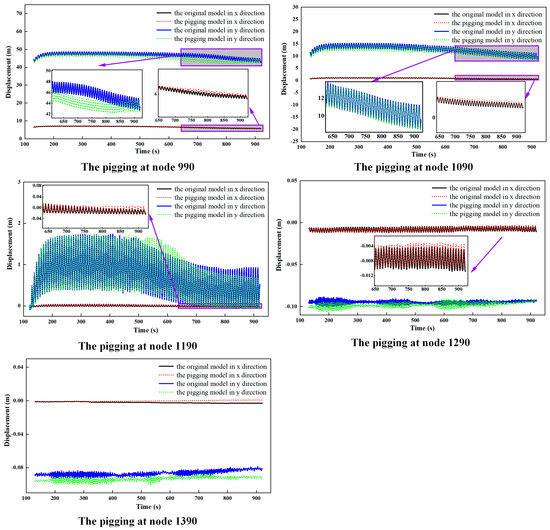
Figure 11.
Comparison of the absolute displacements of different nodes with the effects of different pigging impact loads.
It can be seen from Figure 11 that the TDZ shows an offset trend to the right in the X direction with the effect of the pigging impact load. The offset of the TDP and its left nodes are relative larger than its right nodes. For the left nodes, the farther away from the TDP, the greater the displacement of the node, while this is not applicable to the nodes on the right of the TDP due to the support of the seabed. In the Y direction, the displacement deviation of the SCR is significantly larger than that in the X direction. The displacement of the nodes in the left part of the TDP undergoes a large offset and fluctuates regularly. The displacement of the right part of the TDP is quite small and undergoes irregular changes due to the support of the seabed.
In order to investigate the variations in the node displacements at different pigging velocity rates, the displacement data were extracted and are shown in Figure 12 and Figure 13. Figure 12 shows the variations in the average and maximum displacement values of the TDZ in the X direction at different pigging velocity rates. With the increase in the pigging velocity, the mean absolute displacement of the nodes on the right of the TDP in the X direction undergoes a small increase, as well as the maximum displacement. The effect of the pigging impact load on the absolute displacement variation of the right part of the TDP is quite small due to the support of the seabed. Here, a 7.37 m absolute displacement in the X direction and 47.74 m absolute displacement in the Y direction can be found at node 990 when the pigging velocity is 5 m/s. The analysis in Figure 13 indicates that the pigging impact load only brings about 1–2 m increments in the Y direction
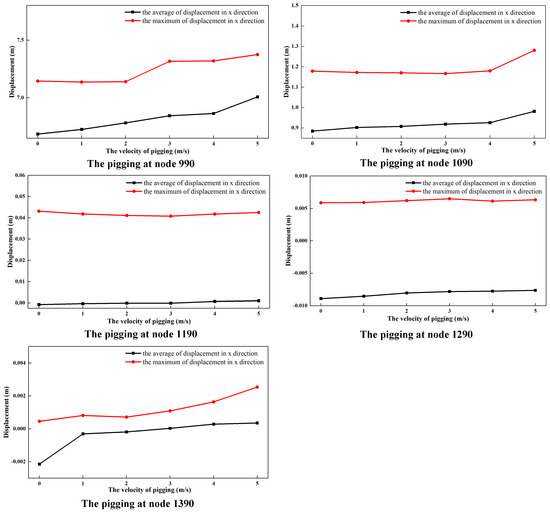
Figure 12.
Variations in the average and maximum displacements of the TDZ in the X direction at different pigging velocity rates.
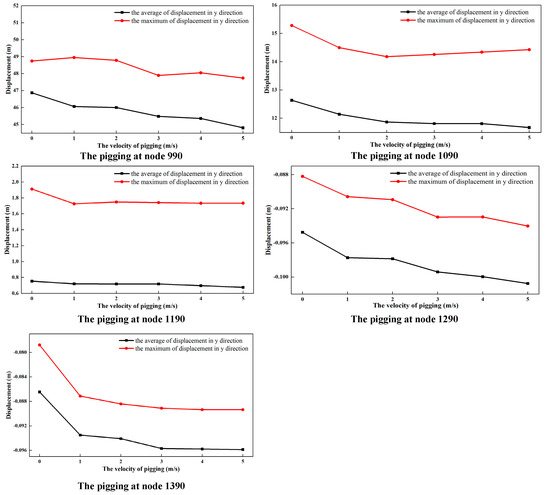
Figure 13.
Variations in the average and maximum displacements of the TDZ in the Y direction at different pigging velocity rates.
3.3. The Effect of Multiple Loads on the SCR Stress Variation, Considering the Pigging-Induced Slug Load
Differing from the pigging of a pipeline onshore, it is inevitable to encounter slug flow in front of the pig during riser pigging (a pigging-induced slug), which will aggravate the stress and displacement variations of the riser. In this section, the stress distribution and displacement of the SCR are investigated, with consideration of the effects of the waves, currents, floating platform’s movements, and pigging load (including the pigging impact load and pigging-induced slug load).
The pigging-induced slug load is applied on the riser in the same way as the pigging impact load. Figure 14 shows a schematic diagram of the impact of the pig and the slug loads on the riser when the pig runs to the 990 m position of the riser. Among them, Gpig represents the gravity load of the pig itself; Fpig represents the impact load of the pig on the pipeline, which can be decomposed into concentrated loads along the X and Y directions; Gslug represents the gravity load of the slug flow in front of the pig; Fslug represents the impact load of the slug flow in front of the pig. In order to ensure the computational efficiency of the model, the direction of the impact load resulting from the slug on the riser is approximately the same for every 2 m; that is, the slug load every 2 m is a computational unit. Here, Fslug-unit represents the slug load of the above calculation unit (represented by Fs-u in Figure 14). Similarly, Fs-u can be decomposed into concentrated loads in the X and Y directions.
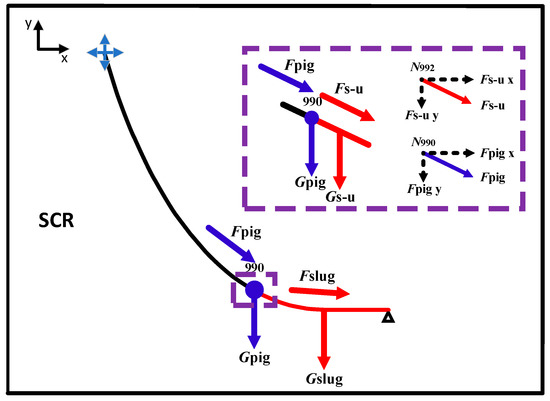
Figure 14.
Schematic diagram of the pigging impact load and the pigging-induced slug load on the riser.
In order to further study the influence of the slug load in front of the pig on the stress variation of the SCR during the pigging process, a pig with initial velocity of 1 m/s and mass of 80 kg passing through five nodes (nodes 990, 1090, 1190, 1290, and 1390) was investigated. The slug load was applied on the section between the corresponding research node and the riser end at the same time (with slug lengths of 410 m, 310 m, 210 m, 110 m, and 10 m, respectively), and the initial velocity of the slug was the same as the pig (1 m/s). The pigging loads are compared to the slugging loads applied on the riser in Table 4. The equivalent stress values of different nodes of the riser were extracted and are shown in Figure 15. The black solid line represents the riser model without considering the pigging load, i.e., the original model, and the red dotted line represents the riser model considering slug flow and pig impact load, i.e., the pigging model.

Table 4.
Pigging loads applied on the riser while considering the slugging loads.
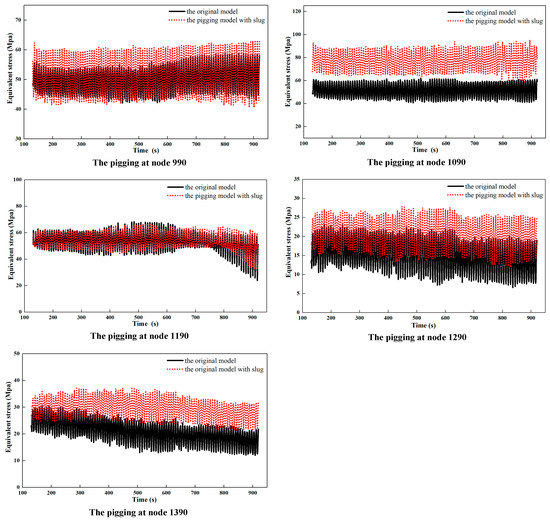
Figure 15.
Comparison of equivalent stress values of the TDZ with and without considering the pigging load.
It can be found from Figure 15 that the effect of the slug load on the riser stress of the touchdown zone is larger than the effect of the pigging impact load (Figure 9). The stress values of these nodes all increase, with a 106.76% maximum increment in stress occurring at node 1090. However, the absolute increment is 47.62 MPa, leading to the largest stress value of 95.42 MPa, which is still below the allowable stress of the material.
Variations in the mean and maximum equivalent stress values of the TDZ at different pigging loads are shown in Figure 16. Here, the 0 m/s pigging velocity and 0 m/s slug flow velocity in Figure 16 mean that there is no pigging load, which represents the original model. It can be found that the effects of the slug load with different velocity values on the riser stress of the TDZ are similar to the effect of the pigging impact load (Figure 10). Almost all nodes undergo a slight increase in stress with the increment in the slug velocity. Here, a 66.7% maximum stress variation can be found at node 1090 when the pigging velocity increases from 0 m/s to 5 m/s.
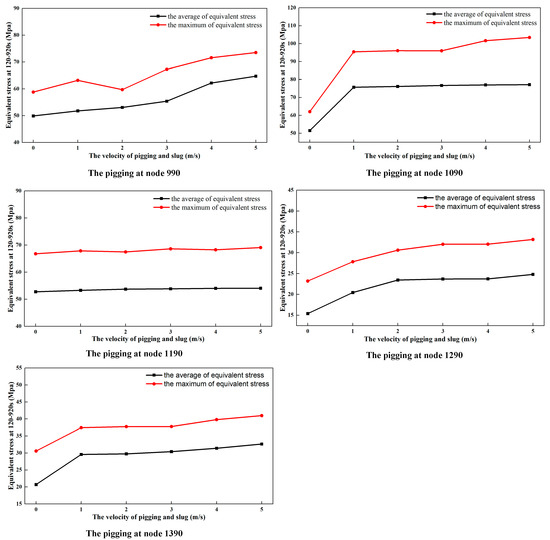
Figure 16.
Variations in mean and maximum equivalent stress values of the TDZ with and without slug loads at different nodes.
3.4. The Effects of Multiple Loads on the SCR Displacement Variation, Considering the Pigging-Induced Slug Load
Th analysis in Figure 17 indicates that compared with the original model, the nodes on the left side of the TDP of the pig model considering the slug load show a left offset trend in the X direction, while the nodes on the right side show a right offset trend due to the superposition of the slug load, which is different from the trend for the effect of only the pigging impact load. A large offset in the Y direction for nodes on the left side of the TDP can be observed (nodes 990 and 1090). A 10.05 m maximum offset in the Y direction occurred at node 990. However, this trend is not obvious for nodes 1290 and 1390 due to the seabed support.
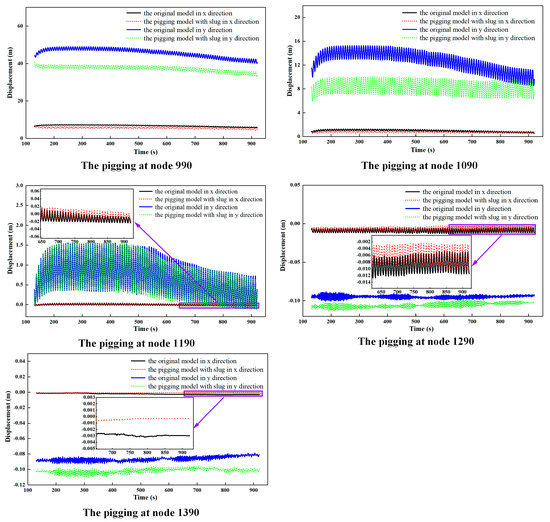
Figure 17.
Comparison of the absolute displacement values of different nodes with the effects of different pigging loads.
The variations in displacement at different nodes of the TDZ with different pigging velocity values were further studied, and the displacements in the X and Y direction were extracted and are shown in Figure 18 and Figure 19. It can be found in Figure 18 that with the increase in pigging velocity, the average and maximum displacements of the nodes on the left of the TDP in the X direction decrease monotonously, which means that with the effects of multiple loads, these nodes experience an offset to the left (as for the X and Y directions shown in Figure 5). On the contrary, the nodes on the right of the TDP undergo an offset to the right, and the offset increases with the increment in the pigging velocity.
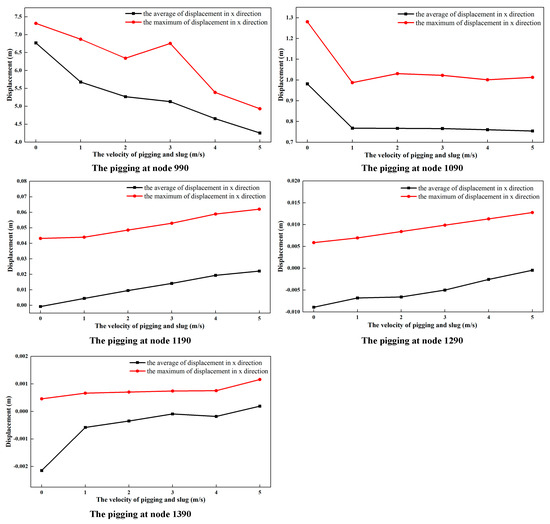
Figure 18.
Variations in average and maximum displacements of the touchdown zone in the X direction at different pigging velocity values while considering the slug flow.
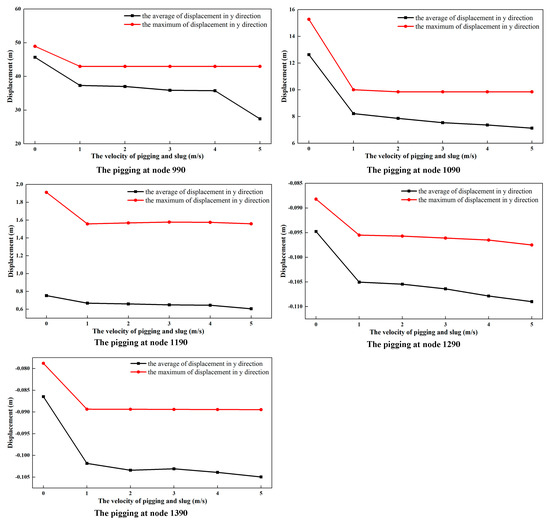
Figure 19.
Variations in average and maximum displacements of the touchdown zone in the Y direction at different pigging velocity values while considering the slug flow.
Figure 19 shows that with the increase in velocity of the pig and slug flow, the average displacement of the five nodes in the Y direction decreases monotonously, and the maximum displacement decreases as well, indicating that the velocity of the pig and slug flow is positively correlated with the downward offset of the nodes around the TDZ in the Y direction. With the increase in velocity of the pig and slug flow, the displacement offset of the nodes on the left of the TDP becomes significantly greater than that of the nodes on the right. Here, a 2.51 m absolute displacement in the X direction and a 18.29 m absolute displacement in the Y direction occurred at node 990, when the pigging velocity increased from 0 m/s to 5 m/s.
Figure 20 was obtained by extracting the shape of the riser from ABAQUS, revealing the shape of SCR at different pigging velocities when the pig is located at node 990 and when the slug flow is considered. It can be found that when the slug flow is considered, the node near the left of the SCR TDP moves downward due to the pigging load. However, the nodes far away from the SCR TDP move upward due to the deformation of the steel catenary riser. The larger the pigging velocity, the more serious the deformation of the SCR. Fortunately, even a heavy pig moving at 5 m/s stops within 0.1 s and cannot destroy the riser.
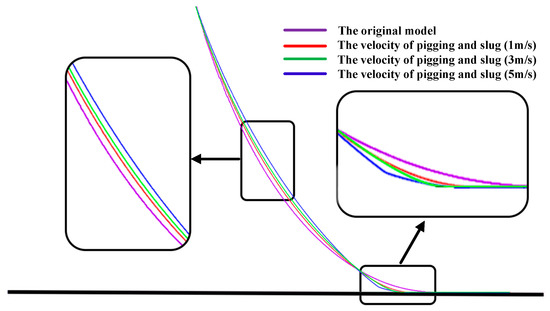
Figure 20.
SCR geometrical morphologies at different velocities when the slug flow is considered and the pig is located at node 990.
4. Conclusions
In this paper, a model was proposed to investigate the pigging process of an SCR based on ABAQUS software. This model was verified by an experiment, and a maximum error of 16.6% with a minimum error of 1.2% were found. Next, the variations in the equivalent stress and displacement values of SCR in the pigging process were investigated under the pigging conditions with the combined action of waves, currents, and floating platform movements. The conclusions are presented below:
- (1)
- During the pigging of the SCR TDZ, the amplitude of the equivalent stress increased due to the pigging load, and a 106.76% maximum increment was observed. The closer to the touchdown point, the more obvious the trend. However, the periodic variation law of the equivalent stress is not affected by the pigging impact load, which is mainly determined by the effects of the waves, currents, and floating platform movements.
- (2)
- The displacement of the SCR TDZ in the Y direction was significantly larger than that in the X direction due to the catenary properties. The displacement of the nodes on the left part of the TDP underwent a large offset and fluctuated regularly. The displacement of the right part of the TDP was quite small due to the support of the seabed.
- (3)
- When the slug flow was considered in the pigging of the SCR TDZ, the displacement of the node on the left the TDP in the X direction experienced an offset to the left, while the nodes on the right of the TDP underwent a right offset. Downward displacements in the Y direction was found for all the nodes and was positively correlated with the initial velocity of the pig. Here, a 2.51 m absolute displacement in the X direction and a 18.29 m absolute displacement in the Y direction were observed at node 990 when the pigging velocity increased from 0 m/s to 5 m/s. The research results indicate that the potential damage of the pigging to the riser was limited, compared with the fatigue failure due to the periodic motion of the SCR.
Author Contributions
Conceptualization, X.Z. and Y.F.; methodology, X.Z.; software, Y.W.; validation, L.W. and L.L.; writing—original draft preparation, X.Z. and Y.F.; writing—review and editing, Y.W. and L.W.; supervision, X.Z. and L.L. All authors have read and agreed to the published version of the manuscript.
Funding
This paper is supported by the National Natural Science Foundation of China (No. 51509259), the Joint Funds of the National Natural Science Foundation of China (No. U1908228), as well as the National Key R&D Program of China (2022YFC2806103).
Data Availability Statement
The data presented in this study are available upon request from the corresponding author.
Conflicts of Interest
No conflict of interest exists in the submission of this manuscript, and the manuscript is approved by all authors for publication. I would like to declare on behalf of my coauthors that the work described was original research that has not been published previously.
References
- Wang, Y.B.; Gao, D.L.; Fang, J. Static analysis of deep-water marine riser subjected to both axial and lateral forces in its installation. J. Nat. Gas Sci. Eng. 2014, 19, 84–90. [Google Scholar] [CrossRef]
- Bai, X.L.; Chen, K.; Xie, Y.H. Experimental study on the pipe-soil interaction in the contact zone of steel catenary riser. Shipbuild. China 2016, 57, 112–119. [Google Scholar]
- Wang, J.; Fu, S.; Baarholm, R.; Wu, J.; Larsen, C.M. Out-of-plane vortex-induced vibration of a steel catenary riser caused by vessel motions. Ocean Eng. 2015, 109, 389–400. [Google Scholar]
- Mekha, B.B. New Frontiers in the Design of Steel Catenary Risers for Floating Production Systems. J. Offshore Mech. Arct. Eng. 2001, 123, 153–158. [Google Scholar]
- Willis, N.R.T.; Thethi, K.S.; 2H Offshore Engineering Ltd. Stride JIP: Steel risers in deepwater environments—Progress summary. Offshore Technol. Conf. 1999, OTC 10974. [Google Scholar] [CrossRef]
- Hodder, M.S.; Byrne, B.W. 3D experiments investigating the interaction of a model SCR with the seabed. Appl. Ocean Res. 2010, 32, 146–157. [Google Scholar]
- Elliott, B.J.; Zakeri, A.; Barrett, J.; Hawlader, B.; Li, G.; Clukey, E.C. Centrifuge modeling of steel catenary risers at touchdown zone part II: Assessment of centrifuge test results using kaolin clay. Ocean Eng. 2013, 60, 208–218. [Google Scholar]
- Elliott, B.J.; Zakeri, A.; Macneill, A.; Phillips, R.; Clukey, E.C.; Li, G. Centrifuge modeling of steel catenary risers at touchdown zone part I: Development of novel centrifuge experimental apparatus. Ocean Eng. 2013, 60, 200–207. [Google Scholar]
- Gao, Y.; Fu, S.; Ma, L.; Chen, Y. Experimental investigation of the response performance of VIV on a flexible riser with helical strakes. Ships Offshore Struct. 2014, 11, 113–128. [Google Scholar]
- Wang, Y.; Duan, M.L.; Zhang, Y. Experimental and numerical investigation of vertical pipe–soil interaction considering pipe velocity. Ships Offshore Struct. 2015, 12, 77–85. [Google Scholar] [CrossRef]
- Yao, R.; Bai, X.L.; Xie, Y.H. Small size three-dimensional experimental study of interaction between steel catenary riser and seabed. Ocean Eng. 2015, 33, 93–99. [Google Scholar]
- Bai, X.; Vaz, M.A.; Morooka, C.K.; Xie, Y. Dynamic tests in a steel catenary riser reduced scale model. Ships Offshore Struct. 2017, 12, 1064–1076. [Google Scholar]
- Yu, Y.; Xu, S.; Yu, J.; Xu, L.; Liu, X.; Liu, P. Experimental Study of the Dynamic Performance of Steel Catenary Riser within the Touchdown Zone. J. Mar. Sci. Eng. 2023, 11, 151. [Google Scholar] [CrossRef]
- Li, F.Z.; Low, Y.M. Influence of low-frequency vessel motions on the fatigue response of steel catenary risers at the touchdown point. Ships Offshore Struct. 2012, 9, 134–148. [Google Scholar]
- Guo, L.; Duan, M.; Wang, Y.; Yu, F. Experimental investigation on dynamic model testing of a deep-water riser support by truncated hybrid method. Ships Offshore Struct. 2013, 9, 344–353. [Google Scholar] [CrossRef]
- Shiri, H. Influence of seabed trench formation on fatigue performance of steel catenary risers in touchdown zone. Mar. Struct. 2014, 36, 1–20. [Google Scholar] [CrossRef]
- Yang, H.Z.; Xiao, F. Instability analyses of a top-tensioned riser under combined vortex and multi-frequency parametric excitations. Ocean Eng. 2014, 81, 12–28. [Google Scholar] [CrossRef]
- Elosta, H.; Huang, S.; Incecik, A. Trenching effects on structural safety assessment of integrated riser/semisubmersible in cohesive soil. Eng. Struct. 2014, 77, 57–64. [Google Scholar] [CrossRef]
- Dong, Y.; Sun, L. Fatigue analysis of steel catenary risers based on a plasticity model. J. Mar. Sci. Appl. 2015, 14, 76–82. [Google Scholar]
- Thorsen, M.J.; Savik, S.; Larsen, C.M. Fatigue damage from time domain simulation of combined in-line and cross-flow vortex-induced vibrations. Mar. Struct. 2015, 41, 200–222. [Google Scholar] [CrossRef]
- Bai, X.; Huang, W.; Vaz, M.A.; Yang, C.; Duan, M. Riser-soil interaction model effects on the dynamic behavior of a steel catenary riser. Mar. Struct. 2015, 41, 53–76. [Google Scholar] [CrossRef]
- Kim, S.; Kim, M.-H. Dynamic behaviors of conventional SCR and lazy-wave SCR for FPSOs in deepwater. Ocean Eng. 2015, 106, 396–414. [Google Scholar]
- Zhang, J.; Tang, Y. Parametric instability analysis of deepwater top-tensioned risers considering variable tension along the length. J. Ocean Univ. China 2015, 14, 59–64. [Google Scholar]
- Gong, S.; Xu, P. Influences of pipe–soil interaction on dynamic behaviour of deepwater S-lay pipeline under random sea states. Ships Offshore Struct. 2016, 12, 370–387. [Google Scholar]
- Wang, K.; Ji, C.; Xue, H.; Tang, W. Fatigue sensitivity analysis of steel catenary riser near touchdown point. J. Shanghai Jiaotong Univ. (Sci.) 2017, 22, 570–576. [Google Scholar] [CrossRef]
- Sun, L.; Zhang, Y.; Ma, G.; Wang, H. Nonlinear dynamic analysis of deepwater risers with the irregular seabed. Offshore Arct. Eng. 2017, OMAE-62531. [Google Scholar] [CrossRef]
- Dong, X.; Shiri, H. Performance of non-linear seabed interaction models for steel catenary risers, part I: Nodal response. Ocean Eng. 2018, 154, 153–166. [Google Scholar]
- Dong, X.; Shiri, H. Performance of non-linear seabed interaction models for steel catenary risers, part II: Global response. Appl. Ocean Res. 2019, 82, 158–174. [Google Scholar]
- Liu, Z.; Guo, H.Y. Dynamic response study of steel catenary riser based on slender rod model. China Ocean Eng. 2019, 33, 57–64. [Google Scholar] [CrossRef]
- Liu, Y.; Zhu, X.; Song, J.; Wu, H.; Zhang, S.; Zhang, S. Research on bypass pigging in offshore riser system to mitigate severe slugging. Ocean Eng. 2022, 246, 110606. [Google Scholar]
- Queau, L.M.; Kimiaei, M.; Randolph, M.F. Dimensionless groups governing response of steel catenary risers. Ocean Eng. 2013, 74, 247–259. [Google Scholar] [CrossRef]
- Jayawardena, S.; Dykhno, L.; Hudson, J. Challenges in pigging subsea gas flowlines. Soc. Pet. Eng. 2002, SPE-77576. [Google Scholar] [CrossRef]
Disclaimer/Publisher’s Note: The statements, opinions and data contained in all publications are solely those of the individual author(s) and contributor(s) and not of MDPI and/or the editor(s). MDPI and/or the editor(s) disclaim responsibility for any injury to people or property resulting from any ideas, methods, instructions or products referred to in the content. |
© 2023 by the authors. Licensee MDPI, Basel, Switzerland. This article is an open access article distributed under the terms and conditions of the Creative Commons Attribution (CC BY) license (https://creativecommons.org/licenses/by/4.0/).