Article

Landfill Waste Segregation Using Transfer and Ensemble Machine Learning: A Convolutional Neural Network Approach

Biosystems and Agricultural Engineering, Oklahoma State University, 111 Agriculture Hall, Stillwater, OK 74078, USA
*
Author to whom correspondence should be addressed.
Energies 2023, 16(16), 5980; https://doi.org/10.3390/en16165980
Submission received: 5 July 2023 / Revised: 3 August 2023 / Accepted: 13 August 2023 / Published: 15 August 2023

Abstract

:
Waste disposal remains a challenge due to land availability, and environmental and health issues related to the main disposal method, landfilling. Combining computer vision (machine learning) and robotics to sort waste is a cost-effective solution for landfilling activities limitation. The objective of this study was to combine transfer and ensemble learning to process collected waste images and classify landfill waste into nine classes. Pretrained CNN models (Inception–ResNet-v2, EfficientNetb3, and DenseNet201) were used as base models to develop the ensemble network, and three other single CNN models (Models 1, 2, and 3). The single network performances were compared to the ensemble model. The waste dataset, initially grouped in two classes, was obtained from Kaggle, and reorganized into nine classes. Classes with a low number of data were improved by downloading additional images from Google search. The Ensemble Model showed the highest prediction precision (90%) compared to the precision of Models 1, 2, and 3, 86%, 87%, and 88%, respectively. All models had difficulties predicting overlapping classes, such as glass and plastics, and wood and paper/cardboard. The environmental costs for the Ensemble network, and Models 2 and 3, approximately 15 g CO2 equivalent per training, were lower than the 19.23 g CO2 equivalent per training for Model 1.

Graphical Abstract

1. Introduction

Waste generation has increased over time along with demography, and soared from 88.1 million tons in 1960 to 292.4 million tons in 2018 [1]. The world waste production is expected to increase by 70% and reach 3.4 billion tons by 2050 [2]. Landfilling is the most common waste disposal method used worldwide, especially in the US. However, the constant increase in waste generation has raised concerns about land availability, and health and safety of humans, animals, and the environment [3]. The US Environmental Protection Agency (U.S EPA) provided the following waste management hierarchy: source reduction and reuse, recycling/composting, energy recovery, treatment, and disposal [1].
Waste recycling is one of the most environmentally friendly waste management processes proposed. The process allows material recovery and saves energy by avoiding new raw material mining (metals) and production (plastics, glass, and papers) [4]. In addition, recycling reduces landfilling activities and therefore minimizes air and water pollution [5]. However, waste recycling remains a challenge because of the lack of viable and cost-effective technologies for the segregation of wet and contaminated waste (waste with high moisture and food waste) [6]. Waste recycling involves manual and mechanical sorting. Manual sorting is inefficient and dangerous for workers because of the toxic nature of waste [6,7]. In addition, the lack of manpower makes the process challenging [6]. Mechanical sorting on the other hand processes dry recyclables only and requires presorting by households or at initial disposal place (trash can). However, the lack of public knowledge and awareness on waste recycling practices and improper waste categorization by residents often lead to inefficient recycling and result in contaminated batches that get routed to landfills [7,8]. Due to the aforementioned reasons, the recycling efficiency in the US is low and about half of the US waste is still landfilled. Hence, it is imperative to develop cost effective technologies that will not rely on household waste separation and be able to sort waste at landfill or processing sites.
The convolutional neural network (CNN) method, a subbranch of deep learning specifically for computer vision, has potential use in building a cost-effective waste segregation system for landfill wastes using classification of waste images. The availability of performant CNN algorithms helps towards developing cost effective and automated waste sorting systems with visually guided robotic arms for waste segregation. According to the US Environmental Protection Agency [1], landfill wastes are municipal solid wastes composed of over nine types of materials: paper and paperboard, glass, metals, plastics, yard trimmings, food, wood, rubber and leather, textiles, misc. inorganic waste, and others. These waste classes can be separated and reused (recyclable material) or properly disposed of via biological (composting and anaerobic digestion of food waste) and thermal processing (gasification and pyrolysis with energy recovery) to avoid landfilling. The main goal of this study is to develop and fine tune a CNN algorithm to classify landfill waste into nine marketable material classes (aluminum, carton, e-waste, glass, organic waste, paper and cardboard, plastics, textiles, and wood).
Several conference papers investigated waste classification using CNNs but very limited number of peer-reviewed published journals on the same topic exist. A pretrained CNN (ResNet 18) was used to classify recyclable waste into four classes (plastic, paper, metals, and glass) in one study that reported an accuracy of 87.8% [4]. Another study reported an accuracy of 82% in classifying recyclable waste into five classes using another pretrained model, DenseNet169 [7]. These studies only targeted recyclables and categorized waste into four and five classes. In this study, the landfill waste will be classified into nine classes and a combination of CNNs, transfer learning, and ensemble learning will be used. Moreover, based on the results reported in literature, the accuracy of waste classification using the CNN can be improved [4,7]. To date, no study has used a combination of Inception–ResNet, EfficientNet, and DenseNet via transfer and ensemble learning to classify landfill waste into nine classes. Consequently, the three pretrained CNNs were used as a base model to develop the ensemble network. This study investigated and compared the proposed model’s performance to the three other networks (Models 1, 2, and 3) trained on the same data and conditions as the ensemble model. In addition, the models’ training cost and environmental burden were investigated.
The rest of the paper is presented in four sections: Section 2 defines the CNN base models used; Section 3 presents the methodology used; Section 4 presents the results and discussion, and Section 5 presents the summary and conclusions.

2. Pretrained CNN Models Architecture

This study used three pretrained CNNs as base models to build the ensemble network. These pretrained Convolutional Neural Networks are models that were trained on large datasets. For example, ImageNet was created by a team of researchers to provide a large database for object recognition models training [9]. The database is composed of more than a million images categorized into 1000 classes and has been used in the ImageNet Large Scale Visual Recognition Challenge (ILSVRC) every year since 2010. The challenge has allowed the development of several CNN models such as VGG (Visual Geometry Group) and Inception (previously called GoogleNet) [10]. Pretrained CNN models have shown a potential for image classification. In this study, the pretrained models including Inception–ResNet-v2, EfficientNetB3, and DenseNet201 were used to develop an ensemble model for landfill waste classification into nine classes.

2.1. Inception–ResNet

The Inception–ResNet-v2, introduced by Szegedy, et al. [11], is a hybrid version based on the architectures of Inception family and residual connection [11]. The author described the network as costly but significantly performant in terms of recognition [11]. Inception–ResNet-v2 has a deep structure composed of 164 layers. As shown in Figure 1, the model’s basic architecture is composed of stem block, five Inception–ResNet-As, a reduction-A, ten Inception–ResNet-Bs, a reduction-B, five Inception–ResNet-Cs, an average pooling, and a dropout layer (Figure 1) [11]. The residual connection used in the model is known for improving the model training speed and reducing network degradation due to its deep structure [11,12].

2.2. EfficientNet

EfficientNet was introduced by Tan and Le [13]. The network was reported to be 8.4 times smaller and 6.1 times faster than existing CNNs. Tan and Le [13] applied advanced scaling to all three dimensions (depth, width, and resolution) of the network using an effective compound coefficient. Unlike other research that scale up depth, width, or resolution, the authors uniformly scaled up the three dimensions with a fixed ratio, which therefore, led to a higher accuracy (Figure 2) [13,14].

2.3. Densely Connected Convolutional Network (DenseNet)

The Densely Connected Convolutional Network (DenseNet) comes from a collaborative work between Cornell and Tsinghua Universities and Facebook AI research [15]. The network was designed to address challenges related to gradient vanishing due to the increased depth of the CNN models [15]. The authors found that connecting all layers to each other guarantees information flow throughout the network. Figure 3 shows the architecture of DenseNet 201 (201 layers), which is composed of a convolution layer, pooling layer, dense blocks, and transition layers (convolution and average pooling layers).

3. Methods

This study proposed a CNN model using transfer and ensemble learning to classify landfill waste into nine classes: aluminum, carton, e-waste, glass, organic waste, paper and cardboard, plastics, textiles, and wood.

3.1. Deep Learning Libraries

Open-source platforms and libraries such as Keras, TensorFlow, Numpy, Matplotlib, Scikit-Learn, and Seaborn were used to train the models, and Google Colab Pro [16] was used as the training platform. Keras is a deep learning framework and open-source library capable of running on top of TensorFlow [17]. Keras provides full access to the TensorFlow platform and can run experiments faster [17]. Tensorflow is an open-source library able to carry complex numerical computation for machine learning and artificial intelligence [17]. In this study, Tensorflow and Keras were used for data processing (ImageDataGenerator), CNN architecture (layers, model), model training/optimization (regularizers, optimizers and callbacks), and evaluation (utils). Numpy is a library for Python used to work with arrays, matrices, linear algebra, and Fourier transform, etc. In this study, Numpy was used to transform images into matrices. Matplotlib is a library and an extension of Numpy used for plotting. The library was used to plot models, training curves, and performance metrics. The Scikit-Learn library was used to establish the models’ classification reports (performance metrics) and confusion matrices. Google Colab Pro was used as a training platform for the CNN models. The platform offers faster GPU (NVIDIA P100 or T4), longer runtimes, and additional RAM.

3.2. Data Collection and Preprocessing

A waste dataset of 22,500 images was collected from waste classification dataset on Kaggle [18]. The dataset was preprocessed through image scrapping (repeated and misclassified image removal) and reorganized into nine groups with a total of 6536 images: aluminum, carton, e-waste, glass, organic waste, paper and cardboard, plastics, textiles and wood. Waste classes such as e-waste, carton, textiles, and wood had a low number of images. Therefore, the aforementioned classes datasets were increased by downloading 1810 images from Google Search and a recycling waste dataset on Kaggle. Finally, 8346 images were included in the study. Figure 4 and Table 1 show the dataset samples and repartition per class of waste, respectively.
After the dataset was uploaded in the simulation platform, all images in RGB format were resized to 224 × 224 pixels in resolution for data uniformity. A data augmentation technique is used to increase dataset size, reduce overfitting, capture more features, and therefore, increase the CNN models’ performance. In this study, the ImageDataGenerator function was used for data augmentation techniques such as horizontal flip, shearing (0.2), zooming (0.2), and dataset repartition (training and validation). The waste dataset was then divided into training dataset (80%) and validation dataset (20%).

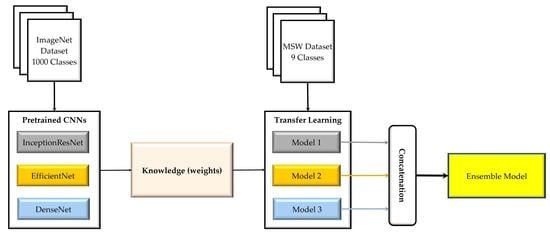
3.3. Ensemble Method

The method proposed in this study is called the ensemble method. The technique consists of combining feature extraction techniques of three CNN models to improve waste class prediction using the concatenation function. Transfer learning is known as a suitable technique to address the lack of data and computing cost. The hypothesis of this study is that combining several CNN models using transfer learning and ensemble learning will enhance useful and diverse feature collection and increase waste prediction accuracy, while reducing misclassification errors (for classes with similar features such as plastics, glasses, and metals). The pretrained models were trained on the waste dataset and the optimized weights were used to build the ensemble model.
The ensemble model architecture can be divided into three sections (Figure 5). The first section (grey in Figure 5) is the image collection and preprocessing step. The second section (Model 1, 2, and 3) consists of using weights of three pretrained CNNs through transfer learning to classify the waste dataset into nine classes. Models 1, 2, and 3 were built using Inception–ResNet, EfficientNetb3, and DenseNet201 as base models, respectively. An input layer was created for each model to define the image shape. The models’ feature extraction abilities were optimized using layers such as a batch normalization layer, dense layer, dropout layer, and an additional dense layer (classifier for nine classes). Once the models were trained on the waste dataset, the updated weights were ensembled through concatenation (third section) and trained again (yellow in Figure 5). The networks’ loss function, also called its objective function, was defined using categorical crossentropy (multiple classes). The optimizer in charge of the networks’ learning rate was set using Adamax (0.001 initial learning rate). When CNN models are trained independently, the concatenation step is challenging and leads to errors because layers have repetitive names and parameters are not compatible. To resolve the issue, a method was created to allow Models 1, 2, and 3 to be trained and validated in the same algorithm. The models were saved and used to build, train, and validate the ensemble model.

3.4. Experiment Setting

Four CNN models (Model 1: Inception–ResNet-v2 based, Model 2: EfficientNetB3 based, Model 3: DenseNet201 based, and Model 4: the Ensemble Model) were run with the waste dataset of 8346 images containing nine classes of waste. CNNs. The training was completed on 80% of the waste dataset and the remaining 20% was used for testing and validation. The networks were trained in 80 epochs.

3.5. Performance Measures

The performance of each CNN model was evaluated using accuracy, precision, f-1 score, and recall. Performance metrics were evaluated using prediction indicators, true and false positives and true and false negatives. A true positive is when a data point belonging to a positive class is correctly predicted (belongs to positive class). A true negative is when a data point belonging to a negative class is correctly predicted (belongs to negative class). Alternatively, a false positive and negative correspond to an incorrect prediction of a positive and negative class, respectively.
Accuracy is the number of correct predictions made over the total predictions (Equation (1)),
A c c u r a c y   ( % ) = T r u e   p o s i t i v e s + T r u e   n e g a t i v e s T o t a l   p r e d i c t i o n .
Precision is the ratio of true positives and total positives (Equation (2)),
P r e c i s i o n   ( % ) = T r u e   P o s i t i v e s ( T r u e   p o s i t i v e s   + F a l s e   p o s i t i v e s ) .
Recall or sensitivity is the quotient of true positive and sum of true positive and false negatives (Equation (3)),
R e c a l l   ( % ) = T r u e   P o s i t i v e s ( T r u e   p o s i t i v e s   + F a l s e   n e g a t i v e s ) .
F1-score is the harmonic mean of precision and recall (Equation (4)),
F 1   s c o r e   ( % ) = 2 × P r e c i s i o n × R e c a l l P r e c i s i o n + R e c a l l .

4. Results and Discussion

4.1. Performance Metrics

Figure 6 shows the accuracy, precision, recall, and F1-score of the Ensemble Model and the three single networks (Models 1, 2, and 3). The Ensemble Model was the most performant model (accuracy: 90% and precision: 90%) and was followed by Model 3 (accuracy: 88% and precision: 88%). Model 2 (accuracy: 87% and precision: 87%) and Model 1 (accuracy: 86% and precision: 86%) were the poorest performing models. As shown in Table 2, the Ensemble Model predicted each waste class did better than Models 1, 2, or 3. The precision accuracy for wood was very low for all models. However, the Ensemble Model prediction accuracy was higher (71% precision) than those of Models 1, 2, and 3 (69%, 63%, and 70%, respectively). The low precision accuracy for wood is due to the small data size of the class (Table 1). Another reason for the misclassification of wood as food or cardboard was due to feature similarities among the classes. The prediction accuracy of the model proposed in this study was higher than the results reported by Gyawali, Regmi, Shakya, Gautam and Shrestha [4] (88% accuracy) and Zhang, Yang, Zhang, Bao, Su and Liu [7] (82% accuracy). These results proved that combining multiple pretrained CNNs as base model increased feature extractions abilities and led to higher prediction accuracy. The effect of waste class number on the Ensemble Model’s performance was investigated by training and testing the model to predict six waste classes. The model showed a prediction accuracy of 93%, leading to the conclusion that the model’s performance increases as the number of classes decreases.

4.2. Error Per Class and Model

Wood, textiles, paper/cardboard, and plastics were the waste classes with the highest prediction errors. The prediction errors were calculated by summing misclassified images per class and per model. As mentioned above, all models performed poorly in classifying wood, with precision values of 69, 63, 70, and 71% for Models 1, 2, and 3 and the Ensemble Model, respectively. Prediction performances for Models 1 and 2 were low for plastics (82 and 83%, respectively), while Model 3 showed a low precision for paper and cardboard class (86%). Figure 7 shows the percentage of errors for each model per class. Overall, the Ensemble Model had the lowest prediction error. However, this model was the second-most accurate in predicting glass (behind Model 3), textiles (behind Model 1) and wood (behind Model 3).

4.3. Confusion Matrix

The confusion matrices (Figure 8) show the models’ prediction performance on the test dataset. The horizontal axis represents the predicted values (predicted classes) from the CNN models and the vertical axis shows the true values (true classes) of the data. The diagonal line represents accurate predictions. Although the Ensemble Model’s overall performance was higher than those of Models 1, 2, and 3, the results showed that all models had difficulties in the classification of waste classes with similar features such as glass and plastics, paper/cardboard and wood, e-waste and aluminum and wood and organic waste. Azis, et al. [19] reported that plastics were confused with glass and cardboard. Susanth, et al. [20] confirmed that glass was misclassified as metal and plastic, metal as glass, plastic as glass, and metal and paper as trash. Rahman, et al. [21], Mao, et al. [22], and this study observed similar trends. According to Huang, Lei, Jiao and Zhong [6], the misclassification errors could be due to several issues such as: 1. plastic and glass bottle were so similar that the human eye could not detect a difference; 2. a plastic or glass bottle was covered with a plastic or paper label; and 3. metal was covered with a plastic or paper sticker. Wood and textiles were additional classes sorted in this study. Wood was mostly misclassified as paper and carboard because of feature similarities. Mao, Chen, Wang and Lin [22] supported that paper and carboard features were extracted based on the edges and corners. Wood shares similar features.
This study was a unique case study using three CNN models’ knowledge to classify landfill waste into nine classes. Limited number of peer reviewed journals in the field have reported such a comparison. Table 3 shows the comparison between other research findings (4 conferences and 2 journals), and the results obtained with the ensemble method. The Ensemble method’s accuracy was higher than the accuracies reported by Miko, et al. [23] (75%) with Inception v3 and Ruiz, et al. [24] with ResNet (89%). Accuracy reported by other studies varied between 93 and 95% when models were trained to classify six classes (Table 3), while this study classified nine waste classes. An evaluation of the Ensemble Model on six waste classes showed a higher accuracy (93%) than on nine waste classes, which was among the highest. Wood misclassification led to lower nine-class prediction accuracy. In addition, the characteristics of the dataset (non-uniform background, different color light, and non-obvious features) used to train and test the models affected the results. Overall, the Ensemble Model prediction performance was higher than the pretrained CNNs investigated in this study. The results of that model proved that the combination of transfer and ensemble learning reduced the sensitivity of CNNs to small datasets and increased useful feature extraction.
Trained CNN models are dependent on image datasets that the model was trained on, as the model’s learning process is based on features extracted from the images. Waste image prediction is challenging because of image noises such as background, object deformation, dirt, and presence of several types of waste on an image. To increase the prediction accuracy of the models presented in this study, images with several backgrounds and deformed images were included in the dataset. Though these types of noise were included in the dataset used in this study, other noise types, such as wastes with soil/dirt, were not included.

4.4. Models Training Cost

Training CNNs requires large computational resources with fast GPUs. Although cost can vary with time and between vendors, the average value of a Tesla T4 GPU is $1797 [26]. This study trained and tested the ensemble model on a paid subscription of Google Colab Pro using GPU (Tesla T4). Use of computational resources to train CNNs requires energy consumption and therefore leads to an environmental cost. Using the method proposed in Strubell, et al. [27], the carbon footprint of training the CNN models was calculated. The total power consumption (Pt) of each model shown in (Equation (5)) was calculated using each model’s training time (t), the 2022 power usage effectiveness factor (1.55) [28], and the power (Pg) consumed by the Tesla T4 GPU (70 W) [29]. The environmental cost is the amount of CO2 emitted due to training the CNN models and was calculated using the factor provided by the US EPA for average CO2 produced per power consumed (0.976 lb. of CO2 equivalent/kWh) [30]. Table 4 shows the training time, total power consumption and environmental cost (grams CO2 equivalent) of the Ensemble network and Models 1, 2, and 3.
P t = 1.58   t P g
According to Table 4, training the Ensemble networks emitted less carbon dioxide (15.45 g CO2 equivalent) compared to Models 1 (19.23 g CO2 equivalent) and 2 (15.68 g CO2 equivalent). However, Model 3 showed the lowest carbon footprint (15.04 g CO2 equivalent). The Ensemble Model was built using three networks. However, the Ensemble Model’s training time, power consumption, and environmental cost are close to, or lower than the single networks’ computational cost. These results proved that the combination of transfer and ensemble learning was energy-efficient.

5. Conclusions

The exponential increase in waste generation, shortage of land availability, and environmental and health related issues have led to the search for novel waste management methods to limit landfilling. Waste recycling is one of the most preferred methods for waste management. However, due to lack of cost-effective sorting technologies, waste segregation and recycling remain a challenge. Advances in machine learning have the potential to solve this challenge through development of automated and visually guided robotic arms to sort wastes. In this study, several models (Models 1, 2, and 3) were developed with pretrained Inception-ResNet-v2, EfficientNetB3, and DenseNet201 as base models using transfer learning. An ensemble model was developed using a combination of the three models via transfer and ensemble learning. The performance metrics showed the ensemble model was the highest performant of all networks, with a precision of 90%, while precision ranged from 86% to 88% for Models 1, 2, and 3. The results showed that by combining transfer and ensemble learning approaches, network performance increased and increased essential feature extraction despite, the relatively small dataset. Additionally, the multi-network’s environmental cost (15.45 g CO2 equivalent) was similar to single networks’ (Models 2 and 3) cost (15.68 and 15.04 g CO2 equivalent, respectively) and lower than Model 1′s environmental impact (19.23 g CO2 equivalent).

Author Contributions

Conceptualization, A.S.O., A.K. and N.W.; methodology, A.S.O.; software, A.S.O.; validation, A.K. and N.W.; formal analysis, A.S.O.; investigation, A.S.O.; resources, A.K. and N.W.; data curation, A.S.O.; writing—original draft preparation, A.S.O.; writing—review and editing, A.K. and N.W.; visualization, A.S.O., A.K. and N.W.; supervision, A.K. and N.W.; project administration, A.K.; funding acquisition, A.K. All authors have read and agreed to the published version of the manuscript.

Funding

This research was funded in part by the OSU Research Foundation, Oklahoma Agricultural Experiment Station, and the USDA National Institute of Food and Agriculture, Hatch project 1019511.

Data Availability Statement

Publicly available datasets were analyzed in this study. This data can be found here: https://www.kaggle.com/datasets/angelikasita/waste-images.

Conflicts of Interest

The authors declare no conflict of interest.

References

  1. US Environmental Protection Agency. National Overview: Facts and Figures on Materials, Wastes and Recycling. Available online: https://www.epa.gov/facts-and-figures-about-materials-waste-and-recycling/national-overview-facts-and-figures-materials (accessed on 1 March 2021).
  2. The World Bank. Solid Waste Management. Available online: https://www.worldbank.org/en/topic/urbandevelopment/brief/solid-waste-management (accessed on 24 March 2022).
  3. Ouedraogo, A.S.; Frazier, R.S.; Kumar, A. Comparative Life Cycle Assessment of Gasification and Landfilling for Disposal of Municipal Solid Wastes. Energies 2021, 14, 7032. [Google Scholar] [CrossRef]
  4. Gyawali, D.; Regmi, A.; Shakya, A.; Gautam, A.; Shrestha, S. Comparative analysis of multiple deep CNN models for waste classification. arXiv 2020, arXiv:2004.02168. [Google Scholar]
  5. Chu, Y.; Huang, C.; Xie, X.; Tan, B.; Kamal, S.; Xiong, X. Multilayer hybrid deep-learning method for waste classification and recycling. Comput. Intell. Neurosci. 2018, 2018, 5060857. [Google Scholar] [CrossRef] [PubMed] [Green Version]
  6. Huang, K.; Lei, H.; Jiao, Z.; Zhong, Z. Recycling waste classification using vision transformer on portable device. Sustainability 2021, 13, 11572. [Google Scholar] [CrossRef]
  7. Zhang, Q.; Yang, Q.; Zhang, X.; Bao, Q.; Su, J.; Liu, X. Waste image classification based on transfer learning and convolutional neural network. Waste Manag. 2021, 135, 150–157. [Google Scholar] [CrossRef] [PubMed]
  8. Deng, J.; Xu, W.-Y.; Zhou, C.-B. Investigation of waste classification and collection actual effect and the study of long acting management in the community of Beijing. Huan Jing Ke Xue 2013, 34, 395–400. [Google Scholar] [PubMed]
  9. Li, F.-F.J.D.; Olga, R.; Alex, B.; Kai, L. About ImageNet. Available online: https://www.image-net.org/about.php (accessed on 14 September 2022).
  10. Russakovsky, O.; Deng, J.; Su, H.; Krause, J.; Satheesh, S.; Ma, S.; Huang, Z.; Karpathy, A.; Khosla, A.; Bernstein, M. Imagenet large scale visual recognition challenge. Int. J. Comput. Vis. 2015, 115, 211–252. [Google Scholar] [CrossRef]
  11. Szegedy, C.; Ioffe, S.; Vanhoucke, V.; Alemi, A.A. Inception-v4, inception-resnet and the impact of residual connections on learning. In Proceedings of the Thirty-First AAAI Conference on Artificial Intelligence, San Francisco, CA, USA, 4–9 February 2017. [Google Scholar]
  12. Elhamraoui, Z. InceptionResNetV2 Simple Introduction. Available online: https://medium.com/@zahraelhamraoui1997/inceptionresnetv2-simple-introduction-9a2000edcdb6 (accessed on 7 July 2022).
  13. Tan, M.; Le, Q. Efficientnet: Rethinking model scaling for convolutional neural networks. In Proceedings of the International Conference on Machine Learning, Long Beach, CA, USA, 9–15 June 2019; pp. 6105–6114. [Google Scholar]
  14. Zhang, P.; Yang, L.; Li, D. EfficientNet-B4-Ranger: A novel method for greenhouse cucumber disease recognition under natural complex environment. Comput. Electron. Agric. 2020, 176, 105652. [Google Scholar] [CrossRef]
  15. Huang, G.; Liu, Z.; Van Der Maaten, L.; Weinberger, K.Q. Densely connected convolutional networks. In Proceedings of the IEEE Conference on Computer Vision and Pattern Recognition, Honolulu, HI, USA, 21–26 July 2017; pp. 4700–4708. [Google Scholar]
  16. Google. Welcome to Colaboratory Google (Google Colab); Google: Mountain View, CA, USA, 2022. [Google Scholar]
  17. Keras. About Keras. Available online: https://keras.io/about/ (accessed on 14 September 2022).
  18. Sekar, S. Waste Classification Date; Kaggle: San Francisco, CA, USA, 2019. [Google Scholar]
  19. Azis, F.A.; Suhaimi, H.; Abas, E. Waste classification using convolutional neural network. In Proceedings of the 2020 2nd International Conference on Information Technology and Computer Communications, Online, 12–14 August 2020; pp. 9–13. [Google Scholar]
  20. Susanth, G.S.; Livingston, L.J.; Livingston, L.A. Garbage Waste Segregation Using Deep Learning Techniques. In Proceedings of the IOP Conference Series: Materials Science and Engineering, Chennai, India, 2–3 October 2020; p. 012040. [Google Scholar]
  21. Rahman, M.W.; Islam, R.; Hasan, A.; Bithi, N.I.; Hasan, M.M.; Rahman, M.M. Intelligent waste management system using deep learning with IoT. J. King Saud Univ.-Comput. Inf. Sci. 2020, 34, 2072–2087. [Google Scholar] [CrossRef]
  22. Mao, W.-L.; Chen, W.-C.; Wang, C.-T.; Lin, Y.-H. Recycling waste classification using optimized convolutional neural network. Resour. Conserv. Recycl. 2021, 164, 105132. [Google Scholar] [CrossRef]
  23. Miko, P.; Shiela, M.M.; Hilary, R.; Mary, J.S. i-BIN: An Intelligent Trash Bin for Automatic Waste Segregation and Monitoring System. In Proceedings of the 2019 IEEE 11th International Conference on Humanoid, Nanotechnology, Information Technology, Communication and Control, Environment, and Management (HNICEM), Laoag, Philippines, 29 November–1 December 2019. [Google Scholar]
  24. Ruiz, V.; Sánchez, Á.; Vélez, J.F.; Raducanu, B. Automatic image-based waste classification. In Proceedings of the International Work-Conference on the Interplay Between Natural and Artificial Computation, Almería, Spain, 3–7 June 2019; pp. 422–431. [Google Scholar]
  25. Geetha, S.; Saha, J.; Dasgupta, I.; Bera, R.; Lawal, I.A.; Kadry, S. Design of Waste Management System Using Ensemble Neural Networks. Designs 2022, 6, 27. [Google Scholar] [CrossRef]
  26. David. Alternative to Colab Pro: Comparing Google’s Jupiter Notebooks to Gradient Notebooks (Updated). Available online: https://blog.paperspace.com/alternative-to-google-colab-pro/ (accessed on 26 December 2022).
  27. Strubell, E.; Ganesh, A.; McCallum, A. Energy and policy considerations for deep learning in NLP. arXiv 2019, arXiv:1906.02243. [Google Scholar]
  28. Davis, J.; Bizo, D.; Lawrence, A.; Rogers, O.; Smolaks, M. Uptime Institute Lobal Data Center Urvey 2022; Uptime Institute: New York, NY, USA, 2022. [Google Scholar]
  29. Techpowerup. Tesla T4 Specs. Available online: https://www.techpowerup.com/gpu-specs/tesla-t4.c3316 (accessed on 26 December 2022).
  30. U.S Environmental Protection Agency. Emissions & Generation Resource Integrated Database (eGRID). Available online: https://www.epa.gov/egrid (accessed on 26 December 2022).
Figure 1. Inception–ResNet-v2 architecture inspired from [11].
Energies 16 05980 g001
Figure 2. Model Scaling. (a) a baseline network example; (bd) conventional scaling that only increases one dimension of network width, depth, or resolution. (e) proposed compound scaling method that uniformly scales all three dimensions with a fixed ratio [13].
Energies 16 05980 g002
Figure 3. DenseNet 201 architecture.
Energies 16 05980 g003
Figure 4. Sample of images from the collected dataset.
Energies 16 05980 g004
Figure 5. Ensemble model architecture.
Energies 16 05980 g005
Figure 6. Performance metrics on validation data per model (%).
Energies 16 05980 g006
Figure 7. Classification error on validation set per class and model.
Energies 16 05980 g007
Figure 8. Confusion matrices: (a) Model 1; (b) Model 2; (c) Model 3; (d) Ensemble.
Energies 16 05980 g008
Table 1. Waste dataset collection and repartition per class.
ClassesClass ItemsInitial
Database
Added DatabaseTotal Number of Images
1AluminumCanes, plates, bottles, leads, bottle openers, trash cans, cooking pots, car parts, and silverware1019-1019
2CartonJuice, milk, and cigarettes boxes382151533
3E-wasteBatteries, electronics (computer, phones, etc.) circuit boards, microchips, cables, and chargers -10291029
4GlassBottles, jars, containers, cups, decoration, plates, and pitchers1089-1089
5Organic wasteFruits, vegetables, meats, fast food, meals, plants, seeds, cheese, bread, and eggshells1053-1053
6Paper and cardboardNewspapers, magazines, books, shipping boxes, letters, envelopes, gift and pizza boxes, shredded paper, flyers, and stickers. 1194-1194
7PlasticsBottles, containers, cups, plates, food packaging, bags, silverware, furniture, cases, buckets, planting pots, and trash bins 1035-1035
8TextilesClothes, curtains, towels, decorations, sheets, bags and fabric346484830
9WoodSigns, furniture, cases, wood blocks, tiles, utensils, plates, silverware, wine cork, pellets, boards, baskets, mashed wood, and containers.418146564
Total 653618108346
Table 2. Models’ precision per class (%).
EnsembleModel 1Model 2Model 3
Aluminum 95889491
Carton 95909188
E-waste 93929092
Glass 93929192
Organic waste92889089
Paper & cardboard88878586
Plastics87828389
Textiles 95869592
Wood 71696370
Table 3. Comparative results of different models.
#MethodData SourceData SizeNumber of ClassesClassesAccuracy (%)References
1Inception V3-2433 6Cardboard, glass, paper, plastic, metal, and organic waste75[23]
2ResNetTrashNet25276Cardboard, glass, paper, plastic, metal, and trash89[24]
3Inception-v3GitHub24006Cardboard, glass, paper, plastic, metal, and others93[19]
4YOLO-25276Cardboard, glass, paper, plastic, metal, and organic trash94[25]
5DenseNet169 TrashNet and Google images41636Cardboard, glass, paper, plastic, metal, and trash95[20]
6ResNet-34GITHUB25606Cardboard, glass, paper, plastic, metal, and trash95[21]
7EnsembleKaggle and Google images55596Cardboard, glass, paper, plastic, aluminum, and organic waste93This study
8EnsembleKaggle and Google images83469Paper and cardboard, glass, plastic, aluminum, organic waste, carton, wood, textiles, and e-waste 90This study
Table 4. CNNs models computational costs.
CNN ModelsTraining Time (Minutes)Total Power
(Wh)
Environmental Cost
(g CO2 Equivalent)
Ensemble19.2834.8715.45
Model 124.0043.4019.23
Model 219.5735.3815.68
Model 318.7733.9415.04
Disclaimer/Publisher’s Note: The statements, opinions and data contained in all publications are solely those of the individual author(s) and contributor(s) and not of MDPI and/or the editor(s). MDPI and/or the editor(s) disclaim responsibility for any injury to people or property resulting from any ideas, methods, instructions or products referred to in the content.

