Review

Ecological Hydrogen Production and Water Sterilization: An Innovative Approach to the Trigeneration of Renewable Energy Sources for Water Desalination: A Review

Department of Industrial Thermal Power Engineering, Institute of Energy and Power Engineering, South Ural State University, 76 Prospekt Lenina, 454080 Chelyabinsk, Russia
*
Author to whom correspondence should be addressed.
Energies 2023, 16(17), 6118; https://doi.org/10.3390/en16176118
Submission received: 5 July 2023 / Revised: 3 August 2023 / Accepted: 11 August 2023 / Published: 22 August 2023
(This article belongs to the Section A5: Hydrogen Energy)

Abstract

:
In this study, hydrogen production by solar thermal energy has been studied in terms of economics, technology and hydrogen sources. Methane was captured and subjected to solar photovoltaic steam, solar methane cracking, high-temperature water electrolysis and thermochemical cycles. The price of hydrogen production was calculated compared to other methods, and means of using and exploiting hydrogen as an energy carrier were examined in addition to verifying the industrial need for hydrogen, especially in the presence of high solar energy, which improves hydrogen production. The study was carried out in order to generate hydrogen using a solar electrolyzer based on polymeric exchange membrane technology. The study was carried out using two methods. The first was involved the direct connection of the photovoltaic system to the hydrogen analyzer, and the second was a system for a solar electrolysis hydrogen analyzer consisting of a PV array and a maximum power tracker MPPT meant to operate the system at the maximum power of the photovoltaic system at all times uses a DC converter to supply the analyzer. With the necessary current and hydrogen tank, the results showed that the first method was less effective compared to the second method due to the instability of the intensity of solar radiation during the day, and the results show that adding potassium hydroxide, for example, enhances ionization and improves hydrogen supply.

1. Introduction

Hydrogen is being studied as a clean and sustainable energy source to reduce air pollutants, combat global warming, and decrease reliance on finite resources like oil. Renewable energy sources, particularly solar and thermal energy, are being explored for hydrogen production through processes like water electrolysis. The German Aerospace Center has been involved in various projects related to solar thermal processes for hydrogen generation. However, the transportation of hydrogen is expensive and inefficient, leading to economic losses when transporting it over long distances. Despite this, hydrogen remains important for meeting future energy demands and addressing climate and environmental concerns.
Replacing fossil fuels with hydrogen can generate electricity, heat, and mechanical energy, with potential applications in transportation and industrial production. However, challenges exist in establishing infrastructure for hydrogen storage, transportation, and renewable production. The length of the transmission chain reduces energy efficiency and poses a disadvantage. Models and simulations of energy systems have been developed to optimize the cost and utilization of hydrogen. Future projections indicate an increasing demand for hydrogen, particularly in fuel cell vehicle systems.
Solar thermal hydrogen is still under development but holds promise for improving the cost and performance of hydrogen production. It is estimated that hydrogen demand in Europe will reach 3.8% of final energy demand by 2050, with global demand reaching 17 EJ. Nuclear fission techniques are expected to play a role in hydrogen production. In the transportation sector, hydrogen demand is projected to account for about 12 equivalent units globally by 2055. Various concepts and cycles, such as solar thermal chemical cycles and methane separation, are being explored to produce hydrogen efficiently. Concentrated solar radiation is a valuable heat source for solar thermal processes, which involve central receivers and reactors. These processes offer the advantage of low emissions of polluting gases [1,2,3,4,5,6,7,8,9,10,11]. In Table 1 data on the cost price of hydrogen in 2022 are presented [5].
A case study on the use of 600 MW of electricity from the New Zealand Manapuri power plant for the production of hydrogen by electrolysis of water was carried out in 2022. Three H2 carriers—liquid H2, ammonia, and toluene hydrogenation/methylcyclohexane dehydrogenation—were modeled using Aspen’s HYSYS to estimate the associated energy and annual capital costs. Surprisingly, the total volume of capital investments for all carriers remained unchanged but with clear patterns of distribution between the electrolysis and molding of carriers (Figure 1).
Analysis showed that the energy availability of liquid H2 ranges from 53.9% to 60.7% depending on the energy costs associated with cryogenic liquefaction of H2. For liquid ammonia, the energy reserve was 37.5% after the reverse conversion to H2, increasing to 53.6% when ammonia could be directly used as fuel. The energy availability of toluene/methylcyclohexane was 41.2%.
Total electricity costs and annual capital costs per kilogram of H2 varied depending on the carrier, with ranges from NZ $5.63 to NZ $6.43 for liquid H2, NZ $6.24 to NZ $8.91 for ammonia, and a cost of NZ $7.86 for toluene/methylcyclohexane, taking into account a net electricity cost of NZ $70 per MWh. Our results show that the cost of hydrogen (or energy for the direct use of ammonia) largely depends on the efficiency of energy saving, with electricity costs accounting for about two-thirds of the total costs [8].

2. Materials and Methods

The solar panel data needs to be analyzed. A description of the main characteristics is given in Table 2.
Charging regulator specifications:
Model: S.C.C-M.P.P. T 650 W;
Input: 35 Vdc-80 Vdc;
Input: 25 A 24 Vdc;
Capacity: 650 W.
Batteries:
Model Type: N.150.(145.G51R);
Capacity: 160 Ah
12 v
Analyzer model:
The analyzer model (Figure 2) consists of a transparent acrylic plastic box with its cover, the electrodes, the aqueous medium, the polymeric exchange membrane, and the copper conductive wires. The analyzer includes two parallel plates with the dimensions of 5.5 cm. Between them is a polymeric exchange membrane, and the distance between the poles can be expressed to become 1.5, 5.0, 7.5, 10 cm [7].
Mediator:
Distilled water solutions containing potassium hydroxide at 5, 10, 20, and 30 gr/L were added to cover the electrodes of the analyte.
Electrode:
Manufactured from 316 stainless steel.
Hydrogen production from the system and direct connection:
Hydrogen productivity was studied according to this method. During daylight hours, the intensity of solar radiation appears as in the following Figure 3, Figure 4, Figure 5, Figure 6 and Figure 7.

2.1. Hydrogen Yield by System

This method depends on feeding the analyzer from the charging battery with a DC–DC converter. The figure shows the relationship between the hourly and cumulative hydrogen gas volumes at the direct connection (vertical axis) according to daylight hours (horizontal axis) and with a distance of 1.5 cm between the electrodes.
Consider the data shown in Table 3.

2.2. Thermochemical Solar Cycles

Solar thermochemical cycles have been successfully developed. The redox cycle of iron oxide is a two-stage process of splitting water. The thermal decomposition of water is achieved using a reactor receiving solar heat, supported by a honeycomb ceramic substrate and coated with an active redox reagent containing metal oxide. Oxidation and reduction are activated and oxidized (metal oxide) to produce pure hydrogen with gaseous oxygen from water at a temperature of 820 °C. In the second stage, the oxidizing reagent must be completely regenerated by optimizing the temperature to approximately 1150 °C in an atmosphere with zero oxygen content. Using nitrogen, oxygen is catalyzed to activate adsorption.
Depending on the solar thermal power, the expected efficiency of the process is about 72%. The reduction and oxidation systems were developed in the laboratory by H.Y.D.R.O.O.L. The project focuses on finding optimal reducing agents and oxidants in terms of hydrogen production and regeneration potential. During the process, the appropriate installation and operation strategies are optimized in order to achieve reliability in 500–1000 cycles and thereby increase efficiency.
Consider Figure 8.
The thermochemical cycle of hybrid sulfur and hydrogen sulfide and two processes in which the thermal separation of sulfuric acid at 855 °C in an unidentified recipient reactor at 1250 with or without a catalyst were determined. The hybrid sulfur process uses electrolysis to resume the production of sulfuric acid and pure hydrogen [10].
The sulfur iodization process is based on the Bunsen reaction for the regeneration of used acids and on thermal cleavage (HI) for the production of uncontaminated (pure) hydrogen. Absorption units are used to separate oxygen from the gas stream. Within the framework of the H.Y.T.H.E.C. project, the operational capabilities of various process configurations (heat capacity, catalysts, and temperature) were analyzed. One of the key stages in solar energy is the transfer, optimization and analysis of thermal energy in a reactor using a standard modeling tool.
With reduced heat loss, a maximum efficiency of 36% is required for an industrial plant with a capacity of 50 MW [2]. Developing resistance to concentrated acids at high temperatures is the most difficult task. The integration and design of the main parts, such as the exchanger, absorber and others—which are made of resistant materials (ceramics)—as well as the separation of products are goals for the future. There are some costs associated with coating components and advanced catalytic systems. Research is aimed at optimizing the receiving reactor so as to be suitable for the separation of sulfuric acid. Electrolysis is the second important step for the hybrid. The process of producing sulfur also needs further development in terms of lowering heat loss, lowering overvoltage and achieving high current density; the feedback is low.

2.3. Using Solar Steam to Improve Methane

This process depends on the thermal decomposition of steam and methane mixed at temperatures between 850 and 1100 °C. For the natural gas pretreatment process and the production of pure hydrogen, Syngas must be cleaned. Gas cleaning consists of converting water vapor to carbon dioxide, performing unstable pressure adsorption to remove hydrogen and washing gas with MDEA to separate residual carbon dioxide from recyclable methane.
The hatch is designed to provide the process with the necessary heat from concentrated solar energy and a reformer bowl with a quartz window covering receiver and compact volumetric receiver. A prototype was realized and tested within the S.O.L.A.S.Y.S project. Its operating pressure is 10 bar, and the receiver absorbs 450 kW of heat energy. The project showed the possibility of generating practical heat for operation through the future volumetric reactor. For power generation, the synthesis gas produced in small gas turbines was used and the chemical reaction occurred at around 900 °C. The estimated cost for a commercial plant with a thermal capacity of 50 megawatts and 2.100 full operating hours annually (when direct solarization 2500 kWh/m2 general).
The S.O.L.R.E.F project is looking to reach a temperature above 950 °C in order to connect the reactor and process the gas to produce pure (non-polluting) hydrogen and increase process efficiency. Daily start-up and solar power output cause intermittent operation problems, reducing system durability and reliability. Additionally, the catalyst and acceptor materials must be selected to achieve optimum heat, and due to the 85% methane conversion rate, the process requires the recovery/separation of the methane residues. System and operating parameters will be optimized to reach high efficiency, stability, and high recovery rate of carbon dioxide and hydrogen while also working with alternative materials such as biogas [17].

2.4. Solar Methane Separation

The release of solar methane leads to the release of thermal methane, primary carbon and hydrogen in the atmosphere, where the percentage of oxygen is zero when using solar temperatures from 1300 to 2200 °C. Carbon can be separated industrially using a filter and cyclone, and this affects the structure and quality of carbon as well as the cost of processing. One of the most important tasks taken up in this research project is to determine the type of reactor and the layout for optimal technological processing using the results of experimental tests implemented as part of the pilot plant S.O.L.H.Y.C.A.R.B with a thermal capacity of 50 kW [18,19,20,21,22,23,24,25,26,27,28,29,30,31,32,33,34,35,36].
The research team aims to convert methane at a rate of more than 85% and research the separation of carbon and hydrogen particles in addition to safety issues. The commercial price of carbon black is the main factor for adjusting the resulting hydrogen costs. For the production of high-quality carbon, a temperature above 1816 °C is required, which leads to problems with the efficiency of the process and the properties of the material.
One possible problem is that the temperature drop is too low, which leads to the formation of polycyclic aromatic hydrocarbons (PAHs), which are by-products. Another problem is that methane cannot absorb solar energy directly, and therefore, methane gas is not heated by solar energy. We will test the receiving tube made of high-temperature material and test the gas flow with particles loaded into it. It is necessary to compare the efficiency of this process with other processes, such as the capture and optimization of solar methane and the storage of carbon particles underground, compared with the release of carbon dioxide.

2.5. Comparison of Hydrogen Getting Methods

After 2030, low-cost wind-based electrolysis will appear as a viable future option for renewable hydrogen production in the market. The gasification method is also a competitive method for low hydrogen production costs. However, the uses of biomass as a fuel for solar thermal power plants and as a transportation biofuel only have limited potential [19]. Methane separation could be competitive with conventional production if gas and coal prices rise further.
The leading method is hydrogen production by relying on methane in direct emissions of multiple gases, including carbon dioxide, and emissions resulting from the distribution, treatment and extraction of gas. Carbon dioxide emissions from methane enhancement with solar steam (not equipped with carbon sequestration technology) can be greater than the emissions from fossil options using CO2 storage and capture.
In addition to future domestic supply, it is possible to export hydrogen from the producing regions to the consuming and marketed European and American markets, by pipelines or ships, but the energy efficiency decreases and reaches 50% and the costs increase.
Producing clean, carbon-free hydrogen using an unlimited energy source is the main advantage of solar thermal energy, making hydrogen a sustainable and climate-friendly fuel. The efficiency of hydrogen production by electrolysis and photovoltaic means is at or significantly lower than land use and related to solar thermal input, according to Figure 9. Building on process development and future demand for hydrogen and energy, the solar thermal process presents as an alternative a semi-permanent option for transcontinental energy import and an excellent method for hydrogen production renewable for local use.
Other methods of hydrogen production due to solar energy and distillate electrolysis are possible, and they have been presented in various studies.
This study presents the design, modeling, and behavior of a solar distiller using computational fluid dynamics (CFD). The study aimed to measure various parameters, such as changes in internal temperature, coating and volume formed after the solar distillation process, as well as transfer coefficients obtained during the months of operation. The results of the study showed that in May, there was the highest average indoor water temperature—44 °C—and the production of distilled water was the highest—an average of 1000 mL per day. In addition, in the same month, the average amount of falling global radiation per day was 5.8 kWh/m2, which is the highest indicator for all months of operation. The Kumar and Tiwari model was applied to study the thermal behavior of a solar distiller. The study also conducted a water quality analysis to determine the suitability of distilled water for drinking, which met the standard NOM-127-SSA1-1994. The study showed that the internal temperature of the coating and water increased as the incident radiation increased. The heat transfer coefficients behaved similarly but also depended on the internal temperature of the glass. The amount of distillate is directly related to the above variables, which indicates that high heat transfer between the various components of the distillation equipment is required to obtain a larger volume of distillate. CFX modeling showed the behavior of distillation equipment during water production and the temperature of glass and water. Differences were found between the experimental method and CFX modeling: the difference in water temperature was 5.8%, and the volume of the distiller was 8.2%. It was found that the efficiency of the equipment is within the parameters reported by other authors. However, it has been observed that climatic conditions can affect the operation of the solar distiller. The key to high efficiency is radiation, but wind speed and ambient temperature can affect system performance. The results in CFD have a slight difference from the results of the experiment, which makes improvements aimed at improving the efficiency of equipment possible, either by adding new components for forced convection, by adding heat to the system, or by improving structural materials. The study concludes that distilled water can be produced in regions with a shortage of drinking water. Overall, the study provides valuable information about the design, modeling, and behavior of a solar distiller using CFD. The results obtained may be useful to researchers and engineers working in the field of solar distillation and may contribute to the development of more efficient systems [37].
This paper presents a mathematical model for the analysis of multi-stage and multi-effect desalination systems. The model takes into account the geometry of the steps, the mechanisms of heat transfer and the physical properties of seawater, including temperature and salinity. Pollution is also taken into account, and its effect on the efficiency of the installation is evaluated. The study shows the relationship between operational and design parameters, including the plant performance coefficient, the specific consumption of recirculating brine, the temperature of the upper brine layer and the specific heat transfer area. The model is applied to a typical operating plant, and the results are compared with data from the Sidi-Krir plant in western Alexandria, which has 17 stages of restoration and three stages of rejection. The calculation results are consistent with the factory data. The model is also used to study various operating conditions, such as partial loading, and the influence of variables such as recirculated flow rate, brine top layer temperature, seawater temperature and pollution coefficient on the efficiency of the installation. With multi-effect desalination using a boiling incident film, the study examines the effect of technological parameters on productivity, including the number of effects and the upper temperature of the brine. The specific heat transfer area and cooling brine consumption are also studied. The study showed that the efficiency depends on the number of effects and slightly depends on the temperature of the upper brine layer [38,39].
This study presents a comparison of the performance of two conventional solar distillers and a heat storage system with a flat plate collector in the city of Shebin el-Kom, Egypt. The experiments were conducted in August, September, November and December 2015. This review examines the technical aspects of heat exchange tubes in thermal desalination plants, which are the main cost item and account for 25–35% of the total cost of the evaporator. The authors seek to identify the technical aspects of the components that could lead to the optimization of the number of materials and improve quality and reliability. The review combines corrosion/material selection aspects and thermodynamic aspects for the analysis and specification of thermal desalination plant pipes. The authors compare the use of different alloys in terms of thermal resistance to heat transfer and resistance to erosion/corrosion and assess the economic consequences associated with the choice of different materials, taking into account the service life of the installation. The technical specifications contain recommendations for future optimization. In general, a comprehensive technical analysis of heat exchange pipes is presented, which is important for reducing costs and improving the efficiency of thermal desalination plants [40].
This study presents the design and production of two single-pitched solar distillers with a heat storage system using a flat plate collector. The system collects solar energy during the day and accumulates it in a heat-insulated tank which is used as a heat source for one of the distillers—a modified distiller. Another distiller, a conventional distiller, uses exclusively solar radiation as a heat source. Experimental measurements were carried out during the day and over four seasons, and a theoretical study was conducted using energy balance equations to predict the performance of system components. The results showed a good agreement between theoretical and experimental data. The use of the recovery system increased the productivity of distillers, especially the modified distiller, which increased from 45% to 106% during the experiment period. The study also showed that productivity gains were lower in the spring and summer seasons compared to the other two seasons. In general, the models used made it possible to accurately predict the performance of a conventional distiller and a thermal storage system [41].
The review presents a study of a seawater distiller that uses the thermal energy of exhaust gases from a portable electric generator using a heat pipe. The distiller is a vertical diffusion unit with a single effect, still consisting of a series of closely spaced parallel partitions in contact with wicks soaked in saline solution. The study shows that 40 to 50% of thermal energy can be transported through a heat pipe and about 35% of thermal energy can be used for distilling salt water. The study also presents experimental results on distillate performance, which are in good agreement with theoretical forecasts. In general, the study represents a promising approach to seawater distillation, which may be useful in remote areas with a shortage of electricity [42].
This study evaluates the performance of a newly developed multi-effect distillation system with a capacity of 3 m 3 per day and a shell-and-tube heat exchanger that has been optimized for solar thermal desalination systems. In the experiment, a corrugated Cu (90%)–NI (10%) tube was used for efficient heat transfer. In the course of the study, the consumption of hot water was studied as a parameter of the effectiveness of multi-effect distillation. The study showed that the development of multi-effect distillation required approximately 40 kW of heat and 35 kW of a cooling source to produce 3 m3 of fresh water per day. The efficiency of the developed multi-effect distillation was approximately 2.0191. In general, the study provides valuable information about the performance of multi-effect distillation systems for solar thermal desalination and can serve as a basis for future research in this area [43].
The review presents a system of natural vacuum desalination of water with an internal condenser, powered by solar energy. This system allows the flowing seawater to absorb a small amount of solar heat to achieve phase-change evaporation. The system is capable of removing accumulated non-condensing gas through the process of filling with water and releasing air. The efficiency of solar-powered distillation was tested in real weather conditions using flat solar collectors with a total area of 18 m2. The results of the experiment with a constant temperature show that the output of fresh water and the cycle time increase with an increase in the temperature of hot seawater. Hourly water consumption can reach 12.45 kg/h at a temperature of 60 °C hot seawater and a mass flow rate of 0.1 kg/s seawater. The daily water consumption is 154.14 kg, and the corresponding efficiency is 1.36 in real weather conditions with an average solar illumination of 672 W/m2. In general, the review presents an effective system of natural vacuum desalination, which is powered by solar energy and provides high yields of fresh water. The results of the study demonstrate that the system is capable of producing fresh water at a low cost, which makes it an attractive option for increasing the productivity of freshwater [44].
The review presents a mathematical model for the analysis of multi-stage and multi-effect desalination systems. The model takes into account the geometry of the steps, heat transfer mechanisms and physical properties of seawater, environmental pollution is taken into account and its impact on the efficiency of the installation is evaluated. The model is applied to a typical operating plant, and the results are compared with data from the Sidi Crir plant in western Alexandria. The study shows the relationship between operational and design parameters, including the plant’s performance coefficient, the specific flow rate of circulating brine, the temperature of the upper brine layer and the specific heat transfer area. The study showed that the effectiveness depends on the number of impacts and slightly depends on the temperature of the upper brine layer. The review proposes the development of a solar desalination plant using vacuum tubes for water purification, which would provide inexpensive drinking water, especially in remote areas and regions with brackish and seawater. The system is powered by solar energy and does not contain any moving parts, which ensures a long service life of the system with minimal maintenance. The modified plant has an efficiency of about 6.5–7.0%, which is higher than that of conventional solar stills with one tank [45].
This review discusses the growing demand for freshwater due to population growth and industrialization, which leads to the development of desalination technologies using renewable energy sources. Vacuum desalination is presented as a method that involves increasing the pressure of brackish water, creating a vacuum and evaporation using waste heat. The study analyzes a vacuum water desalination system by applying mass, momentum and energy balances and solving control equations using simulation. The simulated performance is confirmed by experimental data from the literature, and the operating parameters, such as the temperature of the evaporator and condenser, flow rate and pressure in the chamber, vary. It is found that the output of freshwater increases with a decrease in the temperature of the condenser and an increase in the temperature of the evaporator, as well as with a decrease in the pressure in the chamber [46].
This scientific article examines the effectiveness of an autonomous solar vacuum membrane distillation (VMD) system for the desalination of seawater. The study evaluates various indicators such as membrane flow rate (MFR), efficiency coefficient (GOR), efficiency coefficient (PR), recovery coefficient (RR) and specific heat consumption (STEC). The results obtained are compared with previous studies of solar-powered membrane distillation systems in order to provide context for the results obtained. The authors also conducted a sensitivity analysis to determine the effect of operating parameters on GOR performance, finding that lower raw material consumption and higher feed temperature yield better GOR results. In addition, increasing the vacuum level and the area of the solar collector can increase the GOR value. Finally, the authors present an economic study to estimate the cost of distilled water production at a VMD solar installation. Overall, this study provides valuable information about the performance of the VMD solar system for seawater desalination, including key factors affecting its efficiency and cost-effectiveness [47].
This scientific review highlights the important role of seawater desalination technology in solving the problems of freshwater scarcity. It presents natural vacuum desalination (NVD) technology, which uses a very low-pressure environment created at the top of a 10 m column of water to facilitate desalination at low temperatures. Unlike other desalination technologies, NVD does not require mechanical pumping, and its simple design means that it can be made of relatively low-quality materials. The review provides an overview of the basic theory and physical model of NVD, summarizes the progress of research on various types of NVD technologies and outlines methods for increasing freshwater production. In addition, the authors discuss the potential future development of NVD technology. In general, this review gives valuable insight into NVD technology, highlights its advantages over other desalination technologies, and discusses how it can help solve the problems of freshwater scarcity [48].
This scientific review discusses the need for new water sources due to the current shortage of clean water on Earth and emphasizes that the desalination of seawater is a viable solution. The review is devoted to a widely used method that involves obtaining clean water by condensing evaporated salt water at low pressure, which is achieved due to natural vacuum and renewable energy using a vacuum pump. The study examines the efficiency of a water desalination system at various low pressures created by a vacuum pump at various condensation temperatures. The volume of desalinated water was measured at different evaporation temperatures, and the efficiency was analyzed for a given volume of desalinated water at reduced temperatures below 0 °C. The results show that salt water can be purified with an average efficiency of 99.6% in each experimental group. However, reducing the condensation temperature to −25 °C turned out to be unnecessary since a similar efficiency could be obtained using less condensation energy at 0 °C. Overall, this study provides valuable information on the effectiveness of low-pressure water desalination methods and highlights the potential for optimizing productivity while reducing energy consumption [49].
This scientific review presents a study on the design of an autonomous desalination plant, the purpose of which is to provide high-quality drinking water to remote coastal areas with weak infrastructure and network connectivity. The system is designed to work exclusively on solar energy, while electric energy is generated by the field of photovoltaic cells, and heating is provided by the field of a selective flat solar collector. The feasibility study led to the selection of 35 collectors located in seven cascades, each of which contains five collectors connected in series. The additional electricity needed to operate the pumps is provided by photovoltaic panels which can generate up to 1.5 kW and store energy using eight batteries. The energy characteristics of the system are improved due to the recovery of latent condensation energy, while a hollow fiber module with a heat exchange area of 4 m2 and a plate heat exchanger provides efficient heat transfer. The designed installation is located in the village of orphans in the coastal area of Mares. An experimental study of this system is currently being conducted. The study provides valuable information on the design and performance of an autonomous solar-powered desalination plant, highlighting its potential as a solution for providing clean water to remote areas with limited access to resources [50].
This scientific review presents a methodology for the theoretical prediction of the vacuum load for low-temperature thermal desalination (LTTD) installations and compares it with experimental values for verification, in particular, with an emphasis on the load of non-condensing gas and escaping water vapor. The aim is to determine the accumulated effect of non-condensing gases on the vacuum load of LTTD installations and to propose ways to control these factors during the desalination process. The vacuum system alone accounts for about 31% of the total energy consumption of the LTTD installation, which makes it extremely important to accurately determine the vacuum load. Experimental measurements were carried out at an operating plant with a capacity of 100 m3/day located on Agatti Island, UT Lakshadweep Island Group, India, to measure the contribution of gas mixtures such as escaping water vapor, non-condensing gas and air leakage. The results were compared with published data and predicted values using the proposed methodology, showing good compliance under the same operating conditions. The study showed that the accumulated effect of non-condensing gases on each unit of mass led to the extraction of 1.6 units of mass of steam from the process condenser, which is a relatively low indicator due to the low operating temperature range LTTD and the use of deep cooling water in the condenser pipes. The review also highlights the influence of various parameters, such as operating pressure, pipeline losses and feed water mass flow, on the overall vacuum load of LTTD installations [51].
This scientific review highlights the growing demand for drinking water due to rapid population growth and an increase in living standards. It highlights the need for new, energy-efficient desalination methods to meet this demand, leading to the analysis of vacuum desalination systems. Vacuum desalination involves the use of warm seawater from the ocean surface, which quickly evaporates in an evaporation chamber under vacuum, and then condenses in a shell-and-tube condenser using cold seawater from deeper layers. The review presents a numerical model designed to simulate the operation of a desalination plant and study the effect of operational parameters on system performance. The design of the installation, including a vacuum evaporation chamber, a distillate condenser, a vacuum pumping system and a water pumping system, is also discussed. The control equations are derived based on mass, momentum and energy balances, and modeling is used to assess the influence of key technological variables, such as pressure in the vacuum chamber and the temperature of warm seawater at the inlet, on the operational characteristics of the system in terms of freshwater output. In general, this study provides valuable information about the potential of vacuum desalination systems as an energy-efficient method of drinking water production and the development of numerical models to optimize their performance [52].

3. Results

The circuit operates according to the following explanation: When the solar cell panel is exposed to sunlight during the day, its cells absorb the radiation energy and transform it into thermal electrical energy to conduct the analysis and separate the aqueous solution of oxygen and hydrogen gas. Negative and oxygen for the positive electrode.
H 2 O + ( l i q u i d ) H 2 + 1 2 O 2
The release of hydroxide ions simultaneously releases electrons and oxygen is emitted; the reaction of the water molecule is also carried out, releasing hydrogen:
2 O H 2 e + H 2 O + 1 2 O 2
2 H 2 O + 2 e 2 O H + H 2
Solar radiation and its thermal energy are received and exploited to produce green hydrogen according to the circuit diagram. Part of the solar energy is transmitted to the generator connected to the heat exchanger and cooling water condenser, and another part is transmitted to the water sterilizer. The heat exchanger changes the temperature of the liquid by passing it through tubes in another medium. If we want to raise the temperature of the liquid or gas, then the other medium is at a high temperature. We cool the liquid or gas by passing it in tubes in another medium with a low temperature. The condenser is connected to the evaporator via an expansion valve. The valve is connected to a pump with a cooling load through two inlet and outlet paths. The return or exit path is connected to the pump connected to the heat exchanger. An example of such a scheme is shown in Figure 10.
The decomposition of water into hydrogen and oxygen by direct conversion of solar radiation energy can be carried out without high temperatures and electricity. Water molecules absorb solar photons for further decay. In addition, inorganic substances can contribute to the decomposition of water. The electricity generated by solar panels and a steam solar station is used to produce hydrogen, a clean, environmentally friendly fuel, as well as oxygen. The efficiency of the scheme ranges from 5 to 21% [53].
Solar energy is transferred to a vacuum desalination plant. The seawater is pumped by a centrifugal pump through the condenser tubes, where it is heated due to the heat of steam condensation. The heating water heats the walls of the evaporator tubes, where the seawater boils and evaporates. The resulting steam passes through the louver separator and enters the condenser, where it condenses, and the distillate flows by gravity into the collector. The distillate pump takes the distillate from the collector and directs it to electrolysis [53,54,55].

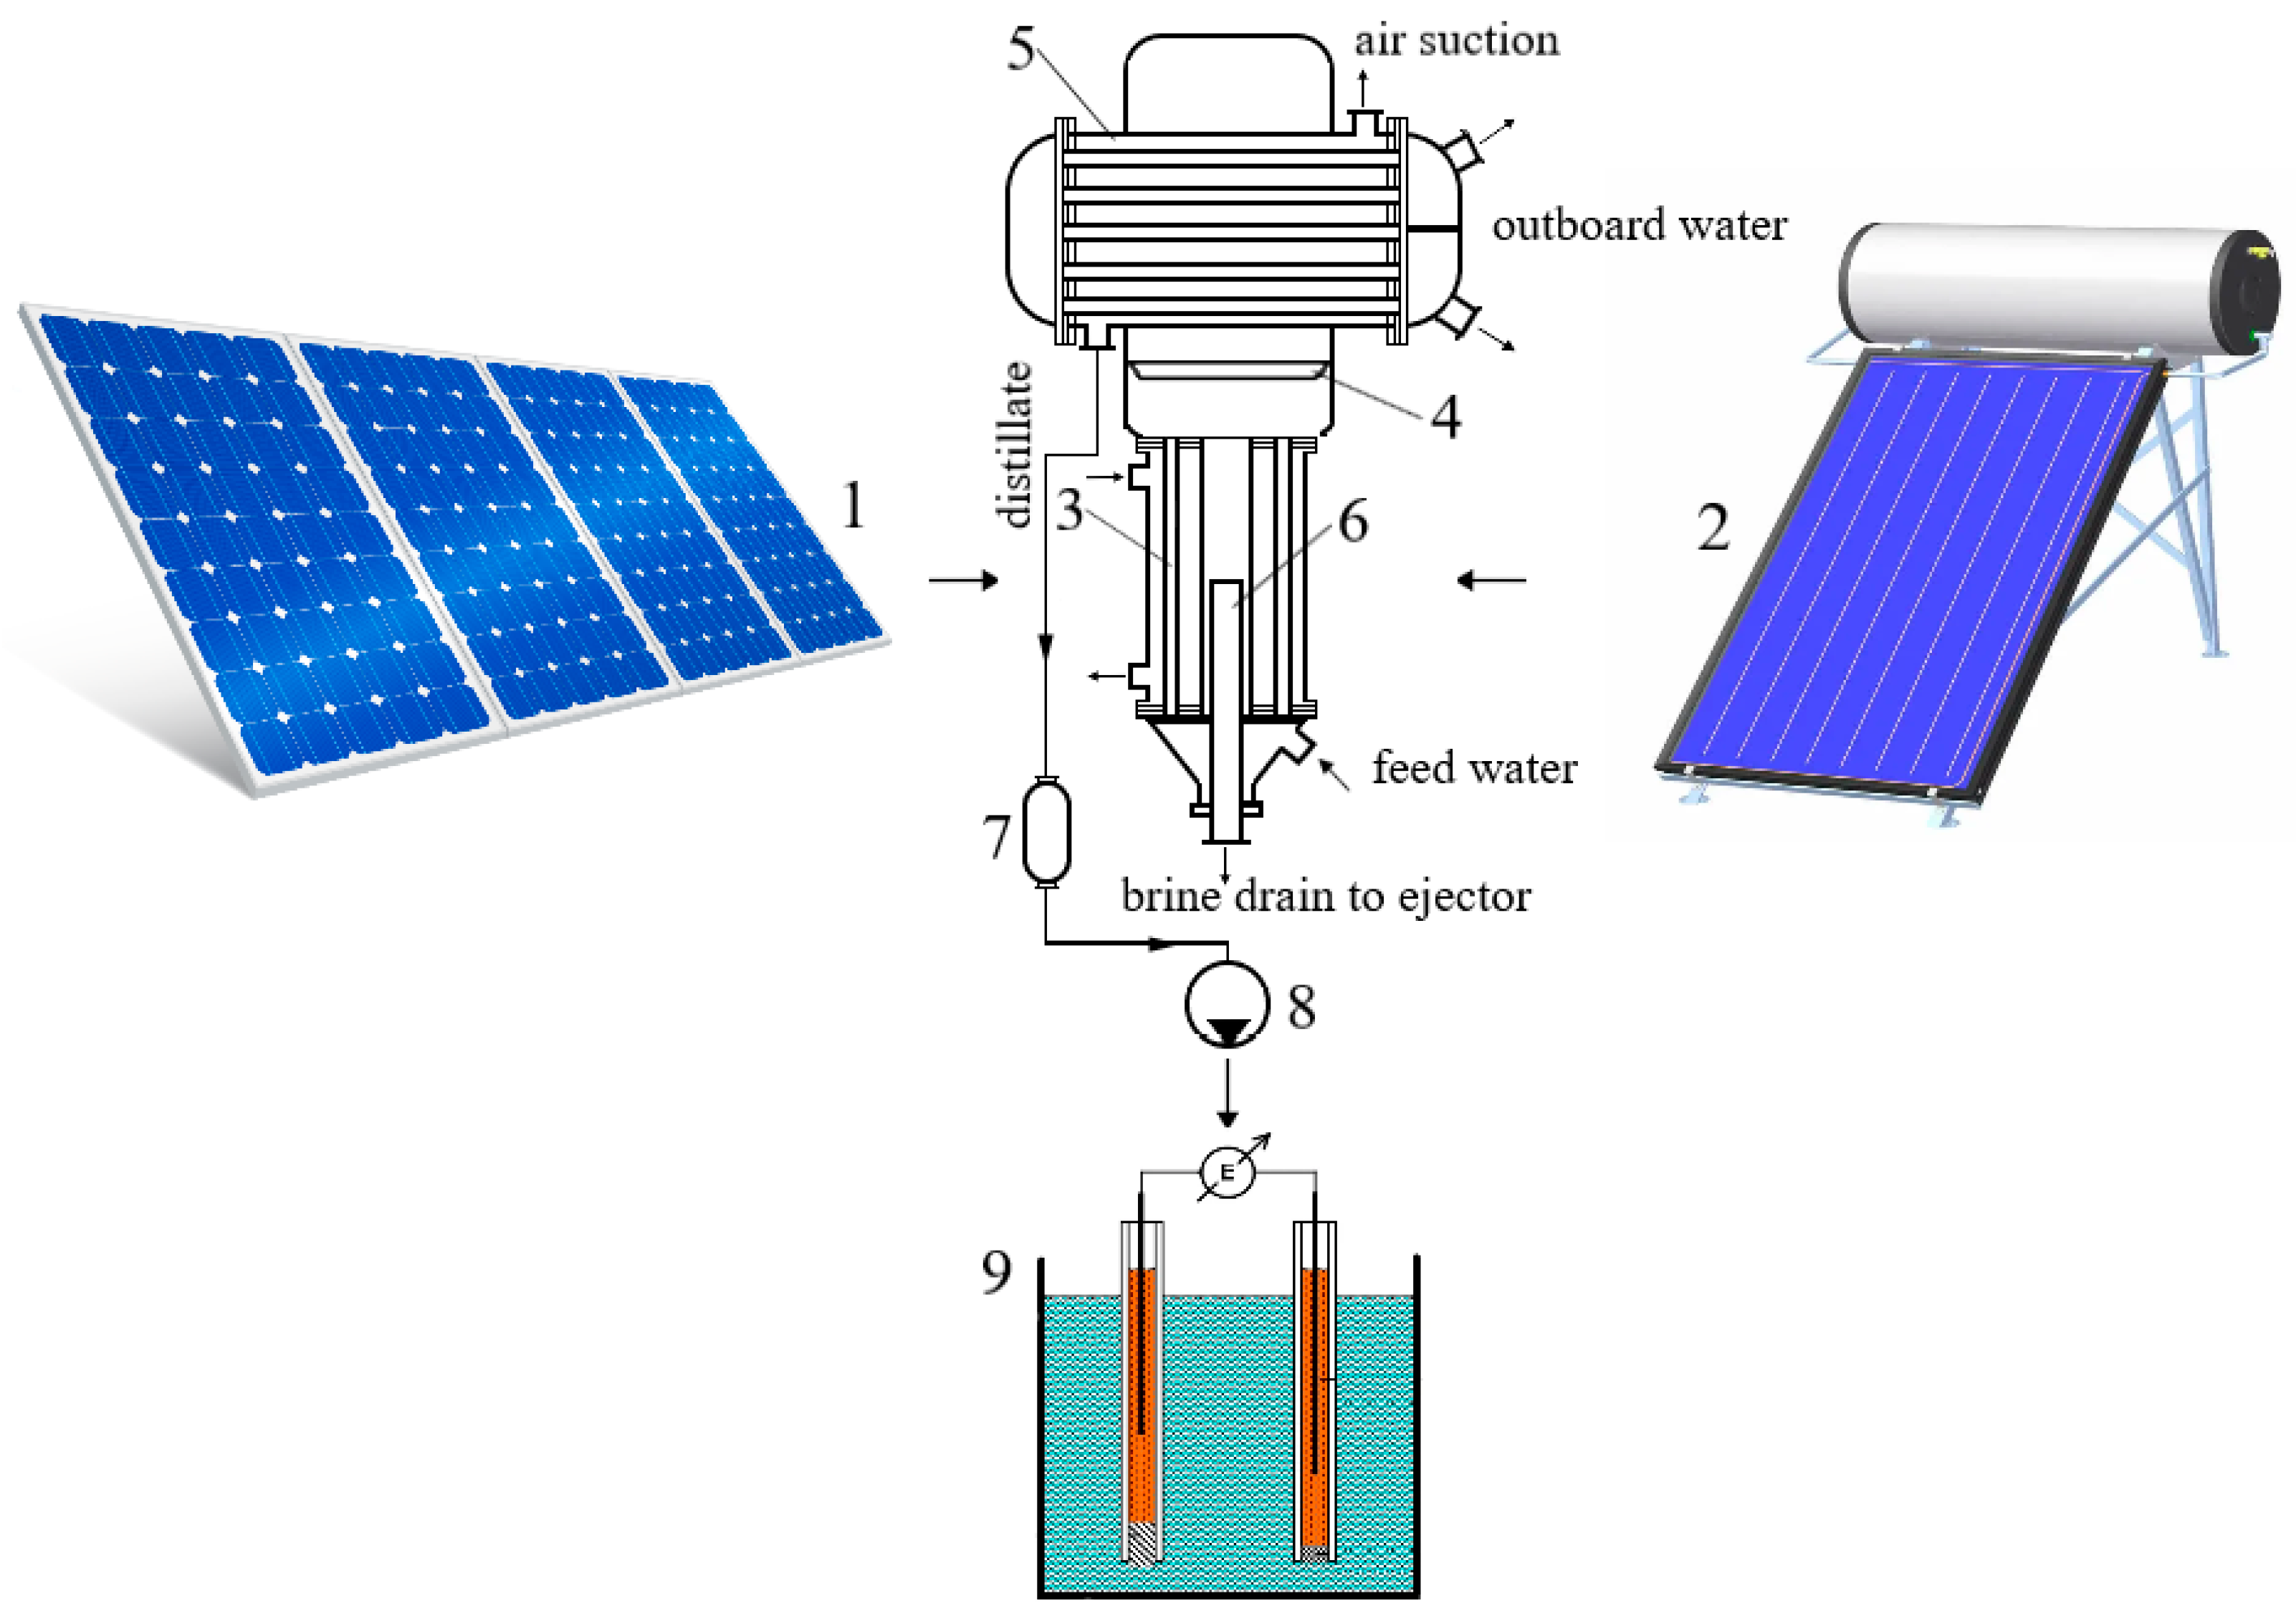
3.1. Installation Calculation

Consider the data shown in the Table 4.
The power function in Figure 11 of the dependence of the amount of heating water on the heat load of the evaporator is as follows: at the expense of 80 m3/h: y = 0.000003139581868 × 0.997860639930083; at the expense of 150 m3/h: y = 0.000001676697004 × 0.997860639905449 [56].
The power function in Figure 12 of the dependence of the amount of heating water on the heat load of the evaporator: at the temperature of the heating water 68 °C: y = 0.000003139581868 × 0.997860639930083; at the temperature of the heating water 90 °C: y = 0.000003285180381 × 0.994136417876874 [56].

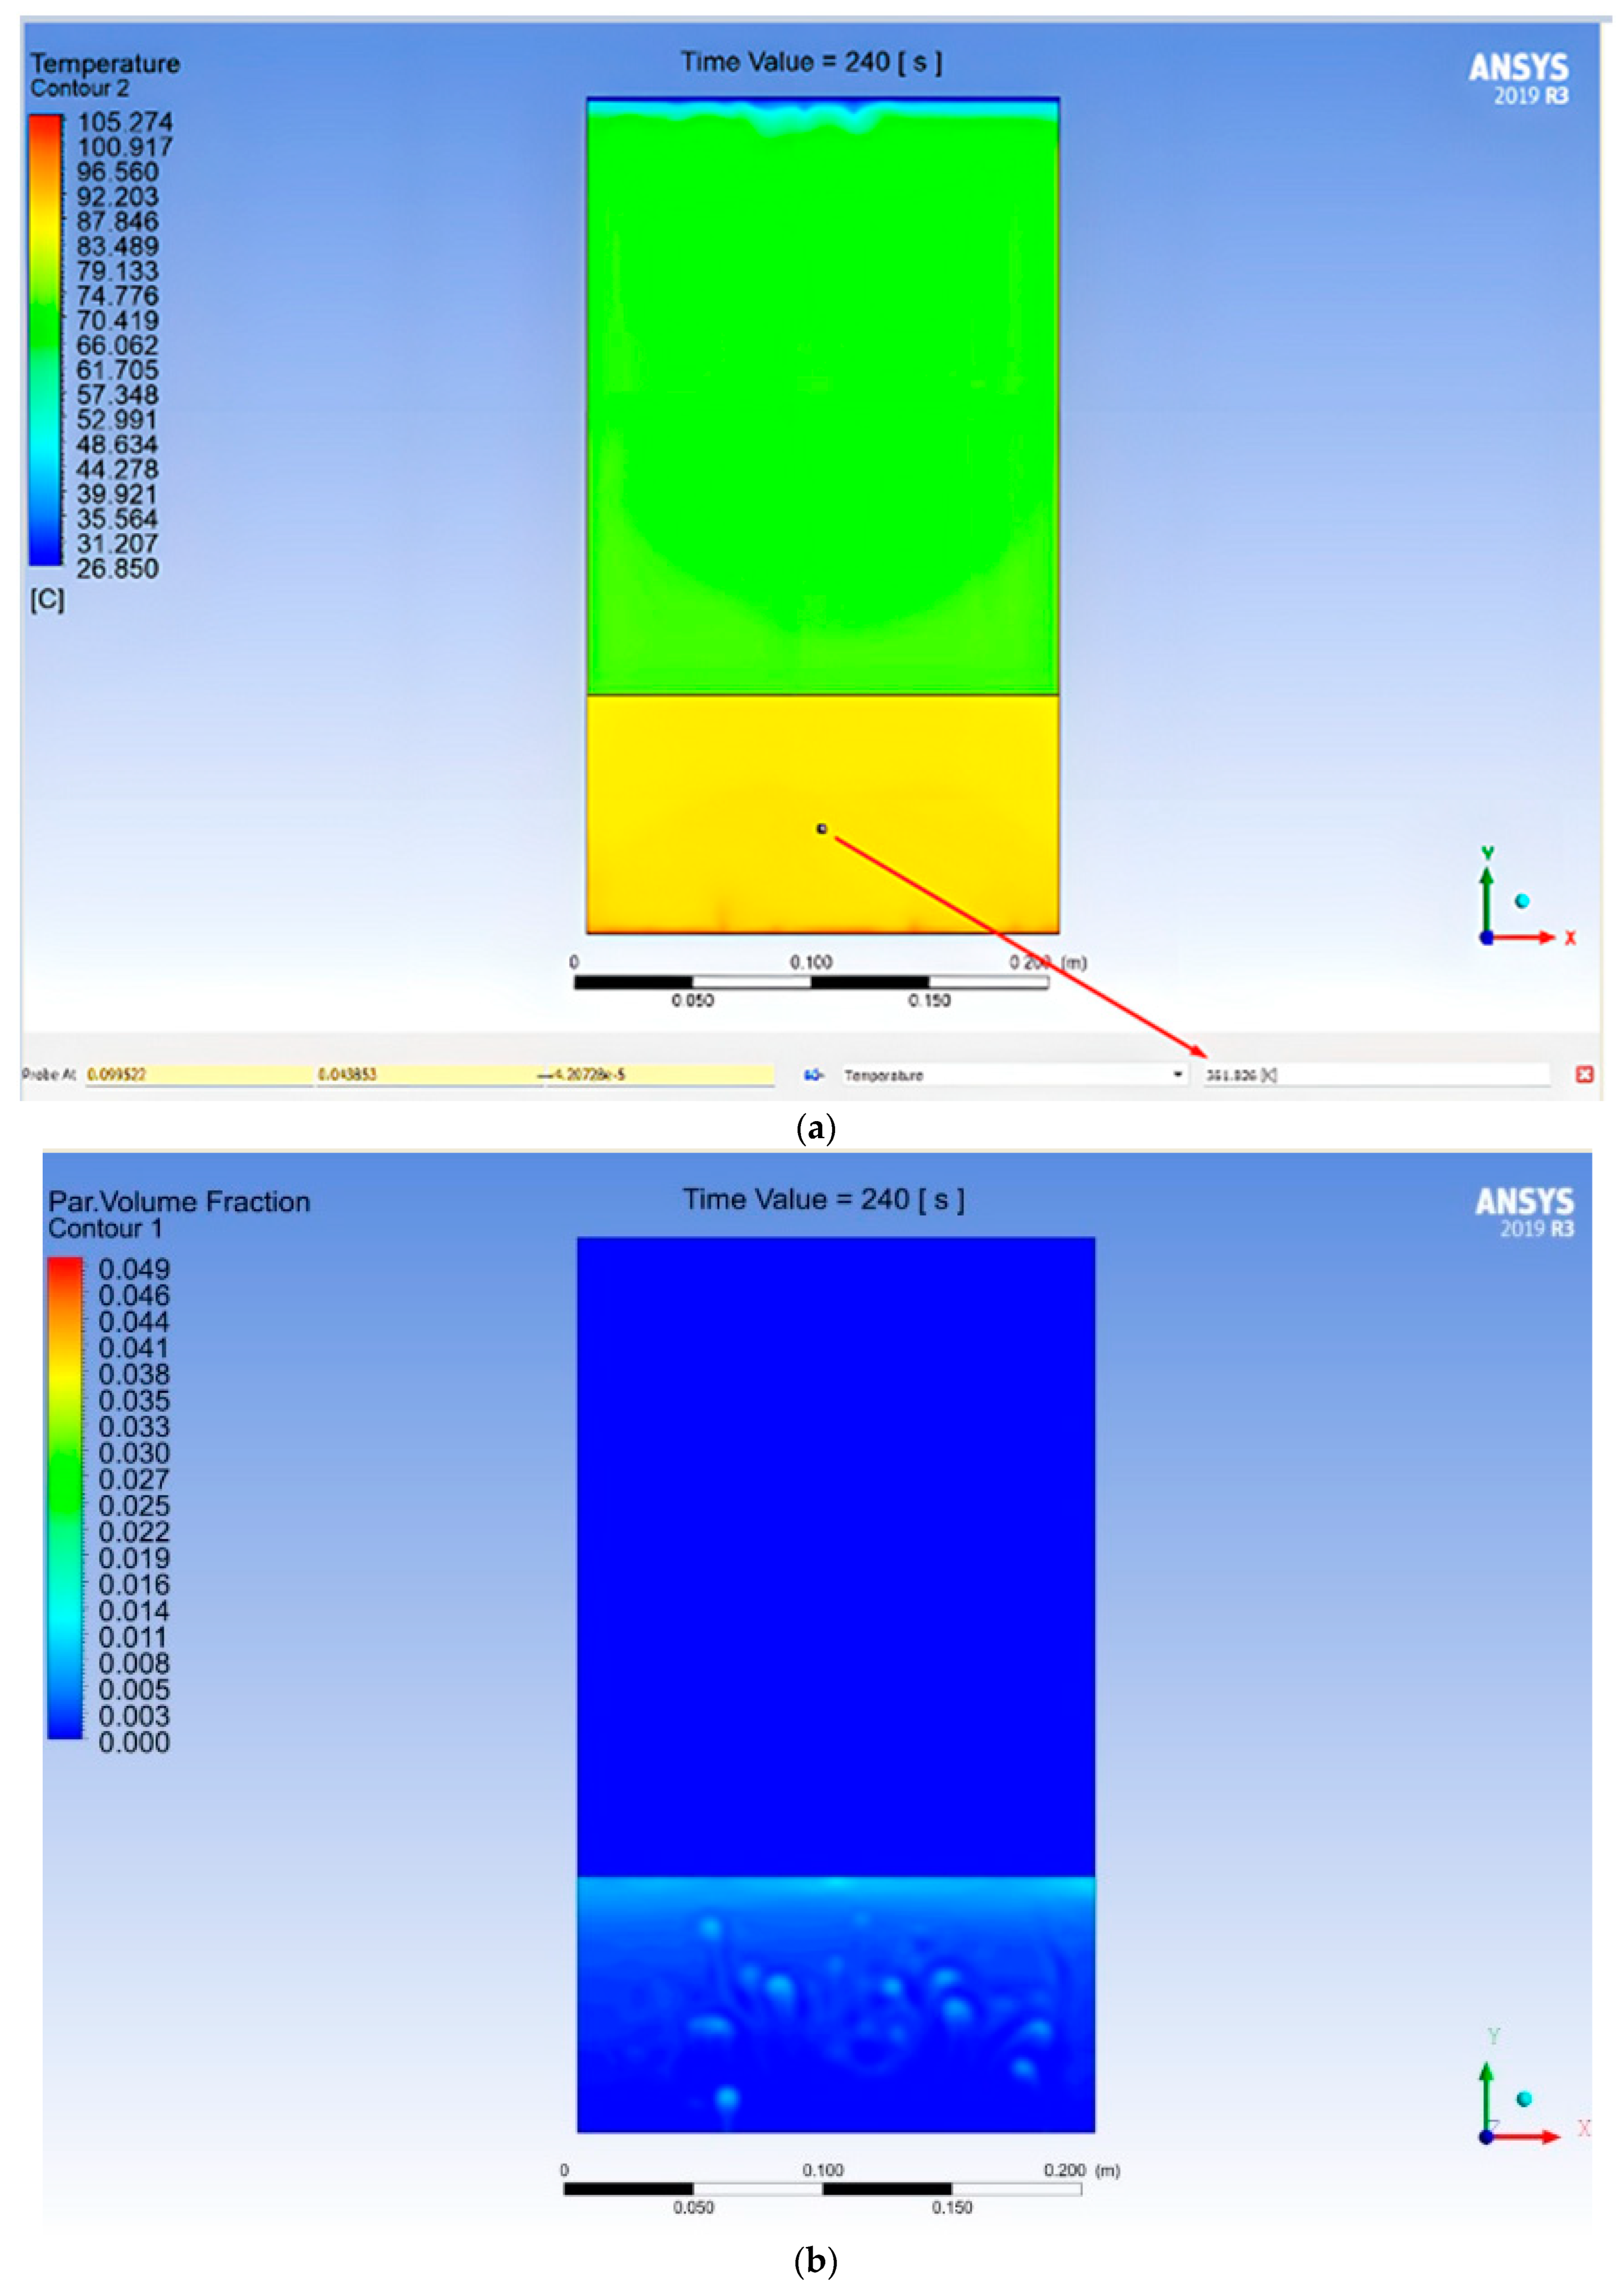
3.2. Modeling in ANSYS

Standard k-ε(+2E) is a two-parameter RANS model that is computationally efficient and applicable to a wide range of flows. It uses wall-mounted functions and applies only to stationary turbulent flows. However, in this model, there is significant vortex diffusion in many problems. It should be noted that this model can take into account the influence of compressibility and natural convection, which is useful when calculating industrial cooling systems. However, it is not suitable for solving the problem of boiling the refrigerant due to the large error and low convergence of the results at boiling.
The authors concluded that transient flow models should be used (models simulate only the transition from laminar to turbulent flow; the wall function is used).
The transient turbulence model k-kl-ω (+3E) is a widely used turbulence model that combines models k-ε and k−ω together with the Baldwin–Lomax model. This combination of models provides a reliable method for predicting flow behavior in transient regimes, which is especially useful when calculating boiling due to its unstable nature and complexity of forecasting.
The transition model k-kl-ω (+3E) has several advantages over other turbulence models. It can accurately predict the beginning of the transition from laminar to turbulent flow, which is a problem for many turbulence models. In addition, the transition k-kl-ω (+3E) is a three-parameter model and is suitable for solving heat transfer problems in elements that create turbulence, for example, on turbine blades. However, the transition model k-kl-ω (+3E) also has some disadvantages. It is relatively complex and requires significant computing resources to solve. In addition, it is more prone to numerical instability compared to simpler turbulence models, which may make it difficult to use it in some problems. Finally, the model is based on the use of a transition coefficient to another model, which can lead to inaccuracies and errors if the coefficient is set incorrectly.
Boundary conditions:
  • The emulsion flow is set from the condition of the appearance of a two-zone liquid flow at the beginning of boiling on the lower surface.
  • The temperature of the liquid saturation container is set from the theoretical calculation condition.
  • Based on the saturation temperature, the burdened degree of dryness of the vapor-liquid mixture in the transition state is established.
Conditional data of the tank size, water temperature and heating elements were taken for modeling.
Initial data:
Tank dimensions:
length: 0.2 m;
width: 0.2 m;
height: 0.35 m;
Water level: 0.1 m;
Temperature of heating element: 106 °C;
Power of heating element: 3 kW;
Initial water temperature: 80 °C.
A computer simulation was conducted and calculations of liquid evaporation were carried out in which assumptions were made; heating from the heating element is applied to the bottom of the tank and evenly distributed over the area (0.2·× 0.2 = 0.04 m2) in Figure 13.
The calculation was performed in a two-dimensional formulation. Two rectangular surfaces were constructed. The first one is 0.2 × 0.1 m in size, referring to the poured water. The second one is 0.2 × 0.25 m, related to vacuum (Figure 14).

4. Grid

CFD was chosen as the preferred physics, and Fluent is chosen as the solver. The size of the grid structure was set to 0.002 (Figure 15).
During the calculation, the process time was extended twice due to the long boiling period. After the expiration of 4 min, the water temperature rose by 9 °C (Figure 16a). Additionally, when considering the volume fraction of steam, you can see that it boils (Figure 16b). The screenshots above show the estimated time.
Next, 6 min were added in 0.5 s increments followed by another 4 min in 2 s increments. As a result, it was revealed that the water was heated to 100 °C in 13 min. However, at this point, the problem becomes obvious: the water–vacuum interface line turned out to be a solid wall at the set settings, due to which steam was locked in the water area. As a result, before reaching the 15th minute, an explosion occurred, and the solid wall was knocked out due to the high pressure created by steam (Figure 17).
The simulation involves solving the problem of fluid flow in a gravitational field with the formation of vapor bubbles. In order to achieve satisfactory accuracy, a transient turbulence model is used in the non-stationary formulation of problems about the effect of the heating wall on the evaporated liquid k-kl-ω. This three-parameter model, which is part of the RANS group, is suitable for a narrow range of tasks and allows for modeling the transition from laminar to turbulent flow. This model uses wall functions. The main equations solved in the mathematical model are the energy equation, as well as the turbulence and turbulence dissipation model equations.
The lifting force that causes the mixing of the flow occurs due to convection, which is described by the Boussinesq approximation. In this approximation, the system of Navier–Stokes equations and the energy equation are solved using a special dependence of density on temperature only when calculating the volumetric force.
The approximation makes it possible to take into account the gravitational field, that is, the aspiration of the vapor bubbles in the direction opposite to gravity, respectively, and so to take into account the orientation of the tube in space.

5. Discussion

In light of economic and technological developments, studies show the potential of hydrogen demand to be 4% to 10% of global energy demand by 2051. This is consistent with the presence of millions of fuel vehicles in the world. The most promising hydrogen technology is fuel cell vehicles. The development of hydrogen as an energy carrier depends on improved end-use technologies, significant cost reductions, comparison with alternative technologies, and the construction of hydrogen infrastructure.
Consider Figure 18.
In the future, a series of energy-efficient hybrid and electric battery vehicle alternatives will become available with low investment costs. Hydrogen is a supplemental fuel for future hybrid vehicles as well as renewable source of electricity and with limited potential as biofuel. Hydrogen can reduce greenhouse gas emissions within customer segments that cannot be covered by electric vehicle battery and vehicle size combinations. It needs to be analyzed in greater detail in order to clarify concepts for use in the future of hybrid vehicles. The prerequisite for significant environmental benefit is the production of competitive hydrogen through renewable energy sources. A future option in this context is solar thermal hydrogen production.
There are many constraints related to components materials and operating concepts which are defined in order to maintain stable and commercially available solar thermal processes. It is necessary to further improve technical concepts for mass flows and thermal processes. Other problems include spatial temperature gradients and temporal change of load. The main objectives of research are the selection, adoption and rehabilitation of the appropriate resistance for the main components [58]. Commercial stations with a capacity exceeding 120 MW are anticipated for the future. In addition, carbon-free solar thermal processes that produce pure hydrogen are still in the early development stage.
First, it is expected that there will be commercial factories for mass production after 2020. The prototype plant was already implemented a few years ago, and the development of solar energy and the methane improvement process started early. Traditional technology can be added or combined in plants in order to be able to produce at a competitive speculative cost of approx.
It will be cheaper and cheaper to obtain hydrogen using fossil fuels until at least 2030 provided that this process is associated with carbon storage and capture. Commercial competitive options for hydrogen fuel cells are electrolysis, renewable energies and wind energy. Methane can be developed by solar steam. It may compete with conventional gas and hydrogen synthesis in a few years, depending on the evolution of the process and natural gas prices. The long-term costs of carbon-free solar thermal operations are completely autonomous.
The production of components and materials should be researched in addition to research and development work. Hydrogen transport from the solar thermal processes of the continents appears only possible in the long run because of cost and energy losses. However, not only the potential demand for hydrogen for transportation alone is considered a catalyst for the improvement of the solar thermal process. The most important direct reason for improving solar thermal processes and building pilot plants in the future is regions with higher solar radiation due to increased industrial demand for hydrogen.
An estimated 3.5 EJ of hydrogen will be available from future solar thermal plants. The sites of the pilot plants require direct and high solar radiation above 2.200 kW/m2 and the availability of electricity, water and gaseous methane. Seawater desalination and cleaning solar heat can be used to supply water demand for hydrogen production.
Despite the challenges, problems, and difficulties of solar thermal processes, it is expected to have great potential for clean, pollutant-free and sustainable hydrogen production, using clean water, solar energy and approximate hydrogen sources without restrictions. Conventional costs of hydrogen production depend on the price and availability of fossil fuels, while the cost of emerging solar energy operations is large and high. Reductions are expected due to further development of design and production techniques for the process and components.
Solar hydrogen markets could improve due to climate and political demand for renewable energy and hydrogen. As a result, it should include industrial and political advertising for hydrogen technologies, a clear strategy to obtain permanent hydrogen in the future and implement renewable energy.
Solar hydrogen was produced using photovoltaic cells based on a polymeric tidy membrane.
The software study was carried out by relying on the direct connection method of the hydrogen analyzer with the photovoltaic system and the second method by designing an integrated system for the electro-hydrogen analyzer [59].
From the results, we find that the first method is less effective and efficient than the second because, during the day, the intensity of solar radiation changes, as the yield of hydrogen production in the second method reached 2.5 per hour, while in the first direct method 1.16 per hour.
The optimum spacing distance is 1.5 cm, and the greater the distance between the electrodes, the lower the hydrogen flow.
Some additives such as KOH can enhance and hydrogen flow and electrolyte ionization.
Consider Figure 19.
Consider Figure 20.
Consider Figure 21.
Consider Figure 22.
The previous figures and circuit modeling indicate that the temperature of the solution, the number of rays falling on the solar panel, the area of the panel and the resulting solar thermal energy are all directly proportional to the amount of hydrogen produced.
Initially, the hydrogen flow will be faster when the solution is cooler and it is not the peak hour in the middle of the day; the hydrogen flow will be greater in the early hours of the day or at the end of the day.
Additionally, the relationship between the volume of hydrogen over time and with the electrical tension is direct, and its production rate reaches about 0.5 milliliters per hour.

6. Conclusions

The production of hydrogen using solar thermal energy has been thoroughly studied from various points of view, including economic, technological and hydrogen sources. Traditional methods such as steam conversion of methane, high-temperature electrolysis of water and thermochemical cycles have been evaluated for their viability in the production of hydrogen using solar energy. A study was also conducted on the generation of hydrogen using a solar electrolyzer based on polymer ion exchange membrane technology.
Two methods of hydrogen generation were considered: a direct connection of the photovoltaic system with a hydrogen analyzer and a solar electrolysis system with maximum power tracking of the photovoltaic system to ensure a constant supply of current voltage to the hydrogen analyzer. The solar electrolysis system proved to be more efficient due to the instability of the intensity of solar radiation during the day. In addition, it was found that the addition of potassium hydroxide increases the ionization of the electrolyte and improves the flow of hydrogen.
Hydrogen has been studied as a means of transferring energy and reducing air pollution and global warming. Renewable energy sources can be used in the electrolysis of water to produce hydrogen, which is an attractive option for future energy systems due to the potential demand for hydrogen in various sectors.
Solar hydrogen markets may improve due to climate change and the demand for renewable energy and hydrogen. It is extremely important to develop clear strategies for obtaining permanent hydrogen in the future and to introduce renewable sources to ensure the safety of energy sources. Despite the difficulties, solar thermal processes have the potential to significantly improve the future use of hydrogen due to cost and performance.
In conclusion, it should be noted that solar thermal processes offer a promising option for the production of clean and environmentally friendly hydrogen. The use of polymer exchange membrane technology in solar electrolyzers has shown promising results that can be improved in the course of further research and development. However, for wider implementation, it is necessary to solve problems such as infrastructure for storing and transporting hydrogen.
The applicability of the scheme is limited to the areas in which the proposed method of producing hydrogen with renewable energy can be used, i.e., the availability of additional equipment, as well as due to restrictions on storage and transportation of the final product.

Author Contributions

Conceptualization, E.S., Z.S., K.O. and S.K.; data curation, E.S., K.O., S.A. and S.K.; formal analysis, K.O., S.A. and S.K.; investigation, K.O., S.K., V.K., A.O., A.K. and T.T.; methodology, E.S., K.O. and S.K.; project administration, K.O. and S.A.; supervision, E.S., Z.S. and K.O.; validation, K.O. and S.K.; visualization, K.O., S.K., V.K., A.O., A.K. and T.T.; writing—original draft, K.O. and S.K.; writing—review and editing, E.S., Z.S., K.O. and S.A. All authors have read and agreed to the published version of the manuscript.

Funding

The study was supported by the Russian Science Foundation grant No. 22-19-20011, https://rscf.ru/en/project/22-19-20011/. The study was supported by the Russian Science Foundation grant No. 23-29-10042, https://rscf.ru/project/23-29-10042/.

Data Availability Statement

There are no data applicable in this study.

Conflicts of Interest

The authors declare no conflict of interest.

Nomenclature

eelectron
t’hwheating water temperature
tout.woutboard water temperature
Whwvolume flow of heating water
dscalescale layer thickness
hsship’s draft
t 1 av average heating water temperature in the evaporator
t 1 heating water inlet temperature
t 1 heating water temperature at the evaporator outlet
t o u t . w av average cooling water temperature in the condenser
t o u t . w condenser inlet cooling water temperature
t o u t . w condenser outlet cooling water temperature
Δtc temperature difference in the condenser
Kcheat transfer coefficients in the condenser
Kevheat transfer coefficients in the evaporator
t2temperature of the secondary steam in the evaporator
Q 1 evaporator heat load
ρhw heating water density in the evaporator
chwheat capacity of heating water in the evaporator
Qc condenser thermal load
η heat utilization factor
δtout.w amount of heating of the cooling water in the condenser
Wcoolcooling outboard water consumption
ρout.wdensity of cooling water in the condenser
cout.wheat capacity of the cooling water in the condenser
t o u t . w condenser outlet cooling water temperature
°CHEU purge ratio
Wbamount of brine to be removed
W2evaporated water consumption
Sbsalinity of brine
S0outboard water salinity
δtbtemperature depression
gacceleration of gravity
xreduced boiling brine level
levevaporator tube length
ρbbrine density
pbaverage design pressure of boiling brine
p2 vapor pressure in the evaporator
Δph mean hydrostatic pressure correction
δthtemperature difference taking into account the hydrostatic effect
t s saturation temperature
tbaverage design temperature of boiling brine
vhwaverage speed of heating water in the annulus
Fseopen area for the passage of heating water
Re Reynolds criterion
doutouter diameter of evaporator tubes
ν kinematic viscosity
Nu Nusselt criterion
Prwall wall Prandtl criterion
Prliquid liquid Prandtl criterion
λhwthermal conductivity of heating water
α1heat transfer coefficient from heating water to evaporator pipes
twallaverage pipe wall temperature of the evaporator heating battery
δtevaverage temperature difference between pipe wall and boiling brine
α2heat transfer coefficient from pipes to boiling brine
ppaverage design pressure of boiling brine
δwallpipe wall thickness and scale
dininner diameter
λwallcoefficient of thermal conductivity of the pipe wall material
λscalethermal conductivity coefficient of scale
Kevheat transfer coefficient from heating water to brine
Δtev temperature difference in the evaporator heating coil
Fevevaporator surface
Q 1 evaporator heat load
Q c e design value of the thermal load of the condenser
Q 1 e calculated evaporator heat load
W2evaluation of HEU productivity by the amount of evaporated water
ρfwfeed water density
cfwfeed water heat capacity
tfwfeed water temperature
vout.wcooling water speed
fevnumber of capacitor strokes
zevnumber of condenser tubes
Δ t c e design temperature difference in the condenser
t 1 a v e average calculated heating water temperature
t 2 e temperature of the secondary steam in the evaporator
δ t o u t . w e design value of the amount of heating of the cooling water in the condenser
Δt temperature difference between heating water and secondary steam
pcvapor pressure
p 2 e vapor pressure in the evaporator
Δp steam resistance of louvered separator and condenser tube bundle
Mcondenser cooling rate
qtspecific heat load of the condenser
Fccapacitor surface
qstspecific steam load of the condenser
ρgdistillate density
δ t o u t . w δ heating of cooling water in the condenser
hsecondary steam enthalpy
henthalpy of distillate
Hpump head
pingdischarge pressure
psusuction pressure
ηmpump mechanical efficiency
Nout.wpump power
Nedrive motor power
ηemmotor efficiency
Pcabsolute pressure in the condenser
Qpump delivery
qepower consumption for distillate production.

References

  1. Möller, S.; Kaucic, D.; Sattler, C. Hydrogen production by solar reforming of natural gas: A comparison study of two possible process configurations. J. Sol. Energy Eng. 2006, 128, 16–23. [Google Scholar] [CrossRef]
  2. Le Duigou, A.; Borgard, J.M.; Larousse, B.; Doizi, D.; Allen, R.; Ewan, B.; Hpriestman, G.; Elder, R.; Devonshire, R.; Ramos, V. HYTHEC: An EC funded search for a long-term massive hydrogen production route using solar and nuclear technologies. Int. J. Hydrogen Energy 2007, 32, 1516–1529. [Google Scholar] [CrossRef]
  3. Poitou, S.; Rodriguez, G.; Haquet, N.; Cachon, L.; Bucci, P.; Tochon, P.; Chaumat, V.; Gillia, O.; Gwinner, B.; Balbaud, F. Development program of the SO3 decomposer as a key component of the sulphur based thermochemical cycles: New steps towards feasibility demonstration. In Proceedings of the 17th World Hydrogen Energy Conference, Brisbane, Australia, 15–19 June 2008; Available online: https://www.researchgate.net/publication/228413536_Development_program_of_a_key_component_of_the_iodine_sulfur_thermochemical_cycle_the_SO_3_decomposer (accessed on 12 February 2023).
  4. Dawood, F.; Anda, M.; Shafiullah, G.M. Hydrogen production for energy: An overview. Int. J. Hydrogen Energy 2020, 45, 3847–3869. [Google Scholar] [CrossRef]
  5. Dash, S.K.; Chakraborty, S.; Elangovan, D. A Brief Review of Hydrogen Production Methods and Their Challenges. Energies 2023, 16, 1141. [Google Scholar] [CrossRef]
  6. Anaya, K.; Oni, A.O.; Kumar, A. Investigating the techno-economic and environmental performance of chemical looping technology for hydrogen production. Sustain. Energy Technol. Assess. 2023, 56, 103008. [Google Scholar] [CrossRef]
  7. Spath, P.L.; Amos, W.A. Using a concentrating solar reactor to produce hydrogen and carbon black via thermal decomposition of natural gas: Feasibility and economics. Trans. ASME 2003, 125, 159–164. [Google Scholar] [CrossRef]
  8. Hinkley, J.T.; Heenan, A.R.; Low, A.C.; Watson, M. Hydrogen as an export commodity—Capital expenditure and energy evaluation of hydrogen carriers. Int. J. Hydrogen Energy 2022, 47, 35959–35975. [Google Scholar] [CrossRef]
  9. Li, P.; Chen, L.; Xia, S.; Zhang, L.; Kong, R.; Ge, Y.; Feng, H. Entropy generation rate minimization for steam methane reforming reactor heated by molten salt. Energy Rep. 2020, 6, 685–697. [Google Scholar] [CrossRef]
  10. Vostrikov, S.V.; Samarov, A.A.; Turovtsev, V.V.; Wasserscheid, P.; Müller, K.; Verevkin, S.P. Thermodynamic Analysis of Chemical Hydrogen Storage: Energetics of Liquid Organic Hydrogen Carrier Systems Based on Methyl-Substituted Indoles. Materials 2023, 16, 2924. [Google Scholar] [CrossRef]
  11. Jensen, S.H.; Larsen, P.J.; Mogensen, M. Hydrogen and synthetic fuel production from renewable energy sources. Int. J. Hydrogen Energy 2007, 32, 3253–3257. [Google Scholar] [CrossRef]
  12. Ewan, B.; Graf, D.; Monnerie, N.; Sattler, C.; Le Naour, F.; Stein, W.; Hikley, J.l. Innovative High Temperature Routes for Hydrogen Production—Coordinated Action (INNOHYP CA); Final report INNOHYP CA-FR-CEA/07–05; 2007. [Google Scholar] [CrossRef]
  13. Padro, C.E.G.; Putsche, V. Survey of the Economics of Hydrogen Technologies; National Renewable Energy Laboratory: Golden, CO, USA, 1999. [Google Scholar]
  14. Well-to-Wheels Analysis of Future Automotive Fuels and Powertrains in the European Context; WELL-TO-TANK Report, EUCAR, CONCAWE, JRC, Version 2c; SAE International: Warrendale, PA, USA, 2007; Available online: http://ies.jrc.ec.europa.eu/WTW (accessed on 12 February 2023).
  15. World Energy Technology Outlook—2050—WETO H2. European Commission, Directorate-General for Research, Brussels 2006. Available online: https://espas.secure.europarl.europa.eu/orbis/sites/default/files/generated/document/en/WETO-H2.pdf (accessed on 25 February 2023).
  16. Prospects for Hydrogen and Fuel Cells. International Energy Agency (IEA), Paris. 2005. Available online: https://www.iea.org/reports/prospects-for-hydrogen-and-fuel-cells (accessed on 10 May 2023).
  17. Nitsch, J. Potenziale der Wasserstoffwirtschaft. Externe Expertise für das WBGU-Hauptgutachten 2003 “Welt im Wandel: Energiewende zur Nachhaltigkeit”; Springer: Berlin/Heidelberg, Germany, 2003; (In German). Available online: http://www.wbgu.de/wbgu_jg2003_ex06.pdf (accessed on 12 May 2023).
  18. Mueller-Langer, F.; Tzimas, E.; Kaltschmitt, M.; Peteves, S. Technoeconomic assessment of hydrogen production processes for the hydrogen economy for the short and medium term. Int. J. Hydrogen Energy 2007, 32, 3797–3810. [Google Scholar] [CrossRef]
  19. Fischedick, M.; Esken, A.; Pastowski, A.; Schüwer, D.; Supersberger, N.; Nitsch, J. RECCS: Strukturellökonomisch-ökologischer Vergleich regenerativer Energietechnologien (RE) mit Carbon Capture and Storage (CCS). Final report BMU, Feb. 2007. Int. J. Hydrogen Energy 2009, 34, 4256–4267. (In German) [Google Scholar]
  20. Energy Technology Perspectives 2008; International Energy Agency (IEA): Paris, France, 2008.
  21. IFA-International Fertilizer Industry Association, France: Ammonia Statistics 2006. Personal communication and e-mail, Ms Marcel-Monnier, IFA 29.05.2007. Available online: https://www.indexmundi.com/minerals/?country=fr&product=ammonia&graph=production (accessed on 25 February 2023).
  22. Hydrogen (H2)-Based Iron Making. 2022. Available online: https://worldsteel.org/publications/fact-sheets/ (accessed on 25 May 2023).
  23. Government, US. Energy Information Administration (EIA): Country Analysis Briefs. 2007. Available online: https://www.eia.doe.gov/emeu/cabs/index.html (accessed on 12 May 2023).
  24. Innovation Outlook. Renewable Methanol. 2021. Available online: https://www.methanol.org/wp-content/uploads/2020/04/IRENA_Innovation_Renewable_Methanol_2021.pdf (accessed on 25 May 2023).
  25. USGS—U.S. Geological Survey: Nitrogen Statistics and Information. Available online: http://minerals.usgs.gov/minerals/pubs/commodity/nitrogen/ (accessed on 3 May 2023).
  26. U.S. Government. Energy Information Administration (EIA): Refinery Capacity Report 2023. Available online: https://www.eia.gov/petroleum/refinerycapacity/ (accessed on 25 May 2023).
  27. BP Statistical Review of World Energy 2008—Refinery Capacities. Available online: http://www.bp.com (accessed on 19 May 2023).
  28. USGS—U.S. Geological Survey: International Minerals Statistics and Information. Available online: http://minerals.usgs.gov/minerals/pubs/country/ (accessed on 9 May 2023).
  29. Trieb, F. Trans-Mediterranean Interconnection for Concentrating Solar Power (TRANS CSP). Final Report, DLR-ITT, project funded by the German Ministry for Environment, Nature Conservation, and Nuclear Safety (BMU). Available online: http://www.dlr.de/tt/Portaldata/41/Resources/dokumente/institut/system/projects/TRANS-CSP_Full_Report_Final.pdf (accessed on 11 May 2023).
  30. Graf, D.; Monnerie, N.; Roeb, M.; Schmitz, M.; Sattler, C. Economic comparison of solar hydrogen generation by means of thermochemical cycles and electrolysis. Int. J. Hydrogen Energy 2008, 33, 4511–4519. [Google Scholar] [CrossRef]
  31. Couturier, K.; Joppich, F.; Wörner, A.; Tamme, R. Tank design for on-board hydrogen storage in metal hydrides. In Proceedings of the 2nd International Conference on Energy Sustainability, Jacksonville, FL, USA, 10–14 August 2008; ES 2008. ASME: Jacksonville, FL, USA, 2008. [Google Scholar]
  32. Schindler, J.; Wurster, R.; Zerta, M.; Blandow, V.; Zittel, W. Where will the energy for hydrogen production come from?—Status and alternatives. Ottobrunn: EHA (European Hydrogen Association), Ludwig–Bölkow–Systemtechnik GmbH (LBST). 2006. Available online: https://www.h2euro.org/wp-content/uploads/2009/01/eha_h2production_brochure_eng_0407.pdf (accessed on 7 March 2023).
  33. Knoche, K.F. Thermochemical H2-production with a solar driven sulphur–iodine-process. Sol. Therm. Energy Util. DLR 1988, 4, 441–498. [Google Scholar]
  34. Kolb, G.J.; Diver, R.B.; Siegel, N. Central-station solar hydrogen power plant. J. Sol. Energy Eng. 2007, 129, 179–183. [Google Scholar] [CrossRef]
  35. Liberatore, R. S-I solar evaluation costs and considerations on economic comparisons among thermochemical cycles. In Proceedings of the IEA/HIA Task 25 Meeting, Rome, Italy, 9–10 October 2008. [Google Scholar]
  36. Kolb, G.J.; Diver, R.B. Screening Analysis of Solar Thermochemical Hydrogen Concepts; Sandia Report SAND2008-1900; Sandia National Laboratories: Albuquerque, NM, USA, 2008. [Google Scholar]
  37. García-Chávez, R.J.; Chávez-Ramirez, A.U.; Villafán-Vidales, H.I.; Velázquez-Fernández, J.B.; Rosales, I.H. Thermal study of a solar distiller using computational fluid dynamics (CFD). Rev. Mex. De Ing. Química 2020, 2, 455–467. Available online: https://www.researchgate.net/publication/339201525_Thermal_study_of_a_solar_distiller_using_computational_fluid_dynamics_CFD (accessed on 7 March 2023). [CrossRef]
  38. Aly, N.H.; El-Figi, A.K. Thermal performance of seawater desalination plants. Desalination 2003, 158, 127–142. [Google Scholar] [CrossRef]
  39. Farahat, M.A.; Mousa, M.M.; Mahmoud, N.H. Solar Distiller with Flat Plate Collector and Thermal Storage. Int. Conf. Appl. Mech. Mech. Eng. 2016, 17, 1–11. [Google Scholar] [CrossRef]
  40. Sommariva, C.; Hogg, H.; Callister, K. Cost reduction and design lifetime increase in thermal desalination plants: Thermodynamic and corrosion resistance combined analysis for heat exchange tubes material selection. Desalination 2003, 158, 17–21. [Google Scholar] [CrossRef]
  41. Mahmoud, N.H.; Mousa, M.M.; Farahat, M.A. Performance Study of Solar Distiller with Thermal Storage System. In Proceedings of the 1st International Conference, Ninth Conference of Sustainable Environmental Development, Rome, Italy, 8 September 2021. [Google Scholar]
  42. Tanaka, H.; Park, C.-D. Experimental study of distiller with heat pipe utilizing waste heat from a portable electric generator. Desalination 2012, 302, 43–49. [Google Scholar] [CrossRef]
  43. Joo, H.-J.; Kwak, H.-Y. Performance evaluation of multi-effect distiller for optimized solar thermal desalination. Appl. Therm. Eng. 2013, 61, 491–499. [Google Scholar] [CrossRef]
  44. Wang, L.; Zheng, H.; Zhao, Y.; Ma, X. Solar-driven natural vacuum desalination system with inner condenser. Appl. Therm. Eng. 2021, 196, 117320. [Google Scholar] [CrossRef]
  45. Khokhani, P.; Patel, K.; Jikadra, V.; Patel, A.; Patel, S.K. Development of Solar Thermal Desalination Plant Using Vacuum Tubes. Int. J. Emerg. Technol. Innov. Res. 2018, 5, 11. [Google Scholar]
  46. Kumar, R.S.; Mani, A.; Kumaraswamy, S. Analysis of a jet-pump-assisted vacuum desalination system using power plant waste heat. Desalination 2005, 179, 345–354. [Google Scholar] [CrossRef]
  47. Triki, Z.; Bouaziz, M.; Boumaza, M. Performance and cost evaluation of an autonomous solar vacuum membrane distillation desalination plant. Desalination Water Treat. 2017, 73, 107–120. [Google Scholar] [CrossRef]
  48. Liu, X.H.; Zhang, X.C.; Fang, Y.Q.; Zhu, M.M. The Natural Vacuum Desalination Technology in Seawater Desalination. Appl. Mech. Mater. 2014, 675–677, 851–855. [Google Scholar] [CrossRef]
  49. Bilgil, A.; Hırlakoğlu, B. An experimental study on desalination at vacuum environment under low pressure and low condensation temperatures. Desalination 2017, 411, 9–18. [Google Scholar] [CrossRef]
  50. Ben Abdallah, S.; Frikha, N.; Gabsi, S. Design of an autonomous solar desalination plant using vacuum membrane distillation, the MEDINA project. Chem. Eng. Res. Des. 2013, 91, 2782–2788. [Google Scholar] [CrossRef]
  51. Balaji, D.; Abraham, R.; Murthy, M.R. Experimental study on the vacuum load of low-temperature thermal desalination plant. Desalination Water Treat. 2016, 57, 26830–26844. [Google Scholar] [CrossRef]
  52. Balaji, D.; Abraham, R.; Murthy, M.R. Process simulation of vacuum desalination systems for producing potable drinking water from saline sea water. Desalination Water Treat. 2017, 57, 26830–26844. [Google Scholar] [CrossRef]
  53. Lemeshko, M.A. Energy-Efficient Method of Sea Water Desalination; EDN TMLARX; Lemeshko, M.A., Umnov, I.V., Eds.; Bulletin of the Vladimir Dahl Lugansk State University: Moscow, Russia, 2021; Volume 11, pp. 221–224. [Google Scholar]
  54. Lemeshko, M.A. Desalination of Sea Water by Solar Energy in a Vacuum (In Russian) /M. A. Lemeshko, D. S. Bondarev, I. S. Bagnyuk//Advanced Technologies in Construction and Technosphere Safety: Collection of Scientific Papers, Shakhty, February 10, 2022 years—10 2023—Mines: ISOiP (branch) of DSTU in Shakhty, 2022—P. 9-14—EDN RBKPPT, Moscow. Available online: https://elibrary.ru/item.asp?id=50341381 (accessed on 7 March 2023).
  55. Lemeshko, M.A. Water Desalination System in a Solar Collector (In Russian) /M. A. Lemeshko, I. V. Umnov//Scientific spring—2022. Technical sciences: Collection of scientific papers: Scientific electronic edition, Shakhty, May 16–20, 2022/Institute of Service and Entrepreneurship (branch) DSTU in Shakhty—Shakhty: Institute of Service and Entrepreneurship (branch) of DSTU in Shakhty, Moscow, 2022—P. 196-202—EDN OMWKNH. Available online: https://elibrary.ru/item.asp?id=49183205&ysclid=llgq6hqem5597152454 (accessed on 7 March 2023).
  56. Bashurov, B.P.; Skiba, A.N.; Chebanov, V.S. Functional Reliability and Control of the Technical Condition of Ship Auxiliary Mechanisms (In Russian): Russia, 2009, 192p. Available online: https://elibrary.ru/qnwayt?ysclid=llgqmlku3u376734960 (accessed on 7 March 2023).
  57. Alnaimat, F.; Rashid, Y. Thermal Energy Storage in Solar Power Plants: A Review of the Materials, Associated Limitations, and Proposed Solutions. Energies 2019, 12, 4164. [Google Scholar] [CrossRef]
  58. Osintsev, K.; Aliukov, S.; Kuskarbekova, S.; Tarasova, T.; Karelin, A.; Konchakov, V.; Kornyakova, O. Increasing Thermal Efficiency: Methods, Case Studies, and Integration of Heat Exchangers with Renewable Energy Sources and Heat Pumps for Desalination. Energies 2023, 16, 4930. [Google Scholar] [CrossRef]
  59. Osintsev, K.; Aliukov, S.; Kovalev, A.; Bolkov, Y.; Kuskarbekova, S.; Olinichenko, A. Scientific Approaches to Solving the Problem of Joint Processes of Bubble Boiling of Refrigerant and Its Movement in a Heat Pump Heat Exchanger. Energies 2023, 16, 4405. [Google Scholar] [CrossRef]
Figure 1. Solar tower and futuristic heliostat field developed surrounding the tower (50 MW) borrowed from the literature [9].
Energies 16 06118 g001
Figure 2. Parallel laminar type analyzer electrodes borrowed from the literature [7].
Energies 16 06118 g002
Figure 3. The relationship between the intensity of solar radiation in watts per square meter (vertical axis) and the time in hours (horizontal axis) borrowed from the literature [13].
Energies 16 06118 g003
Figure 4. The relationship between the hourly and cumulative hydrogen gas volumes at the direct connection (vertical axis) according to daylight hours (horizontal axis) and with a distance of 1.5 cm between the electrodes borrowed from the literature [13].
Energies 16 06118 g004
Figure 5. The relationship between the hourly and cumulative hydrogen gas volumes at the direct connection (vertical axis) according to daylight hours (horizontal axis) according to the distance of 1.5 cm between the electrodes borrowed from the literature [9].
Energies 16 06118 g005
Figure 6. The relationship between the electrode spacing (horizontal axis) in cm and the hydrogen productivity in liters (vertical axis) by system method borrowed from the literature [13].
Energies 16 06118 g006
Figure 7. Relationship between the electrolyte concentration in milligrams per liter (horizontal axis) and hydrogen yield in liters (vertical axis) borrowed from the literature [13].
Energies 16 06118 g007
Figure 8. Important principles of solar thermal hydrogen production borrowed from the literature [9].
Energies 16 06118 g008
Figure 9. Atmospheric desalination plant: 1—solar battery; 2—steam generator; 3—turbine unit; 4—electric generator; 5—condenser; 6—pump; 7—converter device; 8—solution preparation; 9—hydrogen storage; 10—electrolyzer obtained by the authors.
Energies 16 06118 g009
Figure 10. Vacuum desalination plant: 1—solar battery; 2—heater tank; 3—heating battery; 4—louver separator; 5—condenser; 6—evaporator tubes; 7—distillate collector; 8—pump; 9—electrolyzer obtained by the authors.
Energies 16 06118 g010
Figure 11. The dependence of the heat load of the evaporator on the cooling value of the heating water when its flow rate changes is obtained by the authors.
Energies 16 06118 g011
Figure 12. The dependence of the heat load of the evaporator on the cooling value of the heating water when its temperature changes is obtained by the authors.
Energies 16 06118 g012
Figure 13. Designed tank, side view (overall dimensions of the stand: height—350 mm, width—200 mm, length—200 mm, panel thickness—2 mm).
Energies 16 06118 g013
Figure 14. Constructed grid.
Energies 16 06118 g014
Figure 15. Post-processing: (a) Temperature field at the time of boiling (transition k-kl-ω); (b) mixing of the vapor–liquid mixture (transition k-kl-ω).
Energies 16 06118 g015
Figure 16. The volume fraction of steam during boiling (Transition k-kl-ω): (a) Mixing of the vapor-liquid mixture is dimensionless; (b) the proportion of steam in the volume, dimensionless.
Energies 16 06118 g016
Figure 17. Hydrogen costs for electricity without equipment costs borrowed from the literature [57].
Energies 16 06118 g017
Figure 18. The cost of solar technologies borrowed from the literature [57].
Energies 16 06118 g018
Figure 19. The temperature of the medium changes with time borrowed from the literature [16].
Energies 16 06118 g019
Figure 20. The electrical tension produced by the plate changes with time borrowed from the literature [16].
Energies 16 06118 g020
Figure 21. Hydrogen flow changes over time borrowed from the literature [16].
Energies 16 06118 g021
Figure 22. The efficiency of the solution and the solar system changed over time borrowed from the literature [16].
Energies 16 06118 g022
Table 1. Hydrogen cost price in 2022 [5].
Year of Construction of the StationProduction Hydrogen Plant Capacity, Tones/DayCost Price, $/kg
1Commissioned before 20226073.66
2Put into operation in 2022 with an increase in production efficiency6783.51
Table 2. Solar panel specifications [12].
Model typeBsm 200 m-72
Solar cell typeMono 125 × 125 cell a grade
Pm 210 W, Vm 38 V, Im 5.5 AVoc 44.6 V, Isc 5.8 A
Size1580 × 808 × 35mm
Weight16.5 kg
Output tolerance0–4%
Standard test condition999 W/m2, am 1.6, 25 °C
Operating temperature−42 °C…+87 °C
Manufacture warranty11 years
Power performance warranty>90% after 16 year, >85% after 26 year
Table 3. The need for hydrogen in regions and countries where direct solar radiation is high due to industry (metal oxide TC: solar iron-oxide-based redox pair cycle, SSMR: solar steam methane reforming) [12,14,15,16].
Hydrogen Demand EJTheoretical Number of Plants with 50 MWs SSMRTheoretical Number of Plants with 50 MWs Metal Oxide TC
Refineries existing0.44380860
Refineries additional0.87001600
Ammonia production0.514401003
DRI (pig iron) production0.1298220
Methanol production0.2166
Total countries2.0717841683
Table 4. Calculated data [56].
GivenUnit of MeasurementFormulaOption 1Option 2Option 3
t’hw°C686890
tout.w°C444
Whwm3/h8015080
dscalemm0.10.10.1
hs.m555
CalculationUnit of measurementFormulaOption 1Option 2Option 3
The average temperature of the heating water in the evaporator when cooling the heating water is 6 °C; 8 °C; 10 °C.°C t 1 av = 0.5 ( t 1 t 1 ) 65
64
63
65
64
63
87
86
85
The average temperature of the cooling water in the condenser°C t o u t . w a v = 0.5 ( t o u t . w t o u t . w ) 777
Temperature pressure in the condenser°C Δ t c = t 1 a v + t o u t . w a v 1 + K c K ev 29.82
29.41
28.99
29.82
29.41
28.99
38.94
38.52
38.11
Secondary steam temperature in the evaporator°C t 2 = t o u t . w a v + Δ t c 36.82338
36.40916
35.99495
36.82338
36.40916
35.99495
45.93607
45.52186
45.10765
Secondary steam pressure in the evaporatorkPa6.2162
6.0812
5.946
6.2162
6.0812
5.946
10.04
9.84
9.63
Heat of vaporization of secondary steamkJ/kg2568
2567
2566.7
2568
2567
2566.7
2392.3
2393.3
2394.3
Heating water densitykg/m3980.4
980.94
981.48
980.4
980.94
981.48
989
990.5
992
Heat load of the evaporatorkJ/h Q 1 = W h w ρ h w c h w ( t 1 t 1 ) 1,971,310
2,629,861
3,289,136
3,696,206
4,930,989
6,167,130
1,988,602
2,655,491
3,324,390
Thermal load of the condenserkJ/h Q k = Q 1 η 1,892,457
2,524,666
3,157,570
3,548,358
4,733,750
5,920,444
1,909,058
2,549,271
3,191,415
The amount of heating of the cooling water in the condenser°C δ t o u t . w = Q c W cool ρ o u t . w c o u t . w 4.85
6.47
8.08
9.09
12.13
15.16
4.85
6.47
8.08
The temperature of the cooling water at the outlet of the condenser°C t o u t . w = t o u t . w + δ t o u t . w 8.85
10.47
12.08
13.09
16.13
19.16
8.85
10.47
12.08
Salinity of seawaterg/L303030
HEU purge coefficient ε = W b W 2 333
Brine salinityg/L S b = S 0 ( 1 + ε ) ε 404040
Temperature depression°C δ t b = S b 80 0.50.2670.5
Correction taking into account the average hydrostatic pressurekPa Δ p h = 0.5 g x l ev ρ b 1000 1.7841.7841.784
Average design pressure of boiling brinekPa p b = p 2 + Δ p h 7.999
7.865
7.729
7.999
7.865
7.729
11.824
11.624
11.414
Temperature difference taking into account the hydrostatic effect°C δ t h = t s + t 2 4.70
4.77
4.83
4.70
4.77
4.83
3.16
3.28
3.39
Average design temperature of boiling brine°C t b = t 2 + δ t b + δ t h 42.025
41.676
41.329
42.025
41.676
41.329
49.6
49.3
49
The area of the living section for the passage of heating waterm20.01540.01540.0154
The average speed of heating water in the inter-tube space of the evaporatorm/s v h w = W h w 3600 F s e 1.441.441.44
Kinematic viscosity of heating waterm2/s0.445
0.451
0.458
0.445
0.451
0.458
0.345
0.341
0.345
Reynolds criterion for the flow of heating water Re = v h w d out ν 45,397.8
44,793.84
44,109.21
85,120.87
83,988.44
82,704.78
58,556.58
59,243.46
58,556.58
The Nusselt Criterion N u = 0.4 Re 0.6 Pr 0.36 ( Pr liquid Pr wall ) 0.25 349.339
346.543
343.355
509.387
505.310
500.662
406.979
409.837
406.979
Thermal conductivity of heating waterW/(m·°C)659
658
657
678
677
676
659
658
657
Heat transfer coefficient from the heating water to the evaporator pipesW/(m·°C) α 1 = N u λ h w d o u t 16,443,893
16,287,529
16,113,182
24,668,894
24,435,359
24,174,828
19,157,074
19,262,315
19,098,934
The average wall temperature of the pipes of the heating battery of the evaporator°C t wall = 0.5 ( t 1 av + t b ) 53.512
52.838
52.164
53.512
52.838
52.164
68.3
67.65
67
The average temperature difference between the pipe wall and the boiling brine°C δ t ev = t w a l l t b 11.48743
11.1619
10.8355
11.48743
11.1619
10.8355
18.7
18.35
18
Heat transfer coefficient from pipes to boiling brineW/(m·°C) α 2 = 25.5 ( 0.01 p b ) 0.58 δ t e v 2.33 1740.405
1611.662
1488.931
1740.405
1611.662
1488.931
6794.061
6437.442
6090.232
Pipe wall thickness and scalem δ w a l l = 0.5 ( d o u t + d i n ) 0.0010.0010.001
Coefficient of thermal conductivity of the pipe wall materialW/(m·°C)282828
Thermal conductivity coefficient of scaleW/(m·°C)0.80.80.8
Heat transfer coefficient from heating water to brineW/(m·°C) K ev = 1 ( 1 α 1 + δ w a l l λ w a l l + δ scale λ scale + 1 α 2 ) 796.112
795.821
795.498
796.112
795.822
795.498
798.830
798.778
798.722
Temperature pressure in the evaporator heating battery°C Δ t e v = ( t 1 t o u t . w ) ( t 1 t b ) ln ( ( t 1 t o u t . w ) ( t 1 t b ) ) 36.085
34.268
32.428
34.545
32.240
29.928
54.471
52.692
50.904
Heat load of the evaporatorkJ/h Q 1 = 3.6 K e v F e v Δ t e v 2,585,560
2,454,476
2,321,748
2,475,208
2,309,198
2,142,746
3,916,221
3,788,064
3,659,278
The calculated value of the heat load of the condenserkJ/h Q c e = Q 1 e η 2,277,0002,128,5003,366,000
Evaluation of HEU performance by the amount of evaporated waterm3/h W 2 = Q 1 e ρ f w ( 1 + ε ) c f w ( t b t f w ) 0.7740.7220.786
The speed of cooling water in the condenser pipesm/s v o u t . w = 4 W c o o l f e v 3600 π d i n 2 z e v 1.0361.0361.036
Heat transfer coefficient of the condenserW/(m2·°C) K c = 923 ν o u t . w t o u t . w a v + 17.8 4 2095.9522091.8382125.407
Calculated temperature pressure in the condenser°C Δ t c e = ( t 1 a v e + t o u t . w a v ) ( 1 + K c K e v ) 27.17927.19531.243
Secondary steam temperature in the evaporator°C t 2 e = t o u t . w + δ t o u t . w e 2 + Δ t c e 34.15333.97539.639
Secondary steam pressure in the evaporatorkPa5.45.295.6
Temperature difference of heating water and secondary steam°C Δ t = ( t 1 a v e + t 2 e ) 30.04630.22435.560
Secondary steam pressurekPa p c = p 2 e + Δ p 5.225.115.42
Distillate temperature°C33.6733.2834.3
Enthalpy of distillatekJ/kg140.98139.38143.52
Enthalpy of secondary steamkJ/kg2562.22561.82563.6
Distillate densitykg/m 3993.24994.6994
The multiplicity of condenser cooling M = W c o o l W 2 122.684131.520120.790
Specific heat load of the condenserkJ/(m2 h) q t = Q c e F c 87,576.9281,865.38129,461.5
Specific steam load of the condenserkJ/(m2 h) q s t = W 2 ρ g F c 29.58127.63130.067
Heating of the cooling water in the condenser°C δ t o u t . w δ = W 2 ρ g ( h h ) W c o o l ρ o u t . w c o u t . w 4.8644.5454.941
Intake water pump headm H o u t . w = 10 3 ( p i n g p s u ) ρ o u t . w g 26.76726.76726.767
Pump feedm3/s Q o u t . w = 1.2 W c o o l 3600 0.03160.03160.0316
Pump powerkW N o u t . w = g ρ o u t . w H o u t . w Q o u t . w ( 1000 η m ) 10.64710.64710.647
Power of the drive motorkW N e 1 = N o u t . w η e m 12.5269612.5269612.52696
The suction pressure of the distillate pumpkPa p s u = 101.3 + P c + ( 3...5 ) −92.08−92.19−91.88
Discharge pressurekPa264.7264.7264.7
Pump headm H d = 10 3 ( p i n g p s u ) ρ g g 36.61636.57736.568
Pump feedm/s Q d = ( 3.5...4 ) W 2 3600 0.000860.0008030.000874
Pump powerkW N d = g ρ g H d Q d ( 1000 η m ) 0.3410.3180.346
Power of the drive motorkW N e 2 = N d η m 0.4260.3970.432
Electricity consumption for the production of 1 m3 of distillatekW q e = ( N e 1 + N e 2 ) W 2 16.72817.89316.478
Disclaimer/Publisher’s Note: The statements, opinions and data contained in all publications are solely those of the individual author(s) and contributor(s) and not of MDPI and/or the editor(s). MDPI and/or the editor(s) disclaim responsibility for any injury to people or property resulting from any ideas, methods, instructions or products referred to in the content.

