Article

Comparative Analysis of Combustion Characteristics of a CFB Boiler during the Changes Process between High-Rated Loads and Low-Rated Loads

1
State Key Laboratory of Coal Conversion, Institute of Engineering Thermophysics, Chinese Academy of Sciences, Beijing 100190, China
2
University of Chinese Academy of Sciences, Beijing 100049, China
3
University of Science & Technology of China, Hefei 230026, China
*
Authors to whom correspondence should be addressed.
Energies 2023, 16(17), 6190; https://doi.org/10.3390/en16176190
Submission received: 11 August 2023 / Revised: 22 August 2023 / Accepted: 23 August 2023 / Published: 25 August 2023
(This article belongs to the Section I2: Energy and Combustion Science)

Abstract

:
In order to alleviate problems such as large fluctuations in grid load caused by the high proportion of renewable energy, circulating fluidized bed (CFB) power plants undertake the task of rated load regulation. This study discussed the combustion characteristics of a 100 KW CFB boiler during the operation process of varying loads and analyzes the combustion characteristics, load regulation rate and emissions variation law during the operation process of high- and low-rated load intervals. The experimental results showed that under the condition of a high-rated load, the average temperature of each area in the furnace was proportional to the size of the load. Under low-rated load conditions, the temperature change increased first and then decreased with the reduction in load. In the 30% load stage, the lowest temperature in the riser was 740 °C, while the temperature in the loop seal was even as low as 650 °C. The concentrations of O2, CO and unburned carbon mainly depended on the combustion reaction intensity under each load condition, which showed a higher trend at low load (30%). In terms of NOx emission, it was proportional to the load in the high-rated load range. However, the NOx generation at the 30% load was about 30 mg/Nm3(@6%O2) higher than the 50% load. In addition, the regulation load rate (2.5%/min) between high-load conditions exhibited significantly greater than that between low-load conditions (0.78%/min). Therefore, the low-load operation will face problems such as low furnace temperature, uneven gas–solid fluidization, and difficult control of pollutant generation, which need to be paid attention to during operation.

1. Introduction

Climate change is a global problem facing mankind [1], and countries around the world have reached an agreement on global greenhouse gas emission reduction [2]. China follows the global trend of sustainable and low-carbon development and promises to achieve “Carbon peak” and “Carbon neutrality” by 2030 and 2060, respectively [3,4]. Power plant boilers are special equipment with high energy consumption. According to fuel consumption estimates, the total CO2 emissions from boilers in China account for 50% of the total carbon emissions in energy consumption [5]. Hence, improving the energy conversion efficiency of boilers and reducing energy consumption is of great significance to reducing carbon emissions. In addition, with the rational use of energy and the requirements of sustainable environmental development planning in various countries, the future energy structure will be inclined to a large proportion of renewable energy, and there is an urgent need for flexible load adjustment methods to cope with the insufficient absorption of renewable energy by the grid [6,7], and factors such as intermittency and uncertainty of renewable energy represented by wind, light, and water to the power grid load supply [8,9,10,11]. In response to low hydropower generation and weak wind conditions in some regions, global coal-fired generation rose by 8% [12]. Especially in some countries mainly affected by coal-based resource endowments with less natural gas and fuel oil, electricity production still relies on coal-fired power plants. Coal-fired power plants not only need to undertake the task of grid load regulation but also have the ability to discharge low pollutants [10,13].
Compared with traditional pulverized coal (PC) boilers, circulating fluidized beds (CFB) have been widely used for clean energy combustion and power generation because of their advantages such as high combustion efficiency, low pollutant emissions, wide fuel adaptability and large operating load range [14,15]. However, in terms of load flexibility adjustment, it is also subject to problems such as large thermal inertia, strong hysteresis, and a slow load response rate. When the CFB boiler load is regulated (that is, during the load increase or decrease process), it is critical to ensure the rapid matching of the addition and subtraction of airflow and coal, which is of great significance for stabilizing the combustion state and controlling pollution. Thus, it is essential to optimize the regulation rate of load, especially in the pursuit of ultra-low load conditions, to avoid combustion deterioration caused by excessive coal reduction, including uneven combustion intensity and temperature radiation [16]. Secondly, during load adjustment, another key factor is to observe the changes in bed temperature and oxygen during the process of increasing and decreasing coal and fine-tune the coal supply and air volume in time to achieve stable combustion before subsequent load adjustment. The participation of the CFB boiler in load regulation will not only confront the requirements of low load regulation and high load regulation rate, but also may cause the following problems [17,18]: (1) Poor combustion stability and low combustion efficiency; (2) Temperature difference between the flue gas and the wall near the water wall and superheater is large; (3) The lower the load, the worse the combustion condition, the difficulty of pollutant emission control increases, and the fluctuation of the negative pressure inside the furnace affects the combustion efficiency.
The variable load rate is related to its combustion mode for the fluidized bed; however, it is prone to disadvantages such as large heat storage inertia, slow combustion and load response rate. In general, when the load is reduced, the rate of load reduction is slowed down by the accumulation of more bed material at the bottom of the furnace, and the rate of load decrease is usually 1.14%/min. In addition, it will be challenging to control the discharge of pollutants, and issues with response rate will arise if the fluidized bed controls the load at a faster rate [16].
When the fluidized bed performs load regulation, in order to control the regulation rate and quantify its energy storage, Liu et al. proposed the utilization mode of the fluidized bed coupling energy storage [19], which shortened the response time of the fluidized bed system and significantly improved the variable load rate and provided an effective adjustment method for a large proportion of blended coal slime. Jiang et al. [20] adjusted the minimum rated load to 30% by modifying and optimizing the combustion test conditions such as the primary air volume. Deng et al. [21] established a one-dimensional dynamic model of gas–solid flow in the full circuit of the fluidized bed; as a result, they have improved the load regulation capability of the fluidized bed unit. The effects of load change rate and bed pressure on the hydrodynamic performance of the whole circuit during the load reduction process are analyzed.
The fluidized bed with the properties of large thermal inertia, low load response rate, and long process from the pulverized coal being fed into the combustion chamber to the heat generated is transferred to the working fluid. The detailed transfer process is explained as follows. After the pulverized coal particles enter the combustion chamber, the heat first heats the bed material in the dense phase, then brings it into the upper fast bed, and then transfers the bed material to the working fluid. Secondly, in the combustion reaction under anoxic conditions, because part of the bed material hinders the effective diffusion of oxygen, and the particle size of the newly input pulverized coal particles is often large, the combustion reaction speed is slowed down. In addition, the bed temperature of the fluidized bed is 800~900 °C, and the radiant heat is much smaller than that of the pulverized coal furnace. All of the above factors will lead to problems such as low load response rate [22], unstable combustion, and high NOx concentration in local areas during the load change process of the fluidized bed unit. The variable load adjustment of the fluidized bed is a dynamic adjustment process [23]. In this process, the steam parameters are required to remain relatively stable, and the fluidized state is required to be stable, that is, the fluctuation of the bed hotbed pressure in each area is kept within a relatively controllable range, and it is not lower than the flameout temperature nor higher than the cooking temperature.
The NOx emission of the fluidized bed is closely related to the combustion condition when operating at high loads [24,25]. For example, Tourunen et al. [24] found that with the reduction of oxygen concentration or bed temperature in the primary air, the concentration of char and CO in the dense phase zone increased, resulting in a decrease in NO emissions. In addition, NO release is more sensitive to the oxygen concentration distribution in the furnace [26]. Thus, strengthening the reducing atmosphere in different areas of the furnace is the key to further reducing NOx emissions from the fluidized bed. Besides, the analysis of the gas–solid flow characteristics closely related to the reaction atmosphere in the fluidized bed should be strengthened. Usually, the NOx produced in the fluidized bed combustion process is mainly Fuel-NO. Due to the lower combustion temperature and fewer CH radicals, the NOx is mainly NO [27,28]. Fuel nitrogen can also be divided into two parts, volatile-N and char-N. There are three main pathways for the generation of NO, namely, the homogeneous oxidation of volatile-N [29,30], the heterogeneous oxidation of volatile-N on the surface of some catalytic materials, and the oxidation of char-N [26]. Although NOx is unavoidable during coal combustion, fluidized bed combustion technology has significant denitrification potential due to its inherent reducing conditions. For example, char has a self-reducing ability to NOx [31]. In addition, circulation ash can provide abundant active sites for NOx catalytic reduction [32,33]. Additionally, the concentration of reducing gases such as CO in certain areas of the furnace is high [34], which is beneficial to the reduction of NOx.
According to the research content of the above scholars, the factors that affect the NOx emission of stable combustion of fluidized bed under full load included combustion temperature and uniformity, excess air coefficient, staged combustion, etc. [35,36]. However, there was relatively little research on the combustion characteristics of the fluidized bed during load regulation and the control of low nitrogen emissions. Therefore, it is necessary to conduct experimental research on the combustion characteristics of the fluidized bed during load regulation and analyze the factors affecting the combustion state and the path of coal N conversion to NOx under various operating conditions.
The purpose of this study was to comprehensively evaluate the combustion state of CFB boilers in the process of load adjustment through experiments and focus on comparing the combustion and pollutant generation characteristics under the conditions of regulation between high loads and regulation between low loads. The research content mainly includes the following points: (1) Changes in the combustion characteristics and pollutant generation characteristics of the furnace during stable operation before and after each rated load regulation; (2) Changes in the combustion and pollutant generation characteristics of the furnace during the regulation process between high and low loads. The research results provide an important reference for the CFB boiler in the power station to realize safe load adjustment in each load interval and ensure stable combustion in the furnace and low pollutant generation in each load stage.

2. Experiment

2.1. Experimental Platform

Figure 1 shows the CFB combustion experimental platform with a rated load of 100 KW (100% load), consisting of a combustion system (riser, cyclone, seal loop, etc.), auxiliary systems (electric furnace auxiliary heating system, fuel feed system, air supply system) and flue gas cooling system) and a measurement system consisting of three parts. The riser is approximately 5.5 m high with an internal diameter of 0.15 m. The upper, middle and lower parts of the riser are equipped with electric furnace auxiliary heating systems, which are only used during the ignition and temperature rise stage of the experimental platform. The air cap is arranged at the bottom of the riser, which is the primary air supply position. The pulverized coal is fed into the furnace through a feeder located at a height of about 1.5 m in the riser. After leaving the riser, the particles are separated by a high-efficiency cyclone separator, enter the feeder, and then return to the dense-phase zone of the furnace through the fluidization air.
The measurement mainly includes 4 temperature (T1~T4) and pressure (P1~P4) measuring points arranged along the height direction of the riser and 1 temperature measuring point (T5) located in the feeder part. The measurement accuracy of temperature and pressure is ±0.5%, respectively. The oxygen concentration in the tail flue gas was analyzed online by a zirconia analyzer, and the flue gas was continuously measured by a flue gas analyzer (GASMET DX4000, Finland, instrument error <±2%), and the concentration of gas components such as CO, CO2, SO2 and NOx was recorded in real time. The accuracy of NOx measurement was ±5 ppm (<1000 ppm), while other gases are measured with an accuracy of ±2%. On the other hand, the fly ash was collected through the transverse inclined pipe located at the outlet of the upper part of the cyclone before and after the load change, and the unburned carbon (UBC) content was measured and analyzed after the experiment. The total experiment time was about 960 min. Except for the different times required to regulate the load, the duration of stable operation of each rated working condition was controlled at no less than 60 min. In addition, all measuring instruments were calibrated before the test to ensure their good measurement accuracy.

2.2. Fuel Characteristics

The fuel used in this experiment is Shenmu bituminous coal. The proximate analysis, ultimate analysis and calorific value are listed in Table 1. After drying and sieving, the particle sizes of the Shenmu coal were between 0 and 1000 μm, and the median particle size of coal was 293.04 μm.

2.3. Experimental Method and Operation Conditions

To compare and study the combustion and pollutant change characteristics of CFB boilers during regulation between high loads and low loads, it should be ensured that the fluidized bed boiler maintains stable operation before and after load regulation. First of all, before starting the experiment, 13.5 kg and 1 kg of quartz sand with a particle size of 0.1–0.7 mm should be added as circulating materials into the 100 KW CFB riser and seal loop as the furnace bottom material and circulating material. Before the CFB boiler runs stably at full load, the furnace auxiliary combustion device needs to be turned on to ensure stable combustion in the furnace. When regulating the load conditions, to make sure the coal supply and airflow rate are switched quickly (completed within 1 min), the combustion instability caused by the operation should be minimized.
The parameters of each working condition in this experiment were summarized in Table 2. According to the fast load range, 4 rated operating loads and 2 load adjustment change intervals were divided, and the rated operating loads include high load (100% and 75%) Cases 1, 2, Low load (50% and 30%), Case 3 and 4, the load adjustment range includes Case 1–2 (100% to 75% load) and Case 3–4 (50% to 30% load). During the experiment, the load matching was adjusted in real -time according to the theoretical calculation of the coal supply and airflow, while maintaining the excess coefficient in the furnace at 1.1.

2.4. Evaluation of Regulating Target Load Arrival and Calculation Method of Response Rate between Loads

Compared with the stable operation characteristics of circulating fluidized bed boilers under full load conditions, the regulation process between loads will have varying degrees of influence on the combustion state in the furnace due to changes in coal feed and airflow. As a result, there is a need to formulate an evaluation method for the regulating target load of CFB boilers and the stable operation of each rated load. At present, most studies are based on the judgment of the temperature difference at specific points in the furnace during each operating stage. Consequently, if the regulation target load reaches the standard that the temperature difference fluctuation difference of the main temperature measuring points of the furnace before and after the load regulation is less than 10 °C, it can be judged that the load regulation is completed, then enters the rated target load. At the same time, the stable running time of each rated operating condition should be no less than 60 min.
In addition, the regulating response rate of the boiler load starts from the start of the regulating command (start), and the moment when the boiler load reaches the target value is the completion of the experiment (Finish). The calculation formula of the boiler load percentage response rate (LPRR) is as follows:
L P R R = L P S L P F t
In the formula, LPRR is the percentage response rate of the boiler load, %/min; L P S and L P F is the boiler load percentage after the load regulation starts and finishes, %; Δ t is the time s required for the load regulation to the target load.

3. Results

3.1. Comparative Analysis of Combustion and Emission Characteristics in the Boiler during Stable Operation before and after Regulation between High- and Low-Rated Loads

This section compared the changes in temperature, pressure, gaseous substance concentration, and pollutant generation in a circulating fluidized bed furnace, and obtained the impact of different rated load regulating operations on combustion and pollutant emissions in the boiler. In addition, the gas–solid flow state and combustion atmosphere in the furnace during operation in different load stages were directly affected by the regulation of operating parameters, and the formation and reduction of NOx were also affected.

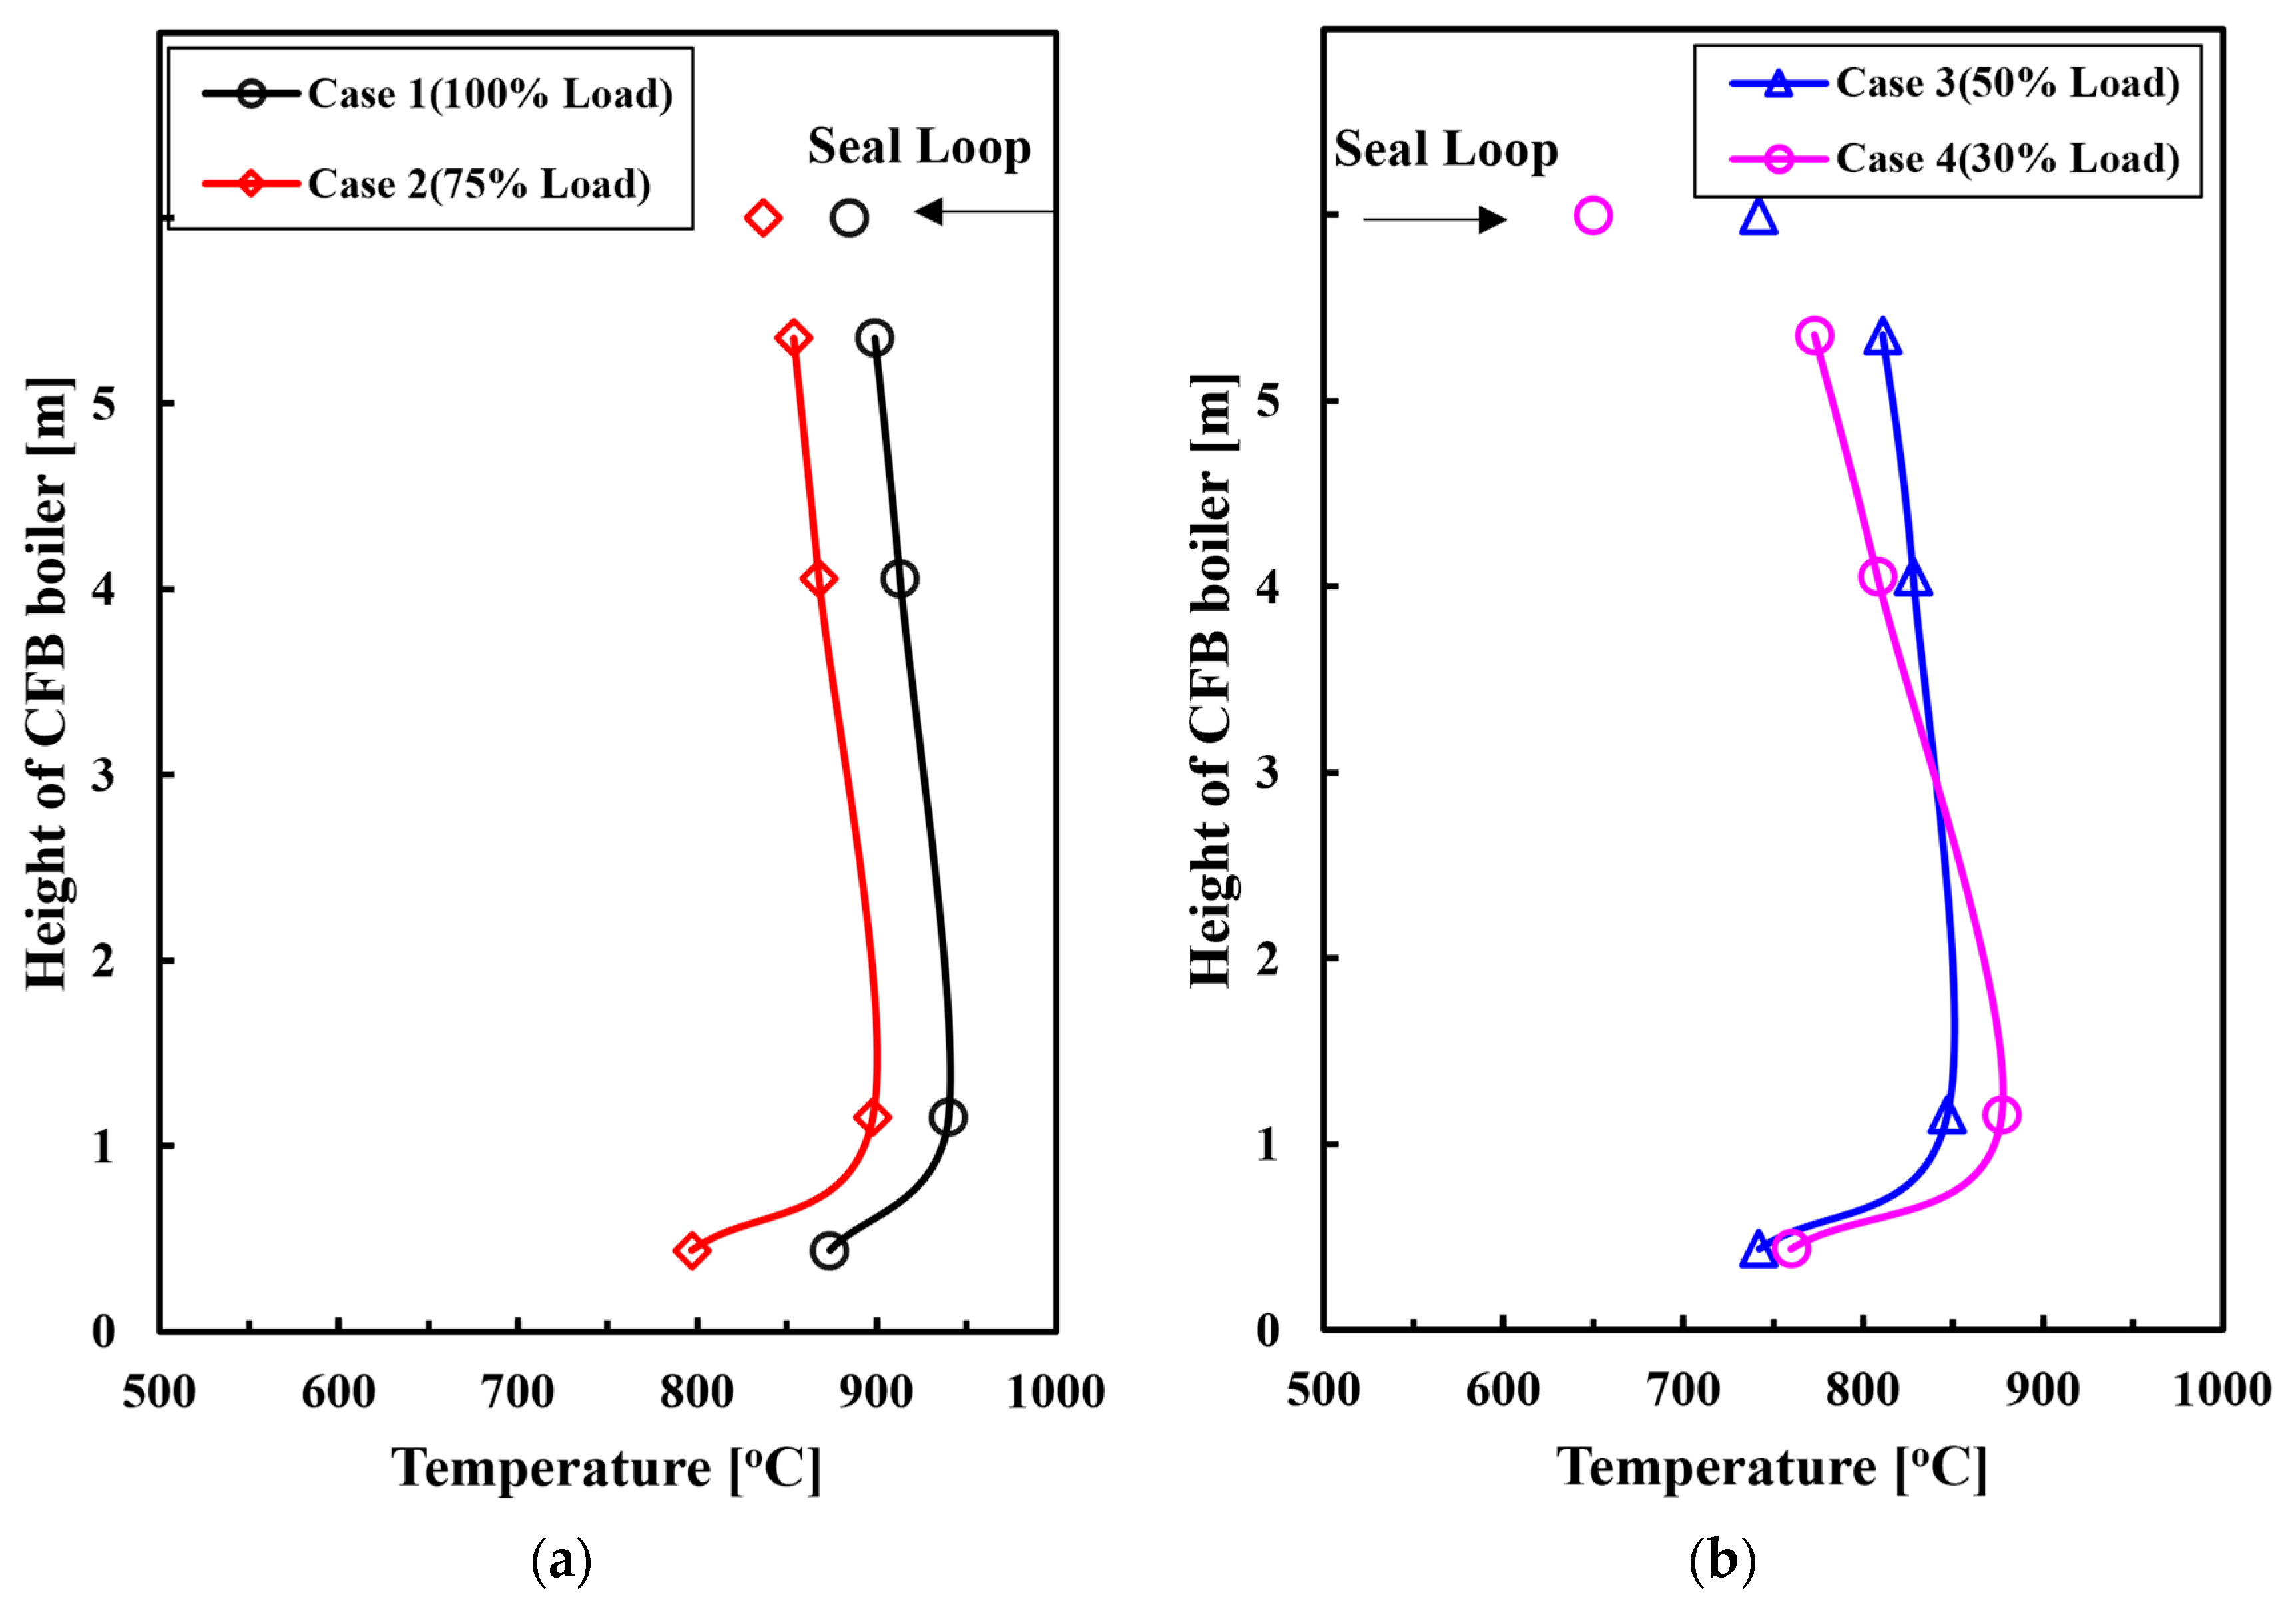
3.1.1. Temperature Characteristic

Figure 2a,b demonstrates the vertical temperature distribution curves along the furnace under different rated load conditions. Comparing the temperature distribution diagrams of high boiler-rated load conditions Case 1 and 2 (Figure 2a), it can be seen that the temperature in each area inside the riser revealed a decreasing trend. The reduction of the load was accompanied by the reduction of coal feed and airflow, and the proportion of combustion decreased accordingly, but the normal gas–solid fluidization in the boiler can still be maintained. In addition, the overall temperature in the boiler was kept above 800 °C in this stage, which also exhibited that a good combustion state can be maintained in the boiler before and after regulation between 100% and 75% high-rated load.
The temperature distribution of the boiler under low-rated load conditions Case 3 and 4 under stable operating conditions was shown in Figure 2b. Compared with Case 1 and 2, the combustion characteristics in the furnace are obviously different, and the overall average temperature distribution in the riser first increased and then decreased. Compared with Case 3 and Case 4, the maximum temperature difference is about 30 °C at the lower-dense phase zone (about 1 m) of the riser. This was mainly due to the primary air volume being greatly reduced in the 30% ultra-low-load operation, which made the uneven fluidization in the riser, while the combustion reaction of the pulverized coal entering the riser was mainly concentrated in the dense- phase zone. In addition, due to the deterioration of the overall gas–solid circulation in the boiler, a large amount of high-heating bed material was accumulated at the riser’s bottom, which will also cause the temperature to rise.
On the other hand, when the height of the riser exceeds 3 m, the dilute phase zone temperature of Case 4 dropped rapidly and even lower than Case 3. This also proved that the primary air volume under ultra-low load (30%) conditions was difficult to carry most of the solid particles in the dense phase zone to the dilute phase zone for the combustion reaction. Therefore, the combustion intensity of pulverized coal was weaker in this zone, less heat was produced and the average flue gas temperature was lower. In addition, the overall temperature drop led to the weakening of the ability of the rising flue gas to carry solid particles and caused lower separation efficiency of the cyclone separator. These factors ultimately led to a decline in both overall solids circulation rate in the boiler and in the suspended density of solid particles inside the boiler [35].
In addition, the seal loop zone temperature of Case 4 was also reduced by about 100 °C compared with Case 3, which was much higher than the temperature difference (30 °C) between high loads (Case 1 and 2). This also proved that the overall gas–solid circulation state under rated low-load operation was poorer than that under high-load operation in the boiler, and attention should be paid to the uniformity of fluidization during actual operation.

3.1.2. Pressure Characteristic

As shown in Figure 3, the pressure difference between rated loads was also different, and the pressure difference of Case 1–2 (high-rated load range) was significantly larger than that of Case 3–4 (low-rated load range). This was mainly because the interior of the furnace can still maintain a good gas–solid two-phase circulation before and after the load adjustment between high loads, and the pressure difference in each area was concentrated between 8.5 and 12 Kpa. However, the regulation of Case 3–4 (between low loads) was affected by the reduction of primary air flow, the effective circulation was reduced in the boiler, and the pressure difference from the dense-phase zone to the top of the riser is less than 4 Kpa.
Compared with the pressure difference in other zones, the pressure difference shows an increasing trend at the riser’s bottom. This was mainly due to the reduction of the primary air volume, which causes a large accumulation of solid particles at the riser’s bottom. Accordingly, if the ultra-low-load operation state is maintained for a long time, the fluidization characteristics will change to the bubbling bed state. This will affect the heat transfer of the heating surface in the boiler, and also pose a risk to safe operation due to overheating of the boiler bottom.

3.1.3. Flue Gas Composition Characteristic

The results of a comparison of the flue gas composition at the boiler outlet under different high- and low-rated load conditions are shown in Figure 4. First of all, the O2 concentration fluctuates within the range of 1.45–1.55% under Cases 1, 2 and 3. However, the O2 concentration of Case 4 (30% ultra-low-load condition) increased to 1.8% compared with the other operating conditions, which indicated that the oxidative combustion reaction was relatively slow under the 30% ultra-low-load condition. This also indirectly proves that the uniform gas–solid fluidization and the combustion reaction [37,38] are relatively sufficient during the stable operation of the boiler under the condition of high load (Case 1, 2). However, during the operation of low load (especially ultra-low load Case 4), due to factors such as a large accumulation of bed material in the dense-phase zone at the riser’s bottom, uneven distribution of gas–solid, insufficient oxidation and combustion reaction, etc., the O2 content is finally high at the outlet of the boiler.
In addition, regardless of the high- or low-load stage, the CO concentration showed an upward trend with the decrease of the load, but the concentration increased slowly at the 100% to 75% load stage and rose rapidly at the low-load stage (50% to 30%). This also shows that the gas–solid distribution is uniform, and the oxidation combustion reaction is sufficient in Cases 1 and 2, while the high CO concentration in Cases 3 and 4 is due to the deterioration of the gas–solid circulation state, and the local zone oxidation reaction was limited. The deterioration of the gas–solid circulation state leads to the inability to fully mixed the coal with O2, and the low load reaction temperature reduced the overall combustion reaction rate in the boiler and increased the char burnout time. While the combustion efficiency was low, the CO content increased significantly [37]. On the other hand, the amount of CO2 produced is mainly determined by the oxidation reaction of char-C and CO. At the same time, it can be obtained from the increase of UBC content in fly ash (Figure 5) with the decrease of load and the gradual increase of CO concentration at the boiler outlet. The CO2 concentration gradually decreases as the load decreases.

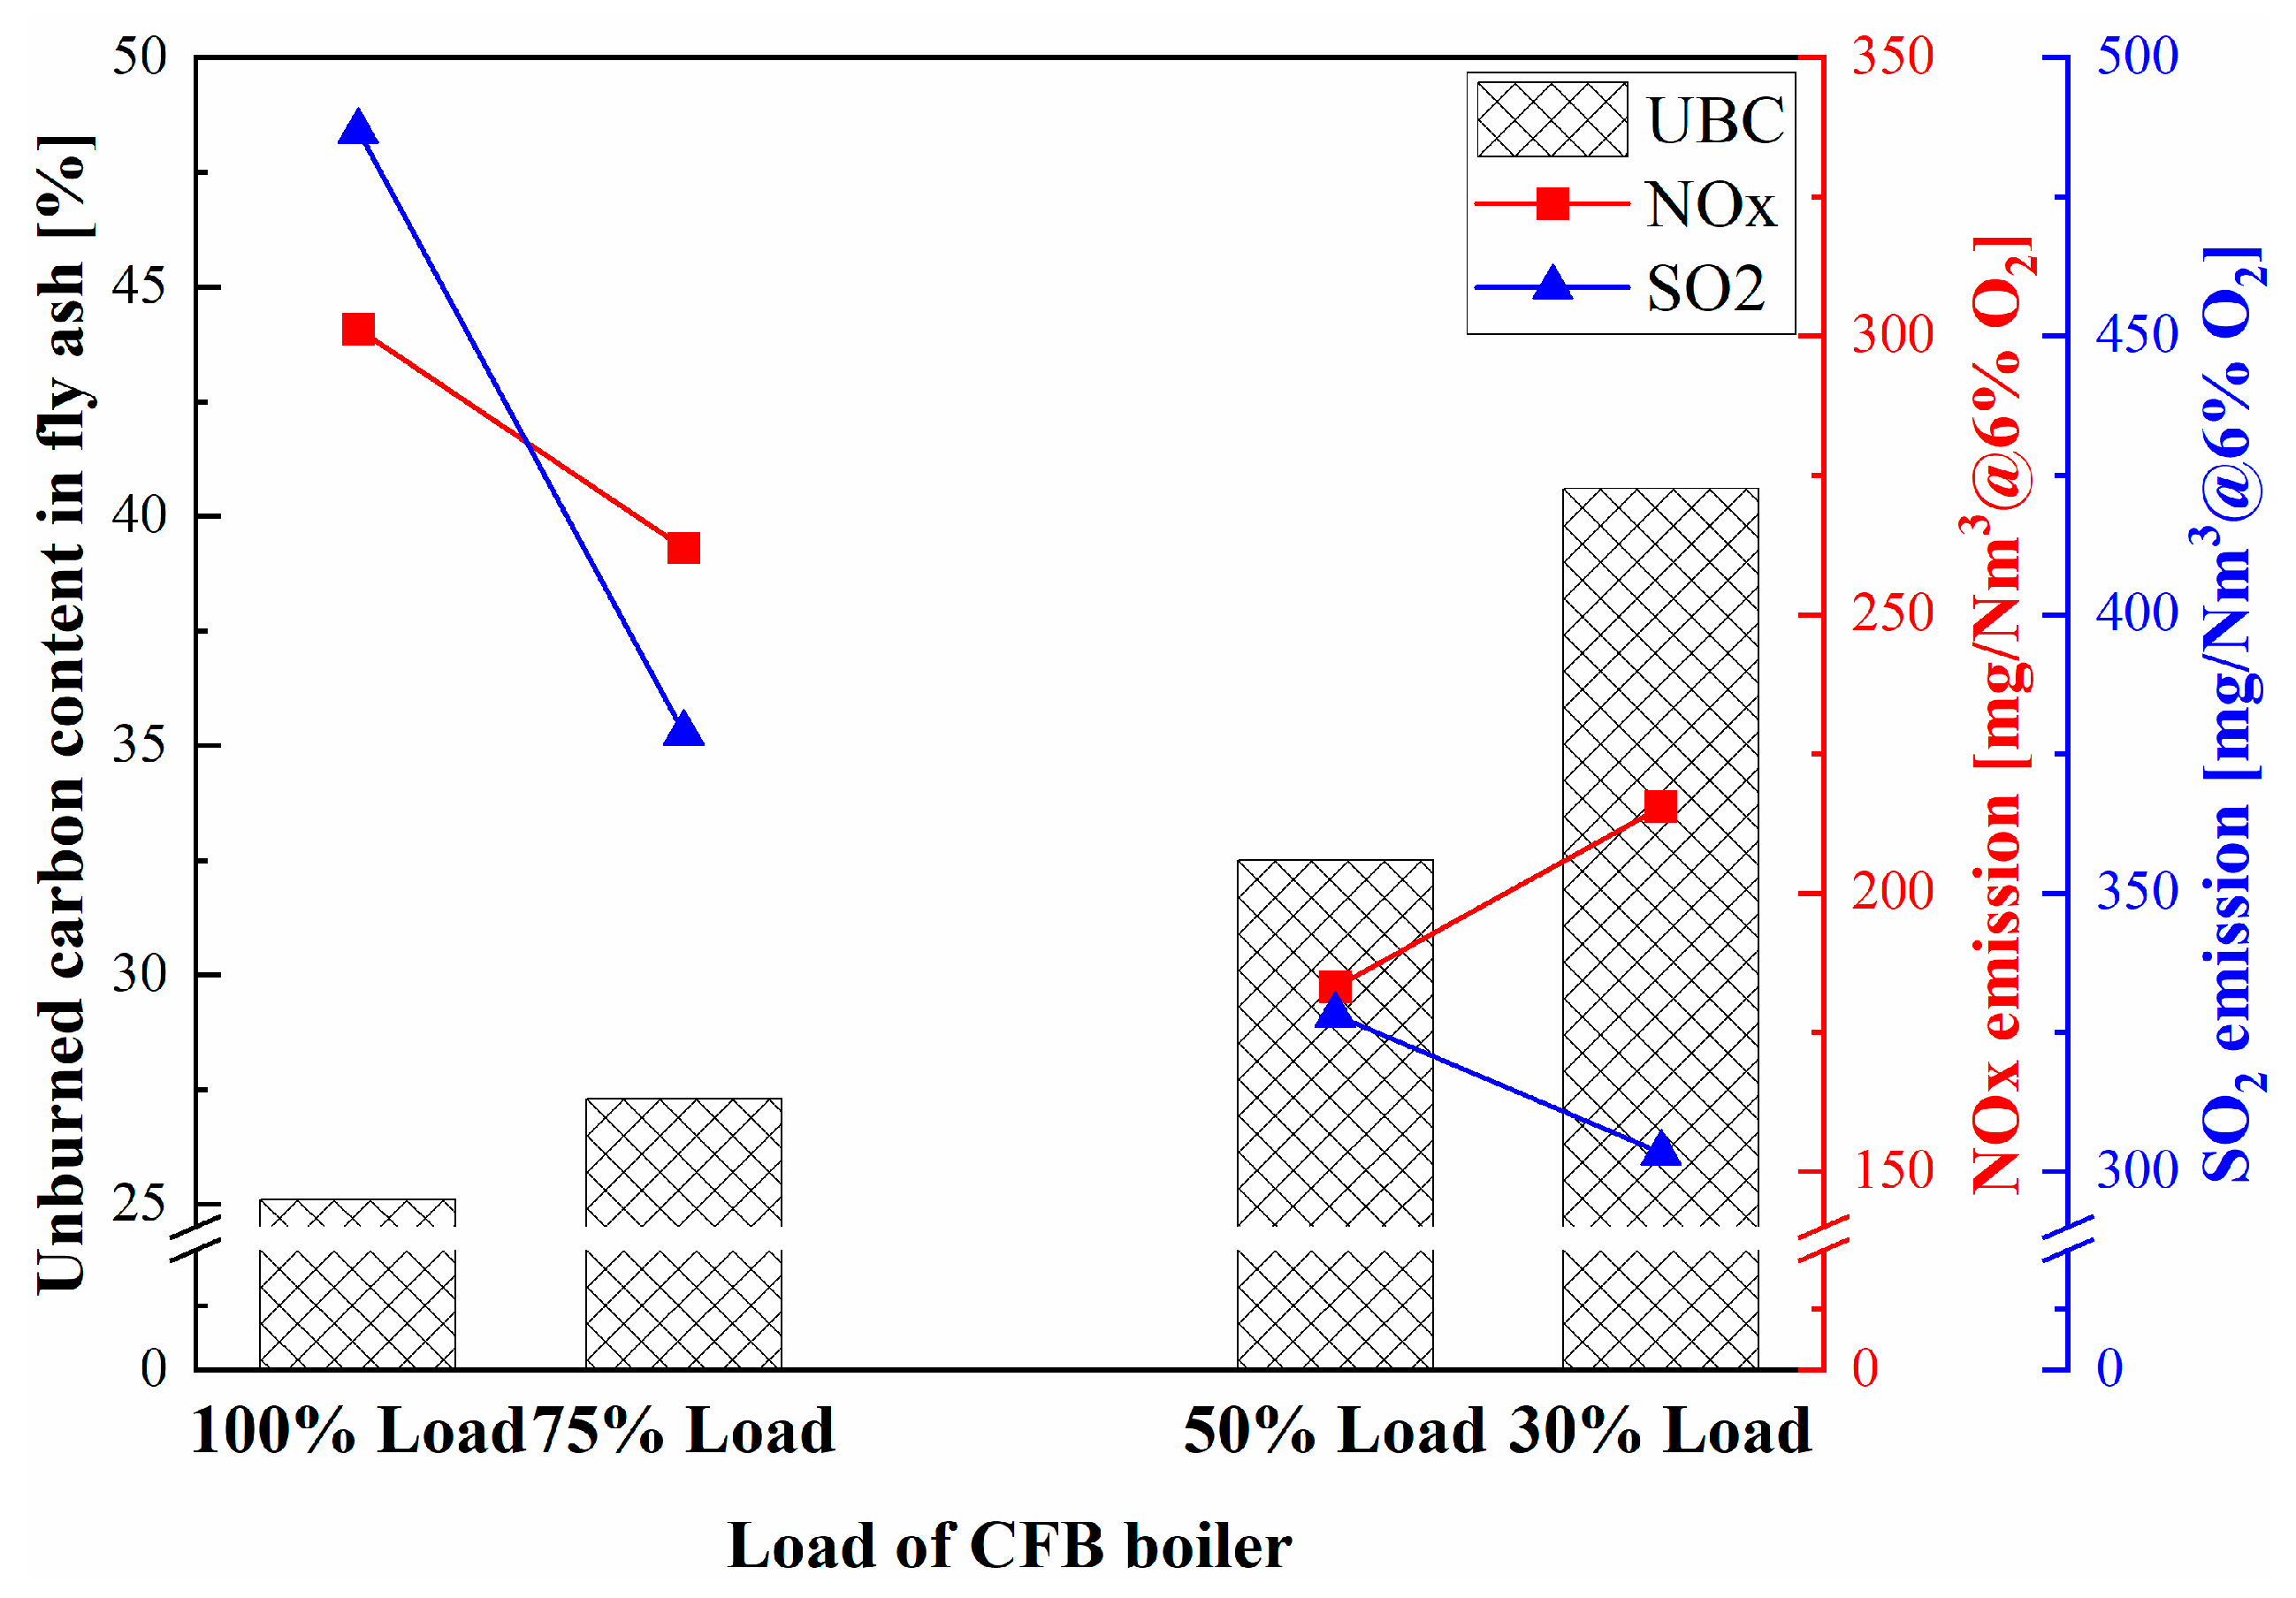
3.1.4. Emission Characteristics

Figure 5 shows the change of UBC content in fly ash and NOx generation under the stable operating conditions of various rated loads. Whether regulating between high load (Case 1–2) or low load (Case 3–4), the UBC content of fly ash continued to increase as the load decreased. The UBC content of Case 1–2 and Case 3–4 increased by about 2.2% and 8.1%, respectively. It proves that the load change adjustment will have a certain impact on the burnout of pulverized coal, and the heat loss directly related to the incomplete combustion of pulverized coal also shows an upward trend (low combustion efficiency). Secondly, the UBC content under low-load conditions (Cases 3 and 4) was generally higher than 30%, which also shows that under low-load operating conditions, the low bed temperature is extremely unfavorable for pulverized coal burnout. In addition, some problems will also occur under low-load operating conditions: the large reduction of primary air will cause uneven fluidization, the existence of some low-oxygen concentration areas and multiple bed materials will hinder the effective diffusion of oxygen, and the particle size of pulverized coal newly entering the riser is too large, etc. Under the Case 4 (30% load) condition, a large amount of CO gas (Figure 4) cannot be burned out and was trapped, and the O2 concentration was also higher than that of Case 3 (50% load), which also shown low combustion reactivity, and poor reaction degree, etc.
With the continuous reduction of load, the concentration of SO2 generation showed a downward trend. The main reasons for this phenomenon are as follows: the formation of SO2 mainly depends on the amount of Coal-S [39], and the coal feed continues to decrease with the decrease of load. At the same time, due to the reduction of load, the bed temperature and the degree of burnout of pulverized coal were reduced, and the residual S exists in fly ash or char [40].
The comparative analysis of the NOx generation shows that the NOx generation in the combustion stages of high-load (Case 1 and 2) conditions was generally higher than that in the combustion stages of low-load (Case 3 and 4) conditions, which mainly depended on the NOx produced by the coal fired into the boiler. Meanwhile, due to the amount of high SO2 during the high-rated load, the CO oxidation reaction was suppressed, and the generation of NO was reduced by the reducing atmosphere [41]. In addition, the generation of NOx showed a decreasing trend with the decreased load in the high load stage, but the amount of NOx generated in the low load stage was inversely proportional to the load (the amount of NOx generated increased by about 30 mg/Nm3@6%O2), which is similar to some research results [42]. Although the amount of coal has been continuously reduced, due to the uneven gas–solid fluidization in the furnace during low-load (30%) operation, the complete combustion of char is inhibited by high-concentration oxygen and the reducing atmosphere is weakened, resulting in increased NOx generation.
In addition, NOx generation was also closely related to the conversion mechanism of fuel N, and the final amount of NOx formation was jointly determined by the formation rate and reduction rate [43]. In the high-load (Case 1–2) regulated stage, as the combustion temperature was decreased, the volatile matter production rate in the fuel decreased, and gases such as NH3 and HCN cannot be released by Fuel-N and react with O2 to form NO was blocked. However, the amount of NO formed by the oxidation reaction of char-N was reduced by the decrease in O2 concentration. Relevant reaction equations are shown as (1) and (2):
HCN, NH3 + O2 → NO
Char N + O2 → NO
For the heterogeneous conversion process of NOx, the lowest temperature under the operating condition of Case 4, the active substances such as ash in the bed material had a certain role in limiting the catalytic reduction rate of NO [44]. At the same time, affected by the decrease in temperature, the NO reduction rate of char was reduced. The lower temperature made the combustion reaction incomplete, and the residual char increased in the boiler. A large amount of CO gas generated by the incomplete combustion reaction also inhibited the formation of NO in high-temperature char. Therefore, the main reason for the reduction of NO emissions due to the decrease in temperature is that the yield of volatile N in the pulverized coal devolatilization process was reduced, and the productivity of volatile N converted into NOx was also reduced accordingly. In addition, char-NO generation was also suppressed by char. Relevant reaction equations are shown as (3)–(5):
NO + C → 1/2 N2 + CO
2NO + C → N2 + CO2
NO + CO → (Char/Catalyst) 1/2N2 + CO2
Compared with the operation stage of Case 3, the final NOx generation showed an increased trend during Case 4 (Figure 5). Affected by the decrease in temperature and fuel quantity, the rate of NOx formation decreased. However, due to the poor gas–solid circulation in the furnace due to the low load, most of the solid particles were stored at the riser’s bottom, and the effective reduction reaction was weakened. In addition, the uneven distribution of the gas–solid flow field was caused by the continuous reduction of the airflow, and the active sites on the char surface were reduced by the high concentration of O2 in the local zone. Therefore, based on the above reasons, the formation rate of NO under Case 4 was higher than its reduction rate, and the final NOx generation was higher than that of Case 3.
To sum up, the gas–solid flow state and combustion atmosphere in the furnace during operation in different load stages were directly affected by the regulation of operating parameters, and the formation and reduction of NOx were also affected.

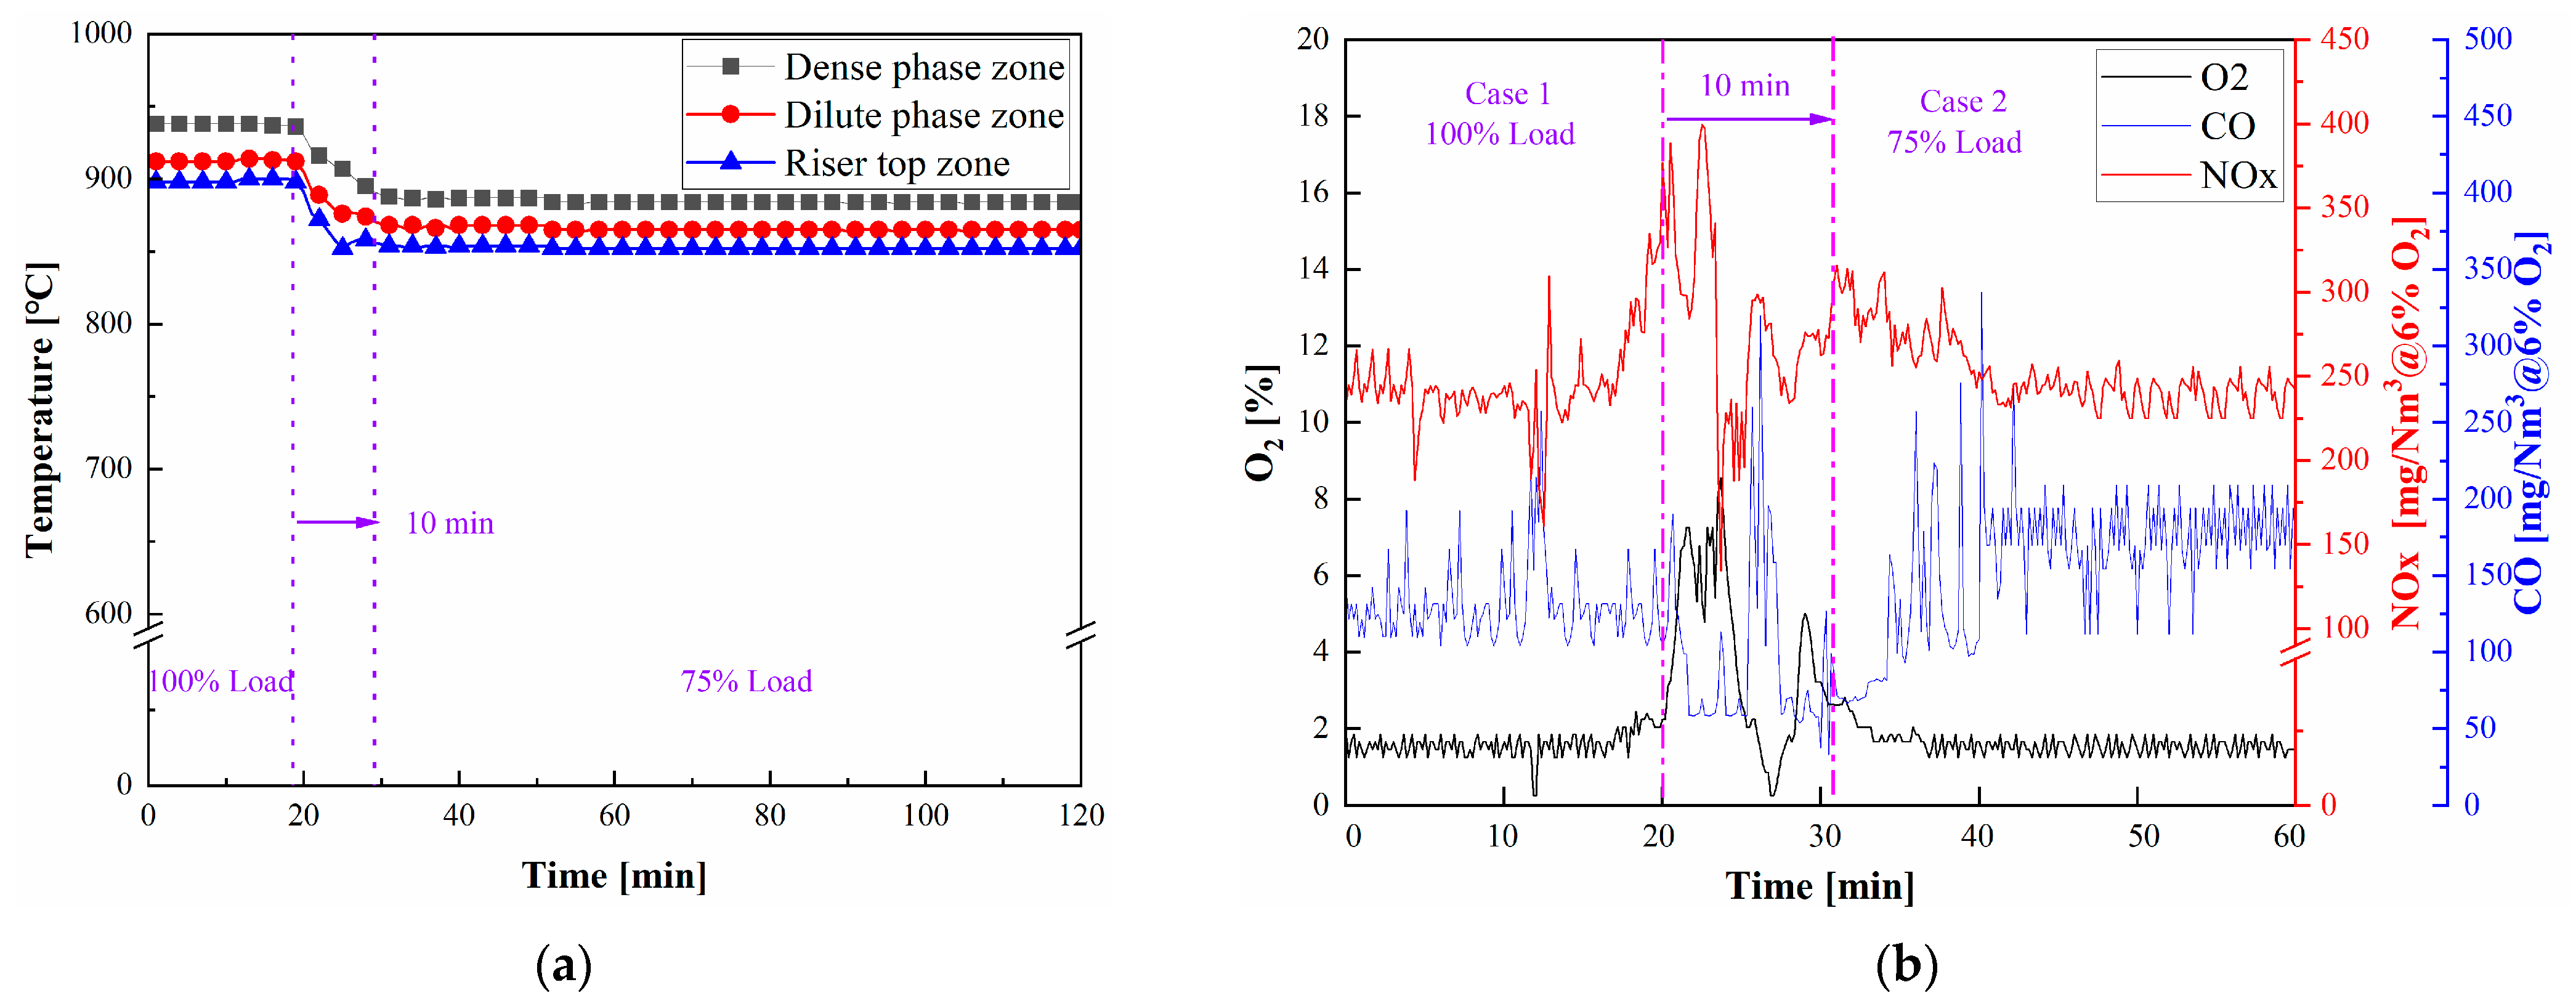
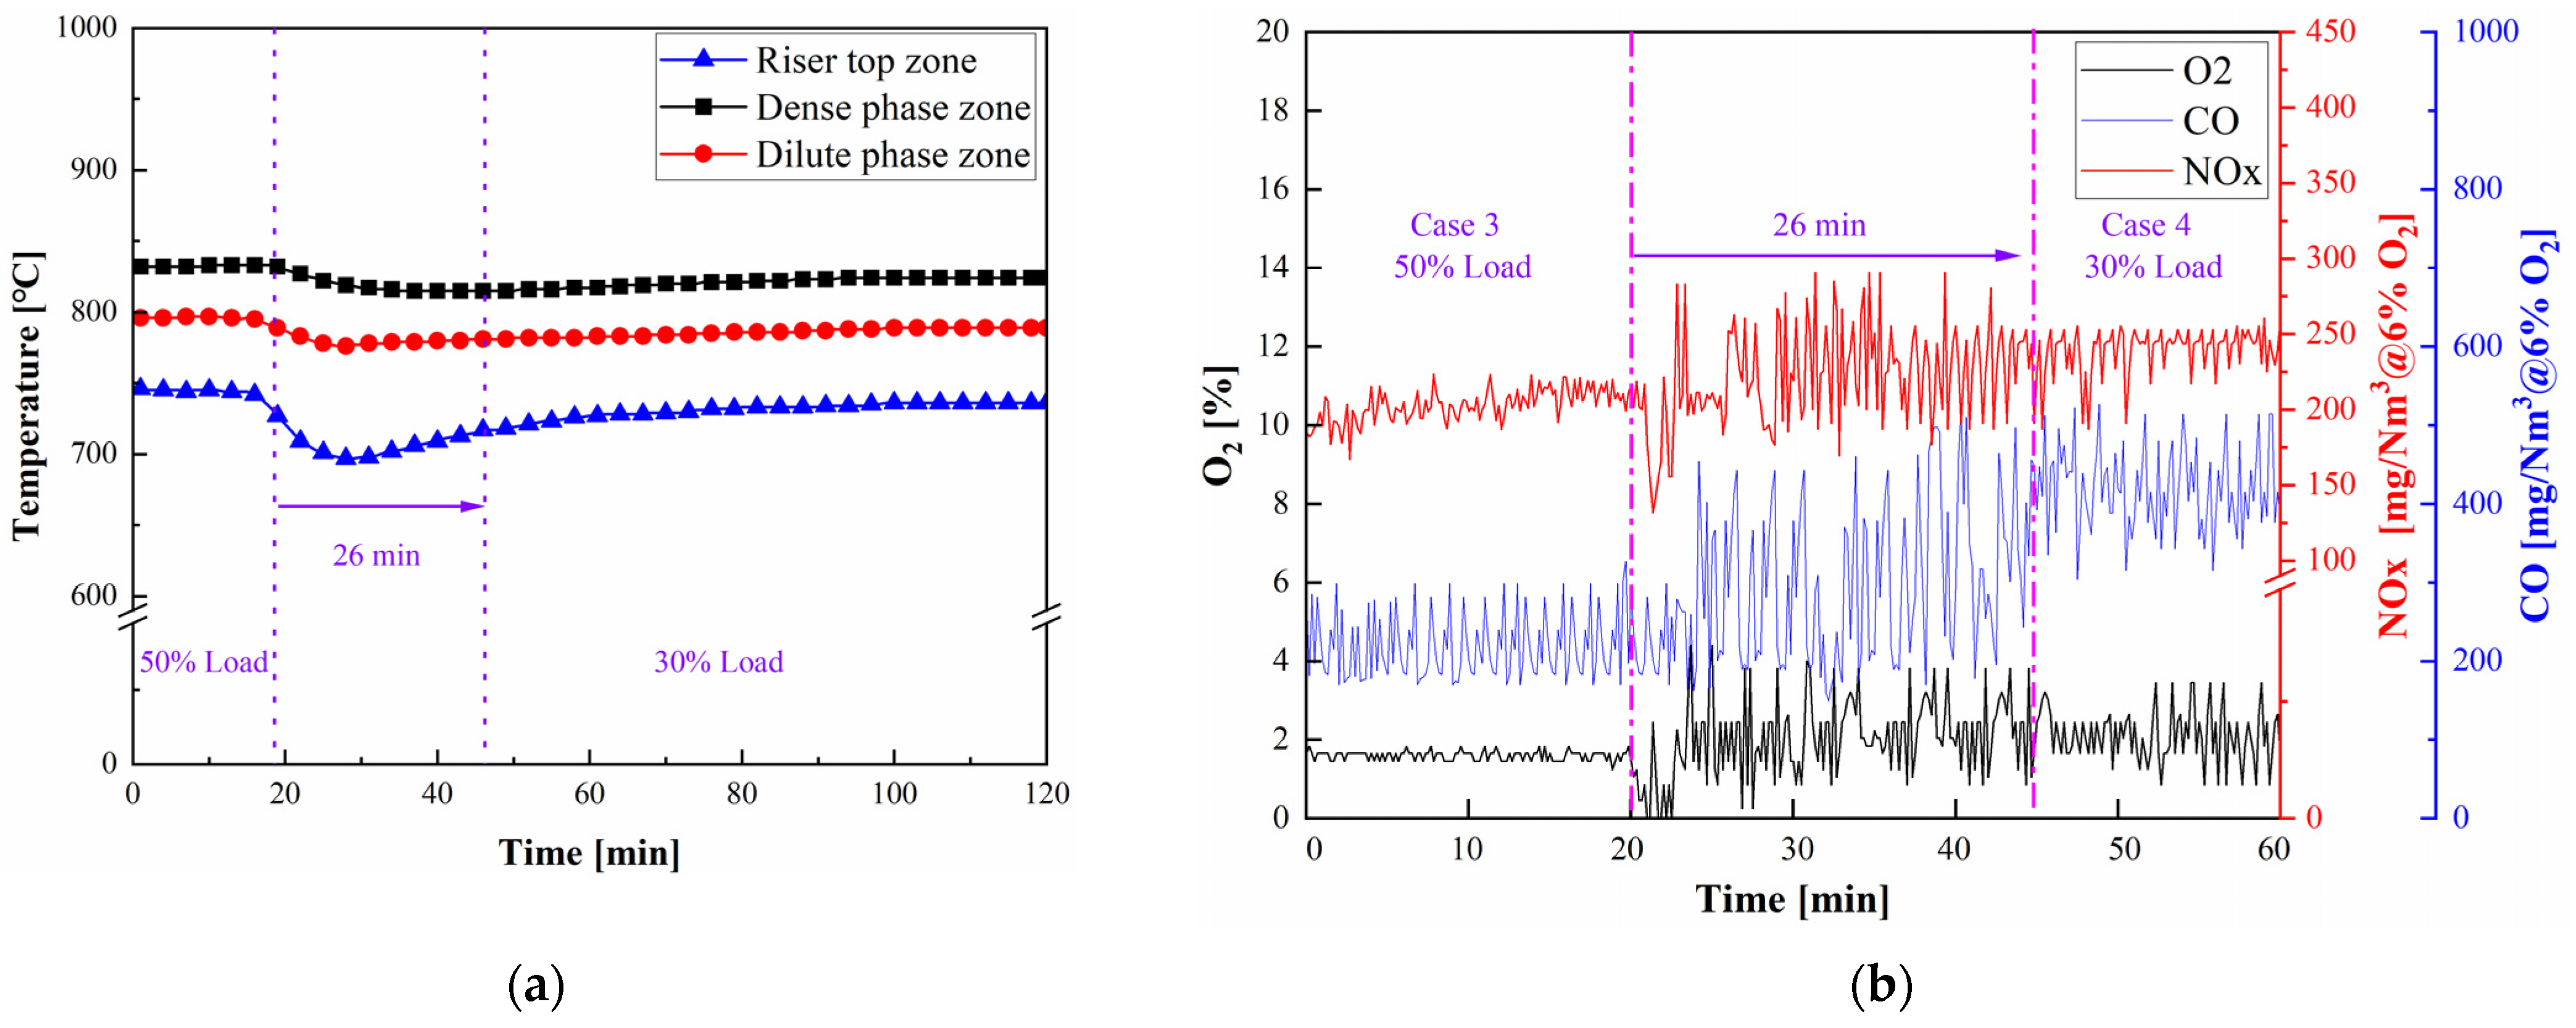
3.2. Influence of the Regulating Process between High and Low Loads on the Combustion and Pollutant Characteristics

As shown in Figure 6a, it has taken about 10 min to complete the regulation between high-load conditions (Case 1–2, 100% load to 75% load). During the regulated process, as the coal feed rate and airflow rate were reduced, the temperature in the dilute phase zone, dense phase zone and top zone of the riser all showed a rapid downward trend. In addition to affecting the combustion characteristics, load regulation also has caused a certain impact on the concentration change of gaseous substances. The O2 concentration at the boiler tail was mainly accompanied by the change in combustion reaction intensity. When the coal feed was reduced, the oxygen concentration rapidly increased to about 7%, and the change range was relatively large (0–8%) during load regulation. This is mainly because the circulating fluidized bed has the characteristics of combustion hysteresis, so the O2 concentration increased first and then decreased with the combustion reaction of pulverized coal particles. Before and after load regulation, the O2 concentration basically maintains fluctuations within a small range (1.4~1.6%).
The CO side decreases first and then increases with the beginning of load regulation, which mainly depends on the oxidation reaction rate. At the same time, the CO concentration was changed a little before and after the load regulation [24]. These all show that the gas–solid fluidization and combustion state inside the boiler before and after regulated operations between high loads are relatively stable. In addition, NOx continued to increase with the increase of O2 concentration after the load regulating started, then decreased and stabilized after the load regulating ended. Affected by the reduction of coal feed and airflow brought about by the load reduction, the NOx generation after load regulating was lower than before.
On the other hand, as shown in Figure 7, in the regulation process of low variable load conditions Case 3–4, the response time is about 26 min, which is longer than that of high variable load conditions. At the same time, due to factors such as lower airflow rate and downward movement of the combustion reaction zone under low load conditions, the temperature was changed in the dense-phase zone, and the furnace top zone was relatively insignificant before and after being load regulated. The temperature of the dense-phase zone showed a decrease first and then an increase, which indicated the combustion hysteresis characteristics of the fluidized bed in the dense-phase zone under low load. During the operation of Case 3–4, the O2 concentration mainly was changed between 0 and 4%, which was also shown that the reaction intensity fluctuates significantly at this stage. Moreover, when the response ends and enters the stable combustion stage, the O2 concentration (1–3.2%) fluctuates higher than before the load regulation. The CO concentration curve fluctuated significantly during the load response process, and the CO concentration increased after the stable operation compared with that before the load regulation. In terms of NOx, although the amount of coal feed was reduced, the formation of NOx after load changes was relatively increased due to various factors such as the unstable combustion state and the low cycle efficiency in the boiler. The above result proved that some problems such as uneven gas–solid fluidization, unstable combustion, and significant fluctuations in the gaseous concentration were caused by the low-load operation.
Comparing the variable load response rate in each load stage, it can be seen in Figure 8 that the variable load response rate (2.5%/min) of Case 1–2 (100% to 75%) is much higher than that of Case 3–4 (50% to 30%). Although the load reduction of 25% in the high load change stage was greater than the 20% in the low load change stage, the load change time was shorter, and the key parameters in the boiler were relatively stable before and after operation (Figure 6b and Figure 7b). Therefore, when adjusting between cases 3 and 4, in addition to the temperature changes in the dense-phase zone and the furnace top, the temperature changes in the furnace bottom should also be confirmed. This is mainly because the combustion reaction zone was reduced during low-load operation, and high-temperature bed materials were gathered at the bottom of the furnace, and overheating of the riser’s bottom was likely to cause safety hazards.

4. Conclusions

In order to achieve combustion optimization in the process of load regulation of circulating fluidized bed boilers, balance the uncertainty and intermittent power grid fluctuations caused by new energy power generation. In this study, through the 100 KW circulating fluidized bed boiler test platform, the comparative combustion test research of high and low load adjustment intervals was carried out, and the comparative analysis of combustion characteristics under the high (100%, 75%) and low (50%, 30%) rated loads, while analyzed the variable load response rate and gaseous substance concentration changes during the combustion process in the high and low variable load stage.
(1)
Under the condition of a high-rated load, the temperature was positively correlated with the size of the load. Under low-load conditions, affected by factors such as the deterioration of the furnace circulation caused by the reduction of the primary air and the downward movement of the main combustion zone, the overall average temperature of the boiler increases first and then decreases with the decrease of the load.
(2)
The pressure difference between high-rated loads was obviously stronger than that between low-rated loads, reflecting that the effective solid circulation was weakened at low loads, and the fluidized state changed to a bubbling bed under the condition of 30% load.
(3)
The O2 concentration has not significantly changed during the high-load operation stage, but it increased due to factors such as uneven fluidization and weak oxidation reaction of pulverized coal under the low-load 30% operation condition. The CO concentration was positively correlated with the UBC concentration under rated load conditions, which depends on the burnout degree of pulverized coal. In terms of CO2, it shows a downward trend mainly with the reduction of load.
(4)
In terms of NOx generation, it was proportional to the load in the high-rated load range and depends on the amount of pulverized coal entering the boiler. In the low-load stage, the main reason for the 30% load to generate about 30 mg/Nm3(@6%O2) higher NOx than the 50% load was due to factors such as uneven fluidization and unstable combustion.
(5)
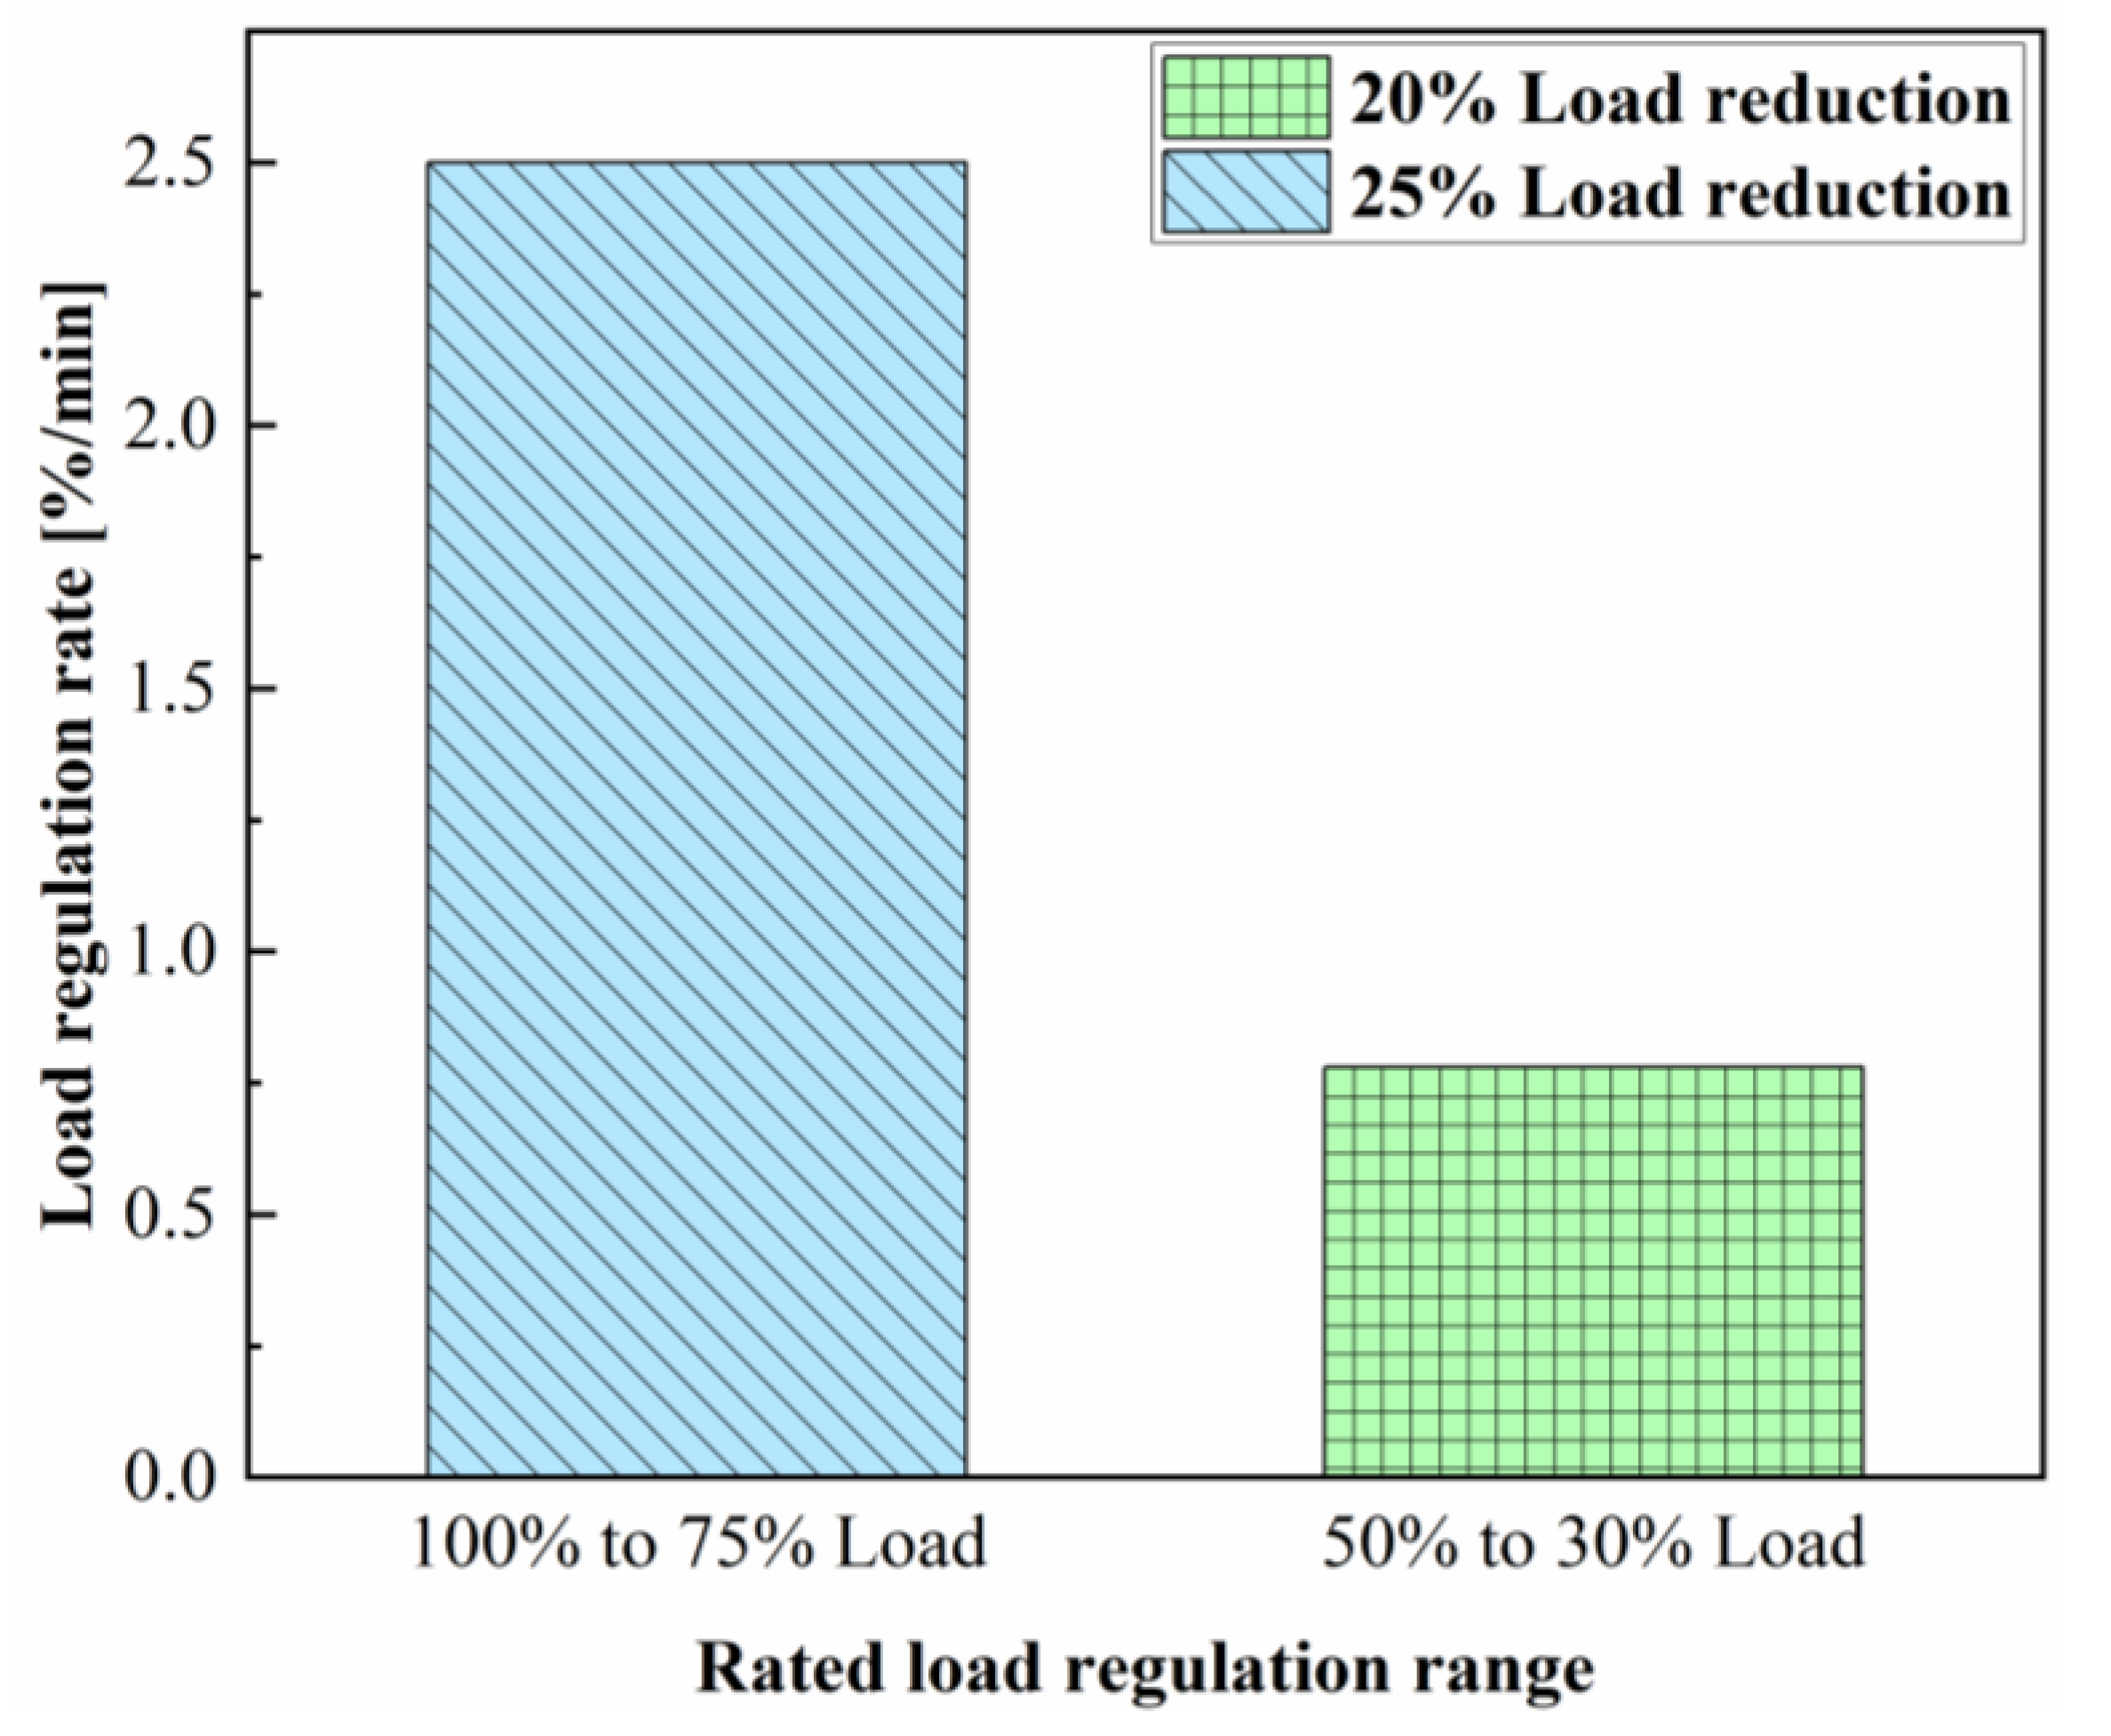
The variable load response rate (2.5%/min) between high-load conditions was significantly greater than that between low-load conditions (0.78%/min). The load responded process between low-load conditions was affected by uneven fluidization and Combustion instability and other factors caused large fluctuations in the concentration of key parameters (O2, CO).
Through this research, the combustion characteristics and variable load characteristics of CFB boilers in various load stages are obtained, which can provide a reference for the actual on-site unit operation. In future research, in addition to considering the flexibility of the combustion system, new control algorithms should also be introduced to improve the flexibility of the control system, and ultimately improve the flexibility of the overall system and better enhance the thermal power unit’s ability to serve as flexible power.

Author Contributions

Y.J.: Conceptualization, Investigation, Methodology, Experiment, Formal analysis, Validation, Writing—original draft, Writing—review and editing; Z.T.: Methodology, Experiment; X.Z.: Data collection; C.W.: Experiment; G.S.: Project administration; Q.L.: Supervision. All authors have read and agreed to the published version of the manuscript.

Funding

This work was supported by the Strategic Priority Research Program of the Chinese Academy of Sciences, Grant No. XDA21040100.

Conflicts of Interest

The authors declare no conflict of interest.

References

  1. International Energy Agency (IEA). World Energy Outlook (2022 Edition); International Energy Agency Report; International Energy Agency (IEA): Paris, France, 2022; pp. 32–72. [Google Scholar]
  2. Virguez, E.; Wang, X.; Patino-Echeverri, D. Utility-scale photovoltaics and storage: Decarbonizing and reducing greenhouse gases abatement costs. Appl. Energy 2021, 282, 116120. [Google Scholar] [CrossRef]
  3. The State Council of the People’s Republic of China. Report on the Work of the Government 2021; The State Council of the People’s Republic of China: Beijing, China, 2021. [Google Scholar]
  4. Gao, G. Peaking CO2 emission and carbon neutrality: The inevitable choice of China to go to a green economy. North. Econ. 2021, 3, 25–27. [Google Scholar]
  5. Mo, Q.; Zhu, X.; Deng, C.; Cen, S.; Ye, H.; Wang, C.; Lu, W.; Chen, X.; Lin, X. Analysis on influencing factors and improvement of thermal efficiency of bagasse boilers based on performance test data. Energy 2023, 271, 127099. [Google Scholar] [CrossRef]
  6. Chen, J.; Liu, W.; Jiang, D.; Zhang, J.; Ren, S.; Li, L.; Li, X.; Shi, X. Preliminary investigation on the feasibility of a clean CAES system coupled with wind and solar energy in China. Energy 2017, 127, 462–478. [Google Scholar] [CrossRef]
  7. Gonzalez-Salazar, M.A.; Kirsten, T.; Prchlik, L. Review of the operational flexibility and emissions of gas- and coal-fired power plants in a future with growing renewables. Renew. Sustain. Energy Rev. 2018, 82, 1497–1513. [Google Scholar] [CrossRef]
  8. Yu, H.Y.; Zu, G.X.; Dong, E.J. Research on effect of large-scale grid connected PV power station for power system. Northeast. Elect. Power Technol. 2016, 37, 54–57. [Google Scholar]
  9. Jiang, Y.; Lee, B.H.; Oh, D.H.; Jeon, C.H. Optimization of operating conditions to achieve combustion stability and reduce NOx emission at half-load for a 550-MW tangentially fired pulverized coal boiler. Fuel 2021, 306, 121727. [Google Scholar] [CrossRef]
  10. Jiang, Y.; Lee, B.H.; Oh, D.H.; Jeon, C.H. Influence of various air-staging on combustion and NOX emission characteristics in a tangentially fired boiler under the 50% load condition. Energy 2022, 244, 123167. [Google Scholar] [CrossRef]
  11. Aunedi, M.; Kindi, A.A.A.; Pantaleo, A.M.; Markides, C.N.; Strbac, G. System-driven design of flexible nuclear power plant configurations with thermal energy storage. Energy Convers. Manag. 2023, 291, 117257. [Google Scholar] [CrossRef]
  12. International Energy Agency (IEA). Coal 2022; International Energy Agency Report; International Energy Agency (IEA): Paris, France, 2022; pp. 13–14. [Google Scholar]
  13. Jiang, Y.; Ahn, S.; Oh, D.H.; Lee, B.H.; Jeon, C.H. Optimization of separated overfire air to reduce NOX emissions under combustion stability for the retrofit of a 500 MW tangentially pulverized coal boiler. Fuel 2021, 289, 119764. [Google Scholar] [CrossRef]
  14. Yue, G.; Cai, R.; Lu, J.; Zhang, H. From a CFB reactor to a CFB boiler: The review of R&D progress of CFB coal combustion technology in China. Powder Technol. 2016, 316, 18–28. [Google Scholar]
  15. Lee, B.H.; Bae, Y.H.; Kim, K.M.; Jiang, Y.; Ahn, Y.H.; Jeon, C.H. Application of the CPFD method to analyze the effects of bed material density on gas-particle hydrodynamics and wall erosion in a CFB boiler. Fuel 2023, 342, 127878. [Google Scholar] [CrossRef]
  16. Gao, M.; Zhang, B.; Hong, F.; Chen, F. Design and application of the feed water control strategy for a 350 MW circulating fluidized bed boiler. Appl. Therm. Eng. 2017, 125, 1–8. [Google Scholar] [CrossRef]
  17. Gao, M.; Hong, F.; Liu, J. Investigation on energy storage and quick load change control of subcritical circulating fluidized bed boiler units. Appl. Energy 2017, 185, 463–471. [Google Scholar] [CrossRef]
  18. Luo, G.; Zhang, X.; Liu, S.; Dan, E.; Guo, Y. Demand for flexibility improvement of thermal power units and accommodation of wind power under the situation of high-proportion renewable integration—Taking North Hebei as an example. Environ. Sci. Pollut. Control Ser. 2019, 26, 7033–7047. [Google Scholar] [CrossRef] [PubMed]
  19. Liu, J.; Hong, F.; Gao, M.; Li, C.; Chen, F. Research on the Control Strategy for Quick Load Change of Circulating Fluidized Bed Boiler Units. Proc. Chin. Soc. Electr. Eng. 2017, 37, 4130–4137. [Google Scholar]
  20. Jiang, C.; Niu, R. Research on operation method of deep peak-shaving of 330 MW fluidized bed units. J. Shenyang Inst. Eng. 2017, 13, 42–46. [Google Scholar]
  21. Deng, B.; Zhang, M.; Shan, L.; Wei, G.; Lyu, J.; Yang, H.; Gao, M. Modeling study on the dynamic characteristics in the full-loop of a 350 MW supercritical fluidized bed boiler under load regulation. J. Energy Inst. 2021, 97, 117–130. [Google Scholar] [CrossRef]
  22. Liu, Z.; Ma, S.; Pan, X.; Chen, J. Experimental study on the load response rate under the dynamic combined combustion of PC coal and CFB coal in a fluidized bed boiler. Fuel 2019, 236, 445–451. [Google Scholar] [CrossRef]
  23. Alobaid, F.; Peters, J.; Epple, B. Experimental measurements for Polish lignite combustion in a 1MWth circulating fluidized bed during load changes. Energy 2021, 228, 120585. [Google Scholar] [CrossRef]
  24. Tourunen, A.; Saastamoinen, J.; Nevalainen, H. Experimental trends of NO in circulating fluidized bed combustion. Fuel 2009, 88, 1333–1341. [Google Scholar] [CrossRef]
  25. Lupiáñez, C.; Guedea, I.; Bolea, I.; Díez, L.; Romeo, L. Experimental study of SO2 and NOx emissions in fluidized bed oxy-fuel combustion. Fuel Process Technol. 2013, 106, 587–594. [Google Scholar] [CrossRef]
  26. Jiang, Y.; Park, K.H.; Jeon, C.H. Feasibility Study of Co-Firing of Torrefied Empty Fruit Bunch and Coal through Boiler Simulation. Energies 2020, 13, 3051. [Google Scholar] [CrossRef]
  27. Stanmore, B.; Tschamber, V.; Brilhac, J. Oxidation of carbon by NOx with particular reference to NO2 and N2O. Fuel 2008, 87, 131–146. [Google Scholar] [CrossRef]
  28. Glarborg, P.; Jensen, A.; Johnsson, J. Fuel nitrogen conversion in solid fuel fired systems. Prog. Energy Combust. Sci. 2003, 29, 89–113. [Google Scholar] [CrossRef]
  29. Hayhurst, A.; Lawrence, A. The amounts of NOx and N2O formed in a fluidized bed combustor during the burning of coal volatiles and also of char. Combust. Flame 1996, 105, 341–357. [Google Scholar] [CrossRef]
  30. Miller, J.; Bowman, C. Mechanism and modeling of nitrogen chemistry in combustion. Prog. Energy Combust. Sci. 1989, 15, 287–338. [Google Scholar] [CrossRef]
  31. Winter, F.; Wartha, C.; Löffler, G.; Hofbauer, H. The NO and N2O formation mechanism during devolatilization and char combustion under fluidized-bed conditions. Symp. Int. Combust. 1996, 26, 3325–3334. [Google Scholar] [CrossRef]
  32. Li, S.; Yu, J.; Wei, X.; Guo, X.; Chen, Y. Catalytic reduction of nitric oxide by carbon monoxide over coal gangue hollow ball. Fuel Process Technol. 2014, 125, 163–169. [Google Scholar] [CrossRef]
  33. Wang, C.; Du, Y.; Che, D. Investigation on the NO reduction with coal char and high concentration CO during oxy-fuel combustion. Energy Fuel 2012, 26, 7367–7377. [Google Scholar] [CrossRef]
  34. Tarelho, L.; Matos, M.; Pereira, F. Axial and radial CO concentration profiles in an atmospheric bubbling fluidized bed combustor. Fuel 2005, 84, 1128–1135. [Google Scholar] [CrossRef]
  35. Ke, X.; Cai, R.; Zhang, M.; Miao, M.; Lyu, J.; Yang, H. Application of ultra-low NOx emission control for CFB boilers based on theoretical analysis and industrial practices. Fuel Process Technol. 2018, 181, 252–258. [Google Scholar] [CrossRef]
  36. Gong, Z.; Liu, Z.; Zhou, T.; Lu, Q.; Sun, Y. Combustion and NO emission of Shenmu char in a 2 MW circulating fluidized bed. Energy Fuels 2015, 29, 1219–1226. [Google Scholar] [CrossRef]
  37. Leckner, B. Fluidized bed combustion: Mixing and pollutant limitation. Prog. Energy Combust. Sci. 1998, 24, 31–61. [Google Scholar] [CrossRef]
  38. Leckner, B. Developments in fluidized bed conversion of solid fuels. Therm. Sci. 2016, 20, 1–18. [Google Scholar] [CrossRef]
  39. Krzywanski, J.; Czakiert, T.; Zylka, A.; Nowak, W.; Sosnowski, M.; Grabowska, K.; Skrobek, D.; Sztekler, K.; Kulakowska, A.; Ashraf, W.M.; et al. Modelling of SO2 and NOx Emissions from Coal and Biomass Combustion in Air-Firing, Oxyfuel, iG-CLC, and CLOU Conditions by Fuzzy Logic Approach. Energies 2022, 15, 8095. [Google Scholar] [CrossRef]
  40. Wang, C.; Song, G.; Chen, R.; Jiang, Y.; Lyu, Q. Influence of Operating Parameters on NOx and SO2 Emissions in Circulating Fluidized Bed with Post-Combustion. J. Therm. Sci. 2023. [Google Scholar] [CrossRef]
  41. Krzywanski, J.; Czakiert, T.; Nowak, W.; Shimizu, T.; Zylka, A.; Idziak, K.; Sosnowski, M.; Grabowska, K. Gaseous Emissions from Advanced CLC and Oxyfuel Fluidized Bed Combustion of Coal and Biomass in a Complex Geometry Facility: A Comprehensive Model. Energy 2022, 251, 123896. [Google Scholar] [CrossRef]
  42. Ke, X.; Zhu, S.; Huang, Z.; Zhang, M. Issues in deep peak regulation for circulating fluidized bed combustion: Variation of NOx emissions with boiler load. Environ. Pollut. 2023, 318, 120912. [Google Scholar] [CrossRef]
  43. Kawabata, Y.; Nakagome, H.; Wajima, T.; Hosokai, S.; Sato, H.; Matsuoka, K. Tar emission during pyrolysis of low rank coal in a circulating fluidized bed reactor. Energy Fuels 2018, 32, 1387–1394. [Google Scholar] [CrossRef]
  44. Li, J.; Zhang, Y.; Yang, H.; Yang, Y. Study of the effect of ash composition in coal on the kinetic parameters of NO reduction reaction by CO. J. China Coal Soc. 2016, 41, 2448–2453. [Google Scholar]
Figure 1. System schematic diagram of the 100 KW circulating fluidized-bed experimental platform.
Energies 16 06190 g001
Figure 2. Temperature distribution along the furnace under various rated load conditions. (a) Case 1 and 2 (100% load, 75% load) conditions. (b) Case 3 and 4 (50% load, 30% load) conditions.
Energies 16 06190 g002
Figure 3. Variation of boiler pressure difference under different load conditions.
Energies 16 06190 g003
Figure 4. Analysis of flue gas composition (O2, CO, CO2) at the furnace outlet during the stable operation of the boiler under different load conditions.
Energies 16 06190 g004
Figure 5. Analysis of pollutant generation (UBC, SO2, NOx) at the furnace outlet during the stable operation of the boiler under different load conditions.
Energies 16 06190 g005
Figure 6. Change of load response rate and gaseous concentration in the process of regulating between high loads. (a) Temperature variation curves. (b) Gaseous concentration variation curves.
Energies 16 06190 g006
Figure 7. Change of load response rate and gaseous concentration in the process of regulating between low loads. (a) Temperature variation curves. (b) Gaseous concentration variation curves.
Energies 16 06190 g007
Figure 8. Comparison of load response rates in high and low load intervals.
Energies 16 06190 g008
Table 1. The properties of Shenmu bituminous coal.
Fuel TypeUltimate Analysis/wt %Proximate Analysis/wt %Qar,net,p/MJ/kg
C adH adO adN adS adM adV adFC adA ad
Shenmu coal62.943.8810.180.980.411.839.0147.809.8224.52
ad: air dried basis; ar: net value of received basis.
Table 2. The operation condition of CFB boiler under different load regulation.
ItemUnitCase 1Case 1–2Case 2Case 3Case 3–4Case 4
Thermal loadKW100100~75755050~3030
Level-High-HighLow-Ultra low
Load percentage%100100~75755050~3030
Coal feeding ratekg/h14.514.5~11.211.27.27.2~4.94.9
Total air flow rateNm3/h104.1104.1~78.2678.2651.6951.67~35.1835.18
Primary air flow rateNm3/h88.4988.49~66.5266.5243.9443.94~29.929.9
Excess air coefficient-1.1
Disclaimer/Publisher’s Note: The statements, opinions and data contained in all publications are solely those of the individual author(s) and contributor(s) and not of MDPI and/or the editor(s). MDPI and/or the editor(s) disclaim responsibility for any injury to people or property resulting from any ideas, methods, instructions or products referred to in the content.

