
Green Hydrogen: Resources Consumption, Technological Maturity, and Regulatory Framework


Abstract
:1. Introduction: Scientific Background and Related Works
2. Green Hydrogen Water Footprint
3. Green Hydrogen Energy Footprint
4. TRL of Hydrogen Technologies
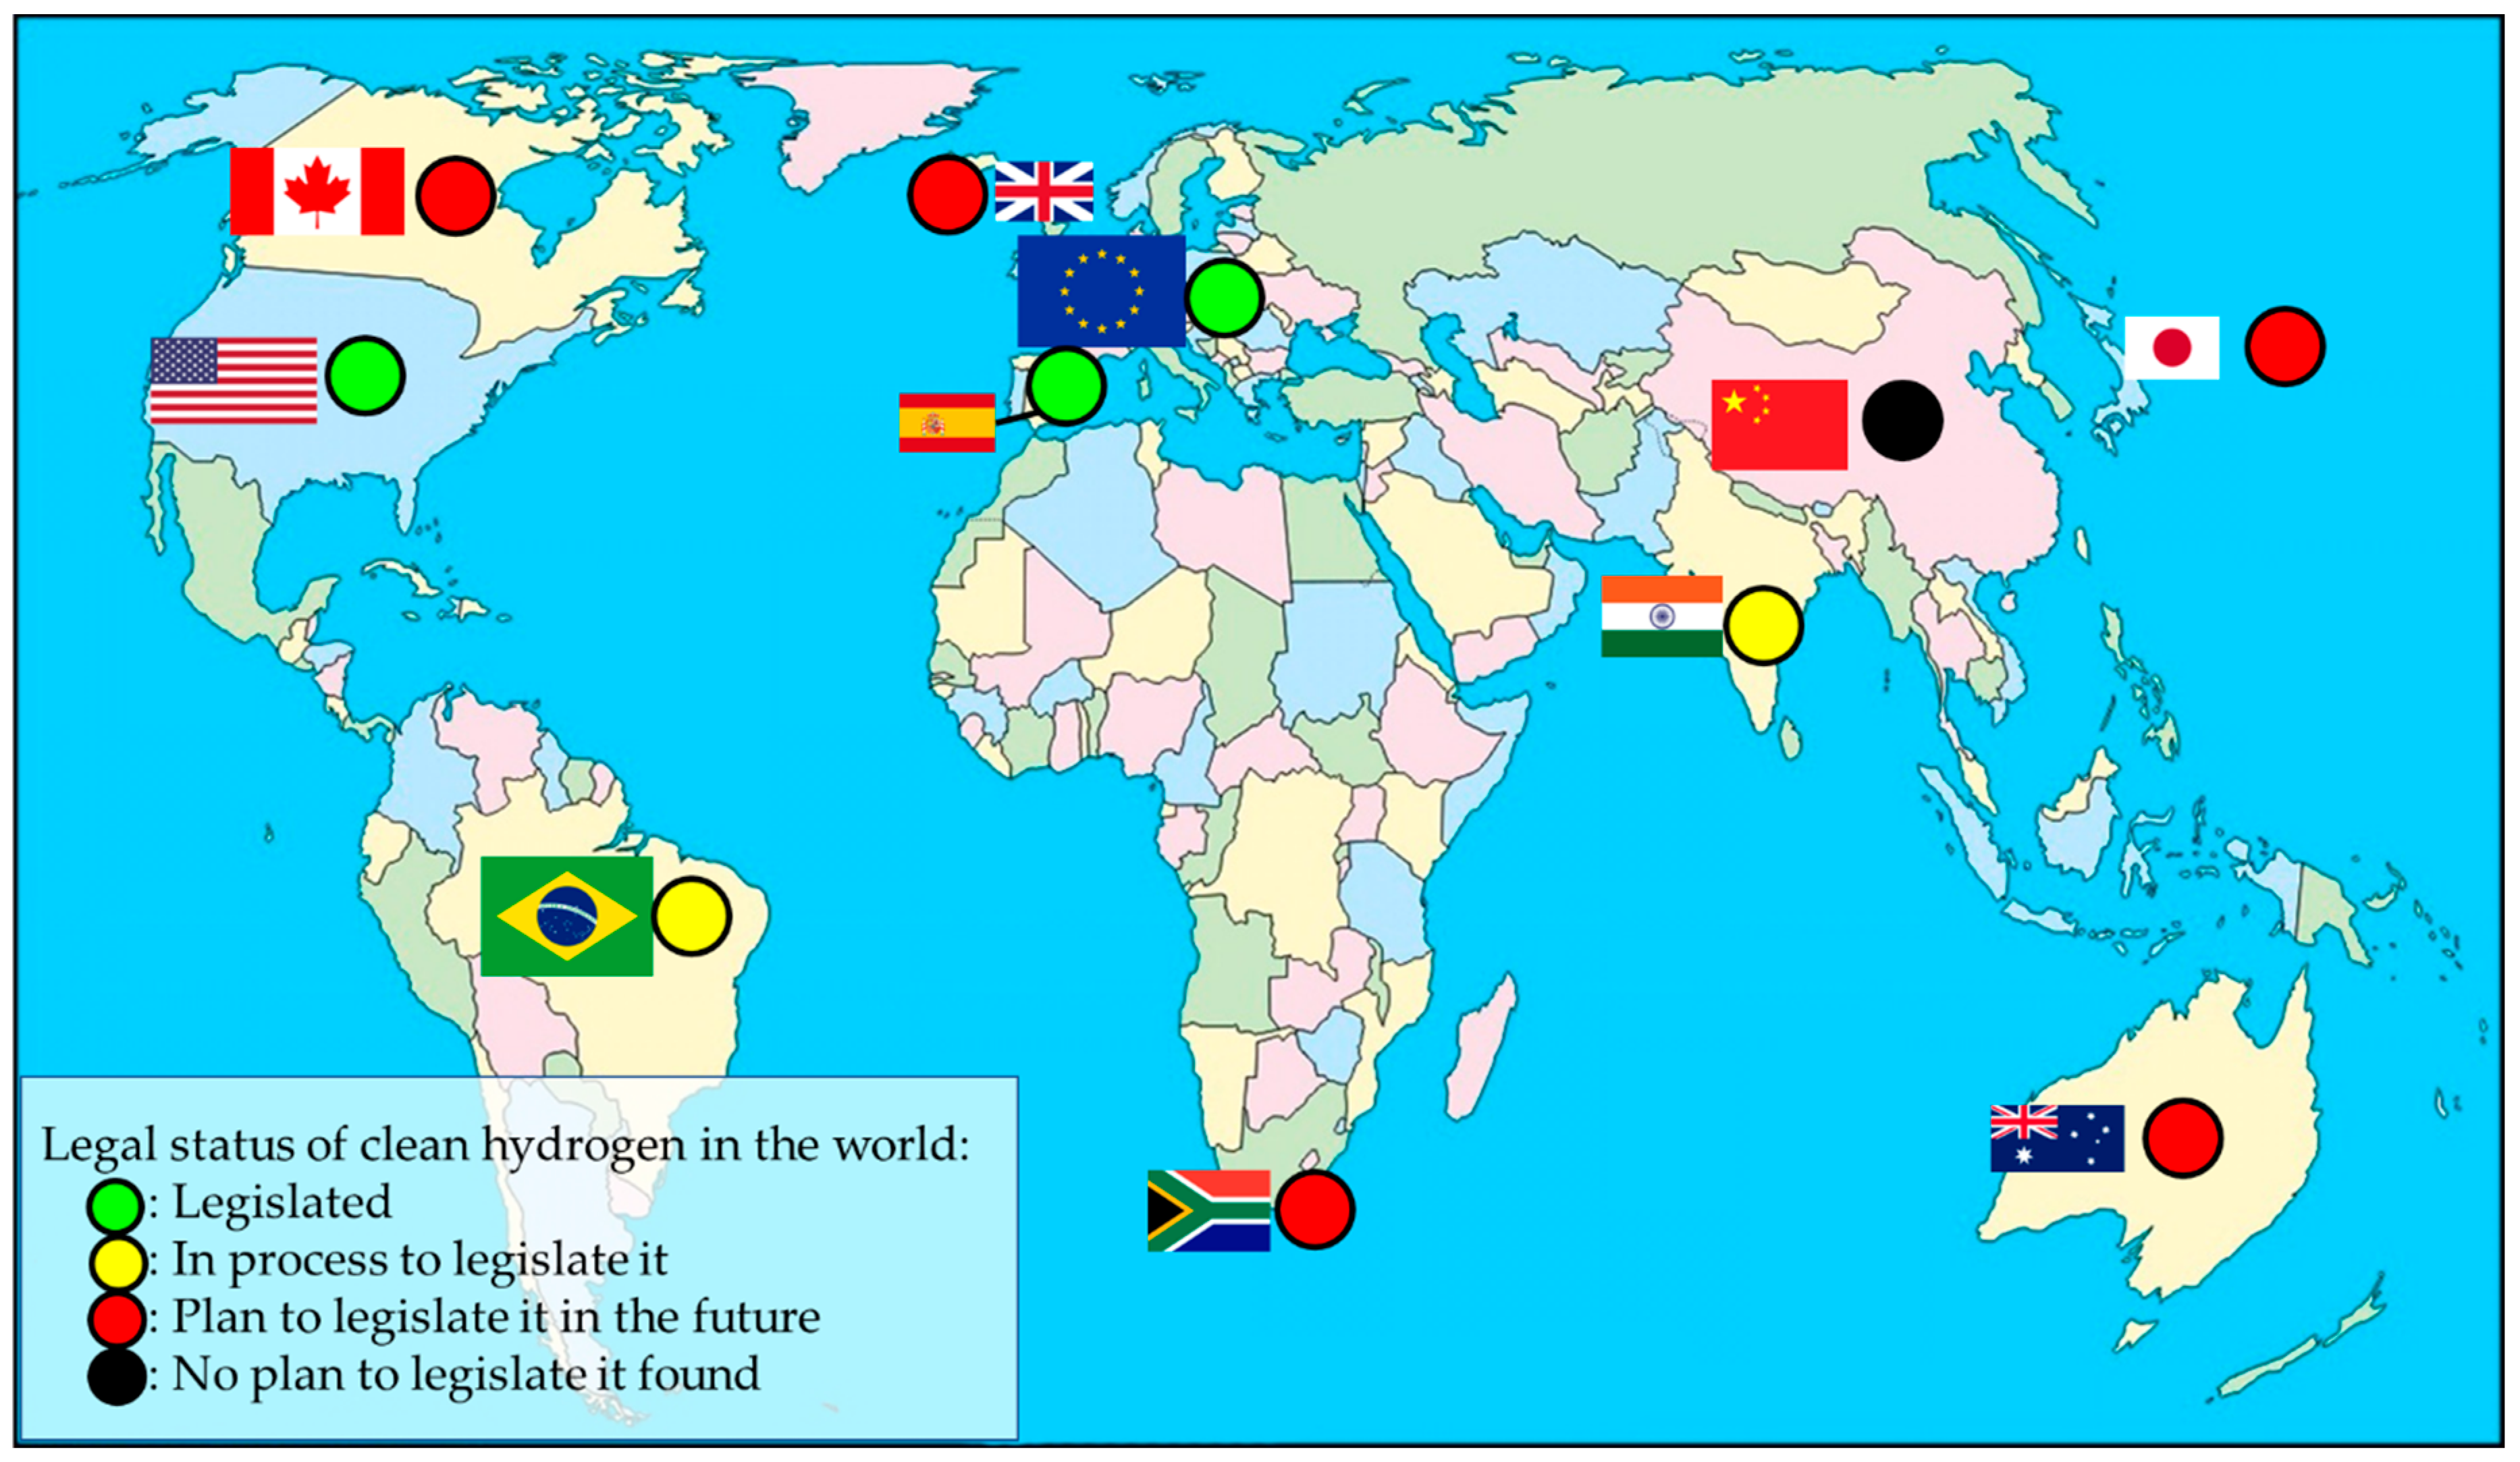
5. Green Hydrogen Regulatory Framework: Global Legislation and Guarantees of Origin (GO)
- (1)
- Spain
- (2)
- European Union (EU)
- (3)
- United States (US)
- (4)
- Australia
- (5)
- United Kingdom (UK)
- (6)
- Japan
- (7)
- Canada
- (8)
- China
- (9)
- Brazil
- (10)
- India
- (11)
- South Africa
6. Discussion
- (a)
- Green hydrogen water footprint
- (b)
- Green hydrogen energy footprint
- (c)
- TRL of hydrogen technologies
- (d)
- Green hydrogen current global legislation and GOs certificates
7. Conclusions
Author Contributions
Funding
Data Availability Statement
Conflicts of Interest
Abbreviations
| AAEM | Acid-Assisted Extraction Method. |
| AC | Activated Carbon. |
| AEC | Australian Energy Council. |
| AEG | Aerogel. |
| AEM | Anion Exchange Membrane. |
| AEM-FC | Anion Exchange Membrane Fuel Cell. |
| AEM-WE | Anion Exchange Membrane Water Electrolysis. |
| AFC | Alkaline Fuel Cell. |
| ANP | National Agency for Petroleum, Natural Gas and Biofuels. |
| ATR | Autothermal Reforming. |
| AWE | Alkaline Water Electrolysis. |
| BG | Biogas Gasification. |
| BMZ | Ministry of Economic Cooperation and Development. |
| BPG | Biowaste Pyrogasification. |
| BR | Biogas Reforming. |
| CcH2 | Cryocompressed Hydrogen. |
| CER | Clean Energy Regulator. |
| CF | Carbon Fibres. |
| CG | Coal Gasification. |
| CH | Complex Hydrides. |
| CH2 | Compressed Hydrogen. |
| CN | Carbon Nanotubes. |
| CNMV | National Commission of Markets and Competition. |
| COR | Crude Oil Refining. |
| DEM | Dry Extraction Method. |
| DF | Dark-Fermentation. |
| DMFC | Direct Methanol Fuel Cell. |
| EROI | Energy Return On Investment. |
| ESS | Energy Storage Systems. |
| EU | European Union. |
| GH | Green Hydrogen. |
| GO | Guarantee of Origin. |
| H2ICE | Hydrogen Internal Combustion Engine. |
| H2DRI | Hydrogen Direct Reduced Ironmaking. |
| HCI | Hydrogen Cleanness Index. |
| HDT | Hydrogen Distribution Technologies. |
| HT | Hydrotreating. |
| LCFS | Low Carbon Fuel Standard. |
| LHV | Lower Heating Value. |
| LOHC | Liquid Organic Hydrogen Carrier. |
| MCFC | Molten Carbonate Fuel Cell. |
| MH | Metal Hydrides. |
| MOF | Metal Organic Framework. |
| MP | Methane Pyrolisis. |
| PAFC | Phosphoric Acid Fuel Cell. |
| PC | Photocatalysis. |
| PEM | Polymer Exchange Membrane. |
| PEM-FC | Polymer Exchange Membrane Fuel Cell. |
| PEM-WE | Polymer Exchange Membrane Water Electrolysis. |
| PF | Photo-Fermentation. |
| PG | Plasma Gasification. |
| PH | Physisorption. |
| PV | PhotoVoltaic. |
| RD | Royal Decree. |
| RES | Renewable Energy Sources. |
| SMR | Steam and Methane Reforming. |
| SOFC | Solid Oxide Fuel Cell. |
| SO-WE | Solid Oxide Water Electrolysis. |
| TC | Templated Carbon. |
| TRL | Technology Readiness Level. |
| UHU | University of Huelva. |
| UK | United Kingdom. |
| US | United States. |
| Notation and Symbols | |
| Gibbs free energy (kJ/mol). | |
| enthalpy of formation (kJ/mol). | |
| entropy (kJ/(mol·K)). | |
| PV energy generated annually in the studied microgrid (22,590 kWh). | |
| PV energy generated annually worldwide (830,741·106 kWh/year). | |
| wind energy generated annually in China (800·109 kWh/year). | |
| wind energy generated annually in the studied microgrid (1087 kWh). | |
| energy required in the electrolyser so that the electrolysis takes place (36.14–54.6 kWh/kg H2). | |
| Faraday constant (96,485 C/mol). | |
| PV power installed in the considered location (15 kW). | |
| total PV power installed worldwide (710·106 kW). | |
| wind power in the considered location (3.4 kW). | |
| total wind power installed in China (278.353·106 kW). | |
| temperature (K). | |
| average lifetime of a PV panel (25–30 years/panel). | |
| average lifetime of a wind turbine (20 years/wind turbine). | |
| standard equilibrium voltage of the water electrolysis cell (. | |
| electrolyser water footprint (9.1–18 L H2O/kg H2). | |
| water footprint of green hydrogen produced in Huelva (L H2O/kg H2). | |
| water footprint of green hydrogen produced via solar energy in Huelva (L H2O/kg H2). | |
| water footprint of green hydrogen produced via wind energy in Huelva (L H2O/kg H2). | |
| water footprint of PV power. | |
| water footprint of PV energy at “La Rábida Campus” (University of Huelva). | |
| water footprint of PV energy worldwide (0–0.11 L H2O/kWh. | |
| water footprint of wind power. | |
| water footprint of wind energy in China (0–0.64 L H2O/kWh. | |
| water footprint of wind energy at “La Rábida Campus” (University of Huelva). | |
| number of electrons converted per H2 molecule (z = 2). |
References
- Beasy, K.; Emery, S.; Pryor, K.; Vo, T.A. Skilling the green hydrogen economy: A case study from Australia. Int. J. Hydrogen Energy 2023, 48, 19811–19820. [Google Scholar] [CrossRef]
- Liu, Z.; Wang, B.; Cazorla, C. Strain Engineering of Two-Dimensional Piezophotocatalytic Materials for Improved Hydrogen Evolution Reaction. ACS Sustain. Chem. Eng. 2022, 10, 16924–16934. [Google Scholar] [CrossRef]
- Han, H.; Qiu, Y.; Zhang, H.; Bi, T.; Yang, Q.; Liu, M.; Zhou, J.; Ji, X. Lattice-disorder layer generation from liquid processing at room temperature with boosted nanointerface exposure toward water splitting. Sustain. Energy Fuels 2022, 6, 3008–3013. [Google Scholar] [CrossRef]
- Vivas, F.J.; De las Heras, A.; Segura, F.; Andújar, J.M. A review of energy management strategies for renewable hybrid energy systems with hydrogen backup. Renew. Sustain. Energy Rev. 2018, 82, 126–155. [Google Scholar] [CrossRef]
- Van, L.P.; Chi, K.D.; Duc, T.N. Review of hydrogen technologies based microgrid: Energy management systems, challenges and future recommendations. Int. J. Hydrogen Energy 2023, 48, 14127–14148. [Google Scholar] [CrossRef]
- Genovese, M.; Cigolotti, V.; Jannelli, E.; Fragiacomo, P. Current standards and configurations for the permitting and operation of hydrogen refueling stations. Int. J. Hydrogen Energy 2023, 48, 19357–19371. [Google Scholar] [CrossRef]
- Rasul, M.G.; Hazrat, M.A.; Sattar, M.A.; Jahirul, M.I.; Shearer, M.J. The future of hydrogen: Challenges on production, storage and applications. Energy Convers. Manag. 2022, 272, 116326. [Google Scholar] [CrossRef]
- Bollmann, J.; Schmidt, N.; Beck, D.; Preuster, P.; Zigan, L.; Wasserscheid, P.; Will, S. A path to a dynamic hydrogen storage system using a liquid organic hydrogen carrier (LOHC): Burner-based direct heating of the dehydrogenation unit. Int. J. Hydrogen Energy 2023, 48, 1011–1023. [Google Scholar] [CrossRef]
- Ferrario, A.M.; Vivas, F.J.; Manzano, F.S.; Andújar, J.M.; Bocci, E.; Martirano, L. Hydrogen vs. Battery in the long-term operation. A comparative between energy management strategies for hybrid renewable microgrids. Electronics 2020, 9, 698. [Google Scholar] [CrossRef]
- Lubello, P.; Pasqui, M.; Mati, A.; Carcasci, C. Assessment of hydrogen-based long term electrical energy storage in residential energy systems. Smart Energy 2022, 8, 100088. [Google Scholar] [CrossRef]
- Viteri, J.P.; Viteri, S.; Alvarez-Vasco, C.; Henao, F. A systematic review on green hydrogen for off-grid communities –technologies, advantages, and limitations. Int. J. Hydrogen Energy 2023, 48, 19751–19771. [Google Scholar] [CrossRef]
- Meda, U.S.; Rajyaguru, Y.V.; Pandey, A. Generation of green hydrogen using self-sustained regenerative fuel cells: Opportunities and challenges. Int. J. Hydrogen Energy 2023, 48, 28289–28314. [Google Scholar] [CrossRef]
- Patnaik, D.; Pattanaik, A.K.; Bagal, D.K.; Rath, A. Reducing CO2 emissions in the iron industry with green hydrogen. Int. J. Hydrogen Energy 2023, 48, 23449–23458. [Google Scholar] [CrossRef]
- Qiu, Y.; Liu, Z.; Yang, Q.; Zhang, X.; Liu, J.; Liu, M.; Bi, T.; Ji, X. Atmospheric-Temperature Chain Reaction towards Ultrathin Non-Crystal-Phase Construction for Highly Efficient Water Splitting. Chem.-A Eur. J. 2022, 28, e202200683. [Google Scholar] [CrossRef] [PubMed]
- de Souza, T.A.Z.; Rocha, D.H.D.; Julio, A.A.V.; Coronado, C.J.R.; Silveira, J.L.; Silva, R.J.; Palacio, J.C.E. Exergoenvironmental assessment of hydrogen water footprint via steam reforming in Brazil. J. Clean. Prod. 2021, 311, 127577. [Google Scholar] [CrossRef]
- Cui, P.; Xu, Z.; Yao, D.; Qi, H.; Zhu, Z.; Wang, Y.; Li, X.; Liu, Z.; Yang, S. Life cycle water footprint and carbon footprint analysis of municipal sludge plasma gasification process. Energy 2022, 261, 125280. [Google Scholar] [CrossRef]
- Shi, X.; Liao, X.; Li, Y. Quantification of fresh water consumption and scarcity footprints of hydrogen from water electrolysis: A methodology framework. Renew. Energy 2020, 154, 786–796. [Google Scholar] [CrossRef]
- Mehmeti, A.; Angelis-Dimakis, A.; Arampatzis, G.; McPhail, S.J.; Ulgiati, S. Life Cycle Assessment and Water Footprint of Hydrogen Production Methods: From Conventional to Emerging Technologies. Environments 2018, 5, 24. [Google Scholar] [CrossRef]
- Beswick, R.R.; Oliveira, A.M.; Yan, Y. Does the Green Hydrogen Economy Have a Water Problem? ACS Energy Lett. 2021, 6, 3167–3169. [Google Scholar] [CrossRef]
- Hren, R.; Vujanović, A.; Van Fan, Y.; Klemeš, J.J.; Krajnc, D.; Čuček, L. Hydrogen production, storage and transport for renewable energy and chemicals: An environmental footprint assessment. Renew. Sustain. Energy Rev. 2023, 173, 113113. [Google Scholar] [CrossRef]
- Arsad, A.Z.; Hannan, M.A.; Al-Shetwi, A.Q.; Begum, R.A.; Hossain, M.J.; Ker, P.J.; Mahlia, T.I. Hydrogen electrolyser technologies and their modelling for sustainable energy production: A comprehensive review and suggestions. Int. J. Hydrogen Energy 2023, 48, 27841–27871. [Google Scholar] [CrossRef]
- Pawłowski, A.; Zelazna, A.; Zak, J. Is the Polish Solar-to-Hydrogen Pathway Green? A Carbon Footprint of AEM Electrolysis Hydrogen Based on an LCA. Energies 2023, 16, 3702. [Google Scholar] [CrossRef]
- Dermühl, S.; Riedel, U. A comparison of the most promising low-carbon hydrogen production technologies. Fuel 2023, 340, 127478. [Google Scholar] [CrossRef]
- Pinsky, R.; Sabharwall, P.; Hartvigsen, J.; O’Brien, J. Comparative review of hydrogen production technologies for nuclear hybrid energy systems. Prog. Nucl. Energy 2020, 123, 103317. [Google Scholar] [CrossRef]
- Solis, M.; Silveira, S. Technologies for chemical recycling of household plastics—A technical review and TRL assessment. Waste Manag. 2020, 105, 128–138. [Google Scholar] [CrossRef]
- Al Ghafri, S.Z.; Revell, C.; Di Lorenzo, M.; Xiao, G.; Buckley, C.E.; May, E.F.; Johns, M. Techno-economic and environmental assessment of LNG export for hydrogen production. Int. J. Hydrogen Energy 2023, 48, 8343–8369. [Google Scholar] [CrossRef]
- Bollmann, J.; Pitchaimuthu, S.; Kühnel, M.F. Challenges of Industrial-Scale Testing Infrastructure for Green Hydrogen Technologies. Energies 2023, 16, 3604. [Google Scholar] [CrossRef]
- Incer-Valverde, J.; Mörsdorf, J.; Morosuk, T.; Tsatsaronis, G. Power-to-liquid hydrogen: Exergy-based evaluation of a large-scale system. Int. J. Hydrogen Energy 2021, 48, 11612–11627. [Google Scholar] [CrossRef]
- Simanullang, M.; Prost, L. Nanomaterials for on-board solid-state hydrogen storage applications. Int. J. Hydrogen Energy 2022, 47, 29808–29846. [Google Scholar] [CrossRef]
- Massaro, M.C.; Biga, R.; Kolisnichenko, A.; Marocco, P.; Monteverde, A.H.A.; Santarelli, M. Potential and technical challenges of on-board hydrogen storage technologies coupled with fuel cell systems for aircraft electrification. J. Power Sources 2023, 555, 232397. [Google Scholar] [CrossRef]
- Niermann, M.; Beckendorff, A.; Kaltschmitt, M.; Bonhoff, K. Liquid Organic Hydrogen Carrier (LOHC)—Assessment based on chemical and economic properties. Int. J. Hydrogen Energy 2019, 44, 6631–6654. [Google Scholar] [CrossRef]
- Böhm, M.; Fernández Del Rey, A.; Pagenkopf, J.; Varela, M.; Herwartz-Polster, S.; Nieto Calderón, B. Review and comparison of worldwide hydrogen activities in the rail sector with special focus on on-board storage and refueling technologies. Int. J. Hydrogen Energy 2022, 47, 38003–38017. [Google Scholar] [CrossRef]
- Okonkwo, E.C.; Al-Breiki, M.; Bicer, Y.; Al-Ansari, T. Sustainable hydrogen roadmap: A holistic review and decision-making methodology for production, utilisation and exportation using Qatar as a case study. Int. J. Hydrogen Energy 2021, 46, 35525–35549. [Google Scholar] [CrossRef]
- Neuwirth, M.; Fleiter, T.; Manz, P.; Hofmann, R. The future potential hydrogen demand in energy-intensive industries—A site-specific approach applied to Germany. Energy Convers. Manag. 2022, 252, 115052. [Google Scholar] [CrossRef]
- Kampker, A.; Ayvaz, P.; Schön, C.; Karstedt, J.; Förstmann, R.; Welker, F. Challenges towards large-scale fuel cell production: Results of an expert assessment study. Int. J. Hydrogen Energy 2020, 45, 29288–29296. [Google Scholar] [CrossRef]
- Singh, S.P.; Ohara, B.; Ku, A.Y. Prospects for cost-competitive integrated gasification fuel cell systems. Appl. Energy 2021, 290, 116753. [Google Scholar] [CrossRef]
- Olabi, A.G.; Wilberforce, T.; Abdelkareem, M.A. Fuel cell application in the automotive industry and future perspective. Energy 2021, 214, 118955. [Google Scholar] [CrossRef]
- Velazquez Abad, A.; Dodds, P.E. Green hydrogen characterisation initiatives: Definitions, standards, guarantees of origin, and challenges. Energy Policy 2020, 138, 111300. [Google Scholar] [CrossRef]
- Cheng, W.; Lee, S. How Green Are the National Hydrogen Strategies? Sustainability 2022, 14, 1930. [Google Scholar] [CrossRef]
- Dawood, F.; Anda, M.; Shafiullah, G.M. Hydrogen production for energy: An overview. Int. J. Hydrogen Energy 2020, 45, 3847–3869. [Google Scholar] [CrossRef]
- Mould, K.; Silva, F.; Knott, S.F.; O’Regan, B. A comparative analysis of biogas and hydrogen, and the impact of the certificates and blockchain new paradigms. Int. J. Hydrogen Energy 2022, 47, 39303–39318. [Google Scholar] [CrossRef]
- Yuan, L.; Steinle-Neumann, G. Hydrogen distribution between the Earth’s inner and outer core. Earth Planet. Sci. Lett. 2023, 609, 118084. [Google Scholar] [CrossRef]
- Hassan, Q.; Sameen, A.Z.; Olapade, O.; Alghoul, M.; Salman, H.M.; Jaszczur, M. Hydrogen fuel as an important element of the energy storage needs for future smart cities. Int. J. Hydrogen Energy 2023, in press. [Google Scholar] [CrossRef]
- Hwang, J.; Maharjan, K.; Cho, H.J. A review of hydrogen utilization in power generation and transportation sectors: Achievements and future challenges. Int. J. Hydrogen Energy 2023, 48, 28629–28648. [Google Scholar] [CrossRef]
- Huang, J.; Balcombe, P.; Feng, Z. Technical and economic analysis of different colours of producing hydrogen in China. Fuel 2023, 337, 127227. [Google Scholar] [CrossRef]
- Purayil, S.T.P.; Hamdan, M.O.; Al-Omari, S.A.B.; Selim, M.Y.E.; Elnajjar, E. Review of hydrogen–gasoline SI dual fuel engines: Engine performance and emission. Energy Rep. 2023, 9, 4547–4573. [Google Scholar] [CrossRef]
- Shiva Kumar, S.; Lim, H. An overview of water electrolysis technologies for green hydrogen production. Energy Rep. 2022, 8, 13793–13813. [Google Scholar] [CrossRef]
- Coertzen, R.; Potts, K.; Brannock, M.; Dagg, B. Water for Hydrogen—GHD. Available online: https://www.ghd.com/en/perspectives/water-for-hydrogen.aspx (accessed on 10 May 2023).
- Siemens-Energy. Silyzer 300: The Next Paradigm of PEM Electrolysis. Silyzer 300-PEM Module Array. Available online: https://assets.siemens-energy.com/siemens/assets/api/uuid:a193b68f-7ab4-4536-abe2-c23e01d0b526/datasheet-silyzer300.pdf (accessed on 10 May 2023).
- SinoHy Energy. 5MW/10MW Alkaline Water Electrolysis. Available online: https://www.sinohyenergy.com/5mw-10mw-alkaline-water-electrolysis/ (accessed on 10 May 2023).
- Lampert, D.J.; Cai, H.; Elgowainy, A. Wells to wheels: Water consumption for transportation fuels in the United States. Energy Environ. Sci 2016, 9, 787. [Google Scholar] [CrossRef]
- Jia, X.; Klemeš, J.J.; Tan, R.R. Overview of Water Use in Renewable Electricity Generation. Chem. Eng. Trans. 2021, 89, 403–408. [Google Scholar] [CrossRef]
- IRENA. Solar Energy. Available online: https://www.irena.org/Energy-Transition/Technology/Solar-energy (accessed on 11 May 2023).
- Sodhi, M.; Banaszek, L.; Magee, C.; Rivero-Hudec, M. Economic Lifetimes of Solar Panels. Procedia CIRP 2022, 105, 782–787. [Google Scholar] [CrossRef]
- Artaş, S.B.; Kocaman, E.; Bilgiç, H.H.; Tutumlu, H.; Yağlı, H.; Yumrutaş, R. Why PV panels must be recycled at the end of their economic life span? A case study on recycling together with the global situation. Process Saf. Environ. Prot. 2023, 174, 63–78. [Google Scholar] [CrossRef]
- Reuters. Column: China Widens Renewable Energy Supply Lead with Wind Power Push. Available online: https://www.reuters.com/markets/commodities/china-widens-renewable-energy-supply-lead-with-wind-power-push-2023-03-01/ (accessed on 16 May 2023).
- Voigt, C.C.; Kaiser, K.; Look, S.; Scharnweber, K.; Scholz, C. Wind turbines without curtailment produce large numbers of bat fatalities throughout their lifetime: A call against ignorance and neglect. Glob. Ecol. Conserv. 2022, 37, e02149. [Google Scholar] [CrossRef]
- Ziegler, L.; Gonzalez, E.; Rubert, T.; Smolka, U.; Melero, J.J. Lifetime extension of onshore wind turbines: A review covering Germany, Spain, Denmark, and the UK. Renew. Sustain. Energy Rev. 2018, 82, 1261–1271. [Google Scholar] [CrossRef]
- Mekonnen, M.M.; Gerbens-Leenes, P.W.; Hoekstra, A.Y. The consumptive water footprint of electricity and heat: A global assessment. Environ. Sci. Water Res. Technol. 2015, 1, 285–297. [Google Scholar] [CrossRef]
- Parliament of Australia—Department of Parliamentary Services. Water Requirements of Nuclear Power Stations. Parliamentary Library 2006; p. 1. Available online: https://apo.org.au/node/1519 (accessed on 17 May 2023).
- Shiva Kumar, S.; Himabindu, V. Hydrogen production by PEM water electrolysis—A review. Mater. Sci. Energy Technol. 2019, 2, 442–454. [Google Scholar] [CrossRef]
- Buttler, A.; Spliethoff, H. Current status of water electrolysis for energy storage, grid balancing and sector coupling via power-to-gas and power-to-liquids: A review. Renew. Sustain. Energy Rev. 2018, 82, 2440–2454. [Google Scholar] [CrossRef]
- Rashid, M.M.; Al Mesfer, M.K.; Naseem, H.; Danish, M. Hydrogen Production by Water Electrolysis: A Review of Alkaline Water Electrolysis, PEM Water Electrolysis and High Temperature Water Electrolysis. Int. J. Eng. Adv. Technol. 2015, 4, 80–93. [Google Scholar]
- Chatenet, M.; Pollet, B.G.; Dekel, D.R.; Dionigi, F.; Deseure, J.; Millet, P.; Braatz, R.D.; Bazant, M.Z.; Eikerling, M.; Staffell, I.; et al. Water electrolysis: From textbook knowledge to the latest scientific strategies and industrial developments. Chem. Soc. Rev. 2022, 51, 4583–4762. [Google Scholar] [CrossRef]
- Nasser, M.; Megahed, T.F.; Ookawara, S.; Hassan, H. A review of water electrolysis–based systems for hydrogen production using hybrid/solar/wind energy systems. Environ. Sci. Pollut. Res. 2022, 29, 86994–87018. [Google Scholar] [CrossRef]
- Lamagna, M.; Groppi, D.; Nastasi, B. Reversible solid oxide cells applications to the building sector. Int. J. Hydrogen Energy 2023, 48, 27033–27058. [Google Scholar] [CrossRef]
- Min, G.; Choi, S.; Hong, J. A review of solid oxide steam-electrolysis cell systems: Thermodynamics and thermal integration. Appl. Energy 2022, 328, 120145. [Google Scholar] [CrossRef]
- Palmas, S.; Rodriguez, J.; Mais, L.; Mascia, M.; Herrando, M.C.; Vacca, A. Anion exchange membrane: A valuable perspective in emerging technologies of low temperature water electrolysis. Curr. Opin. Electrochem. 2023, 37, 101178. [Google Scholar] [CrossRef]
- Chi, J.; Yu, H. Water electrolysis based on renewable energy for hydrogen production. Chin. J. Catal. 2018, 39, 390–394. [Google Scholar] [CrossRef]
- Lange, H.; Klose, A.; Lippmann, W.; Urbas, L. Technical evaluation of the flexibility of water electrolysis systems to increase energy flexibility: A review. Int. J. Hydrogen Energy 2023, 48, 15771–15783. [Google Scholar] [CrossRef]
- International Renewable Energy Agency. Green Hydrogen Cost Reduction Scaling Up Electrolysers To Meet The 1.5 °C Climate Goal H2O2. 2020. Available online: https://www.irena.org/-/media/Files/IRENA/Agency/Publication/2020/Dec/IRENA_Green_hydrogen_cost_2020.pdf (accessed on 17 May 2023).
- Song, H.; Liu, Y.; Bian, H.; Shen, M.; Lin, X. Energy, environment, and economic analyses on a novel hydrogen production method by electrified steam methane reforming with renewable energy accommodation. Energy Convers. Manag. 2022, 258, 115513. [Google Scholar] [CrossRef]
- Wu, Z.; Guo, Z.; Yang, J.; Wang, Q. Numerical investigation of hydrogen production via methane steam reforming in a novel packed bed reactor integrated with diverging tube. Energy Convers. Manag. 2023, 289, 117185. [Google Scholar] [CrossRef]
- Li, J.; Cheng, W. Comparative life cycle energy consumption, carbon emissions and economic costs of hydrogen production from coke oven gas and coal gasification. Int. J. Hydrogen Energy 2020, 45, 27979–27993. [Google Scholar] [CrossRef]
- Roy, P.; Hossain, M.N.; Uddin, S.M.M.; Hossain, M.M. Unraveling the sustainability aspects of coal extraction and use in Bangladesh using material flow analysis and life cycle assessment. J. Clean. Prod. 2023, 387, 135895. [Google Scholar] [CrossRef]
- Xie, M.; Wei, X.; Chen, C.; Sun, C. China’s natural gas production peak and energy return on investment (EROI): From the perspective of energy security. Energy Policy 2022, 164, 112913. [Google Scholar] [CrossRef]
- Hall, C.A.S.; Lambert, J.G.; Balogh, S.B. EROI of different fuels and the implications for society. Energy Policy 2014, 64, 141–152. [Google Scholar] [CrossRef]
- Manikrao Ingle, U.; Pawar, P.R.; Prakash, G. Acid-assisted oil extraction directly from thraustochytrids fermentation broth and its energy assessment for docosahexaenoic acid-enriched oil production. Bioresour. Technol. 2023, 367, 128272. [Google Scholar] [CrossRef]
- Dincer, I.; Rosen, M.A.; Khalid, F. 3.16 Thermal Energy Production. In Comprehensive Energy Systems; Dincer, I., Ed.; Elsevier: Oxford, UK, 2018; pp. 673–706. [Google Scholar] [CrossRef]
- Raeesi, R.; Searle, C.; Balta-Ozkan, N.; Marsiliani, L.; Tian, M.; Greening, P. Hydrogen supply chain and refuelling network design: Assessment of alternative scenarios for the long-haul road freight in the UK. Int. J. Hydrogen Energy 2023, in press. [Google Scholar] [CrossRef]
- Dong, W.; Shao, C.; Li, X.; Zhu, D.; Zhou, Q.; Wang, X. Integrated planning method of green hydrogen supply chain for hydrogen fuel cell vehicles. Int. J. Hydrogen Energy 2023, 48, 18385–18397. [Google Scholar] [CrossRef]
- Seo, Y.; Park, H.; Lee, S.; Kim, J.; Han, S. Design concepts of hydrogen supply chain to bring consumers offshore green hydrogen. Int. J. Hydrogen Energy 2023, 48, 15126–15142. [Google Scholar] [CrossRef]
- Riera, J.A.; Lima, R.M.; Knio, O.M. A review of hydrogen production and supply chain modeling and optimization. Int. J. Hydrogen Energy 2023, 48, 13731–13755. [Google Scholar] [CrossRef]
- Banke, J.; Technology Readiness Levels Demystified. NASA. Available online: https://www.nasa.gov/topics/aeronautics/features/trl_demystified.html (accessed on 21 August 2023).
- Dincer, I. Green methods for hydrogen production. Int. J. Hydrogen Energy 2012, 37, 1954–1971. [Google Scholar] [CrossRef]
- Xu, X.; Zhou, Q.; Yu, D. The future of hydrogen energy: Bio-hydrogen production technology. Int. J. Hydrogen Energy 2022, 47, 33677–33698. [Google Scholar] [CrossRef]
- Salehmin, M.N.I.; Husaini, T.; Goh, J.; Sulong, A.B. High-pressure PEM water electrolyser: A review on challenges and mitigation strategies towards green and low-cost hydrogen production. Energy Convers. Manag. 2022, 268, 115985. [Google Scholar] [CrossRef]
- Sandberg, E.; Krook-Riekkola, A. The impact of technology availability on the transition to net-zero industry in Sweden. J. Clean. Prod. 2022, 363, 132594. [Google Scholar] [CrossRef]
- Khan, S.N.; Yang, Z.; Dong, W.; Zhao, M. Cost and technology readiness level assessment of emerging technologies, new perspectives, and future research directions in H2 production. Sustain. Energy Fuels 2022, 6, 4357–4374. [Google Scholar] [CrossRef]
- Gordon, J.A.; Balta-Ozkan, N.; Nabavi, S.A. Socio-technical barriers to domestic hydrogen futures: Repurposing pipelines, policies, and public perceptions. Appl. Energy 2023, 336, 120850. [Google Scholar] [CrossRef]
- Riemer, M.; Duval-Dachary, S.; Bachmann, T.M. Environmental implications of reducing the platinum group metal loading in fuel cells and electrolysers: Anion exchange membrane versus proton exchange membrane cells. Sustain. Energy Technol. Assess. 2023, 56, 103086. [Google Scholar] [CrossRef]
- Posdziech, O.; Schwarze, K.; Brabandt, J. Efficient hydrogen production for industry and electricity storage via high-temperature electrolysis. Int. J. Hydrogen Energy 2019, 44, 19089–19101. [Google Scholar] [CrossRef]
- Nnabuife, S.G.; Oko, E.; Kuang, B.; Bello, A.; Onwualu, A.P.; Oyagha, S.; Whidborne, J. The prospects of hydrogen in achieving net zero emissions by 2050: A critical review. Sustain. Chem. Clim. Action 2023, 2, 100024. [Google Scholar] [CrossRef]
- Shirvanian, P.; Loh, A.; Sluijter, S.; Li, X. Novel components in anion exchange membrane water electrolyzers (AEMWE’s): Status, challenges and future needs. A mini review. Electrochem. Commun. 2021, 132, 107140. [Google Scholar] [CrossRef]
- Miller, H.A.; Bouzek, K.; Hnat, J.; Loos, S.; Bernäcker, C.I.; Weißgärber, T.; Röntzsch, L.; Meier-Haack, J. Green hydrogen from anion exchange membrane water electrolysis: A review of recent developments in critical materials and operating conditions. Sustain. Energy Fuels 2020, 4, 2114–2133. [Google Scholar] [CrossRef]
- Hosseinzadeh, A.; Zhou, J.L.; Li, X.; Afsari, M.; Altaee, A. Techno-economic and environmental impact assessment of hydrogen production processes using bio-waste as renewable energy resource. Renew. Sustain. Energy Rev. 2022, 156, 111991. [Google Scholar] [CrossRef]
- Acar, C.; Dincer, I. Selection criteria and ranking for sustainable hydrogen production options. Int. J. Hydrogen Energy 2022, 47, 40118–40137. [Google Scholar] [CrossRef]
- Hazrat, M.A.; Rasul, M.G.; Jahirul, M.I.; Chowdhury, A.A.; Hassan, N.M.S. Techno-economic analysis of recently improved hydrogen production pathway and infrastructure. Energy Rep. 2022, 8, 836–844. [Google Scholar] [CrossRef]
- Rahim Malik, F.; Yuan, H.-B.; Moran, J.C.; Tippayawong, N. Overview of hydrogen production technologies for fuel cell utilization. Eng. Sci. Technol. Int. J. 2023, 43, 101452. [Google Scholar] [CrossRef]
- González Martínez, M.; Elsaddik, M.; Nzihou, A. Monitoring, analysis, and quantification of hydrogen from biomass and biowaste: A review. Int. J. Hydrogen Energy 2023, 48, 22113–22131. [Google Scholar] [CrossRef]
- Oh, V.B.-Y.; Ng, S.-F.; Ong, W.-J. Is photocatalytic hydrogen production sustainable?—Assessing the potential environmental enhancement of photocatalytic technology against steam methane reforming and electrocatalysis. J. Clean. Prod. 2022, 379, 134673. [Google Scholar] [CrossRef]
- Andújar, J.M.; Segura, F.; Rey, J.; Vivas, F.J. Batteries and Hydrogen Storage: Technical Analysis and Commercial Revision to Select the Best Option. Energies 2022, 15, 6196. [Google Scholar] [CrossRef]
- Chu, C.; Wu, K.; Luo, B.; Cao, Q.; Zhang, H. Hydrogen storage by liquid organic hydrogen carriers: Catalyst, renewable carrier, and technology—A review. Carbon Resour. Convers. 2023, 6, 334–351. [Google Scholar] [CrossRef]
- Yang, M.; Hunger, R.; Berrettoni, S.; Sprecher, B.; Wang, B. A review of hydrogen storage and transport technologies. Clean Energy 2023, 7, 190–216. [Google Scholar] [CrossRef]
- Xu, Z.; Zhao, N.; Hillmansen, S.; Roberts, C.; Yan, Y. Techno-Economic Analysis of Hydrogen Storage Technologies for Railway Engineering: A Review. Energies 2022, 15, 6467. [Google Scholar] [CrossRef]
- Patonia, A.; Poudineh, R. Hydrogen Storage for a Net-Zero Carbon Future; The Oxford Institute for Energy Studies: Oxford, UK, 2023. [Google Scholar]
- Monforti Ferrario, A.; Bartolini, A.; Segura Manzano, F.; Vivas, F.J.; Comodi, G.; McPhail, S.J.; Andujar, J.M. A model-based parametric and optimal sizing of a battery/hydrogen storage of a real hybrid microgrid supplying a residential load: Towards island operation. Adv. Appl. Energy 2021, 3, 100048. [Google Scholar] [CrossRef]
- Verhelst, S. Recent progress in the use of hydrogen as a fuel for internal combustion engines. Int. J. Hydrogen Energy 2014, 39, 1071–1085. [Google Scholar] [CrossRef]
- Wei, R.; Chang, H.; Huang, S.; Huang, L. A bibliometric analysis on safety of fuel cells: Research trends and perspectives. Int. J. Hydrogen Energy 2023, 48, 12861–12876. [Google Scholar] [CrossRef]
- Luo, Y.; Wu, Y.; Li, B.; Mo, T.; Li, Y.; Feng, S.-P.; Qu, J.; Chu, P.K. Development and application of fuel cells in the automobile industry. J. Energy Storage 2021, 42, 103124. [Google Scholar] [CrossRef]
- Wang, Y.; Ruiz Diaz, D.F.; Chen, K.S.; Wang, Z.; Adroher, X.C. Materials, technological status, and fundamentals of PEM fuel cells—A review. Mater. Today 2020, 32, 178–203. [Google Scholar] [CrossRef]
- Aminudin, M.A.; Kamarudin, S.K.; Lim, B.H.; Majilan, E.H.; Masdar, M.S.; Shaari, N. An overview: Current progress on hydrogen fuel cell vehicles. Int. J. Hydrogen Energy 2023, 48, 4371–4388. [Google Scholar] [CrossRef]
- Pollet, B.G.; Kocha, S.S.; Staffell, I. Current status of automotive fuel cells for sustainable transport. Curr. Opin. Electrochem. 2019, 16, 90–95. [Google Scholar] [CrossRef]
- Peng, S. Current Status and Future Prospects of Fuel Cells in China. Engineering 2023, 21, 20–23. [Google Scholar] [CrossRef]
- Ishimoto, Y.; Wulf, C.; Schonhoff, A.; Kuckshinrichs, W. Life cycle costing approaches of fuel cell and hydrogen systems: A literature review. Int. J. Hydrogen Energy 2023, in press. [Google Scholar] [CrossRef]
- Wang, J.; Wang, H.; Fan, Y. Techno-Economic Challenges of Fuel Cell Commercialization. Engineering 2018, 4, 352–360. [Google Scholar] [CrossRef]
- Dekel, D.R. Review of cell performance in anion exchange membrane fuel cells. J. Power Sources 2018, 375, 158–169. [Google Scholar] [CrossRef]
- Gottesfeld, S.; Dekel, D.R.; Page, M.; Bae, C.; Yan, Y.; Zelenay, P.; Kim, Y.S. Anion exchange membrane fuel cells: Current status and remaining challenges. J. Power Sources 2018, 375, 170–184. [Google Scholar] [CrossRef]
- Ferriday, T.B.; Middleton, P.H. Alkaline fuel cell technology—A review. Int. J. Hydrogen Energy 2021, 46, 18489–18510. [Google Scholar] [CrossRef]
- Sazali, N.; Wan Salleh, W.N.; Jamaludin, A.S.; Mhd Razali, M.N. New Perspectives on Fuel Cell Technology: A Brief Review. Membranes 2020, 10, 99. [Google Scholar] [CrossRef]
- Abderezzak, B. 1—Introduction to Hydrogen Technology. In Introduction to Transfer Phenomena in PEM Fuel Cell; Abderezzak, B., Ed.; Elsevier: Amsterdam, The Netherlands, 2018; pp. 1–51. [Google Scholar] [CrossRef]
- Mendonça, C.; Ferreira, A.; Santos, D.M.F. Towards the Commercialization of Solid Oxide Fuel Cells: Recent Advances in Materials and Integration Strategies. Fuels 2021, 2, 393–419. [Google Scholar] [CrossRef]
- Dincer, I.; Rosen, M.A. Chapter 18—Exergy analyses of fuel cell systems. In Exergy, 3rd ed.; Dincer, I., Rosen, M.A., Eds.; Elsevier: Amsterdam, The Netherlands, 2021; pp. 479–514. [Google Scholar] [CrossRef]
- ETN Global. Hydrogen Gas Turbines: The Path Towards a Zero-Carbon Gas Turbine. p. 28. 2020. Available online: https://etn.global/wp-content/uploads/2020/01/ETN-Hydrogen-Gas-Turbines-report.pdf (accessed on 24 May 2023).
- Sørensen, B.; Spazzafumo, G. 2—Hydrogen. In Hydrogen and Fuel Cells, 3rd ed.; Sørensen, B., Spazzafumo, G., Eds.; Academic Press: Cambridge, MA, USA, 2018; pp. 5–105. [Google Scholar] [CrossRef]
- Saint-Just, J.; Etemad, S. 10—Catalytic combustion of hydrogen for heat production. In Compendium of Hydrogen Energy; Barbir, F., Basile, A., Veziroğlu, T.N., Eds.; Woodhead Publishing Series in Energy; Woodhead Publishing: Oxford, UK, 2016; pp. 263–287. [Google Scholar] [CrossRef]
- Garg, N.; Sarkar, A.; Sundararaju, B. Recent developments on methanol as liquid organic hydrogen carrier in transfer hydrogenation reactions. Coord. Chem. Rev. 2021, 433, 213728. [Google Scholar] [CrossRef]
- Clifford Chance. Marco Regulatorio Actual Del Hidrógeno Verde. pp. 1–8. 2023. Available online: https://www.cliffordchance.com/content/dam/cliffordchance/briefings/2023/02/Marco-regulatorio-actual-hidrogeno-verde.pdf (accessed on 24 May 2023).
- Ministerio para la Transición Ecológica y el Reto Demográfico. Real Decreto 376/2022, de 17 de Mayo, por el que se Regulan los Criterios de Sostenibilidad y de Reducción de las Emisiones de gases de Efecto Invernadero de los Biocarburantes, Biolíquidos y Combustibles de Biomasa, así como el Sistema. p. 108. 2022. Available online: https://www.boe.es/eli/es/rd/2022/05/17/376 (accessed on 24 May 2023).
- Ministerio para la Transición Ecológica y el Reto Demográfico. Orden TED/1026/2022, de 28 de Octubre, por la que se Aprueba el Procedimiento de Gestión del Sistema de Garantías de Origen del Gas Procedente de Fuentes Renovables. Boletín Oficial del Estado 2022; pp. 148170–148212. Available online: https://www.boe.es/boe/dias/2022/10/31/pdfs/BOE-A-2022-17721.pdf (accessed on 26 May 2023).
- Comisión Nacional de los Mercados y la Competencia. Circular 1/2018, de 18 de abril, de la Comisión Nacional de los Mercados y la Competencia, por la que se regula la gestión del sistema de garantía de origen de la electricidad procedente de fuentes de energía renovables y de cogeneración de alta eficiencia. Boletín Oficial del Estado 2018; pp. 46103–46114. Available online: https://www.boe.es/boe/dias/2018/04/27/pdfs/BOE-A-2018-5717.pdf (accessed on 26 May 2023).
- Rosas, A. European Union Law and National Law: A Common Legal System. In International Actors and the Formation of Laws; Karjalainen, K., Tornberg, I., Pursiainen, A., Eds.; Springer International Publishing: Cham, Switzerland, 2022; pp. 11–28. [Google Scholar] [CrossRef]
- Azadnia, A.H.; McDaid, C.; Andwari, A.M.; Hosseini, S.E. Green hydrogen supply chain risk analysis: A european hard-to-abate sectors perspective. Renew. Sustain. Energy Rev. 2023, 182, 113371. [Google Scholar] [CrossRef]
- European Parliament. Renewable Energy Directive: Revision of Directive (EU) 2018/2001. 2021. Available online: https://euagenda.eu/upload/publications/eprs-bri2021662619-en.pdf (accessed on 26 May 2023).
- European Commission. Fit for 55: Delivering the EU’s 2030 Climate Target on the Way to Climate Neutrality. COM(2021) 550 Final. p. 15. 2021. Available online: https://eur-lex.europa.eu/legal-content/EN/TXT/HTML/?uri=CELEX%3A52021DC0550 (accessed on 26 May 2023).
- United Nations Industrial Development Organization. The European Green Deal: Europe’s New Growth Strategy: A Climate-Neutral EU by 2050; UNIDO: Vienna, Austria, 2020. [Google Scholar]
- Towards a New Hydrogen market—CertifHy Green Hydrogen Guarantees of Origin are launched—CERTIFHY. Available online: https://www.certifhy.eu/sin-categoria/towards-a-new-hydrogen-market-certifhy-green-hydrogen-guarantees-of-origin-are-launched/ (accessed on 12 April 2023).
- Lagioia, G.; Spinelli, M.P.; Amicarelli, V. Blue and green hydrogen energy to meet European Union decarbonisation objectives. An overview of perspectives and the current state of affairs. Int. J. Hydrogen Energy 2023, 48, 1304–1322. [Google Scholar] [CrossRef]
- CertifHy. Certification Process-Steps of Certification. Available online: https://www.certifhy.eu/steps-of-certification/ (accessed on 13 June 2023).
- Thomson Reuters Westlaw. Barclays Official California Code of Regulations. Available online: https://govt.westlaw.com/calregs/Browse/Home/California/CaliforniaCodeofRegulations?guid=I09D690805A2111EC8227000D3A7C4BC3 (accessed on 27 May 2023).
- California Air Resources Board. Low Carbon Fuel Standard. Available online: https://ww2.arb.ca.gov/our-work/programs/low-carbon-fuel-standard/about (accessed on 14 June 2023).
- Bracmort, K. A Low Carbon Fuel Standard: In Brief; Summary; Congressional Research Service: Washington, DC, USA, 2021. [Google Scholar]
- Authenticated, U.S.; Government Information. Public Law 117-58-Nov.15. 2021. Available online: https://www.energy.gov/sites/default/files/2022-09/IIJA-%20Pub%20Law%20117-58%20Nov%2015%202021.pdf (accessed on 27 May 2023).
- Australian Energy Council. Hydrogen Guarantee of Origin-Discussion Paper. 2021. Available online: https://consult.dcceew.gov.au/hydrogen-guarantee-of-origin-scheme (accessed on 1 June 2023).
- Hydrogen Strategy Update to the Market: December 2022. 2022. Available online: https://assets.publishing.service.gov.uk/government/uploads/system/uploads/attachment_data/file/1175495/hydrogen-strategy-update-to-the-market-december-2022.pdf (accessed on 1 June 2023).
- Clifford Chance. Focus on Hydrogen: Japan’s Energy Strategy for Hydrogen and Ammonia. pp. 1–10. 2022. Available online: https://www.cliffordchance.com/briefings/2022/08/focus-on-hydrogen-japans-energy-strategy-for-hydrogen-and-ammonia.html (accessed on 1 June 2023).
- Niunoya, M.; Shima, M.; Masaki, K. Hydrogen Law, Regulations & Strategy in Japan. CMS. 2021. Available online: https://cms.law/en/int/expert-guides/cms-expert-guide-to-hydrogen/japan (accessed on 14 June 2023).
- Akimoto, D.; Japan Looks to Promote a Hydrogen Society. Diplomat. 2023. Available online: https://thediplomat.com/2023/01/japan-looks-to-promote-a-hydrogen-society/ (accessed on 14 June 2023).
- FuelCellsWorks. Japan’s Govt Eyes New Legislation To Promote Wider Use of Hydrogen, Ammonia Fuels. 2022. Available online: https://fuelcellsworks.com/news/japans-govt-eyes-new-legislation-to-promote-wider-use-of-hydrogen-ammonia-fuels/ (accessed on 14 June 2023).
- Canada’s Ministry of Natural Resources. Hydrogen Strategy for Canada: Seizing the Opportunities for Hydrogen. 2020. Available online: https://natural-resources.canada.ca/sites/nrcan/files/environment/hydrogen/NRCan_Hydrogen-Strategy-Canada-na-en-v3.pdf (accessed on 15 June 2023).
- Chinese Government. Outline of the Five-Year Plan for National Economic and Social Development of the People’s Republic of China and the Long-Range Goals for 2035. 2021. Available online: https://www.gov.cn/xinwen/2021-03/13/content_5592681.htm (accessed on 15 June 2023).
- Chinese Parliament—National People’s Congress. Modern Energy System Plan for the 14th Five-Year Plan. 2022. Available online: https://www.ndrc.gov.cn/xxgk/zcfb/ghwb/202203/P020220322582066837126.pdf (accessed on 15 June 2023).
- Chinese Parliament—National People’s Congress. Renewable Energy Development Plan for the 14th Five-Year Plan. 2022. Available online: https://www.ndrc.gov.cn/xxgk/zcfb/ghwb/202206/P020220602315308557623.pdf (accessed on 15 June 2023).
- Yanasse, D.; Rage, P.; Souza, C. Green Hydrogen. Brazil Energy J. 2023, 1, 1–11. [Google Scholar]
- Ministry of New and Renewable Energy—Government of India. National Green Hydrogen Mission. 2023. Available online: https://mnre.gov.in/img/documents/uploads/file_f-1673581748609.pdf (accessed on 17 June 2023).
- Green Hydrogen Organisation. Green Hydrogen Standard: The Global Standard for Green Hydrogen and Green Hydrogen Derivatives Including Green Ammonia. 2023. Available online: https://gh2.org/sites/default/files/2023-01/GH2_Standard_A5_JAN%202023_1.pdf (accessed on 17 June 2023).
- Salma, T.; Tsafos, N.; South Africa’s Hydrogen Strategy. CSIS. 2022. Available online: https://www.csis.org/analysis/south-africas-hydrogen-strategy (accessed on 16 June 2023).
- Tang, D.; Tan, G.-L.; Li, G.-W.; Liang, J.-G.; Ahmad, S.M.; Bahadur, A.; Humayun, M.; Ullah, H.; Khan, A.; Bououdina, M. State-of-the-art hydrogen generation techniques and storage methods: A critical review. J. Energy Storage 2023, 64, 107196. [Google Scholar] [CrossRef]
- Abdin, Z.; Zafaranloo, A.; Rafiee, A.; Mérida, W.; Lipiński, W.; Khalilpour, K.R. Hydrogen as an energy vector. Renew. Sustain. Energy Rev. 2020, 120, 109620. [Google Scholar] [CrossRef]
- Bartolucci, L.; Cennamo, E.; Cordiner, S.; Mulone, V.; Pasqualini, F.; Boot, M.A. Digital twin of a hydrogen Fuel Cell Hybrid Electric Vehicle: Effect of the control strategy on energy efficiency. Int. J. Hydrogen Energy 2023, 48, 20971–20985. [Google Scholar] [CrossRef]
- Sabihuddin, S.; Kiprakis, A.E.; Mueller, M. A Numerical and Graphical Review of Energy Storage Technologies. Energies 2015, 8, 172–216. [Google Scholar] [CrossRef]
- Mitali, J.; Dhinakaran, S.; Mohamad, A.A. Energy storage systems: A review. Energy Storage Sav. 2022, 1, 166–216. [Google Scholar] [CrossRef]
- Intergovernmental Panel on Climate Change. IPCC Special Report on Carbon dioxide Capture and Storage; Cambridge University Press: Cambridge, UK, 2005. [Google Scholar]
- International Atomic Energy Agency. Nuclear Energy for a Net Zero World. 2021. Available online: https://www.iaea.org/sites/default/files/21/10/nuclear-energy-for-a-net-zero-world.pdf (accessed on 19 June 2023).
- European Clean Hydrogen Alliance. Roadmap on Hydrogen Standardisation. pp. 1–121. 2023. Available online: https://www.cencenelec.eu/media/CEN-CENELEC/News/Press%20Releases/2023/20230301_ech2a_roadmaphydrogenstandardisation.pdf (accessed on 19 June 2023).


| [17] | [18] | [20] | [21,22] | [7,23,24,25,26,27] | [28] | [29,30,31,32] | [33] | [34,35,36] | [38] | [39] | [40] | Authors’ Proposal | ||
|---|---|---|---|---|---|---|---|---|---|---|---|---|---|---|
| Water footprint | Green hydrogen | · | · | · | ||||||||||
| Other types | · | · | ||||||||||||
| Energy footprint | Green hydrogen (1) | · | · | · | · | · | ||||||||
| Other types | · | · | · | · | ||||||||||
| Comparison with fossil fuels | · | |||||||||||||
| TRL Hydrogen supply chain | Production | · | · | · | · | |||||||||
| Storage | · | · | · | · | ||||||||||
| Distribution | · | · | ||||||||||||
| Final use | · | · | ||||||||||||
| Regulatory framework | GO | · | · | · (2) | · | |||||||||
| Normative | · | · | ||||||||||||
| Coloured Label for H2 | Chemical Process + Energy Input | Highlights | |
|---|---|---|---|
 | Green | Renewable powered water electrolysis | Sustainable (no carbon emissions associated) |
 | Pink | Nuclear powered water electrolysis | Very low carbon emissions associated |
 | Turquoise | Methane pyrolysis | Generates solid carbon residues (neutral in carbon dioxide emissions) |
 | Grey | Steam and methane/gas natural reforming | Generates greenhouse gases emissions |
 | Blue | Hydrogen obtained from fossil fuels with carbon capture | Carbon dioxide emissions are significantly reduced |
 | Black/brown | Hydrogen obtained from gasification of coal | Large carbon emissions associated |
| Steam Methane Reforming (SMR) | Coal Gasification (CG) | Biomass Gasification (BG) | Biomass Reformation (BR) | Plasma Gasification (PG) | Green Hydrogen (GH) | ||
|---|---|---|---|---|---|---|---|
| Water footprint (L H2O)/kg H2 | 21.87 [18] | 2.91 [18] | 305.5 [18] | 30.96 [18] | 11.56 [16] | 13.4 (wind) [51] 43 (solar) [17] 17 (wind) [17] 129 (grid mix, no GH) [17] | |
| UHU La Rábida Campus | 9.1–23.46 (solar) 9.1–331.95 (wind) 9.1–37.6 (solar + wind) | ||||||
| Hydrogen | Coal | Conventional Oil | Natural Gas | Nuclear Energy | |
|---|---|---|---|---|---|
| Water footprint (L H2O/kWh) | 0.656 (SMR) 0.087 (CG) 9.158 (BG) 0.928 (BR) 0.347 (PG) 0.272–1.289 (GH) (1) | 0.284–7.56 [59] | 0.77–4.284 [59] | 0.274–4.464 [59] | 0.065–4.464 [59] 1.514–2.725 [60] |
| Electrolysis Technology | Energy Consumptions (kWh/Nm3 H2) |
|---|---|
| AWE | Stack energy consumption: 4.3–4.8 [23] 3.8–4.4 [47] (Nel A3880) 5.0–5.4 [47] (Cummins HySTAT®-100-10) 4.0–4.3 [47] (John Cockerill DQ-500) 4.5 [47] (McPhy MeLyzer 800-30) 4.7 [47] (Sunfire HyLink Alkaline) 4.6 [47] (Nuberg PERIC ZDQ-600) 4.4 [47] (TIANJIN Mainland FDQ800) 4.3 [47] (Green Hydrogen Systems HyProvide A-90) 4.2–5.9 [67] 4.46 [68] (Current state of the art) 4.29 [68] (Estimation for 2030) <3.75 [68] (Estimation for 2050) 4.5–5.5 [69] 4.2–4.8 [70] 4.2–5.89 (IRENA, 2020) [71] <3.75 (IRENA, 2050 target) [71] System energy consumption: 4.5–7.0 [21,70] 4.46–6.96 (IRENA, 2020) [71] 4.02 (IRENA, 2050 target) [71] |
| PEM-WE | Stack energy consumption: 4.6–5.3 [23] 4.5 [47] (Nel M5000) 4.3 [47] (HyLyzer®-4000-30) 5.2 [47] (Plug Power GenFuel 5 MW) 4.9 [47] (Elogen ELYTE 260) 4.2–5.5 [67] 4.91 [68] (Current state of the art) 4.29 [68] (Estimation for 2030) <3.75 [68] (Estimation for 2050) 3.84 (2020 US DOE target) [69] 4.4–5.0 [70] 4.2–5.89 (IRENA, 2020) [71] <3.75 (IRENA, 2050 target) [71] 4.88 [18] System energy consumption: 3.93 (2020 US DOE target) [69] 4.5–7.5 [65,70] 4.5–7.0 [21] 4.46–7.41 (IRENA, 2020) [71] 4.02 (IRENA, 2050 target) [71] |
| SO-WE | Stack energy consumption: 3.23 [18] 3.6 [47] (SunFire HyLink SOEC) 3.0–3.3 [67] 2.94–3.5 * [21,65,66] 3.13–4.46 (IRENA, 2020) [71] <3.13 (IRENA, 2050 target) [71] System energy consumption: 3.57–4.46 (IRENA, 2020) [71] <3.57 (IRENA, 2050 target) [71] |
| AEM-WE | Stack energy consumption: 4.8 [47] (Enapter AEM Multicore) 4.91 [68] (Current state of the art) 4.29 [68] (Estimation for 2030) <3.75 [68] (Estimation for 2050) 4.8 [65] 4.8–6.9 [70] 4.6–5.89 (IRENA, 2020) [71] <3.75 (IRENA, 2050 target) [71] System energy consumption: 5.09–6.16 (IRENA, 2020) [71] <4.02 (IRENA, 2050 target) [71] |
| AWE | PEM-WE | SO-WE | AEM-WE | SMR | CG | |
|---|---|---|---|---|---|---|
| Energy consumption (kWh/Nm3 H2) | 3.8–5.4 (stack) 4.46–7.0 (system) | 3.84–5.89 (stack) 3.93–7.5 (system) | 2.94–4.46 (stack) 3.57–4.46 (system) | 4.6–5.89 (stack) 5.09–6.16 (system) | 0.10 [18] (electricity) 2.04 [72,73] * | 0.15 [18] (electricity) 0.55 [74] * |
| Hydrogen | Coal | Oil | |
|---|---|---|---|
| Energy consumption (1) (kWhprod./kWhfuel) | 1–2 (electrolysis, stack) 1.2–2.5 (electrolysis, system) 0.7 (SMR) 0.18 (CG) | 0.0047 [75] 0.017 (China, 2018) [76] 0.013 (US, 2000) [77] 0.017 (US, 2007) [77] | 19.83 (DEM) (2) [78] 4.96 (AAEM) (3) [78] 0.025–0.048 (Norway, 2008) [77] 0.022 (Mexico, 2009) [77] 0.1 (China, 2010) [77] 0.067 (China, 2018) (4) [76] |
| Level | Degree of Maturity |
|---|---|
| TRL 1 | Basic principles observed and reported |
| TRL 2 | Technology concept or application formulated |
| TRL 3 | Concept or application proven through analysis and experimentation |
| TRL 4 | Basic prototype validated in laboratory environment |
| TRL 5 | Basic prototype validated in relevant environment |
| TRL 6 | System or subsystem model or prototype demonstrated in a relevant environment |
| TRL 7 | System prototype demonstrated in an operational environment |
| TRL 8 | Actual system completed and qualified through test and demonstration |
| TRL 9 | Actual system proven through successful operation |
| Source of Hydrogen Production | Technology | TRL |
|---|---|---|
| Water electrolysis | AWE | 8–9 [23,27,88] 9 [7,24,28,89,90] |
| PEM-WE | 7–8 [7,23] 6–8 [24,89] 8–9 [27,90,91] 6–9 [28] 6–7 [88] | |
| SO-WE | 3–5 [7] 5 [24,89] 7 [27] 5–6 [90] 4–5 [92] 6–7 [93] 2–5 [88] | |
| AEM-WE | 3 [91] 2–3 [94,95] | |
| Fossil fuels | Steam and methane reforming (SMR) | 9 [24,88,89,96,97,98] 7–8 (with carbon capture and storage, CCS) [98] 5 (with CCS) [99] 9 (with CCS) [88] |
| Coal gasification (CG) | 9 [96,97,98] 8–9 [88] 6–7 (with CCS) [98] 8–9 (with CCS) [88] | |
| Autothermal reforming (ATR) | 9 [26] 5 (with CCS) [99] | |
| Methane pyrolysis (MP) | 3–6 [93] 3–5 [98] | |
| Bio-hydrogen (biological and chemical methods to obtain hydrogen from biomass) | Dark-fermentation (DF) | 5 [96] 2–4 [100] |
| Photo-fermentation (PF) | 4 [96] 2–4 [100] | |
| Biogas reforming (BR) | 6–7 [100] | |
| Biowaste pyrogasification (BPG) | 8–9 [100] | |
| Photocatalysis (PC) | <4 [101] |
| Technology | TRL | ||
|---|---|---|---|
| Physical storage methods | Compressed hydrogen (CH2) | 9 [29,30,104] 7–9 [32] 8–9 [105,106] | |
| Liquid hydrogen (LH2) | 7 [32] 4–6 [104] 6–7 [105] 6–9 [106] | ||
| Cryocompressed hydrogen (CcH2) | 7 [32] 4–6 [104] 4–5 [105] | ||
| Material-based (chemical) storage methods | Metal hydrides (MH) | 4–6 [104] 4–5 [105] 7–9 [106] | |
| Complex hydrides (CH) | 4–6 [106] | ||
| Physisorption (PH) | Carbon fibres (CF) and nanotubes (CN), and activated carbon (AC) | 7–8 [106] | |
| Graphene | 5–6 [106] | ||
| Aerogel (AEG) and templated carbon (TC) | 2–4 [106] | ||
| Metal-organic frameworks (MOFs) | 2–4 [106] | ||
| LOHC | 4–6 [104] 6–7 [105] 4–7 [106] | ||
| Technology | TRL | |
|---|---|---|
| Fuel cells (FC) | Polymer Exchange Membrane Fuel Cell (PEM-FC) | 8 [35,109,110] 8–9 [111,112,113,114,115] 9 [116] |
| Anion Exchange Membrane Fuel Cell (AEM-FC) | 4 [109,117,118,119] | |
| Alkaline Fuel Cell (AFC) | 8–9 [109,115,119] | |
| Direct Methanol Fuel Cell (DMFC *) | 5–6 [109,120] | |
| Phosphoric Acid Fuel Cell (PAFC) | 8–9 [109,121] | |
| Solid Oxide Fuel Cell (SOFC) | 8–9 [109,114,122] | |
| Molten Carbonate Fuel Cell (MCFC) | 4–7 [109,123] | |
| Hydrogen Internal Combustion Engines (H2ICE) | ≤7 [124,125] ≤8 [126] | |
| Refineries | Hydrotreating (HT) | 7–9 [34] |
| Crude oil refining (COR) | 9 [34] | |
| Iron and steel | Hydrogen direct reduced ironmaking (H2DRI) | 8 [34] |
| Country | Legislation |
|---|---|
| Spain | Green hydrogen: The one that comes from renewable energies. Its producer needs to be registered in the registry of facilities for the production of gas from renewable energy sources (article 19.1, RD, 376/2022). To issue the GOs of green hydrogen, it must derive from a direct production from renewable energies produced on site or from the conversion with any other renewable energy (Order TED/1026/1022). |
| EU | Green hydrogen: Can only be considered renewable if the energy which is used so that the electrolysis process can take place is produced on site or if the manufacturer can provide enough evidence to demonstrate that the hydrogen fuel has been produced with RES (EU RE-Directive II), i.e., it establishes rules for hydrogen GOs certificates. |
| US | Clean hydrogen: Hydrogen produced with a carbon intensity equal to or less than 2 kg of carbon dioxide per kilogram of hydrogen produced (Public Law 117-58-Nov.15, 2021). |
| Australia | The AEC is recommending implementing a formal GO scheme (which should focus only on the emissions created in the production of hydrogen) and supports the appointment of CER as responsible for administering and overseeing the GO scheme. |
| UK | Department for Business, Energy, and Industrial Strategy has committed to setting up a hydrogen certification scheme by 2025. |
| Japan | The Japanese government is aware of the importance of implementing a new regulation concerning hydrogen to exclude businesses which handle non-environmentally friendly hydrogen. |
| Canada | Canada’s Ministry of Natural Resources is aware of the importance of a regulatory framework including hydrogen consistent with the different regions across the country (currently, there are only low-carbon fuel regulations). |
| China | No regulation of green hydrogen has been implemented yet (only it is encouraged in its 5-year plans to implement renewable hydrogen production and to use hydrogen as a way to store renewable energy) and no claim of regulating it has been found. |
| Brazil | Bill of Law 725/2022: Sustainable hydrogen is produced from solar, wind, biomass, biogas, or hydraulic resources; allows the ANP to regulate the activities in the hydrogen chain and sets a hydrogen blending of 5% in natural gas pipelines by 2032 (at least 60% of which is sustainable hydrogen) and of 10% by 2050 (80% of which is sustainable hydrogen). Bill of Law No 1,878/2022: ANP is responsible for regulating green hydrogen chain activity and issuing the licenses for green hydrogen production. |
| India | 2022–2023: Regulation and standards so that pilot projects can be approved. 2023–2024: Relevant international standards adopted for certification of green hydrogen production. |
| South Africa | Collaboration with BMZ with the purpose of establishing a regulatory framework to promote green hydrogen production in South Africa. |
Disclaimer/Publisher’s Note: The statements, opinions and data contained in all publications are solely those of the individual author(s) and contributor(s) and not of MDPI and/or the editor(s). MDPI and/or the editor(s) disclaim responsibility for any injury to people or property resulting from any ideas, methods, instructions or products referred to in the content. |
© 2023 by the authors. Licensee MDPI, Basel, Switzerland. This article is an open access article distributed under the terms and conditions of the Creative Commons Attribution (CC BY) license (https://creativecommons.org/licenses/by/4.0/).
Share and Cite
Rey, J.; Segura, F.; Andújar, J.M. Green Hydrogen: Resources Consumption, Technological Maturity, and Regulatory Framework. Energies 2023, 16, 6222. https://doi.org/10.3390/en16176222
Rey J, Segura F, Andújar JM. Green Hydrogen: Resources Consumption, Technological Maturity, and Regulatory Framework. Energies. 2023; 16(17):6222. https://doi.org/10.3390/en16176222
Chicago/Turabian StyleRey, Jesús, Francisca Segura, and José Manuel Andújar. 2023. "Green Hydrogen: Resources Consumption, Technological Maturity, and Regulatory Framework" Energies 16, no. 17: 6222. https://doi.org/10.3390/en16176222
APA StyleRey, J., Segura, F., & Andújar, J. M. (2023). Green Hydrogen: Resources Consumption, Technological Maturity, and Regulatory Framework. Energies, 16(17), 6222. https://doi.org/10.3390/en16176222