Article

Large-Signal Impedance Modeling and Stability Analysis of a Grid-Connected Inverter Considering the Influence of a Limiter in Different Control Links

1
State Key Laboratory of Smart Grid Protection and Control, Nari Group Corporation, Nanjing 211106, China
2
College of Electrical and Information Engineering, Hunan University, Changsha 410082, China
*
Author to whom correspondence should be addressed.
Energies 2023, 16(17), 6227; https://doi.org/10.3390/en16176227
Submission received: 23 July 2023 / Revised: 12 August 2023 / Accepted: 20 August 2023 / Published: 27 August 2023
(This article belongs to the Section F3: Power Electronics)

Abstract

:
The limiter in grid-connected inverter control may cause sustained oscillation in the system. The large-signal impedance model is provided since the traditional small-signal impedance model cannot accurately describe the characteristics of the limiter. In this paper, there are three established large-signal impedance models of grid-connected inverters that take into account the limiter in the phase-locked loop (PLL), the limiter in the current control loop and the limiter in the pulse width modulation (PWM). Based on the established models, the influences of these different limiters on the output impedance characteristics of the grid-connected inverter are discussed. Furthermore, the stability of the system considering the influence of different limiters is analyzed and the oscillation frequency and amplitude of the system are predicted. The simulation verifies the accuracy of the large-signal impedance model and the predicted oscillation frequency and amplitude.

1. Introduction

With the scarcity of fossil fuels and the worsening of environmental degradation, renewable energy power production technology has advanced significantly [1]. However, as the types and installed capacity of renewable energy generation expand, it is more challenging to deal with a series of oscillation issues produced by the connection of a large number of grid-connected inverters to a weak grid [2,3]. Actual engineering data show that the wind power grid-connected system may have non-growing and persistent constant amplitude oscillations if it reaches saturation or control limits [4]. When operational circumstances vary, oscillations continue to exist in the system, appearing and disappearing. In some cases, this damages the equipment or eventually triggers certain protective measures that trip the system. In order to design protection control and avoid equipment damage and accurately estimate the amplitude and frequency of oscillation, the influence of nonlinear limiters in the control circuit of the grid-connected inverter must be considered when analyzing the system stability [5,6].
The impedance model-based stability analysis considers the grid and the grid-connected inverter as two independent systems, and the structure or parameter changes in one part will not affect the impedance model in the other part, reducing the difficulty of system analysis. As a result, it is the preferred method for studying the interaction between the grid-connected inverter and the grid [7]. At the moment, the majority of impedance model research is concentrated on small-signal impedance models based on harmonic linearization. The small-signal impedance model mainly includes the DQ impedance model [8,9,10], sequence impedance model [11,12,13] and phasor domain impedance model [14,15]. However, the stability analysis based on the small-signal impedance model can only evaluate the system dynamics under the small disturbance close to the static operating point. It is unable to analyze the dynamic characteristics of the oscillation throughout the entire process or to predict the amplitude of the oscillation [16]. Moreso, it ignores the nonlinear limiter in practical systems and fails to analyze the constant amplitude oscillations induced by the limiter. Transient stability analysis techniques are frequently utilized in large-signal disturbance and limiter analysis [17,18,19].
In order to compensate for the defects of the small-signal impedance model and to analyze the impedance characteristics of the grid-connected system with the participation of the limiter, the large-signal impedance is defined in reference [20] as the impedance response of the converter with different magnitudes of injected disturbance. Based on the small-signal impedance and the PWM limiter’s description function, the large-signal impedance model is created. This model contributes to the improvement of impedance amplitude and phase characteristics in the process of nonlinear oscillation. Moreover, a prediction approach of oscillation amplitude of a grid-connected system based on large-signal impedance is proposed. Ref. [21] measures the large-signal impedance of a 1 MW VSC inverter and a 4 MW medium voltage doubly fed induction generator. The experiments show that the theoretical value of the large-signal impedance model is consistent with the measured value, and it is confirmed that the injected disturbance amplitude has an impact on the impedance response. Additionally, it is discovered that the trip protection triggers as the injection disturbance rises, resulting in a narrowing of the impedance scan’s frequency range. Ref. [16] suggests a novel approach to forecast the oscillation frequency and amplitude of grid-connected converters based on a large-signal impedance model. Ref. [22] establishes the large-signal impedance model of the grid-connected inverter, and the effects of PLL bandwidth and current loop control bandwidth are investigated. The accuracy of the large-signal impedance model decreases as PLL bandwidth increases, making it impossible to disregard the nonlinearity generated by PLL. Ref. [23] analyzes the impact of sampling delay on large-signal impedance, demonstrating how the sampling delay contributes to the expansion of the phase’s negative resistance region. Ref. [24] contrasts the large-signal impedance analysis approach with other large-signal analysis methods, demonstrating how the large-signal impedance method simplifies the study and assesses the converter impedance’s sensitivity to disturbance amplitude. Ref. [25] establishes two occurrence criteria of equal-amplitude oscillation based on a large-signal impedance model, using the criteria to assess the amplitude of the oscillation as well as the effects of grid strength and load level.
In summary, the advantages of the large-signal impedance model over the small-signal impedance model are shown in Table 1. At present, the limiter in PWM is taken into account by the majority of large-signal impedance models of grid-connected inverters. However, the actual system may include a limiter in different control loops, which might cause sustained oscillation in various frequency bands. In this paper, based on the existing large-signal impedance model considering the PWM limiter, the large-signal impedance models considering the limiter in the current control loop and the limiter in the PLL of the grid-connected inverter are developed for the first time. Three large-signal impedance models’ impedance properties are compared and analyzed, along with the similarities and distinctions between large-signal and small-signal impedance, as well as the effects of various limiters on the grid-connected inverters’ output impedance properties. When the limiter in the current control loop is taken into account, Bode and Nyquist plots are utilized to forecast the oscillation frequency and amplitude.
This paper is organized as follows: Section 2 introduces the topology of the grid-connected inverter system, Section 3 establishes three large-signal impedance models, and Section 4 verifies the accuracy of these models. The oscillation frequency and amplitude are predicted in Section 5, and Section 6 concludes the paper.

2. Structure and Control of Grid-Connected Inverter System

Figure 1 shows the structure and control diagram of the grid-connected inverter system, which mainly includes the grid impedance, filter circuit, grid-connected inverter, and grid-connected inverter control circuit. Vdc is the DC side voltage of the inverter, S1~S6 are the control switch tubes of the inverter, Lf, Cf and Rf are the filter inductor, filter capacitor and damping resistance, respectively, Lg is the equivalent inductance of the grid, va, vb and vc are the three-phase voltage of the inverter union point and ia, ib and ic are the three-phase current of the inverter union point. Zg and Zp are the grid impedance and the grid-connected inverter positive sequence impedance, respectively.
The control circuit of the grid-connected inverter mainly includes three parts: phase-locked loop control, current control and PWM modulation. HPLL(s) is the PLL’s PI controller, and its value is (Kp_PLL + Ki_PLL/s), Kp_PLL and Ki_PLL are the proportional and integral coefficients of the PLL’s PI controller, respectively. Kd is the current loop decoupling coefficient; Kf is the voltage feedforward coefficient; Hi(s) is the PI controller of the current loop, and its value is (Kp_I + Ki_I/s). Kp_I and Ki_I are the proportional and integral coefficients of the current loop’s PI controller, respectively. limiter1, limiter2 and limiter3 in the yellow box are the limiters in the PLL, the limiter in the current control loop and the limiter in the PWM, respectively. In this paper, when the large-signal impedance model considering the limiter in different control steps is established and the system stability is analyzed, only one of the corresponding limiters is selected. imax and imin are the upper and lower limits of the current loop limiter, PLLmax and PLLmin are the upper and lower limits of the PLL limiter, and PWMmax and PWMmin are the upper and lower limits of the PWM limiter.

3. Large-Signal Impedance Modeling of Grid-Connected Inverter Considering the Influence of Limiter in Different Control Links

To study sustained oscillation, Shahil Shah proposed the large-signal impedance model (LSIM) in 2017. The large-signal impedance is a representation of the converter impedance for various injections of disturbance along the nominal operating trajectory. The large-signal impedance response has changed as a result of the addition of limiters to the converter’s many control loops.

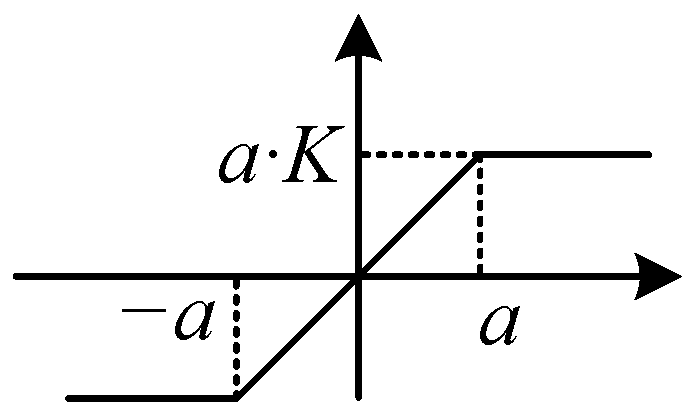
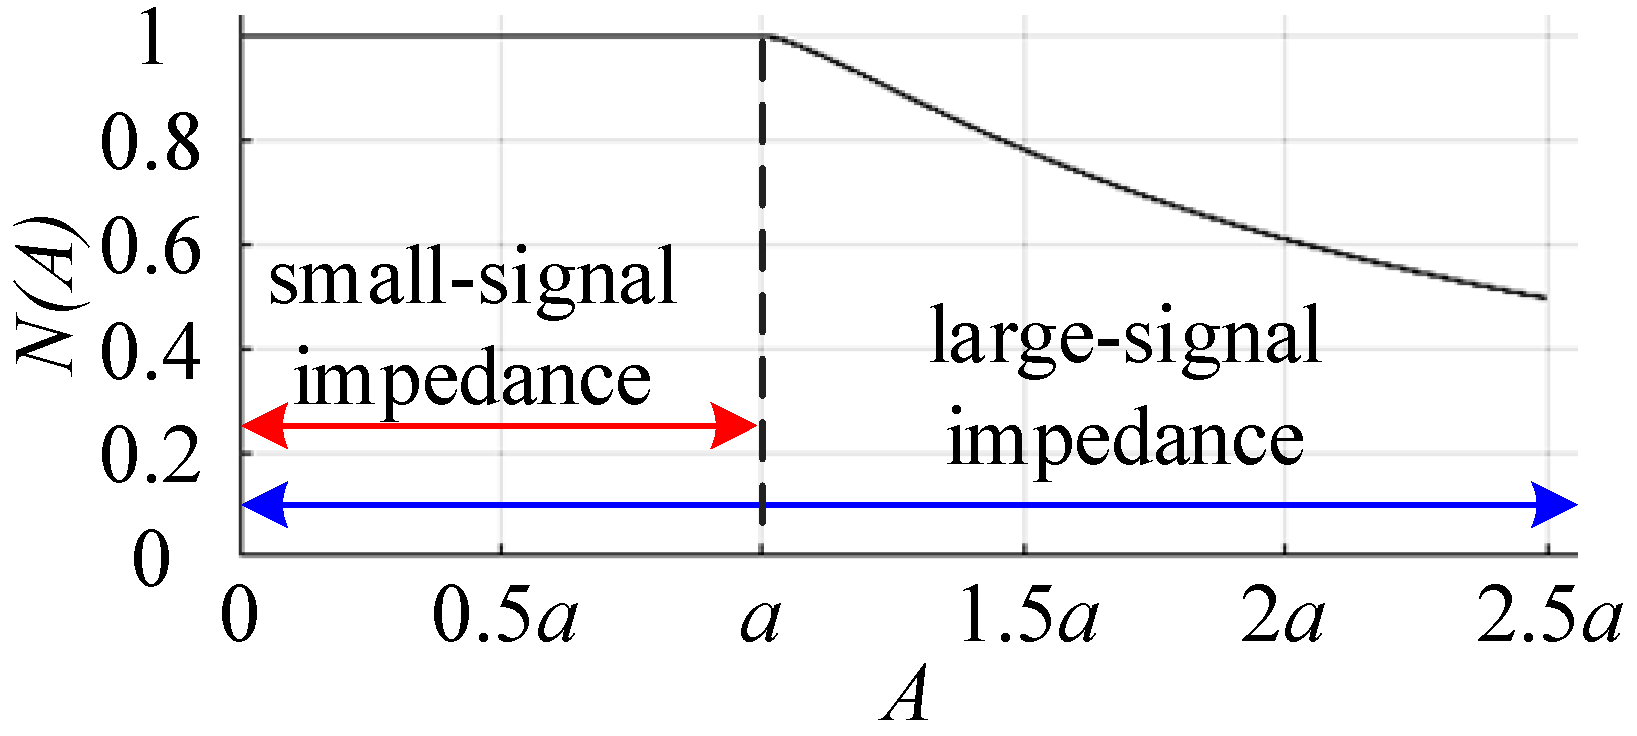
3.1. Limiter Description Function

The approximate equivalent frequency characteristic of the nonlinear link in the control system under the action of a sinusoidal signal is called the describing function of the nonlinear link. When the input of the nonlinear link is a single sinusoidal signal, the describing function can be expressed as the complex ratio of the first harmonic component of the steady-state output of the nonlinear link to the input sinusoidal signal:
N ( A ) = Y 1 A e j φ 1
where, A is the amplitude of the input sinusoidal signal, Y1 is the amplitude of the output primary harmonic component, and φ1 is the phase of the output primary harmonic component.
The limiter shown in Figure 2 is a typical nonlinear link. When the input is a single sinusoidal signal, its description function can be expressed as follows:
N ( A ) = 2 K π [ arcsin a A + a A 1 ( a A ) 2 ] , A a
When the input of the limiter is a double sinusoidal signal, its describing function can be expressed as follows:
N A 1 ( A 1 , A 2 ) = 2 π A 1 { sin u u 2 J 0 ( A 2 u ) J 1 ( A 1 u ) } d u
N A 2 ( A 1 , A 2 ) = 2 π A 2 { sin u u 2 J 0 ( A 1 u ) J 1 ( A 2 u ) } d u
where J0 and J1 are Bessel functions of the first kind. To simplify the operation, the Equation (4) can be simplified as follows [26]:
N A 2 ( A 1 , A 2 ) 1 1 π ( ϕ s + A 1 A 2 sin ϕ s ϕ s π 2 n ( g 0 + g n + 2 i = 1 n 1 g i ) )
ϕ s = cos 1 s a t ( 1 A 1 2 A 2 2 2 A 1 A 2 )
g i = ( 1 + A 1 A 2 cos ϕ i ) { sin 1 [ s a t ( 1 D i ) ] + [ s a t ( 1 D i ) 2 D i ] 1 s a t [ ( 1 D i ) 2 ] }
D i = A 1 2 + A 2 2 + 2 A 1 A 2 cos ϕ i
ϕ i = ϕ s n
As for the characteristics of the limiter’s description function, when K = 1, the value of N(A) is shown in Figure 3, and the characteristics of NA1(A1,A2) and NA2(A1,A2) are similar to Figure 3. According to it, when Aa, the gain of the limiter is 1, the limiter can be regarded as a linear link, but when A > a, the describing function of the limiter is nonlinear. Also, when the system does not trigger the limiter, the description function of the limiter is 1, and the large-signal impedance response is the same as the small-signal impedance response. When the system triggers the limiter to generate constant amplitude oscillation, the description function of the limiter becomes a nonlinear function. In this case, the impedance response of the system can only be described by the large-signal impedance model.

3.2. Small-Signal Impedance Model of Grid-Connected Inverter

When a positive sequence small disturbance voltage is injected into the connection point of the grid-connected system of the inverter shown in Figure 1, and the amplitude of the disturbance voltage does not exceed 5% of the amplitude of the grid phase voltage, the expression of the voltage and current of phase A in the time domain is as follows:
v a ( t ) = V 1 cos ( 2 π f 1 t ) + V p cos ( 2 π f p t + φ vp )
i a ( t ) = I 1 cos ( 2 π f 1 t + φ i 1 ) + I p cos ( 2 π f p t + φ ip )
where V1 and I1 are the amplitudes of the fundamental voltage and current of the grid, f1 and fp are the fundamental frequency and positive sequence disturbance frequency, φvp, φi1 and φip are the initial phase angles of the positive sequence disturbance voltage, fundamental current and positive sequence disturbance current, respectively.
The voltage and current of phase A are converted to the frequency domain as follows:
V a [ f ] = V 1 , f = ± f 1 V P , f = ± f p , I a [ f ] = I 1 , f = ± f 1 I P , f = ± f p
where, V1 = V1/2, Vp = (Vp/2)e±vp, I1 = (I1/2)e±i1, Ip = (Ip/2)e±ip.
The positive sequence small-signal impedance of the grid-connected inverter is defined as the ratio of the positive sequence small disturbance voltage to the positive sequence small disturbance current:
Z p 0 ( s ) = V p I p
Applying Kirchhoff’s voltage law in Figure 1, the following can be obtained:
s L f i a i b i c = m a m b m c K m V dc v a v b v c
By deriving the value of ma and substituting it into Equation (14). The positive sequence small-signal impedance model of the grid-connected inverter can be obtained as follows [20]:
Z p 0 ( s ) = s L f + K m V dc [ H i ( s j ω 1 ) j K d ] e s T d 1 K m V dc [ K f + 1 2 T PLL ( s j ω 1 ) H i ( s j ω 1 ) I 1 V 1 ] e s T d
where TPLL(s) = [V1HPLL(s)/s]∙[1 + V1HPLL(s)/s]−1.

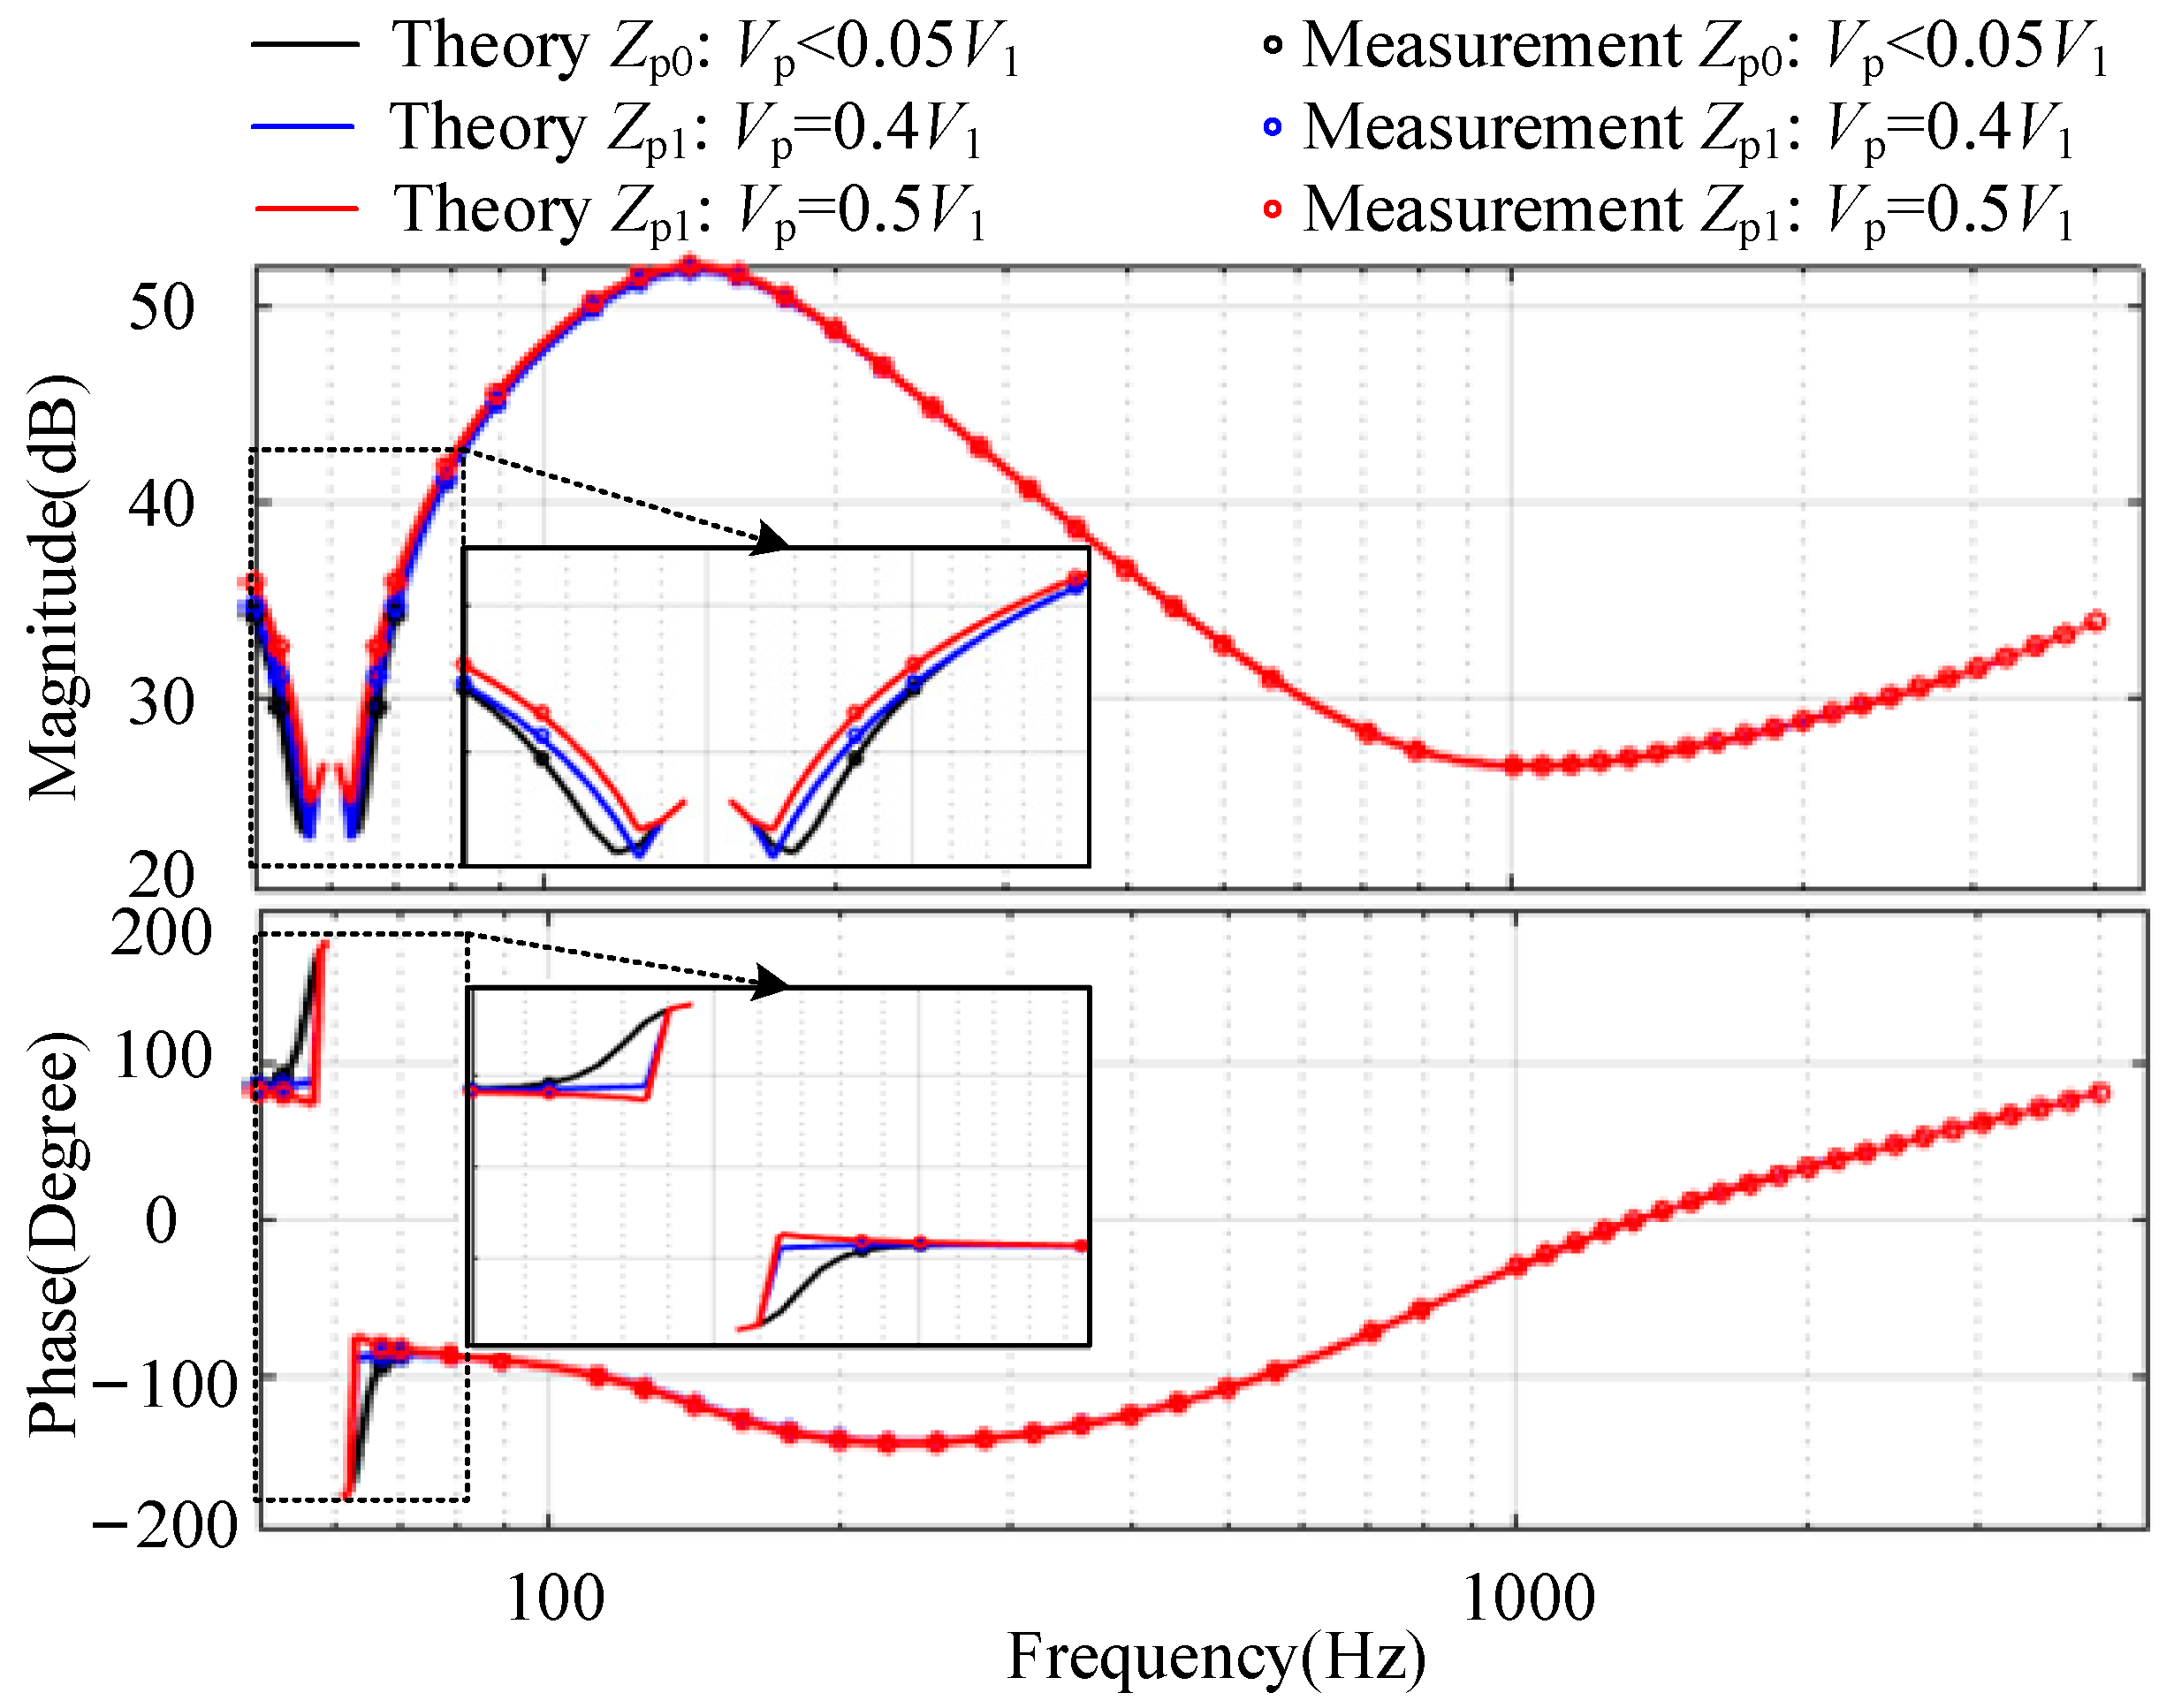
3.3. Large-Signal Impedance Model of Grid-Connected Inverter Considering the Influence of Limiter in PLL

When only the limiter in the PLL is considered, the limiters in both the current control loop and the PWM modulation are not added, that is, only limiter1 is retained in the limiters in Figure 1. According to the PLL control part in Figure 1, the input value vq_PI of the limiter in the PLL is as follows:
v q _ PI = v q H PLL ( s )
where:
v q = 0 , d c [ ± j T PLL 1 ( s ) j ] V p , f = ± ( f p f 1 )
in which:
T PLL 1 ( s ) = V 1 H PLL ( s ) s N PLL ( s ) 1 + V 1 H PLL ( s ) s N PLL ( s )
NPLL(s) is the description function of the limiter in PLL. According to Equation (17), the input value vq_PI of the limiter in the PLL is a single sinusoidal signal, so the NPLL(s) satisfies Equation (2).
Combining Equations (2) and (16)–(18), the value of NPLL(s) can be solved iteratively in MATLAB, and then the value of TPLL1(s) can be solved.
Finally, replacing TPLL(s) in the positive sequence small-signal impedance value Zp0(s) with TPLL1(s), the large-signal impedance value of the inverter considering the influence of the limiter in the PLL can be obtained as follows:
Z p 1 ( s ) = s L f + K m V dc [ H i ( s j ω 1 ) j K d ] e s T d 1 K m V dc [ K f + 1 2 T PLL 1 ( s j ω 1 ) H i ( s j ω 1 ) I 1 V 1 ] e s T d

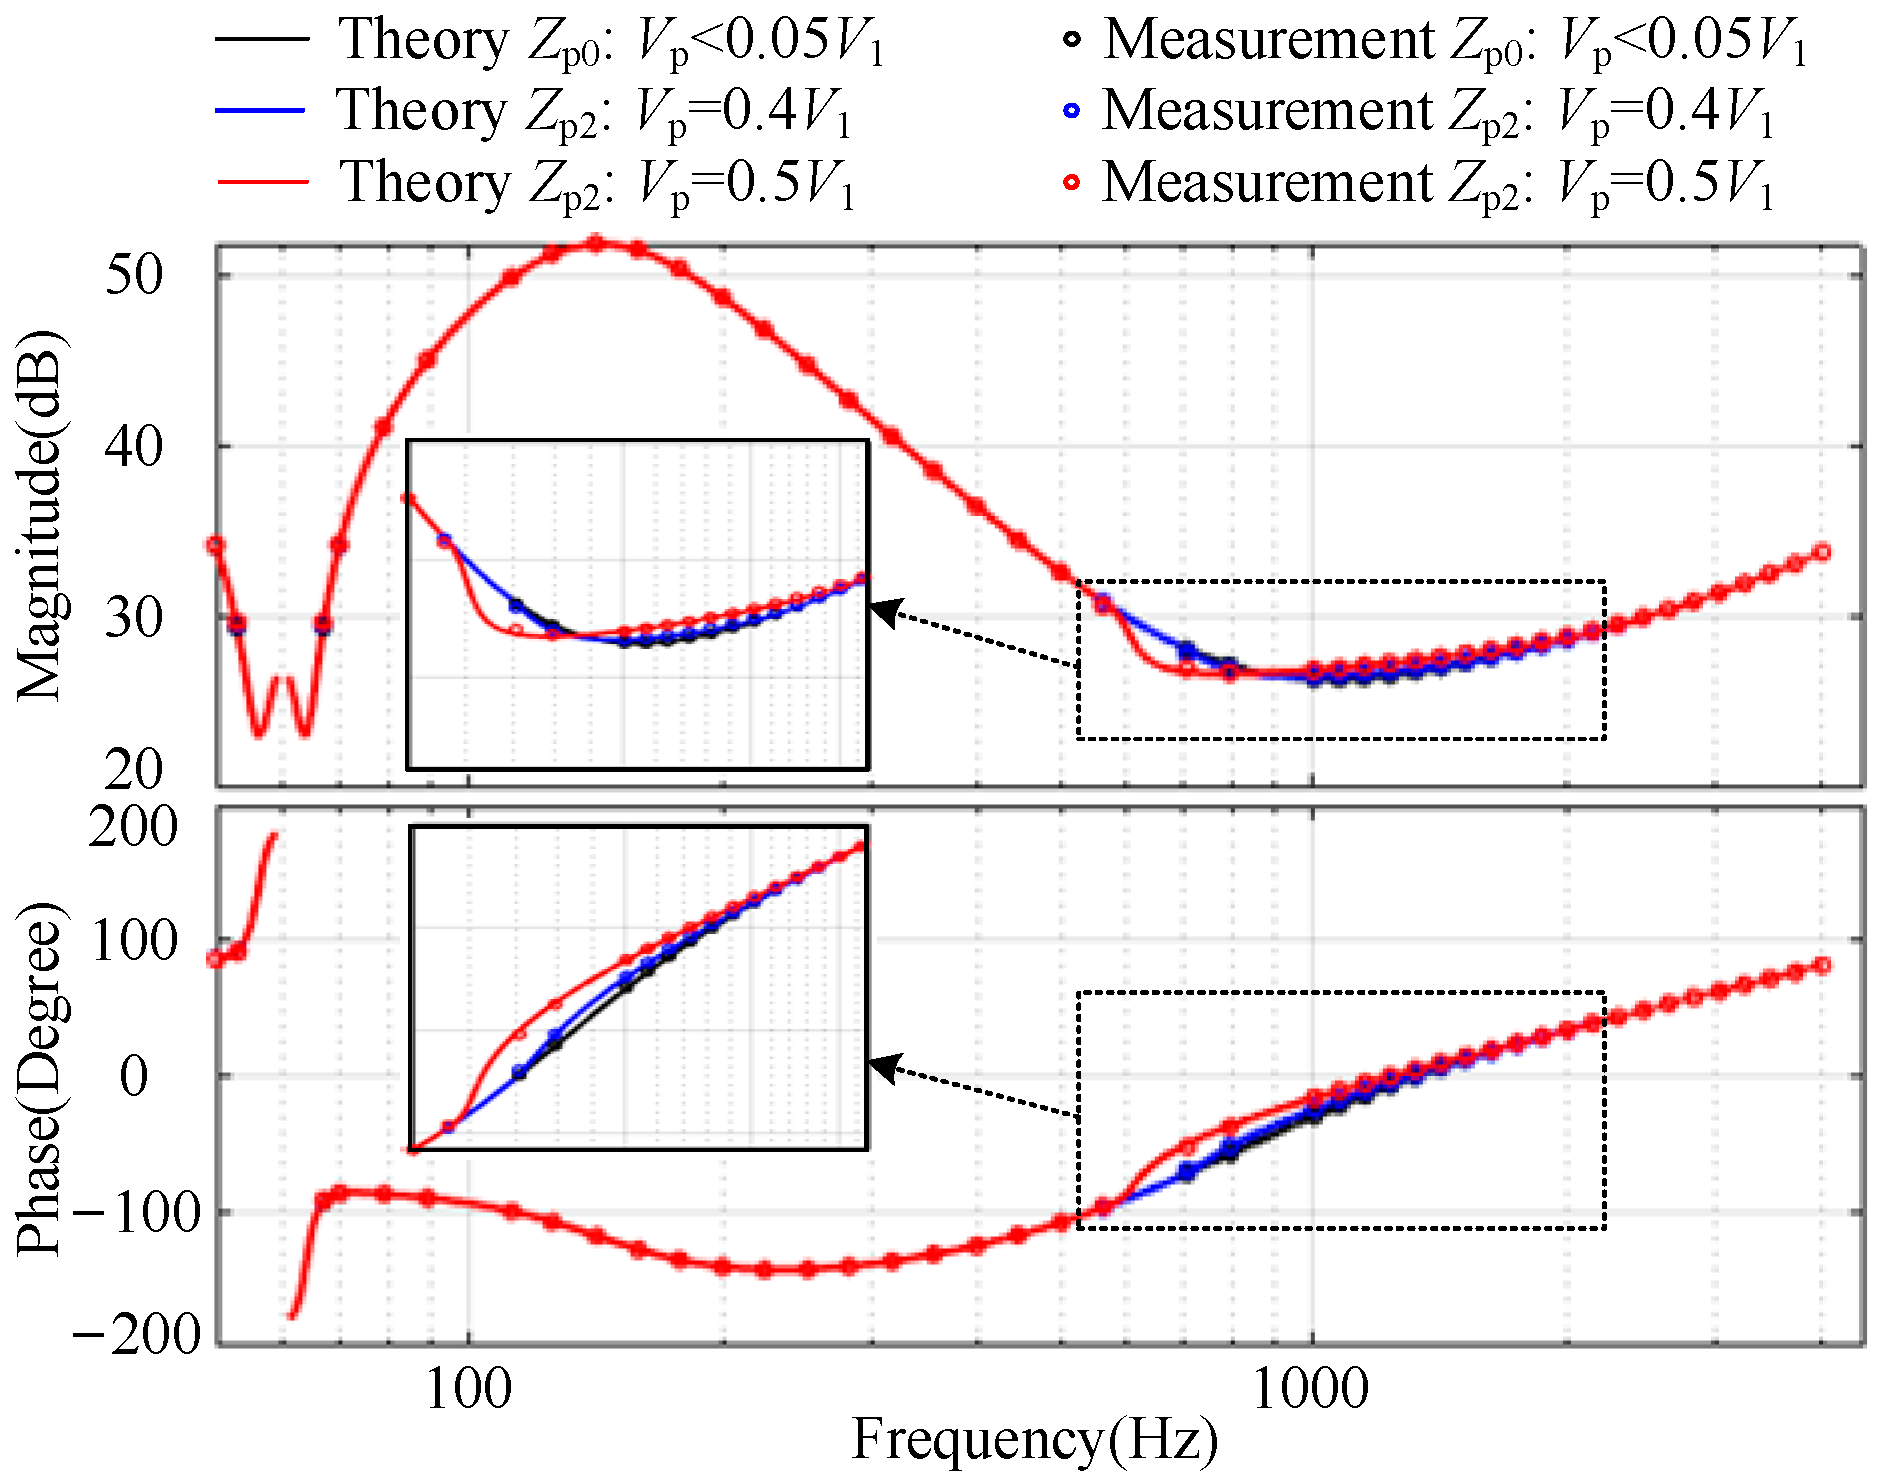
3.4. Large-Signal Impedance Model of Grid-Connected Inverter Considering the Influence of Limiter in the Current Loop

When only the limiter in the current loop is considered, the limiter in Figure 1 only keeps limiter2. Since the D-axis control of the current inner loop is symmetric to the Q-axis control, the description function of the current loop limiter can be obtained through the Q-axis control. The input of the limiter in the Q-axis current loop is:
i q _ PI = ( I qr i q ) H i ( s ) = ( I qr i q ) ( K p _ I + K i _ I / s )
in which:
i q = ± j I 1 V 1 cos φ i 1 T PLL ( s ) V p j I p , f = ± ( f p f 1 )
By defining Ni(s) as the describing function of the limiter in the current loop and replacing Hi(s) in the positive sequence small-signal impedance Zp0(s) with Hi(s)Ni(s), the large-signal impedance value of the inverter considering the influence of the limiter in the current loop can be obtained as follows:
Z p 2 ( s ) = V p I p = s L f + K m V dc [ H i ( s j ω 1 ) N i ( s j ω 1 ) j K d ] e s T d 1 K m V dc [ K f + 1 2 T PLL ( s j ω 1 ) H i ( s j ω 1 ) N i ( s j ω 1 ) I 1 V 1 ] e s T d
Through Equation (22), the expression of disturbance current Ip with respect to disturbance voltage Vp can be obtained as follows:
I p = V p 1 K m V dc [ K f + 1 2 T PLL ( s j ω 1 ) H i ( s j ω 1 ) N i ( s j ω 1 ) I 1 V 1 ] e s T d s L f + K m V dc [ H i ( s j ω 1 ) N i ( s j ω 1 ) j K d ] e s T d
Combining Equations (2), (20), (21) and (23), Ni(s1) is solved iteratively in MATLAB, and this value is substituted into Equation (22) to obtain the large-signal impedance value Zp2 considering the limiter in the current loop.

3.5. Large-Signal Impedance Model of Grid-Connected Inverter Considering the Effect of Limiter in PWM

When considering the influence of the limiter in PWM, the limiter in Figure 1 only retains limiter3. According to the principle of the PWM modulation link in Figure 1, the input of the PWM limiter can be obtained as ma∙e(−sTd), where ma contains two main frequency components f1 and fp, and its expression is:
m a = 1 N M 1 ( M 1 , M p ) K m V dc V 1 2 + ( ω 1 L f I 1 ) 2 , f = f 1 V p [ K f + 1 2 T PLL ( s j ω 1 ) H i ( s j ω 1 ) I 1 V 1 ] s L f + H i ( s j ω 1 ) j K d s L f + K m V dc [ H i ( s j ω 1 ) j K d ] e s T d N Mp ( M 1 , M p ) , f = f p
where, NM1(M1,Mp) is the f1 component of the limiter description function in PWM, and NMP(M1,Mp) is the fp component of the limiter description function in PWM.
By combining Equations (5)–(9) and (24) and solving them iteratively in MATLAB, the values of NM1(M1,Mp) and NMP(M1,Mp) can be obtained.
Finally, Km in the positive sequence small-signal impedance value Zp0(s) is replaced by KmNMP(M1,Mp) to obtain the large-signal impedance value of the inverter considering the influence of the limiter in the PWM:
Z p 3 ( s ) = s L f + K m V dc [ H i ( s j ω 1 ) j K d ] e s T d N Mp ( M 1 , M P ) 1 K m V dc [ K f + 0.5 T PLL ( s j ω 1 ) H i ( s j ω 1 ) I 1 / V 1 ] e s T d N Mp ( M 1 , M p )

4. Simulation Verification

The inverter grid-connected system shown in Figure 1 is built in Simulink, and the parameter settings are shown in Table 2. Among them, the control bandwidth of the PLL is 7.3 Hz, the control bandwidth of the current inner loop is 1190 Hz, and the active power is taken as 3818.25 W.

4.1. Large-Signal Impedance Response of Grid-Connected Inverter Considering the Influence of Limiter in PLL

Only limiter1 in the PLL is retained in the simulation, and large-signal disturbances with amplitude of 40%V1 and 50%V1 are injected into the parallel points of the inverter grid-connected system, respectively.
The amplitude–frequency characteristic curves of the small-signal impedance Zp0 of the grid-connected inverter and the large-signal impedance Zp1 considering the limiter in the PLL under different disturbance amplitudes are shown in Figure 4 together with their measurement results. It can be seen from the figure that the theoretical values of Zp0 and Zp1 agree with the measured values, which verifies the correctness of the large-signal impedance model considering the limiter in the PLL in this paper. Additionally, the grid-connected inverter’s large-signal impedance amplitude increases along with the amplitude of the disturbance in the sub/super-synchronous frequency band. The phase of the impedance gradually decreases when the frequency is below 60 Hz and gradually increases when the frequency is above 60 Hz.
Figure 5 shows the large-signal impedance Zp1 considering the limiter in the PLL for different PLL bandwidths when the disturbance amplitude is fixed at 50%V1. The amplitude of Zp1 is reduced and the phase also changes significantly below 300 Hz.

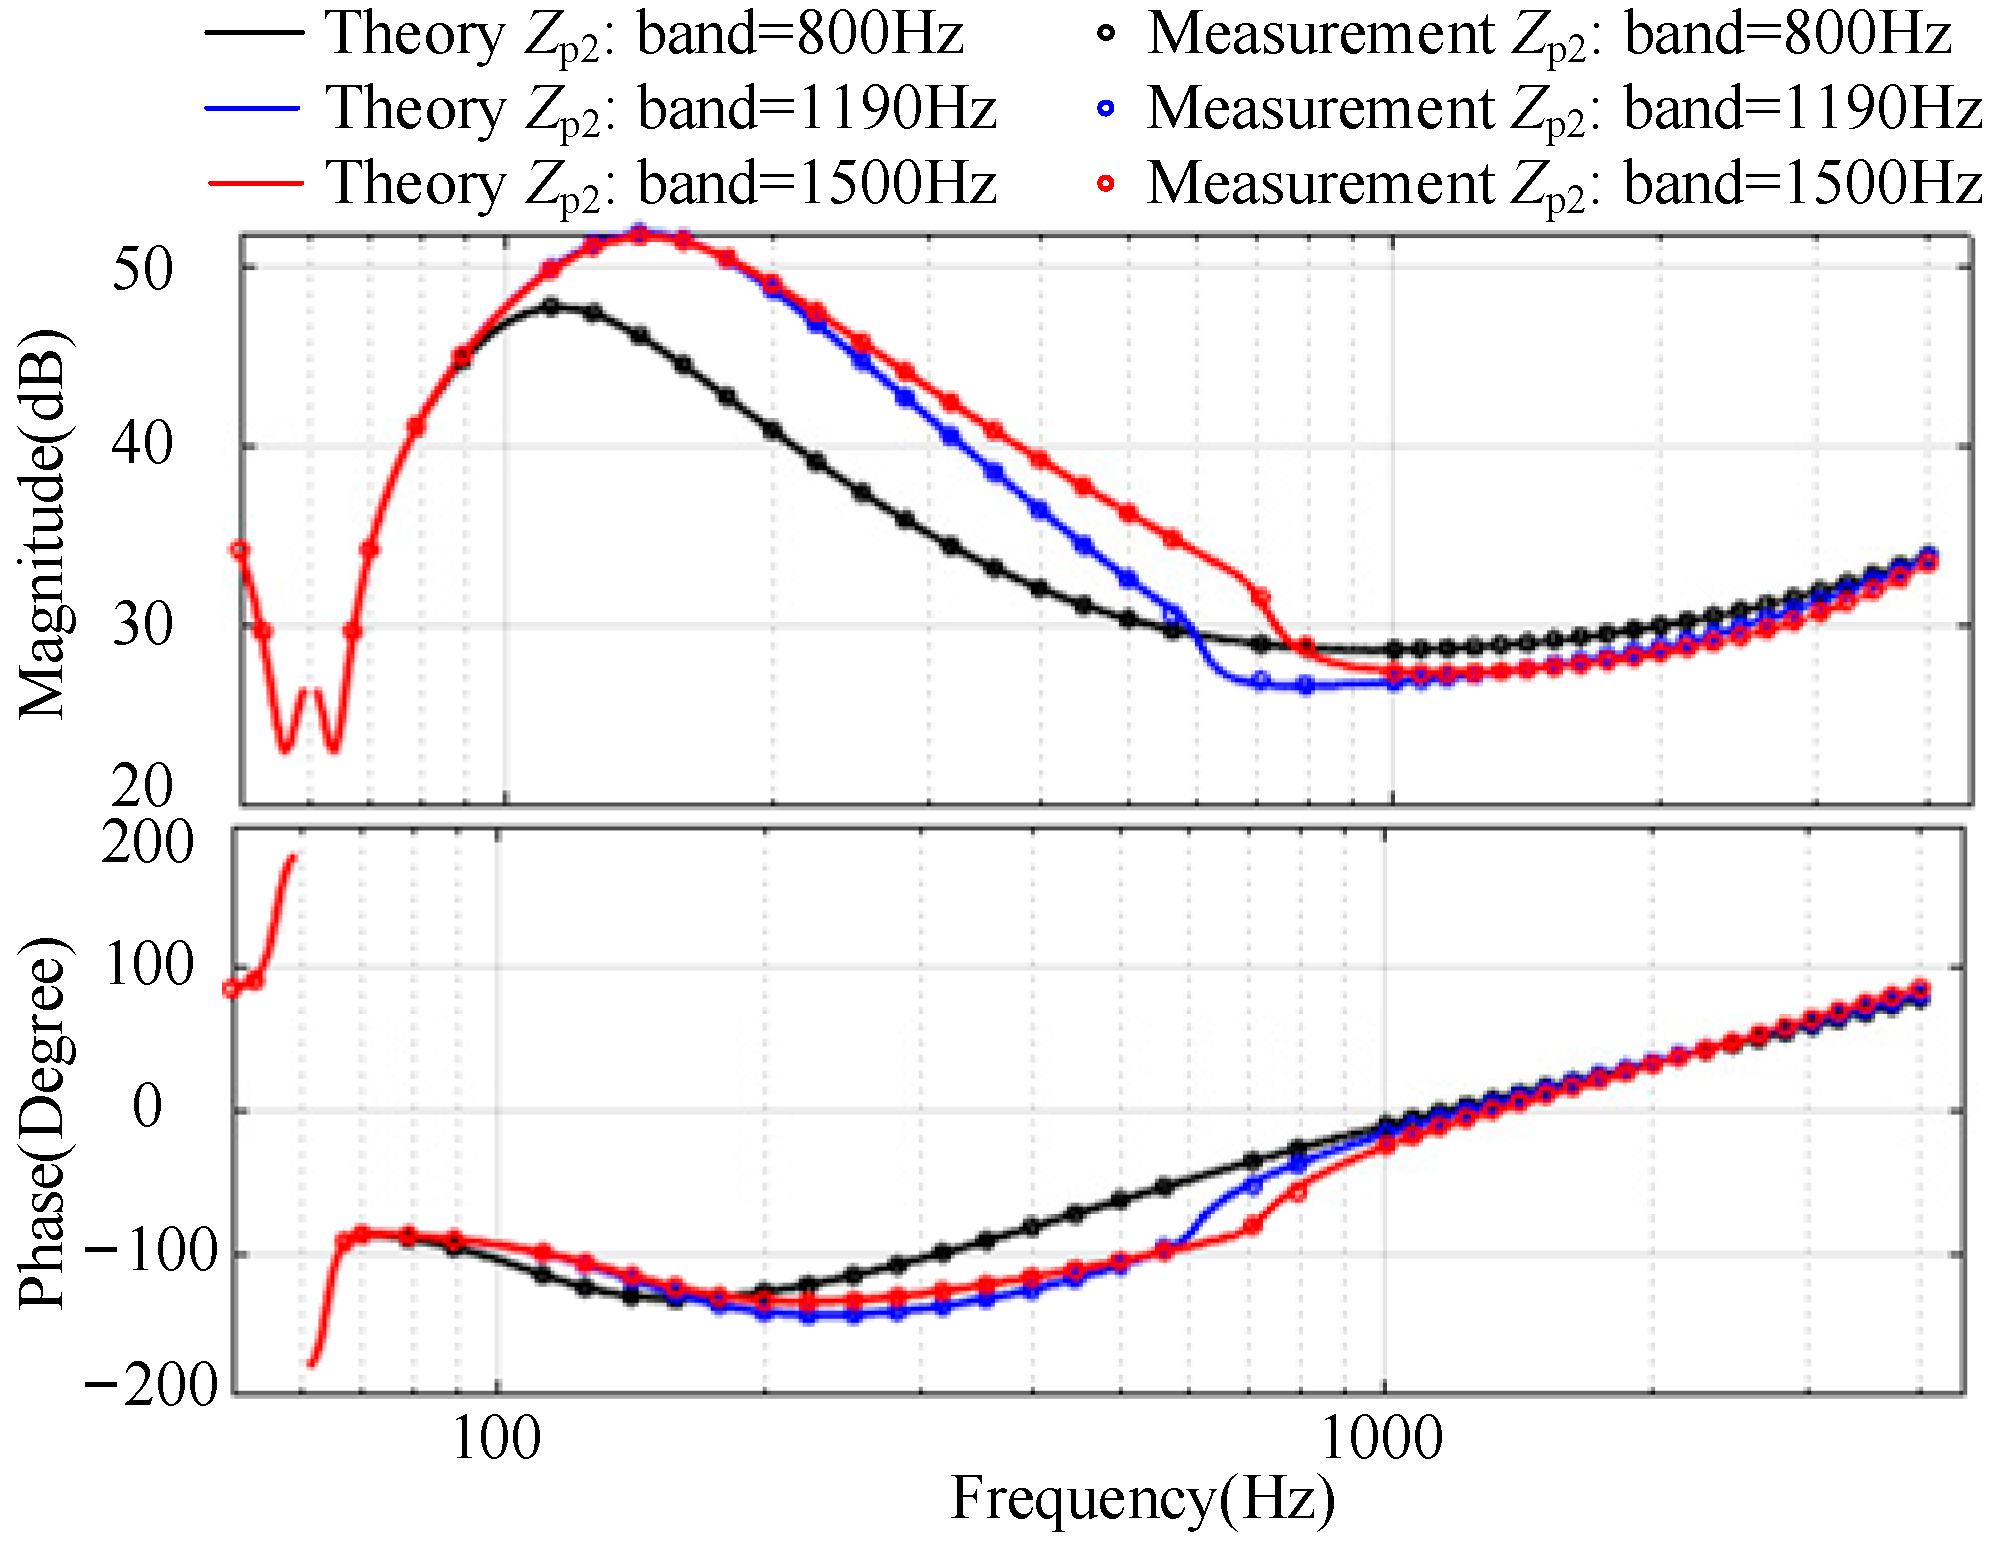
4.2. Large-Signal Impedance Response of Grid-Connected Inverter Considering the Influence of Limiter in the Current Loop

The theoretical amplitude–frequency characteristic curves of the small-signal impedance Zp0 of the grid-connected inverter and the large-signal impedance Zp2 of the inverter considering the limiter in the inner loop of the DQ-axis current are shown in Figure 6, together with their measurement results. Only limiter2 in the current loop is retained in the simulation, and disturbances with amplitude of 40%V1 and 50%V1 are injected into the union points of the inverter grid-connected system, respectively. It can be seen from Figure 6 that the theoretical values of Zp0 and Zp2 agree with the measured values. The large-signal impedance phase and amplitude considerably fluctuate with the disturbance magnitude in the 500 Hz–2000 Hz frequency range.
Figure 7 shows the large-signal impedance of the inverter considering the limiter in the current loop for different current-loop bandwidths when the disturbance amplitude is fixed at 50% V1. It is shown that the amplitude and phase of the large-signal impedance Zp2 considering the limiter in the current loop change significantly in the range of 100 Hz to 3000 Hz with the increase in the bandwidth of the current loop.

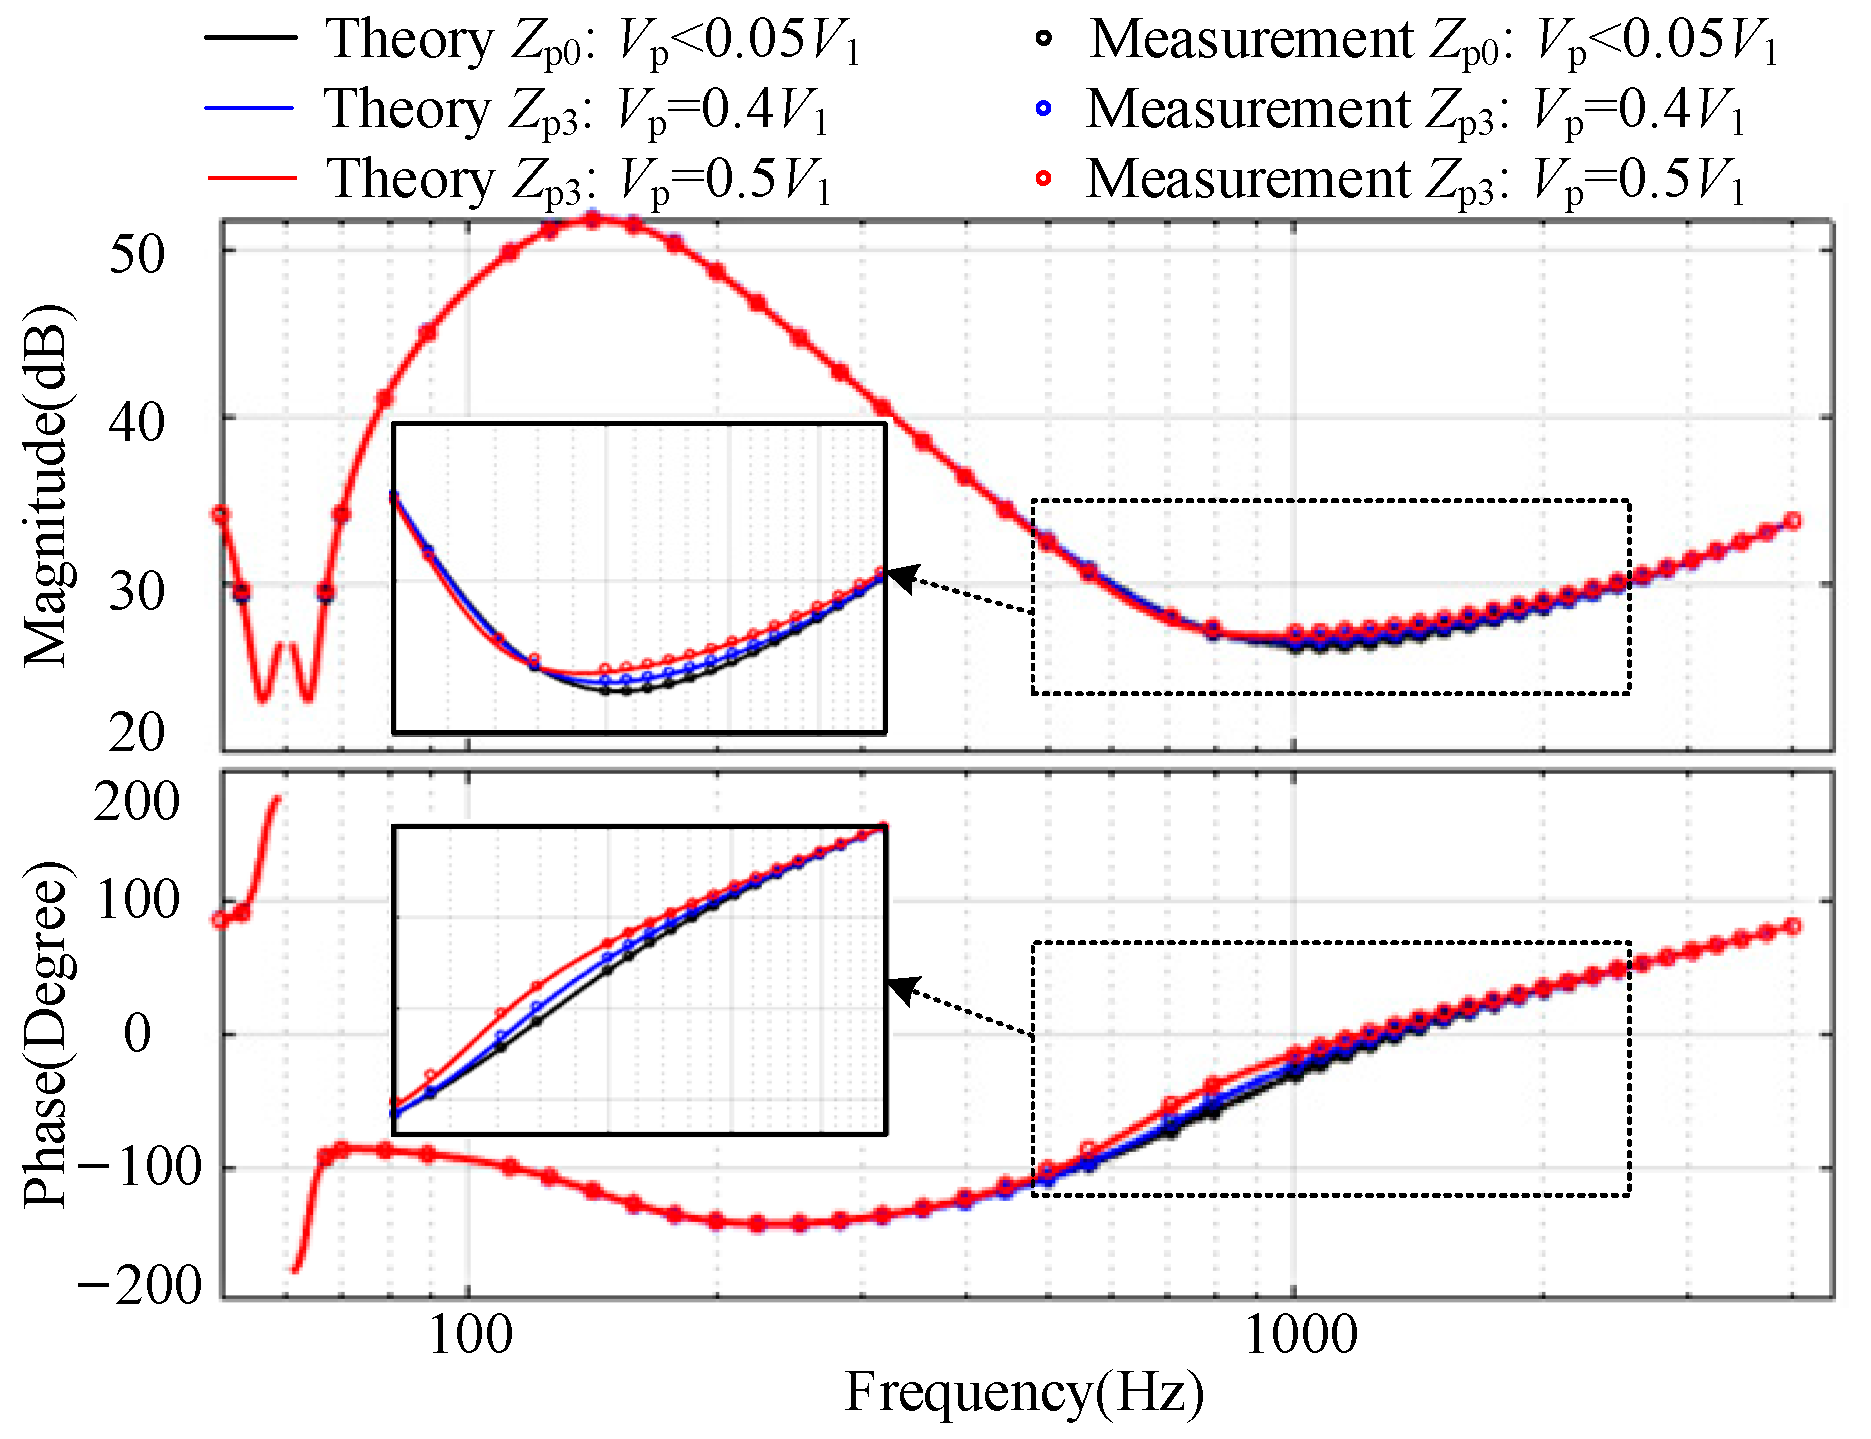
4.3. Large-Signal Impedance Response of Grid-Connected Inverter Considering the Influence of Limiter in PWM

Figure 8 shows the theoretical and measured results of the small-signal impedance Zp0 and the large-signal impedance Zp3 considering the limiter in the PWM.
Only limiter3 in PWM is retained in the simulation, and disturbances with amplitude of 40%V1 and 50%V1 are injected into the union points of the inverter grid-connected system, respectively. It can be seen from the figure that the theoretical values of Zp0 and Zp3 agree with the measured values, which verifies the accuracy of the large-signal impedance model of the inverter established in this paper considering the limiter in PWM. The phase of the large-signal impedance clearly increases as the disturbance amplitude does among 500 Hz–2000 Hz, and the amplitude also varies somewhat.

4.4. Large-Signal Impedance Comparison of Grid-Connected Inverter Considering the Influence of Limiter in Different Control Links

Table 3 compares the large-signal impedance considering the limiter in the PLL, the limiter in the current loop, and the limiter in the PWM. Since there is only one primary frequency component (fpf1) in the limiter input signal when the limiter in PLL or current loop is taken into account, the limiter description function may be directly described by the single-input limiter description function. When considering the limiter in PWM, the main frequency components of the limiter input signal are f1 and fp, which need to be expressed by the dual-input limiter description function. Considering the limiters in different control links, the large-signal impedance Zp1, Zp2 or Zp3 of the grid-connected inverter differ from the small-signal impedance only by one term, which is HPLL(s)NPLL(s), Hi(s)Ni(s) and KmNMP(M1,MP), respectively. Figure 9 supplies a Bode plot of the small-signal impedance model and the large-signal impedance model that takes into account different limiters. As can be seen from the figure, the large-signal impedance Zp1 differs from the small-signal impedance Zp0 around the sub/super-synchronous frequency band, and the large-signal impedances Zp2 and Zp3 differ from the small-signal impedance Zp0 around the middle and high frequency band.

5. System Stability Analysis Based on the Large-Signal Impedance Model

The system’s stability may be assessed based on the phase difference at the intersection of the grid impedance and the small-signal impedance of the grid-connected inverter, but it is not possible to forecast the oscillation’s magnitude. However, the system oscillation frequency and oscillation amplitude can all be predicted by analyzing the intersection of the grid impedance and the grid-connected inverter’s large-signal impedance at different disturbance amplitudes. The grid impedance value Zg(s) in Figure 1 is calculated as follows:
Z g ( s ) = s L g ( R f + 1 s C f ) s L g + R f + 1 s C f
In this paper, the large-signal impedance model considering the limiter in the current loop is taken as an example to analyze the stability of the grid-connected system and predict the oscillation frequency and amplitude of the grid-connected system. The prediction results of two groups of parameters are given and compared with the actual system oscillation amplitude and frequency.
  • Case 1
For the first set of parameters, the grid impedance is taken to be 5.7 mH and the current loop control bandwidth is 1190 Hz. Figure 10 is used to predict the constant amplitude oscillation frequency and amplitude of the system considering the limiter in the current inner loop.
The green solid line is the grid impedance Zg(s), and the black solid line is the small-signal impedance Zp0(s) of the grid-connected inverter. The amplitude of Zp0(s) intersects with the grid impedance amplitude at about 582 Hz with a phase difference of 182.01°, indicating that the system is unstable. The blue solid line is the Zp2(s) corresponding to the injection disturbance amplitude of 50%V1. Its amplitude intersects with the grid impedance amplitude at about 580 Hz with a phase difference of 181.78°. The purple solid line is the Zp2(s) corresponding to the injection disturbance amplitude of 54%V1. Its amplitude intersects with the grid impedance amplitude at about 565 Hz, and the phase difference is 180.51°, indicating that the system is critically stable. The red solid line is the Zp2(s) corresponding to the injected disturbance amplitude of 60%V1. Its amplitude intersects with the grid impedance amplitude at about 524 Hz, and the phase difference is 167.17°, indicating that the system is stable. In conclusion, when the grid impedance is 5.7 mH, unstable oscillation will occur in the system considering a limiter in the current loop. When limiter input does not trigger clipping, the oscillation amplitude will continue to increase. When the oscillation amplitude reaches about 54%V1, the oscillation frequency is around 565 Hz, and the divergence oscillation will eventually become a constant amplitude oscillation, indicating that the system is critically stable.
The oscillation amplitude is predicted by the Nyquist plot of the impedance ratio Zg(s)/Zp2(s, Vp) in Figure 11. The impedance ratio’s Nyquist curve progressively deviates from the point (−1,j0) as the injection disturbance’s magnitude rises, making the system more stable. When the amplitude of the injection disturbance is 54%V1, the Nyquist curve just crosses the point (−1,j0), and the system is critically stable. Therefore, it is predicted that when the grid inductance is set to 5.7 mH, the grid-connected system will have a constant amplitude oscillation with an amplitude of about 54%V1.
The grid impedance is set to 5.7 mH, and the waveform and FFT analysis results of va are shown in Figure 12.
As shown in Figure 12, va has constant amplitude oscillation. The FFT analysis of va shows that an oscillation with an amplitude of 83.51 V appears at 571 Hz, which is basically consistent with the oscillation amplitude and frequency predicted in Figure 10 and Figure 11.
  • Case 2
The second set of parameters takes the grid impedance as 6.7 mH and the current loop control bandwidth as 1290 Hz. Figure 13 is used to predict the constant amplitude oscillation frequency and amplitude of the system considering the limiter in the current inner loop.
The green solid line represents the grid impedance Zg(s), and the black solid line represents the small-signal impedance Zp0(s) of the grid-connected inverter. The amplitude of Zp0(s) intersects with the grid impedance amplitude at about 568 Hz, and the phase difference is 184.65°, indicating that the grid-connected system is unstable. The blue solid line is the Zp2(s) corresponding to the injected disturbance amplitude of 60%V1. Its amplitude intersects with the grid impedance amplitude at about 555 Hz, and the phase difference is 183.5°. The purple solid line is the Zp2(s) corresponding to the injection disturbance amplitude of 64%V1. Its amplitude intersects with the grid impedance amplitude at about 535 Hz, and the phase difference is 179.64°, indicating that the grid-connected system is critically stable. The red solid line is the Zp2(s) corresponding to the injected disturbance amplitude of 70%V1. Its amplitude intersects with the grid impedance amplitude at about 498 Hz, and the phase difference is 159.44°, indicating that the grid-connected system is stable. In conclusion, when considering the limiter in the current loop and the grid impedance is 5.7 mH, the grid-connected system will have unstable oscillation. When the oscillation amplitude reaches about 64%V1, the divergence oscillation becomes constant amplitude oscillation, the system is critically stable, and the oscillation frequency is about 535 Hz.
Figure 14 uses the Nyquist plot of the impedance ratio Zg(s)/Zp2(s, Vp) to predict the oscillation amplitude. As the amplitude of the injection disturbance increases, the Nyquist curve of the impedance ratio gradually moves away from the point (−1,j0), and the system becomes more stable. When the amplitude of the injection disturbance is 64%V1, the Nyquist curve just crosses the point (−1,j0), and the system is critically stable. Therefore, it is predicted that when the grid inductance is set to 6.7 mH and the current loop control bandwidth is 1290 Hz, the grid-connected system considering the limiter in the current loop will have a constant amplitude oscillation with an amplitude of about 64%V1.
To verify whether the oscillation frequency and amplitude predicted by Figure 13 and Figure 14 are correct, the grid impedance is set to 6.7 mH, and the waveform when the grid voltage va is critically stable is observed. As shown in Figure 15, constant amplitude oscillations appear. FFT analysis of va shows an oscillation with an amplitude of 94.72 V at 550 Hz, which was basically consistent with the results predicted by Figure 13 and Figure 14.

6. Conclusions

This study establishes three large-signal impedance models that take into account the limiter in PLL, current loop, and PWM, respectively. The accuracy of each large-signal impedance model is confirmed using MATLAB/Simulink. To examine the stability of the system, the large-signal impedance model of the grid-connected inverter taking into account the limiter in the current loop is used as an example. The system’s oscillation frequency and amplitude are anticipated, and the accuracy of the analysis’s prediction findings is confirmed. In this paper, the following conclusions are obtained:
(1)
Based on the existing large-signal impedance model considering the limiter in PWM, the large-signal impedance models considering the limiter in the current control loop and the limiter in the PLL of the grid-connected inverter are developed for the first time. Their theoretical large-signal impedance characteristics are all consistent with the measured large-signal impedance characteristics;
(2)
The impedance characteristics of three large-signal impedance models and the influence of different limiters on the output impedance characteristics of grid-connected inverters are compared and analyzed. The limiter in the PLL influences the large-signal impedance characteristics of the grid-connected inverter around the sub/super-synchronous frequency band, and the limiter in the current loop and the limiter in the PWM influence those around the middle and high frequency band;
(3)
The large-signal impedance of the inverter taking into account the PLL limiter changes dramatically around the sub-super synchronous frequency range when the PLL bandwidth is increased. The amplitude and phase of the large-signal impedance of the inverter taking into account the limiter in the current loop fluctuate dramatically in the middle frequency band when the current loop’s bandwidth is increased. The PLL bandwidth has a smaller impact on Zp1 than the current-loop bandwidth has on Zp2;
(4)
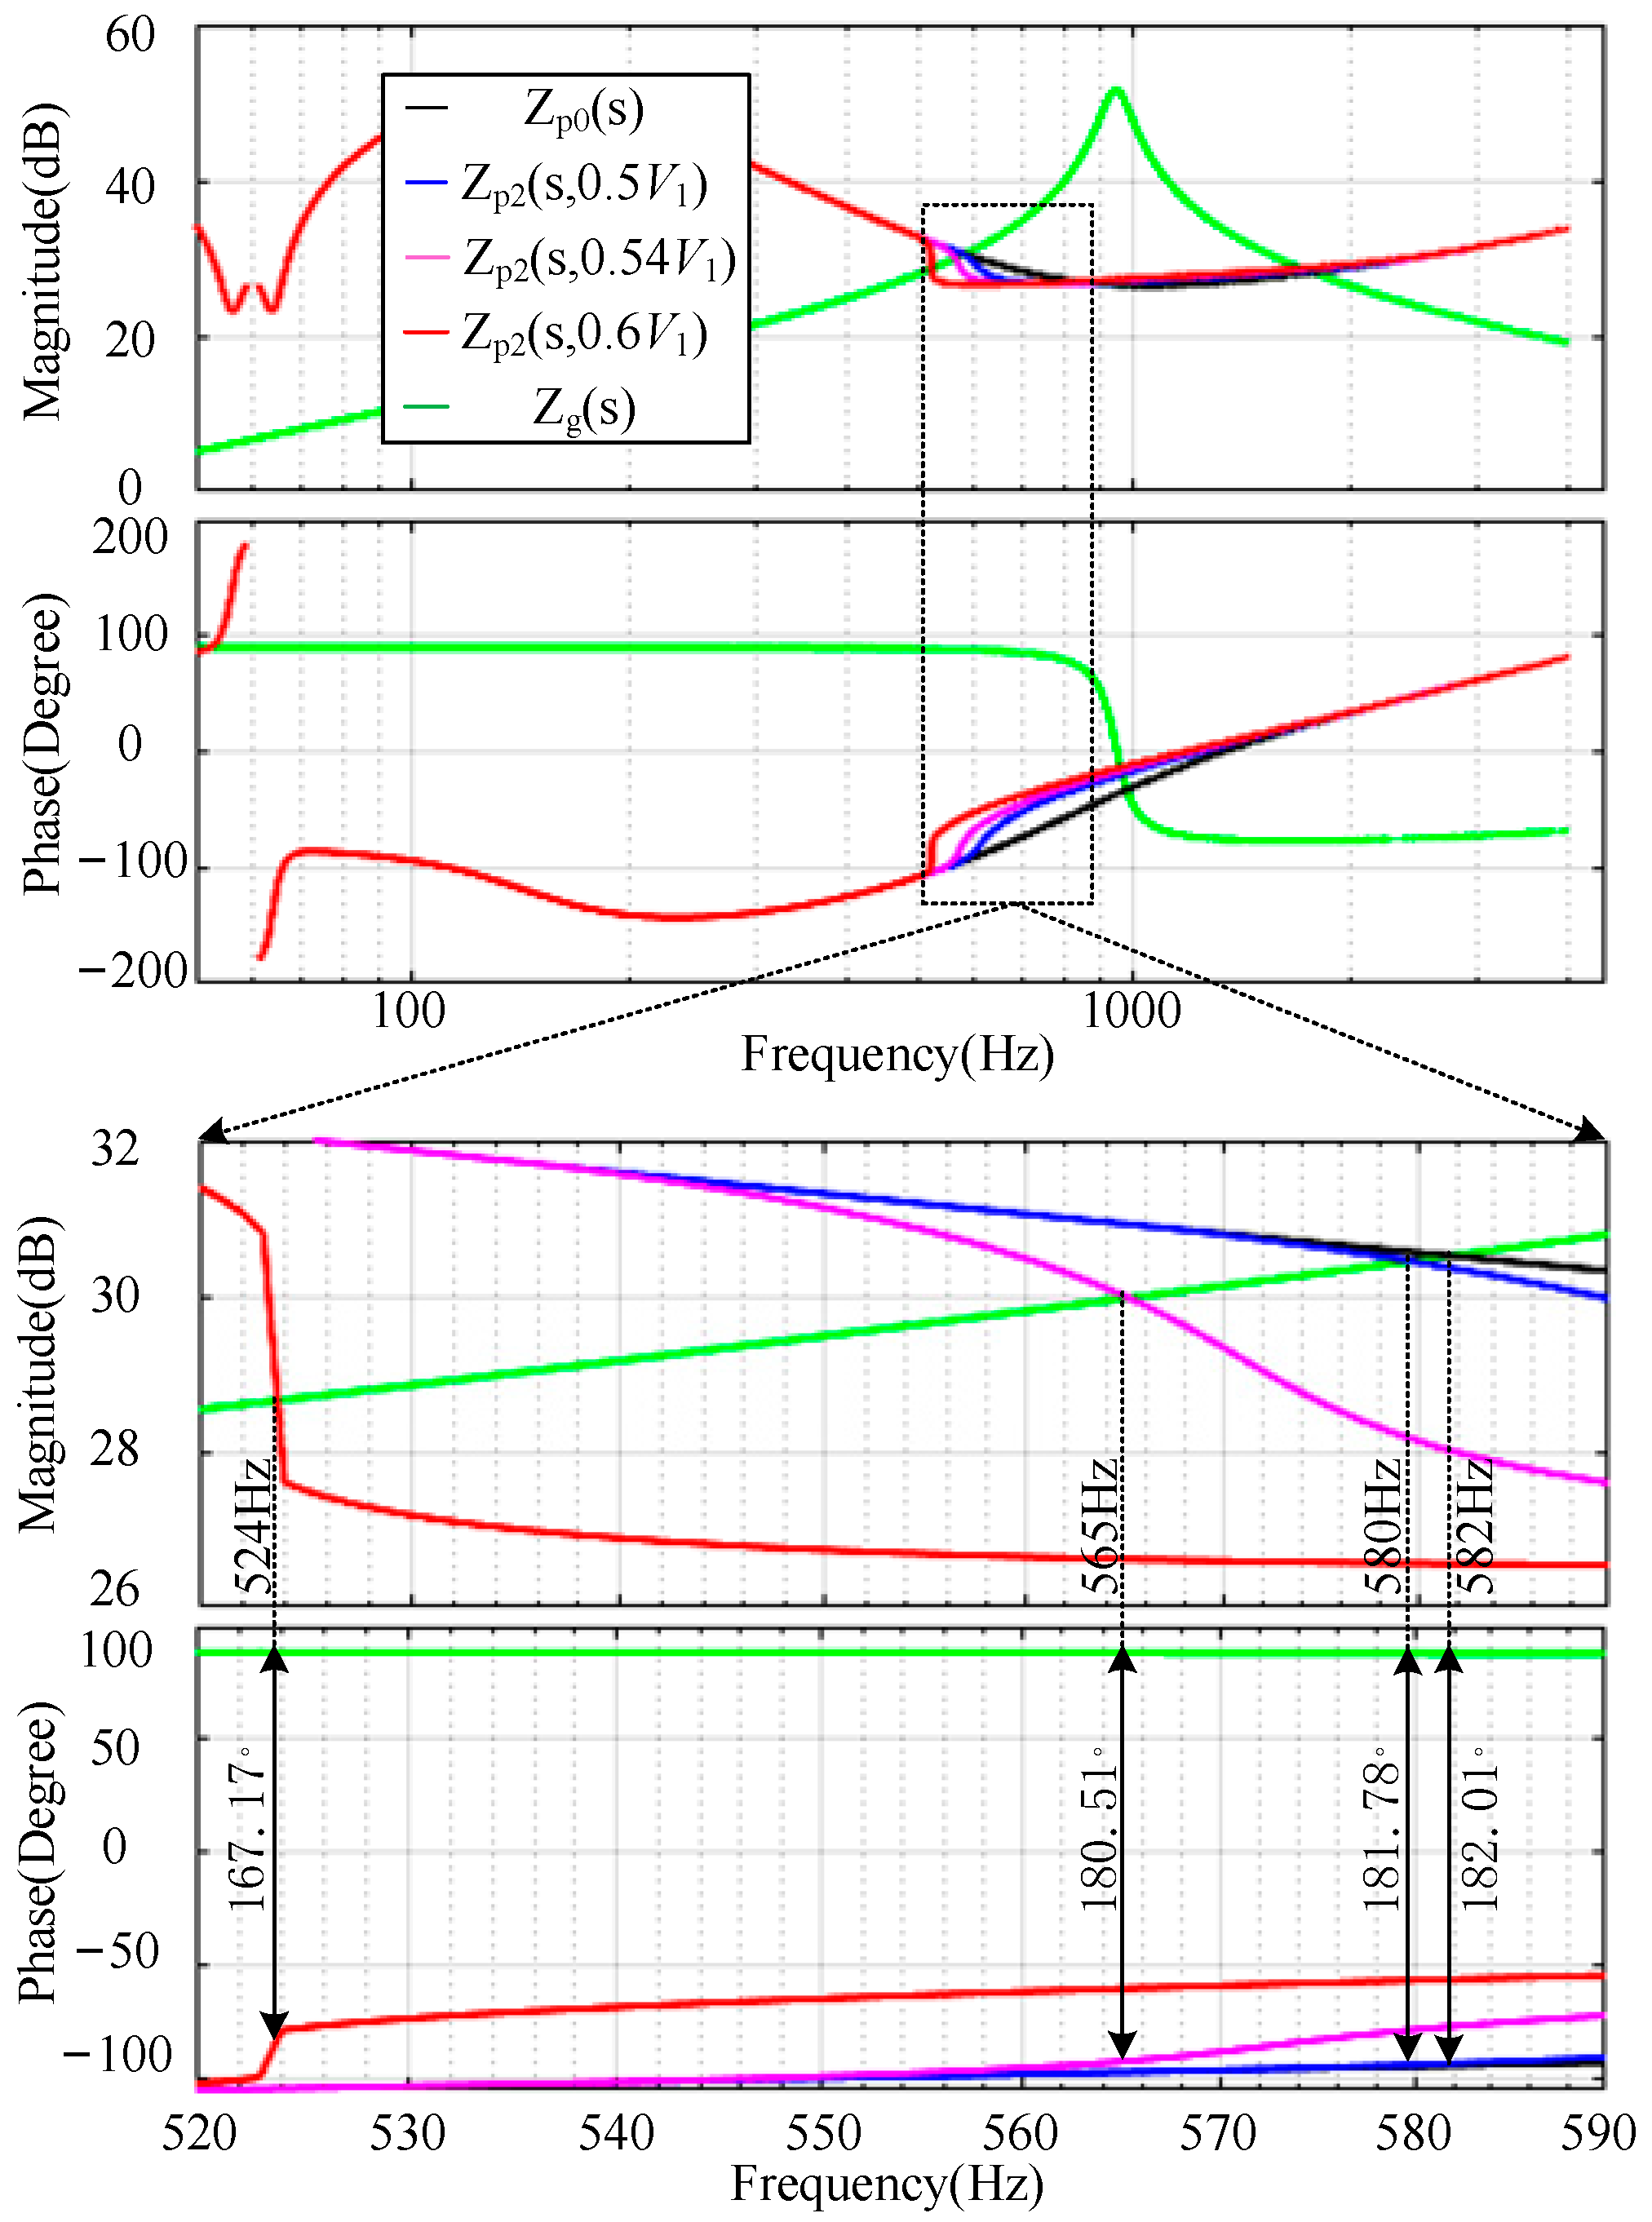
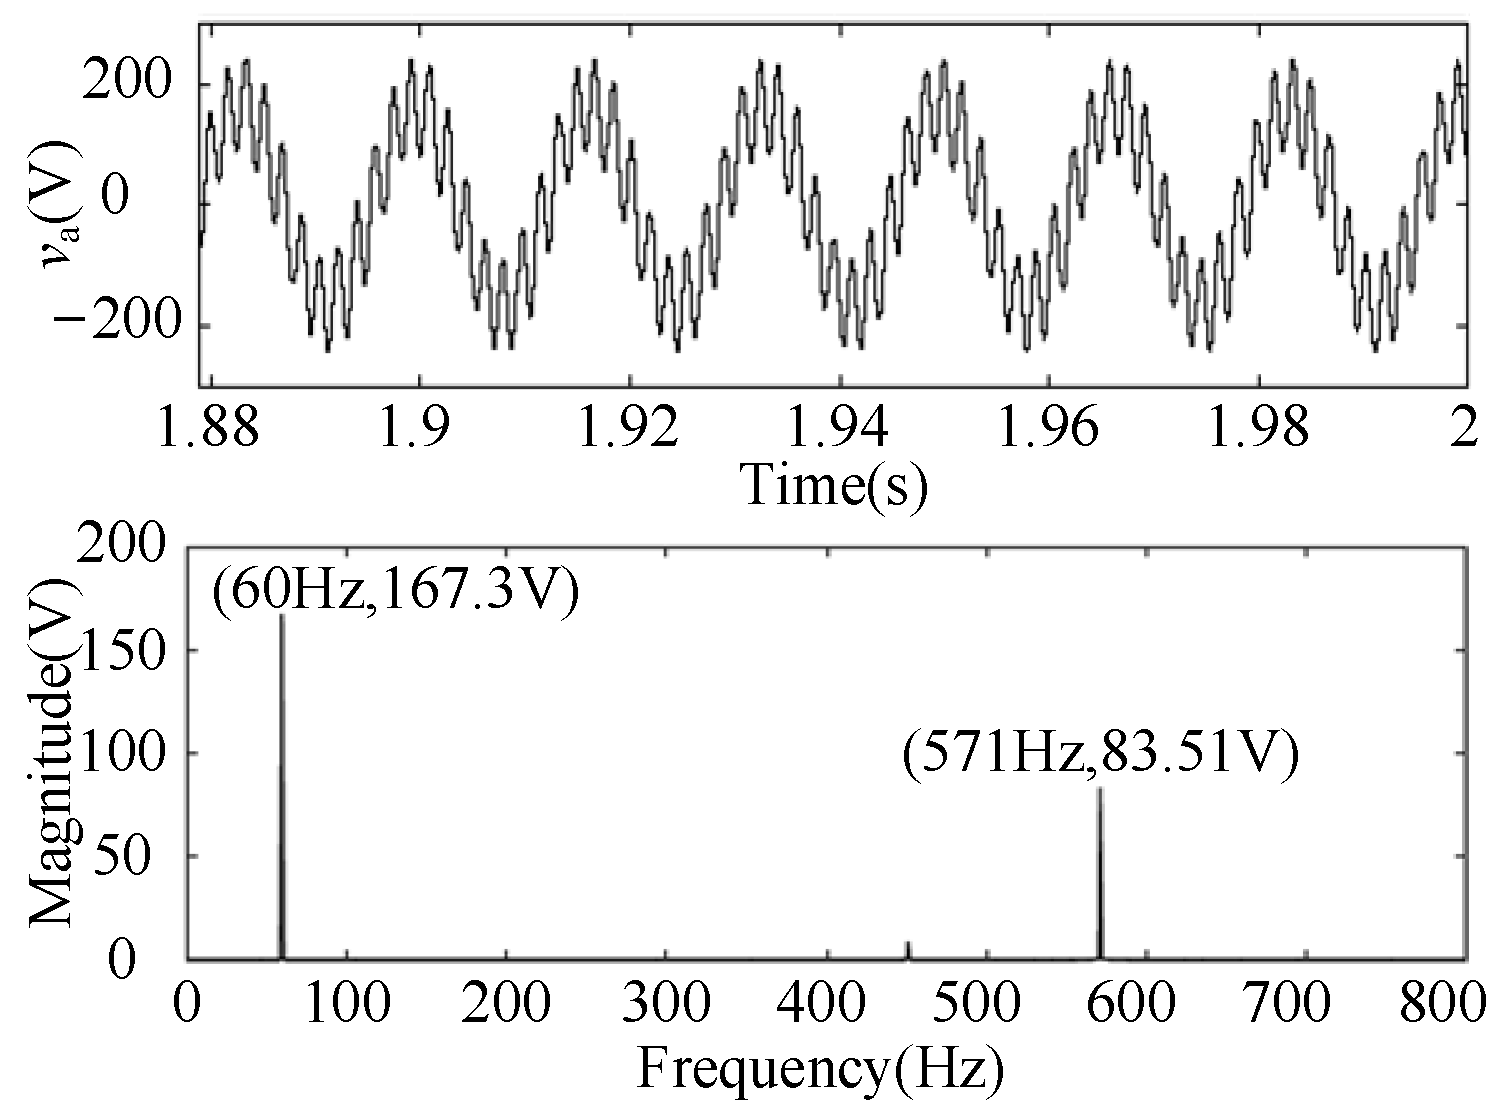
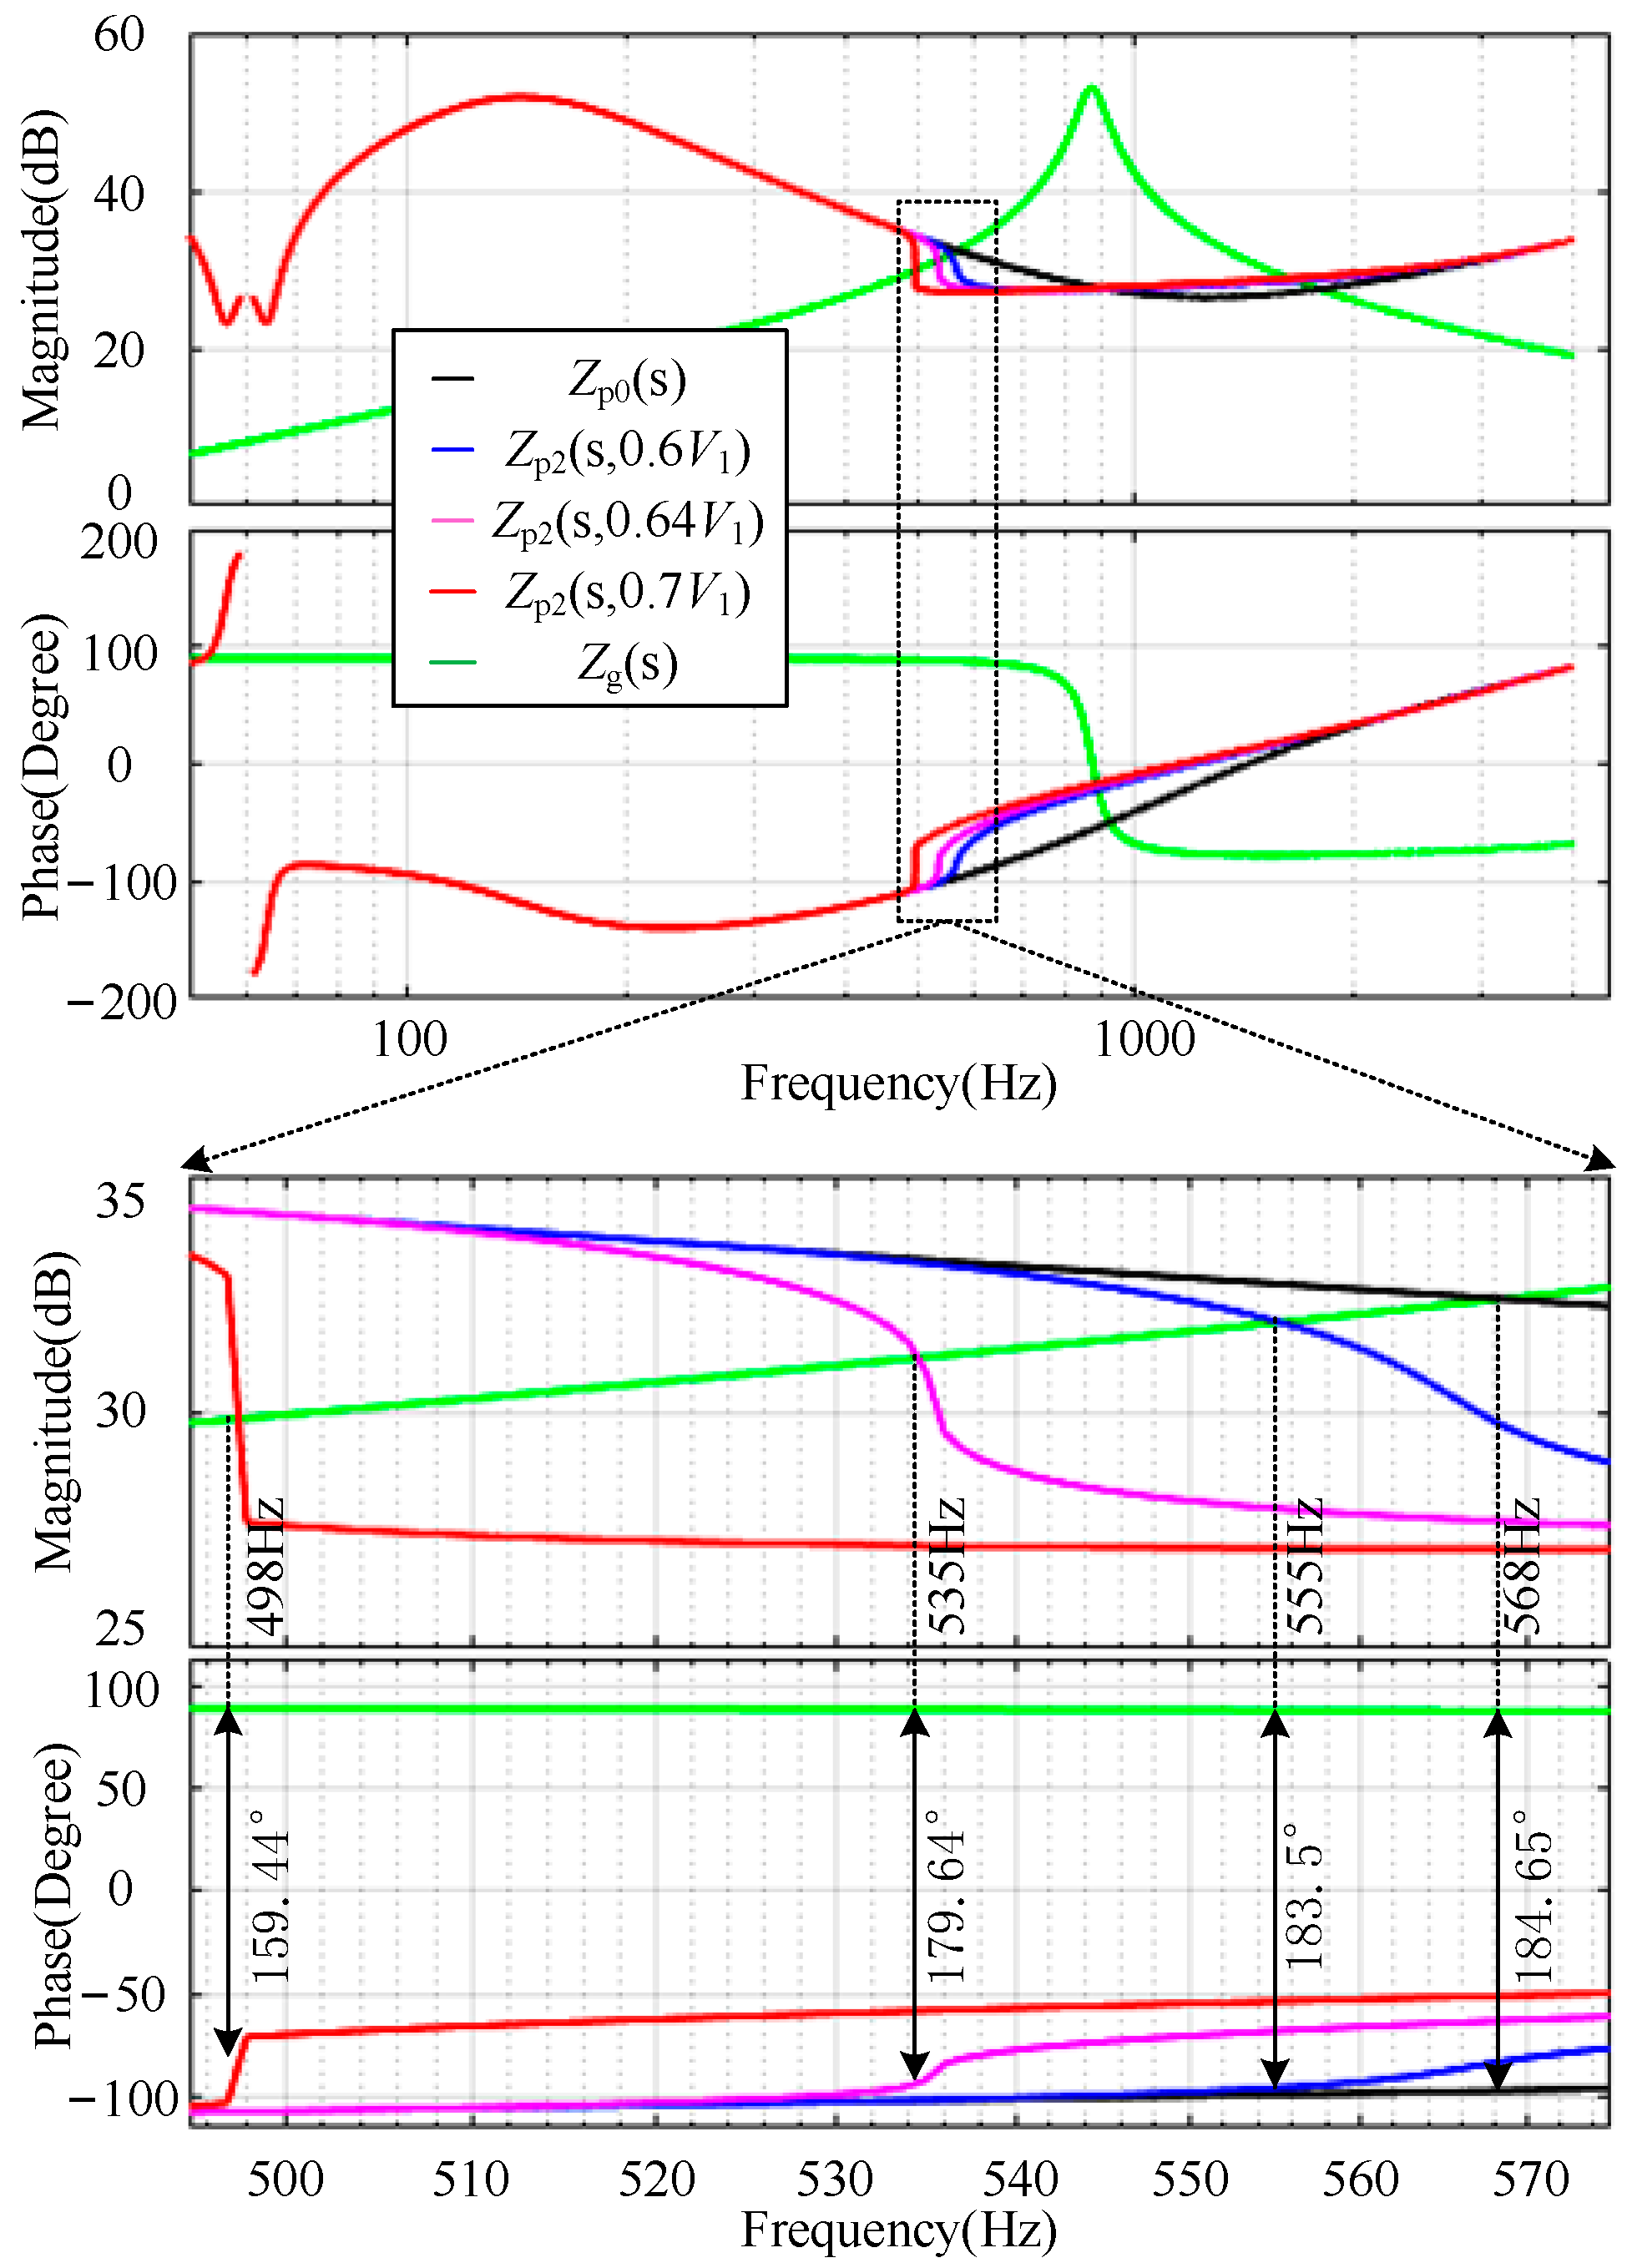
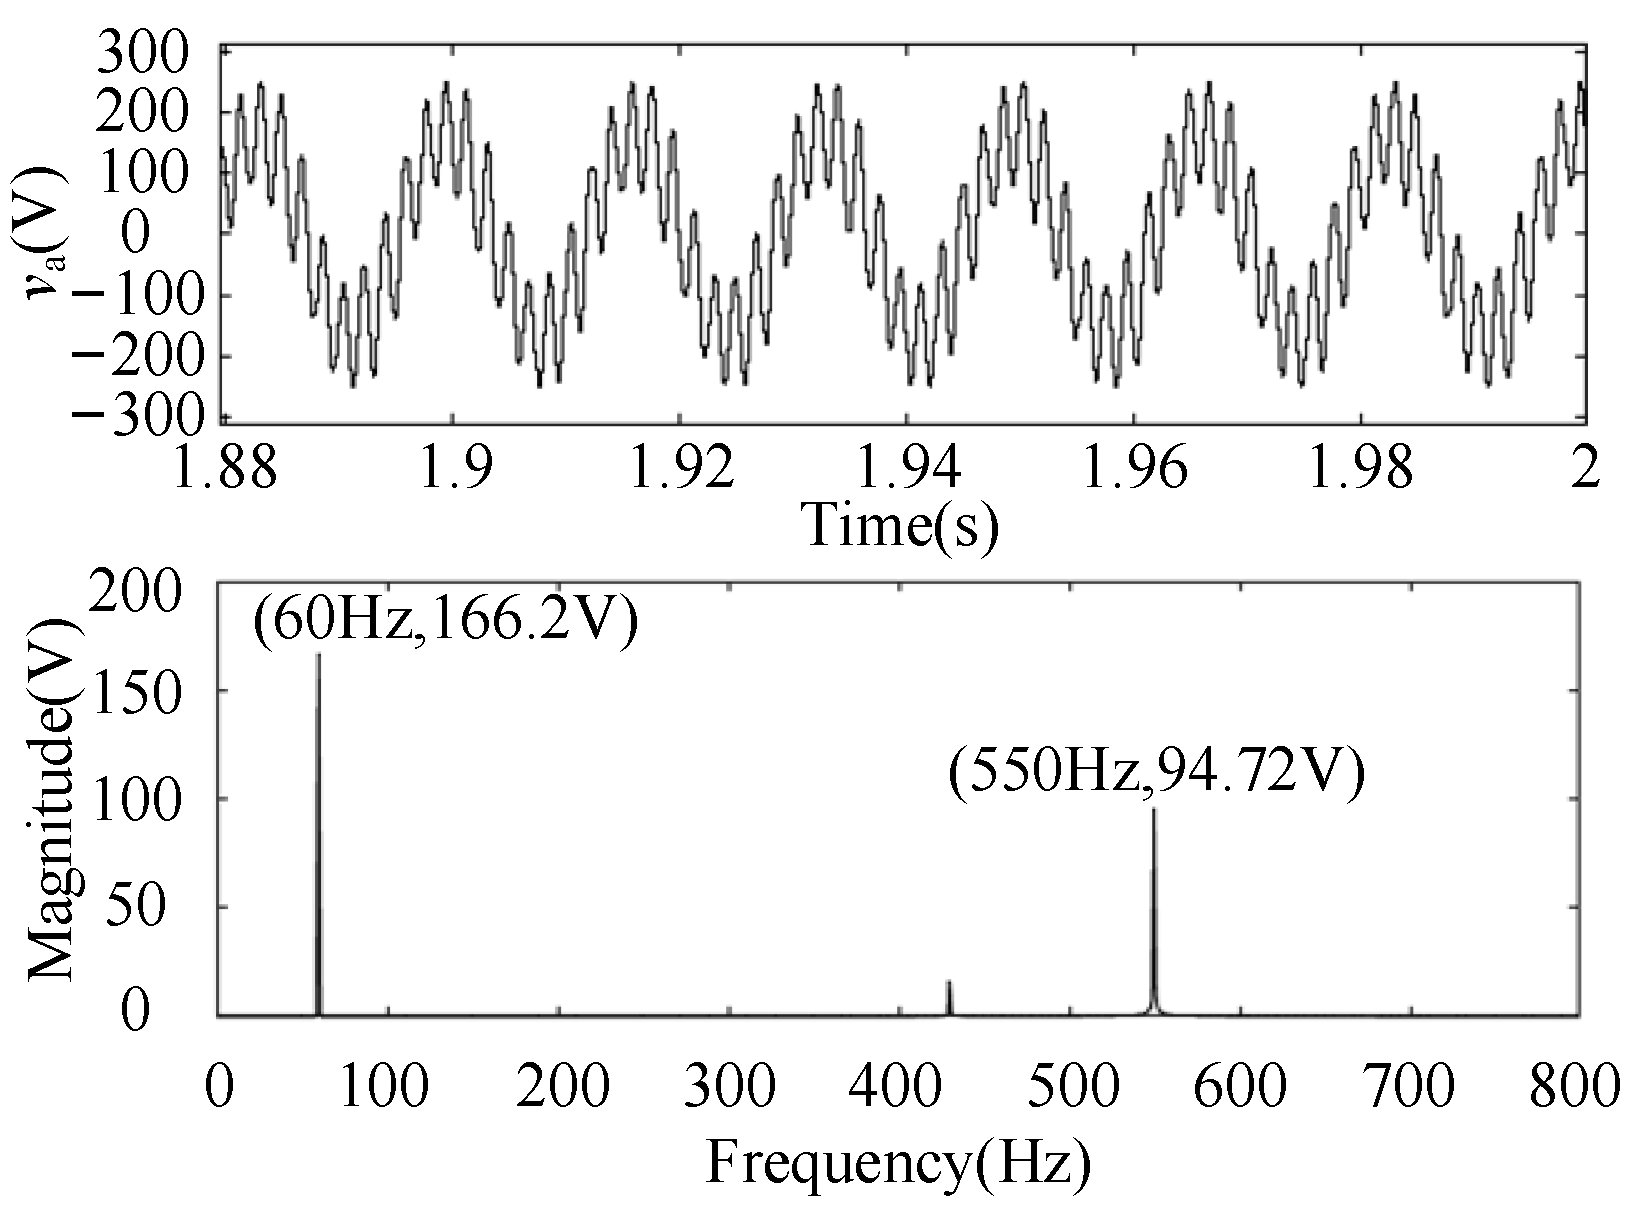
Due to the influence of the limiter in the current loop, with the increase in the system disturbance amplitude, the phase difference at the intersection of the large-signal impedance’s amplitude and the grid impedance’s amplitude decreases gradually, and the system stability is enhanced. When the phase difference is 180°, the system is critically stable, and the oscillation frequency and amplitude of the real system are essentially compatible with the disturbance frequency and amplitude;
(5)
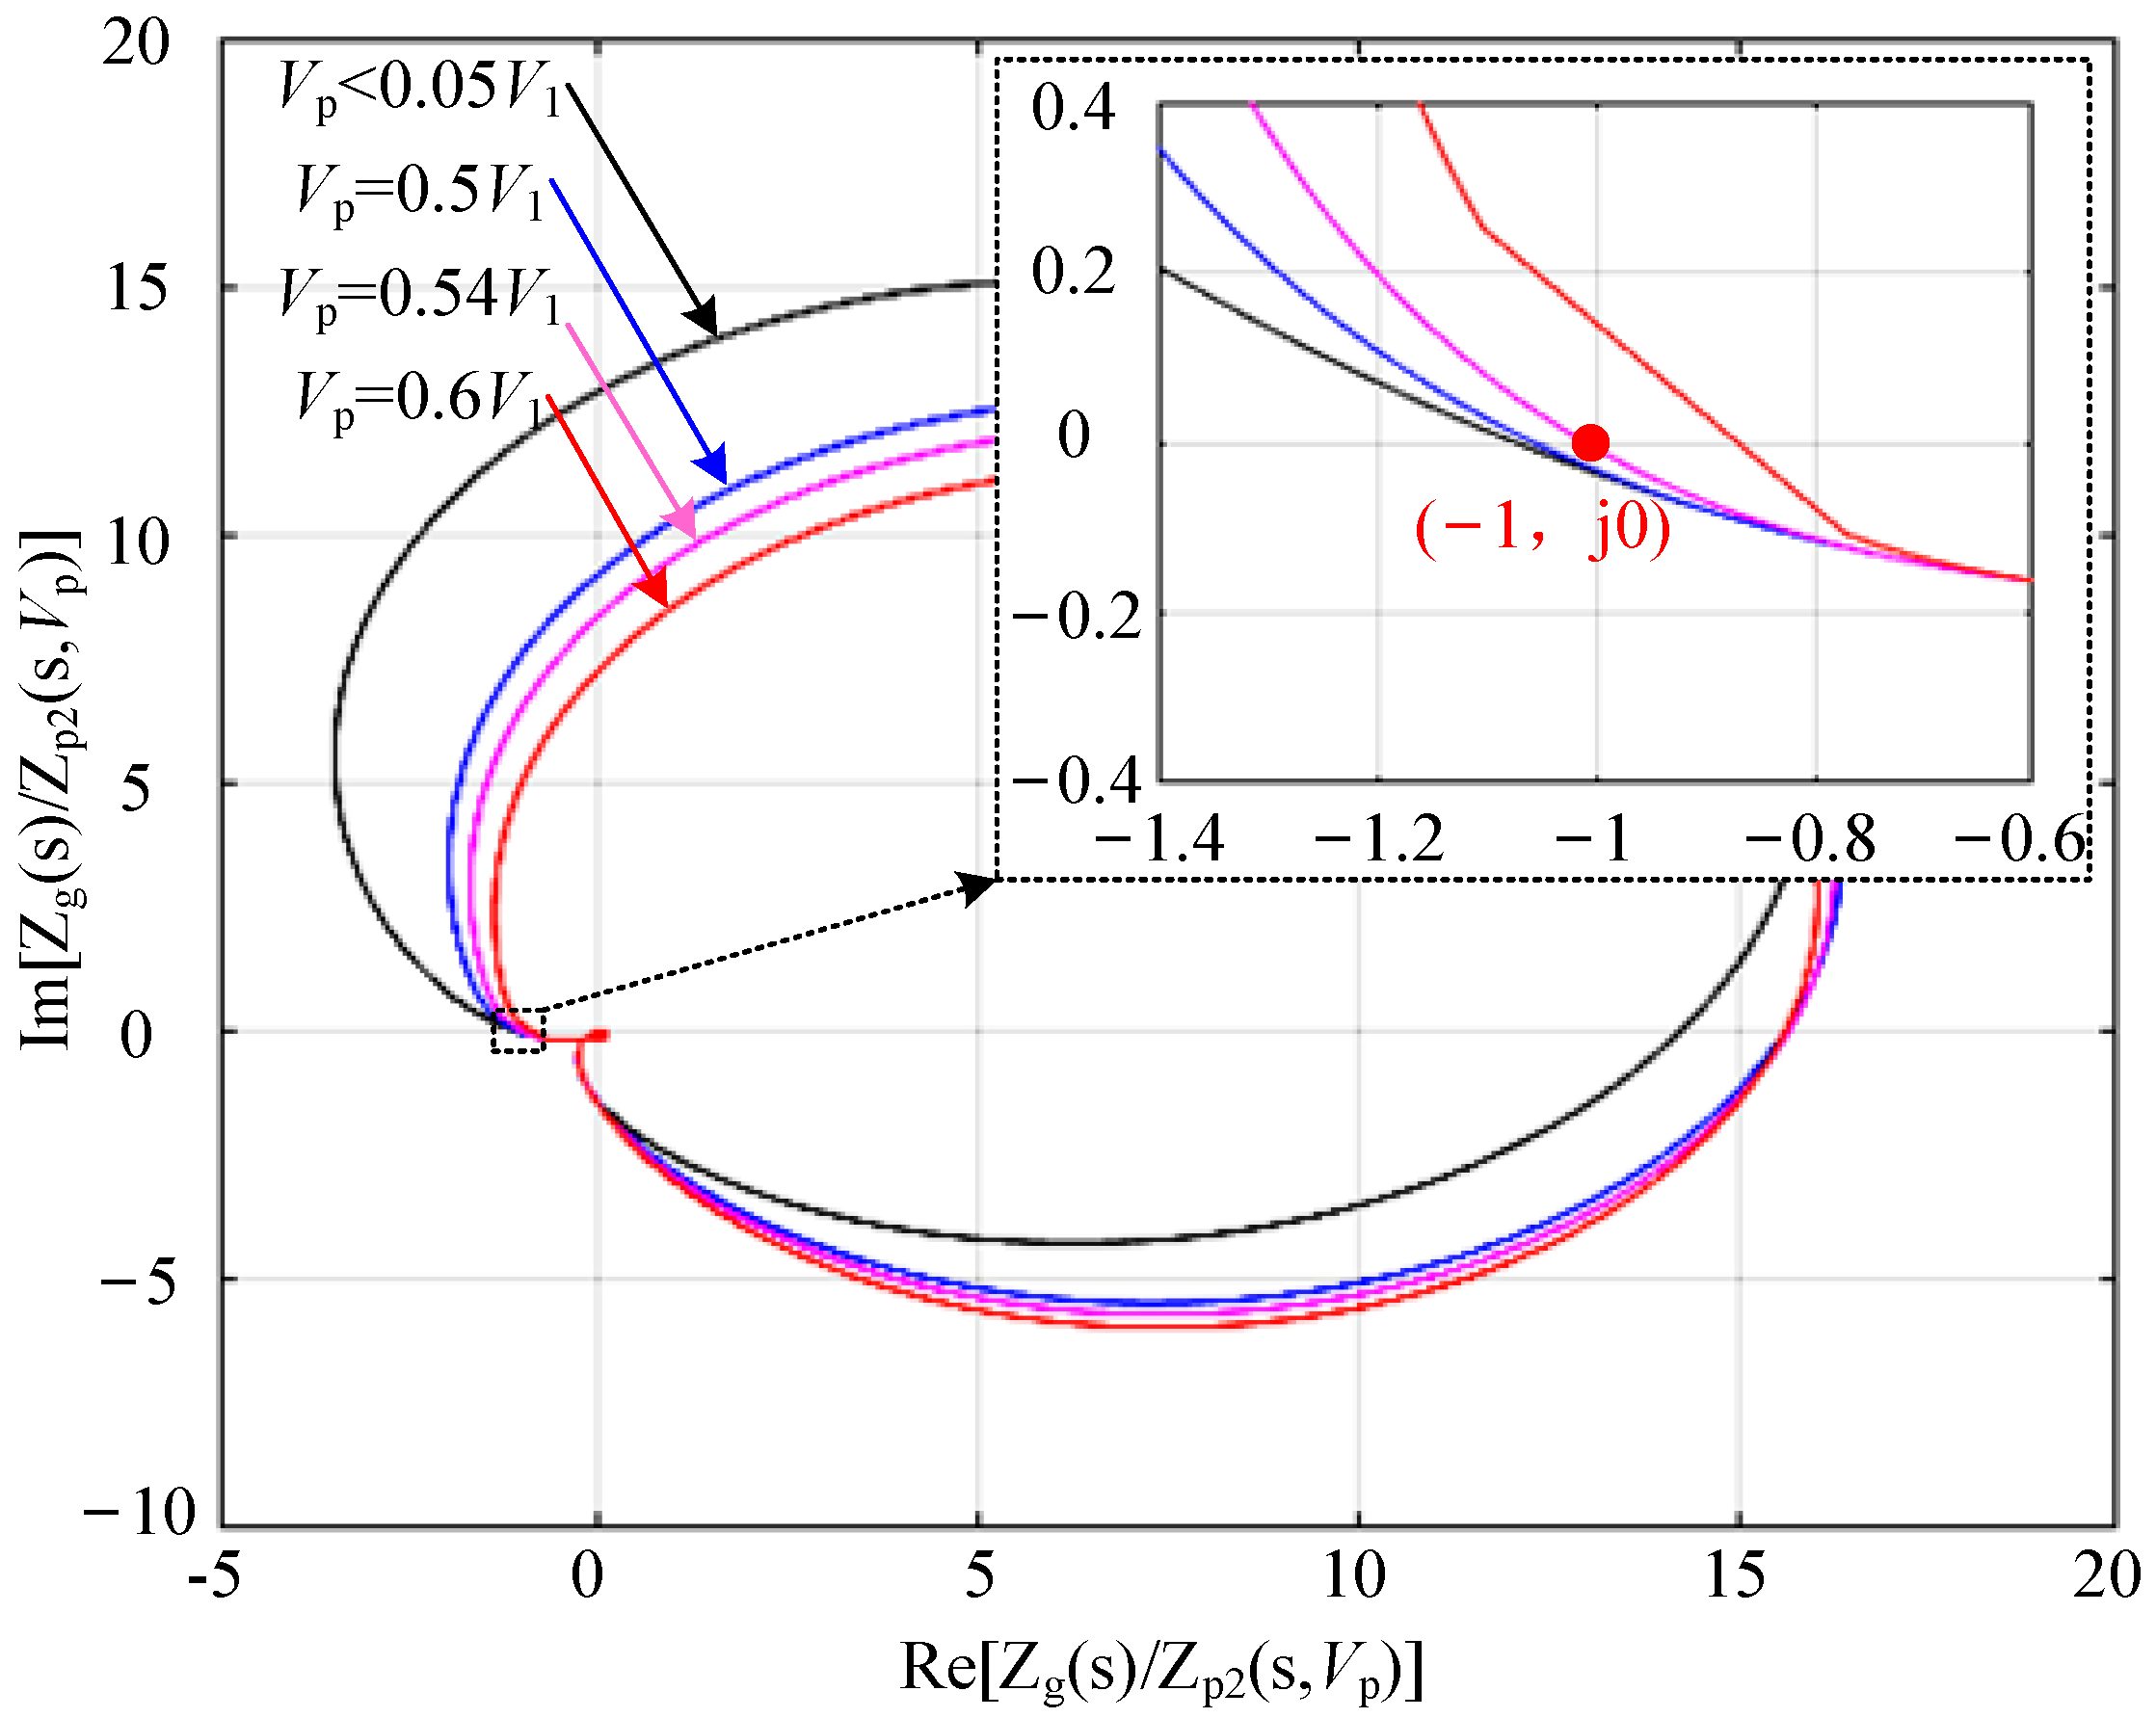
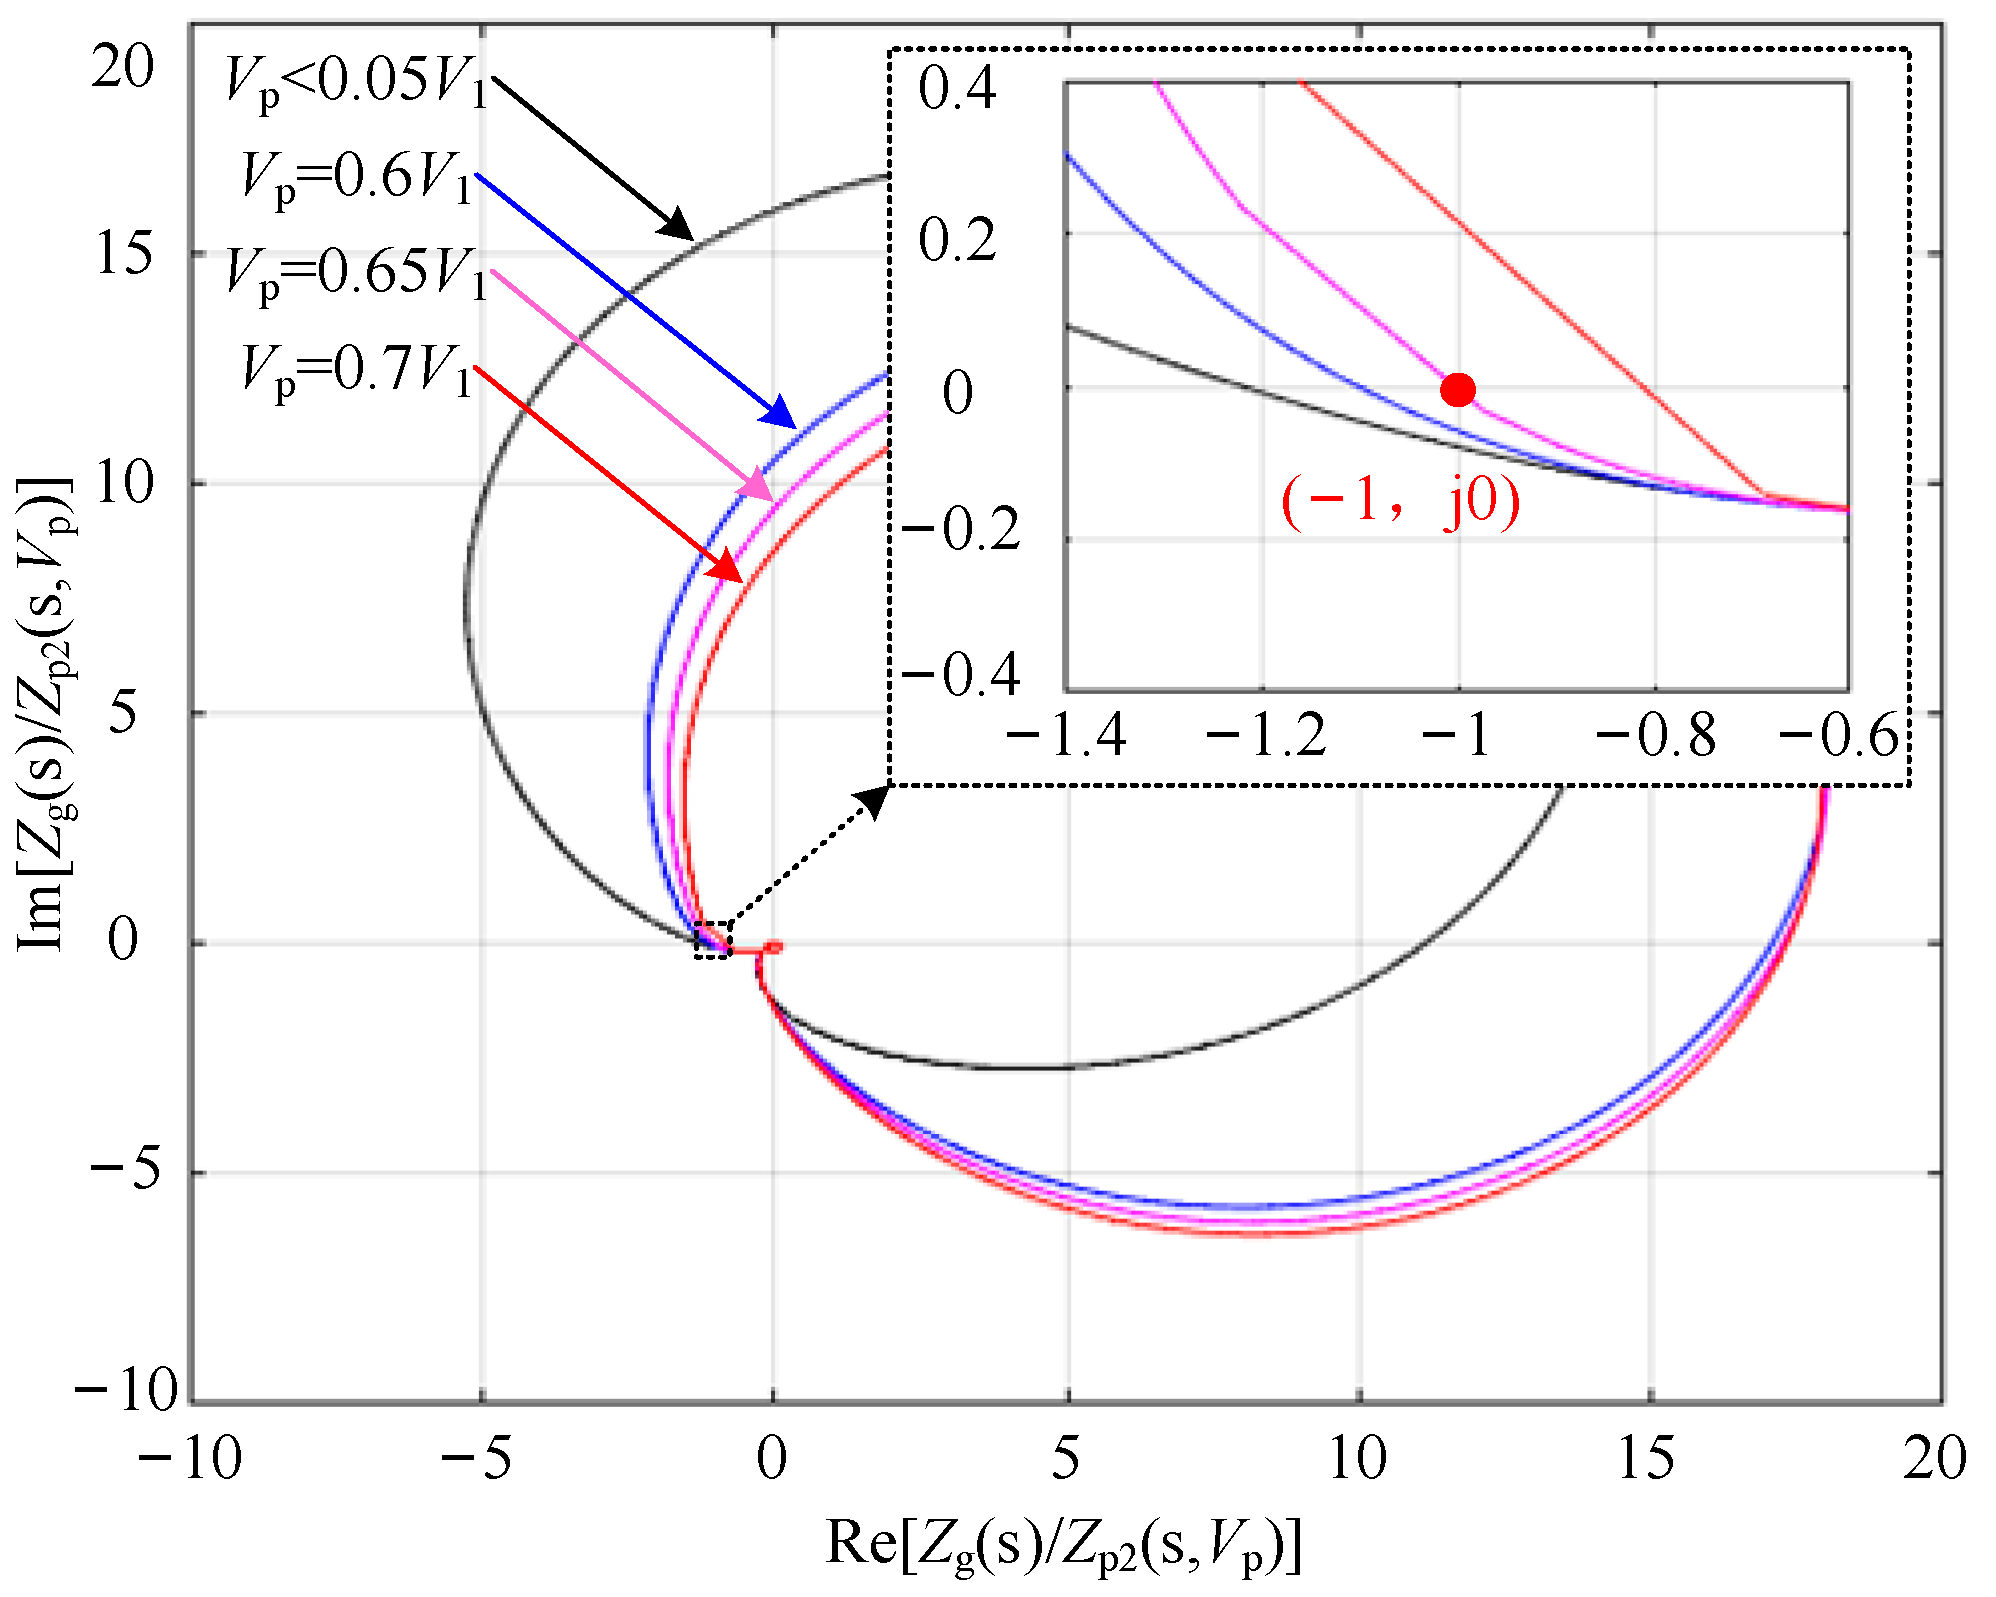
As the amplitude of the system disturbance increases, the Nyquist curve of Zg(s)/Zp2(s, Vp) considering the limiter in the current loop gradually moves away from the point (−1,j0), and the stability margin of the system increases. When the Nyquist curve just crosses the point (−1,j0), the system is critically stable, and the disturbance amplitude is basically consistent with the oscillation amplitude of the actual system.

Author Contributions

Conceptualization, X.C., J.W., X.L., Y.C. and Z.X.; Formal analysis, X.L. and Z.X.; Investigation, Y.L. and C.L.; Methodology, X.C., J.W., X.L., Y.C. and Z.X.; Resources, Y.L. and C.L.; Software, X.C., J.W. and F.X.; Validation, X.C., Y.C. and F.X.; Writing—original draft, X.C.; Writing—review and editing, J.W., X.L., Y.C., Z.X., F.X., Y.L. and C.L. All authors have read and agreed to the published version of the manuscript.

Funding

Project Supported by the Open Fund Program of the State Key Laboratory of Smart Grid Protection and Operation Control (SGNR0000KJJS2200306).

Data Availability Statement

Data are unavailable due to privacy or ethical restrictions.

Conflicts of Interest

The authors declare no conflict of interest.

References

  1. Wang, N.; Tang, J.; Shan, H.S.; Jia, H.Z.; Peng, R.L.; Zuo, L. Efficient Power Conversion Using a PV-PCM-TE System Based on a Long Time Delay Phase Change With Concentrating Heat. IEEE Trans. Power Electron. 2023, 38, 10729–10738. [Google Scholar] [CrossRef]
  2. Wen, B.; Dong, D.; Boroyevich, D.; Burgos, R.; Mattavelli, P.; Shen, Z. Impedance-Based Analysis of Grid-Synchronization Stability for Three-Phase Paralleled Converters. IEEE Trans. Power Electron. 2016, 31, 26–38. [Google Scholar] [CrossRef]
  3. Alawasa, K.M.; Mohamed, Y.A. A Simple Approach to Damp SSR in Series-Compensated Systems via Reshaping the Output Admittance of a Nearby VSC-Based System. IEEE Trans. Ind. Electron. 2015, 62, 2673–2682. [Google Scholar] [CrossRef]
  4. Liu, H.; Xie, X.; He, J.; Xu, T.; Yu, Z.; Wang, C.; Zhang, C. Subsynchronous Interaction Between Direct-Drive PMSG Based Wind Farms and Weak AC Networks. IEEE Trans. Power Syst. 2017, 32, 4708–4720. [Google Scholar] [CrossRef]
  5. Xu, Y.; Gu, Z.; Sun, K. Characterization of Subsynchronous Oscillation with Wind Farms Using Describing Function and Generalized Nyquist Criterion. IEEE Trans. Power Syst. 2020, 35, 2783–2793. [Google Scholar] [CrossRef]
  6. Shah, S.; Koralewicz, P.; Gevorgian, V.; Liu, H.; Fu, J. Impedance Methods for Analyzing Stability Impacts of Inverter-Based Resources: Stability Analysis Tools for Modern Power Systems. IEEE Electrif. Mag. 2021, 9, 53–65. [Google Scholar] [CrossRef]
  7. Sun, J. Impedance-Based Stability Criterion for Grid-Connected Inverters. IEEE Trans. Power Electron. 2011, 26, 3075–3078. [Google Scholar] [CrossRef]
  8. Yu, L.; Xu, L.; Zhu, J.; Li, R. Impedance Modelling and Stability Analysis of Diode-Rectifier based HVDC Connected Offshore Wind Farms. IEEE Trans. Power Deliv. 2022, 37, 591–602. [Google Scholar] [CrossRef]
  9. Guo, J.; Chen, Y.; Wang, L.; Wu, W.; Wang, X.; Shuai, Z.; Guerrero, J.M. Impedance Analysis and Stabilization of Virtual Synchronous Generators With Different DC-Link Voltage Controllers Under Weak Grid. IEEE Trans. Power Electron. 2021, 36, 11397–11408. [Google Scholar] [CrossRef]
  10. Golestan, S.; Ebrahimzadeh, E.; Wen, B.; Guerrero, J.M.; Vasquez, J.C. dq-Frame Impedance Modeling of Three-Phase Grid-Tied Voltage Source Converters Equipped with Advanced PLLs. IEEE Trans. Power Electron. 2021, 36, 3524–3539. [Google Scholar] [CrossRef]
  11. Guo, H. Sequence-Impedance Modeling of Voltage Source Converter Interconnection under Asymmetrical Grid Fault Conditions. IEEE Trans. Ind. Electron. 2021, 68, 1332–1341. [Google Scholar] [CrossRef]
  12. Zhang, H.; Liu, Z.; Wu, S.; Li, Z. Input Impedance Modeling and Verification of Single-Phase Voltage Source Converters Based on Harmonic Linearization. IEEE Trans. Power Electron. 2019, 34, 8544–8554. [Google Scholar] [CrossRef]
  13. Liu, Y.; Zhou, X.; Chen, Y.; Zhou, L.; Wang, L.; Wu, W. Sequence Impedance Modeling and Stability Analysis for Load Converters With Inertial Support. IEEE Trans. Power Electron. 2020, 35, 13031–13041. [Google Scholar] [CrossRef]
  14. Xu, L.; Xin, H.; Huang, L.; Yuan, H.; Ju, P.; Wu, D. Symmetric Admittance Modeling for Stability Analysis of Grid-Connected Converters. IEEE Trans. Energy Convers. 2020, 35, 434–444. [Google Scholar] [CrossRef]
  15. Xu, Y.; Chen, Y.; Wu, W.; Liao, S.; Wang, Z.; Luo, A.; Aziz, S.; Guerrero, J.M. Complex Circuit Modeling Methodology and Its Application to Depict Multifrequency Coupling Effect of Asymmetric Grid-Following Converter. IEEE J. Emerg. Sel. Top. Power Electron. 2023, 11, 1203–1218. [Google Scholar] [CrossRef]
  16. Shah, S.; Parsa, L. Impedance-Based Prediction of Distortions Generated by Resonance in Grid-Connected Converters. IEEE Trans. Energy Convers. 2019, 34, 1264–1275. [Google Scholar] [CrossRef]
  17. Li, Y.; Yang, J.; Wang, H.; Ge, W.; Ma, Y. Leveraging Hybrid Filter for Improving Quasi-Type-1 Phase Locked Loop Targeting Fast Transient Response. Energies 2018, 11, 2472. [Google Scholar] [CrossRef]
  18. Zhang, Z.; Schuerhuber, R. Impact of Reactive Current and Phase-Locked Loop on Converters in Grid Faults. Energies 2023, 16, 3122. [Google Scholar] [CrossRef]
  19. Quan, X.; Lin, X.; Zheng, Y.; Kang, Y. Transient Stability Analysis of Grid-Connected Converter Driven by Imbalance Power under Non-Severe Remote Voltage Sag. Energies 2021, 14, 1737. [Google Scholar] [CrossRef]
  20. Shah, S.; Parsa, L. Large-Signal Impedance for the Analysis of Sustained Resonance in Grid-Connected Converters. In Proceedings of the 2017 IEEE 18th Workshop on Control and Modeling for Power Electronics (COMPEL), Stanford, CA, USA, 9–12 July 2017; pp. 1–8. [Google Scholar] [CrossRef]
  21. Shah, S.; Koralewicz, P.; Gevorgian, V.; Wallen, R.; Jha, K.; Mashtare, D.; Burra, R.; Parsa, L. Large-Signal Impedance-Based Modeling and Mitigation of Resonance of Converter-Grid Systems. IEEE Trans. Sustain. Energy 2019, 10, 1439–1449. [Google Scholar] [CrossRef]
  22. Wu, T.; Jiang, Q. Nonlinear Impedance Modeling of Grid-tied Converters Governed by PWM Saturation. In Proceedings of the 2021 IEEE 2nd China International Youth Conference on Electrical Engineering (CIYCEE), Chengdu, China, 15–17 December 2021; pp. 1–5. [Google Scholar] [CrossRef]
  23. Wu, T.; Xie, X.; Jiang, Q.; Shen, Z. Impedance Modelling of Grid-Connected Voltage-Source Converters Considering the Saturation Non-linearity. IET Gener. Transm. Distrib. 2020, 14, 4815–4823. [Google Scholar] [CrossRef]
  24. Xia, Y.; Lv, Z.; Wei, W.; He, H. Large-Signal Stability Analysis and Control for Small-Scale AC Microgrids With Single Storage. IEEE J. Emerg. Sel. Top. Power Electron. 2022, 10, 4809–4820. [Google Scholar] [CrossRef]
  25. Wu, T.; Jiang, Q.; Shair, J.; Xie, X.; Wang, Y.; Luo, Y.; Mao, H. Quantitative Analysis of Sustained Oscillation Associated with Saturation Non-linearity in a Grid-Connected Voltage Source Converter. IET Renew. Power Gener. 2021, 15, 865–876. [Google Scholar] [CrossRef]
  26. Welford, G.D. Dual Input Describing Functions; Rep, no. RG-TR-69-16; U.S. Army Missile Command: Redstone Arsenal, AL, USA, 1969. [Google Scholar]
Figure 1. Structure and control diagram of the inverter grid-connected system.
Energies 16 06227 g001
Figure 2. Static characteristics of limiter.
Energies 16 06227 g002
Figure 3. The value of N(A) when K = 1.
Energies 16 06227 g003
Figure 4. Large-signal impedance response of the inverter considering the limiter in the PLL for different disturbance amplitudes.
Energies 16 06227 g004
Figure 5. Large-signal impedance response of the inverter considering the limiter in the PLL for different PLL bandwidths.
Energies 16 06227 g005
Figure 6. The large-signal impedance response of the inverter considering the limiter in the current loop for different disturbance amplitudes.
Energies 16 06227 g006
Figure 7. Large-signal impedance response of the inverter considering the limiter in the current loop for different current loop bandwidths.
Energies 16 06227 g007
Figure 8. The large-signal impedance response of the inverter considering the limiter in PWM for different disturbance amplitudes.
Energies 16 06227 g008
Figure 9. The small-signal impedance model and the large-signal impedance model considering different limiters.
Energies 16 06227 g009
Figure 10. Schematic diagram of the interaction between the inverter impedance and the grid impedance when the grid impedance is 5.7 mH and the current loop control bandwidth is 1190 Hz.
Energies 16 06227 g010
Figure 11. Nyquist plot of the impedance ratio Zg(s)/Zp2(s, Vp) for a grid impedance of 5.7 mH and a current loop control bandwidth of 1190 Hz.
Energies 16 06227 g011
Figure 12. The waveform and FFT analysis results of va when Lg is 5.7 mH.
Energies 16 06227 g012
Figure 13. Schematic diagram of the interaction between the inverter impedance and the grid impedance when the grid impedance is 6.7 mH and the current loop control bandwidth is 1290 Hz.
Energies 16 06227 g013
Figure 14. Nyquist plot of the impedance ratio Zg(s)/Zp2(s, Vp) for a grid impedance of 6.7 mH and a current loop control bandwidth of 1290 Hz.
Energies 16 06227 g014
Figure 15. The waveform and FFT analysis results of va when Lg is 6.7 mH.
Energies 16 06227 g015
Table 1. Comparison of the small-signal impedance model with the large-signal impedance model.
ComparisonThe Small-Signal ImpedanceThe Large-Signal Impedance
analyzing the stability of the system
predicting oscillation frequency
considering limiter
describing the impedance change as Vp changes
analyzing the dynamic properties of oscillations
predicting oscillation amplitude
Table 2. System parameters.
Parameters and UnitsValueParameters and UnitsValue
V1/V169.7Kp_I0.07
f1/Hz60Ki_I142.97
Lg/mH0Kd0.006
Rf/Ω3f/Hz10,000
Cf/μF5Kf1/250
Lf/mH4Idr/A15
Vdc/V500Iqr/A0
Km0.5imax and −imin0.2
Kp_PLL0.13PLLmax and −PLLmin10
Ki_PLL4.11PWMmax and −PWMmin1
Table 3. Large-signal impedance comparison of grid-connected inverter considering the influence of limiter in different control links.
Large-Signal ImpedanceZp1Zp2Zp3
The frequency component of the limiter inputfpf1fpf1f1 and fp
Limiter description functionN(A)N(A)NA1(A1,A2) and NA2(A1,A2)
Terms that are different from Zp0HPLL(s)NPLL(s)Hi(s)Ni(s)KmNMP(M1,MP)
The range of impedance characteristics affected Around sub/super-synchronous frequency bandAround middle and high frequency bandAround middle and high frequency band
Disclaimer/Publisher’s Note: The statements, opinions and data contained in all publications are solely those of the individual author(s) and contributor(s) and not of MDPI and/or the editor(s). MDPI and/or the editor(s) disclaim responsibility for any injury to people or property resulting from any ideas, methods, instructions or products referred to in the content.

