Article

Replacement Scenarios of LPG Boilers with Air-to-Water Heat Pumps for a Production Manufacturing Site

by
Alberta Carella
1,
Luca Del Ferraro
2 and
Annunziata D’Orazio
1,*
1
Department of Astronautical, Electrical and Energy Engineering, Sapienza University of Rome, Via Eudossiana 18, 00184 Rome, Italy
2
Daikin Applied Europe S.p.A., Via Piani di S. Maria 72, 00072 Ariccia, Italy
*
Author to whom correspondence should be addressed.
Energies 2023, 16(17), 6233; https://doi.org/10.3390/en16176233
Submission received: 11 July 2023 / Revised: 18 August 2023 / Accepted: 24 August 2023 / Published: 28 August 2023
(This article belongs to the Section J: Thermal Management)

Abstract

:
The replacement of LPG (liquefied petroleum gas) boilers with air-to-water heat pumps on an industrial site is proposed. The boilers are used to produce hot water for the heating of two workshops and for the manufacturing process (test benches). The substitution aims to improve the local air quality in terms of pollutant emissions. The energy benefits in terms of reduction of primary energy and CO2 emissions are analysed. The reduction in primary energy consumption varies between 51% and 64% for two different scenarios that are evaluated, respectively, under design and real operating conditions; the latter is based on the trend in heat loads and outdoor air temperatures recorded in a small town of central Italy in the year 2022. The results also show a decrease in CO2 production of between 58% and 68%. This replacement, carried out in a manufacturing context, represents a case study that may also be applied to industrial suburban areas of cities.

1. Introduction

Under the Green Deal [1], the European Commission has increased the EU’s climate change targets for 2030, raising the target for net reduction of greenhouse gas emissions to −55% by 2030 compared to 1990 levels, with the aim of becoming “carbon neutral” by 2050. Currently, residential and commercial buildings account for 36% of global final energy use (mainly associated with heating and cooling) [2]. In particular, heating accounts for over 36% of total greenhouse gas emissions in Europe [3], over 29% in the US [4], and 30–50% in China [5].
A previous study by Carella et al. [6] recorded a significant contribution to the concentration of pollutants in urban areas due to fuel-fired heating systems. The decarbonisation potential of heating systems lies in the use of renewable technologies such as heat pumps. Particularly, significant progress made by many countries, including Italy, in decarbonizing their electricity production over the last decade (39.4% of electricity generated from renewable sources in 2021) [7] supports the use of these systems. Recent literature has largely focused on the energy and economic analysis of small-capacity and low-temperature heat pumps (HPs) in the residential sector, often in combination with other systems. Minuto et al. [8] studied the centralized use of air-to-water HPs for a condominium in north-western Italy to assess different retrofit scenarios. The use of heat pumps contributed to the reduction of total primary energy demand and CO2 emissions by 26% and 30%, respectively. The authors highlighted the important role of a storage system to mitigate the negative effects of the intermittent nature of the PV system. Jadwiszczak et al. [9] examined the case of low temperature HPs for heating and hot water production. Their research highlighted the dependence of the CO2 emissions on the energy mix (55.2%), COP (33.9%), and climate change (10.9%). A study by Carella et al. [10] presented the impact of replacing existing boilers for space heating and domestic hot water (DHW) production with high-temperature air-to-water HPs in two different Italian cities. Their results showed that the reduction of primary energy consumption varied between 34% and 60% for two values of renewable fraction in electricity generation (REN). The reduction of CO2 production was in the range of 30% to 58%.
The industrial and commercial sector is a major consumer of energy, both for heating/cooling and electricity needs. This consumption is generally associated with massive use of fossil fuels, with significant greenhouse gas emissions and a significant contribution to pollutant concentrations. In the commercial sector, office and retail buildings have the highest consumption, in a range of 200 to 300 kWh/m2 per year; a significant part (about 40–50%) of the energy consumed is used for heating, ventilation, and air conditioning (HVAC) [11]. The use of large HPs in the tertiary sector and in non-residential buildings, such as public buildings, plays an important role in contributing to sustainability and decarbonisation goals. Gradziuk et al. [12] analysed HP installations in eight municipal buildings and claimed that the switch to HPs reduced local air pollution by eliminating the burning of fossil fuels to heat public buildings.
The performance of HP technologies is strongly influenced by the outside air temperature and the load regime (full or partial load, e.g., below the maximum rated capacity). Many scientific papers have studied seasonal efficiency in relation to different environmental temperatures and partial load regimes [13,14]. Mouzeviris and Papakostas [15] studied the effects of climate conditions as regards Greece. Their work consisted of evaluating the seasonal coefficient of performance (SCOP) of 100 different air source HPs (ASHPs) from 12 manufacturers. They concluded that seasonal performance is influenced by the heating capacity, the local climate, the outlet water temperature, the compressor’s technology, and the control system. Rossi di Schio et al. [16] considered two types of HPs: on–off and inverter-driven variable speed compressors. Their results show that inverter heat pumps perform better than on–off heat pumps.
Regarding operating conditions, HPs are required to operate at full load only for a limited period during the heating season. For a correct assessment of the seasonal performance of HPs, it is therefore important to consider their behaviour at partial loads.
The purpose of our study in the case of a manufacturing site was to assess whether the decision to replace boilers with large heat pumps, with the aim of eliminating local combustion emissions, would have energy disadvantages in terms of primary energy consumption and CO2 production, or economic disadvantages (in terms of payback period). Our study focuses on a case of replacement of LPG (liquefied petroleum gas) boilers with air-to-water HPs. The boilers were installed in an industrial site in the town of Cecchina, in a region of Central Italy. They had a total capacity of about 2 MW and were used to produce hot water for the manufacturing process (test benches) and to heat two workshops. Based on the analysis of the monthly LPG consumption for the year 2022, the most suitable system was selected to replace the existing boilers, guaranteeing the thermal load even in the most unfavourable outdoor air temperature conditions (design conditions). An accurate assessment of the monthly machine performance in terms of COP was conducted, depending on the outside temperature and the required heat output. Replacement scenarios were analysed for an outdoor temperature equal to the design temperature and for the case of real operating conditions; the latter was based on the evolution of heat loads and outdoor air temperatures recorded in the Italian city in 2022. Even allowing for some approximations and working assumptions, the substitution confirmed a significant reduction in primary energy consumption and CO2 emissions. The positive impact in terms of avoiding local pollutant emissions was assessed and some considerations regarding public economic support for the investment were reported. This replacement, carried out in a manufacturing context, represents a case study that can also be applied to industrial suburban areas of cities.

2. Materials and Methods

The purpose of the analysis in the case of a manufacturing site was to assess whether the decision to replace boilers with large heat pumps, with the aim of eliminating local combustion emissions, would have energy disadvantages in terms of primary energy consumption and CO2 production, or economic disadvantages (in terms of payback period).
An evaluation of the scenarios was carried out according to the following steps:
(1)
Selection of the HP from the design conditions
(2)
Evaluation of primary energy consumption and CO2 production for the boilers and the HP.
Regarding (1), it was necessary to know the thermal demand of the industrial process and the dispersion of the building (under design conditions). The latter conditions are not known (envelope transmittance and surfaces are not known). They are therefore derived from fuel consumption and outside air temperatures. This procedure is better detailed in the flowchart of Figure 1.

2.1. Description of the Case Study

The production site is in the town of Cecchina, which is part of Ariccia, an Italian municipality in the metropolitan area of Rome. It is characterized by an altitude of 412 m and an outdoor design temperature of −2.67 °C [17].
The boilers to be replaced are 1027 kW and 980 kW, respectively, and are used to produce hot water for the heating of two workshops and the test benches. The efficiencies η at the nominal load of the two boilers, as given in the manufacturer’s data sheets, are 95.4% and 92.3%, respectively. For the evaluation scenarios, an average boiler efficiency equal to 94% was considered. The setpoint for the outlet water temperature is 60 °C, with a temperature rise of 10 K at steady state, resulting from resulting from the experimental data of the temperature probes. This set point is related to the water temperatures required for the test benches during daily operation and to the water temperatures of the fan coils used to heat the two workshops, which are located at a height of about 3.5 m.
The experimental tests concern the development of chiller prototypes. The activities of the test benches are essentially related to cooling tests at the evaporator, using water entering at 12 °C and leaving at 7 °C as measured by the temperature sensors. The 12 °C tempered water for the test circuit is obtained from the boilers, which operate between 50 °C and 60 °C, by means of a plate heat exchanger and a three-way valve capable of adjusting the flow rate and controlling the temperature of the water, as shown in Figure 2. The thermal power required for the test was evaluated as described below.
For space heating, the water enters the fan coils at 50 °C, with an output temperature of 44 °C (as measured by the temperature sensors). The 50 °C tempered water for the fan coil circuit is obtained by means of a three-way valve from the boilers, which operate between 50 °C and 60 °C.
To select the appropriate HP based on the design outdoor temperature and thermal load, the global heat transfer coefficient, K, of the building must be taken into account. Since the value of the coefficient K for the manufacturing building was unknown, and since it would have been difficult to obtain details of the thermophysical characteristics of the construction (transmittance H and surfaces S), it was necessary to extract information on K = HS from the available data (power and temperature profiles).

2.2. Evaluation of the Monthly Heat Load and Temperature Profiles

To evaluate the monthly heat demand, the monthly consumption in m3 of LPG for the year 2022 was considered. These data were obtained by determining the difference between the boiler meter readings taken regularly at the beginning and end of each month. To calculate its equivalent in liquid litres (necessary to evaluate the thermal needs in kWh passing for the lower calorific value of LPG expressed in kWh/L), it should be noted that LPG is a mixture of different components, composed mainly of propane and butane. Its specific weight (per unit volume) varies according to both the percentage of the mixture’s composition and its state condition. Under normal conditions of temperature and pressure, LPG in its liquid state weighs about 0.52 kg/L, whereas in its gaseous state it has a specific weight of about 2 kg/m3. To convert the volumetric consumption of gas into the volumetric consumption of liquid, the gas density is divided by the liquid density, resulting in approximately 3.8 litres of LPG per cubic meter of gas. The resulting monthly LPG consumption in litres is shown in Table 1.
To define the monthly heat load profile related to the boiler consumption, the heat demand HD in kWh for each month was obtained by multiplying the consumption in liquid litres by the lower calorific value of LPG expressed in kWh/L, equal to 6.6 kWh/L, and by the boiler efficiency (0.94).
With regard to the operating time of the boilers, the following daily time slots were considered: Monday to Friday from 5 am to 9:30 pm for a total of 16.5 h per day, and Saturday from 6 am to 1 pm for a total of 7 h per day. It was possible, knowing the number and type of days for each month, to calculate the total number of hours per month during which the boilers were switched on.
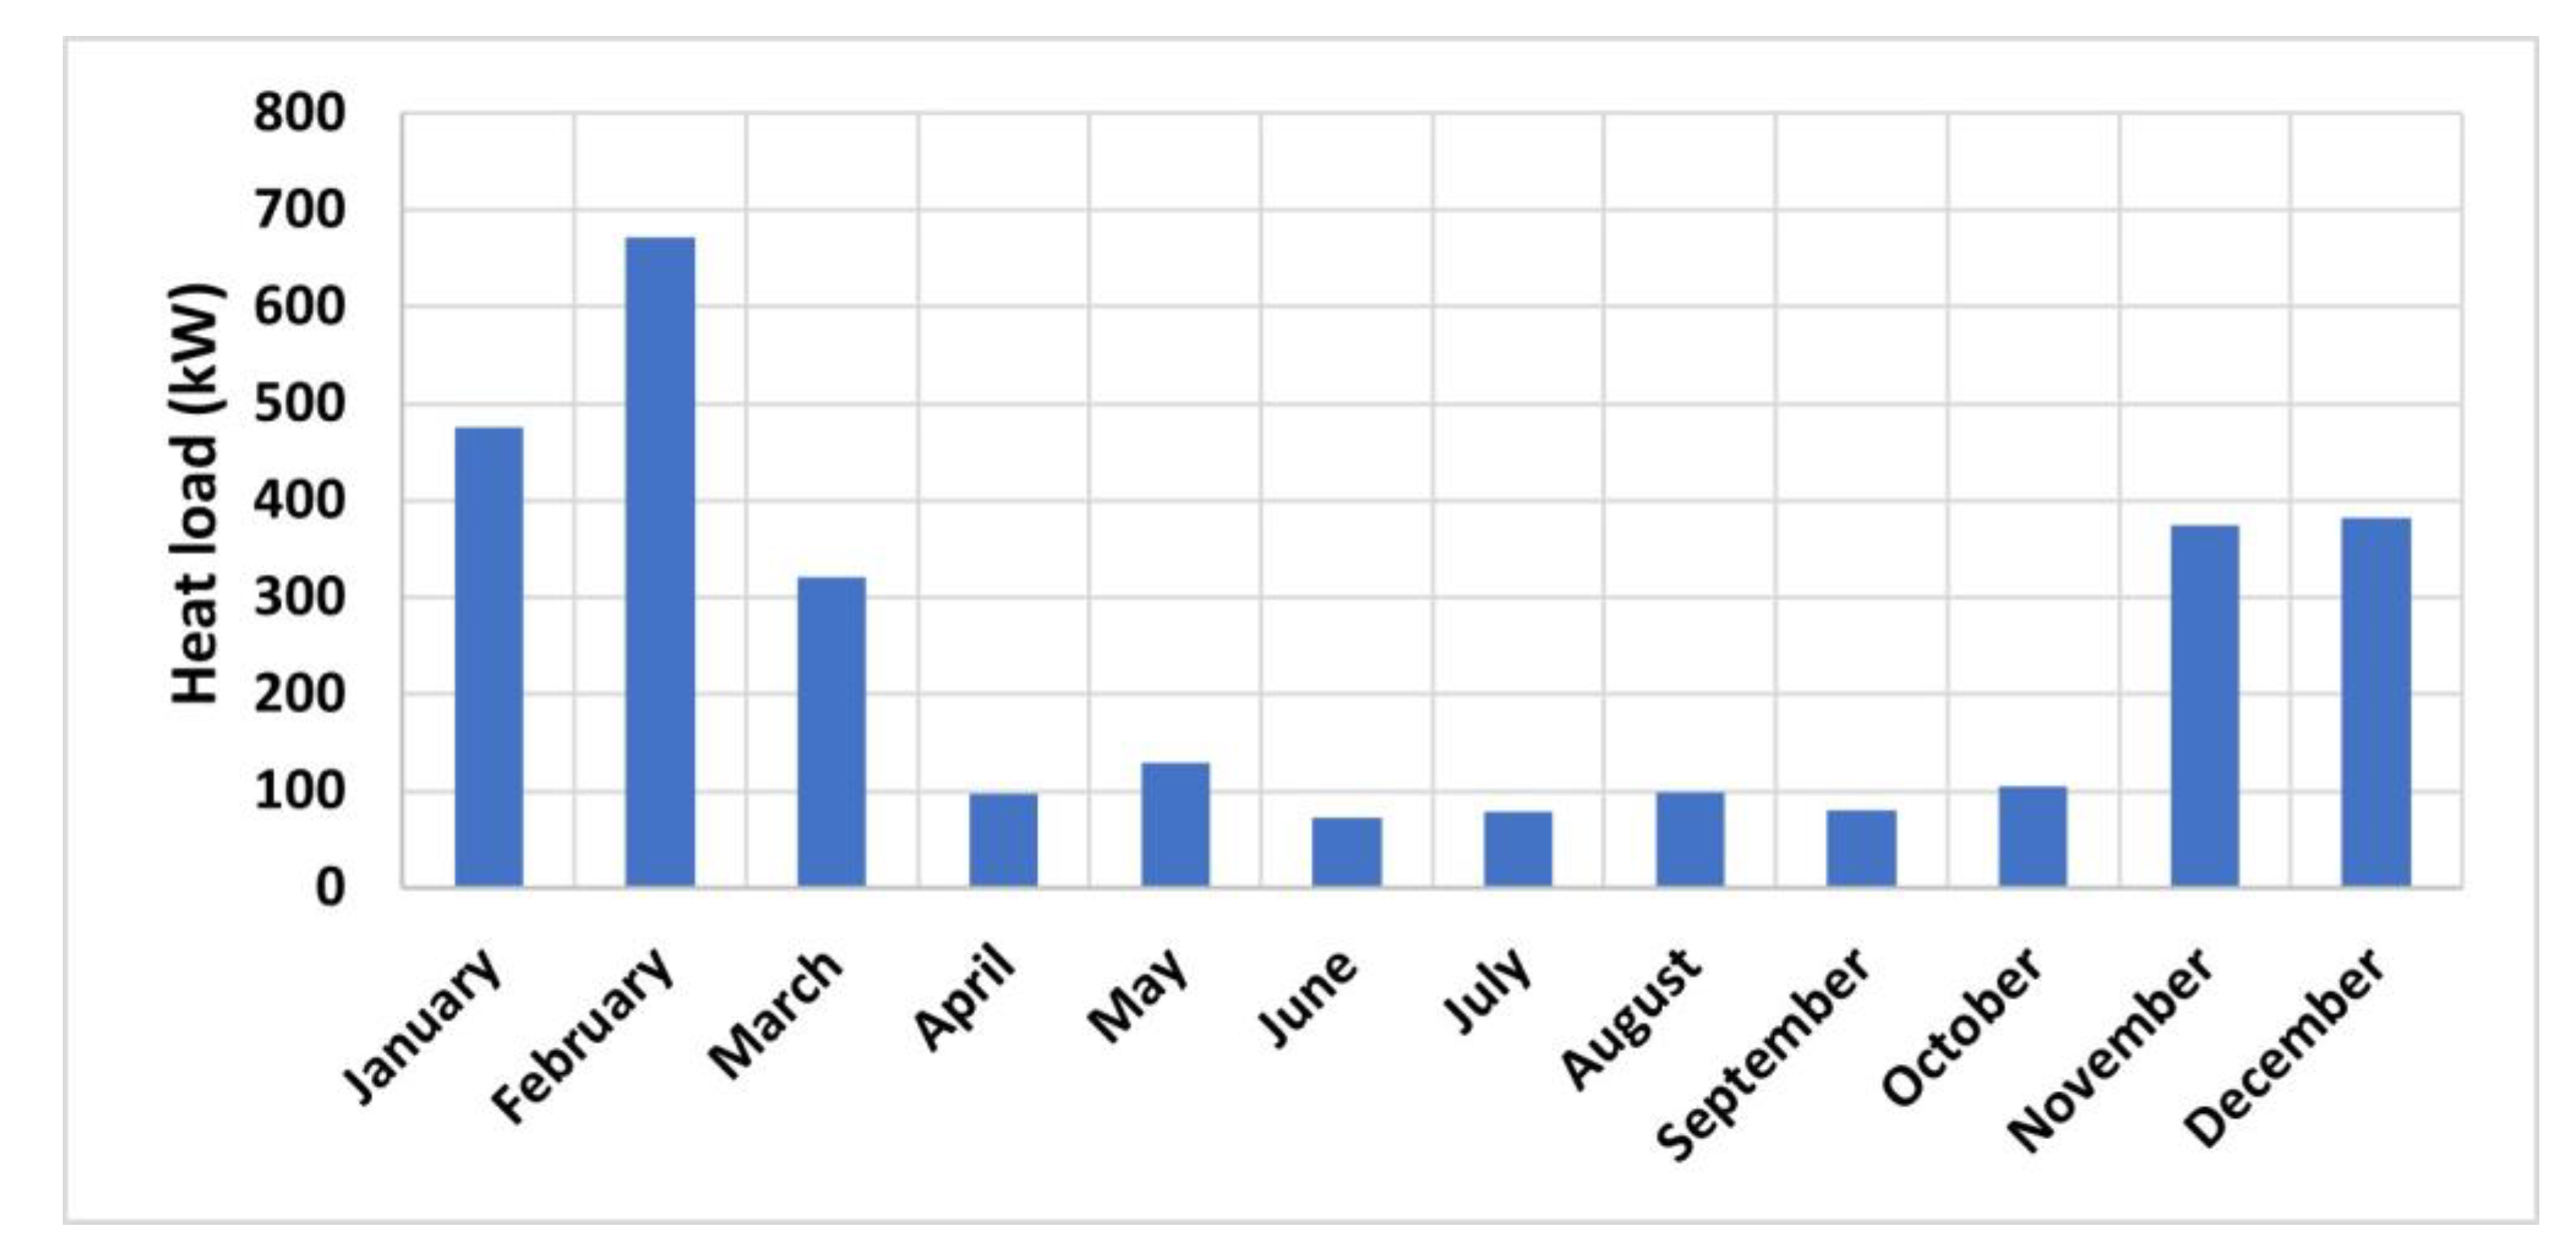
Finally, the heat consumption for each month was divided by the monthly operating hours to obtain the monthly heat load in kW. The results are shown in Figure 3.
From the thermal load trend, it can be observed that the winter months, when the boilers provide hot water for the test benches and space heating, are the months with the highest heat load. In particular, the highest thermal demand occurs during February, which amounts to consumption of 672 kW. During the months when the heating is switched off (from 15 April to 31 October), a fairly constant heat load of around 94 kW is observed.
Concerning the average monthly outdoor temperatures of the town of Cecchina, available daily data for the year 2022 were used [18]. The temperature profile, corresponding to the actual consumption, is shown in Figure 4.

2.3. Selection of the Suitable Heat Pump

The choice of the HP system suitable to replace the current LPG boilers must be done according to UNI EN 12831:2008 [19], based on the thermal load of the building at the design condition temperature, which is equal to −2.67 °C for the municipality of Ariccia, where Cecchina is located.
In particular, as a first approximation disregarding the ventilation heat loss and the additional heating power in intermittently heated rooms (recovery heat load), the heating heat load, P, in kW for each month was assumed to be equal to the transmission heat loss, calculated as follows (1):
P = K · (ti − te)
where K is the global heat transfer coefficient in W/K, ti is the desired temperature in the room (20 °C), and te is the designed outdoor temperature.
As already mentioned, the value of the global heat transfer coefficient for the manufacturing building was not known, and it would have been difficult to obtain details of the thermophysical characteristics of the building (transmittance H and surfaces S). It was therefore necessary to extract information on the global exchange coefficient K = HS from the available data (power and temperature profiles).
It should be noted that LPG consumption during the heating period (1 November to 15 April) also includes the consumption of hot water for the test benches. In order to assess the contribution of heating alone, the contribution of the test benches (Figure 3) was removed from the overall heat load and the heat load profile for the space heating was thus obtained by difference.
The overall heat transfer coefficient, K, was derived by dividing each heat load in kW by the corresponding (ti − te) of Figure 4 for each heating month. It is worth noting that the month of February was excluded from the evaluation, as it differed substantially from the others, probably due to the higher consumption of the test benches. The obtained values show a maximum relative error compared to the average value of 32%. To avoid undersizing, the worst conditions were considered and the maximum value was chosen rather than the average one.
From this, by taking the value of the external temperature at design conditions te (−2.67 °C), it was possible to obtain an approximate value of the thermal load in kW at design conditions related to the space heating equal to 983 kW. The total heat power, which the system must be able to provide for space heating and hot water production for the test benches under the design conditions, was therefore equal to 1077 kW.
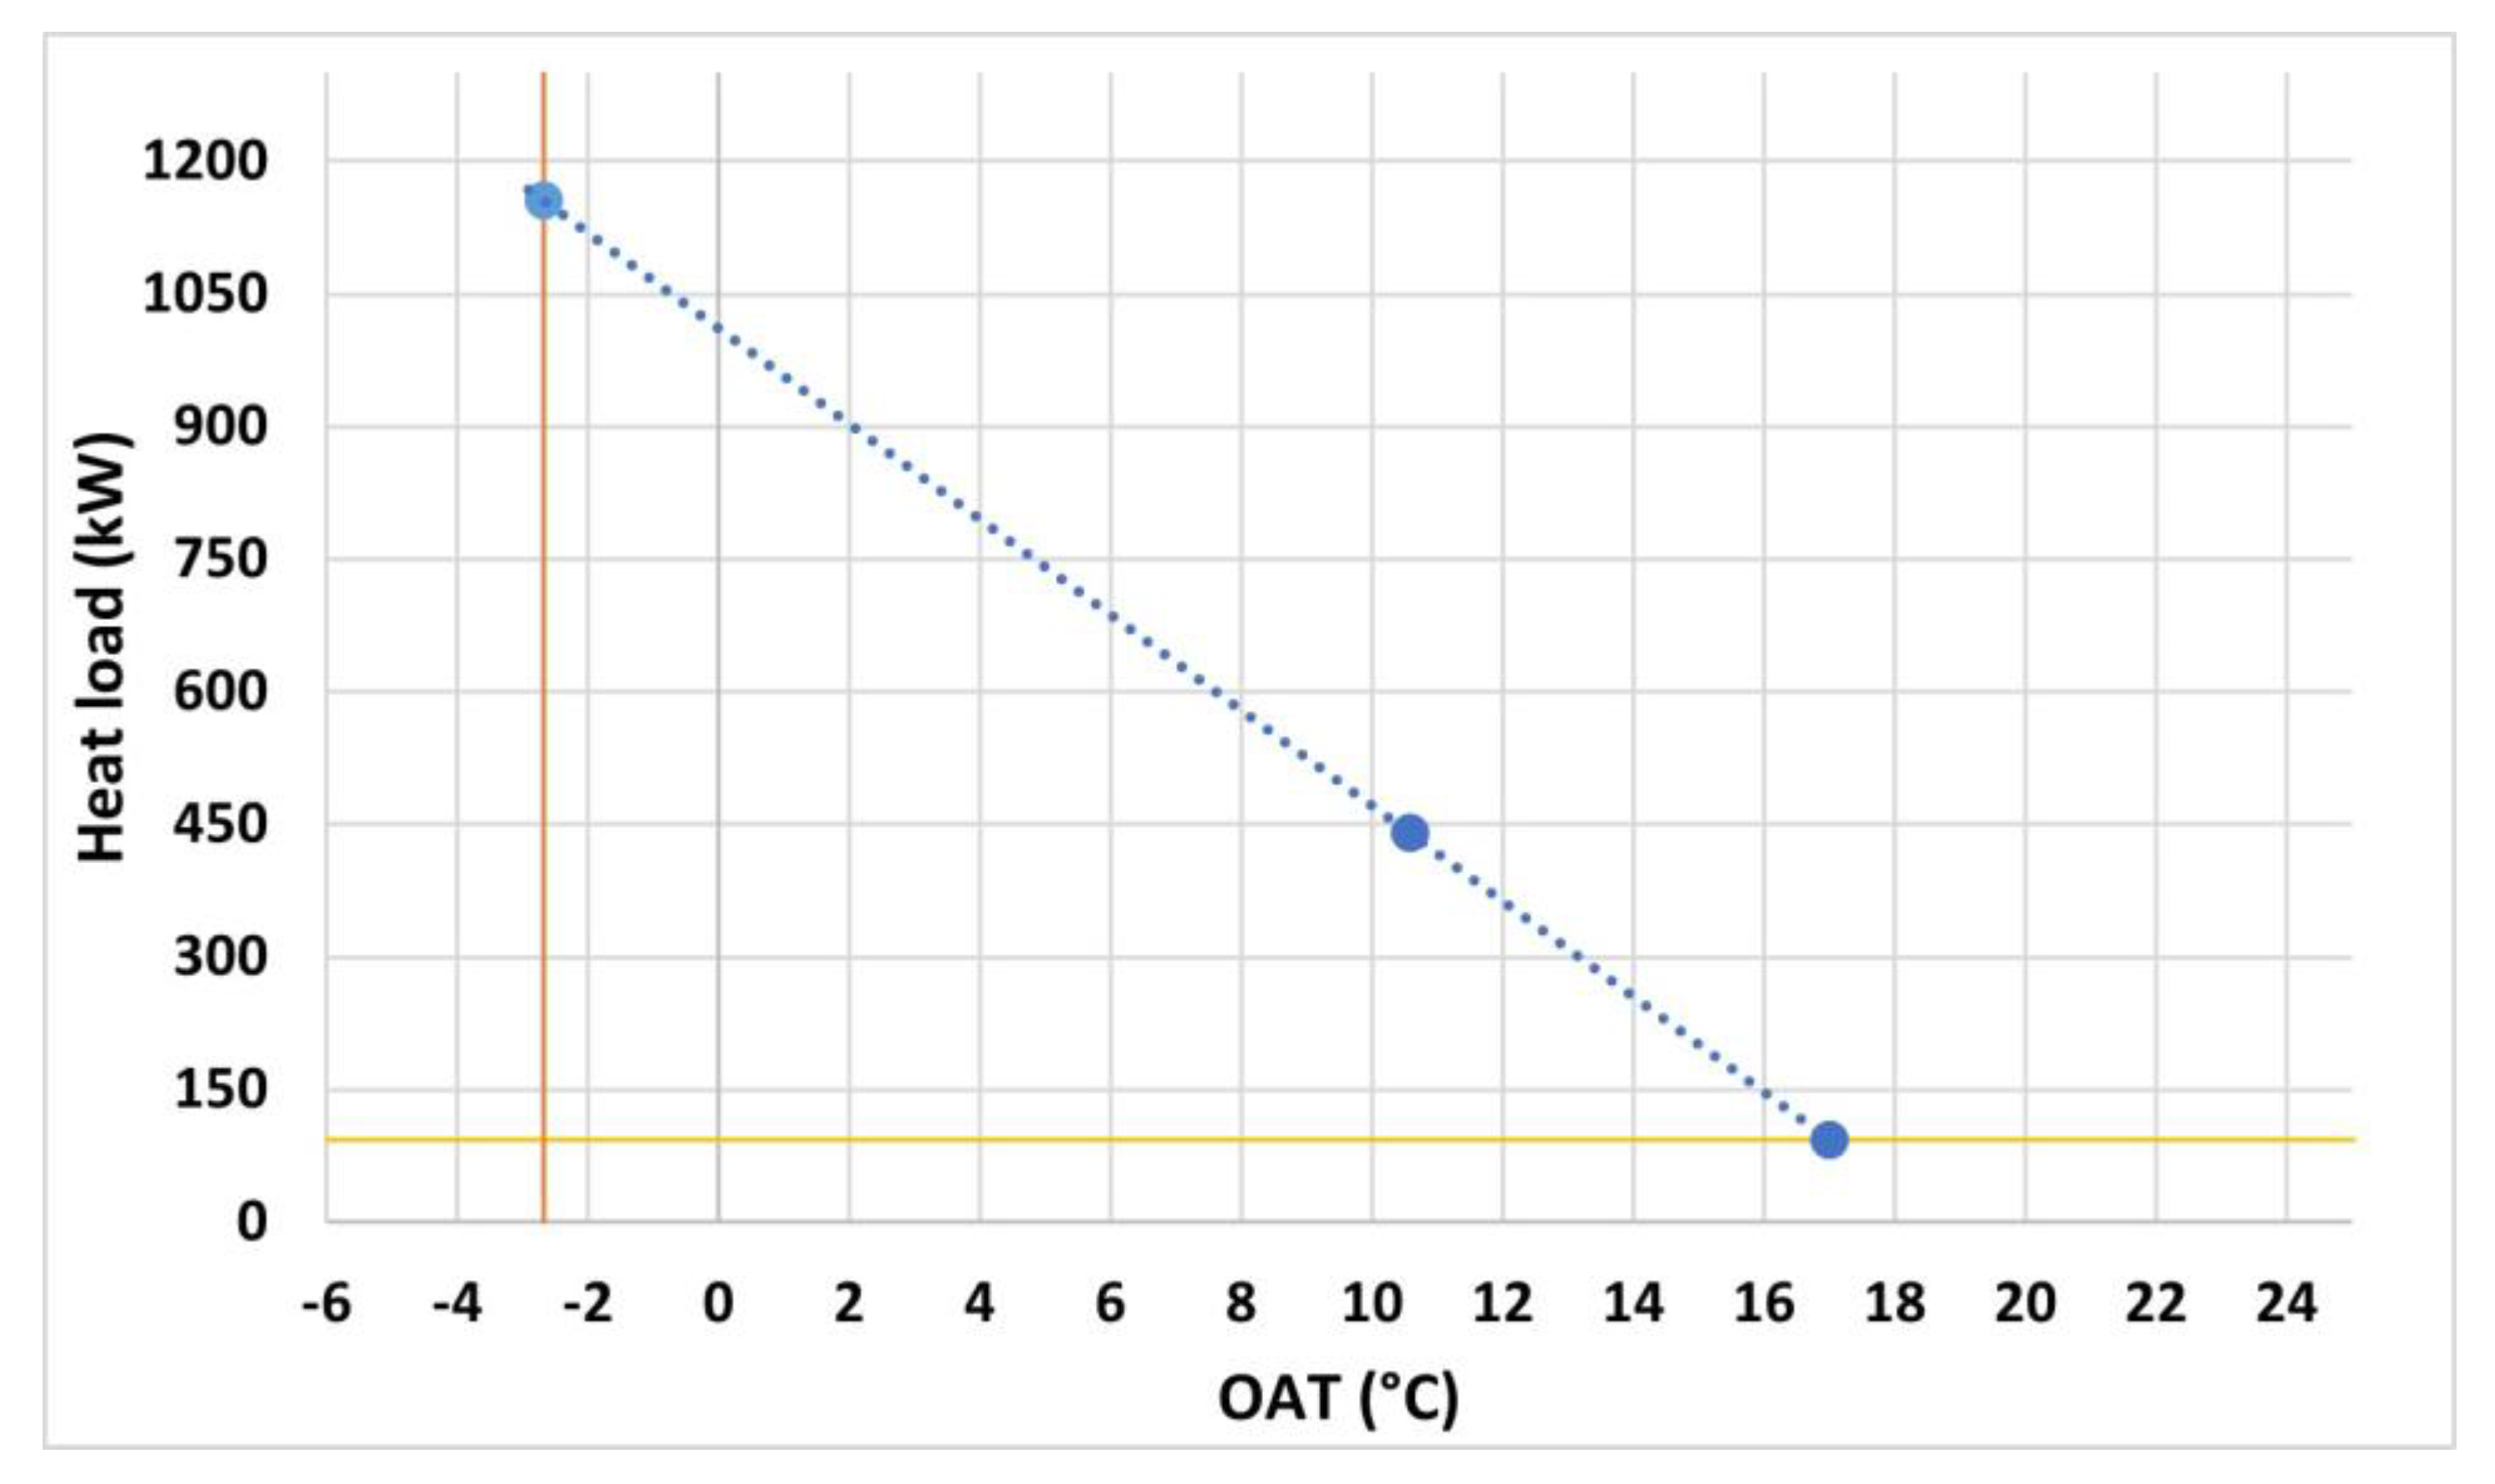
A similar result can be obtained using the graphical method of the simplified energy signature [20], which relates the heat load in kW to the outside air temperature (OAT) in °C. Specifically, a line is drawn from two specific points and any value of heat load can be obtained. The points are the following.
(1)
The first point is (17 °C; 0 kW), at which point generally the free thermal inputs cancel out the power requirement for space heating of most buildings, with the indoor temperature being equal to 20 °C.
(2)
The second point (10.6 °C; 440 kW) is given by the average seasonal temperature and the average seasonal power use during the heating period; the average seasonal power can be deduced as the ratio between the seasonal fuel consumption, expressed in kWh, and the heating period, expressed in hours.
In this case study, as the system also provides hot water for test benches, the first point of the simplified signature has been selected as (17 °C; 94 kW), as shown in Figure 5, recalling that the average thermal power used for hot water production is equal to 94 kW (shown in yellow).
The heat load for sizing the generator is obtained from the external design temperature of −2.67 °C for the town of Ariccia and it results in about 1100 kW as shown in Figure 5, which differs by 5% from the value calculated by the previous method. The selection of the appropriate nominal size for the HP was made based on the maximum thermal load in kW (equal to 1077 kW), taking into account that the HP must operate at the design outdoor temperature of −2.67 °C.
To supply the high heat load, three air-to-water heat pumps were selected from a manufacturer’s catalogue, each capable of providing one-third of the required heat output, approximately 359 kW under design conditions (−2.67 °C) and for an outlet water temperature of 50 °C. It should be noted that there is no single heat pump on the market with the required capacity, which could cause some logistical difficulties. It should also be noted that the value of water temperature is the one at which the fan coils operate in the manufacturing building (at present ensured by the boilers with a three-way valve), and it ensures the correct operation of the test benches by means of plate exchangers and three-way valve.
Each of the HPs selected in this study had four hermetic orbiting scroll compressors and used R32 refrigerant, which has a low global warming potential (GWP) compared to standard refrigerants, and offers good performance in terms of energy efficiency and CO2 emissions [21]. It was equipped with a Variable Frequency Driver (VFD) fan speed control, to ensure modulation of the supplied load with maximum efficiency and a low noise level. The control logic is designed to provide maximum efficiency, to continue operation in unusual working conditions, and to archive the history of unit operation. The embedded software uses adaptive logic to select the most energy-efficient combination of compressor load, electronic expansion valve position, and fan speed to maintain stable operating conditions and maximize chiller efficiency and reliability.
At nominal conditions, for an outdoor temperature of 7 °C and an outlet water temperature of 45 °C, the heating capacity, COP, and SCOP are 443.9 kW, 3.47, and 3.91, respectively. Below, we describe the details of the performance under different operating conditions.

3. Results

The impact in terms of primary energy consumed (PEC) and tons of CO2 produced (TP), was evaluated for two different scenarios. In the following evaluations, the distribution losses in the electricity grid (EL) were 8% and the efficiency of the conversion from fossil fuel to electricity (FEC) was 48% [7]; thus, results for the boilers were as follows (2):
P E C = H D η
and for the heat pumps (3):
P E C = H D C O P 1 + E L 1 R E N F E C
To assess the CO2 emissions from the combustion of LPG in boilers, the coefficient from the United Nations Framework Convention on Climate Change (UNFCCC) national inventory of CO2 emission coefficients [22] was used, which is 3.026 tCO2/tGPL; in this case, TP = 3.026 × tGPL. The useful coefficient to compute the CO2 emissions related to the production of the electricity supplying the heat pumps was given in a report on emissions from the electricity sector by the Italian Institute for Environmental Protection and Research (ISPRA) [7] and is equal to 260.5 gCO2/kWh; thus, TP = 260.5 × 10⁻⁶ × HD × (1 + EL)/COP. This value includes electricity generation from renewable sources, which currently stands at 39.4% (based on data from 2021) [7].
The first comparison was made regarding design conditions, for an outdoor air temperature of −2.67 °C and an outlet water temperature supplied by the HPs equal to 50 °C; in these conditions the heat pumps operating together are three. for three HPs operating together. As mentioned above, the efficiencies of the existing boilers were taken from the manufacturer’s data sheets, and an average boiler efficiency equal to 94% was considered in the evaluation scenarios. The COP of the heat pump under design conditions, obtained from the manufacturer’s data using commercial selection software, is equal to 2.56, while at nominal conditions (for an outdoor air temperature of 7 °C and an outlet water temperature of 45 °C), the COP value is 3.47. The low value of the COP of the heat pump under design conditions was used to represent the cold months. To represent was used in case of the cold months. In the case of the warm months, for which the thermal requirements are related only to the test benches, the COP value related to the lowest outdoor temperature, registered in April, was used to depict the worst-case scenario (COP = 3.60). The COP behaviour as a function of the cold (and hot) source temperatures is given by the manufacturer by linear interpolation of the values of the second thermodynamic principle efficiency ηII calculated from known data [23]. At design and nominal conditions, the Carnot efficiencies are 6.14 and 8.37, respectively.
The second scenario refers to the previously mentioned operating conditions in terms of heat load and average outdoor temperatures that occurred at the manufacturing building in 2022. In this case, the outlet water temperature supplied by the HPs is equal to 50 °C and there are generally two HPs working together, each supplying half of the required heat output, except in the June–July period when only one machine is needed.

3.1. Design Conditions Scenario

For a total annual thermal energy requirement (heating and hot water for the test benches) of 2341 MWht, the primary energy consumed by the boilers is 2494 MWh, while the primary energy consumed by the heat pumps is 1217 MWh. Under these conditions, the corresponding achieved reduction is 51.2%. The reduction in CO2 emissions is 57.7%: from 590 tCO2 for the boilers to 249 tCO2 for the heat pumps. Regarding the selected COP value for the warm months, it must be said that in this specific case it has no significant overall effect due to the low weight of the heat demand for the test benches.

3.2. Scenario of Real Operating Conditions

The data provided by the HP manufacturer’s selection software, available on the web as a selection tool, were used to describe the performance of the HPs at partial loads and specific outdoor air temperatures. In particular, for each month, once the leaving water temperature (LWT) was set at 50 °C and the required thermal power in kW and the outside air temperature (OAT) were known, the Coefficient of Performance (COP) and the absorbed electrical power input (PI) in kW were obtained. The characteristics of the selected HP operating at 50 °C are shown in Figure 6 and Figure 7. Specifically, Figure 6 shows the COP as a function of the outside air temperature (OAT), and Figure 7 shows the COP behaviour in different load conditions according to UNI EN 14825 [23].
The results related to the single HP are shown in Table 2.
As expected, the winter performance in terms of COP is higher than that evaluated in the first analysis at the external design temperature (−2.67). A seasonal average COP (SCOP) is calculated as the average value of the COPs reported in Table 2 and it is equal to 3.72, compared to the value of 2.56 at the design condition. The results also show that higher COP values are associated with higher outdoor air temperatures. Using the partial load data, the primary energy demand and associated CO2 emissions were then calculated for each month. Table 3 shows the primary energy needs and the CO2 emissions of current boilers compared to heat pumps.
It can be seen that the replacement of the boilers implies an annual primary energy reduction of 63.6% and a reduction in CO2 emissions of 68.5%. The greater reductions achieved in this second scenario are associated with higher COP values due to the monthly average outdoor temperature conditions being more favourable than the design temperature and the machine operating at partial loads.
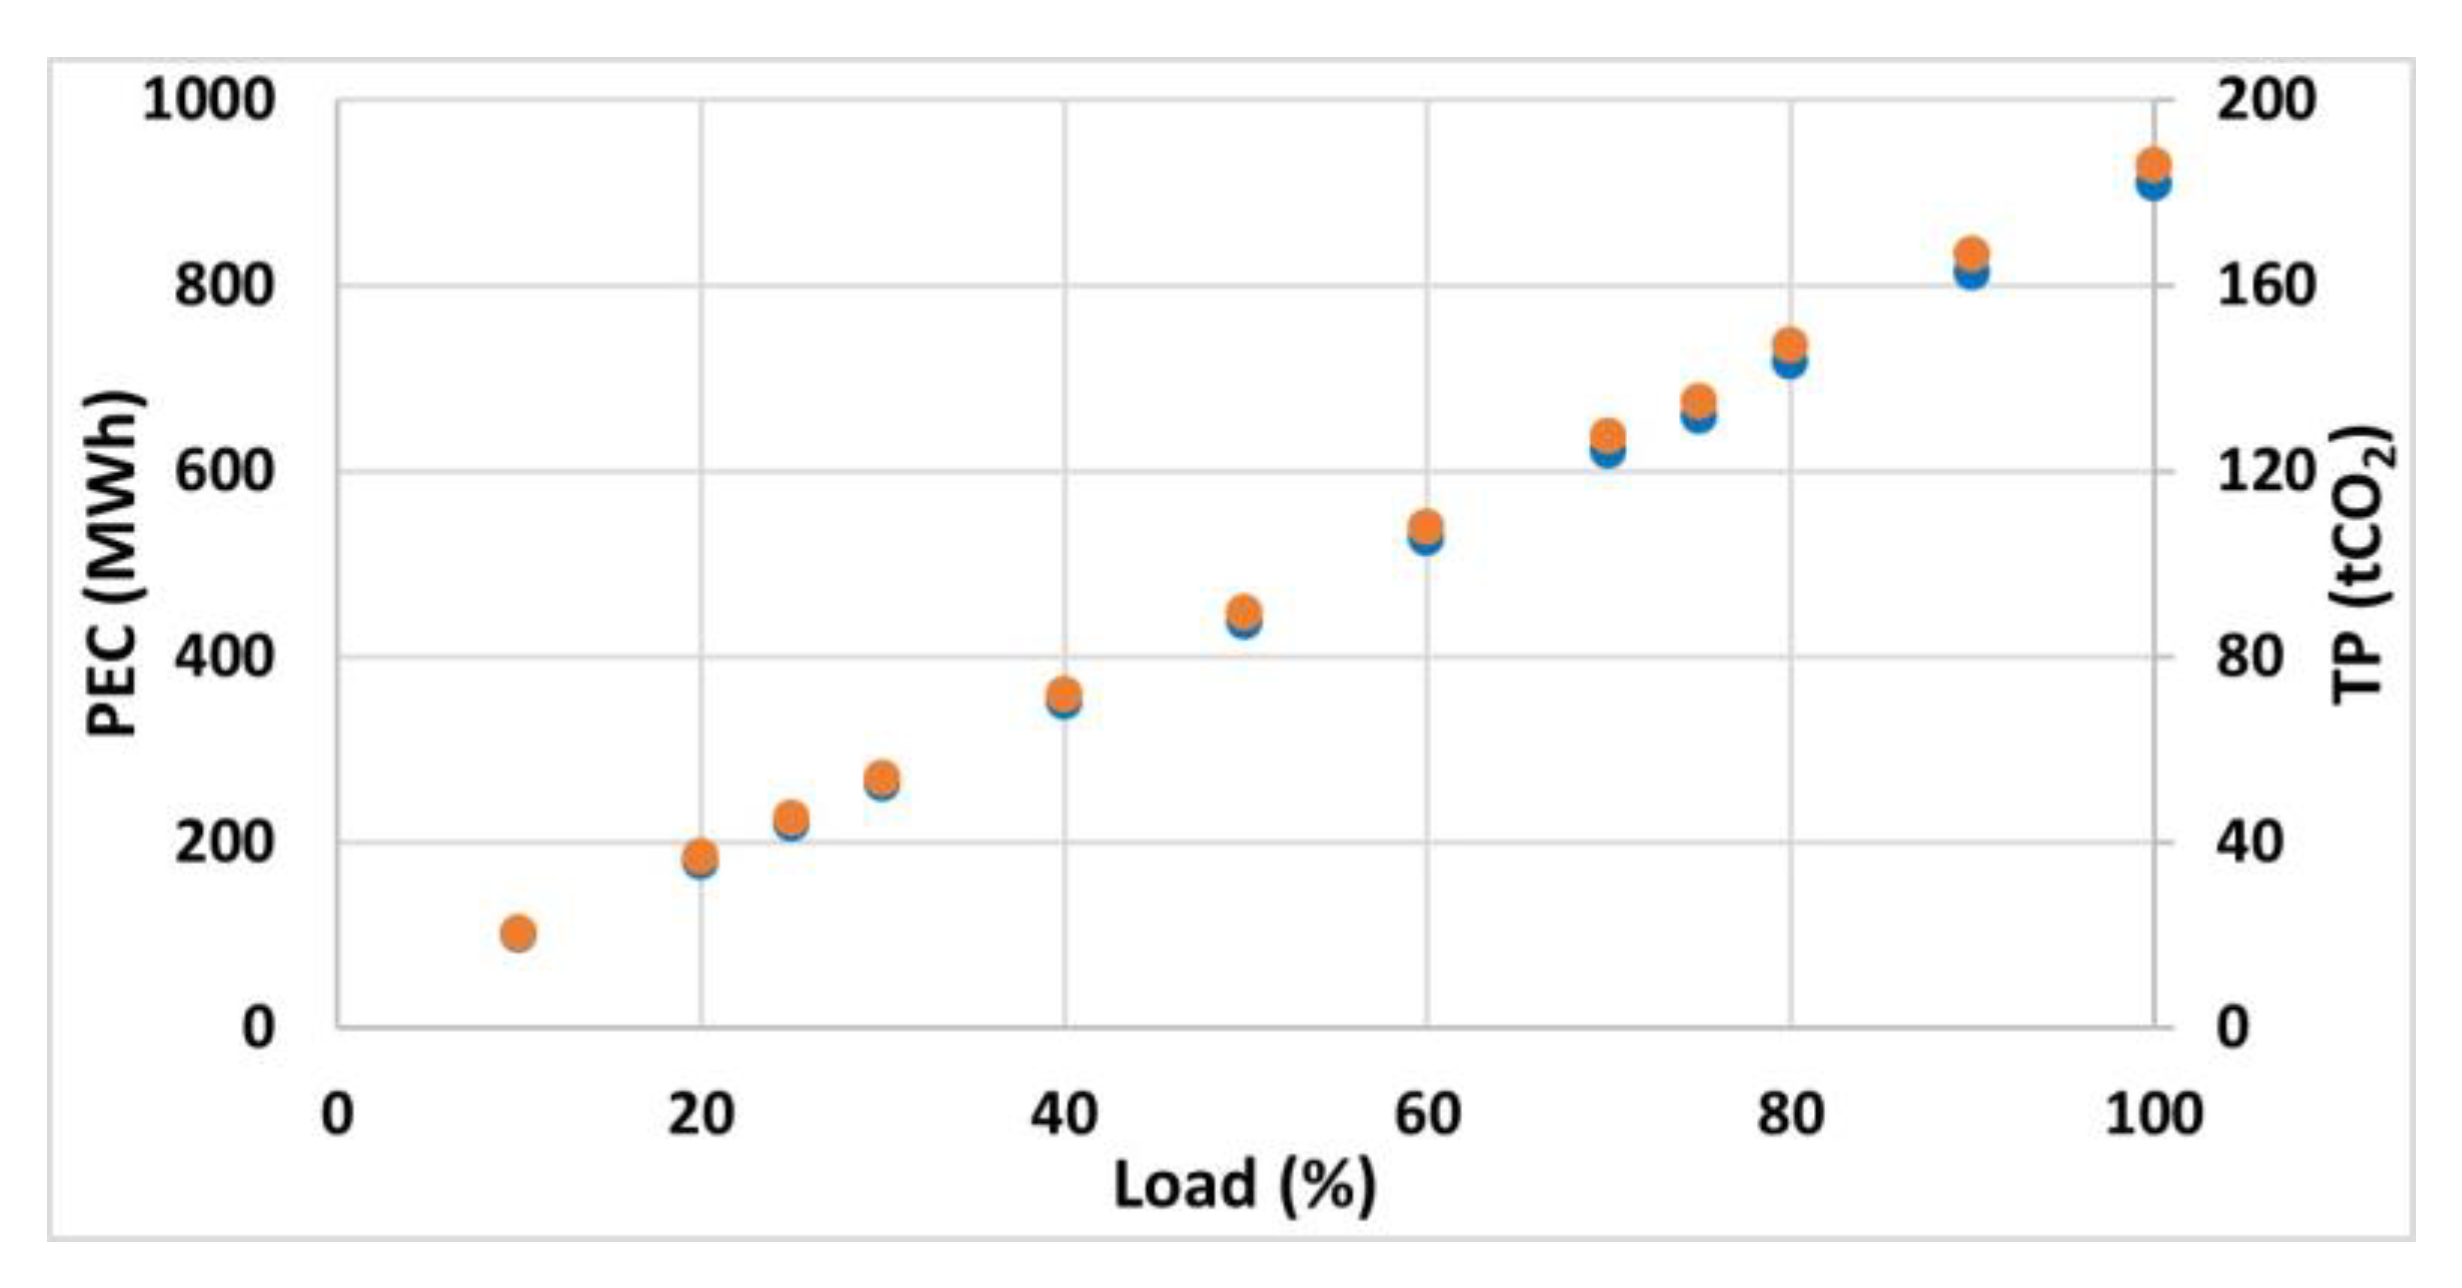
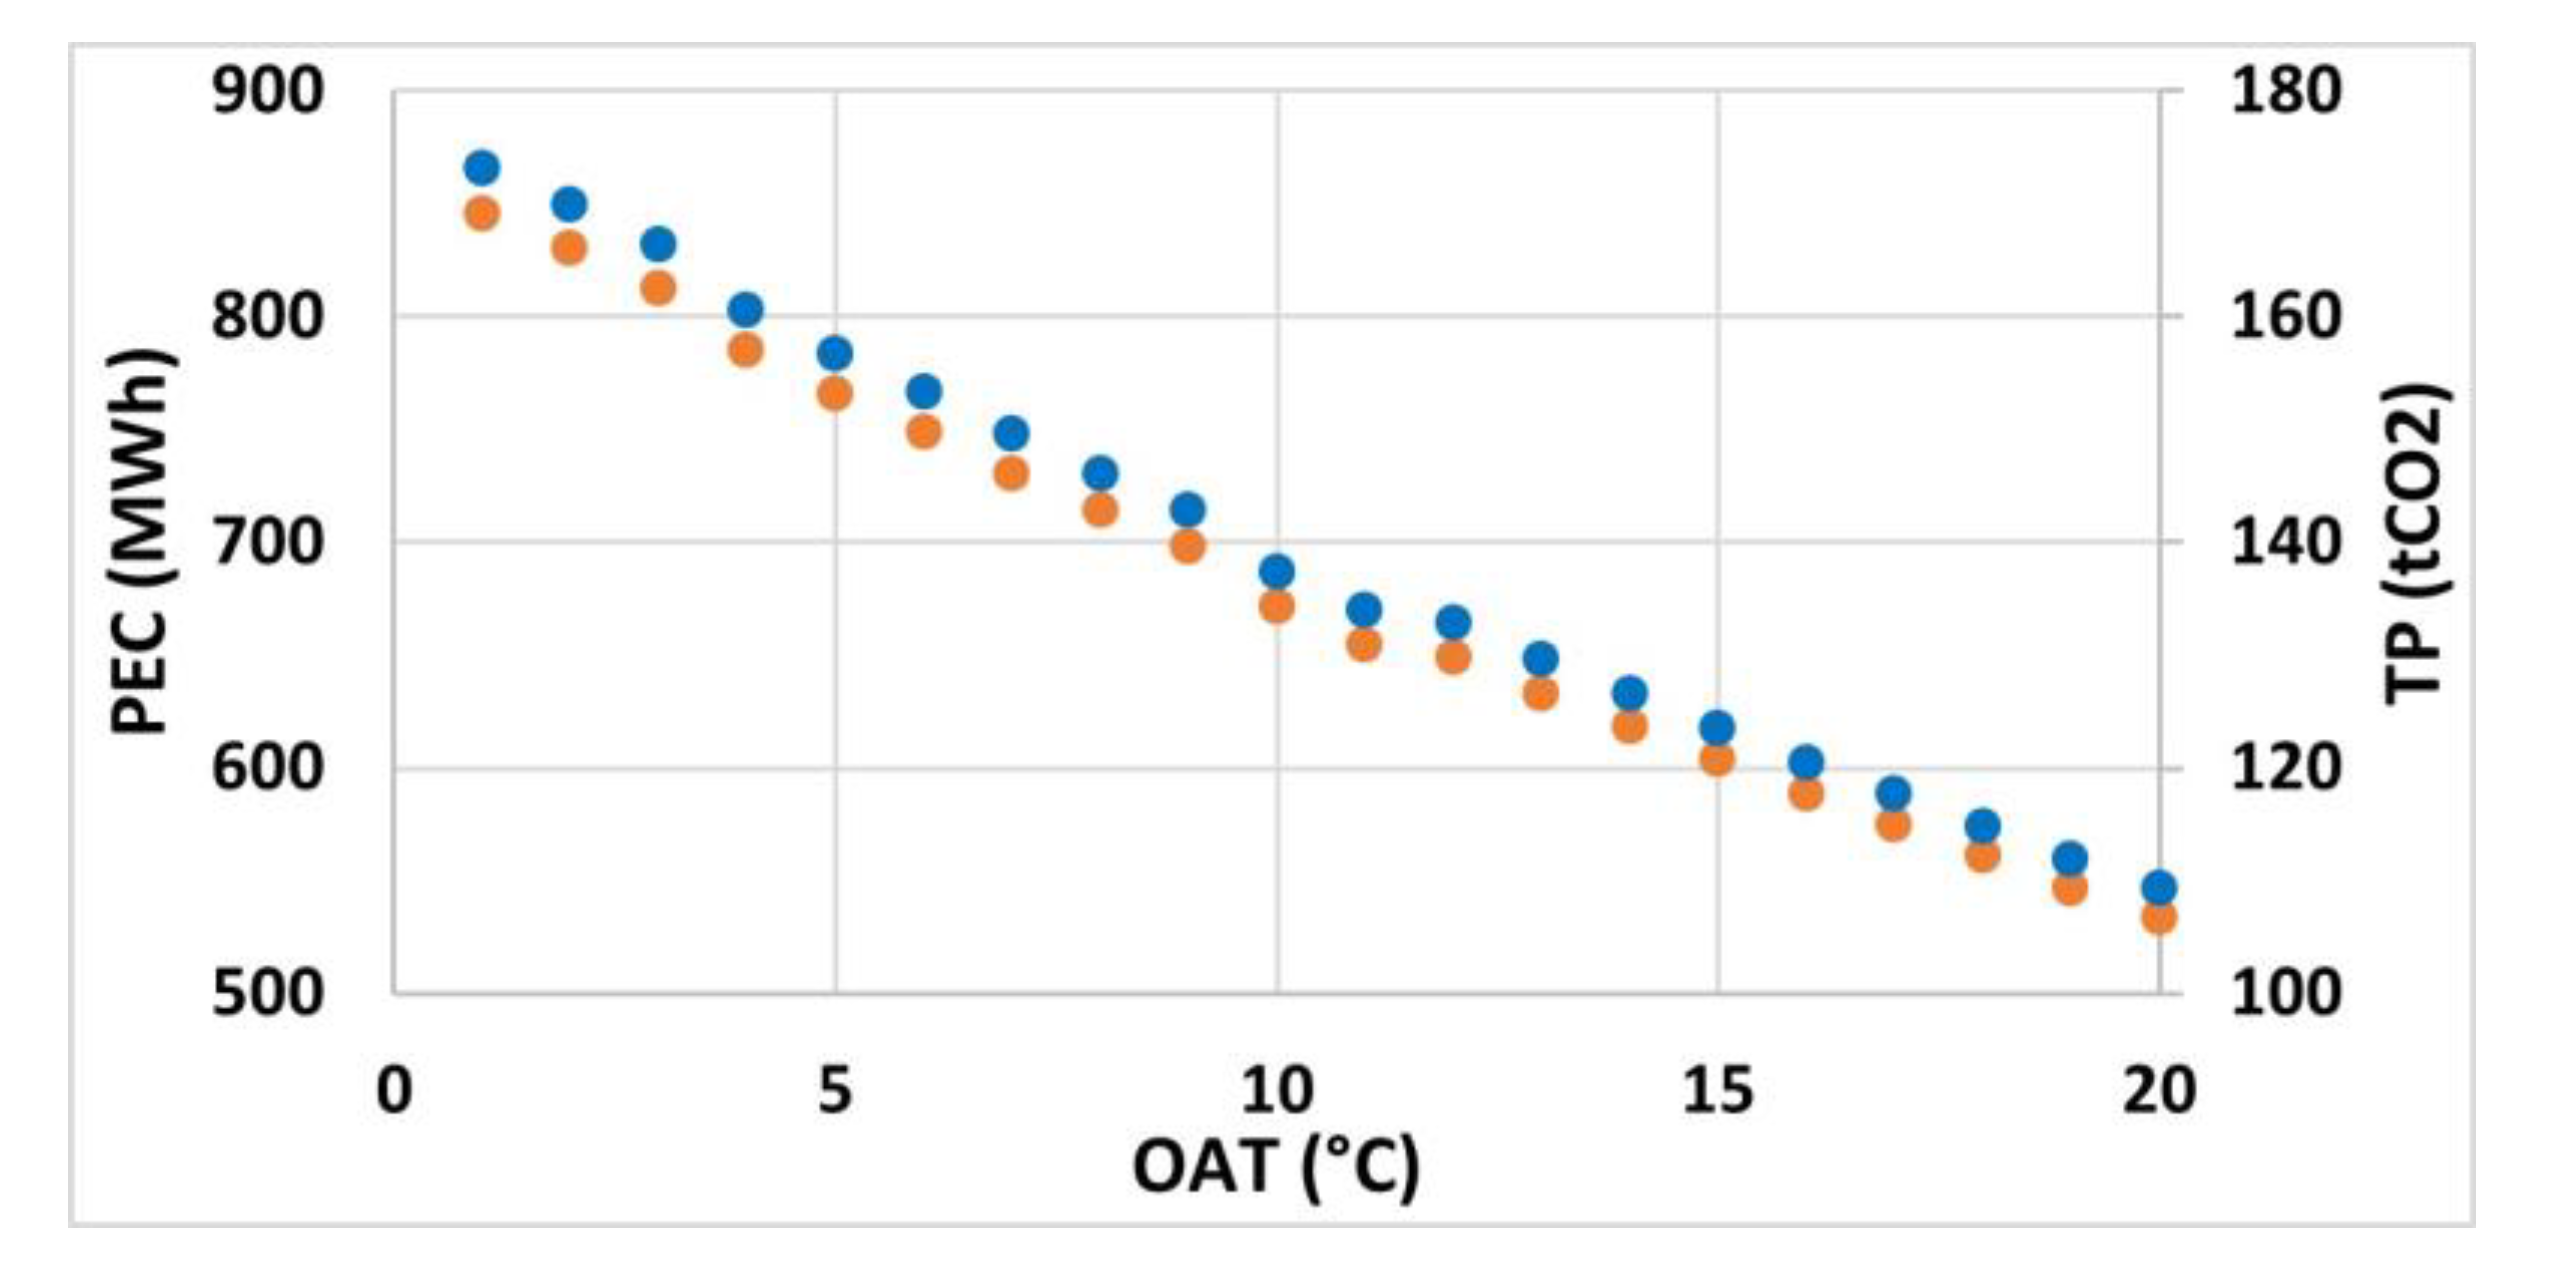
In order to understand the behaviour of each of the selected heat pumps and the evolution of the primary energy consumption and CO2 production under different operating conditions, the results were analysed in the case of fixed outdoor temperature (equal to 7 °C) and variable thermal load, and in the case of fixed thermal load (equal to 359 kW and corresponding to the design conditions) and variable outdoor temperature. The results are shown in Figure 8 and Figure 9. It should be noted that the results in Figure 8 refer to different conditions than those of Figure 7 (where UNI EN 14825 [23] is applied) since they are obtained without varying the outdoor temperature.

4. Discussion

In this section, some useful elements for the discussion are proposed. A number of technical and managerial interventions will be required to move towards the replacement intervention of the current infrastructure. From a technical point of view, attention must be paid to the choice of heat pump(s). As high capacities are required for medium–high water temperatures, an open space for the installation must be identified, the necessary basement must be built, and an additional hydronic circuit must be connected, together with the thermal storage. To avoid potential disruption to the manufacturing process and to have the boilers available as a backup, any decommissioning intervention will be carried out after installation and testing have been completed. The power supply will be upgraded to support the increased electricity demand resulting from the selected heat pumps.
From a management point of view, efforts will be needed to upgrade the electricity supply contract and to implement the procedure for obtaining state aid for companies to support investments in new production facilities and equipment useful for the purposes of energy transition.
Regarding air quality improvement, replacing LPG boilers with heat pumps would eliminate the on-site emissions of pollutants, displacing them to the thermal power plants, which have the highest generation efficiencies and are equipped with capture and reaction systems (for sulphur and nitrogen oxides, particulate matter, and CO2).
To assess the actual improvement in air quality, the (avoided) average concentrations of pollutants emitted by the boilers can be evaluated. As one of the two boilers has a capacity higher than 1000 kW, regional legislation requires annual sampling of the boiler fumes; therefore, those data are available. To this end, three samples are taken, each lasting thirty minutes. The average concentrations of pollutants recorded during the last sampling in November 2022, according to UNI EN 13284-1:2017, UNI EN 15058:2017, UNI EN 14792:2017, UNI EN 14791:2017 [24,25,26,27], are shown in Table 4.
With particular reference to air quality, it should be noted that if natural gas had been used as fuel, the avoided emissions would have been lower, as reported by Koumi Ngoh et al. [28] for different load conditions. From an economic point of view, an economic analysis of the intervention was carried out as described below.

Economic Considerations

An economic analysis has been performed for both of the scenarios studied, in terms of payback period. The results are summarized in Table 5.
In particular, the initial purchase costs were roughly estimated to be very close to €300,000 (including the purchase and installation costs of the three HPs and the disposal costs of the boilers). The operating costs, which include maintenance costs, are based on the LPG and electricity prices in the current supply contracts of €0.514/L and €0.195/kWh, respectively, for the year 2022, together with the annual consumption of the boilers in litres and the electricity consumption of the HPs in kWh.
For the design conditions scenario, the analysis results in a payback period of 12 years and 302 days, compared to a conventional machine life of 15 years and to a more realistic operating life of 20 years [29,30]. In this case, although sustainable, might not seem attractive to proceed with the replacement from an economic point of view (although keeping in mind the objective of improving air quality). It might be useful to consider public support.
Based on the “Conto Termico”, an Italian state incentive regulated by the Ministerial Decree of 16 February 2016, the replacement of the existing heat generator with heat pumps is part of the national incentives to increase energy efficiency and the production of thermal energy from renewable sources [31]. For the purpose of this assessment, a 65% rebate on the total initial investment was considered, paid over 5 years. In this case, the payback period was 4 years and 261 days, which can be considered a good result both for the conventional life cycle of the machine, set at 15 years, and for a more realistic value of 20 years. With regard to the actual operating conditions, the payback period without considering the public support results of 8 years and 363 days; which, in the case of the incentive, is equal to 4 years and 35 days.
The same preliminary analysis was also done for the year 2023, taking into account the price of the LPG equal to 0.526 €/L and of the electricity equal to 0.273 €/kWh. Table 5 shows a very different picture when LPG and electricity prices are considered for the year 2023. Owing to the large price differential between LPG and electricity, the scenario related to the design conditions is economically unsustainable even in the case of public support. By considering the actual operating conditions, the replacement seems to be convenient only in case of public support.
Taking into account the sustainability limit of the intervention, corresponding to a payback period of 20 years, this implies a difference in expenditure for heat production of 13,350 €. This may be due to a difference in the price of the thermal kWht produced by fuel or the heat pump, or to a different heat demand in the year. Assuming that the heat load demand is the same as in 2022, the sustainable thermal kWht price difference, in the absence of public support, is 0.012 €/kWht. Assuming a thermal kWht price difference equal to that of 2023 (equal to 0.00779 €/kWht), the sustainable heat load, in the absence of public support, is 1,714,221 kWht, corresponding, with a 32% error due to the uncertainty on K, to an average outdoor air temperature during the heating period of 11.70 °C. These considerations cannot be considered conclusive, as it is currently impossible to predict the evolution of fuel and electricity prices on the basis of historical data due to structural changes in price dynamics [32].

5. Conclusions

Based on the decarbonisation potential of heating systems in relation to global greenhouse gas emission reduction targets, the substitution of LPG boilers used to produce hot water for the manufacturing process (test benches) and for the heating of two workshops at an industrial site was proposed and analysed. The study demonstrated the validity of the proposal in terms of reducing primary energy consumption and CO2 emissions. The benefits can be seen both for the outdoor temperature at design conditions and for real operating conditions. The latter implies better HP performance in terms of COP when working at partial loads and with more favourable outdoor air temperatures.
The proposal demonstrated the benefits in terms of avoided pollutant emissions and the economic benefits that could be achieved in case of public support in real operating conditions. A sustainability boundary has been drawn in terms of fuel prices and operating temperatures. It should be noted that it is currently impossible to predict the evolution of fuel and electricity prices based on historical data due to structural changes in price dynamics.
It should be noted that the study, based on monthly LPG consumption, represents a first approximation of the intervention. A more accurate study based on weekly consumption trends would take into account any peaks in the heat load. In addition, a more detailed analysis of the heat demand, e.g., for the manufacturing process, could be useful for a better understanding and level of approximation, also with regard to the evaluation of the thermophysical properties of the building envelope, which useful for the construction of evaluation scenarios, e.g., from an economic point of view. However, the current approach, based on data usually available in an industrial context, could be a useful starting point for analysing different sites and scenarios.
The analysed proposal will be of interest to the production management, which plans to re-equip its boiler rooms with air-to-water heat pumps. This replacement, carried out in a manufacturing context, represents a case study that can also be applied in different industrial sites. Future work will also analyse in more detail the economic aspect of the intervention, both in terms of investment and operating costs, taking into account different scenarios of price dynamics and the use of photovoltaic panels.

Author Contributions

Conceptualization, A.C., L.D.F. and A.D.; methodology, A.C., L.D.F. and A.D.; software, A.C., L.D.F. and A.D.; validation, A.C., L.D.F. and A.D.; formal analysis, A.C., L.D.F. and A.D.; investigation, A.C., L.D.F. and A.D.; resources, A.C., L.D.F. and A.D.; data curation, A.C., L.D.F. and A.D.; writing—original draft preparation, A.C., L.D.F. and A.D.; writing—review and editing, A.C., L.D.F. and A.D.; visualization, A.C., L.D.F. and A.D.; supervision, A.C., L.D.F. and A.D.; project administration, L.D.F. and A.D.; funding acquisition, A.D. All authors have read and agreed to the published version of the manuscript.

Funding

This research was funded by Ministero dell’Università e della Ricerca MUR, grant D.M. 1061/2021 finanziati tramite il Programma Operativo Nazionale (PON) “Ricerca e Innovazione” 2014–2020—Azione IV.4 “Dottorati e contratti di ricerca su tematiche dell’innovazione” e Azione IV.5 “Dottorati su tematiche green”.

Conflicts of Interest

The authors declare no conflict of interest.

References

  1. European Commission. Communication from the Commission to the European Parliament, the Council, the European Economic and Social Committee, and the Committee of the Regions. The European Green Deal; European Commission: Brussels, Belgium, 2019; Available online: https://eur-lex.europa.eu/legal-content/EN/TXT/?uri=celex%3A52019DC0640 (accessed on 13 March 2023).
  2. The International Energy Agency, IEA. Global Status Report. 2017. Available online: https://globalabc.org/sites/default/files/2020-09/2017%20GlobalABC%20GSR%20.pdf (accessed on 12 March 2023).
  3. The European Partnership for Energy and the Environment, EPEE. Decarbonising Heating & Cooling in Europe. Available online: https://epeeglobal.org/wp-content/uploads/2022/01/Decarbonising-heating-and-cooling-EPEE_One_Pager.pdf (accessed on 12 March 2023).
  4. Leung, J. Decarbonizing US Buildings. Center for Climate and Energy Solutions, 2018. Available online: https://www.c2es.org/wp-content/uploads/2018/06/innovation-buildings-background-brief-07-18.pdf (accessed on 13 March 2023).
  5. Lin, B.; Liu, H. CO2 emissions of China’s commercial and residential buildings: Evidence and reduction policy. Build. Environ. 2015, 92, 418–431. [Google Scholar] [CrossRef]
  6. Carella, A.; D’Orazio, A. The heat pumps for better air quality. Sustain. Cities Soc. 2021, 75, 103314. [Google Scholar] [CrossRef] [PubMed]
  7. Caputo, A. Istituto Superiore per la Protezione e la Ricerca Ambientale ISPRA, Indicatori di Efficienza e Decarbonizzazione del Sistema Energetico Nazionale e del Settore Elettrico; Higher Institute for Environmental Protection and Research—ISPRA: Rome, Italy, 2022; pp. 1–108. (In Italian) [Google Scholar]
  8. Minuto, F.D.; Lazzeroni, P.; Borchiellini, R.; Olivero, S.; Bottaccioli, L.; Lanzini, A. Modeling technology retrofit scenarios for the conversion of condominium into an energy community: An Italian case study. J. Clean. Prod. 2021, 282, 124536. [Google Scholar] [CrossRef]
  9. Jadwiszczak, P.; Jurasz, J.; Kazmierczak, B.; Niemierka, E.; Zheng, W. Factors Shaping A/W Heat Pumps CO2 Emissions—Evidence from Poland. Energies 2021, 14, 1576. [Google Scholar] [CrossRef]
  10. Carella, A.; Del Ferraro, L.; D’Orazio, A. Air/Water Heat Pumps in Existing Heating and Hot Water Systems for Better Urban Air Quality and Primary Energy Savings: Scenarios of Two Italian Cities. Energies 2022, 16, 377. [Google Scholar] [CrossRef]
  11. Pérez-Lombard, L.; Ortiz, J.; Pout, C. A review of buildings’ energy consumption information. Energy Build. 2008, 40, 394–398. [Google Scholar] [CrossRef]
  12. Gradziuk, P.; Siudek, A.; Klepacka, A.; Florkowski, W.; Trocewicz, A.; Skorokhod, I. Heat Pump Installation in Public Buildings: Savings and Environmental Benefits in Underserved Rural Areas. Energies 2022, 15, 7903. [Google Scholar] [CrossRef]
  13. Dongellini, M.; Naldi, C.; Morini, G.L. Seasonal performance evaluation of electric air-to-water heat pump systems. Appl. Therm. Eng. 2015, 90, 1072–1081. [Google Scholar] [CrossRef]
  14. Katipamula, S.; O’Neal, D.L. A part load factor for heat pump derived from laboratory measurements. Energy Build. 1992, 19, 125–132. [Google Scholar] [CrossRef]
  15. Mouzeviris, G.A.; Papakostas, K.T. Study on Air-to-Water Heat Pumps Seasonal Performances for Heating in Greece. Energies 2022, 15, 279. [Google Scholar] [CrossRef]
  16. Rossi di Schio, E.; Ballerini, V. The scope of an air source heat pump: Comparison between on-off and inverter heat pump. JP J. Heat Mass Transf. 2021, 24, 79–86. [Google Scholar] [CrossRef]
  17. UNI TR 10349-2:2016; Heating and Cooling of Buildings—Climatic Data—Part 2: Data for Design Load. UNI—Ente Italiano di Normazione: Milan, Italy, 2016.
  18. IlMeteo. Available online: https://www.ilmeteo.it/portale/archivio-meteo/Cecchina/2022 (accessed on 3 March 2023).
  19. UNI EN 12831:2018; Energy Performance of Buildings—Method for Calculation of the Design Heat Load—Part 1: Space Heating Load. UNI—Ente Italiano di Normazione: Milan, Italy, 2018.
  20. Socal, L.; Soma, F. La Firma Energetica. Available online: https://www.progetto2000web.com/assets/repository/p2000/pdf/p2000-36.pdf (accessed on 23 March 2023).
  21. Mota-Babiloni, A.; Navarro-Esbrí, J.; Makhnatch, P.; Molés, F. Refrigerant R32 as lower GWP working fluid in residential air conditioning systems in Europe and the USA. Renew. Sust. Energ. Rev. 2017, 80, 1031–1042. [Google Scholar] [CrossRef]
  22. United Nations Framework Convention on Climate Change UNFCCC, National Inventory of CO2 Emission Coefficients. Available online: https://www.assolombarda.it/servizi/ambiente/informazioni/ets-tabella-parametri-standard-nazionali (accessed on 14 March 2023).
  23. UNI EN 14825:2019; Air Conditioners, liquid Chilling Packages and Heat Pumps, with Electrically Driven Compressors, for Space Heating and Cooling—Testing and Rating at Part Load Conditions and Calculation of Seasonal Performance. UNI—Ente Italiano di Normazione: Milan, Italy, 2019.
  24. UNI EN 13284-1:2017; Stationary Source Emissions—Determination of Low Range Mass Concentration of Dust—Part 1: Manual Gravimetric Method. UNI—Ente Italiano di Normazione: Milan, Italy, 2017.
  25. UNI EN 15058:2017; Stationary Source Emissions—Determination of the Mass Concentration of Carbon Monoxide—Standard Reference Method: Non-Dispersive Infrared Spectrometry. UNI—Ente Italiano di Normazione: Milan, Italy, 2017.
  26. UNI EN 14792:2017; Stationary Source Emissions—Determination of Mass Concentration of Nitrogen Oxides—Standard Reference Method: Chemiluminescence. UNI—Ente Italiano di Normazione: Milan, Italy, 2017.
  27. UNI EN 14791:2017; Stationary Source Emissions—Determination of Mass Concentration of Sulfur Oxides—Standard Reference Method. UNI—Ente Italiano di Normazione: Milan, Italy, 2017.
  28. Koumi Ngoh, S.; Epessé Missé, S.; Moungnutou Mfetoum, I. Environmental and economic assessment of switching from heavy fuel oil to natural gas in industrial boilers and furnaces: Case of Cameroon, a low-income country. Front. Energy Res. 2022, 10, 1053576. [Google Scholar] [CrossRef]
  29. Shibata, N.; Sierra, F.; Hagras, A. Integration of LCA and LCCA through BIM for optimized decision-making when switching from gas to electricity services in dwellings. Energy Build. 2023, 288, 113000. [Google Scholar] [CrossRef]
  30. Neumann, G.; Schropp, E.; Gaderer, M. Life Cycle Assessment of an Air-Source Heat Pump and a Condensing Gas Boiler Using an Attributional and a Consequential Approach. Procedia CIRP 2022, 105, 351–356. [Google Scholar] [CrossRef]
  31. MISE, Ministry of Economic Development. DM 16-02-2016. Update of the Framework for the Promotion of Small-Scale Interventions to Increase Energy Efficiency and for the Production of Thermal Energy from Renewable Sources. Available online: https://www.gazzettaufficiale.it/eli/id/2016/03/02/16A01548/sg (accessed on 20 April 2023).
  32. Desideri, U.; Krayem, A.; Thorin, E. The Unprecedented Natural Gas Crisis in Europe: Investigating the Causes and Consequences with a Focus on Italy. Energies 2023, 16, 5954. [Google Scholar] [CrossRef]
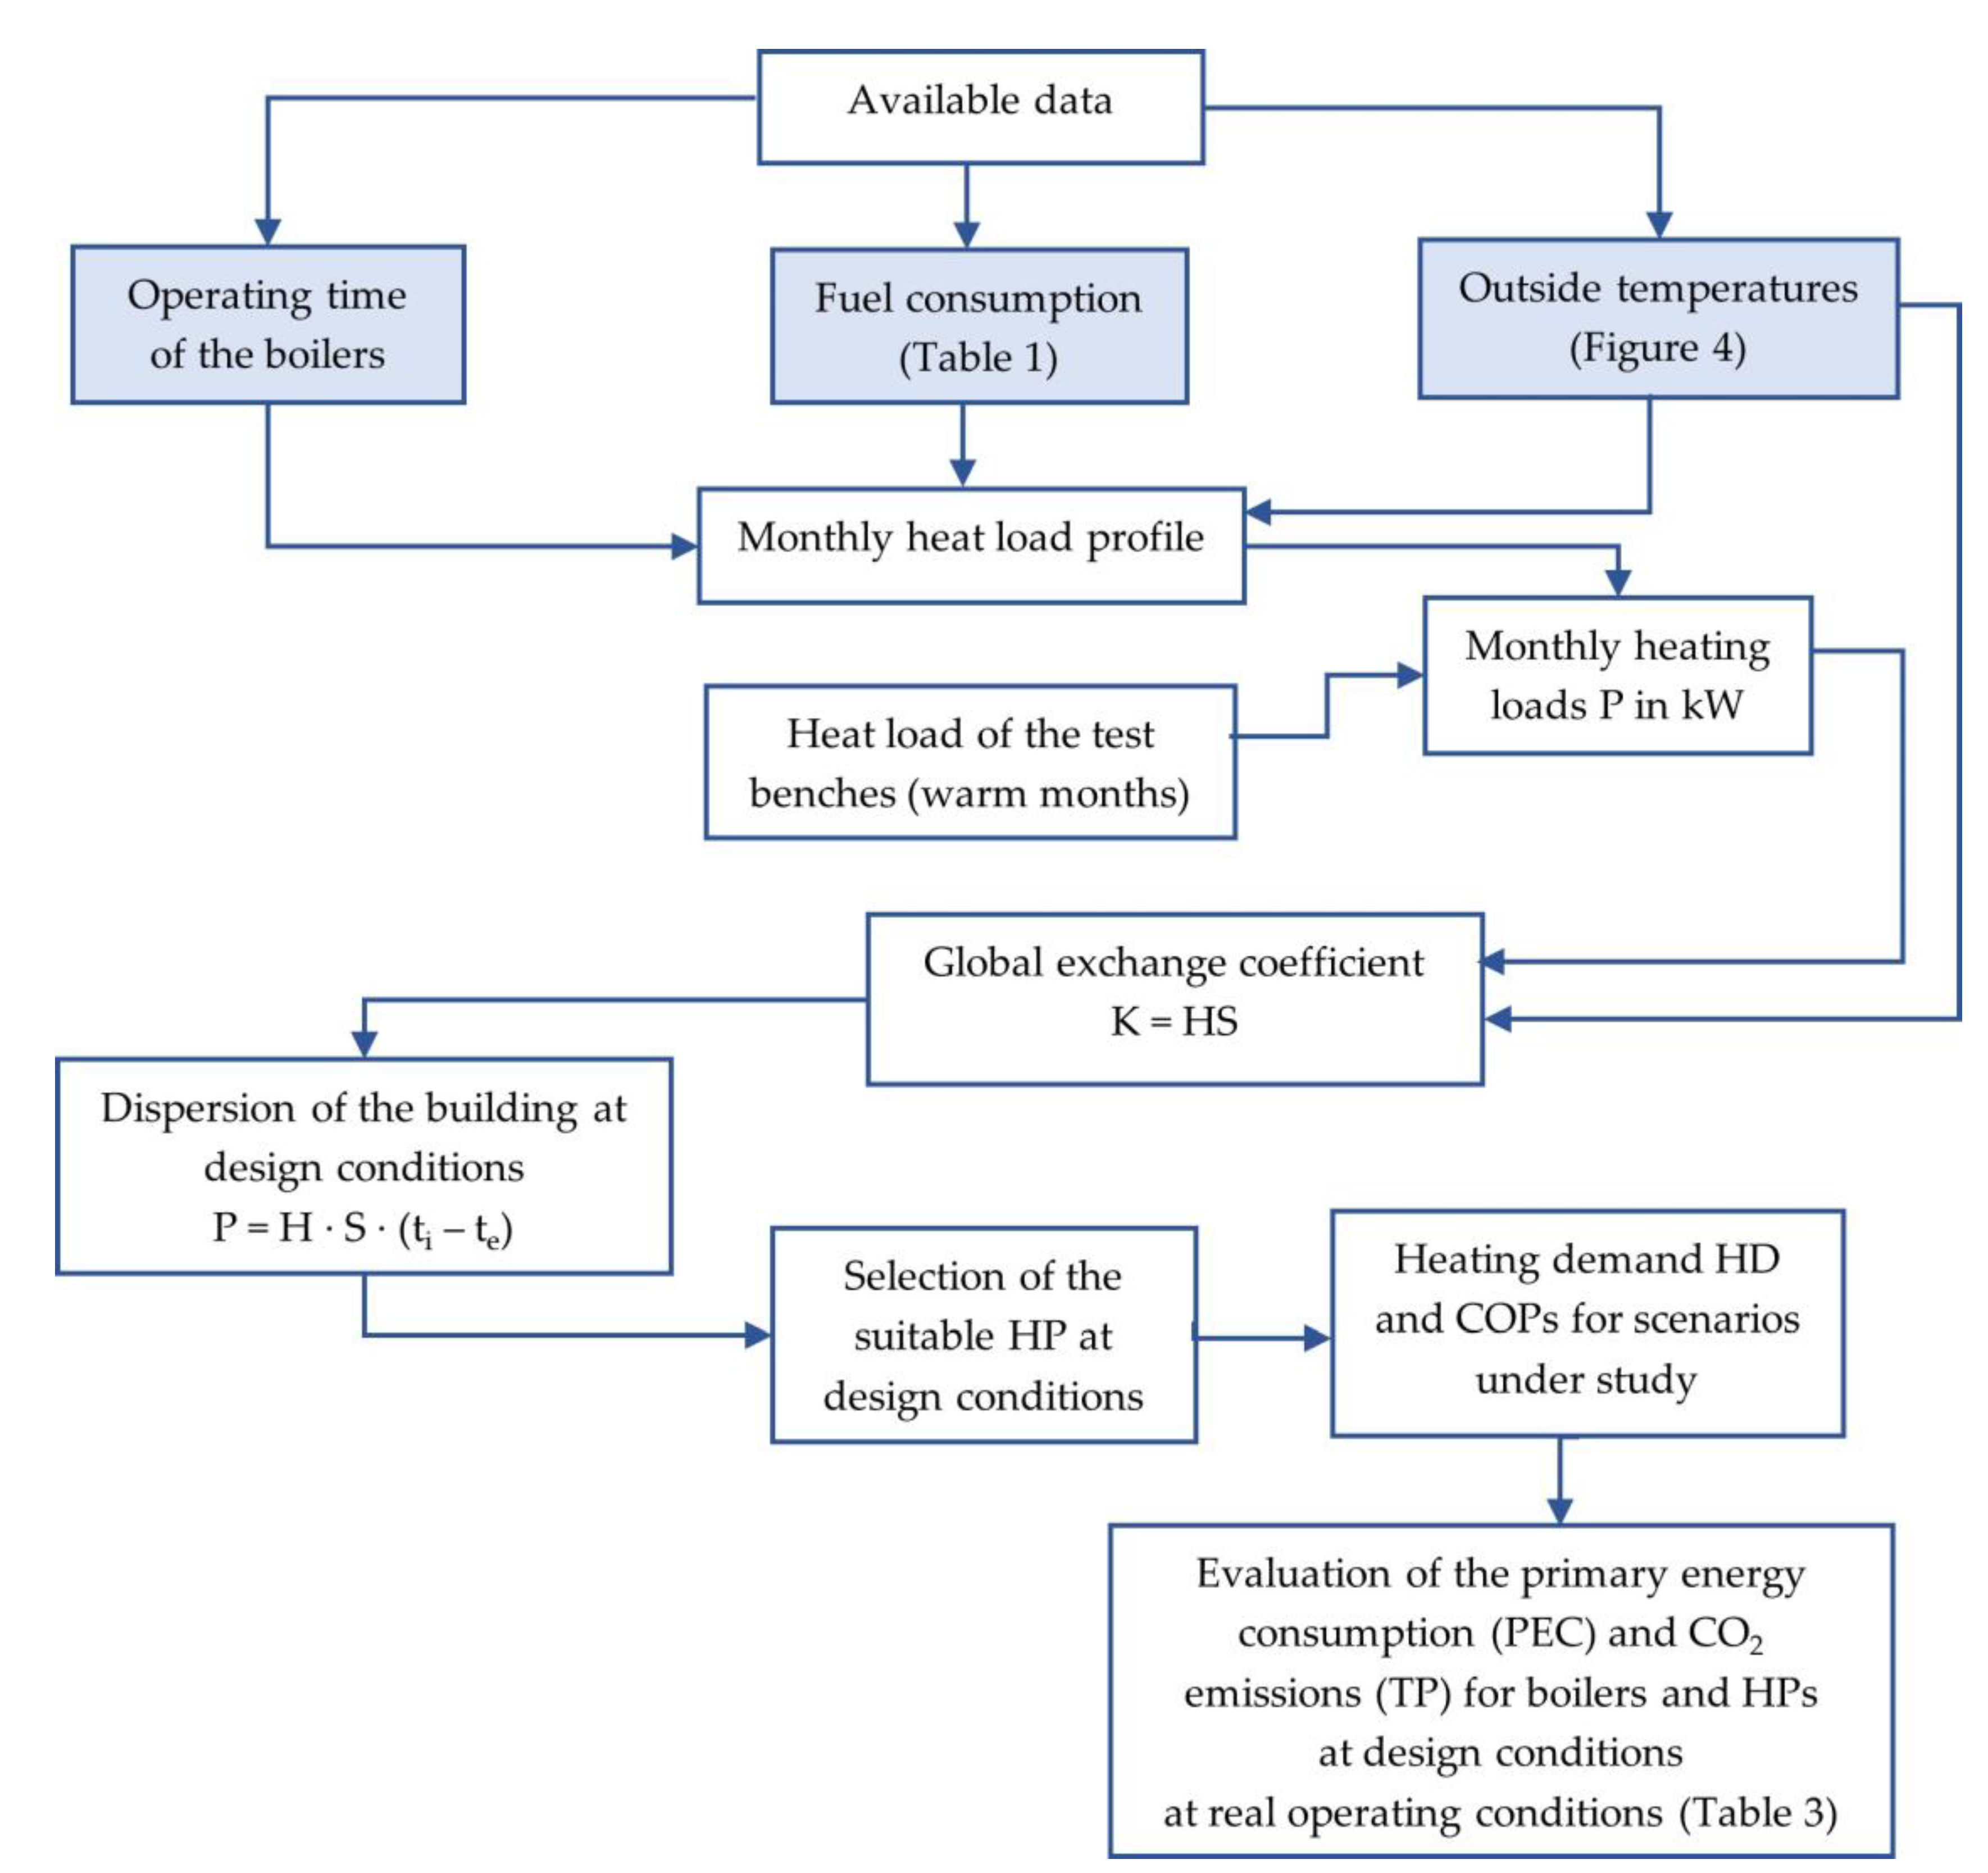
Figure 1. Heat pump selection procedure and evaluation of different scenarios: flowchart.
Energies 16 06233 g001
Figure 2. Circuit logic of the boilers with the plate heat exchanger and the three-way valve supplying the test bench evaporator: 1, boilers; 2, pump; 3, three-way valve; 4, plate heat exchanger; 5, test bench evaporator.
Energies 16 06233 g002
Figure 3. Monthly heat load profile (kW) associated with LPG consumption.
Energies 16 06233 g003
Figure 4. The average monthly temperature profile of the town of Cecchina for the year 2022 [18].
Energies 16 06233 g004
Figure 5. Simplified energy signature representing the heat load as a function of outside air temperature.
Energies 16 06233 g005
Figure 6. COP trend in relation to the outdoor air temperature (OAT) in °C for an outlet water temperature of 50 °C.
Energies 16 06233 g006
Figure 7. COP trend in relation to heat load [%] for an outlet water temperature of 50 °C, following UNI EN 14825 [23].
Energies 16 06233 g007
Figure 8. Primary energy consumption (PEC) in blue and tons of CO2 produced (TP) in orange as a function of load (%) for a fixed OAT of 7 °C and LWT of 50 °C.
Energies 16 06233 g008
Figure 9. Primary energy consumption (PEC) in blue and tons of CO2 produced (TP) in orange as a function of OAT (°C) for a thermal load set at 359 kW and LWT of 50 °C.
Energies 16 06233 g009
Table 1. LPG monthly consumption in cubic meters and litres.
MonthConsumption (m3)Consumption (L)
January770829,291
February10,21038,797
March554721,079
April15826012
May21338105
June11954541
July12624796
August17086490
September13365077
October17076487
November621423,613
December646224,556
Total47,064178,844
Table 2. Heating capacity (HC), monthly average outdoor air temperature (OAT), COP, and electric power input (PI) for each month.
MonthHC, kWOAT, °CCOPPI, kW
January238.07.63.28971.4
February335.910.03.39299.0
March160.39.93.44945.5
April48.813.63.25315.1
May64.320.73.88416.5
June36.026.14.3798.2
July39.027.94.6008.5
August49.426.73.98112.3
September40.222.63.49411.5
October52.719.13.58614.9
November187.213.53.74250.0
December191.211.93.61252.9
Table 3. Primary energy requirements and CO2 emissions of LPG boilers and heat pumps.
MonthPrimary Energy Needs, kWhCO2 Emissions, kg CO2
BoilersHeat PumpsBoilersHeat Pumps
January193,46075,87945,73515,532
February256,24897,45460,57919,949
March139,22552,07432,91410,659
April39,70515,74693873223
May53,53517,78112,6563640
June29,992883670901809
July31,674888374881818
August42,86813,89110,1342843
September33,53112,38079272534
October42,84315,41210,1283155
November155,96053,76636,87011,006
December162,18557,92438,34211,857
Total1,181,226430,025279,24988,026
Table 4. Pollutant concentrations and limit values recorded in the sampling of the boiler fumes.
PollutantConcentration (mg/Nm3)Limit Value (mg/Nm3)
Dust1.4 ± 0.510
CO<4.6150
NO2112 ± 4.1350
SO2<3.535
Table 5. Payback time (PBT) in year (y) and days (d) for the LPG and electricity prices related to 2022 and 2023: design conditions and real operating conditions scenarios, with and without public support.
Prices 2022Prices 2023
Design
Conditions
Real Operating ConditionsDesign
Conditions
Real Operating Conditions
Without incentive12 y 302 d8 y 363 d/29 y 288 d
With incentive4 y 261 d4 y 35 d/9 y 274 d
Disclaimer/Publisher’s Note: The statements, opinions and data contained in all publications are solely those of the individual author(s) and contributor(s) and not of MDPI and/or the editor(s). MDPI and/or the editor(s) disclaim responsibility for any injury to people or property resulting from any ideas, methods, instructions or products referred to in the content.