Abstract
This article presents the results of a comparative scenario analysis of the “green hydrogen” development pathways in Poland and the EU in the 2050 perspective. We prepared the scenarios by linking three models: two sectoral models for the power and transport sectors, and a Computable General Equilibrium model (d-Place). The basic precondition for the large-scale use of hydrogen, in both Poland and in European Union countries, is the pursuit of ambitious greenhouse gas reduction targets. The EU plans indicate that the main source of hydrogen will be renewable energy (RES). “Green hydrogen” is seen as one of the main methods with which to balance energy supply from intermittent RES, such as solar and wind. The questions that arise concern the amount of hydrogen required to meet the energy needs in Poland and Europe in decarbonized sectors of the economy, and to what extent can demand be covered by internal production. In the article, we estimated the potential of the production of “green hydrogen”, derived from electrolysis, for different scenarios of the development of the electricity sector in Poland and the EU. For 2050, it ranges from 76 to 206 PJ/y (Poland) and from 4449 to 5985 PJ/y (EU+). The role of hydrogen as an energy storage was also emphasized, highlighting its use in the process of stabilizing the electric power system. Hydrogen usage in the energy sector is projected to range from 67 to 76 PJ/y for Poland and from 1066 to 1601 PJ/y for EU+ by 2050. Depending on the scenario, this implies that between 25% and 35% of green hydrogen will be used in the power sector as a long-term energy storage.
1. Introduction
In the strategies of the EU and the national documents of the member countries, hydrogen fuel is seen as one of the important technological options for reducing CO2 emissions. Hydrogen in the future is expected to be an energy carrier that will largely replace coal, gas, and oil. It can act as the missing link in the decarbonization process, as it solves a whole range of problems, including enabling decarbonization in the transportation and industry sectors, as well as providing a long-term energy storage to stabilize the operation of the electric power system under a large share of renewable sources characterized by high load volatility. Hydrogen can also be an alternative to natural gas, which is of particular importance in the context of the ongoing crisis in the European gas market.
In July 2020, the European Commission proposed the “Hydrogen strategy for a climate-neutral Europe”, aiming to accelerate the development of “green hydrogen” and secure its role as the basis for a climate-neutral energy system by 2050 [1]. The EU Hydrogen Strategy identifies “green hydrogen” and its value chain as one of the key areas to unlock investment to support sustainable growth and employment, which will be crucial in the context of the post-COVID-19 recovery. It sets the following strategic objectives defining the size of the EU hydrogen market over the next decade:
- -
- By 2024—installation of at least 6 GW of electrolyzers capacity and annual production of at least 1 million tons of hydrogen from RES;
- -
- By 2030—installation of at least 40 GW of electrolyzers capacity and annual production of at least 10 million tons of hydrogen from RES.
The share of hydrogen in the EU member states is expected to be higher than the global average and account for about 24 percent of energy demand in 2050. In order to achieve this goal, a significant increase will have to take place in the future of RES capacity installed, generating adequate amounts of low-cost energy that can be used in electrolyzers. The EU’s formulated goal of reducing net emissions by at least 55 percent by 2030 compared to 1990 levels was translated into an implementation strategy in July 2021 [2].
Among the various sources of RES generation, EU strategies assign a crucial role to offshore wind energy. In 2050, the potential installed capacity of offshore wind farms in the EU is expected to reach 300–450 GW [3]. Another significant EU policy document, called REPowerEU, assumes that hydrogen yearly production from renewable sources is to reach 20 Mt by 2030 (including approximately 4 Mt of ammonia). The document responds to the urgent need for Europe to become independent of Russian gas and also sets a target of increasing the share of RES in gross final consumption to 45 percent by 2030. The REPowerEU plan raises targets for the development of installed electrolyzers capacity compared to the “EU Hydrogen strategy” from 2020. According to this plan, the installed capacity of electrolyzers in the EU area is expected to reach 65 MW in 2030 [4]. It should be noted that the REPowerEU plan assumes more than a 330 percent increase in hydrogen consumption compared to previous EU policies. The European Commission (EC) estimates that achieving the REPowerEU goals requires additional investment of EUR 210 billion up to 2027, but this would save almost EUR 100 billion per year in reduced imports of fossil fuels [5].
This paper examines the potential application of hydrogen in Poland and the broader EU+. Forecasting hydrogen demand is vital to the hydrogen strategy, especially given its significance in stabilizing the electricity system and addressing needs stemming from the technological transformation of various industries. We analyze the quantities of hydrogen required to meet the growing demand for fuel and energy in the EU, with the aim of achieving full decarbonization by 2050. Furthermore, we assess the electricity sector’s ability to produce “green hydrogen” and investigate the feasibility of using this “green hydrogen” as a renewable energy storage solution. This includes its potential role in bolstering the stability of both onshore and offshore wind power plants.
Our literature review reveals that, despite numerous studies presenting scenarios of hydrogen market development in Poland [6,7,8] and Europe [9,10,11,12,13,14,15,16,17,18,19,20,21], only a few approach the topic comprehensively, considering all sectors of the economy and the possibilities of hydrogen supply. In the case of “green hydrogen”, its production capacity is closely related to the share of RES in the energy systems of the EU countries. This article juxtaposes the projected hydrogen demand necessary to reach the net-zero target in the EU+ by 2050 against production capacity, assuming no external imports. This assumption is pivotal for our analysis, as our primary focus is on investigating the internal potential of the EU to produce “green hydrogen”. A hallmark of our innovative model approach is the use of an iterative method for deriving results. The d-Place, MEESA, and other sectoral models determine the total annual demand for green hydrogen, which the MEESA model then optimizes in two-hour time slices. This dual approach melds insights about the broader economic demands for green hydrogen with the intricate challenges and opportunities that the hydrogen production in the electrolysis process presents. It is essential to produce green hydrogen from emission-free energy surpluses. To accurately model this, one must simulate the volatility of RES generation and the changing demand over time.
2. Overview of Hydrogen Market Development Forecast
Key data sources on projected hydrogen demand and production predominantly come from government plans and strategies. These include the EU Hydrogen Strategy [1], REPowerEU Plan [4], and the Polish Hydrogen Strategy [6]. It is essential to interpret the strategies in these documents as assumptions regarding specific objectives rather than concrete predictions.
In 2020, the European Commission (EC) published the EU Hydrogen Strategy, which outlines preferred market development scenarios at the EU level. This strategy defines priority actions and sets both medium and long term development objectives. Notably, it establishes a 2030 target for constructing 40 GW of electrolyzer capacity, targeting an associated production volume of 10 million tons annually.
However, the EC revised its environmental ambitions in less than two years. In response to Russia’s military invasion of Ukraine and the subsequent ramifications on the energy security of the entire EU, the REPowerEU Plan was introduced in May 2022. This plan advocates for a twofold increase in hydrogen consumption by 2030 compared to the original strategy’s provisions, raising the bar from 10 to 20 million tons. The additional volume (10 Mt) is anticipated to be sourced from imports outside the EU. Concurrently, the REPowerEU also suggests increasing the target for RES-installed capacity to 45% by 2030. This revision holds significant implications, especially concerning the powering of electrolyzers using energy from RES.
Two recent publications shed light on the potential development trajectory of the hydrogen market in Poland, namely:
- Analysis of the potential of hydrogen technologies in Poland to 2030 with an outlook to 2040—published by the Ministry of Climate and Environment (MCE), 2021 [7]. On the basis of this analysis forecasts, the assumptions of the Polish Hydrogen Strategy [6] were formulated. It contains three scenarios: business as usual (BAU), a central scenario adapted to the Polish Hydrogen Strategy (PHS), and a scenario in line with the EU’s Fit for 55 package.
- Green hydrogen from RES in Poland. Polish Wind Energy Association (PWEA), the Lower Silesian Institute for Energy Studies (LSIES), 2021 [8].
Based on the data presented in Table 1, there is a considerable variance in the assessment of the potential use of hydrogen in Poland, depending on the assumed scenario (ranging from 61 to 234 PJ/y). It is noteworthy that the forecast for the Polish Hydrogen Strategy (PHS) extends only until 2040. This limitation means the PHS predictions cannot be fully aligned with the Fit for 55 package assumptions.

Table 1.
Hydrogen demand projections in Poland [PJ/y] [6,8].
Among the projections relating to the development of the hydrogen market in the EU, the results of the forecasts contained in the following studies are worth mentioning:
- Hydrogen Roadmap Europe. A Sustainable Pathway for the European Energy transition. Fuel Cells and Hydrogen 2 Joint Undertaking 2019, fh.europa.eu [9]. It includes two scenarios: business as usual (BAU) and a scenario with more ambitious hydrogen development goals (Ambitious).
- Hydrogen Forecast to 2050. Energy Transition Outlook 2022. DNV [13].
- Paris Agreement Compatible (PAC) Scenarios for Energy Infrastructure, 2020. German Federal Ministry of Economics and Energy (BMWi). Co-creation Report prepared by: Global Renewable Energy Community (REN21), European Environmental Bureau (EEB), Renewables Grid Initiative (RGI and Climate Action Network Europe (CAN) [16].
- European Commission 2021. Fit for 55 package—MIX H2 scenario [17].
- Achieving the Paris Climate Agreement Goals. University of Technology Sydney (UTS), University of Melbourne, and German Aerospace Centre, 2019 [18].
- The Net Zero scenario, reaching carbon neutrality in the EU by 2050. EC JRC 2021 [19].
- BP Energy Outlook, 2023 edition. The hydrogen demand projections in this publication were made for two scenarios: Net-zero and Accelerated [20].
- McKinsey & Company (2020). Net-Zero Europe Decarbonization pathways and socioeconomic implications. McKinsey & Company [21].
Figure 1 presents a summary of all the aforementioned projections. They are characterized by a fairly wide range of values in the analyzed periods. For 2030, they range from 180 to 2394 PJ/y and for 2050 from 2520 to 8104 PJ/y.

Figure 1.
Hydrogen demand projections in the EU (own assumptions based on [9,10,13,16,17,18,19,21]).
3. Technological Solutions for Green Hydrogen Production
The basic process of “green hydrogen” production is the electrolysis of water driven by electricity from RES. This process is a straightforward electrochemical reaction that does not require complex apparatus. The outcome is highly pure hydrogen (>99.99%). If the electricity required for the reaction comes from renewable sources, water electrolysis does not cause GHG emissions [22]. Currently, less than 4% of hydrogen production is based on electrolysis processes. The vast majority of the hydrogen is derived from fossil fuels, primarily through the steam reforming of natural gas [23]. Unfortunately, these processes are accompanied by relatively high greenhouse gas emissions (8–12 kg CO2 eq/kg H2 when natural gas is used and 10–20 kg CO2 eq/kg H2 when coal is used) [24]. This makes them unsuitable for achieving climate neutrality. For hydrogen to be deemed climate-neutral fuel, its production should be emission-free. Reforming and gasification require CCS (Carbon Capture and Storage) or CCU (Carbon Capture and Utilization) technology, which is economically and logistically problematic. Therefore, the development of the hydrogen economy should be based on hydrogen produced by water electrolysis, based on electricity derived from RES. The limited share of “green hydrogen” production is primarily due to the high cost associated with electrolysis processes compared to the conventional fossil sources [25]. However, with a higher share of renewable energy from wind turbines and PV’s, “green hydrogen” production is expected to become more economically viable. The article will present trajectories of the decrease in the unit cost of “green hydrogen” production, derived from various literature sources and the results of our calculations.
Hydrogen can also be produced in a sustainable manner using energy derived from biomass through several processes (Figure 2), resulting in a product known as biohydrogen. Utilizing waste materials for biohydrogen production offers numerous benefits. It enhances economic and ecological potential, avoids competitive land use, and represents a step towards a circular economy. Technological advancements in climate change mitigation can be further achieved by capturing CO2 produced during the process, leading to biohydrogen production as a carbon-negative process [26]. This approach allows for the removal of CO2 from the atmosphere during hydrogen generation and is referred to as hydrogen bioenergy with carbon capture and storage (HyBECCS) [27].

Figure 2.
Carbon-negative hydrogen production using HyBECCS approach [27].
Other ways of obtaining hydrogen include the following:
- Separation from coke oven gas;
- Hydrothermal carbonization;
- As a by-product of refining processes;
- Pyrolysis and thermal waste treatment;
- Fermentation and other biological processes [28].
3.1. Types of Electrolyzers
The process of water electrolysis can be implemented in different technical solutions using different electrolyte materials and process parameters. It is possible to distinguish four basic technologies: (1) alkaline electrolyzers (ALK), two polymer electrolyzer technologies: (2) proton exchange membrane (PEM), (3) anion exchange membrane (AEM) and (4) solid oxide electrolyzer (SOE) [29].
ALK electrolyzers are considered the most promising type of electrolyzer at the moment due to their low price and the fact that it is the most mature technology, known for more than a century [30]. Average capital expenditures (CAPEX) are lower for ALK electrolyzers than for PEM at this point. However, it is anticipated that PEM electrolyzers will soon become cheaper and, in the long run, unrivaled compared to ALK [31]. PEM-type electrolyzer technology is presented in the literature as the most promising alternative to ALK electrolyzer technology. This technology has a number of advantages, such as higher efficiency (56–73%) and the possibility of obtaining ultrapure hydrogen (purity class up to 99.999%), as well as a more compact design [32]. ALK and PEM electrolyzers operate in the temperature range of 25 to 100 °C, hence they are classified as low-temperature electrolyzers [33] (as opposed to solid oxide electrolyzers, categorized as high-temperature, for which the operating temperature can reach up to 1000 °C [34,35,36]). SOE electrolyzers are both currently, and for the foreseeable future, the most expensive option. In addition, their disadvantage is their high operating temperature, which has a significant impact on shortening their technical lifetime. However, they can operate in reverse mode as fuel cells, which is a very important advantage, on the other hand [37]. High-temperature electrolysis is more advantageous when an external heat source is available [36].
An important aspect that must be taken into account in the selection of an electrolyzer is its flexibility, which is particularly important in the context of the use of this type of equipment for stabilizing the operation of RES units (wind and photovoltaics). In this element, the PEM electrolyzer performs better than ALK, as it can be started up in less than a minute. The start-up time for ALK electrolyzers ranges from 20–60 min [38], although some companies claim to be able to significantly reduce the start-up and response time in the 10–100% load change range to as little as a few seconds. The specifications of the electrolyzer types taken into account are shown in Table 2. These parameters will be subject to change over time, due to the rapid technological advancement.
Table 2.
Types of electrolyzers and their specification [7].
Increasing the scale of application of electrolyzers is expected to lead to their further improvement—the production of equipment with increasingly higher power and efficiency. This, in turn, is expected to result in lowering the price of the production of “green hydrogen”. As for the production of “green hydrogen”, the problem is also the high price of electricity, which also translates into the total cost of fuel [39].
3.2. Cost of Electrolyzers
Table 3 presents the current and future CAPEX estimations for the electrolyzer types, taken into account in the modeling calculations. Figure 3 shows the expected trends in the decrease of these costs, which will have a significant impact on the economics of Power-to-H2 projects. The costs given below refer to the units of 5 MW. According to these projections, CAPEX has a high potential to go down due to the technology learning curve and scaling of production.
Table 3.
CAPEX for electrolyzers [USD’2020/kWel] [7].

Figure 3.
CAPEX for electrolyzers projections [7].
O&M operating costs for PEM and ALK electrolyzers are very similar at an average of 2% CAPEX per year and 5% for SOE [40,41,42,43]. These parameters are not expected to change noticeably in the near future. The cost of electricity, along with investment costs, is one of the main components that affects the total cost of “green hydrogen” generation. In the case of systems integrated with RES, it is closely interrelated with the cost of generating energy from these sources. The levelized cost of electricity (LCOE) for wind and PV is expected to drop noticeably in the future, which will improve the economics of systems generating this type of hydrogen. The decline in investment costs for wind and PV is expected to continue (due to increased efficiency of generation equipment and falling cost of installations in line with the learning curve) [44,45,46,47].
4. Costs of Hydrogen Production
Currently, the cost of producing “green hydrogen” is at least double that of obtaining hydrogen by steam reforming hydrocarbons. However, this cost is expected to change in the future as the prices of electrolyzers decrease and the unit cost of generating electricity from RES decreases. Figure 4 provides a comparison of the cost of hydrogen from different technologies. It illustrates that, by around 2030, the production of “green hydrogen” should become competitive against conventional hydrogen production methods based on fossil fuels [8]. The cost-effectiveness of fuel cells largely depends on the cost of electricity needed to produce pure hydrogen (the lower the cost of this energy, the more cost-effective the cells will be) and the cost of diesel fuel, which is a competitor to fuel cells.

Figure 4.
Hydrogen production costs comparison (own assumptions based on [8]).  , Brown hydrogen” (coal gasification);
  , Grey hydrogen” (methane reforming);
  , Blue hydrogen” (methane reforming + CCS/CCU);
  , Green hydrogen” (electrolyzer + wind onshore PP);
  , Green hydrogen” (electrolyzer + wind offshore PP);
  , Green hydrogen” (electrolyzer + PV);
  , Biohydrogen” (HyBECCS).
, Brown hydrogen” (coal gasification); , Grey hydrogen” (methane reforming); , Blue hydrogen” (methane reforming + CCS/CCU); , Green hydrogen” (electrolyzer + wind onshore PP); , Green hydrogen” (electrolyzer + wind offshore PP); , Green hydrogen” (electrolyzer + PV); , Biohydrogen” (HyBECCS).
Accelerating the development of RES will further drive the advancement of the hydrogen economy. A pertinent question arises regarding the necessary installed capacity of RES in Poland and Europe to generate a sufficient surplus of energy for the production of “green hydrogen”, assuming the goal of achieving full decarbonization of the European economy.
5. Technological Solutions for Hydrogen Utilization
5.1. Electricity and District Heat Generation
For the production of electricity and heat, cogeneration systems based on fuel cell technology are the optimal solution using hydrogen. A fuel cell is a device that converts the chemical energy of a fuel (e.g., hydrogen, methanol, natural gas) into electricity and heat. Unlike batteries, they work as long as fuel and oxidizer are supplied. Hydrogen can be converted in fuel cells into electricity and heat with efficiencies up to 90%, or alternatively burned in combined cycle gas power plants with efficiencies reaching 60% [48]. Although an energy storage in batteries is already well known and popular, this technology is not viable for storing large amounts of energy or with a discharge duration longer than 4–8 h [49]. For large-scale and long-term energy storage, converting electricity to hydrogen is a more cost-effective option [50]. There are currently many types of fuel cells, consisting of three basic components: the two electrodes and the separating electrolyte. The basic types of fuel cells are outlined below [51]:
- Proton exchange membrane fuel cells—PEMFCs;
- Alkaline fuel cells—AFCs;
- Phosphoric-acid fuel cells—PAFCs;
- Solid-oxide fuel cells—SOFCs;
- Molten-carbonate fuel cells—MCFCs.
The classification given above determines the type of electro-chemical reactions that perform in the cell, the type of catalysts used, the operating temperature range, as well as the type of fuel. AFC is a mature technology for large systems, whilst PEMFCs fuel cells are more elastic and dedicated for small decentralized options. The conversion efficiency for both technologies is in the range of 65~70% (lower heating value) [52]. High temperature fuel cells (like SOFCs) are currently under development and could represent a very valuable alternative to PEM and alkaline systems, with efficiencies reaching up to 90%. Among all available technologies, solid-oxide fuel cells have the highest efficiency and allow the use of a wide variety of gases as fuel. SOFC cells operate in the temperature range of 600–900 °C, requiring dedicated materials [53]. One of the hallmarks of the technology is its modularity, which allows individual cells to form stacks and then combine such units into larger systems. As a result, a single system for generating electricity and heat can consist of one or a number (even hundreds) of SOFC modules that fully meet the needs of the end customer [54].
The most important feature of fuel cells in the context of their application in the electric power sector is that fuel cells combined with hydrogen production can improve resilience by meeting the energy storage needs of electric grids constrained by intermittent RES generation, e.g., wind and solar [55].
In addition to fuel cells, another way to generate hydrogen-based electricity and heat is through dedicated gas turbines. Since 2015, turbine manufacturers have been testing hydrogen combustion in turbines with capacities ranging from a few to several hundred megawatts. Unlike biomethane, which could almost instantly replace natural gas in the existing power plants, the use of hydrogen is technologically challenging. In terms of mass, the energy density of hydrogen is more than twice that of natural gas, but the energy density relative to volume is low [56]. Hydrogen burns very easily, with an invisible clean flame. Unlike natural gas, hydrogen also burns faster. Some energy industry companies declare that all of its newly manufactured gas turbines are capable of burning a fuel mixture with varying hydrogen content. Smaller hydrogen contents, approx. 10–30% by volume, require virtually no modifications to new units, although this ultimately depends on the type of turbine. The addition of up to 50% or even 70% hydrogen may require modifications to the burner and control systems for combustion control and safety. Hydrogen content above 70% in the gas being burned is already associated with mandatory modifications to ensure safe, stable combustion that meets emission standards. General Electric (GE) has developed a dedicated combustion system that can operate on a mixture of natural gas and 50% hydrogen. Ultimately, the GE HA turbine is expected to have the ability to burn 100 percent hydrogen. Plants where GE turbines partially burn hydrogen are in operation around the world. An example is South Korea’s Daesan refinery, where for more than 20 years the GE 6B turbine has also been operating, burning gas blended with 70% to as much as 95% hydrogen.
5.2. Transportation
According to the EU [1] and the Polish Hydrogen Strategy [6], the main sectors for hydrogen utilization are energy, industry, and transportation. In transportation, many EU countries prioritize the use of hydrogen, particularly in vehicles designed for intensive use, such as buses, trucks, trains, ships, and aviation. Transportation is the area of the economy that will be the first to undergo the hydrogen revolution, as fuel cell technologies have reached a stage of high efficiency that allows for serial production and commercialization. However, the development of hydrogen in the transportation sector faces a significant barrier in terms of distribution infrastructure. The European Commission has been actively working to shift transportation to low-carbon sources, introducing legislative initiatives such as the European alternative fuels strategy [57] and the European Strategy for Low-Carbon Mobility [58]. The Polish law and regulations proposed by the European Commission set ambitious targets for member states, local governments, city authorities, and municipal companies to achieve real reductions in emissions from a sector that globally accounts for up to 25% of total greenhouse gas emissions. The EU has made it clear that, after 2035, new car models emitting carbon dioxide, specifically those with diesel engines, will no longer be registered [59]. In June 2022, the European Parliament and EU member countries have reached an agreement to ban the sale of new petrol and diesel cars and vans, further expediting the shift towards alternative fuel vehicles, including hydrogen-powered ones. Initially, hydrogen transportation will be implemented in public transportation. A hydrogen bus, for example, can save up to 800 tons of CO2 in its 12-year lifespan, compared to an internal combustion engine bus. Hydrogen propulsion seems more promising, because buses equipped with fuel cells have a longer range than lithium-ion battery vehicles [60].
Hydrogen buses may become more cost-effective than electric vehicles in the near future. This is expected to be facilitated by the development of infrastructure and technology that reduces production costs. It is important to point out here the recent decline in the cost of purchasing hydrogen buses. The first prototypes cost about EUR 2 million, whereas last year the price limit for the tender reached EUR 600,000 and in the future the price is expected to decrease substantially [61]. This is compounded by significant subsidies from the EU. For this reason, many local governments in Poland are planning to purchase hydrogen buses in the coming years. Looking ahead to 2030, it is expected that 7000 to 14,000 hydrogen buses will serve public transportation in Polish cities [6].
Hydrogen buses are now running in at least 35 cities in Europe. Major automotive and transportation companies are working on solutions to reduce costs on the one hand and improve range on a single refueling on the other. Current technological solutions allow 30 to 80 kg of hydrogen to be refueled in 10 to 15 min and at a pressure of 35 or 70 MPa, depending on the model. The amount of refueled hydrogen provides a range of at least 400 km [62]. These are parameters comparable to today’s trucks, so all these characteristics and the basic advantage of providing zero-emissions with “green hydrogen” shows that the next area of rapid development will be trucks. The advantage that hydrogen-powered trucks have over the trucks powered by lithium-ion batteries is their lower weight. Given the weight of batteries, long charging times, and limited range under current technology, electric powertrains are not the best choice for trucks. Particularly promising from today’s perspective is the method of refueling liquid hydrogen (“subcooled” liquid hydrogen, “sLH2”). This innovative solution makes it possible to increase storage density, increase vehicle range, speed up refueling, and achieve higher energy efficiency. The new method will use higher than atmospheric pressure and a special temperature control to avoid the formation of liquefied gas vapors during refueling (the so-called boil-off effect) and the flow of return gas (from the vehicle tank to the tank at the filling station) [63].
Also, the rail transportation is identified as the area with large potential for implementing hydrogen technology. In Poland, the average age of diesel locomotives used in the passenger transport (108 units) was slightly more than 42 years, and in the freight transport (2146 diesel locomotives)—39 years (figures for 2019) [64]. This indicates the necessity of replacing a significant part of the existing fleet, which represents a potential opportunity to switch its fuel supplying system to alternative energy sources [65]. We can also expect the imposition of additional fees for the use of internal combustion rolling stock or, in the longer term, a regulatory restriction on the use of internal combustion engines in rolling stock, similar to what has been announced for road transport. The Polish administration is also active in creating a legal framework for the application of low-carbon sources in the national economy. The adopted Strategy for Sustainable Transport Development until 2030 (SRT2030) [66] lists reducing the environmental impact of transportation as the fifth direction of intervention. The scope of activities in this area provides for, among other things:
- Modernization of rolling stock (vehicles and alternative fuel infrastructure);
- Supporting low-emission transport, including switching a road transport to rail;
- Promoting means of transportation powered by alternative energy sources (reducing the dependence of the transport sector on conventional fuels).
The average level of the electrification of railroad routes in the European Union is currently about 62%, with the remaining routes being served by diesel-powered locomotives. It is estimated that about 20% of rail transportation in the EU is carried out by diesel locomotives [67]. Hydrogen locomotives will be implemented first on those routes that have not been electrified to date. Diesel locomotives will naturally be replaced by hydrogen locomotives.
5.3. Industry
Hydrogen is widely used in several key industries. Currently, the production of hydrogen for industrial use is mainly performed by methane reforming (“grey hydrogen”). However, this is a process that is characterized by high greenhouse gas emissions, and in the future, this type of hydrogen will have to be gradually replaced by hydrogen derived from RES. Replacing natural gas used to produce hydrogen in industrial processes with “green hydrogen” is part of the EU’s energy and climate policy, and is strongly supported at both regulatory and financial levels. Currently, the largest demand for hydrogen is in the chemical industry (production of ammonia, from which fertilizers are obtained) and in the refining industry in the following processes:
- Reforming—which aims to raise the octane number of the fuel;
- Hydrotreating, hydrodesulfurization—which allows the reduction of the content of sulfur, nitrogen, and oxygen compounds and get rid of unsaturated compounds that reduce fuel stability;
- Hydrocracking—which involves converting heavy petroleum fractions such as lubricants or heavy oils into light oils and gasoline [68].
Hydrogen is also used in the food industry to protect food from oxidation in hermetic packages. It is also used in the process of hydrogenation of fats, particularly in the production of margarine. Fats hydrogenation involves the addition of hydrogen to the double bonds present in the acidic residues of unsaturated fat in the presence of a nickel catalyst. In the food industry, hydrogen is also used in the process of synthesis of sorbitol, a sweetener [69]. In the iron and steel industry, hydrogen is considered a valuable alternative to coke, coke oven coal, and gas. The world’s largest steel companies are working on methods to enable the substitution of fossil fuels in the steelmaking process. Hydrogen can be used in these processes as a reductant of iron compounds contained in its ores and as a fuel for heating the feedstock in blast furnaces. However, using hydrogen to decarbonize the economy requires obtaining it in a way that does not generate emissions. This is only possible with hydrogen extracted through electrolysis using electricity from a non-carbon-emitting source [70].
6. Methods of Calculation
The role of “green hydrogen” in the Polish and EU electricity system was evaluated by applying the energy model MEESA [71] linked with the Computable Equilibrium Model (CGE) [72] and the transport model TR3EE [73]. MEESA (Model for European Energy System Analysis) is a linear optimization model written in the GAMS programing language. It was developed based on the OSeMOSYS platform [74]. The model finds the lowest cost feasible solution for the system under given set of constraints (the objective function is the least system cost in the system over the whole analyzed period).
The model was developed within the Centre for Climate and Energy Analyses (CAKE). More details concerning the MEESA model can be found in the dedicated documentation [75]. In this paper, only general information about the methods applied in the model are described.
MEESA is a model of energy system of EU+, created for the long-term integrated assessment and energy planning. The main objective of the presented tool is to comprehensively analyze the implications of energy strategies aimed at transitioning to a zero- or low-carbon economy.
The MEESA model was created to formulate and evaluate alternative energy supply strategies, which are in line with the user-defined constraints such as limitations on energy sources, norms of emission and reduction targets, policy and market regulations, crossborder energy flow technical limitations, required share of RES in given period, etc. The model takes into account the most important dynamics and relations, occurring in the electricity sector, in order to reflect its functioning as completely as possible.
In addition to the MEESA model, the toolkit elaborated within CAKE also includes a global model d-Place [72] and transport model TR3E [73] (Figure 5). The use of an integrated set of models makes it possible to analyze key aspects involving energy and climate policy actions in all sectors of the EU+ economy. It uses computational loops with a specific sequence of actions. Initially, the emission price and electricity, heat, and hydrogen demand are determined endogenously by the d-Place model, taking into account all sectors in specific region. Then, this parameters are forwarded to the MEESA model, which, using its detailed representation of energy sector, provides a new estimates of CO2 emissions, electricity, heat, and hydrogen generation costs as well as capital expenditures in the power sector. In the next iteration, this estimates are used in the d-Place model to recalibrate the emission intensity of the power sector and establish new energy demand based on the new energy prices. In this process, the d-Place model also uses results provided by the transport model TR3E. Subsequently, the new set of inputs are transferred to the MEESA model and the whole process is repeated, until a satisfactory convergence of parameters between the models is achieved [76].

Figure 5.
General scheme of operation of models in the LIFE Climate CAKE PL project. Source: Tatarewicz et al. [75].
This approach makes it possible to identify the impact of changes in one sector on other sectors and the economy as a whole. For example, an increase in hydrogen demand in the transportation sector affects the electricity sector, its structure and operating costs, and also affects the balance of emissions across the economy.
The MEESA model is used to characterize the supply side of electricity, district heating, and hydrogen coming from electrolysis. This aim of this model is to support energy policy planning and the preparation of impact assessment analyses that require a high level of technological detail. An important feature of the model is a relatively detailed (for optimization model) temporal resolution, allowing an analysis of the load of units characterized by intermittent operation, which makes it possible to assess the impact of such technologies as RES technologies, energy storage, or DSR services. The model uses several types of days reflecting typical variation of weather conditions (windy and sunny days) for different seasons as well as different demand profiles for each type of day. One day is divided into twelve 2 h periods, which allows the reflection of typical daily changes in PV generation, short periods of peak demand, and schemes of operation of energy storages (especially short-time energy storages like batteries or hydro-pumped power plants).
The MEESA model minimizes the cost of the energy mix (electricity, district heat, hydrogen), meeting the set of constraints and minimizing the total discounted cost in the system and analyzed period of time.
For a given level of demands for electricity, district heat, and “green hydrogen”, the model provides sufficient supplies, utilizing the technologies and resources defined in the model by the user. The demand for electricity and commercial heat, exogenous to the model, is given at the first level of the energy chain, and the model calculates the demand at subsequent levels of the chain up to the energy resource level (one by one from the left side of the Figure 6 to the right). The value of the objective function, which is set by the user at the initial stage of analysis, determines the solution which is optimal according to the criteria specified [75]. Figure 6 shows a simplified representation of energy chain applied in MEESA model.

Figure 6.
Schematic presentation of energy chain. Source: CAKE/KOBiZE, Warsaw, Poland.
As noted above, the system operating costs in the MEESA model are optimized throughout the whole supply chain, taking into account each element of the network. At the moment, approximately 55 different technology types are defined in the model, including existing and new conventional thermal units, RES, energy storages, electrolyzers, and DSR services. Each technology defined in the model was assigned an appropriate CO2 emission factor related to its generating unit, which allows to calculate the total emissions from the power sector and to include the derived costs in the optimization process.
The MEESA model is included in a computational loop with the model d-Place and the other sector model TR3E. This allows for the analysis of the impact of changes in the power and heat sector on the overall economy and individual sectors. However, the iterative nature of the calculation process, with the use of several models, causes a significant increase in the calculation time. Therefore, for better computing efficiency, EU+ countries have been grouped into 9 larger regions:
- BEN—Belgium, Luxembourg, the Netherlands;
- CEU—Austria, Switzerland, Czech Republic, Hungary, Slovakia, Slovenia;
- IBI—Italy, Malta, Portugal, Spain;
- NTH—Denmark, Estonia, Finland, Lithuania, Latvia, Norway, Sweden;
- STH—Bulgaria, Greece, Cyprus, Croatia, Romania;
- UKI—Ireland, United Kingdom;
- DEU—Germany;
- FRA—France;
- POL—Poland.
The same regional aggregation was used in the CGE model and in the energy model.
The d-Place model is a recursive-dynamic global and multi-sector computable general equilibrium (CGE) model (based on a static CGE model). The d-Place model was developed mainly to examine the impact of energy and climate policy on the economy. The input data underlying the base year calibration in the d-Place model come from the GTAP-10 (Global Trade Analysis Project) database. The d-Place model distinguishes 21 sectors (industries) and 11 regions (10 EU+ regions and a single rest of world region). From the perspective of this study, the main role of the CGE model is twofold. First, it determines the demand—from households and industries—for electricity, hydrogen, and district heating (supplies of which are modeled in MEESA). Second, as an economy-wide model, including both energy and industrial sectors, as well as air and water transport, it allows us to assess allowance prices (marginal abatement costs) in the EU ETS, consistent with the emission reduction targets. Demand determines the level of demand for particular fuels and energy carriers in all final consumption sectors. Industries and consumers adjust their end-use patterns changes in response to changes in relative prices of different fuels and technologies (including the cost of emissions), whereby prices of electricity and hydrogen are determined by MEESA.
It is assumed that hydrogen can substitute natural gas in industrial sectors, as well as substitute oil uses in most sectors (including, inter alia, construction, agriculture, and water transport; in the latter case it is assumed that hydrogen is transformed to ammonia). The use of hydrogen starts as soon as it becomes cost-competitive compared to the other fuels (emission cost included), but the process of substitution is stretched out in time, so that that is only partial even in the final simulation years. We have not assumed the use of hydrogen by households for heating purposes. The production process is modelled using nested constant elasticity of substitution and Leontief production functions. More details concerning the d-Place model can be found in its documentation [72]. Projections of demand for electricity, district heating, and hydrogen from the industrial, municipal, and commercial services sectors are derived from the d-Place model.
The demand for electricity and hydrogen in the transportation sector is generated by the TR3E model, which simulates changes in transportation activity, including the selection of transport types and modes in the passenger and freight transport, the choice of fuels used, and strategies for reducing CO2 emissions in the sector. The model consists of two modules: the demand module (in which flows of transportation activity are calculated) and the supply module (in which more detailed characteristics of vehicle categories and technologies are developed). More details on the TR3E model can be found in the dedicated documentation [72].
7. Modeling Assumptions
7.1. Scenarios
Calculations were conducted to assess the potential for “green hydrogen” production in Poland and the EU+ under four different scenarios. These scenarios vary in the scale of availability of specific technologies crucial for emission reduction in the energy sector. While all scenarios aim to achieve climate neutrality by 2050, they differ in the approaches taken to achieve this goal:
- (1)
- The EU Climate Neutrality Scenario (fit)—a baseline scenario assuming approximately 90% emission reductions in 2050 vs. 1990 and zero net emissions (including removals) across the EU+ economy. This scenario assumes the achievement of the targets set in the Fit for 55 package for given time frames with the ultimate goal of achieving climate neutrality by 2050.
- (2)
- The EU Climate Neutrality Scenario with low CCS utilization in the EU+ (low_ccs)—assumes the same overall conditions as above, except significantly lower (about 30% lower than in fit scenario) potential of carbon storage technology in the energy sector. This limitation applies to all CCS technologies but, from the system perspective, the most important is the reduced development of BECCS technology, as it is one of the few technologies capable of generating negative emissions in the energy sector. This scenario shows the impact of lower emission reduction potential in the power sector on CO2 and energy prices, which in turn may affect the demand for hydrogen.
- (3)
- The EU Climate Neutrality Scenario without new nuclear power plant in the EU+ (no_nuc)—scenario for achieving climate neutrality in the EU+ without wider development of nuclear power (no new nuclear power plants will be built and the existing power plants will be operating until the end of their lifetime). It is intended to provide an answer to the question of whether it is possible to generate the energy surplus needed to produce “green hydrogen” using mainly non-controllable RES sources.
- (4)
- The EU Climate Neutrality Scenario with a higher amount of “green hydrogen” available in the EU+ (hi_hyd)—a scenario assuming a higher potential for electrolyzers construction in the EU+ in comparison to the fit scenario and subsidies for hydrogen production in the 2025–2035 period. The subsidies are at the level of 15 EUR/GJ in 2025–2030, then decline to 5 EUR/GJ in 2035. There are no subsidies after 2035. The same level of subsidies was used in all regions except Poland. In the case of Poland, due to very high electricity prices in 2030, the level of subsidies necessary to promote faster development of hydrogen production was about twice as high than for other regions.
7.2. Techno-Economic Parameters
The techno-economic assumptions for most of the electricity, district heating, and hydrogen generation technologies defined in MEESA were based on the final assumptions adopted in the PRIMES Reference Scenario 2020 [77].
The techno-economic parameters and potentials of the key generating units adopted in the MEESA model are available in the dedicated documentation [75].
7.3. Fuel Prices
Primary fuel prices, excluding biomass, were assumed for the calculations based mainly on projections coming from the PRIMES Reference Scenario 2020 (in 2025 gas prices are 3 times higher than in the Reference Scenario 2020 forecast, coal prices 2 times higher, and oil prices 1.5 times higher. From 2030, prices return to the path of the Reference Scenario 2020 forecast) [77]. Prices for biomass were adopted from different literature sources and they are basically the result of an expert assessment based on statistical information and available forecasts published by branch institutions. The fuel price projections used for the calculations take into account the current situation in the European market, resulting from the conflict in Ukraine and the Russian Federation’s efforts to push energy prices in the EU+ to the highest possible levels. It is assumed that this situation is temporary and will last about five years.
8. Results
This part of the article presents the results of analyses carried out for the scenarios considered in terms of:
- ○
- CO2 allowance prices;
- ○
- Electricity and hydrogen demand;
- ○
- Electricity generation structure—including electricity generated from the “green hydrogen”;
- ○
- “Green hydrogen” production;
- ○
- “Green hydrogen” costs.
8.1. EU ETS Allowance Prices
CO2 allowance prices are determined through iterative process between the MEESA model and the d-Place and the TR3E models. The MEESA model provides information on the demand for emission allowances in the power sector based on the allowance’s price. This information is combined with the demand for emissions in the other sectors within the EU Emissions Trading System (EU ETS). The price is then determined by equalizing the total demand for allowances with the fixed supply of allowances (determined by exogenous emission reduction targets). Therefore, the prices of CO2 emission allowances in this methodology are not exogenous data, but are results of model calculations which take into account emission reduction targets along with changes in the energy mix and process emissions in the EU ETS sectors. This approach allows the establishment of a marginal cost of CO2 emission abatement in a given year. The results of these calculations, obtained for all the scenarios considered in the analysis, are presented below. They have implications for the future structure of electricity generation, as well as the pace and extent demand for “green hydrogen”, as described in the following sections.
The key conclusions from the analysis of the CO2 marginal abatement cost curve for the scenarios considered are as follows:
- -
- With the low potential of CCS—especially BECCS—the marginal cost of CO2 abatement increases significantly (see Figure 7). This means that BECCS technology has a key impact in the period in which no emissions are allowed (around 2050). The “fit” scenario assumptions require the power sector to achieve negative emissions (offsetting emissions from other sectors) in the final year. The inability to do so raises the cost of reductions.
 Figure 7. Marginal CO2 abatement costs for analyzed scenarios [EUR/t]. Source: Models d-Place and MEESA.
 - -
- The lack of new nuclear power plants raises the marginal abatement cost in EU ETS.
- -
- The lowest CO2 marginal abatement costs are in the scenario hi_hyd. This scenario assumes the high potential of CCS, nuclear, and electrolyzers.
8.2. Electricity Generation Mix
Hydrogen, electricity, and district heat demand, together with carbon prices, are the primary inputs from the d-Place economic model. They determine the required level of generation capacity in the system and determine the future investment needs in the power sector. The final hydrogen demand is a parameter provided by the d-Place and TR3E models, as well as demand generated internally within the MEESA model. The same applies to electricity, for which the MEESA model calculates additional consumption related to the energy required for charging energy storages systems, powering electrolyzers and heat pumps. The demand for hydrogen in the MEESA model is primarily driven by the need to enhance system flexibility. In the electricity sector, hydrogen serves mainly as a long-term energy storage. In the computational model adopted, hydrogen is produced through the process of electrolysis, preferably during the periods of low electricity prices (the days), to meet the demand for hydrogen. The prices of electricity, district heat, and “green hydrogen” generated in the MEESA model for a specific year, serves as the inputs to the d-Place model in the next computational iteration and affect the estimated new level of demand. This iterative process is repeated until the equilibrium between models is achieved (typically it requires about 15 to 20 iteration to reach a satisfactory level of convergence). The demand projections for electricity generated by the d-Place model and sectoral models are presented in Table 4 (demand for hydrogen is presented later in this chapter). This table also shows the additional electricity demand from electrolyzers and heat pumps, as determined by the energy model.
Table 4.
Electricity demand.
Compared to the fit scenario, electricity demand rises in the low_ccs and hi_hyd scenarios, while it decreases in the no_nuc scenario. In the case of the low_ccs, this is mainly due to the higher rate of electrification in other sectors. Lower emission reduction potential in the energy sector puts additional pressure on replacing fossil fuels by electricity, especially in industry, despite higher electricity prices. At the same time, due to the higher prices, the electricity consumption for heat pump and electrolyzers is lower than in the fit scenario.
The no_nuc scenario is characterized by a large decrease in energy demand, both in final consumption and in the energy sector itself. It is driven by higher electricity prices and insufficient amount of energy surpluses form renewable sources. The situation is especially visible in countries with limited RES potential, such as Poland.
In the hi_hyd scenario, energy consumption increases both in the final demand and in heat pumps and electrolyzers. As a result, overall demand for electricity is the highest in this scenario (which is quite obvious as this is the best case scenario).
Electricity generation mix depends both on carbon prices and energy demand. Figure 8 shows changes in the structure of electricity generation, for Poland and the EU+ as a whole.

Figure 8.
Electricity generation by fuels and technologies for analyzed scenarios in Poland and the EU+. Source: Model MEESA.
All scenarios, for both Poland and EU+, are characterized by a high share of RES in the generation mix. This is an important factor for “green hydrogen” production because, for the best cost effectiveness, hydrogen should be generated from surplus RES production.
Most of the hydrogen produced through this method is consumed by other sectors, but part is used in gas turbines for electricity generation (and in some cases district heating) (HYD). The broader use of this fuel in the energy sector is limited by the capacity of electrolyzers and the relatively high cost of electricity generation using this method. These systems can operate using natural gas or hydrogen and are primarily used for peak demand. When operating on hydrogen, it acts as a long-term energy storage and ensures system flexibility. The contribution of hydrogen to electricity generation in Poland is not expected to be significant before 2040. However, this outlook can change depending on the level of financial support dedicated to the development of the hydrogen market, which could alter the situation. The subsidy level adopted in the hi_hyd scenario was sufficient to increase hydrogen consumption in other sectors, but still insufficient to encourage the use of hydrogen in the energy sector.
An important precondition for increasing the share of hydrogen in the Polish energy mix is the implementation of the nuclear power development program [78]. Nuclear power plants, operating in the load base, will cause a considerable amount of surplus energy from RES to appear for producing the “green hydrogen”. In the scenario with constraints on the construction of new nuclear power plants in Europe, including Poland (no_nuc), there are strong limitations on the development of “green hydrogen” production. This is one of the main conclusions from comparisons of the no_nuc scenario with the other scenarios. What should also be noted when analyzing the results presented in Figure 8 is that electricity production falls significantly in this scenario. This is due, on the one hand, to the higher cost of electricity production, which translates into a decrease in consumption and, on the other hand, to the presence of limitations in the potential of the other carbon-free generation sources. In the low_ccs scenario, limitations to the availability of CCS technology cause an increase in the use of nuclear power and hydrogen.
Detailed results for different load zones provide some additional information. The results presented below show power generation in Poland, for different characteristic days in 2050, for the fit scenario (Figure 9) and for the no_nuc scenario (Figure 10). Each bar in both graphs represents a period of 2 h.

Figure 9.
Power generation in the 2 h periods for characteristic days in 2050 (Poland, fit scenario) [GW]. Source: Model MEESA.

Figure 10.
Power generation in the 2 h periods for characteristic days in 2050 (Poland, no_nuc scenario) [GW]. Source: Model MEESA.
In the two examples shown, it can be seen that hydrogen is produced, mainly during periods when there is a surplus of electricity above the demand and during periods characterized by low demand and low energy prices. Another important observation is that a surplus of RES energy is much higher in the scenario with nuclear power plants. In the fit scenario, natural gas consumption is small and limited only to a few periods of high demand. Even as a peak source, it is largely replaced by hydrogen. At the same time, the base load is provided by nuclear power plants, which increases the surplus production of renewable energy, which can be used for electrolyzers and energy storage.
With a lack of stable zero-carbon energy sources (no_nuc scenario), excess production from RES over demand is greatly reduced and does not provide enough energy for hydrogen production at a reasonable cost. As a result, the model reduces or completely discards the use of hydrogen as an energy storage in the power sector. This also leads to the high consumption of natural gas during winter days with low wind energy production, despite very high emission prices. As a result, electricity costs also increase.
8.3. Hydrogen Demand and Production
Table 5 presents the obtained projections of hydrogen demand broken into energy sector and other final demand sectors. It is worth mentioning that, in our case, demand equals production, because no assumption was made to import hydrogen to the European Union from the third countries, and only the potential and possibilities of its production within the EU were studied. These results indicate that, in all scenarios, hydrogen is produced mainly for the final energy demand sectors, where emission reductions are technically difficult to achieve: in particular, for transportation and industry. The use of hydrogen in the energy industry is mainly reduced to the role of long-term storage. In other words, producing hydrogen in electrolyzers and using it in dedicated turbines makes no economic sense. A cheaper solution is battery storage, except that their charge and discharge modes allow energy to be stored only for short periods.
Table 5.
Hydrogen demand.
In the fit scenario, hydrogen production in 2050 is slightly above 5000 PJ in EU+ and less than 200 PJ in Poland. In Poland, about 35% of hydrogen is used in power generation and 65% in other sectors. At the level of the entire EU+, the share of hydrogen production for energy applications is slightly lower (25%). In the fit scenario, the model makes maximum use of the available electrolyzer potential.
The low_ccs scenario shows lower final demand for hydrogen, but the share of hydrogen consumption in the power sector is higher than in the fit scenario, probably due to the high emission allowances prices and the urgent need to replace natural gas with hydrogen in this sector.
The result for the no_nuc scenario indicates significantly lower hydrogen consumption both in the energy sector and final demand. In the case of Poland, this effect is even stronger because hydrogen is not used at all for the production of electricity and heat—only the demand from other sectors is satisfied, and is significantly reduced due to the higher cost of hydrogen. This confirms that nuclear power is important in the context of the development of the hydrogen economy. In the situation of the limited potential of RES, nuclear power plants allow for greater green electricity surpluses, which affects the availability and price of “green hydrogen”.
The highest volumes of hydrogen production were obtained in the hi_hyd scenario, which is reasonable given that this scenario assumed a higher potential for electrolyzer expansion. Nevertheless, the model did not rely on the maximum values of the assumed potential. This is an important observation, because it shows that the large development of electrolyzers might also be limited by other factors determining its cost effectiveness. The availability of surplus RES production, the shape of the demand curve, the scale of the development of battery storage, and even the share of electric cars will also affect the use of hydrogen in the energy sector.
Very low “green hydrogen” production in 2030 in all scenarios except hi_hyd (which assumes subsidies for hydrogen production) shows that the fast development of this technology without substantial subsidizing is highly unlikely. Especially at the beginning in 2025–2030 “green hydrogen” requires significant financial support.
Results show steady growth in hydrogen consumption in the EU+ for the whole time, while for Poland the initial growth rate is much lower (in all scenarios without subsidies). Also, in the case of Poland, a much lower hydrogen production is clearly visible in the no_nuc scenario.
Figure 11 presents a comparison of results obtained in the analysis with the results coming from the studies described in Section 2. The comparisons show that, in the initial period of analysis, the obtained results are in the lower ranges of the hydrogen demand forecasts. This is due to the high cost of “green hydrogen” production during this period, which, despite subsidization, does not provide a sufficient level of competitiveness. Over time, however, the decreasing costs of electrolyzers and the electricity required to power them translate into an increase of the share of hydrogen in the energy balance. In the 2050 perspective, it is possible to ensure that the EU’s hydrogen demand is met based on its own resources, provided that the share of RES in the energy mix is significantly increased.

Figure 11.
Green hydrogen production in the EU+ and Poland for 2030–2050 compared to various demand projections [PJ].
Hydrogen serves a pivotal role in the energy sector, primarily as medium- and long-term energy storage, providing flexibility in systems dominated by intermittent RES. In our analysis, hydrogen is utilized in both gas turbines (GT) and gas turbines with combined cycle (CCGT). Projections for hydrogen usage in the energy sector by 2050 ranges from 67 to 76 PJ/y for Poland and 1066 to 1601 PJ/y for the broader EU+. Concerning hydrogen storage capacity, estimates for the entire EU vary between 390 and 520 GW depending on the scenario. For Poland, the projected capacity lies between 6 to 16 GW. It is important to mention that these storage capacities are used for hydrogen consumed in the power sector as well as in other sectors. Hydrogen, whether stored as compressed gas, ammonia, or synthetic methane, offers a sustainable long-term storage solution to meet demand across different end-use sectors.
8.4. Hydrogen Cost
In the MEESA model, hydrogen production is exclusively based on electricity from RES (“green hydrogen”). Electricity from RES can be transferred directly to the grid or used for hydrogen production—the model does not include RES technologies that generate electricity solely for the electrolyzers. Therefore, the cost is influenced not only by costs associated with RES but also by the prevailing electricity prices in the system at a given moment. Consequently, the marginal cost of hydrogen depends on many factors, such as the level and structure of demand for electricity, the availability of different technologies, the potential of RES, and many others.
Figure 12 shows the marginal cost of hydrogen production for different scenarios. The gray area shows the range of costs in the EU regions—between the maximum and minimum cost, while the red dotted line shows an average cost.

Figure 12.
“Green hydrogen” marginal cost in the EU+ for 2025–2050 in different scenarios [EUR/GJ]. Source: Model MEESA.
In all scenarios, the initial average marginal cost of “green hydrogen” is around 55 EUR/GJ. The EU+ wide average cost drops below 30 EUR/GJ in 2040. In the fit, low_ccs, and no_nuc scenarios, the average marginal cost increases again after 2045 due to the limited development potential of electrolyzers. Only in the hi_hyd scenario, with this potential significantly higher, the costs continue to decrease slowly after 2045. The figure for hi_hyd scenario shows a difference between an average cost with (red line) and without subsidizing hydrogen (blue line).
There are also interesting differences between marginal hydrogen costs in specific regions. In all scenarios, the highest hydrogen costs in 2025–2040 are found in Poland, which are caused mainly by high electricity cost driven by high carbon prices and there is still a high share of fossil fuels in the Polish energy mix. The no_nuc scenario is especially unfavorable for Poland, where hydrogen cost exceeds 60 EUR/GJ in 2050. In contrast, the lowest costs occur in the Northern Region, composed of the Nordic countries and the Baltic states, thanks to large RES potential. The most stable situation, with low hydrogen costs and the smallest differences between individual EU regions, occurs in the hi_hyd scenario.
The results indicate that the regions with a combination of significant potential for intermittent renewable energy sources and stable zero-emission baseload electricity production, such as large hydro or nuclear power plants, tend to have lower hydrogen production costs. This is because the unstable renewables can provide the necessary electricity for electrolysis during periods of high renewable energy generation, while the baseload sources ensure a continuous and stable electricity supply. By leveraging these characteristics, regions can optimize their hydrogen production processes and achieve cost efficiencies.
9. Conclusions
This paper examines the potential of “green hydrogen” production in Poland and the EU+ in light of the assumptions outlined in the “Fit for 55” package. The magnitude of this potential is intrinsically tied to the hydrogen demand across various sectors, including, industrial, transportation, and energy. This demand primarily stems from the imperative to transition from fossil fuel-based technologies to zero-emission technologies in order to meet EU greenhouse gas reduction targets. Our analysis unequivocally indicates that achieving climate neutrality in the EU hinges on hydrogen playing a pivotal role. To achieve climate neutrality by 2050, Poland will require between 76 and 206 PJ/y of hydrogen, while the EU+ will require from 4449 to 5985 PJ/y.
The potential for “green hydrogen” production is directly tied to the availability of surplus low-cost energy suitable for electrolysis. The greater the installed capacity of RES in the system, the larger the surplus energy available. This article provides estimates for “green hydrogen” production in both Poland and the EU+, reflecting the needs stemming from the 2050 reduction targets, and defines the role of hydrogen in the energy transition.
A prerequisite for the development of this market segment is the presence of affordable energy for the electrolysis process. Such energy can be generated in power systems characterized by a substantial share of RES sources and zero-emission base-load units, such as nuclear power plants.
A primary takeaway is that the largest share of hydrogen production will be associated with industrial and transportation sectors. In the energy sector, the hydrogen will be used primarily as a long-term energy storage and a flexible source to contribute to load balancing. The relatively high costs of hydrogen utilization in the power sector compared to other technologies with similar functions in the system limit its adoption. However, after 2040, the projected significant decrease in the cost of producing “green hydrogen” from EUR 50–60/GJ to EUR 20–30/GJ is expected to drive increased utilization of hydrogen in the energy sector.
Furthermore, our analysis underscores a pressing demand and, consequently, production needs for “green hydrogen” in the end-use sectors, where achieving zero greenhouse gas emissions using current technologies, is not feasible. It is worth noting that the actual demand for hydrogen could surpass our analysis if the development of the hydrogen market in these sectors benefits from various financial incentives or subsidies, factors which were not incorporated in the analytical work carried out for the purposes of this article.
Author Contributions
Conceptualization, S.S., I.T., M.L. and R.J.; methodology, I.T.; writing—original draft preparation, S.S., I.T. and M.L.; writing—review and editing, S.S., I.T., M.L, R.J., M.P. and M.S.; visualization, I.T., M.L. and S.S.; supervision, I.T., M.L. and R.J. All authors have read and agreed to the published version of the manuscript.
Funding
This research has received funding from the European Union’s LIFE Programme and the National Fund for Environmental Protection and Water Management under grant LIFE19 GIC/PL/001205—LIFE VIIEW 2050.
Data Availability Statement
Most of results data can be found on our official website: http://climatecake.pl/.
Conflicts of Interest
The authors declare no conflict of interest.
References
- European Commission. A Hydrogen Strategy for Climate-Neutral Europe. Brussels. 2020, p. 8. Available online: https://knowledge4policy.ec.europa.eu/publication/communication-com2020301-hydrogen-strategy-climate-neutral-europe_en (accessed on 15 March 2023).
- European Commission. Fit for 55: Delivering the EU’s 2030 Climate Target on the Way to Climate Neutrality. Brussels. 2021. Available online: https://eur-lex.europa.eu/legal-content/EN/TXT/?uri=CELEX%3A52021DC0550 (accessed on 15 March 2023).
- European Commission. Powering a Climate-Neutral Economy: An EU Strategy for Energy System Integration. Brussels, Com(2020) 299 Final. 2020, p. 9. Available online: https://eur-lex.europa.eu/legal-content/EN/ALL/?uri=CELEX%3A52020DC0299 (accessed on 20 March 2023).
- European Commission. REPowerEU: A Plan to Rapidly Reduce Dependence on Russian Fossil Fuels and Fast Forward the Green Transition. Brussels. 2022, p. 7. Available online: https://eur-lex.europa.eu/legal-content/EN/TXT/?uri=COM%3A2022%3A230%3AFIN (accessed on 21 March 2023).
- Tagliapietra, S. REPowerEU: Will EU Countries Really Make It Work? Bruegel. 18 May 2022. Available online: https://www.bruegel.org/blog-post/repowereu-will-eu-countries-really-make-it-work (accessed on 23 March 2023).
- Ministry of Climate and Environment. Polish Hydrogen Strategy Until 2030 with an Outlook Until 2040. Warsaw. 2 November 2021. Available online: https://www.gov.pl/web/klimat/polska-strategia-wodorowa-do-roku-2030 (accessed on 25 March 2023).
- Ministry of Climate and Environment. Analysis of the Potential of Hydrogen Technologies in Poland Until 2030 with an Outlook to 2040. Available online: https://klasterwodorowy.pl/images/zdjecia/9_Analiza_potencjalu_technologii_wodorowych_opracowanie.pdf (accessed on 26 March 2023).
- Polish Wind Energy Association; The Lower Silesian Institute for Energy Studies. Green Hydrogen from RES in Poland. Wroclaw. October 2021, pp. 114–143. Available online: http://psew.pl/en/wp-content/uploads/sites/2/2021/12/Report-Green-hydrogen-from-RES-75MB.pdf (accessed on 13 February 2022).
- European Commission. Hydrogen Roadmap Europe. A Sustainable Pathway for the European Energy Transition. Fuel Cells and Hydrogen 2 Joint Undertaking 2019. Available online: https://op.europa.eu/en/publication-detail/-/publication/0817d60d-332f-11e9-8d04-01aa75ed71a1/language-en (accessed on 27 March 2023).
- Tarvydas, D. The Role of Hydrogen in Energy Decarbonisation Scenarios—Views on 2030 and 2050; Publications Office of the European Union: Luxembourg, 2022; JRC131299; Available online: https://publications.jrc.ec.europa.eu/repository/handle/JRC131299 (accessed on 17 June 2023).
- IRENA. Global Hydrogen Trade to Meet the 1.5 °C Climate Goal: Part I—Trade Outlook for 2050 and Way Forward; International Renewable Energy Agency: Abu Dhabi, United Arab Emirates, 2022; Available online: https://www.irena.org/-/media/Files/IRENA/Agency/Publication/2022/Jul/IRENA_Global_hydrogen_trade_part_1_2022_.pdf (accessed on 6 May 2023).
- Oxford Institute for Energy Studies; Institute of Energy Economics at the University of Cologne. Contrasting European Hydrogen Pathways. An Analysis of Differing Approaches in Key Markets. March 2021. Available online: https://www.oxfordenergy.org/wpcms/wp-content/uploads/2021/03/Contrasting-European-hydrogen-pathways-An-analysis-of-differing-approaches-in-key-markets-NG166.pdf (accessed on 10 June 2023).
- DNV. Hydrogen Forecast to 2050. Energy Transition Outlook 2022. Available online: https://www.dnv.com/news/hydrogen-at-risk-of-being-the-great-missed-opportunity-of-the-energy-transition-226628 (accessed on 12 May 2023).
- Trinomics and LBST. Opportunities for Hydrogen Energy Technologies Considering the National Energy & Climate Plans, Fuel Cells and Hydrogen Joint Undertaking. Available online: https://trinomics.eu/project/opportunities-for-hy-drogen-in-necps/ (accessed on 6 April 2023).
- Wolf, A.; Zandre, N. Green Hydrogen in Europe: Do Strategies Meet Expectations? Available online: https://www.intereconomics.eu/contents/year/2021/number/6/article/green-hydrogen-in-europe-do-strategies-meet-expectations.html (accessed on 9 April 2023).
- German Federal Ministry of Economics and Energy (BMWi). Co-Creation Report Prepared by: Global Renewable Energy Community (REN21), European Environmental Bureau (EEB), Renewables Grid Initiative (RGI and Climate Action Network Europe (CAN). Paris Agreement Compatible (PAC) Scenarios for Energy Infrastructure. 2021. Available online: https://www.pac-scenarios.eu/project.html (accessed on 6 April 2023).
- European Commission. Fit for 55 Package—EC PRIMES MODEL, MIX H2 Scenario. Brussels. E3M Lab, University of Athens, Greece. 2021. Available online: https://commission.europa.eu/system/files/2021-07/revision-eu-ets_with-annex_en_0.pdf (accessed on 10 June 2023).
- Teske, S. (Ed.) Achieving the Paris Climate Agreement Goals. Global and Regional 100% Renewable Energy Scenarios with Non-Energy GHG Pathways for +1.5 °C and +2 °C; Springer: Cham, Switzerland, 2019. [Google Scholar] [CrossRef]
- EC JRC. The Net Zero Scenario, Reaching Carbon Neutrality in the EU by 2050. Towards Net-Zero Emissions in the EU Energy System by 2050. JRC118592. Available online: https://publications.jrc.ec.europa.eu (accessed on 20 June 2023).
- BP Energy Outlook. 2023 Edition. The Hydrogen Demand Projections in This Publication Were Made for Two Scenarios: Net-zero and Accelerated. Available online: https://www.bp.com/content/dam/bp/business-sites/en/global/corporate/pdfs/energy-economics/energy-outlook/bp-energy-outlook-2023.pdf (accessed on 2 June 2023).
- McKinsey & Company. Net-Zero Europe Decarbonization Pathways and Socioeconomic Implications; McKinsey & Company: Brussels, Belgium, 2020. [Google Scholar]
- Esposito, E.; Minotti, A.; Fontananova, E.; Longo, M.; Jansen, J.C.; Figoli, A. Green H2 Production by Water Electrolysis Using Cation Exchange Membrane: Insights on Activation and Ohmic Polarization Phenomena. Membranes 2022, 12, 15. [Google Scholar] [CrossRef] [PubMed]
- Suleman, F.; Dincer, I.; Agelin-Chaab, M. Environmental Impact Assessment and Comparison of Some Hydrogen Production Options. Int. J. Hydrogen Energy 2015, 40, 6976–6987. [Google Scholar] [CrossRef]
- Howard, R.; Whitehead, C.; Ganbold, A.; Symons, N.; Jabbour, A.; Aurora Energy Research. From Near and Far: The Economics of Hydrogen Imports. Public Webinar Online. 26 January 2021. Available online: https://auroraer.com/wp-content/uploads/2021/05/Aurora-Hydrogen-Service-HyMAR-Press-Release-Slides.pdf (accessed on 2 June 2023).
- Dincer, I.; Acar, C. Review and Evaluation of Hydrogen Production Methods for Better Sustainability. Int. J. Hydrogen Energy 2015, 40, 11094–11111. [Google Scholar] [CrossRef]
- Full, J.; Trauner, M.; Miehe, R.; Sauer, A. Carbon-Negative Hydrogen Production (HyBECCS) from Organic Waste Materials in Germany: How to Estimate Bioenergy and Greenhouse Gas Mitigation Potential. Energies 2021, 14, 7741. [Google Scholar] [CrossRef]
- Full, J.; Merseburg, S.; Miehe, R.; Sauer, A. A New Perspective for Climate Change Mitigation—Introducing Carbon-Negative Hydrogen Production from Biomass with Carbon Capture and Storage (HyBECCS). Sustainability 2021, 13, 4026. [Google Scholar] [CrossRef]
- Ji, M.; Wang, J. Review and comparison of various hydrogen production methods based on costs and life cycle impact assessment indicators. Int. J. Hydrog. Energy 2021, 46, 38612–38635. [Google Scholar] [CrossRef]
- Ahmad Kamaroddin, M.F.; Sabli, N.; Tuan Abdullah, T.A.; Siajam, S.I.; Abdullah, L.C.; Abdul Jalil, A.; Ahmad, A. Membrane-Based Electrolysis for Hydrogen Production: A Review. Membranes 2021, 11, 810. [Google Scholar] [CrossRef]
- Li, C.; Baek, J.-B. The promise of hydrogen production from alkaline anion exchange membrane electrolyzers. Nano Energy 2021, 87, 106162. [Google Scholar] [CrossRef]
- Gambou, F.; Guilbert, D.; Zasadzinski, M.; Rafaralahy, H. A Comprehensive Survey of Alkaline Electrolyzer Modeling: Electrical Domain and Specific Electrolyte Conductivity. Energies 2022, 15, 3452. [Google Scholar] [CrossRef]
- Zawadzki, P.; Kończak, B.; Smoliński, A. Municipal wastewater reclamation: Reclaimed water for hydrogen production by electrolysis—A case study. Measurement 2023, 216, 112928. [Google Scholar] [CrossRef]
- López-Fernández, E.; Sacedón, C.G.; Gil-Rostra, J.; Yubero, F.; González-Elipe, A.R.; de Lucas-Consuegra, A. Recent Advances in Alkaline Exchange Membrane Water Electrolysis and Electrode Manufacturing. Molecules 2021, 26, 6326. [Google Scholar] [CrossRef] [PubMed]
- Hagen, A.; Caldogno, R.; Capotondo, F.; Sun, X. Metal Supported Electrolysis Cells. Energies 2022, 15, 2045. [Google Scholar] [CrossRef]
- Fallah Vostakola, M.; Ozcan, H.; El-Emam, R.S.; Amini Horri, B. Recent Advances in High-Temperature Steam Electrolysis with Solid Oxide Electrolysers for Green Hydrogen Production. Energies 2023, 16, 3327. [Google Scholar] [CrossRef]
- Elder, R.; Cumming, D.; Mogensen, M.B. Chapter 11—High Temperature Electrolysis. In Carbon Dioxide Utilisation; Elsevier: Amsterdam, The Netherlands, 2015; pp. 183–209. ISBN 9780444627469. [Google Scholar] [CrossRef]
- Mermelstein, J.; Posdziech, O. Development and Demonstration of a Novel Reversible SOFC System for Utility and Micro Grid Energy Storage. Fuel Cells 2017, 17, 562–570. [Google Scholar] [CrossRef]
- Lange, H.; Klose, A.; Lippmann, W.; Urbas, L. Technical evaluation of the flexibility of water electrolysis systems to increase energy flexibility: A review. Int. J. Hydrogen Energy 2023, 48, 15771–15783. [Google Scholar] [CrossRef]
- Kędzierski, M. Hydrogen—The Hope of German Climate and Industrial Policy. Centre for Eastern Studies. Issue 330. 2020, p. 3. Available online: https://osw.waw.pl (accessed on 21 May 2022).
- Christensen, A. Assessment of Hydrogen Production Costs from Electrolysis: United States and Europe; International Council on Clean Transportation: Berlin, Germany, 2020. [Google Scholar]
- Krishnan, S.; Koning, V.; de Groot, M.T.; de Groot, A.; Mendoza, P.G.; Junginger, M.; Kramer, G.J. Present and future cost of alkaline and PEM electrolyser stacks. Int. J. Hydrogen Energy 2023, in press. [Google Scholar] [CrossRef]
- Department for Business, Energy & Industrial Strategy. Hydrogen Production Costs 2021; Department for Business, Energy & Industrial Strategy: London, UK, 2021.
- The Oxford Institute for Energy Studies. Cost-Competitive Green Hydrogen: How to Lower the Cost of Electrolysers? The Oxford Institute for Energy Studies: Oxford, UK, 2022; ISBN 978-1-78467-193-8. [Google Scholar]
- Wiser, R.; Rand, J.; Seel, J.; Beiter, P.; Baker, E.; Lantz, E.; Gilman, P. Expert elicitation survey predicts 37% to 49% declines in wind energy costs by 2050. Nat. Energy 2021, 6, 555–565. [Google Scholar] [CrossRef]
- Asmelash, E.; Prakash, G.; Kadir, M.; REmap Team. Wind and Solar PV—What We Need by 2050—IRENA Insights, Webinar Series. 7 January 2020. Available online: https://www.irena.org/-/media/Files/IRENA/Agency/Webinars/07012020_INSIGHTS_webinar_Wind-and-Solar.pdf?la=en&hash=BC60764A90CC2C4D80B374C1D169A47FB59C3F9D (accessed on 26 May 2023).
- Wind Energy Technologies Office. Experts Predict 50% Lower Wind Costs Than They Did in 2015|Department of Energy. 2 June 2021. Available online: https://www.energy.gov/eere/wind/articles/experts-predict-50-lower-wind-costs-they-did-2015-0 (accessed on 12 May 2023).
- Holechek, J.L.; Geli, H.M.E.; Sawalhah, M.N.; Valdez, R. A Global Assessment: Can Renewable Energy Replace Fossil Fuels by 2050? Sustainability 2022, 14, 4792. [Google Scholar] [CrossRef]
- Olabi, A.G.; Wilberforce, T.; Sayed, E.T.; Elsaid, K.; Abdelkareem, M.A. Prospects of Fuel Cell Combined Heat and Power Systems. Energies 2020, 13, 4104. [Google Scholar] [CrossRef]
- Madeline, R. Short- and Long-Duration Energy Storage Essential to the Clean Energy Transition. Global X Research Team, Spain. 23 June 2022, p. 3. Available online: https://www.globalxetfs.com/short-and-long-duration-energy-storage-essential-to-the-clean-energy-transition/ (accessed on 15 May 2023).
- Hutty, T.D.; Dong, S.; Lee, R.; Brown, S. Long term energy storage with reversible solid oxide cells for microgrid applications. Energy Rep. 2021, 7 (Suppl. S2), 24–33. [Google Scholar] [CrossRef]
- Jawad, N.H.; Yahya, A.A.; Al-Shathr, A.R.; Salih, H.G.; Rashid, K.T.; Al-Saadi, S.; AbdulRazak, A.A.; Salih, I.K.; Zrelli, A.; Alsalhy, Q.F. Fuel Cell Types, Properties of Membrane, and Operating Conditions: A Review. Sustainability 2022, 14, 14653. [Google Scholar] [CrossRef]
- Hydrogen and Fuel Cell Technologies Office. Comparison of Fuel Cell Technologies. Available online: https://www.energy.gov/eere/fuelcells/comparison-fuel-cell-technologies (accessed on 5 July 2023).
- Corigliano, O.; Pagnotta, L.; Fragiacomo, P. On the Technology of Solid Oxide Fuel Cell (SOFC) Energy Systems for Stationary Power Generation: A Review. Sustainability 2022, 14, 15276. [Google Scholar] [CrossRef]
- Salogni, A.; Colonna, P. Modeling of solid oxide fuel cells for dynamic simulations of integrated systems. Appl. Therm. Eng. 2010, 30, 464–477. [Google Scholar] [CrossRef]
- St-Pierre, J.; Du, S. Proton Exchange Membrane Fuel Cells (PEMFCs); MDPI: Basel, Switzerland, 2022; ISBN 978-3-0365-1544-1. [Google Scholar]
- Andersson, J.; Grönkvist, S. Large-scale storage of hydrogen. Int. J. Hydrogen Energy 2019, 44, 11901–11919. [Google Scholar] [CrossRef]
- European Commission. Communication from the Commission to the European Parliament, the European Council, the Council, the European Economic and Social Committee and the Committee of the Regions of 24 January 2017. Clean Power for Transport: A European Alternative Fuels Strategy, SWD 4. 2013. Available online: https://eur-lex.europa.eu/legal-content/EN/ALL/?uri=celex%3A52013PC0017 (accessed on 5 July 2023).
- European Commission. Communication from the Commission to the European Parliament, the European Council, the Council, the European Economic and Social Committee and the Committee of the Regions of 20 July 2017. A European Strategy for Low-Emission Mobility, COM 501. 2016. Available online: https://eur-lex.europa.eu/legal-content/en/TXT/?uri=CELEX%3A52016DC0501 (accessed on 5 July 2023).
- EU Parliament News. EU Ban on the Sale of New Petrol and Diesel Cars from 2035 Explained. Available online: https://www.europarl.europa.eu/news/en/headlines/economy/20221019STO44572/eu-ban-on-sale-of-new-petrol-and-diesel-cars-from-2035-explained (accessed on 21 May 2023).
- Pederzoli, D.W.; Carnevali, C.; Genova, R.; Mazzucchelli, M.; Del Borghi, A.; Gallo, M.; Moreschi, M. Life cycle assessment of hydrogen-powered city buses in the High V.LO-City project: Integrating vehicle operation and refueling infrastructure. SN Appl. Sci. 2022, 4, 57. [Google Scholar] [CrossRef]
- Roland Berger Gmbh. Fuel Cell Electric Buses—Potential for Sustainable Public Transport in Europe. A Study for the Fuel Cells and Hydrogen Joint Undertaking. Munich. 2015. Available online: https://www.rolandberger.com/en/Insights/Publications/Fuel-cell-electric-buses.html (accessed on 7 May 2023).
- Cluster of Hydrogen technologies & Pomeranian Hydrogen Valley. Available online: https://klasterwodorowy.pl/po-autobusach-przyszla-kolej-na-ciezarowki-na-wodor,78,pl (accessed on 16 May 2023).
- Schafer, S.; Maus, S. Technology Pitch: Subcooled Liquid Hydrogen (sLH2). In Proceedings of the NOW & CEP Heavy Duty Event, Virtual, 21 April 2021. [Google Scholar]
- The Polish Central Statistical Office. Statistical Information; Transport—Activity results in 2020, 2021. Statistical Office in Szczecin.Warszawa, Szczecin, 2021, 2022. Supervised by: Dmitrowicz- Życka K. Available online: https://stat.gov.pl/en/topics/transport-and-communications/transport/transport-activity-results-in-2020,6,16.html (accessed on 25 April 2023).
- Siwiec, J. Application of hydrogen fuel cells in rail transport. Railw. Rep. 2021, 190, 53–57. [Google Scholar]
- Ministry of Infrastructure. Sustainable Transport Development Strategy until 2030. Polish Monitor, (pos. 1054/2019). Warszawa. 24 September 2019. Available online: https://www.gov.pl/web/infrastruktura/projekt-strategii-zrownowazonego-rozwoju-transportu-do-2030-roku2 (accessed on 15 May 2023).
- Ruf, Y.; Zorn, T.; De Neve, P.A.; Andrae, P.; Erofeeva, S.; Garrison, F.; Schwilling, A. Study on the Use of Fuel Cells and Hydrogen in the Railway Environment—HI-02-19-229-EN-N; Publications Office of the European Union: Luxembourg, 2019. [Google Scholar]
- Deloitte. The Potential of Hydrogen for Chemical Industry. Available online: https://www2.deloitte.com/xe/en/pages/energy-and-resources/articles/the-potential-of-hydrogen-for-the-chemical-industry.html (accessed on 19 June 2023).
- Zbikowska, A.; Onacik-Gür, S.; Kowalska, M.; Zbikowska, K.; Feszterová, M. Trends in Fat Modifications Enabling Alternative Partially Hydrogenated Fat Products Proposed for Advanced Application. Gels 2023, 9, 453. [Google Scholar] [CrossRef]
- Pan, A.; Liu, J.; Liu, Z.; Yang, Y.; Yang, X.; Zhang, M. Application of Hydrogen Energy and Review of Current Conditions. IOP Conference Series: Earth and Environmental Science. In Proceedings of the 2nd International Conference on Advances in Civil Engineering, Energy Resources and Environment Engineering, Nanning, China, 22–24 May 2020; Volume 526. [Google Scholar]
- Tatarewicz, I.; Lewarski, M.; Skwierz, S. The MEESA Model, ver.2.0, Institute of Environmental Protection—National Research Institute/National Centre for Emissions Management (KOBiZE), Warsaw. 2020. Available online: https://climatecake.ios.edu.pl/wp-content/uploads/2022/03/CAKE_MEESA_v.2_energy-model_documentation.pdf (accessed on 17 May 2023).
- Boratyński, J.; Pyrka, M.; Tobiasz, I.; Witajewski-Baltvilks, J.; Jeszke, R.; Gąska, J.; Rabiega, W. The CGE Model d-Place, ver.2.0, Institute of Environmental Protection—National Research Institute/National Centre for Emissions Management (KOBiZE), Warsaw. Available online: https://climatecake.ios.edu.pl/wp-content/uploads/2022/03/CAKE_d-PLACE_v.2_d-place-model_documentation.pdf (accessed on 17 May 2023).
- Rabiega, W.; Sikora, P.; Gąska, J.; Gorzałczyński, A. The TR3E Model, ver.2.0, Institute of Environmental Protection—National Research Institute/National Centre for Emissions Management (KOBiZE), Warsaw. Available online: https://climatecake.ios.edu.pl/wp-content/uploads/2022/03/CAKE_TR3E_v.2_transport-model-documentation.pdf (accessed on 17 May 2023).
- Howells, M.; Rogner, H.; Strachan, N.; Heaps, C.; Huntington, H.; Kypreos, S.; Hughes, A.; Silveira, S.; DeCarolis, J.; Bazili-an, M.; et al. OSeMOSYS: The Open Source Energy Modeling System: An introduction to its ethos, structure and development. Energy Policy 2011, 39, 5850–5870. [Google Scholar] [CrossRef]
- Tatarewicz, I.; Lewarski., M.; Skwierz, S. The Model for European Energy System Analysis MEESA. Technical documentation for the model, version 2.0. Available online: https://climatecake.ios.edu.pl/wp-content/uploads/2022/03/CAKE_MEESA_v.2_energy-model_documentation.pdf (accessed on 17 May 2023).
- Tatarewicz, I.; Lewarski, M.; Skwierz, S.; Krupin, V.; Jeszke, R.; Pyrka, M.; Szczepański, K.; Sekuła, M. The Role of BECCS in Achieving Climate Neutrality in the European Union. Energies 2021, 14, 7842. [Google Scholar] [CrossRef]
- Energy, Transport and GHG Emissions: Trends to 2050. Available online: https://energy.ec.europa.eu/data-and-analysis/energy-modelling/eu-reference-scenario-2020_en (accessed on 20 May 2023).
- Ministry of Climate and Environment. The Polish Nuclear Development Plan. Warsaw. 2020. Available online: https://www.gov.pl/web/paa-en/Polish-Nuclear-Power-Program (accessed on 1 June 2023).
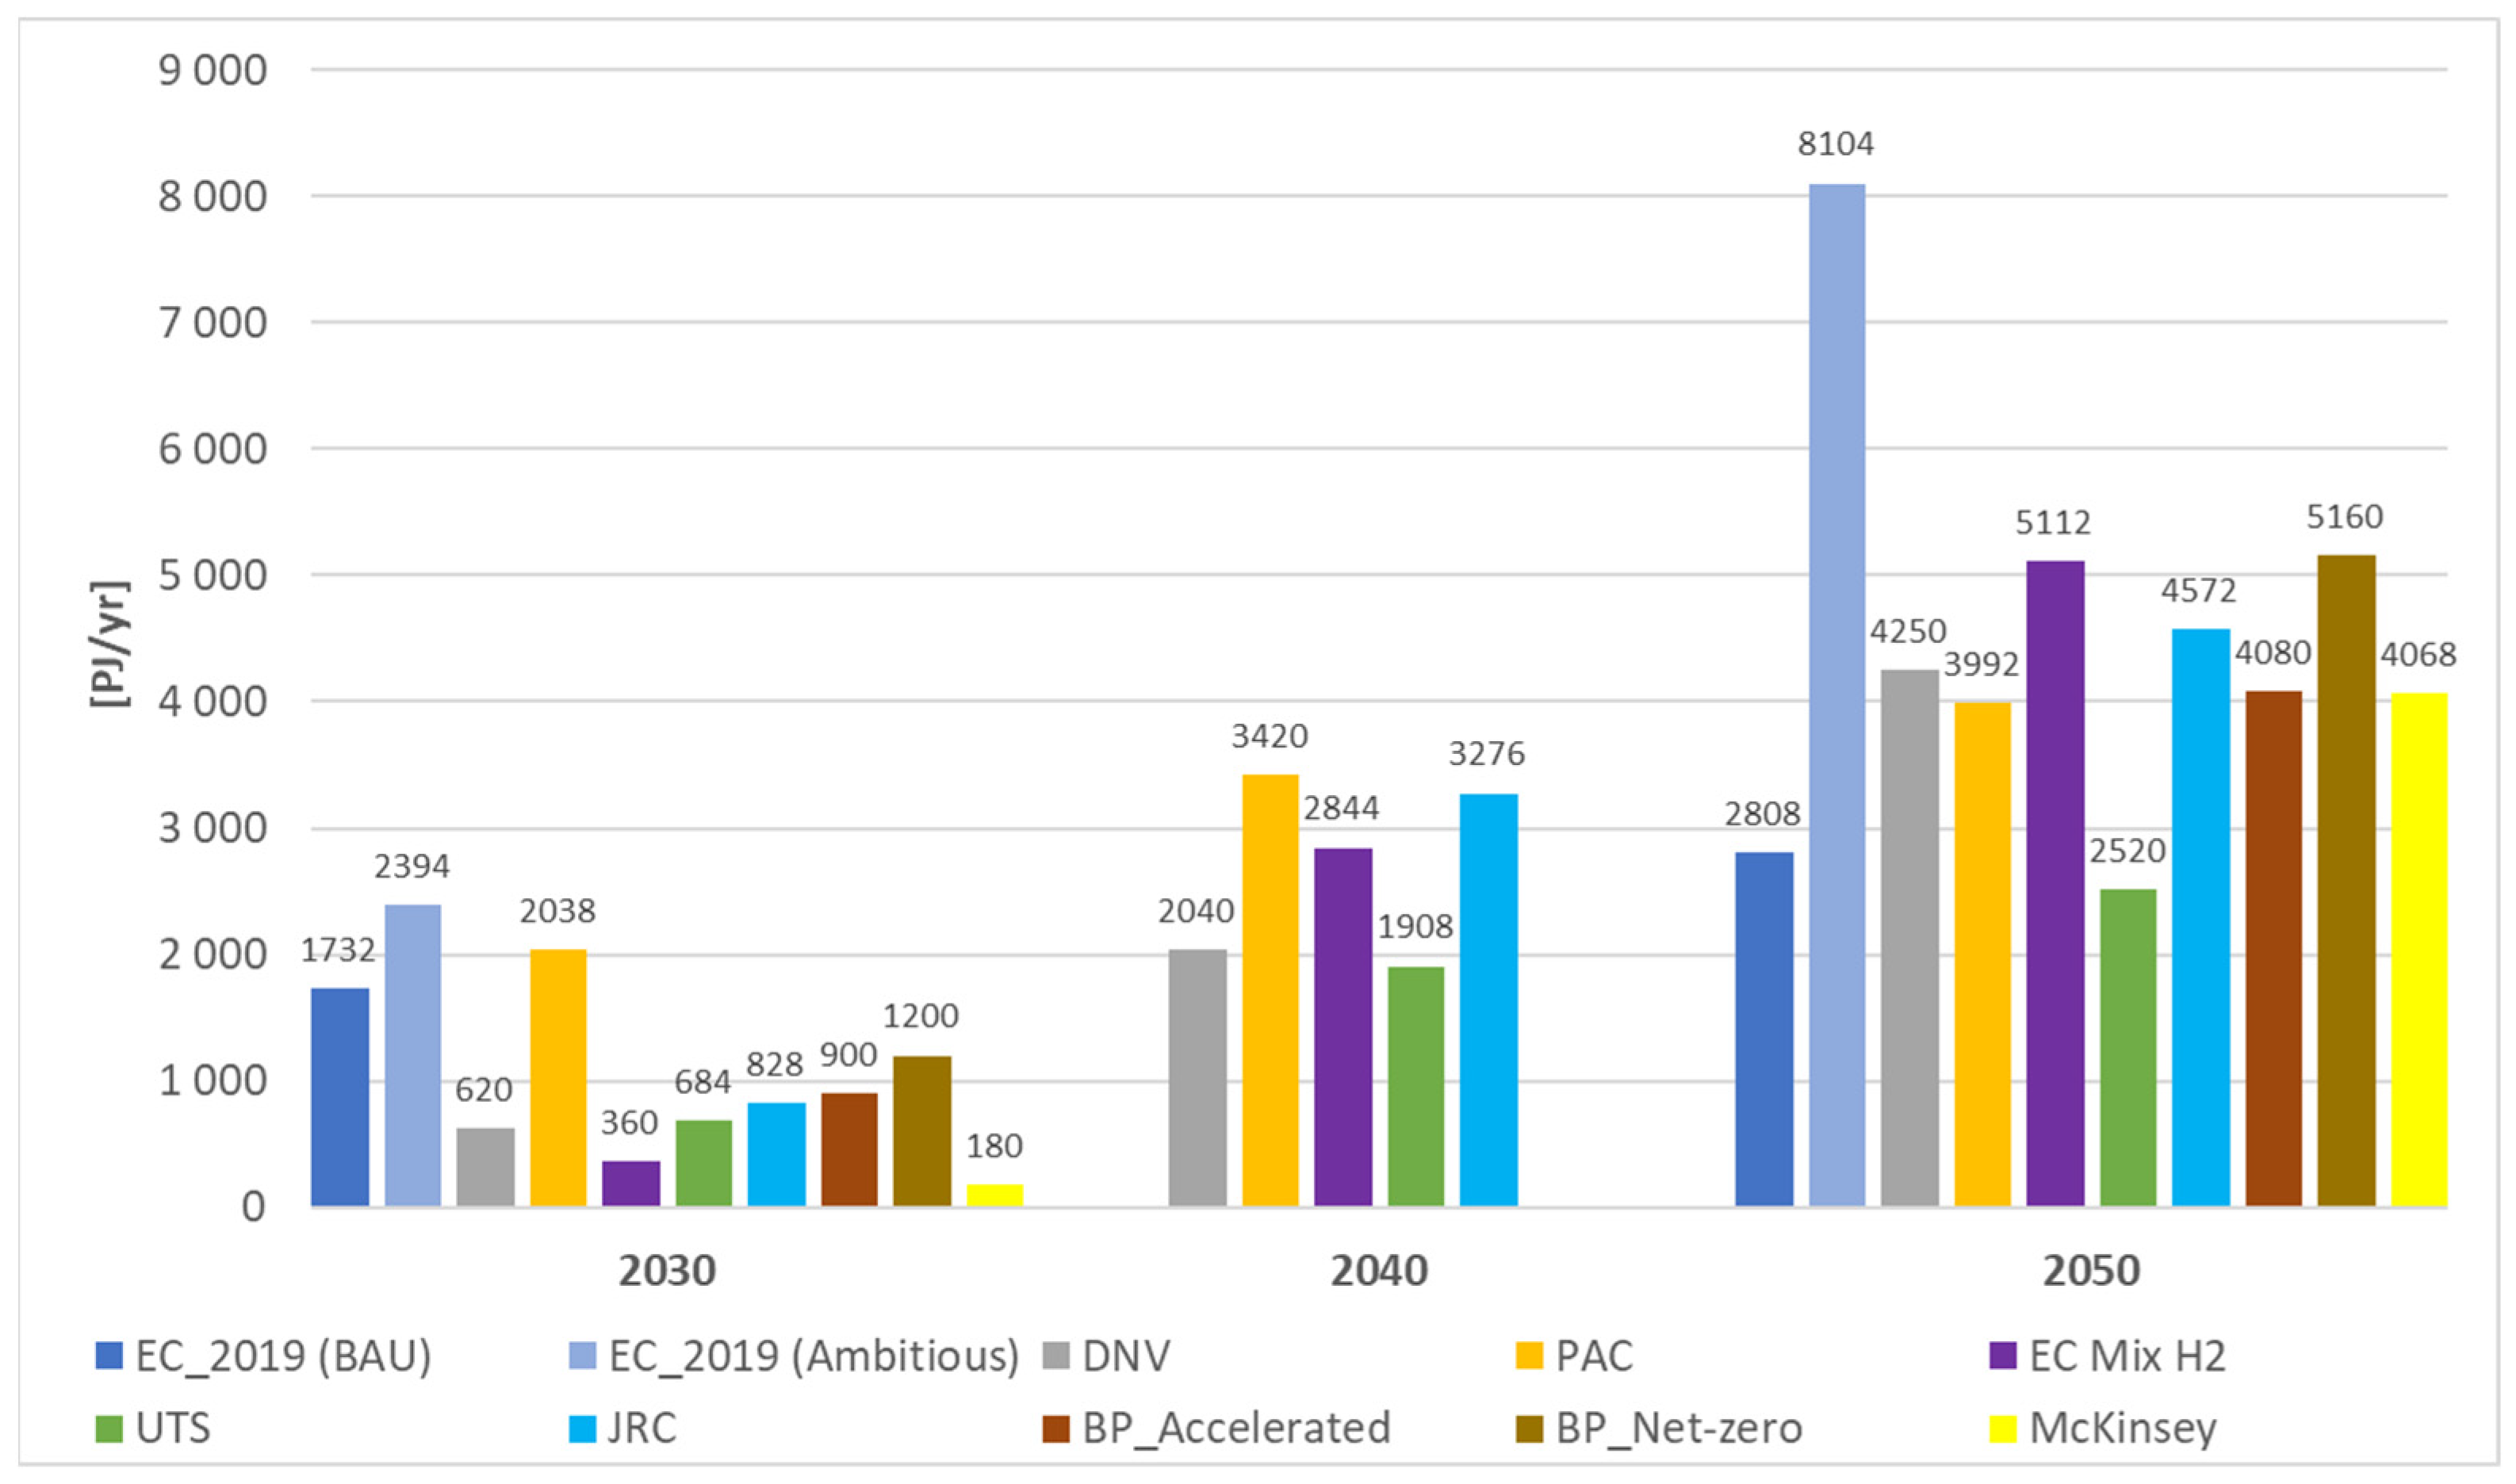
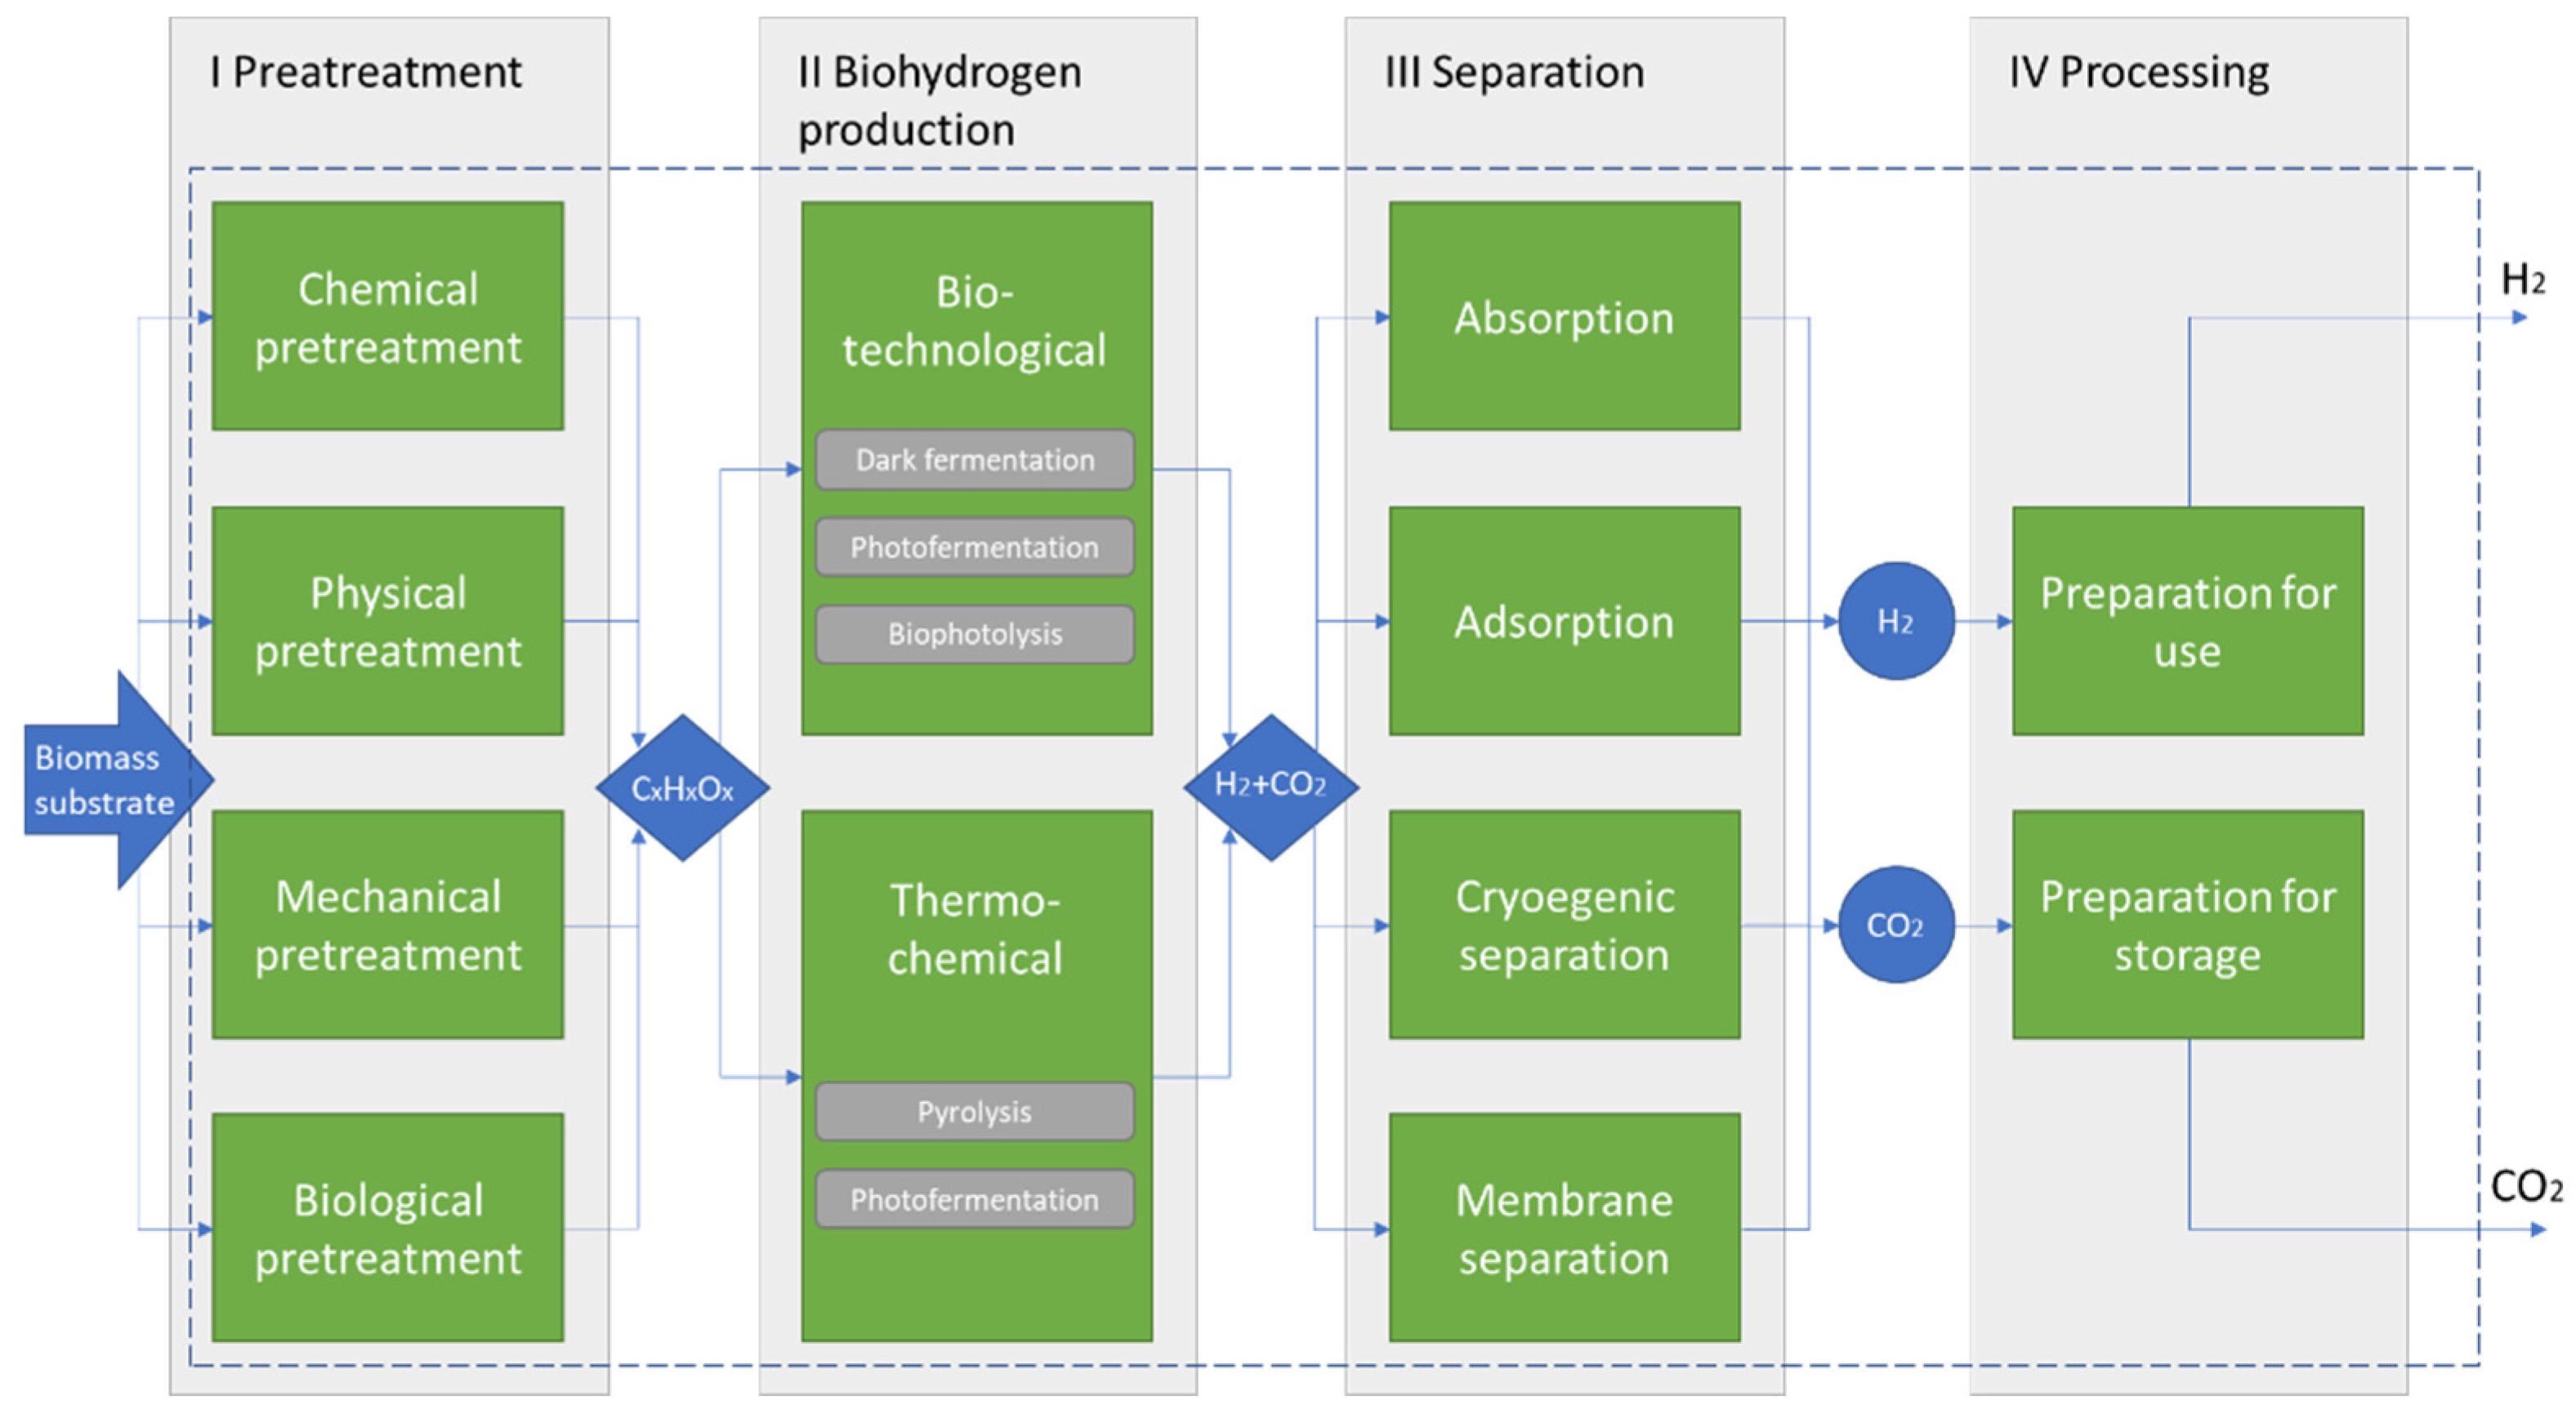
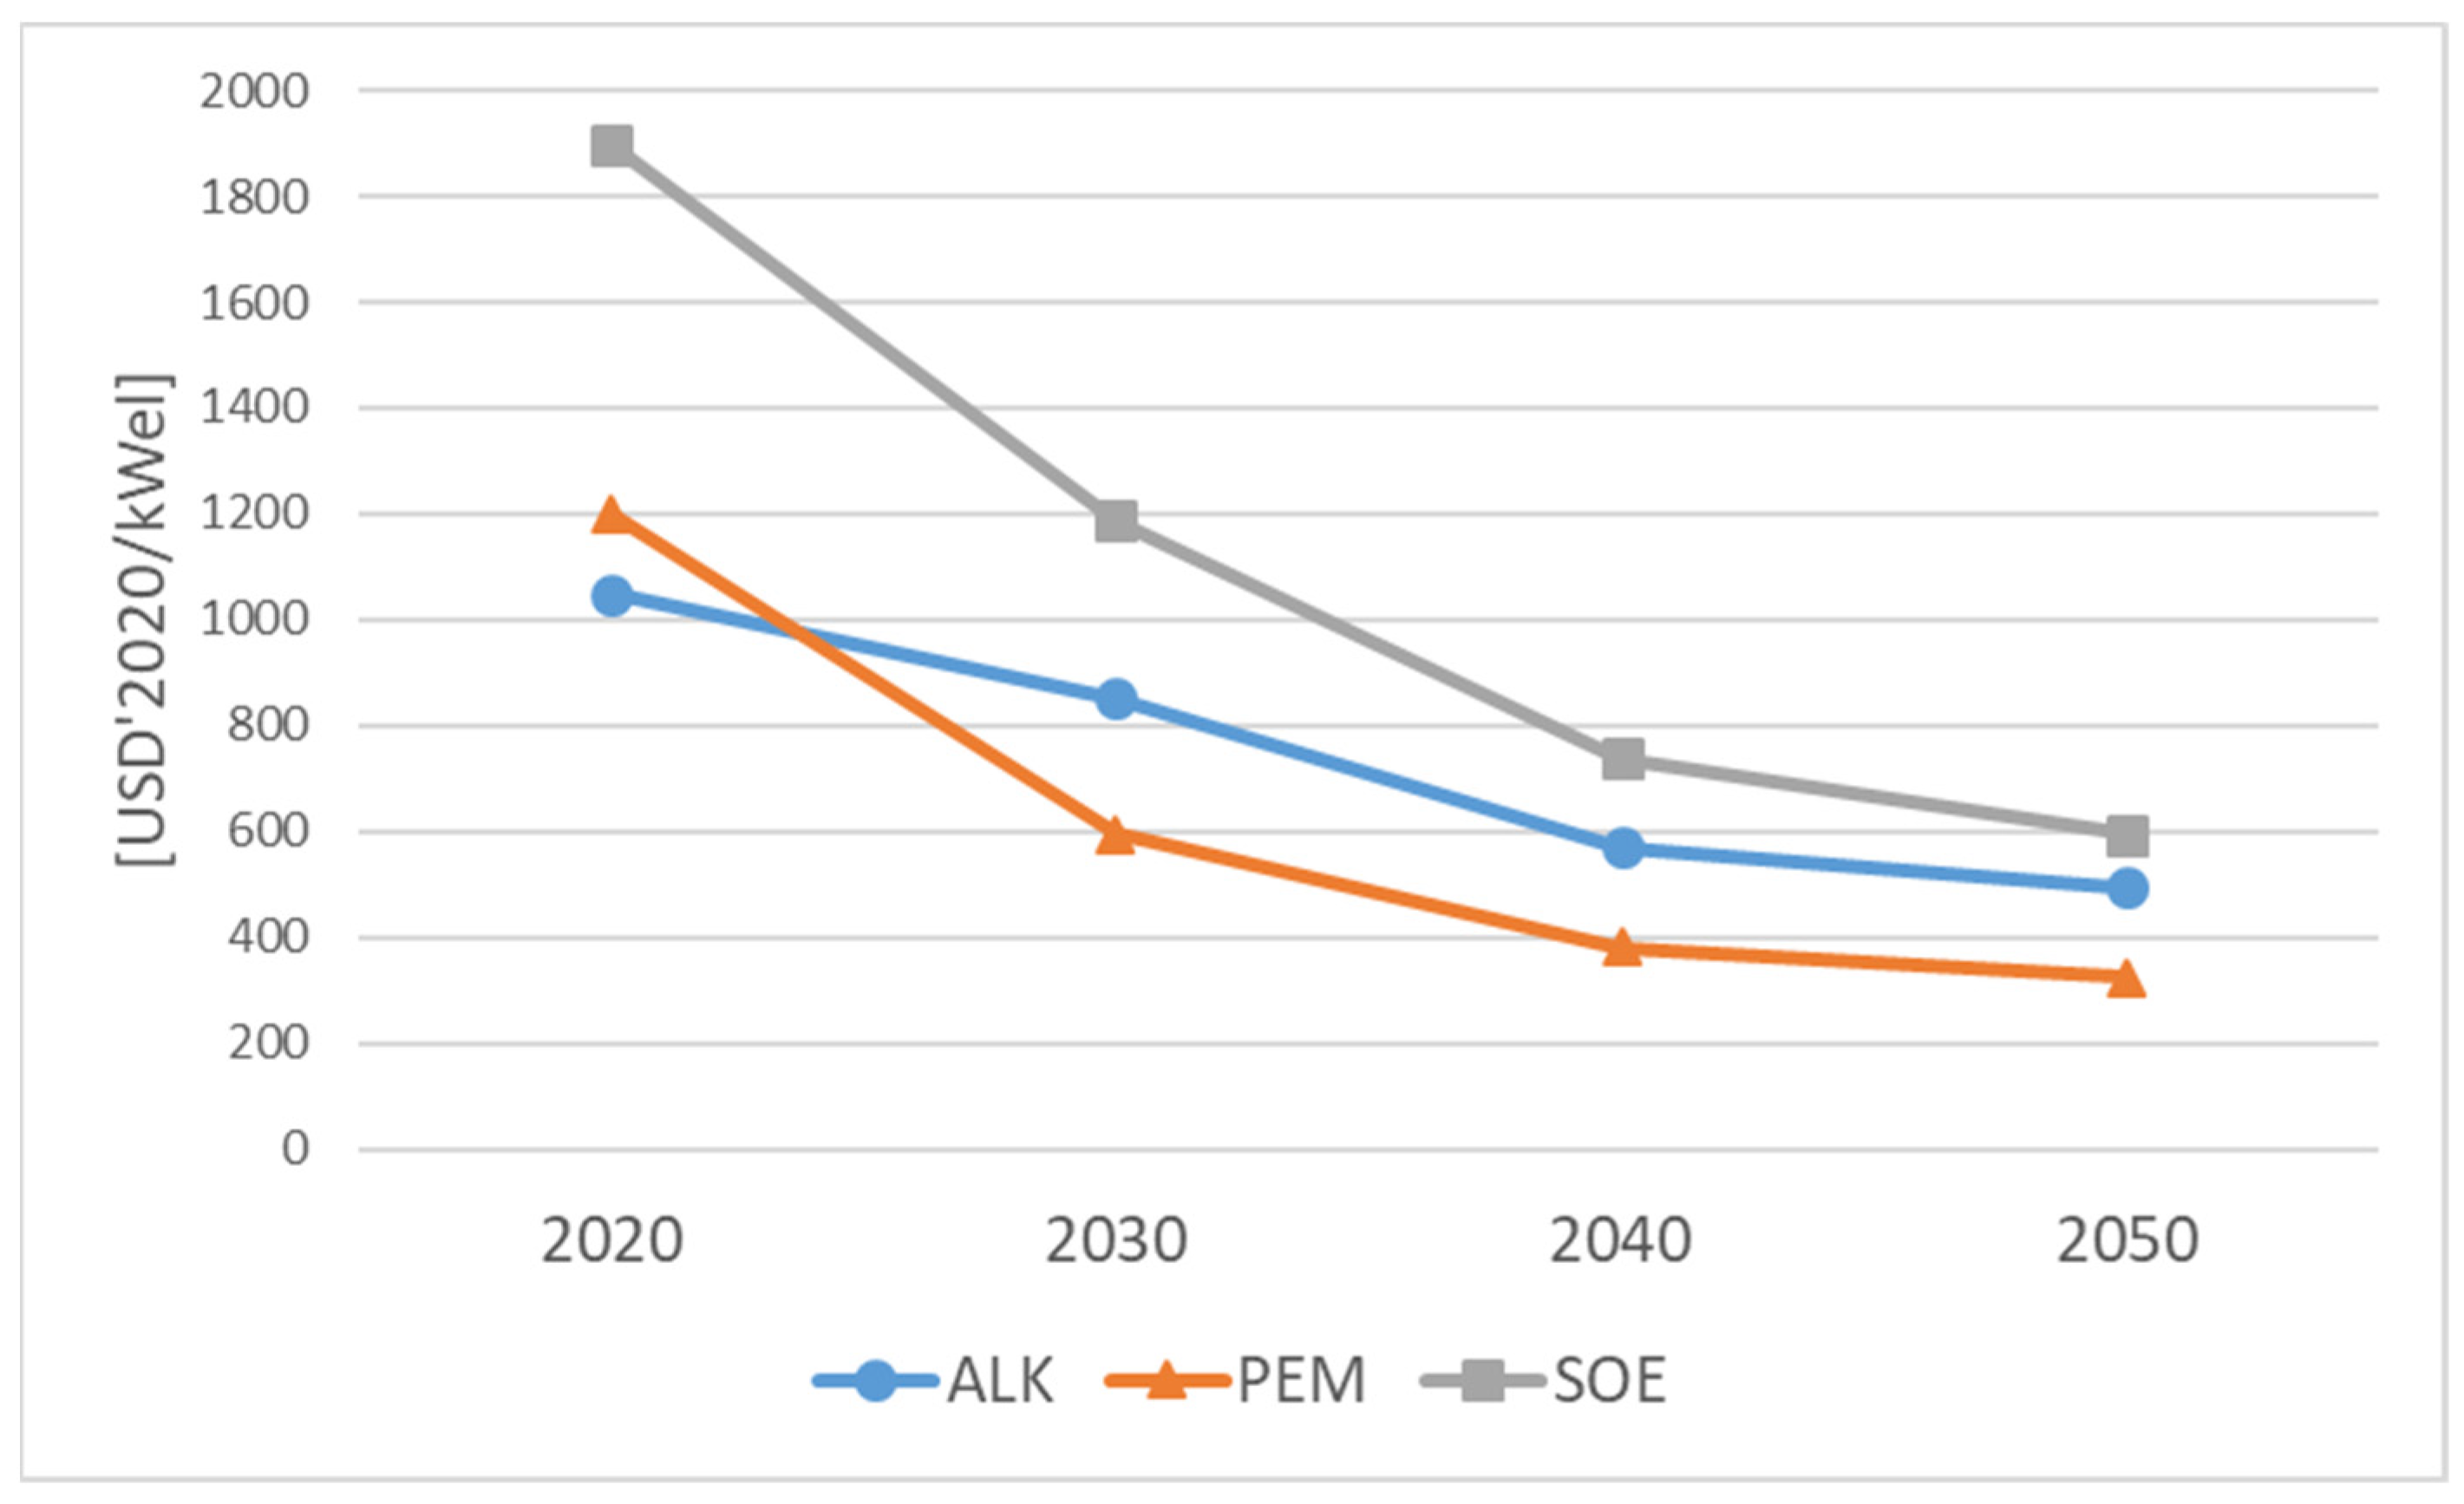
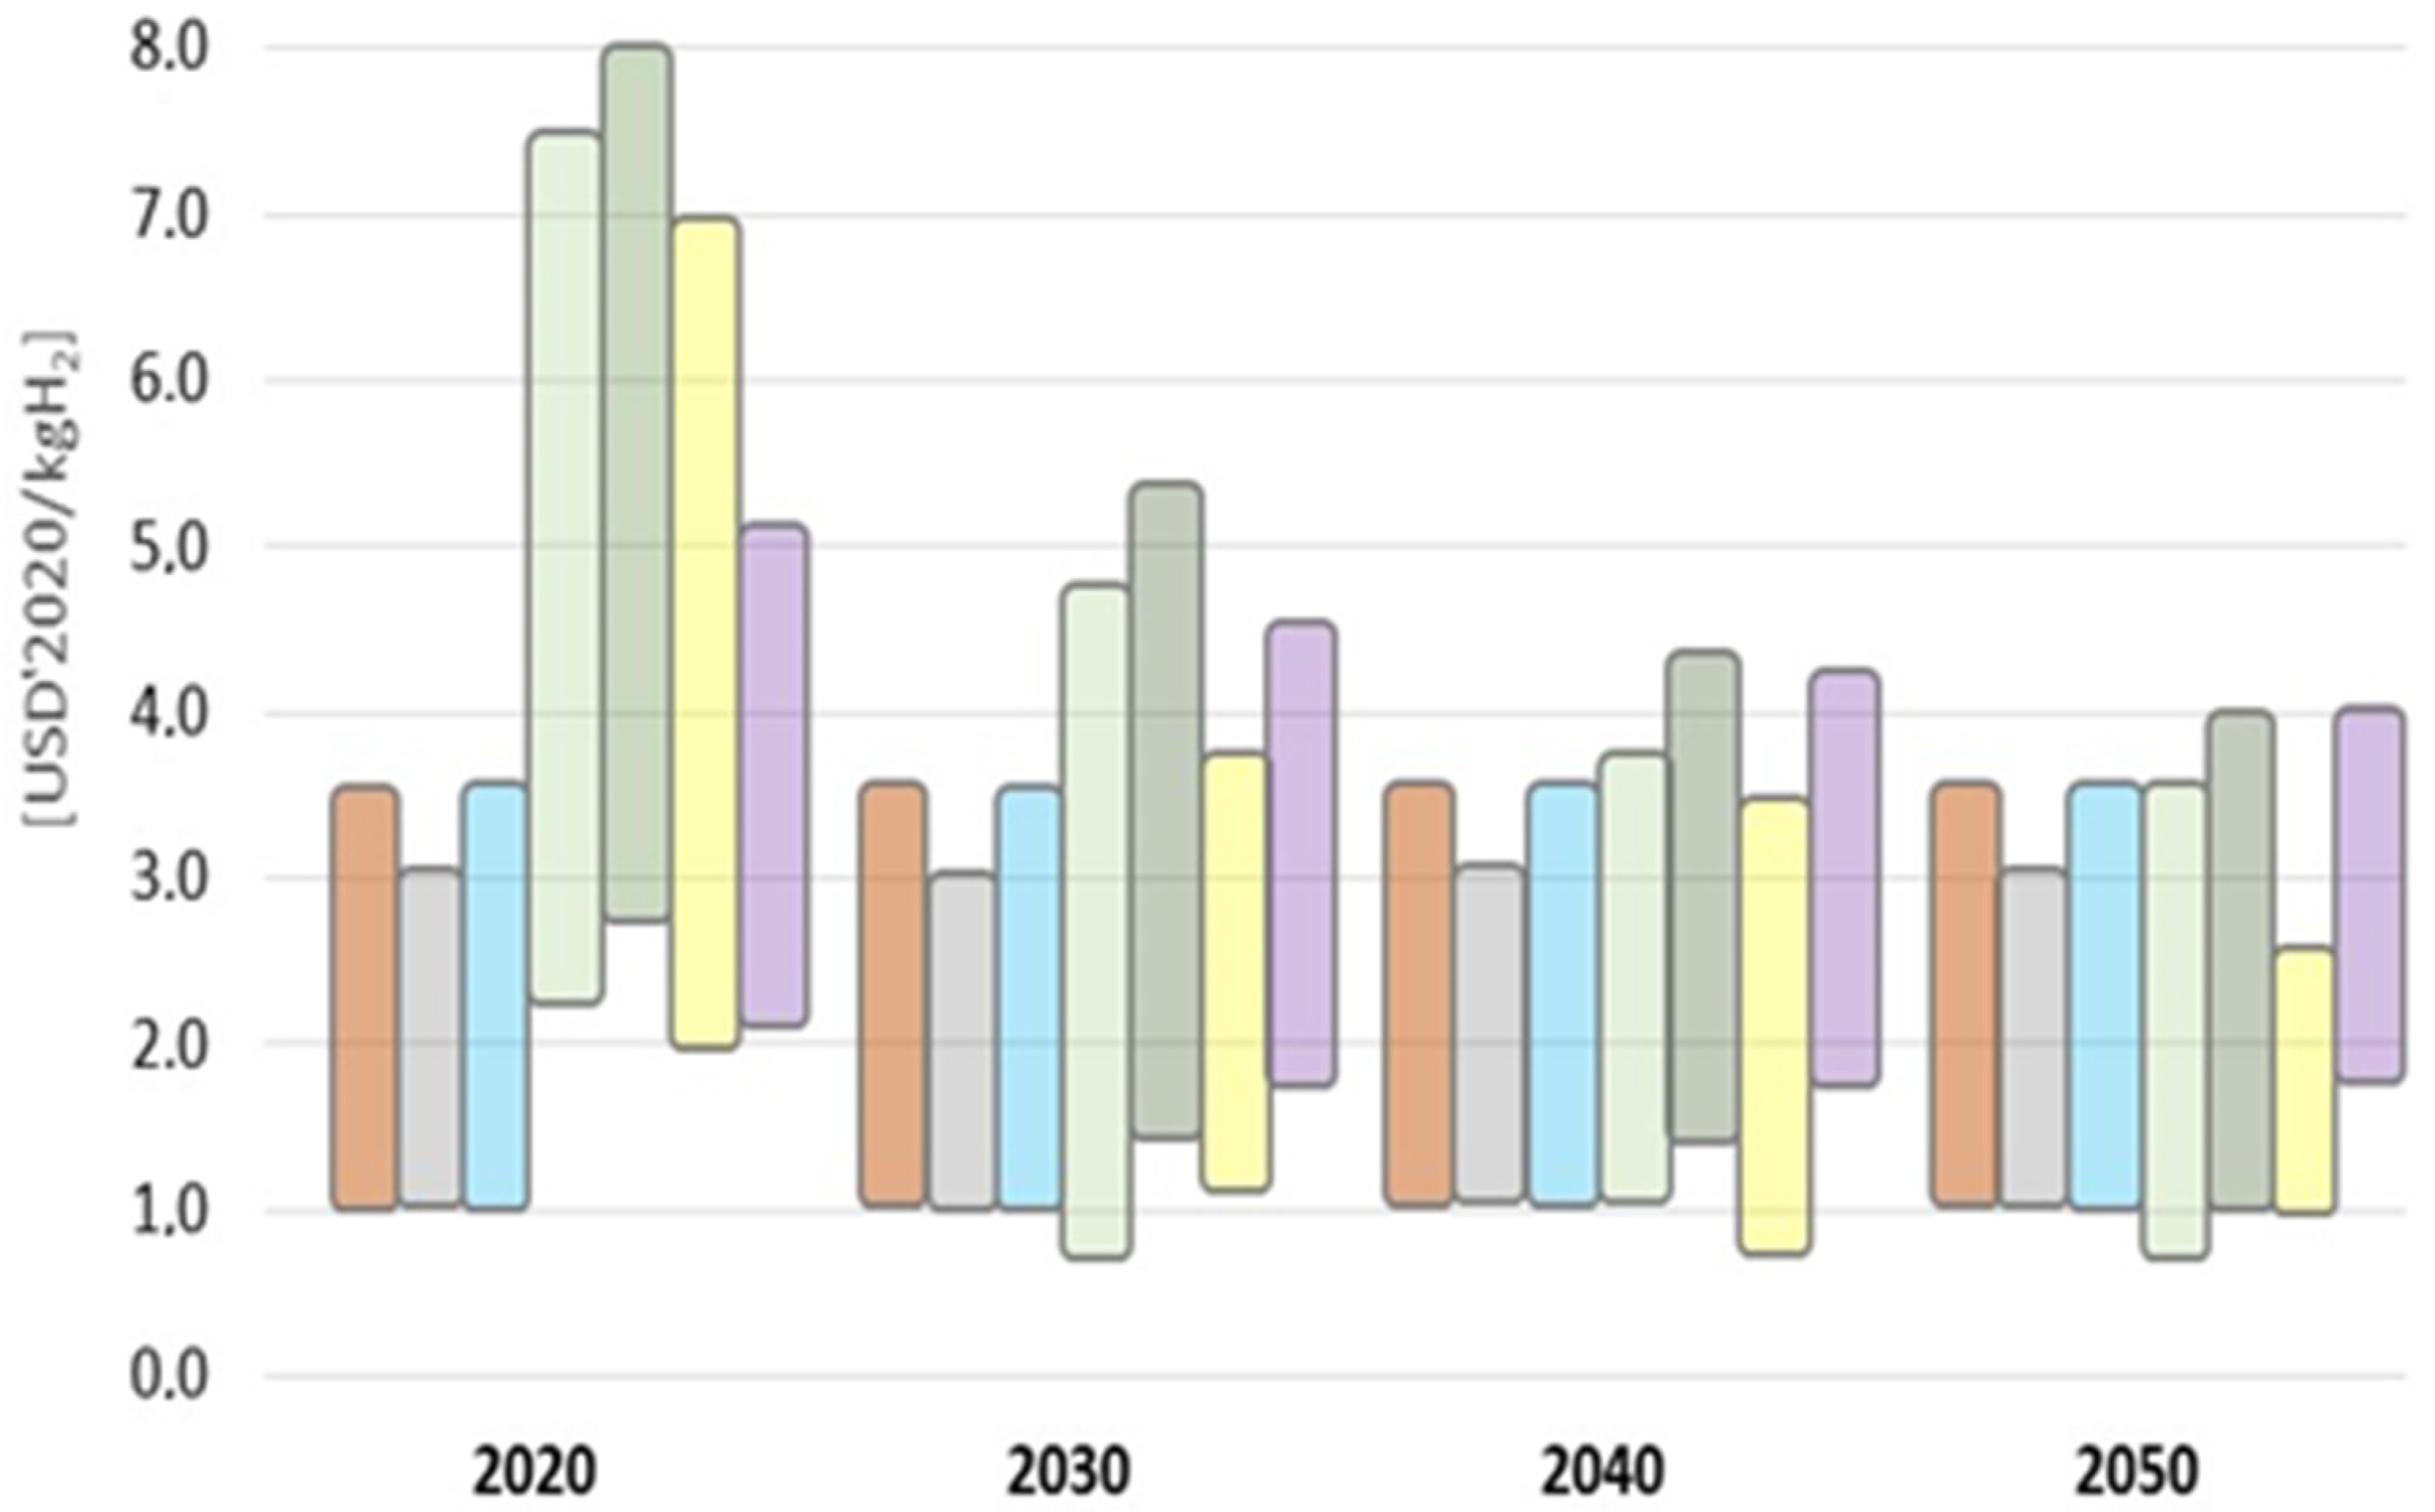
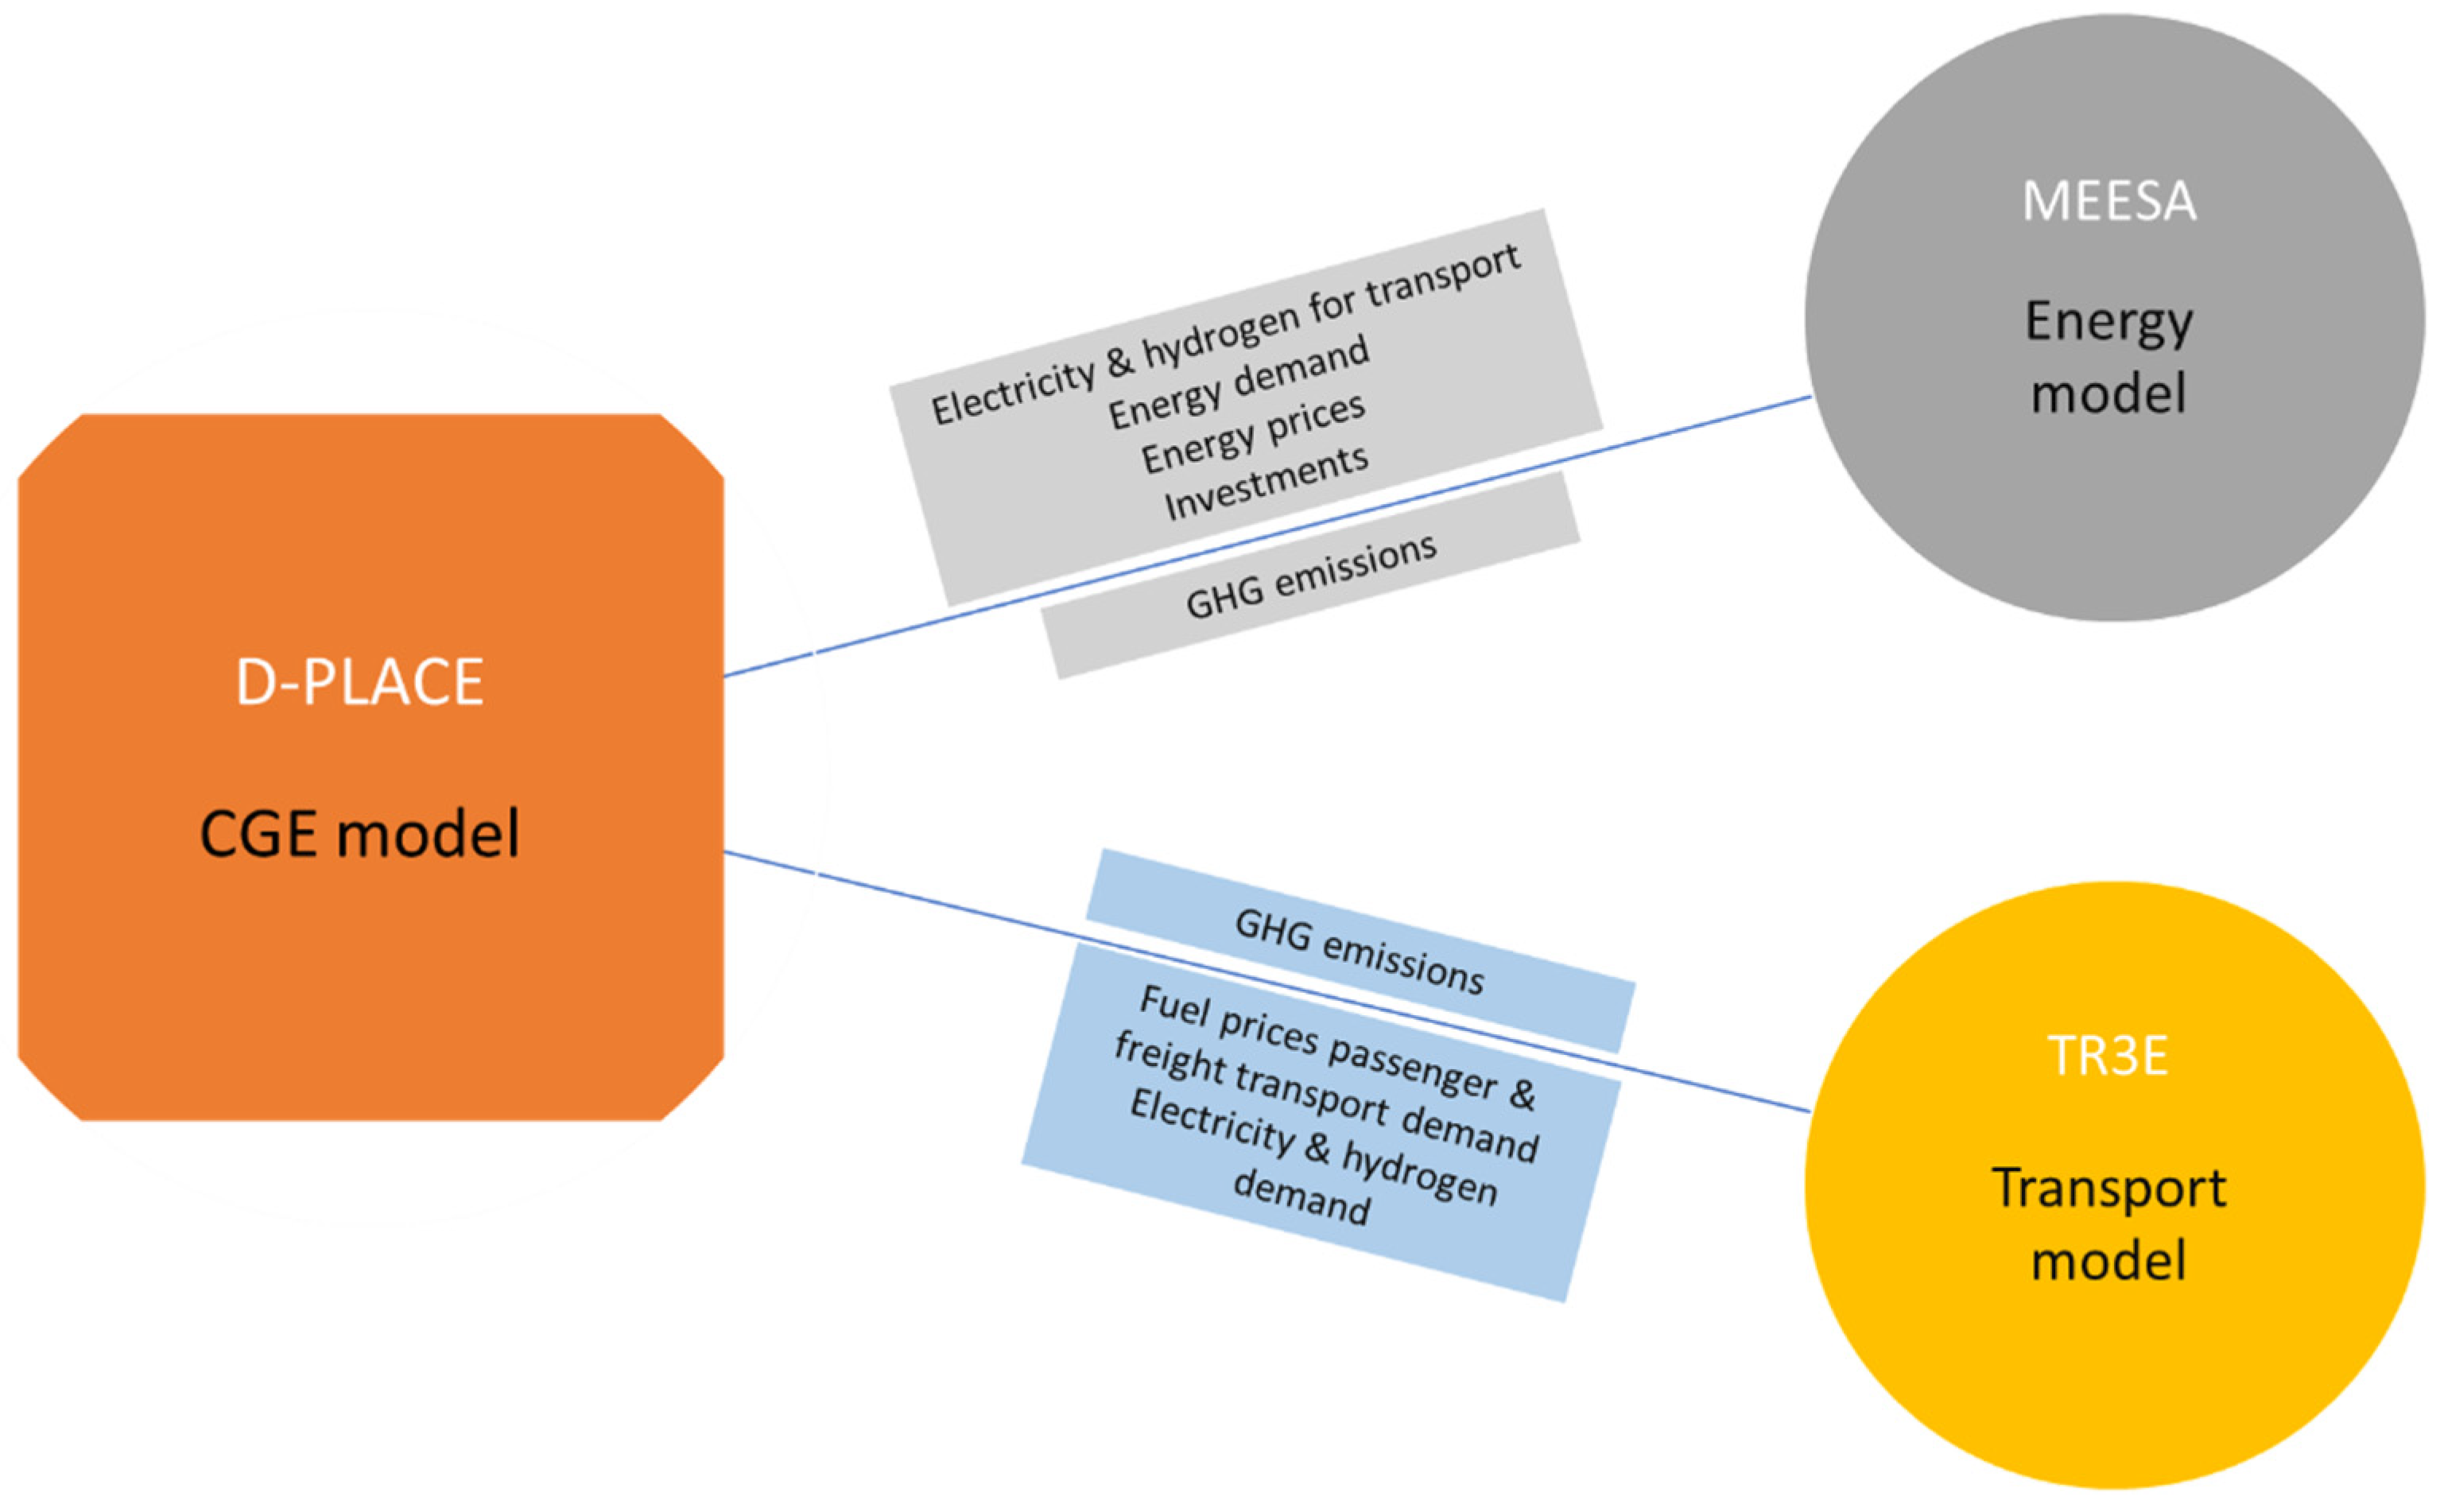
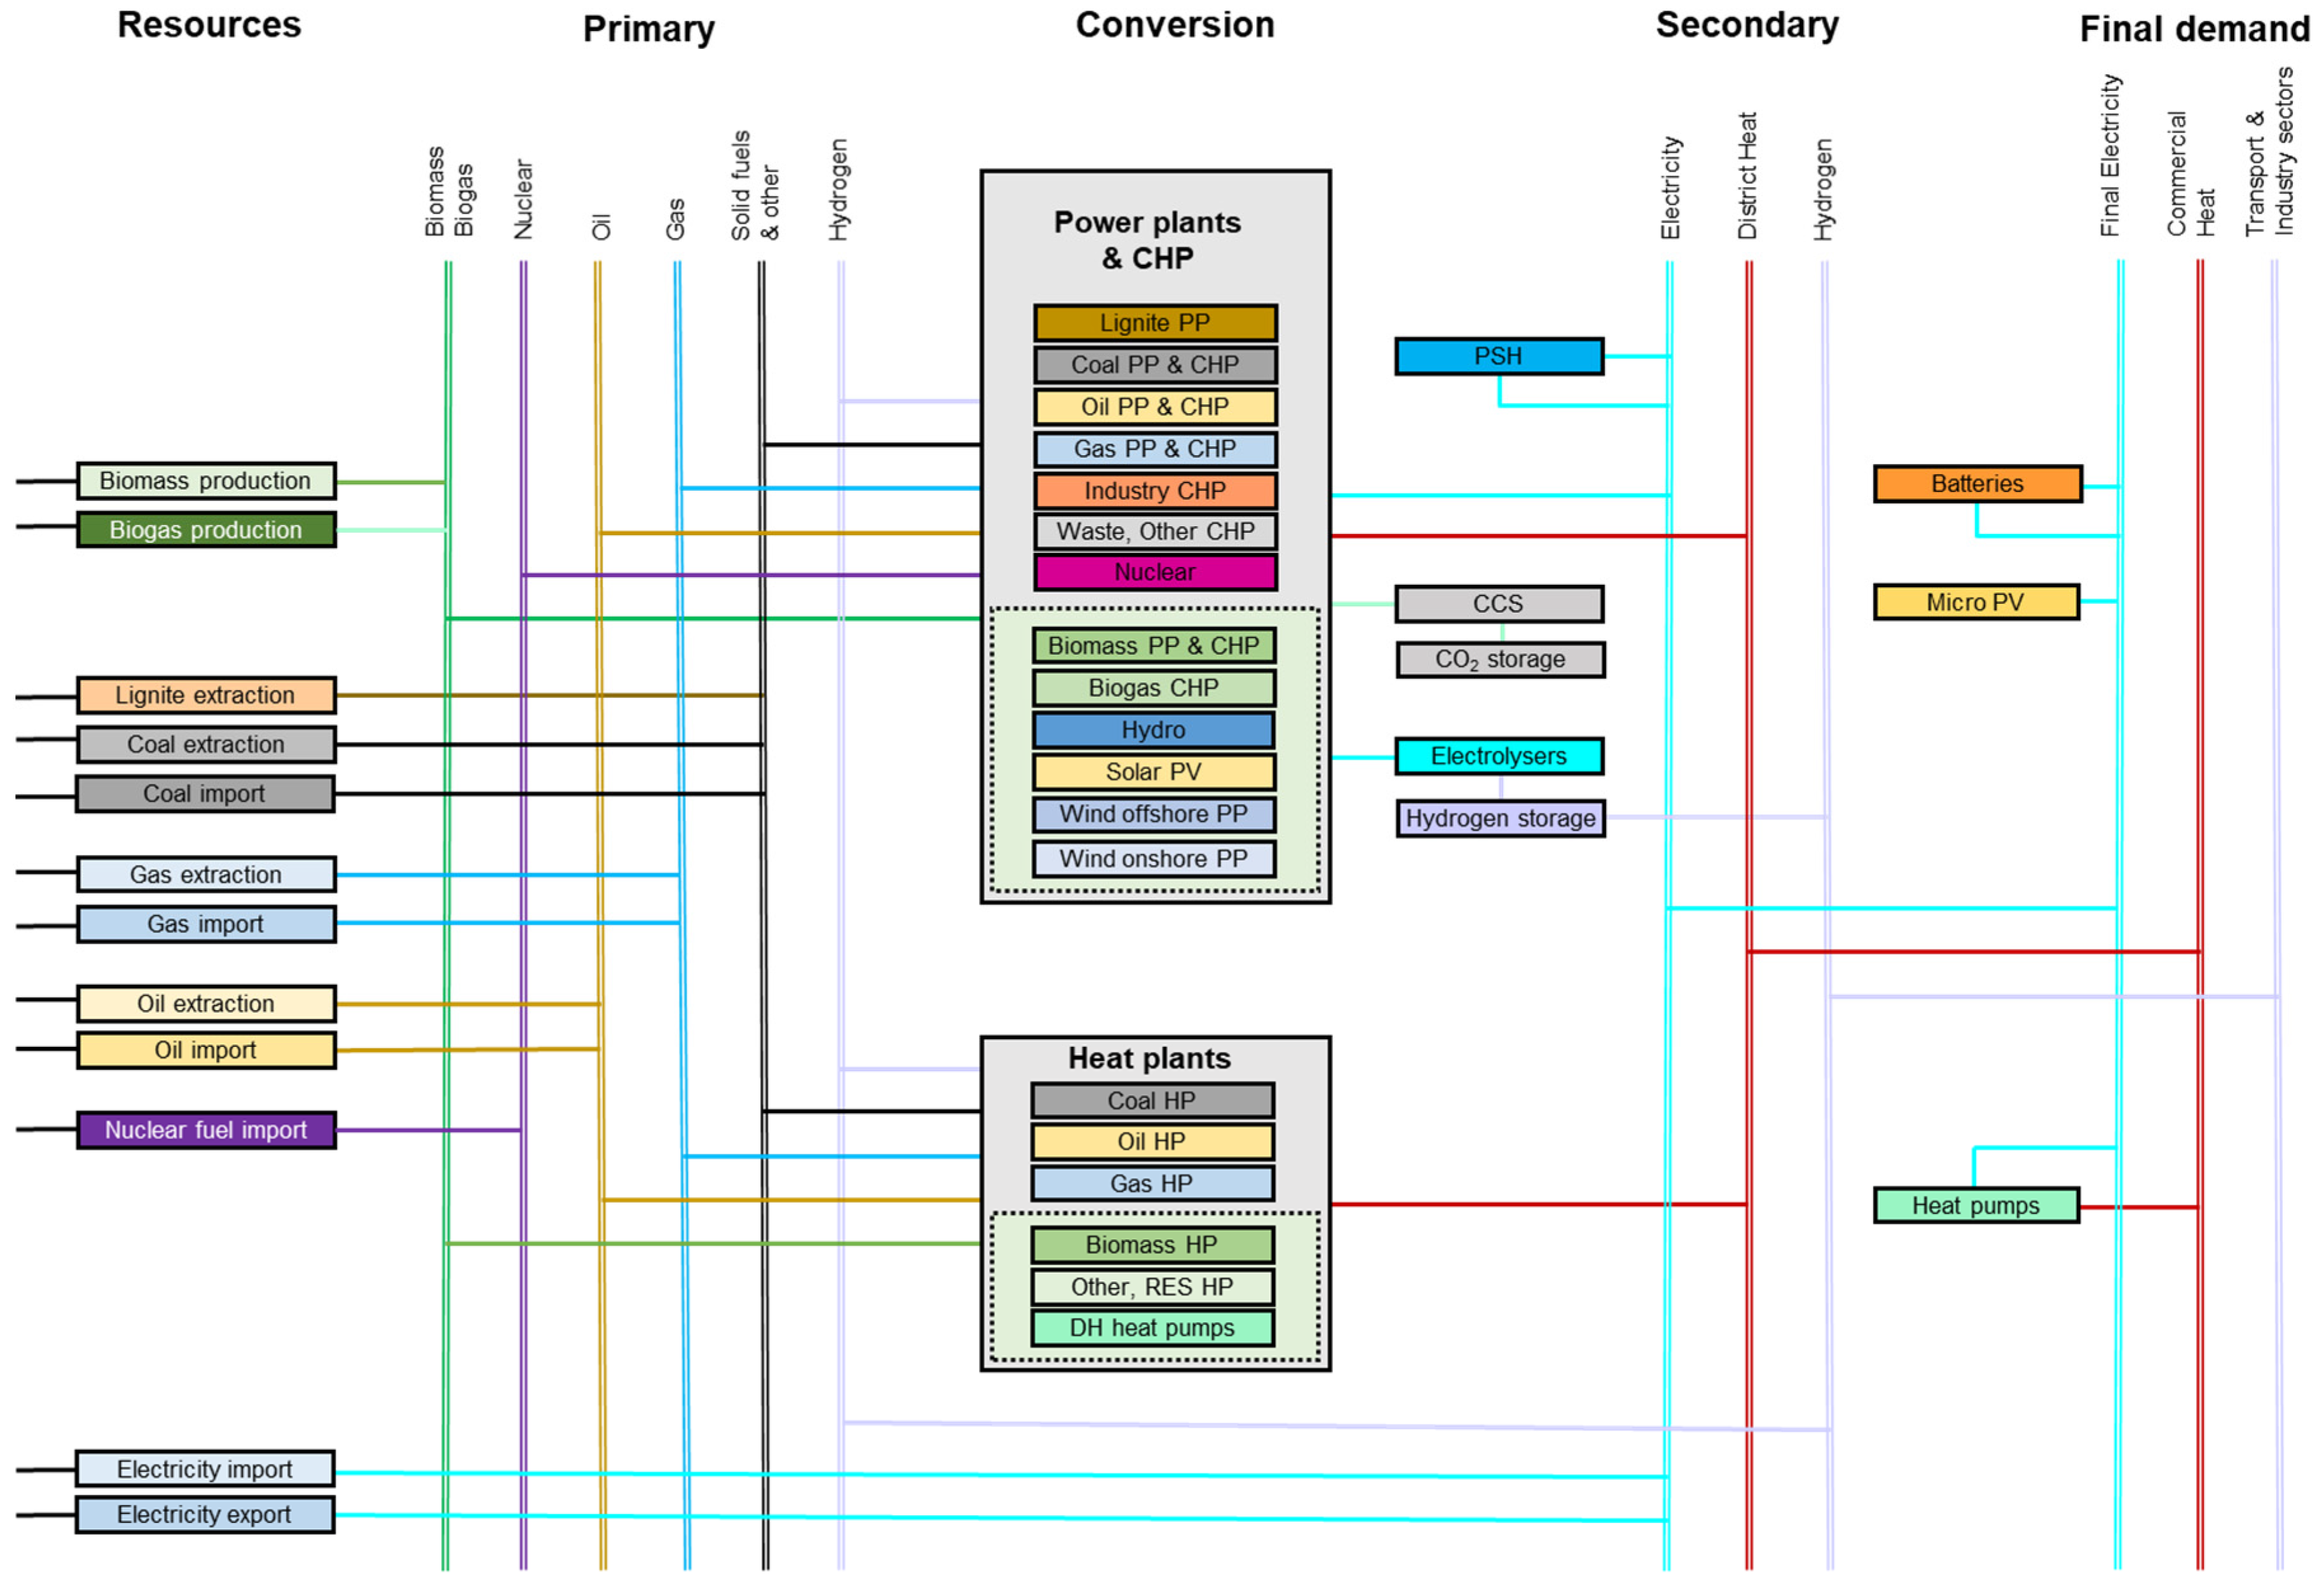
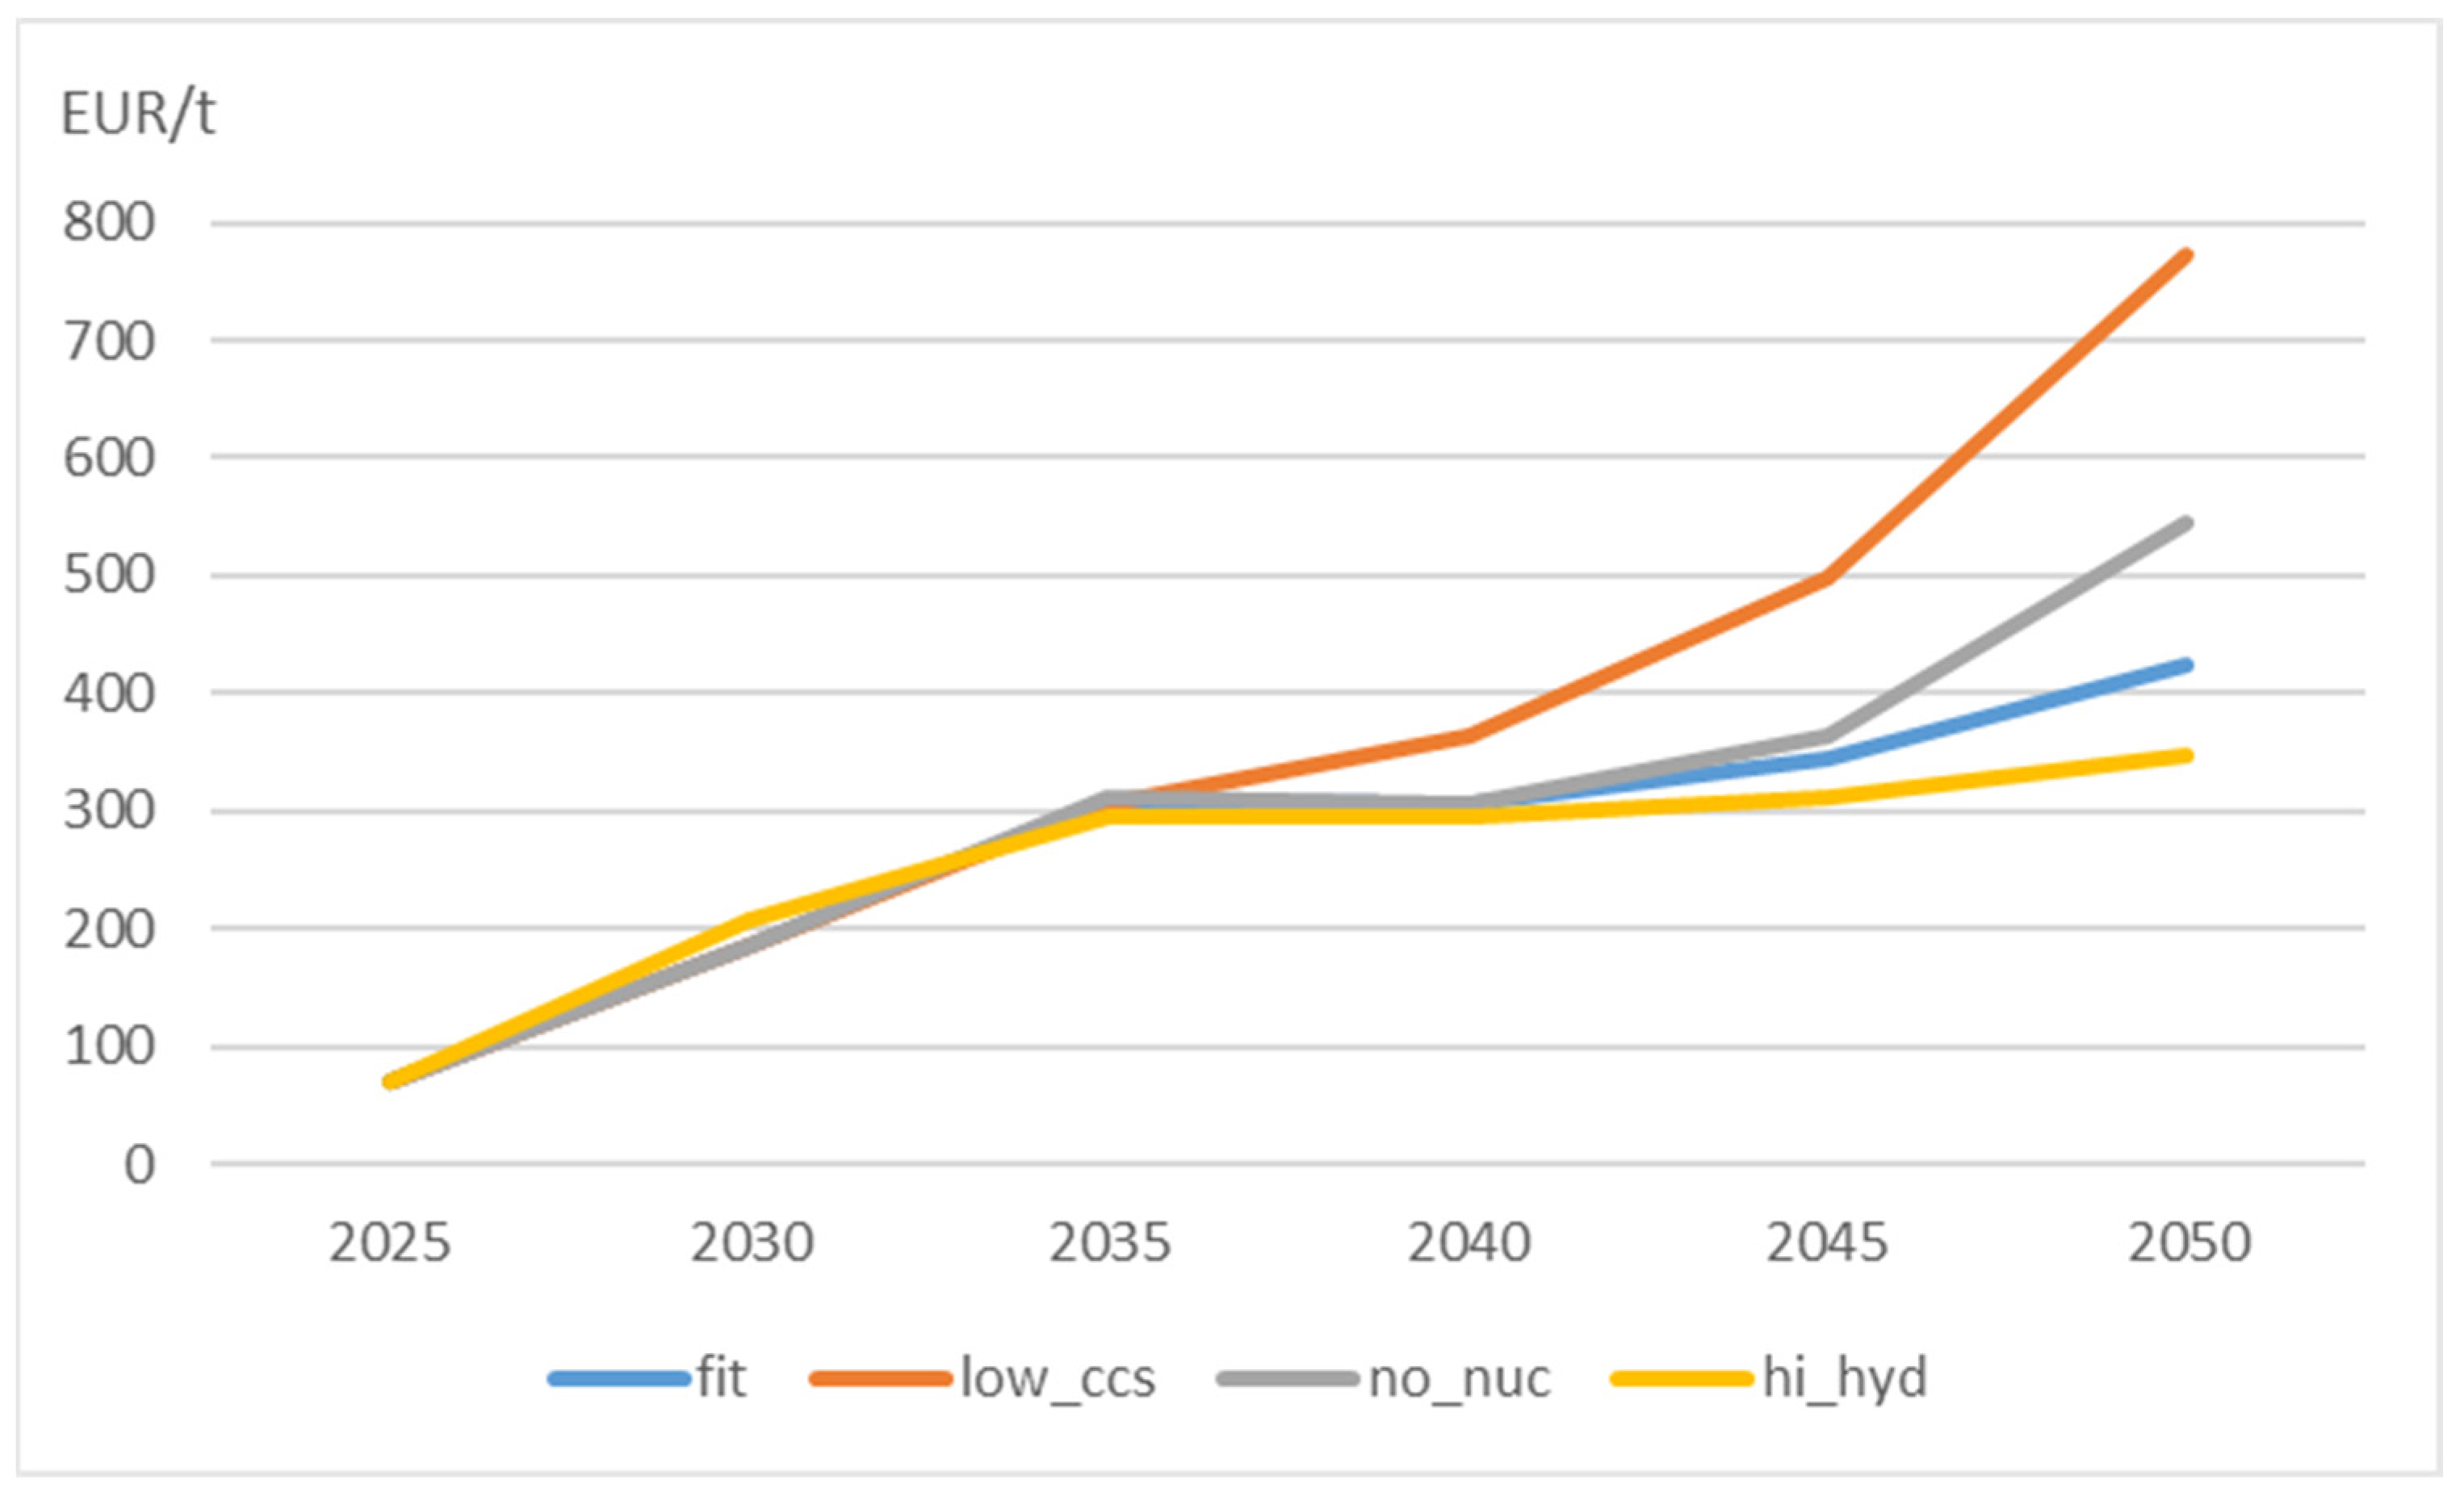
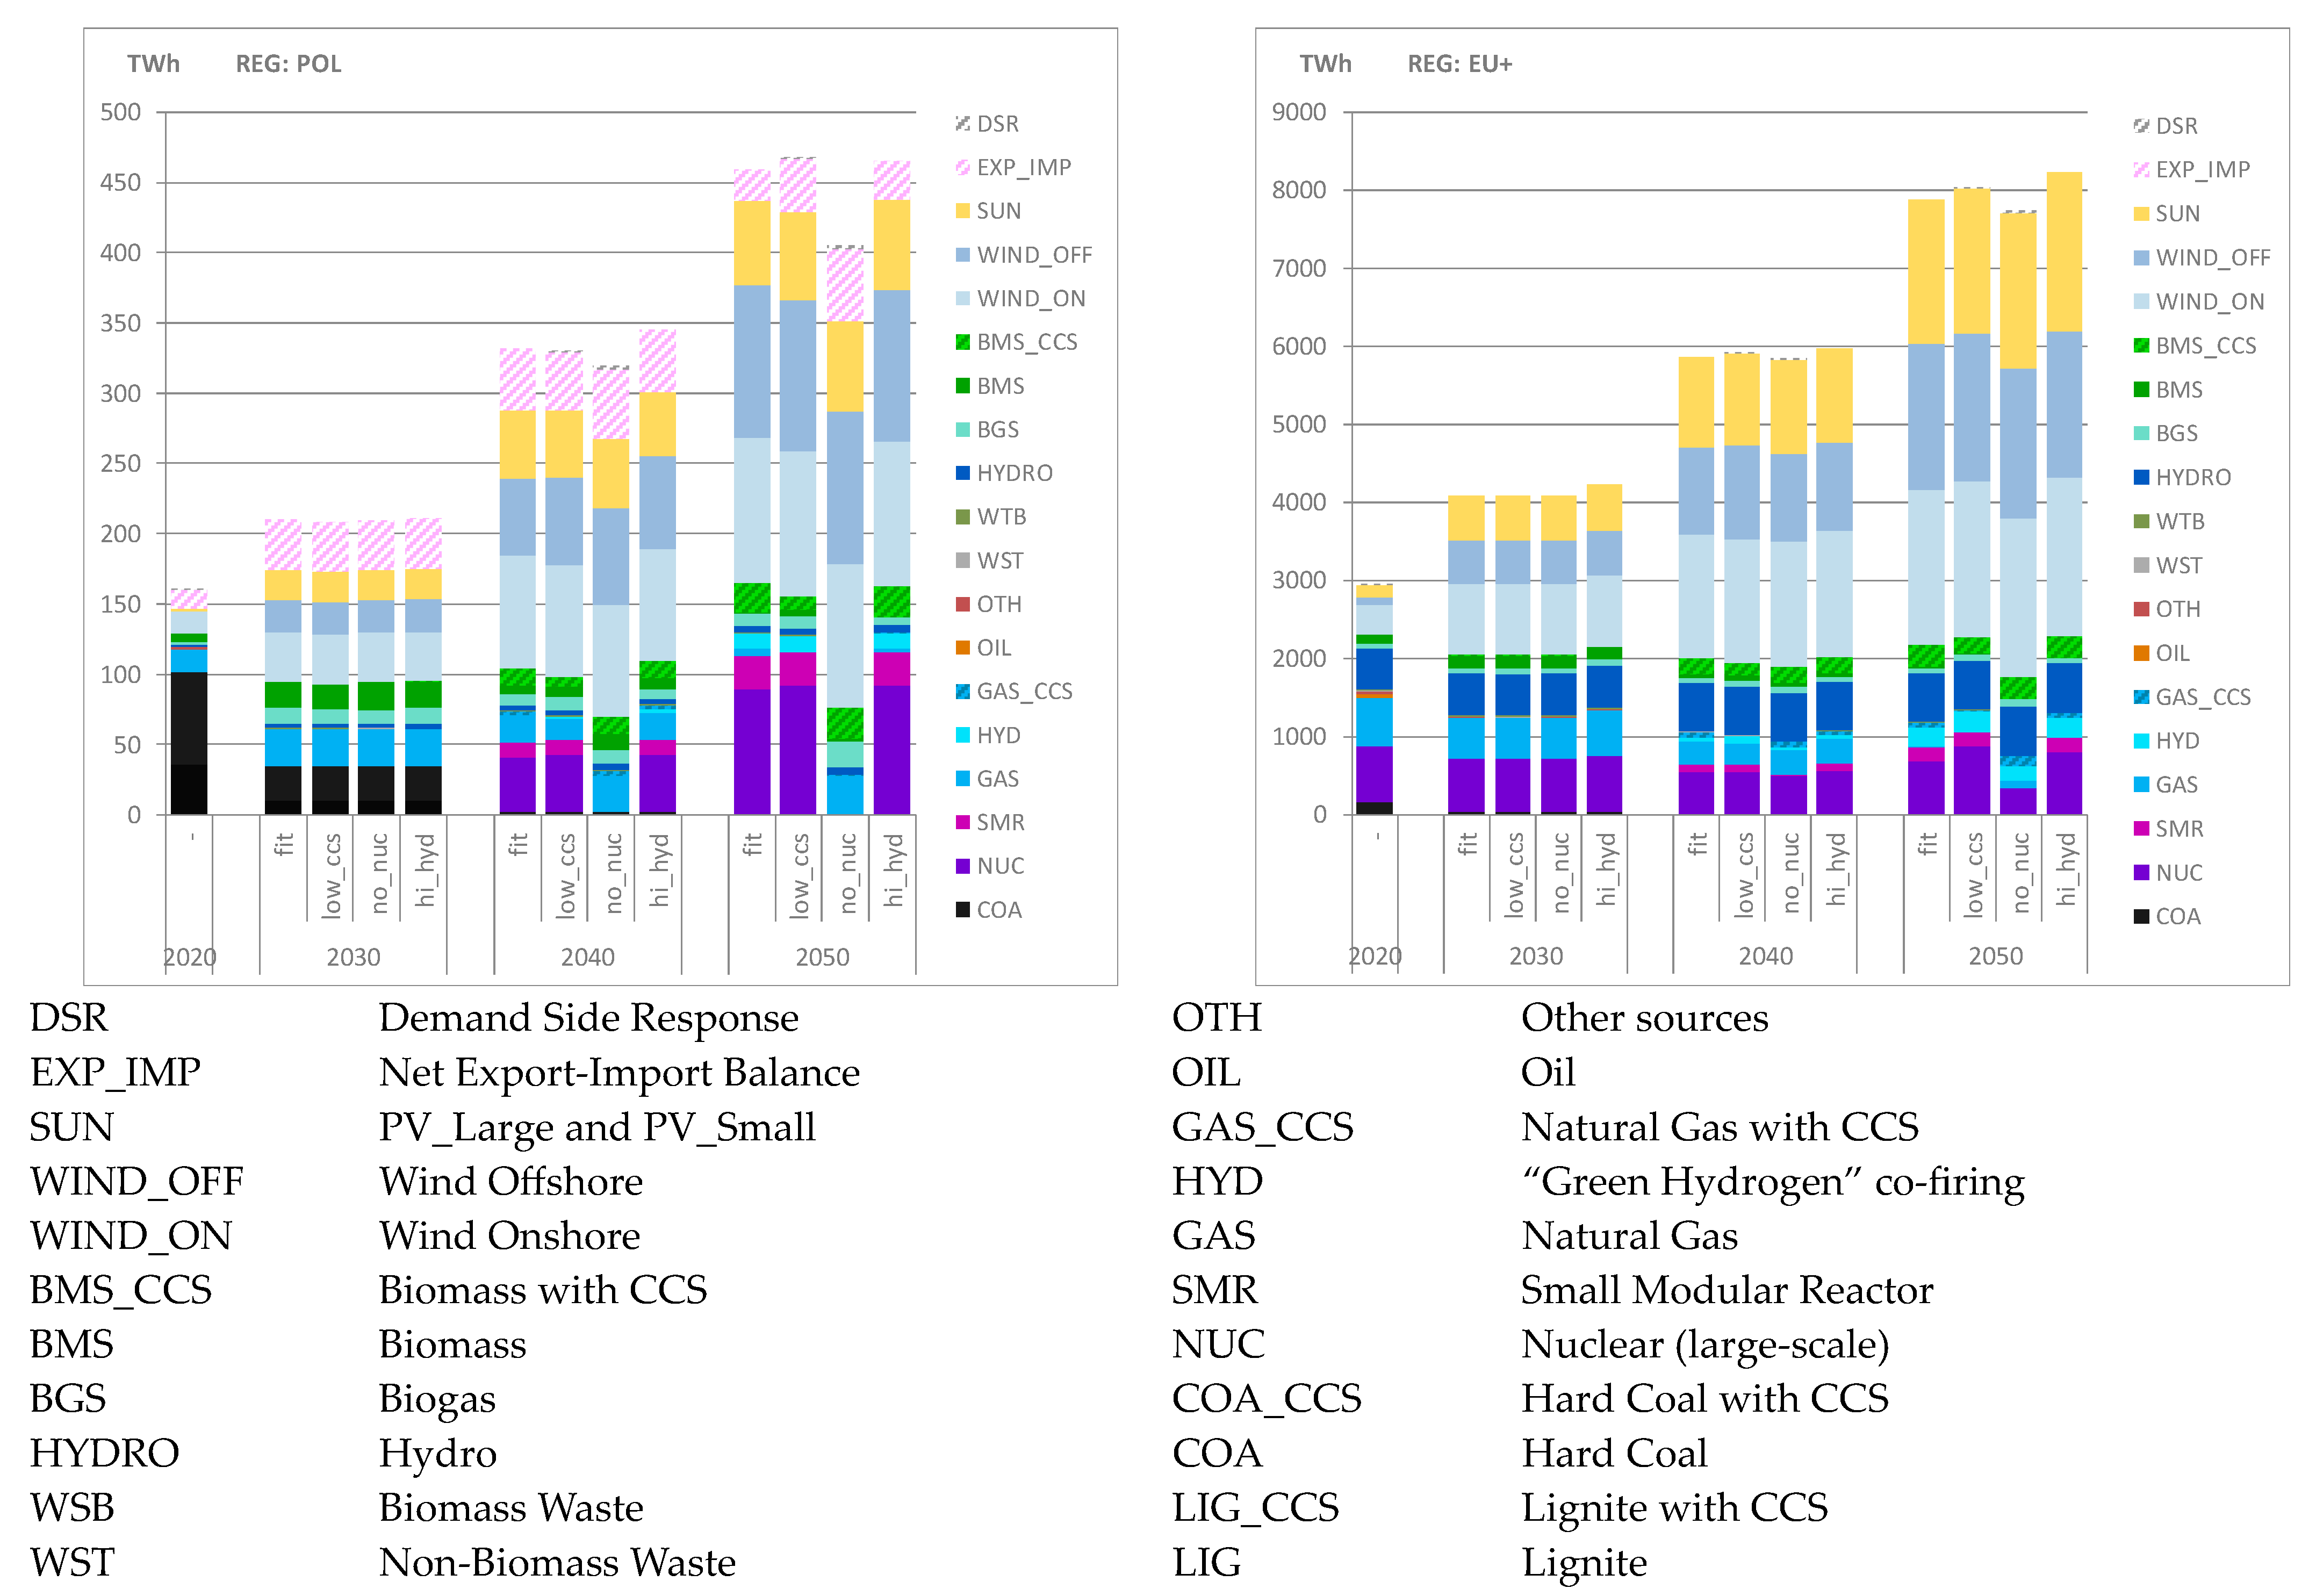
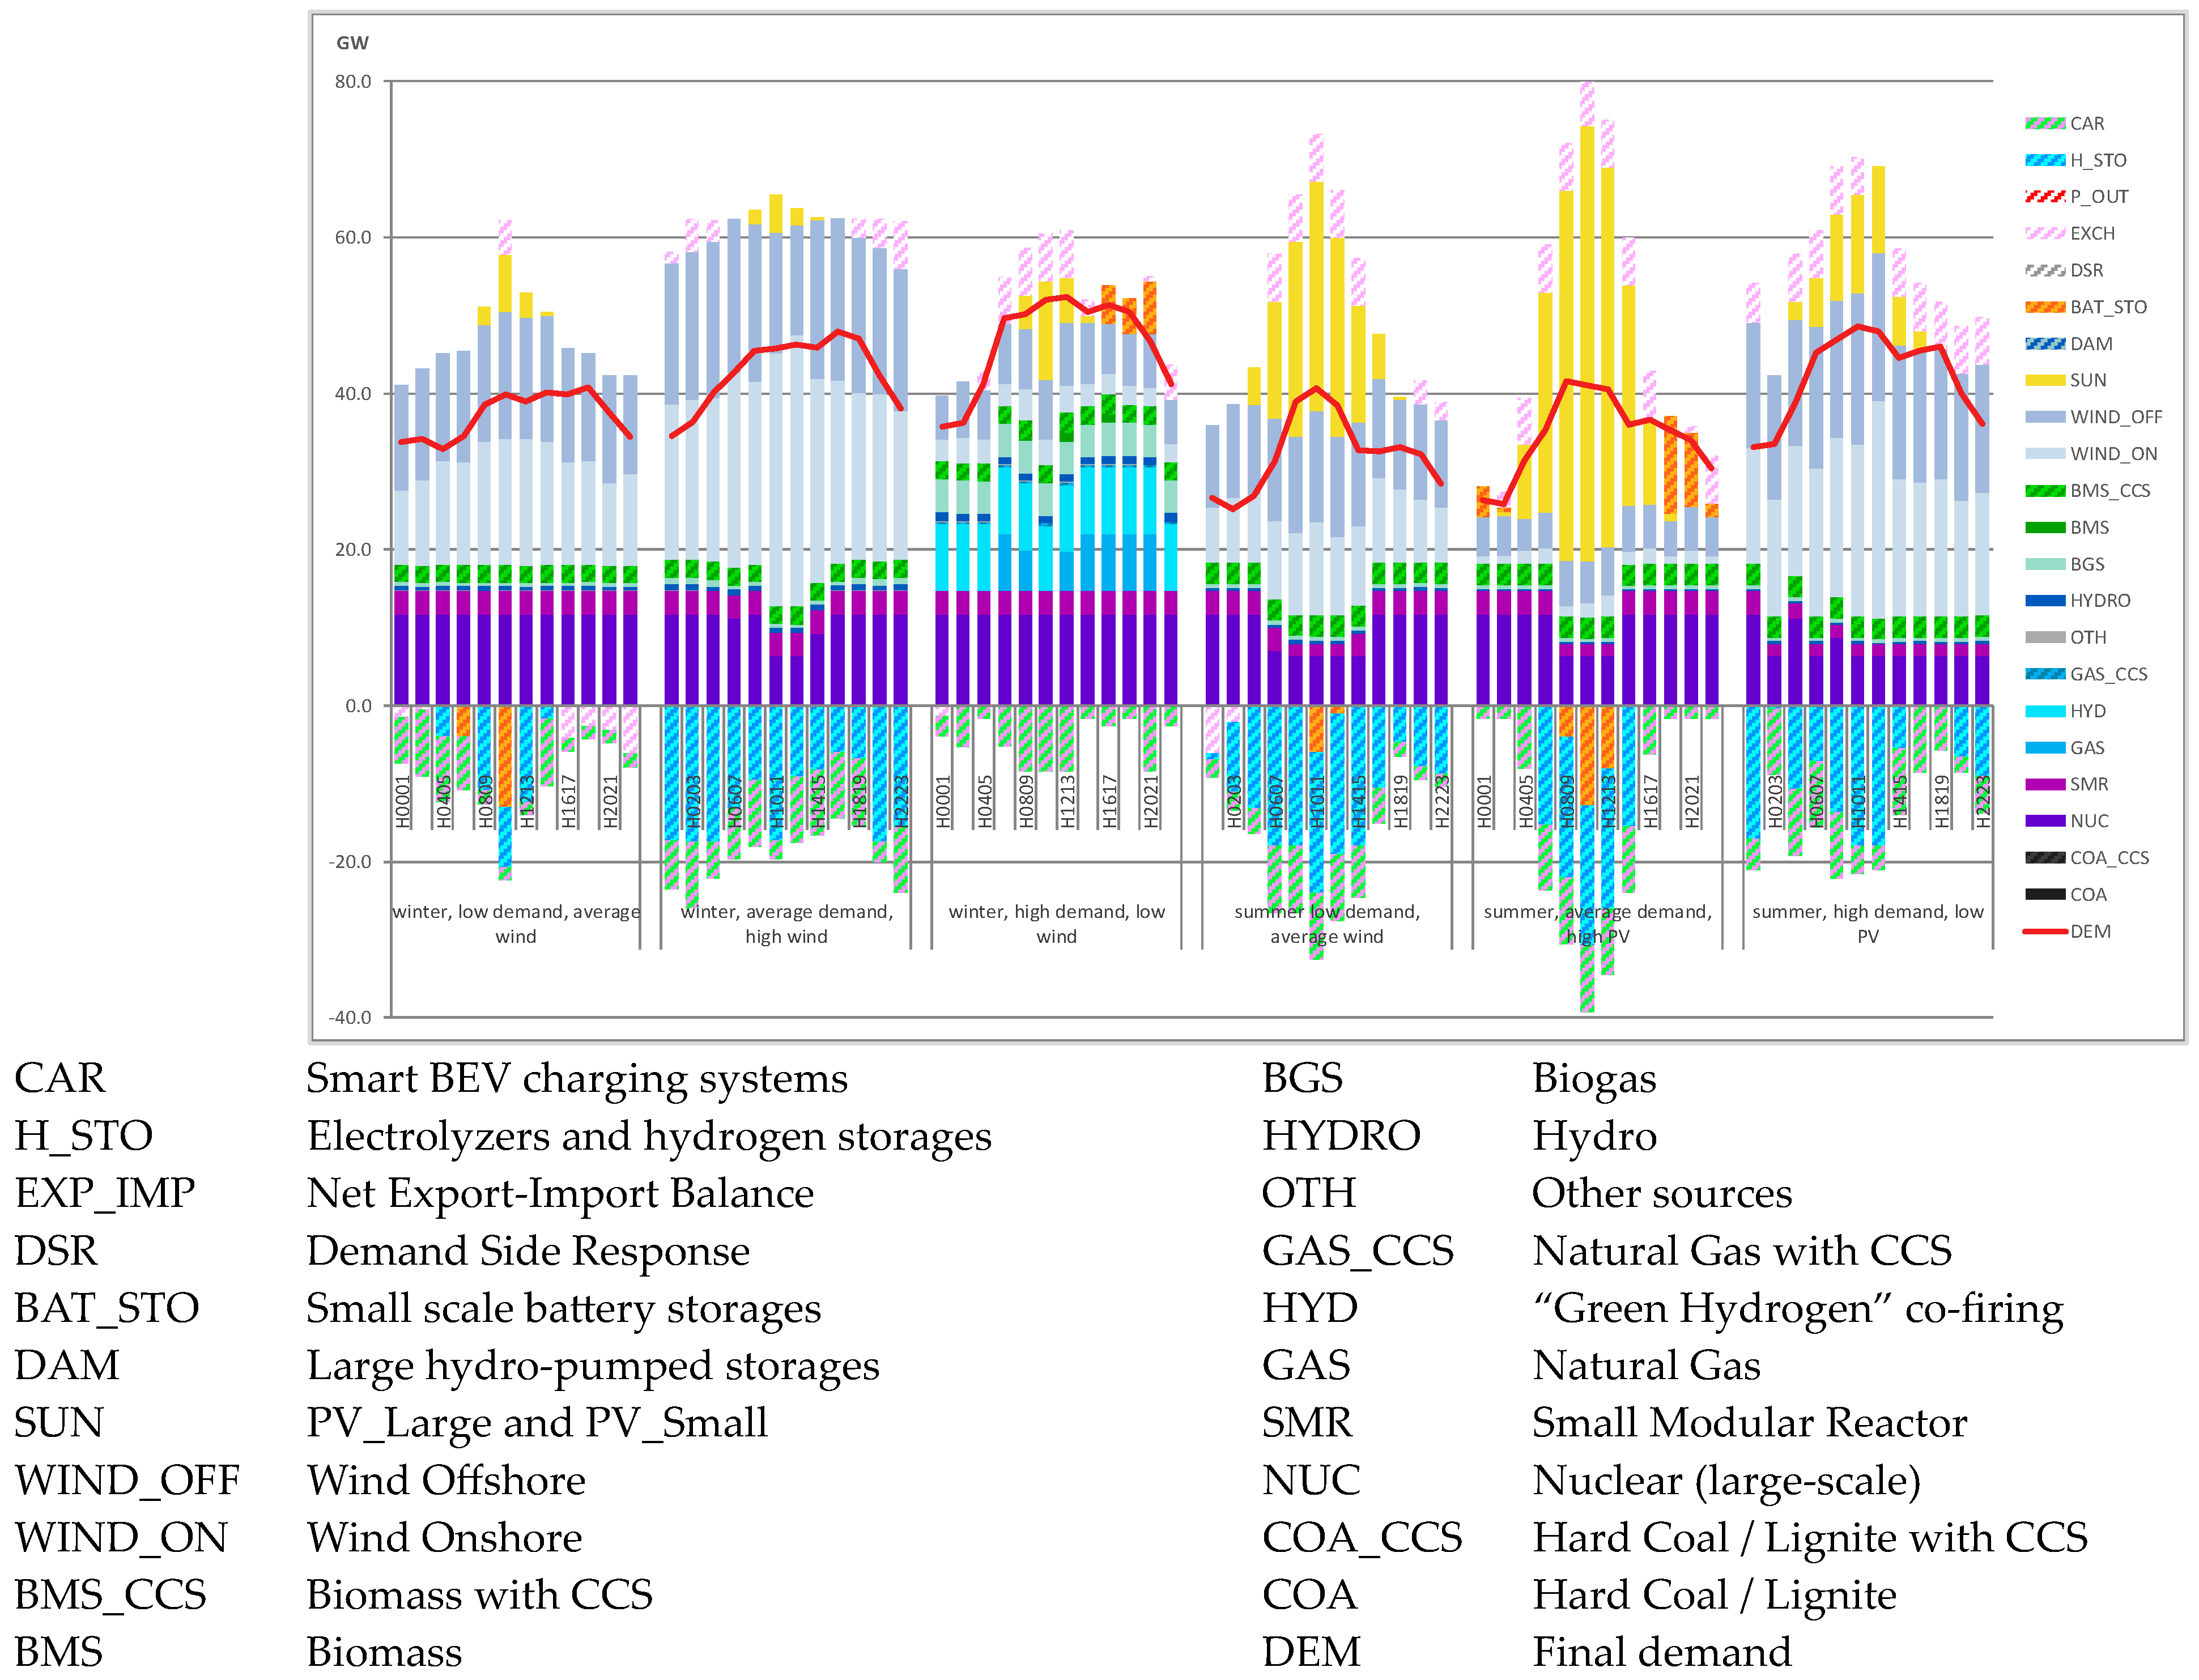
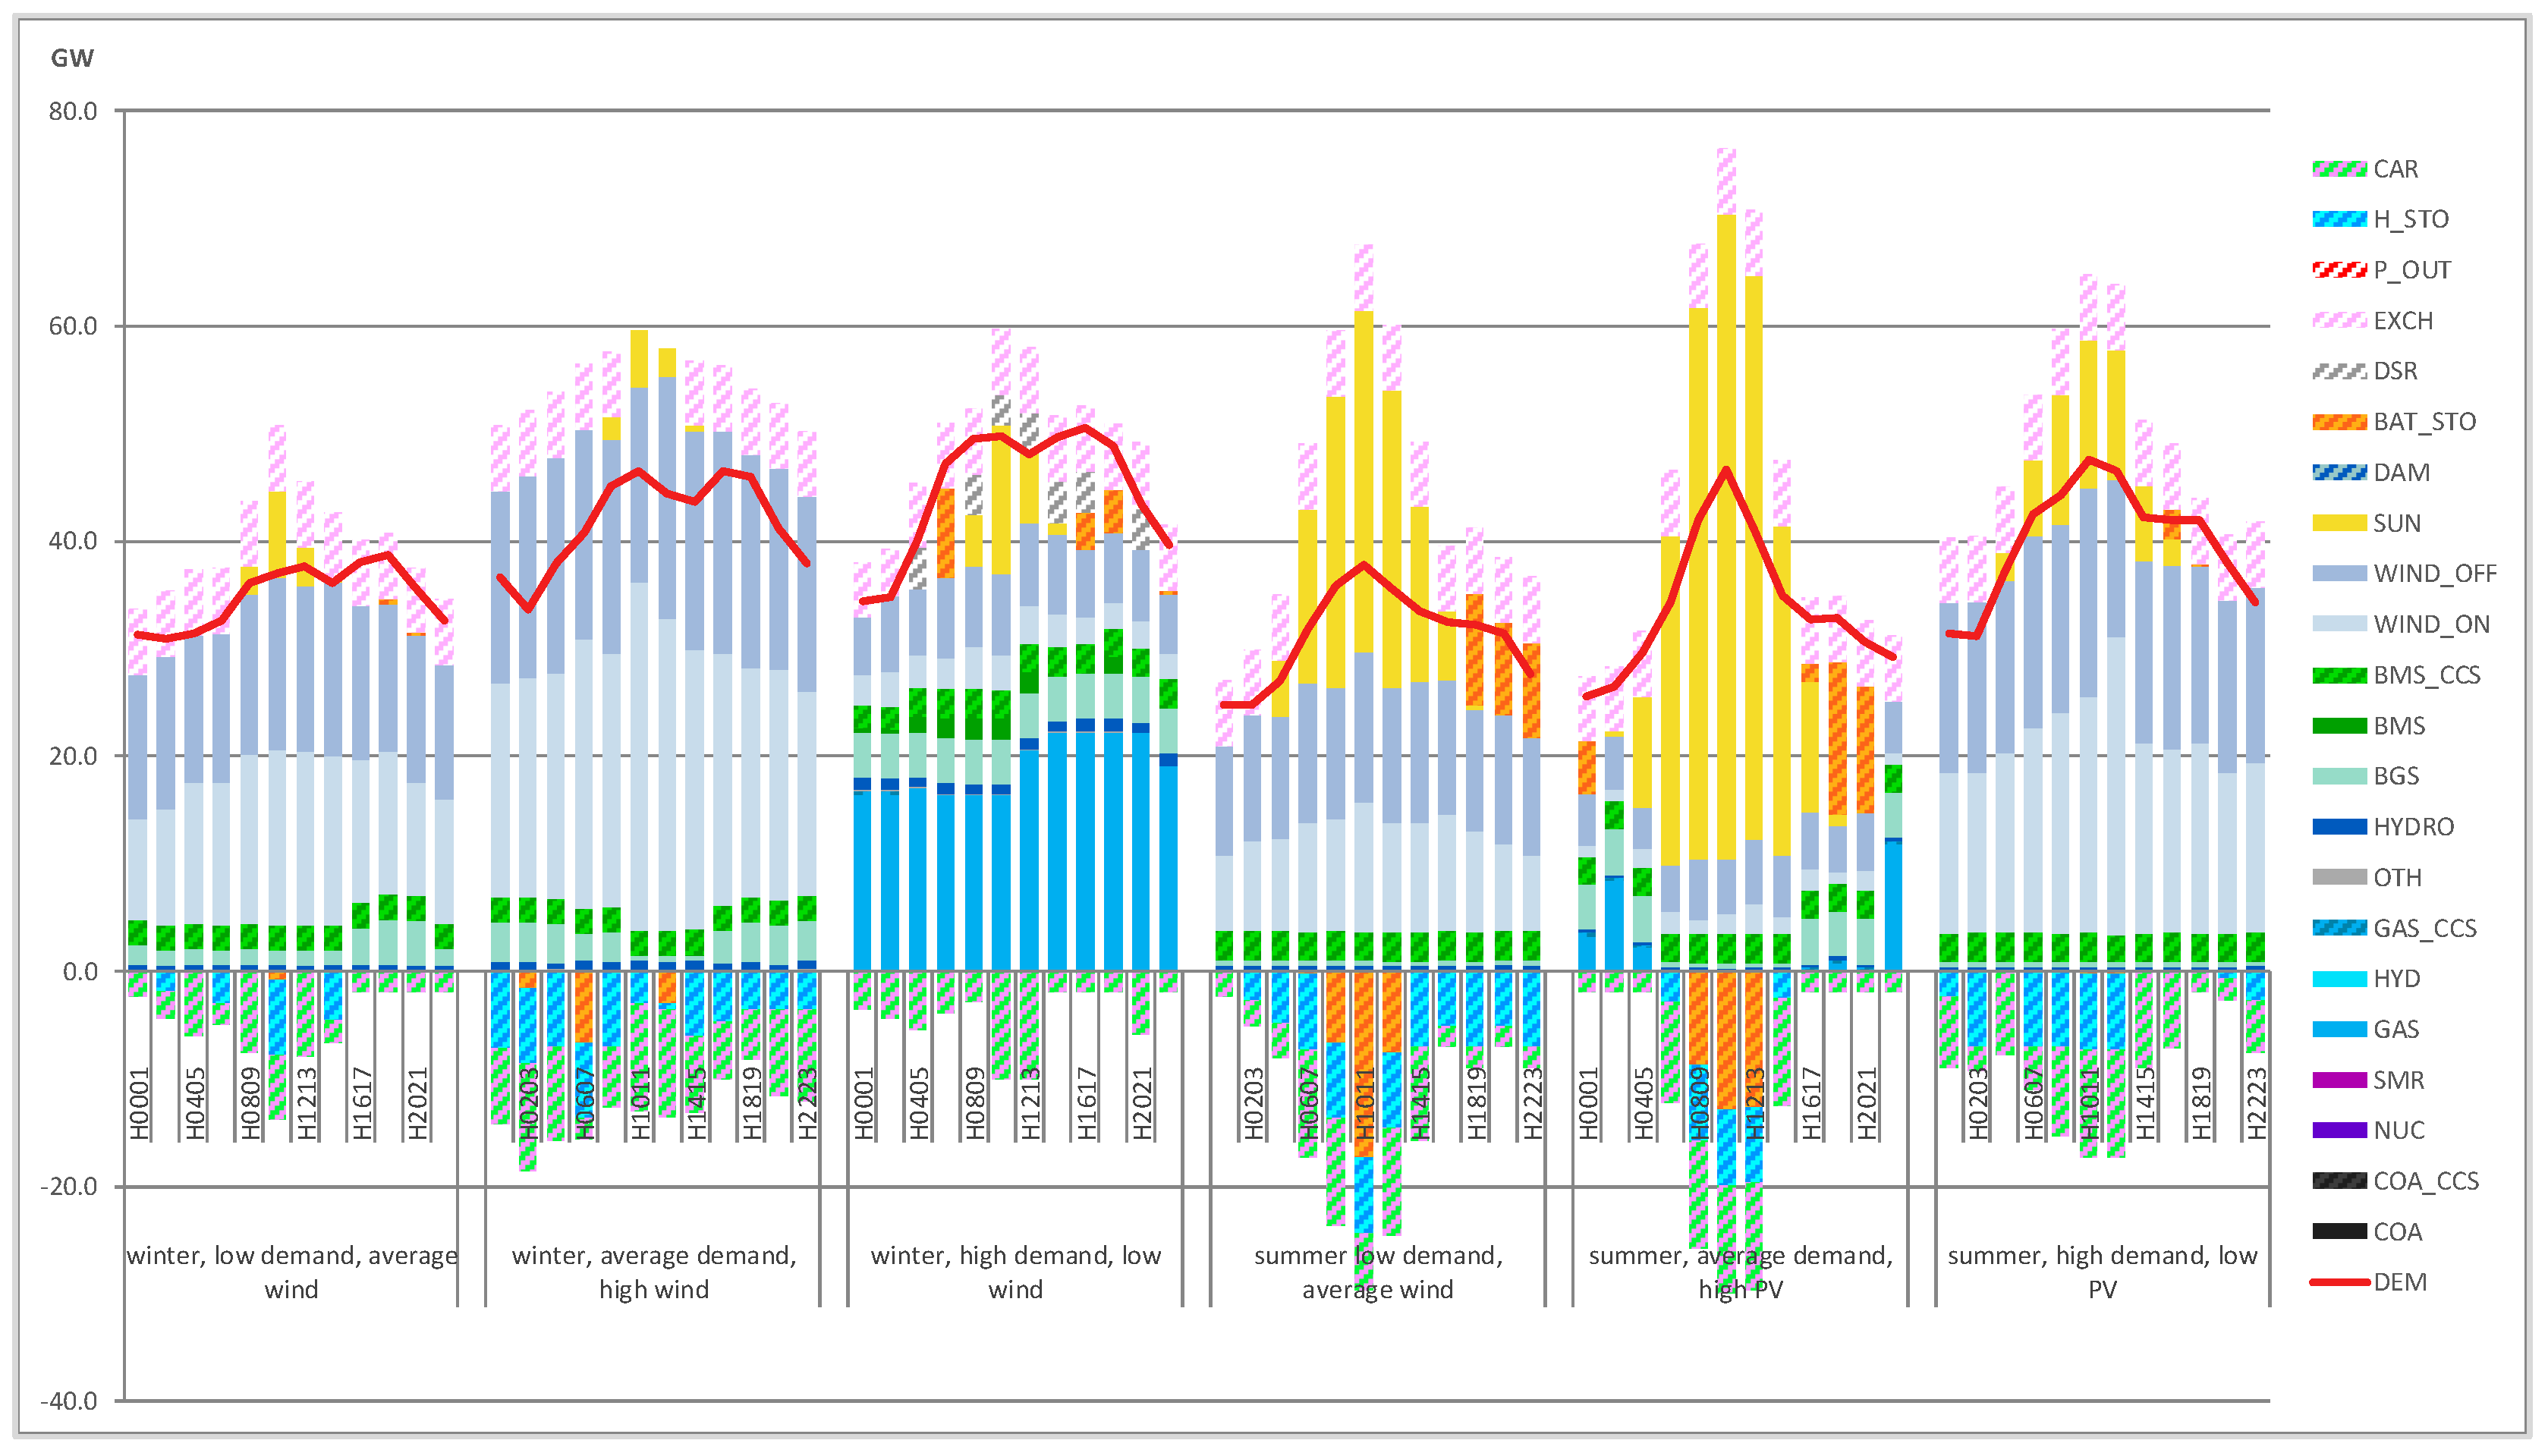
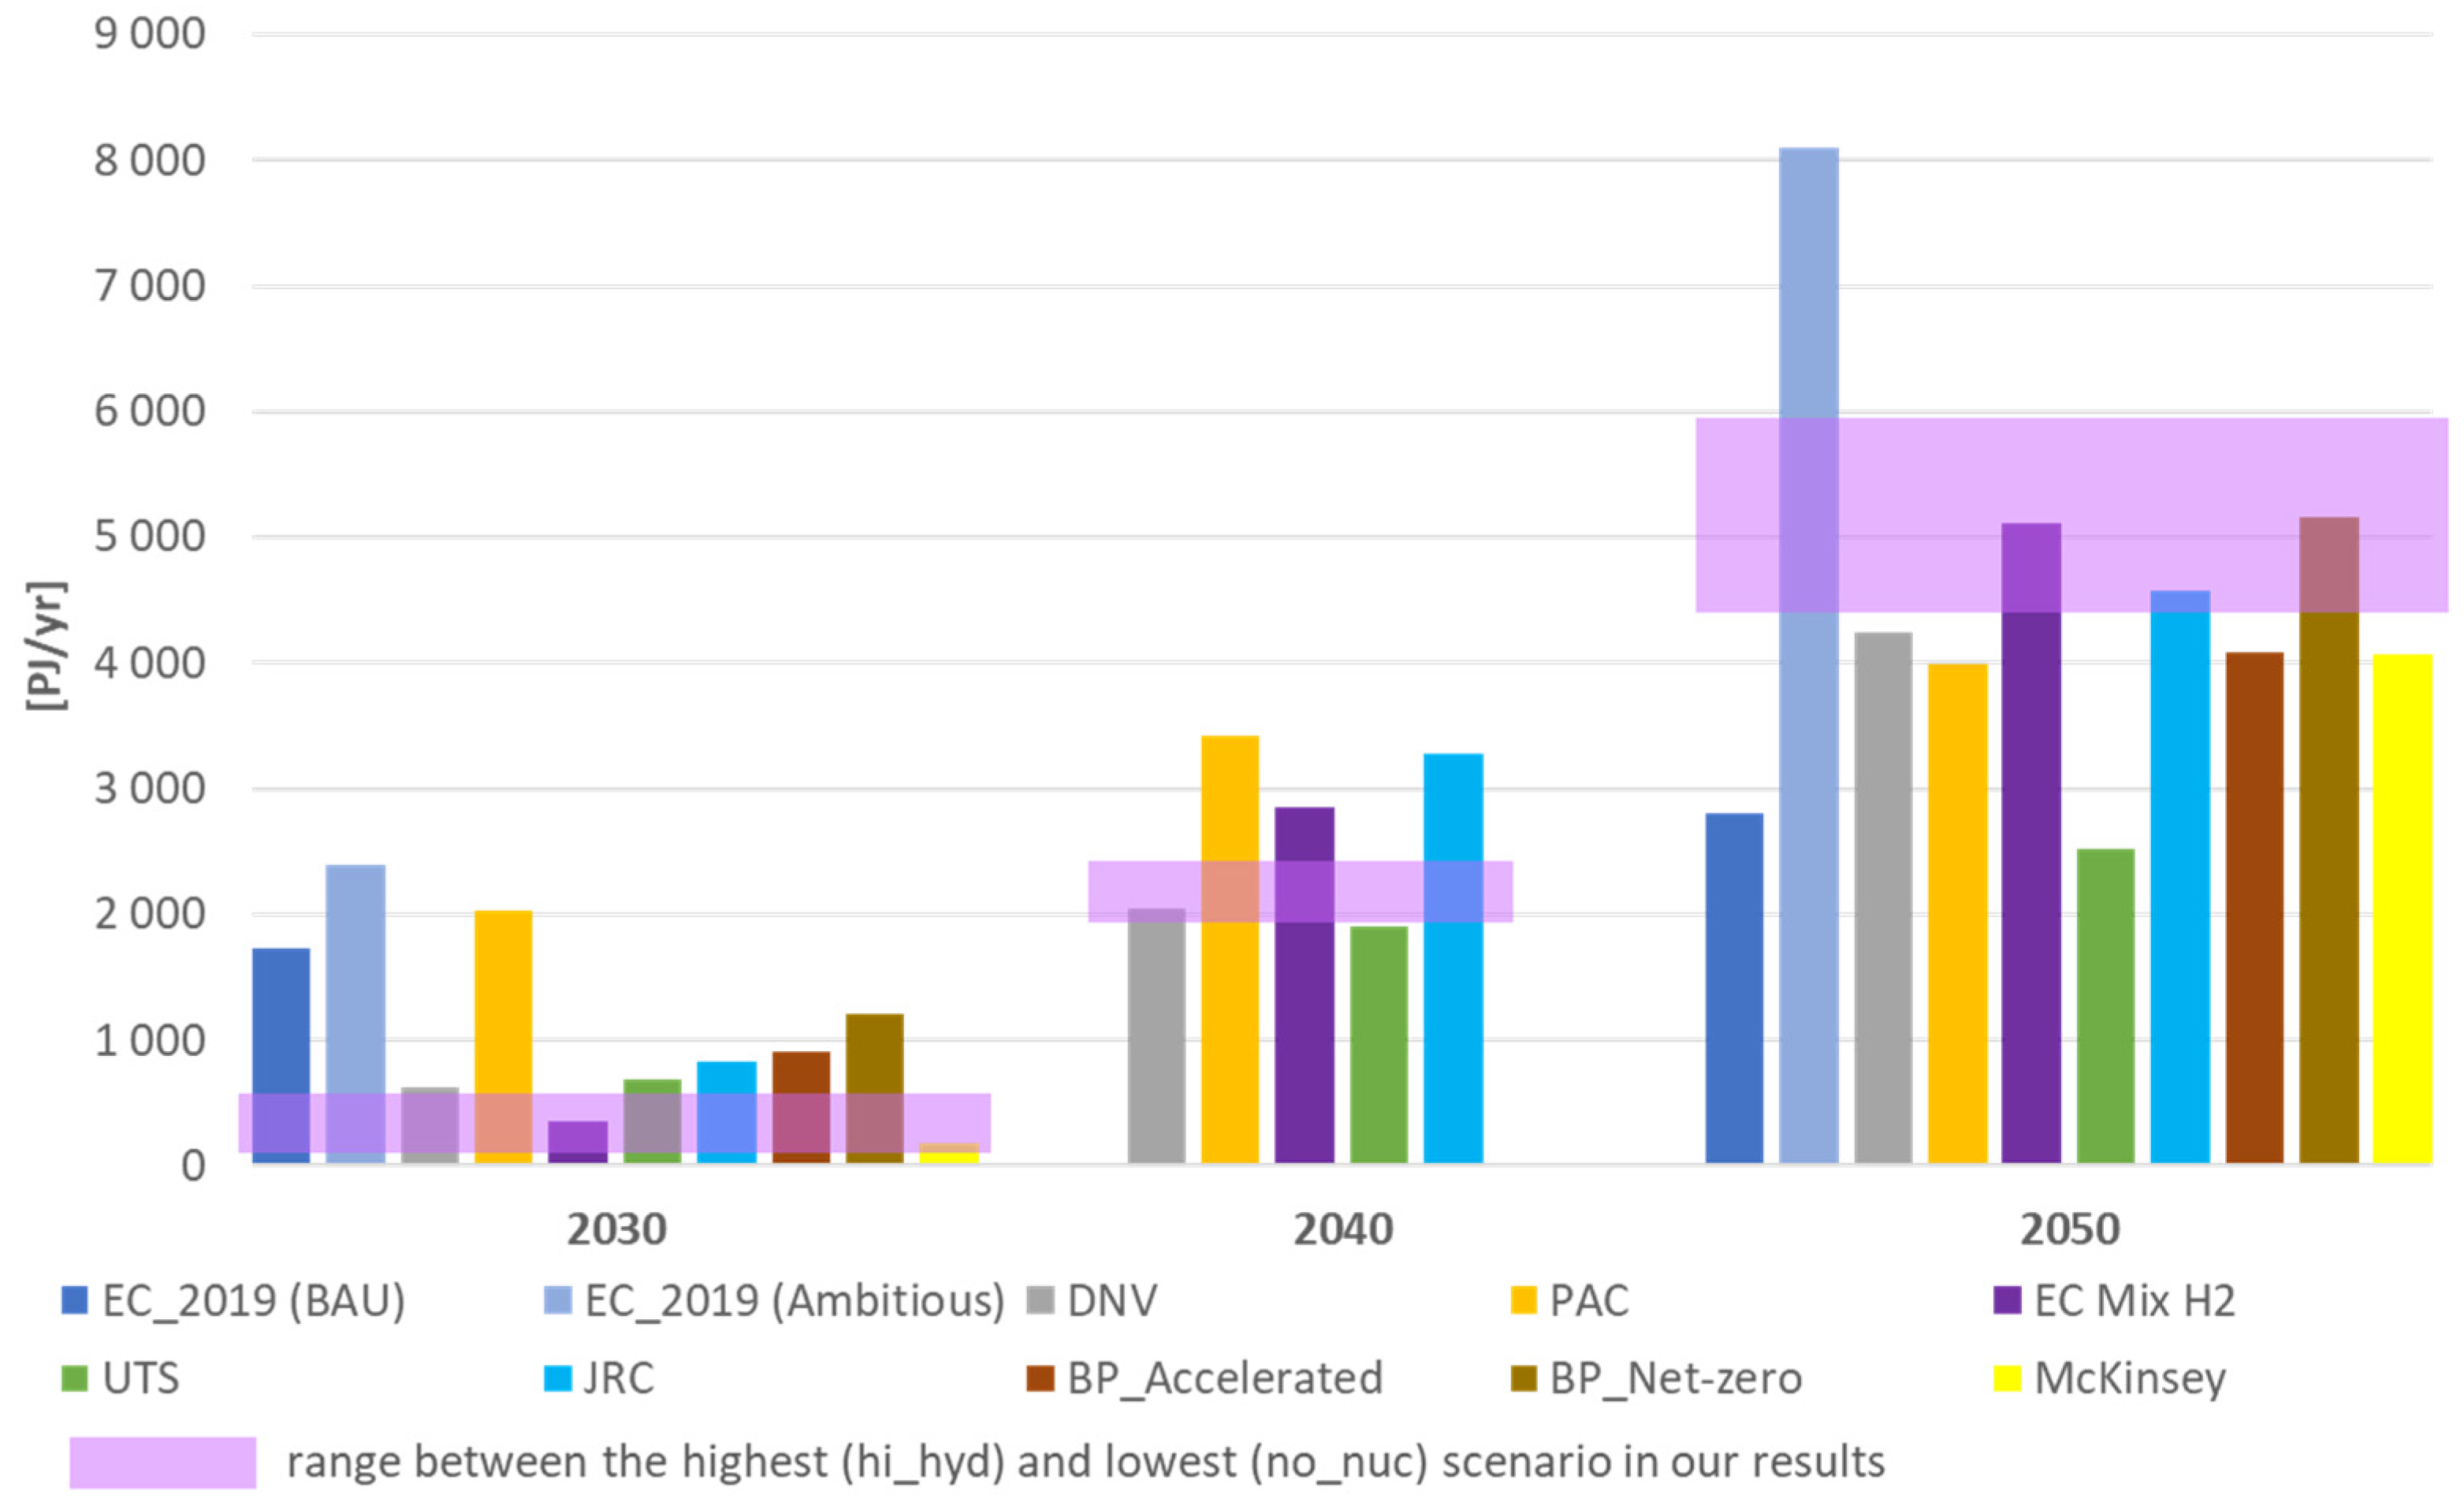
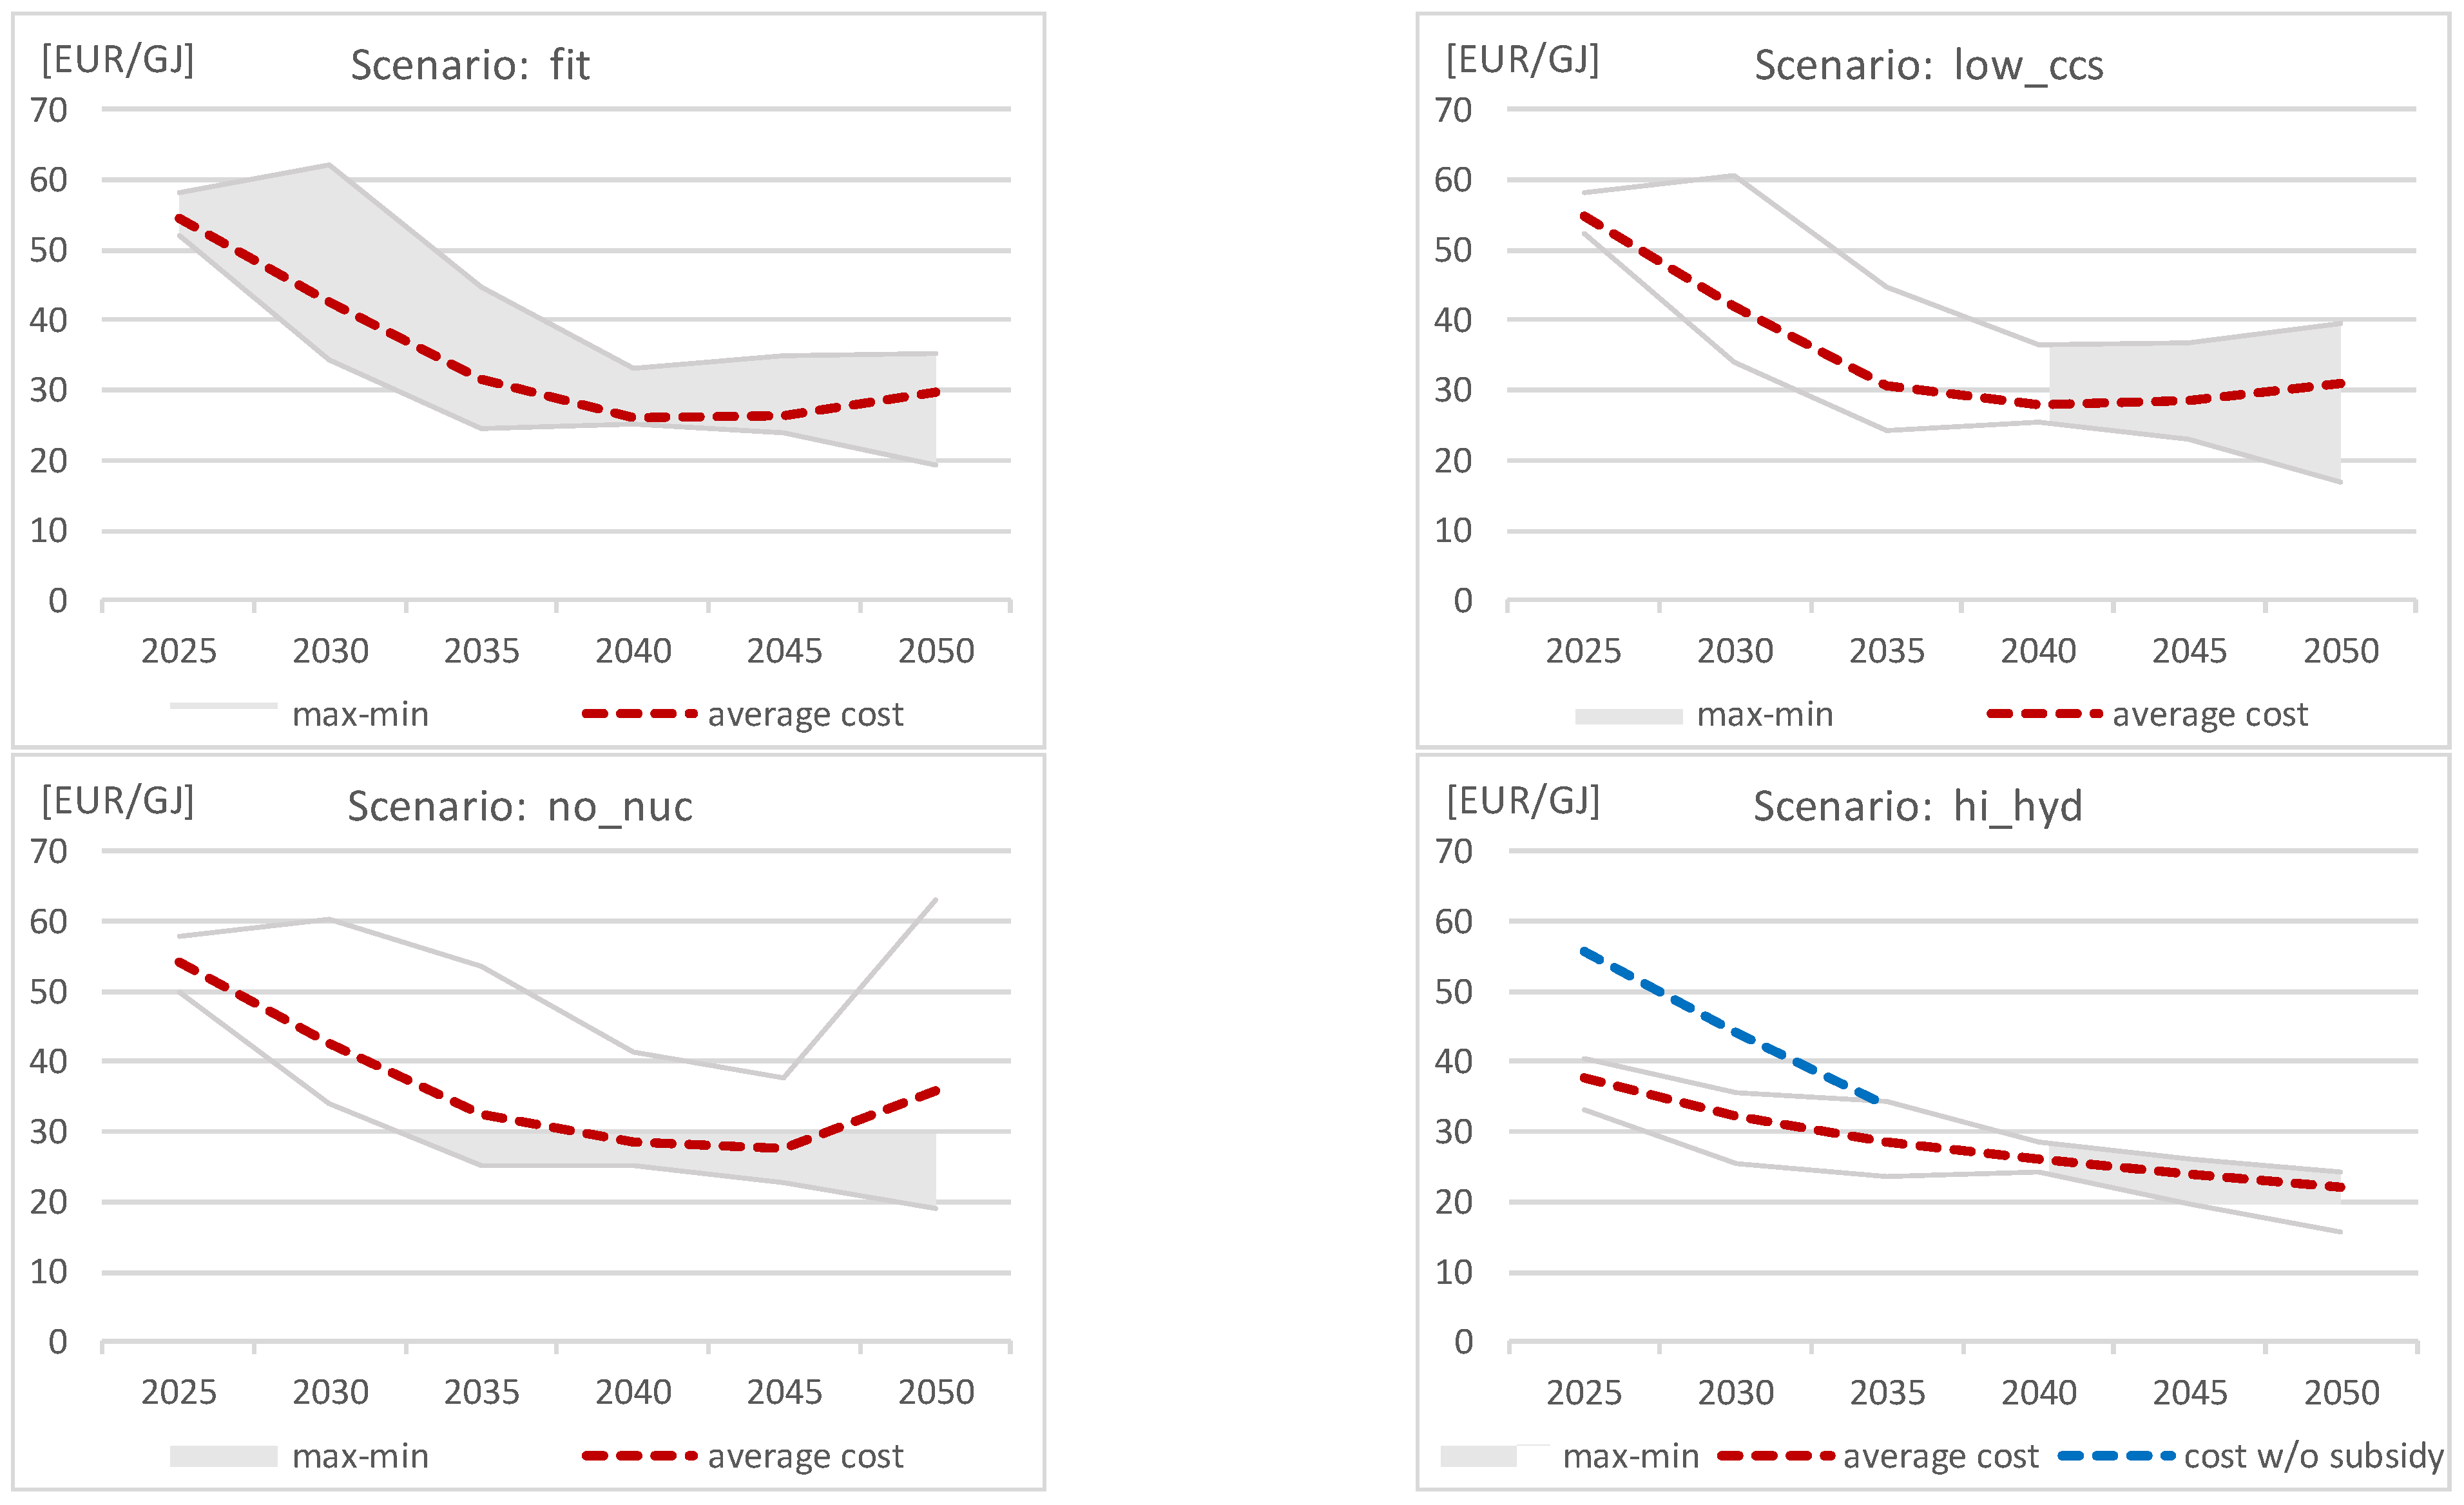
Disclaimer/Publisher’s Note: The statements, opinions and data contained in all publications are solely those of the individual author(s) and contributor(s) and not of MDPI and/or the editor(s). MDPI and/or the editor(s) disclaim responsibility for any injury to people or property resulting from any ideas, methods, instructions or products referred to in the content. |
© 2023 by the authors. Licensee MDPI, Basel, Switzerland. This article is an open access article distributed under the terms and conditions of the Creative Commons Attribution (CC BY) license (https://creativecommons.org/licenses/by/4.0/).