Abstract
Energy transition to renewable sources and more efficient technologies is needed for sustainable development. Although this transition is expected to take a longer time in developing countries, strategies that have been widely explored by the international academic community, such as advanced combustion modes and microgeneration, could be implemented more easily. However, the implementation of these well-known strategies in developing countries requires in-depth research because of the specific technical, environmental, social, and economic conditions. The present research relies on the use of biogas-fueled HCCI engines for power generation under sub-atmospheric conditions provided by high altitudes above sea level in Colombia. A small air-cooled commercial Diesel engine was modified to run in HCCI combustion mode by controlling the air–biogas mixture temperature using an electric heater at a high speed of 1800 revolutions per minute. An experimental setup was implemented to measure and control the most important experimental variables, such as engine speed, biogas flow rate, intake temperature, crank angle degree, intake pressure, NOx emissions, and in-cylinder pressure. High intake temperature requirements of around 320 C were needed to achieve stable HCCI combustion; the maximum net indicated mean effective pressure (IMEPn) was around 1.5 bar, and the highest net indicated efficiency was close to . Higher intake pressures and the addition of ozone to the intake mixture were numerically studied as ways to reduce the intake temperature requirements for stable HCCI combustion and improve engine performance. These strategies were studied using a one-zone model along with detailed chemical kinetics, and the model was adjusted using the experimental results. The simulation results showed that the addition of 500 ppm of ozone could reduce the intake temperature requirements by around 50 C. The experimental and numerical results achieved in this research are important for the design and implementation of HCCI engines running biogas for microgeneration systems in developing countries which exhibit more difficult conditions for HCCI combustion implementation.
1. Introduction
The World Energy Outlook by the International Energy Agency (IEA) recently stated that increasing energy efficiency and increasing the use of renewable energy are two of the most important strategies for achieving a scenario of sustainability development with net zero emissions [1]. Biogas is a renewable fuel that can be produced from organic waste, and has great potential for use in power generation, transportation, and the synthesis of fine chemicals and industrial products [2]. The global demand for biogas was around 35 billion cubic meter equivalents (bcme) in 2021, and is expected to increase to 138 bcme in 2050, according to the Net Zero Emissions scenario [1]. A traditional way of using biogas is power generation via internal combustion engine, with a minimum of methane (CH) concentration between and (volumetric basis) and hydrogen sulfide (HS) concentration below 500 ppm [3]. The most efficient way to use biogas for power generation is through diesel engines in dual-fuel combustion mode, achieving diesel substitution close to in stationary applications. The efficiency of end-use technologies and their capacity to operate solely on biogas are the factors that define the role of this fuel in expected energy scenarios [4]; additionally, the implementation of the cleanest and most advanced kinds of combustion is necessary because of the high costs of emissions after-treatment systems.
Homogeneous charge compression ignition (HCCI) engines have been studied for five decades as an alternative to vehicle powertrains because of their potential for simultaneous reduction of nitrogen oxides (NO) and particulate matter (PM) without emissions after-treatment systems. HCCI combustion is usually implemented through commercial engine modification by removing the OEM ignition control and implementing strategies that control the intake charge conditions, such as intake pre-heating, negative valve overlap, and boost pressures. HCCI is a combustion mode mainly controlled by chemical kinetics, with little effect of turbulence and higher heat release rates when compared with compression ignition engines and spark-ignited engines. Due to its rapid heat release rate, lean equivalence ratios or highly diluted mixtures are required in order to obtain safe operation under HCCI combustion, leading to in-cylinder temperatures below 1800 K, which in turn leads to ultra-low NO and PM emissions [5]. In HCCI engines, the beginning of combustion is controlled by the charge auto-ignition temperature; therefore, fuels with high auto-ignition resistance require higher intake temperatures to achieve stable and safe combustion. Biogas is manly composed of methane (CH) and carbon dioxide (CO). Methane exhibits higher auto-ignition temperatures when compared with other hydrocarbons, and carbon dioxide reduces the average charge temperature during compression stroke because of its lower specific heats ratio when compared with air; this combined effect leads to high intake temperature requirements for biogas-fueled HCCI engines.
One of the most important drawbacks of the implementation of HCCI combustion is the lowered net indicated mean effective pressure (IMEPn), which is usually around 5 bar for naturally aspirated engines operating at sea level with liquid fuels. Any factor that reduces the intake air density tends to decrease the achievable IMEPn in HCCI engines. The implementation of HCCI combustion for fuels with higher auto-ignition temperatures and operating at high altitudes above sea level requires substantial research efforts in order to determine the potential of HCCI engines for power generation under these adverse conditions. The most important previous research on this specific field, to the best of the authors’ knowledge, is presented below.
Blizman et al. [6] evaluated a Caterpillar 3116 -L diesel engine converted to operate in HCCI mode fueled with both natural gas and simulated landfill gas. The engine compression ratio and speed were 16.7:1 and 1800 rpm, respectively. Operation with simulated landfill gas was evaluated at equivalence ratios of , , , and , with intake temperatures ranging between 160 and 185 C and boosted intake air around bar absolute pressure. Operating with simulated landfill gas as fuel, a Brake Thermal Efficiency (BTE) was achieved while producing about 26 kW of electrical power, compared to the and 29 kW, respectively, achieved with natural gas. NOx and unburned hydrocarbon (HC) emissions were maintained below 10 ppm.
Bedoya et al. [7] studied a Volkswagen TDI -L diesel engine in HCCI mode and fueled with simulated biogas ( CH and CO in a volumetric basis) with a modified compression ratio of 17:1 and running at 1800 rpm. Baseline tests were carried out at equivalence ratios of , , and , with absolute intake pressures of 2 and bar and intake temperatures between 473 and 483 K. Excessive cycle-to-cycle variation (normalized standard deviation of IMEP greater than ) was observed at the lowest equivalence ratio, while unacceptable ringing intensity (around 14 MW/m) was observed at the highest equivalence ratio. In later research, Bedoya et al. [8] used two strategies at low equivalence ratio to improve engine performance, specifically, oxygen enrichment of the intake charge and gasoline pilot port injection. At high equivalence ratio, delayed CA50 after top dead center was used to reduce excessive ringing intensities. Oxygen enrichment did not allow for stabilized combustion at the low load limit. Gasoline pilot port injection decreased cycle-to-cycle variation, HC, and carbon monoxide (CO) emissions. The delayed CA50 allowed led to a reduction in ringing intensity. In summary, a biogas-fueled HCCI engine operating with stable combustion between and of equivalence ratios was successfully implemented, allowing indicated efficiencies above , a maximum gross indicated mean effective pressure (IMEPg) of bar, and NOx emissions below 20 ppm.
Kozarac et al. [9] performed a numerical evaluation of the effect of internal and external charge recirculation on the combustion variables of an HCCI engine fueled with biogas, and investigated the potential of these strategies to reduce the requirement for a high intake temperature. Their study revealed that the evaluated strategies did not significantly reduce the required intake temperature for a fixed combustion timing. On the other hand, they observed that high internal charge recirculation, which was achieved using negative valve overlap (NVO), led to unstable combustion.
The studies mentioned above suggest that stable HCCI combustion with biogas is feasible within a narrow range of equivalence ratios, and that multiple strategies are necessary to reduce both cyclic variability at low loads and ringing intensities at high loads. A potentially useful strategy for a power generation system based on biogas-fueled HCCI engines is the addition of ozone to the intake charge. This strategy requires less maintenance compared to charge heating, and demands less energy to operate. Ozone addition tends to reduce the ignition delay as the mixture becomes leaner, as it promotes O radical formation, leading to a greater concentration of OH and H radicals [10]. Nishida and Tachibana [11] experimentally and numerically evaluated the effect of adding ozone to the charge of an HCCI engine fueled with natural gas, finding that an ozone concentration of 700 ppm could potentially lead to the same thermal efficiency with respect to diesel engine operation. In additional, they were able to achieve low NOx emissions. The authors further highlighted the possibility of using ozone addition as an ignition timing control strategy during HCCI combustion.
The present research focused on studying biogas HCCI combustion in a microgeneration system at 1500 m above sea level, which provides sub-atmospheric conditions (85 kPa of intake pressure). A small commercial diesel engine was modified to allow biogas auto-ignition close to the top dead center by controlling the intake temperature and equivalence ratios. Results on the intake temperature requirements and the main performance parameters for the practical operating range for biogas HCCI combustion are reported in this paper. These experimental results are important for the implementation of microgeneration systems running biogas with HCCI combustion, as to the best of our knowledge there is a lack of research on the practical limits for this kind of combustion operating at sub-atmospheric conditions when using renewable fuels such as biogas. Additionally, our research aimed to perform a numerical study of boosted intake pressures and addition of ozone to the intake charge as strategies for reducing the required intake temperature for stable combustion and increasing the engine’s power output.
2. Materials and Methods
2.1. Experimental Setup
The research engine used in this study was a modified two-cylinder four-stroke air-cooled and naturally aspirated direct-injection diesel engine. An electric motor was used to keep the engine speed constant at 1800 rpm. The experiments were conducted in Medellín, Colombia (1500 m above sea level). Table 1 shows the most important technical engine characteristics.

Table 1.
Technical engine specifications.
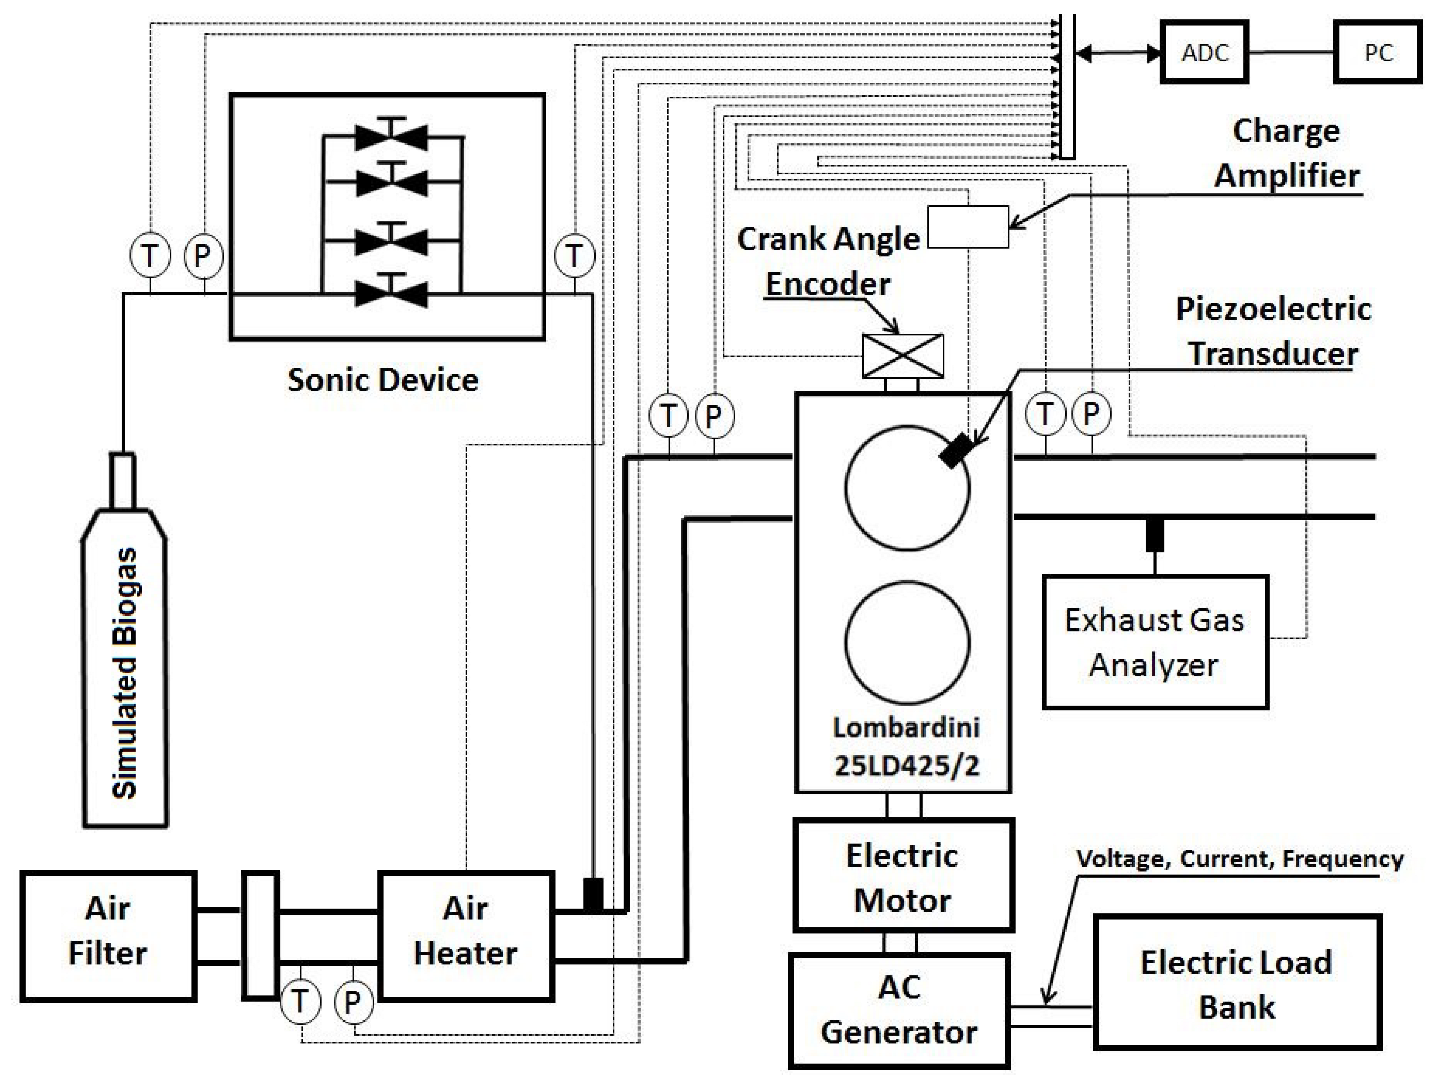
Engine modifications included the replacement of the original bowl-type pistons with flat pistons. This change was carried out to reduce the inlet temperature requirements by lowering the effective area for heat transfer. Additionally, the compression ratio was reduced from 19:1 to :1. Fuel was supplied through a fuel injection system in the intake manifold using a set of calibrated orifices to measure the biogas flow rate. A piezoelectric transducer (Kistler 6125C) coupled to a charge amplifier (Kistler 5064B) was used to capture the in-cylinder pressure in a cylinder. A Kistler SCP 2853A120 system was used for pressure signal conditioning, while the pressure measurements were triggered by a crankshaft encoder with a resolution of 10 samples per crank angle degree (Nord H). The air flow rate was estimated by measuring the intake pressure, intake temperature, and engine speed. An electronic pressure gauge (Wika A10) was used for measuring intake pressure. Inlet temperature was measured with K-type thermocouples. CA50, calculated from the in-cylinder pressure data, was monitored in real-time and served as a feedback parameter for the intake temperature using an open-loop control, which was controlled by adjusting an intake air heater (Silvania threaded inline heater 1-NPT 6 kW).
The engine was fueled using a mix of commercial compressed natural gas (CNG) and CO to simulate a biogas composition with values of CNG and CO on a volumetric basis. Table 2 summarizes the important properties of the natural gas used in the experimental procedure. Table 3 shows the most relevant data on the accuracy and uncertainty of the instruments used during the experiments.
Table 2.
Fuel properties.
Table 3.
Accuracy and uncertainty associated with measurements.
All signals were recorded on a personal computer. The acquisition system recorded data at a rate of 250 kHz with a resolution of 16 bits. The experimental setup is shown in Figure 1.

Figure 1.
Schematic diagram of the experimental setup; T: temperature measurement, P: pressure measurement.
2.1.1. Experimental Procedure
Two equivalence ratios (low and high value) were evaluated using two intake temperatures. The factorial experimental design was conducted using the methodology described by Montgomery [13]. The levels and factors evaluated in the biogas tests are shown in Table 4, which were replicated twice.
Table 4.
Factorial experimental design for biogas experiments.
A total of 100 cycles were recorded for each operating point.
2.1.2. Rate of Heat Release Calculations
Heat release rate (HRR) was calculated from the acquired in-cylinder pressure curves using a zero-dimensional heat release model. Consequently, the main combustion parameters were extracted from the heat release and in-cylinder pressure curves. HRR was calculated as follows [14]:
where is the chemical energy released by the fuel (J), is the specific heat ratio, p is the in-cylinder pressure (Pa), V is the instantaneous cylinder volume (m), is the gas-surrounding heat exchange (J), and are the enthalpy (J/kg) and mass (kg) of the flow in the piston-cylinder-ring crevices, respectively, and is the crank angle.
Heat transfer was calculated using the correlation of Chang et al. [15]:
where (W/m.K) is the heat transfer coefficient, is a scaling factor of the heat transfer coefficient ( in this research), L (m) is the instantaneous chamber height, p (kPa) is the in-cylinder pressure, T (K) is the gas temperature calculated from the ideal gas state equation, v (m/s) is the combustion induced velocity, (m/s) is the mean piston speed, (m) is the cylinder displacement, (kPa), (K), and (m) are the gas conditions at IVC, and (kPa) is the motoring pressure (without combustion). Moreover, is a dimensionless constant with a value of , while (m/s.K) is a constant which takes a value of 0 during the compression period and during the combustion and expansion period.
Flow in the piston cylinder ring crevices was modelled as an orifice flow [16]:
When:
Otherwise:
In Equations (4)–(6), is the mass flow rate in the piston–cylinder–ring crevices (kg/s), is the discharge coefficient ( in this research), is the area of the orifice connecting the combustion chamber and the crankcase (which is considered equal to the passage area caused by ring gaps, m), p is the in-cylinder pressure (kPa), is the pressure in the crankcase (which is considered equal to atmospheric pressure in kPa), is the specific heat ratio, R is the gas constant (kJ/kg.K), and T is the mass temperature (K), which is assumed to be equal to the wall temperature.
The mass contained inside the cylinder immediately after of the intake valve closure consists of air, fuel, and residual gas from previous cycles. The residual gas fraction was calculated using the expression proposed by Ortiz-Soto et al. [17].
The start and end of combustion were calculated using the (CA10) and (CA90) of mass burned (), respectively, which was calculated as follows:
where is the mass of fuel inducted per cycle and is the low heating value of the fuel.
Finally, the normalized standard deviation of IMEPg was used to evaluate the combustion stability of HCCI, which is calculated using the following expression:
where is the standard deviation of measured for 100 cycles and is the in motored conditions. The maximum value for acceptable stability was set to for the normalized standard deviation of , in accordance with the values suggested in the literature [18].
2.2. Numerical Methodology: Single-Zone Model Approach
A CHEMKIN zero-dimensional detailed kinetic model was used to model HCCI auto-ignition to evaluate the effect of increasing intake pressure and ozone addition on combustion phasing and intake temperature requirements. This is a lumped model that ignores spatial variations in the combustion chamber and treats heat loss as a distributed heat transfer rate that is proportional to the temperature difference between the average gas temperature and the time-averaged wall temperature. Although the model oversimplifies the combustion chamber conditions during combustion, because the heat release is a global non-propagating auto-ignition process a zero-dimensional model can reasonably capture the start of combustion and the heat release of the core temperature zone. Predictions for start of combustion and for NOx depend on the peak temperature of the core gases inside the cylinder. Therefore, the model is expected to provide reasonable accuracy for estimating optimal operating conditions and certain combustion performance parameters [19].
To reduce over-prediction of the pressure during compression stroke and near to the TDC, the compression ratio was adjusted to match the experimental motored pressure and numerical motored pressure. In these simulations, a compression ratio of :1 was used, while the bore, stroke, and connecting rod were identical to the experiments (see Table 1).
The heat transfer to the cylinder walls was modeled using the correlation developed by Woschni to estimate the average cylinder gas speed and Nusselt number:
The values used for the constants were , , , , , , and .
The optimal operating conditions associated with ozone addition or increased intake pressure were defined from the ignition timing, where the crank angle of ignition was defined as the crank angle for the peak molar fraction of HO, which usually coincides with the crank angle for of cumulative heat release (CA10) in simulations [20]. The crank angle interval selected for the peak molar fraction of HO to ensure an optimal operating condition was between 3 CAD before top dead center (bTDC) and 3 CAD after top dead center (aTDC), as high heat release rates below this interval have usually been obtained in previous research, leading to excessive ringing intensity, while above this interval high cycle-to-cycle variations have been obtained, leading to misfire [7,21].
Two gas phase mechanisms were used to analyse the effects of the kinetic model on the operating condition results. The mechanisms used were GRI (51 species and 325 reactions) and San Diego (63 species and 307 reactions, including nitrogen chemistry), version 2014-10-04. A comparison shows that both mechanisms have 46 species and 144 reactions in common (the same reactants and products), and that 139 of these reactions show differences in at least one of the Arrhenius parameters.
The effect of ozone on auto-ignition and combustion was studied using the ozone kinetic submechanism used by Halter et al. to study the effect of ozone on methane combustion [22]. This submechanism was coupled to both of the detailed mechanisms used in this research.
Computations were performed during the closed-valve period between IVC and EVO (see Table 1). Two different ozone concentrations (100 and 250 ppm) were used to evaluate this strategy on the intake temperature required to reach the auto-ignition condition near the TDC. In addition, three different pressures at the IVC were used (1, , and 2 bar) in order to compare the effect of ozone concentration with another well-known strategy for improving engine performance and the energy requirement in the intake.
2.3. Wall Temperature Estimation
Wall temperature was estimated using polytropic coefficient and Woschni correlations [23]. Polytropic coefficients were calculated using the in-cylinder pressure, as follows:
where n is the polytropic coeffcient.
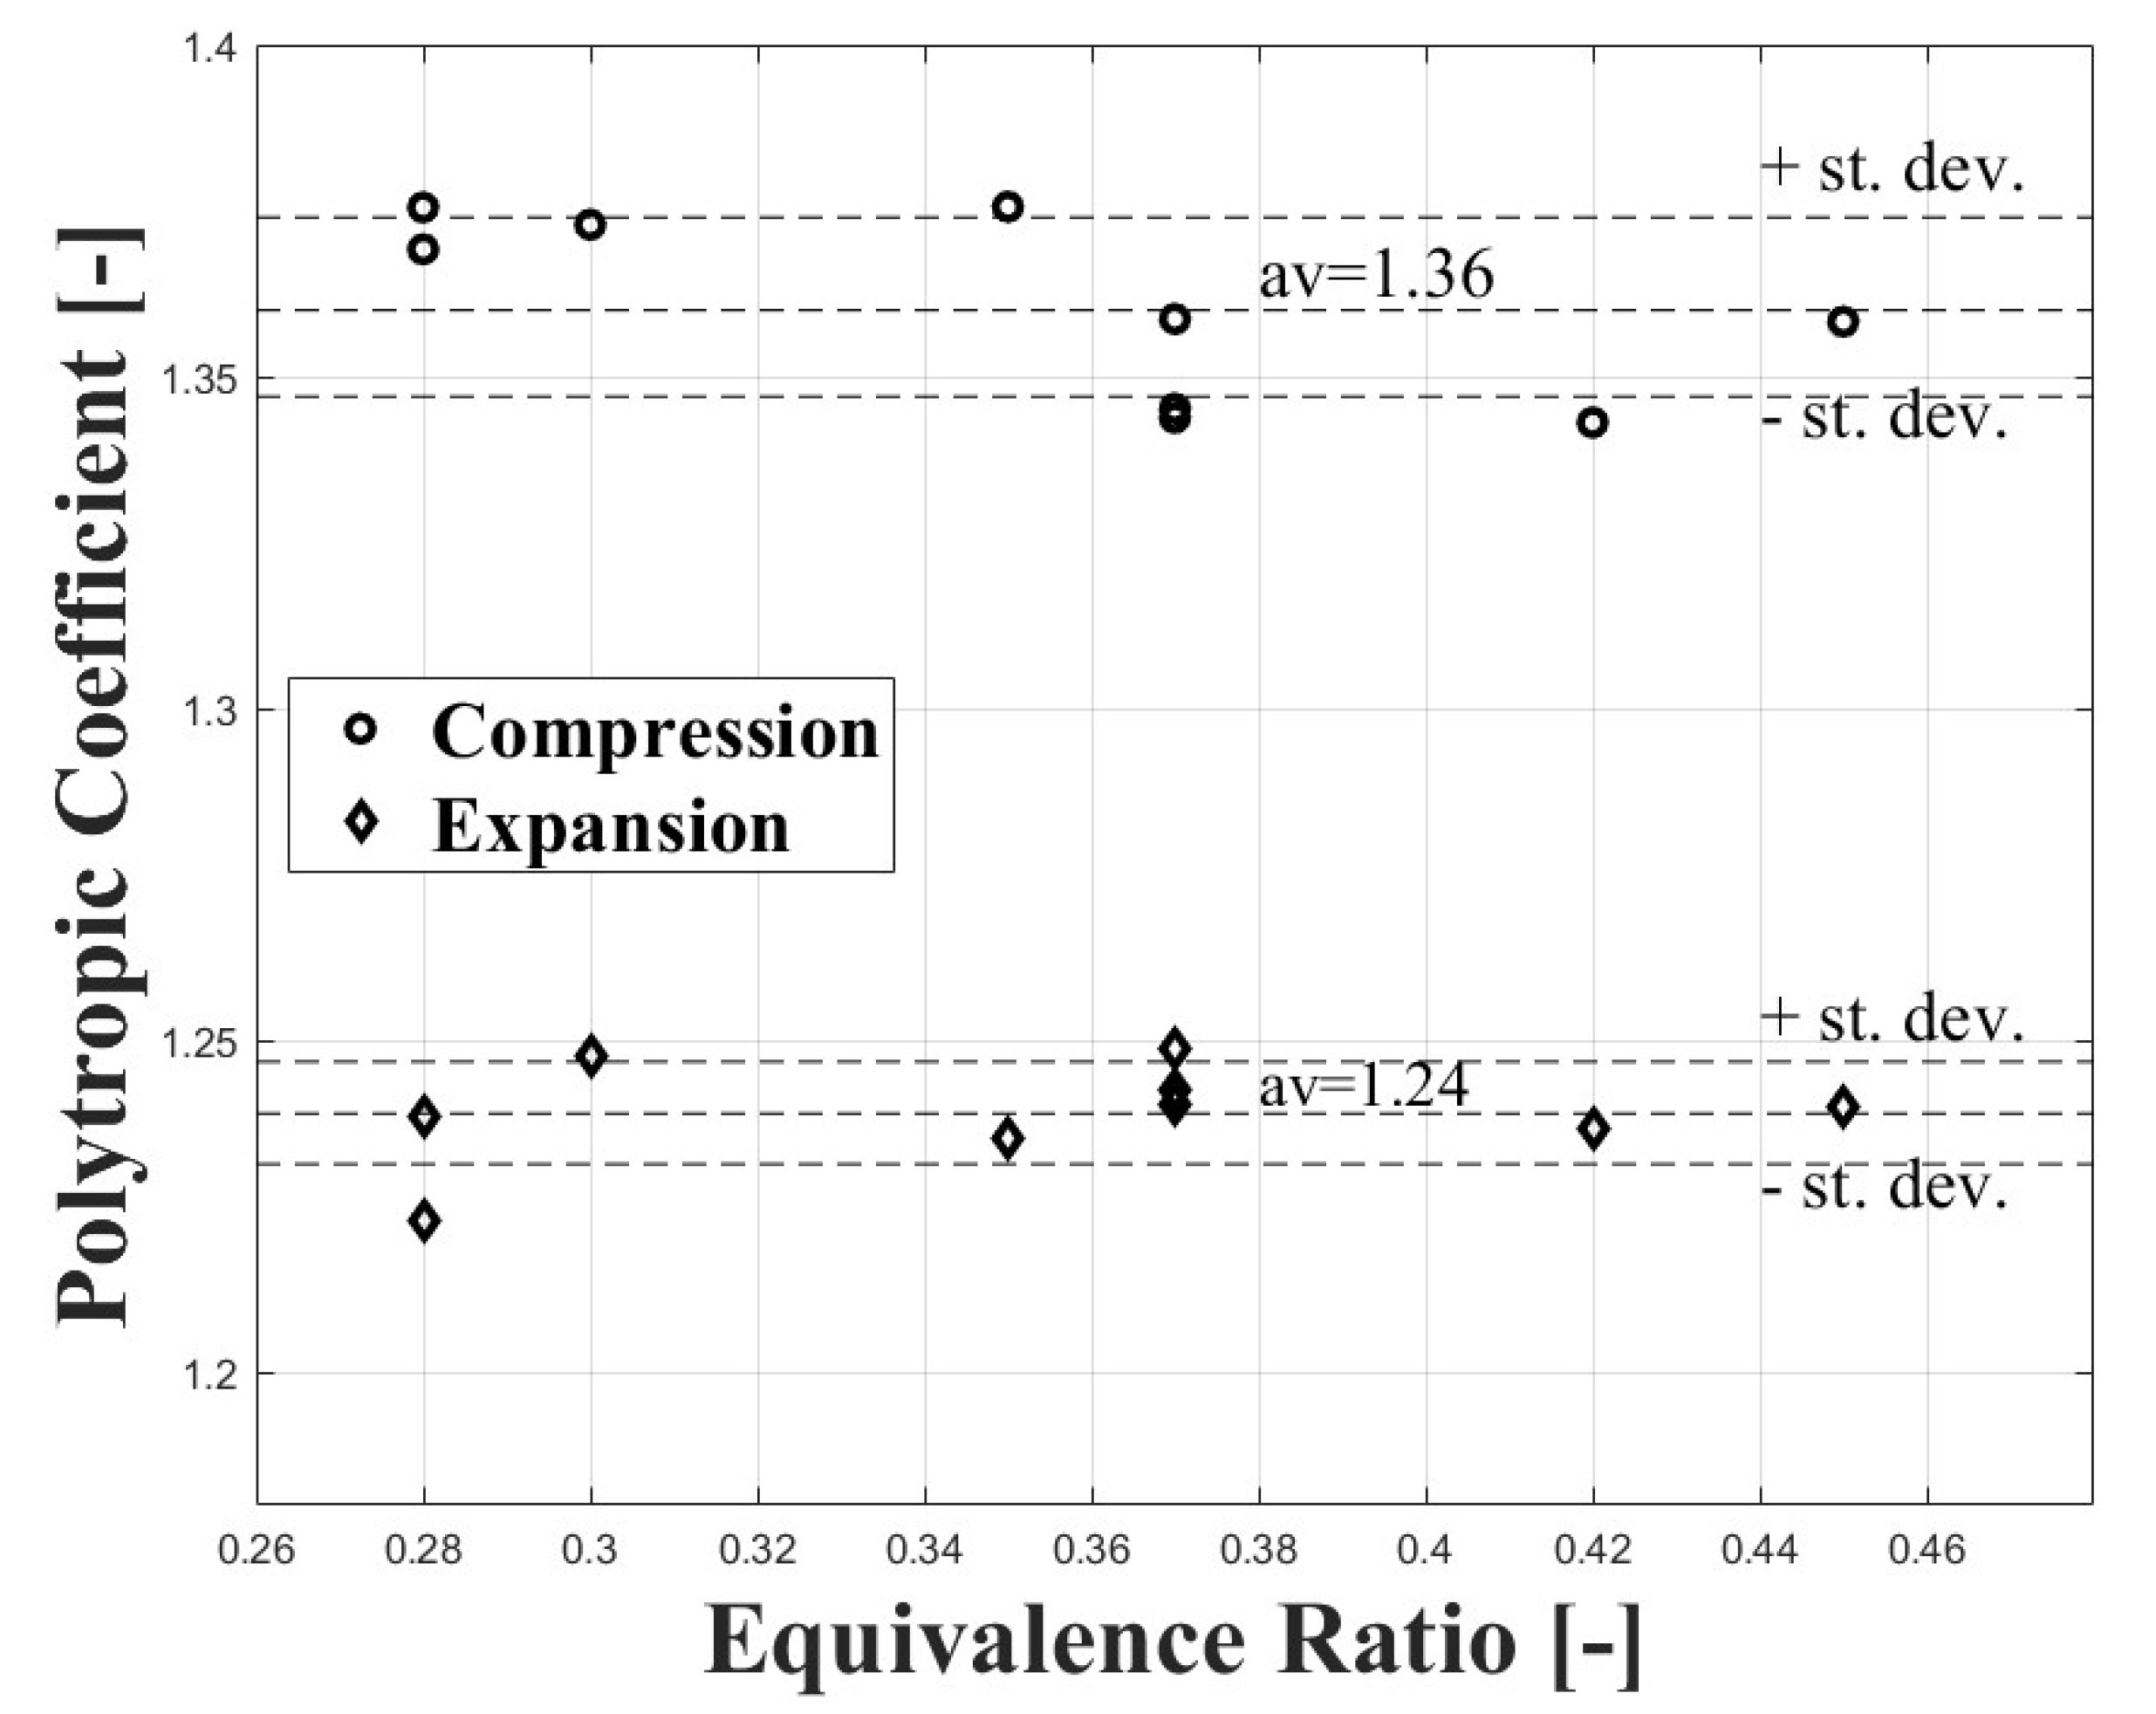
The compression polytropic coefficient was calculated between 90 and 80 CAD bTDC, while the expansion polytropic coefficient was calculated between 60 and 90 CAD aTDC. Figure 2 shows the values obtained for both coefficients at different equivalence ratios. It can be observed that the polytropic coefficients show few variations with the equivalence ratio. For this reason, the compression, and expansion polytropic coefficients were assumed as constants.

Figure 2.
Compression and expansion polytropic coefficients at different equivalence ratio conditions for the engine used in the research.
After polytropic coefficient was calculated, the heat transferred between the in-cylinder gas and the wall was estimated as follows:
After calculating the gas–surroundings heat exchange, the wall temperature was estimated using Newton’s law of cooling:
where is the wall temperature and A is the heat transfer area.
Heat transfer coefficient was calculated as follows:
where the Nusselt number is calculated using Equation (10) (with the Reynolds number calculated using Woschni’s correlation for the average cylinder gas speed in Equation (3)), k is the thermal conductivity of the gas, and B is the bore cylinder. Due to the lean equivalence ratio, the thermal conductivity and dynamic viscosity of the charge are assumed to be equal to those of air.
3. Results and Discussions
3.1. Experimental Results
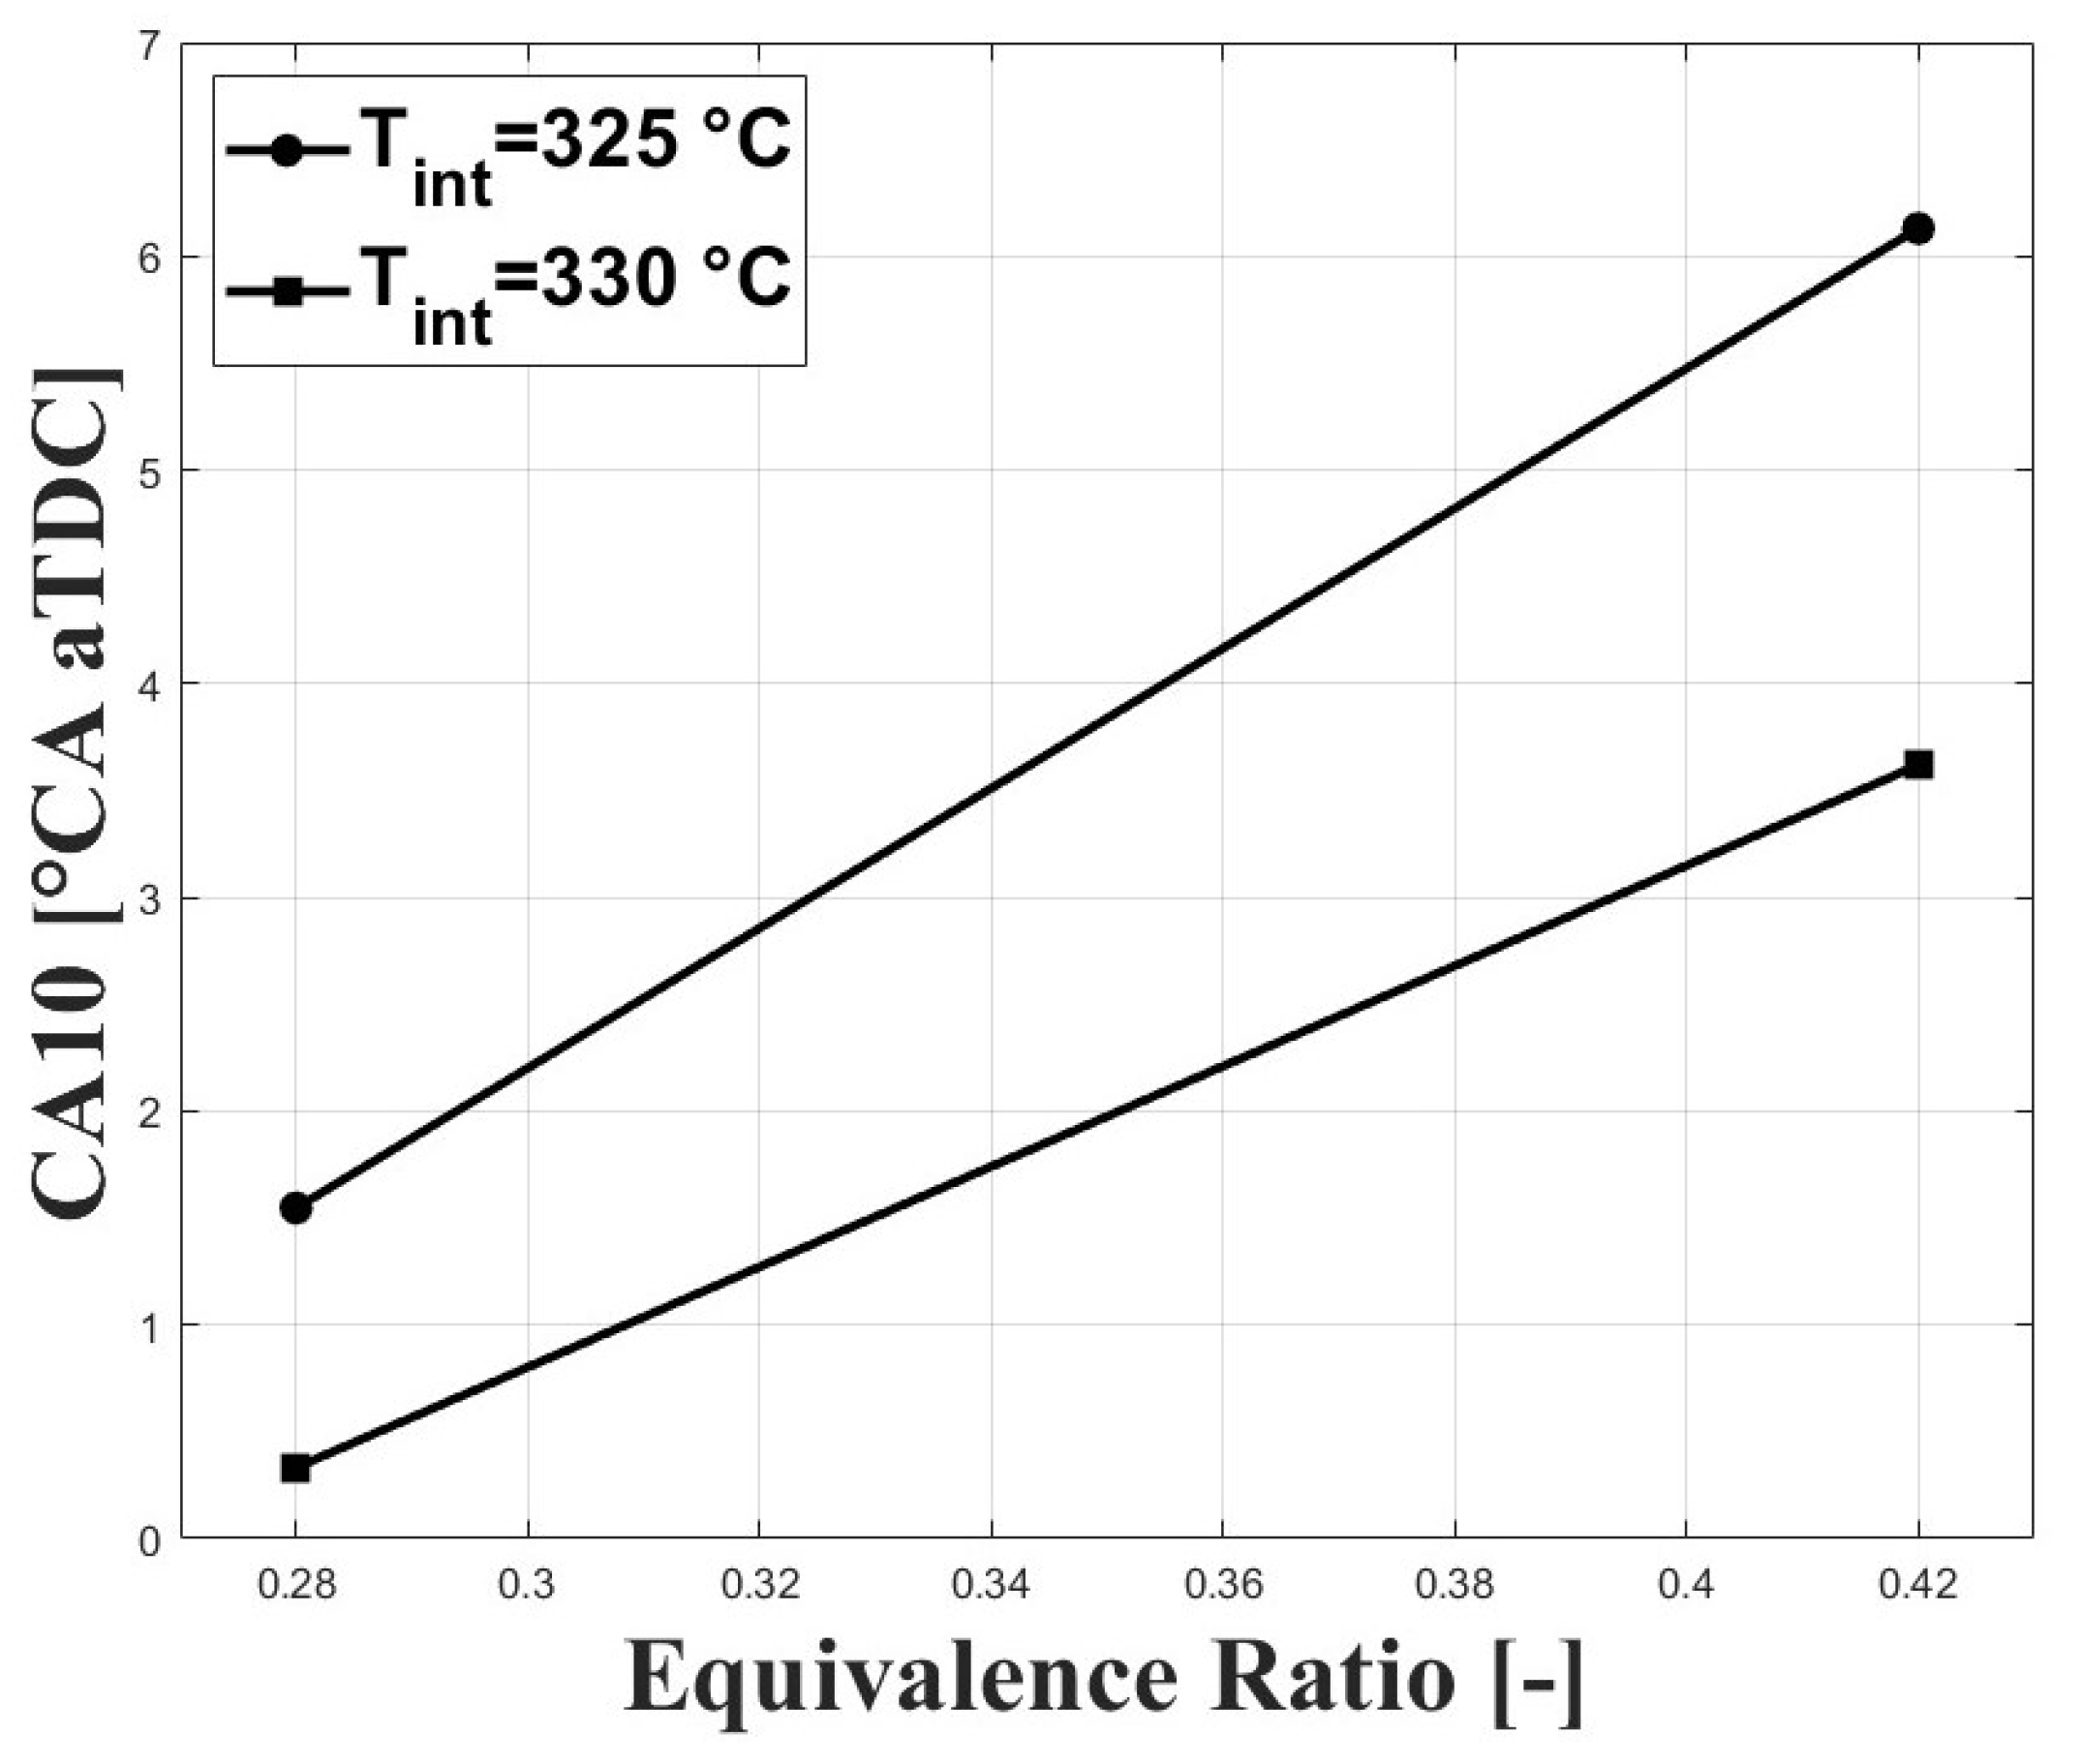
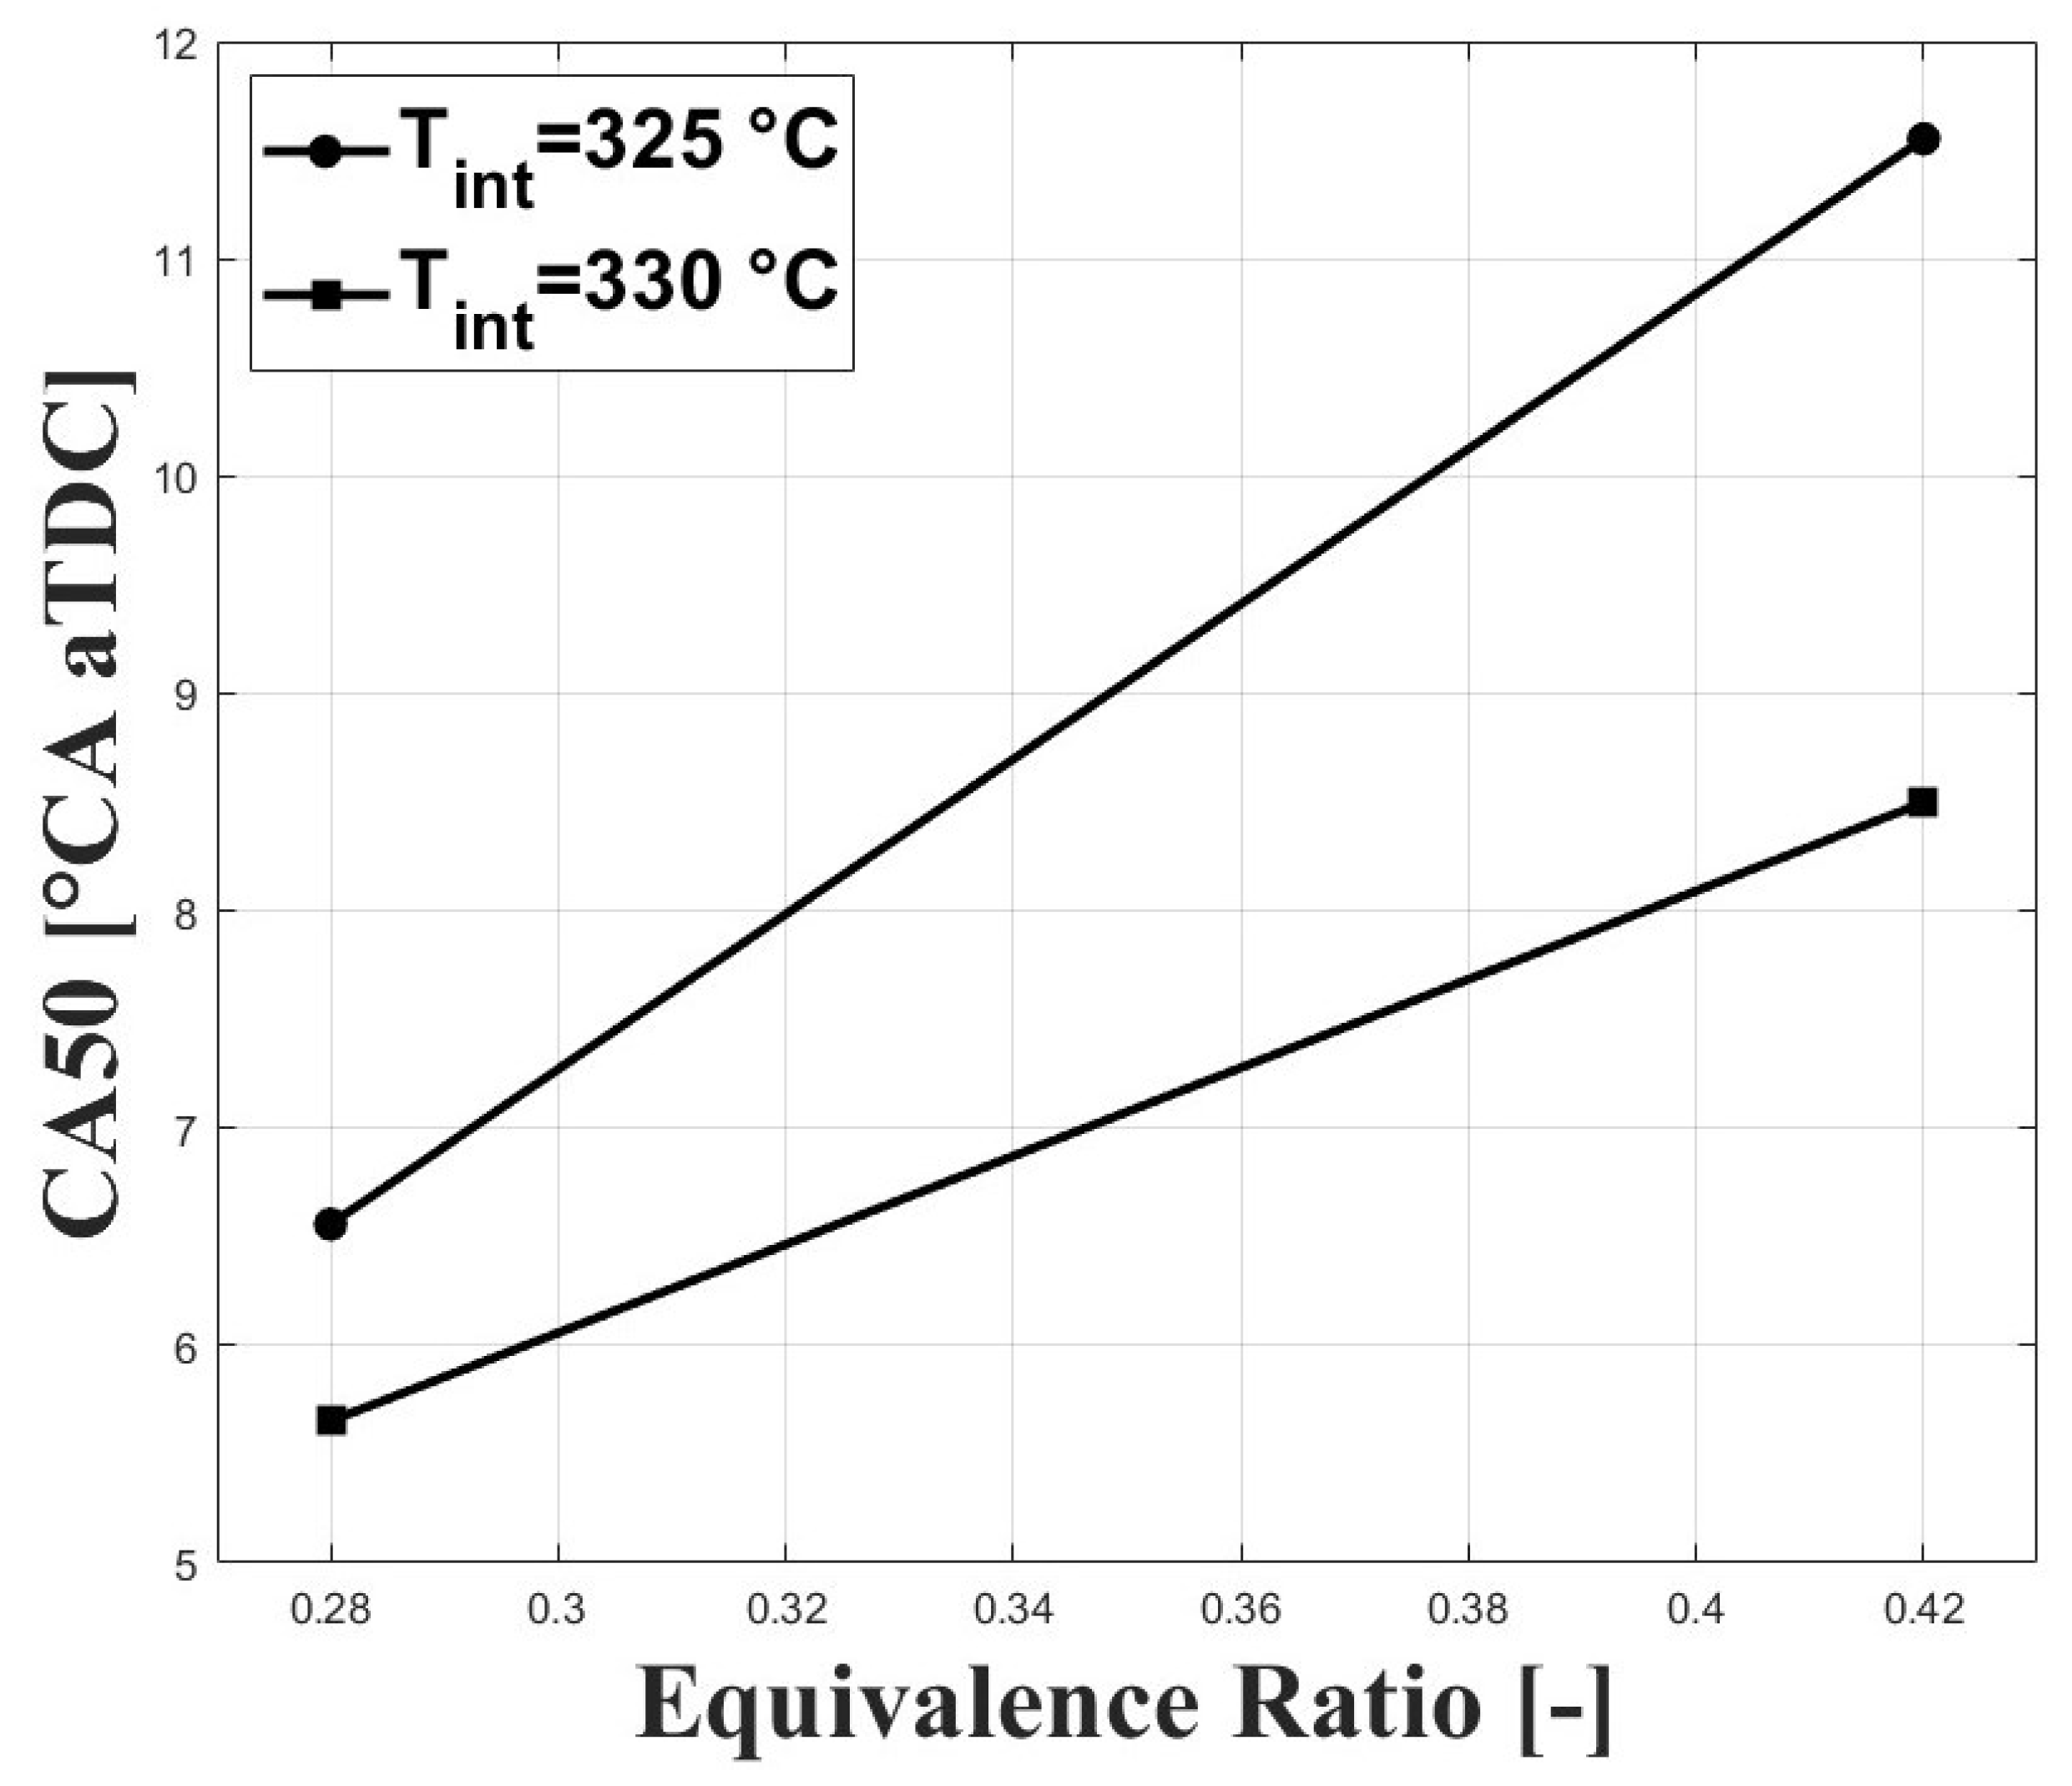
Figure 3 and Figure 4 show the respective CA10 and CA50 related to the evaluated equivalence ratios and intake charge temperatures required for stable combustion. An intake temperature of 325 C was necessary to allow for HCCI combustion at the tested conditions, and previous research performed by Bedoya et al. [7] showed that intake temperatures around 200 C allowed for stable HCCI combustion at sea level and with boosted inlet pressures close to 2 bar. For the same intake temperature, it can be seen that both CA10 and CA50 were delayed when the equivalence ratio was increased. This trend is associated with a higher concentration of CO in the intake mixture with higher equivalence ratios. However, the delayed combustion effect was reduced at higher intake temperature due to the higher in-cylinder temperature.
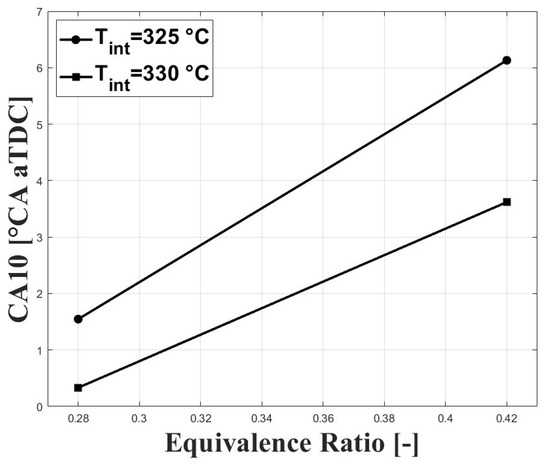
Figure 3.
Crank angle for cumulative heat release; P bar.

Figure 4.
Crank angle for cumulative heat release; P bar.
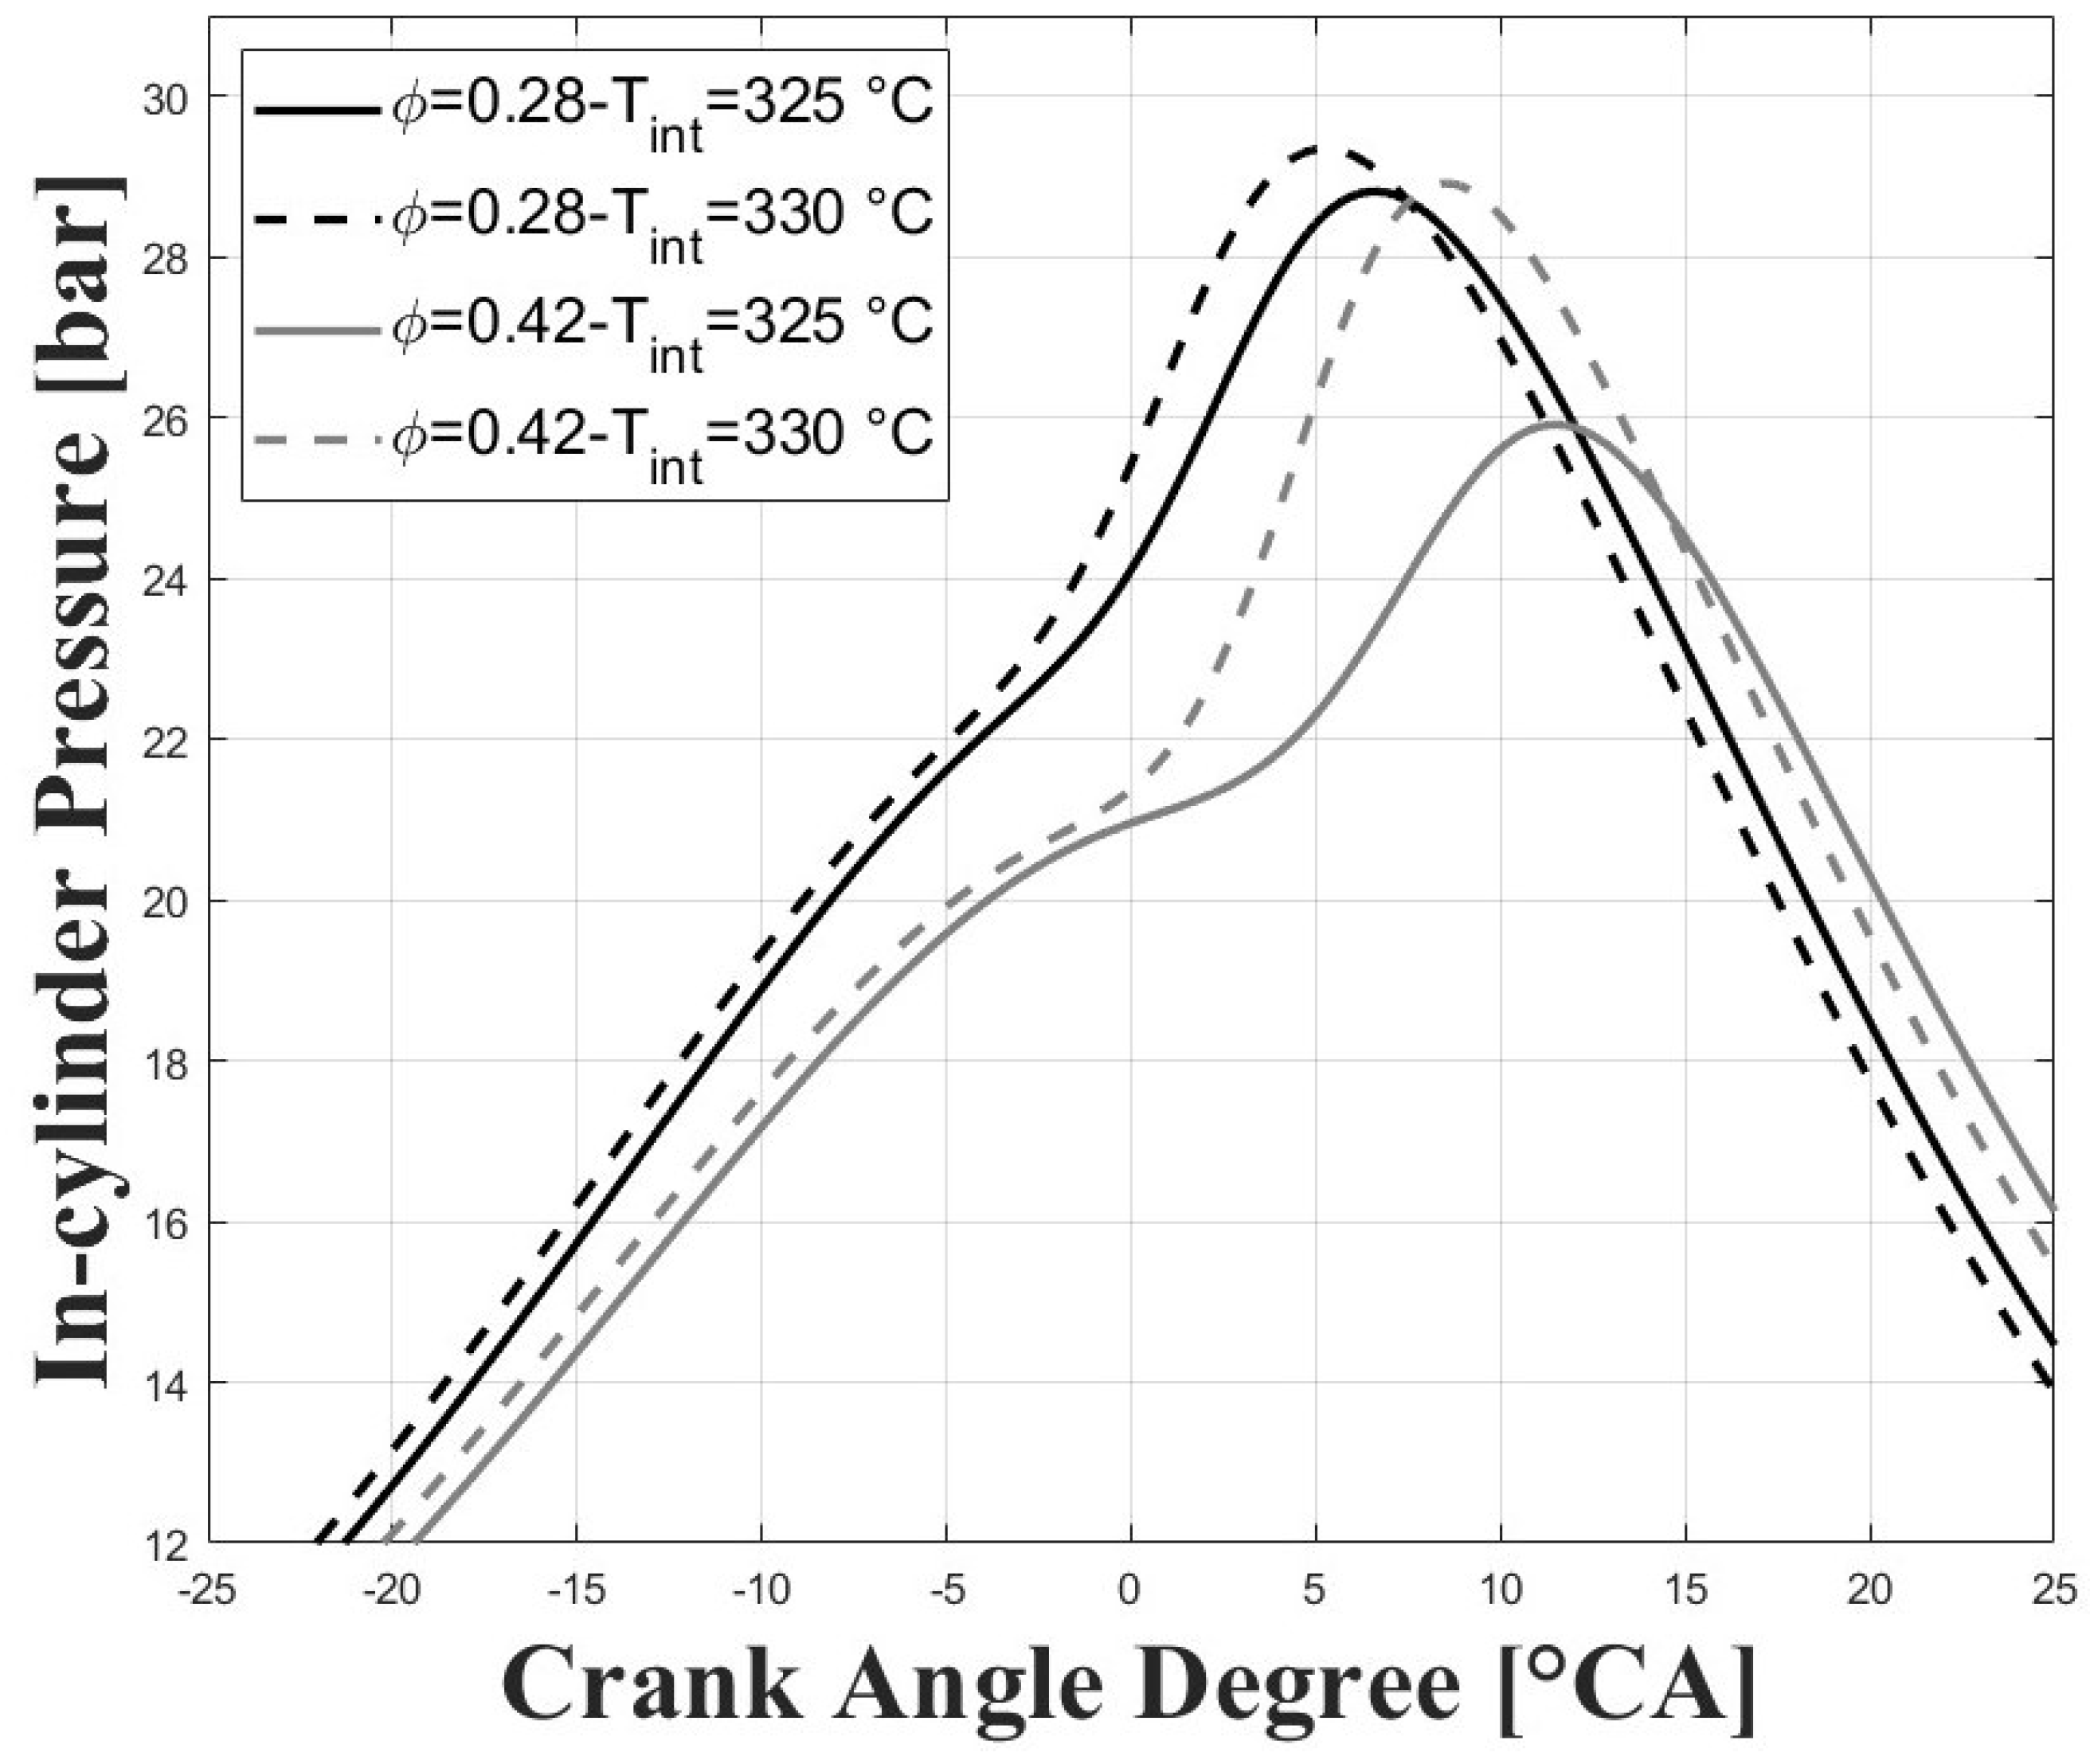
Figure 5 and Figure 6 show the respective in-cylinder pressure and gross heat release rates at the different intake temperatures and equivalence ratios evaluated. As expected, the pressure peak was increased, and was closer to TDC for higher intake temperatures, and this trend was more obvious for the higher tested equivalence ratios. Similar trends were observed for the peaks of the gross heat release rates. The maximum pressure reached for the conditions evaluated in this research were well below the maximum pressure reached in previous research for similar compression ratios [7,8,9] due to the lower intake pressure and for the higher required intake temperatures, which together lead to greatly reduced power output.
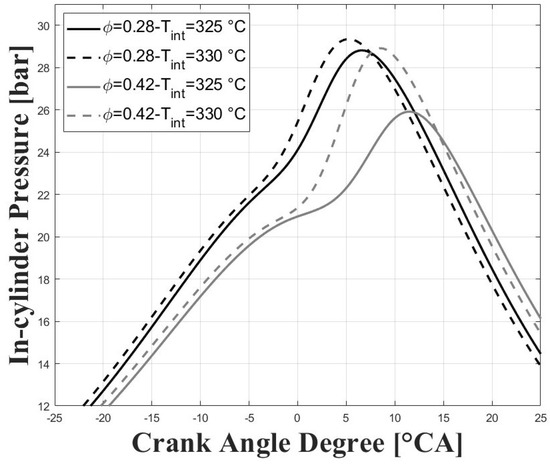
Figure 5.
In-cylinder pressure; P bar.
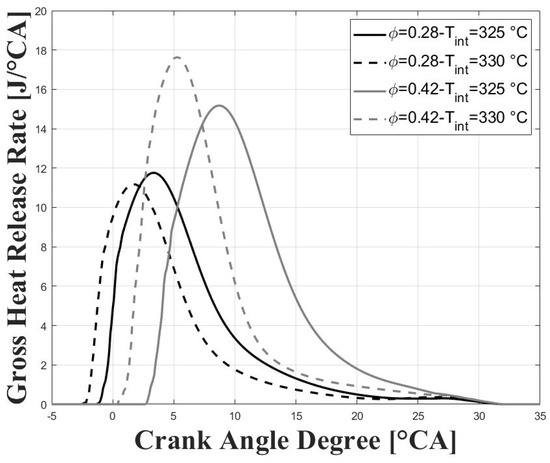
Figure 6.
Gross heat release rates; P bar.
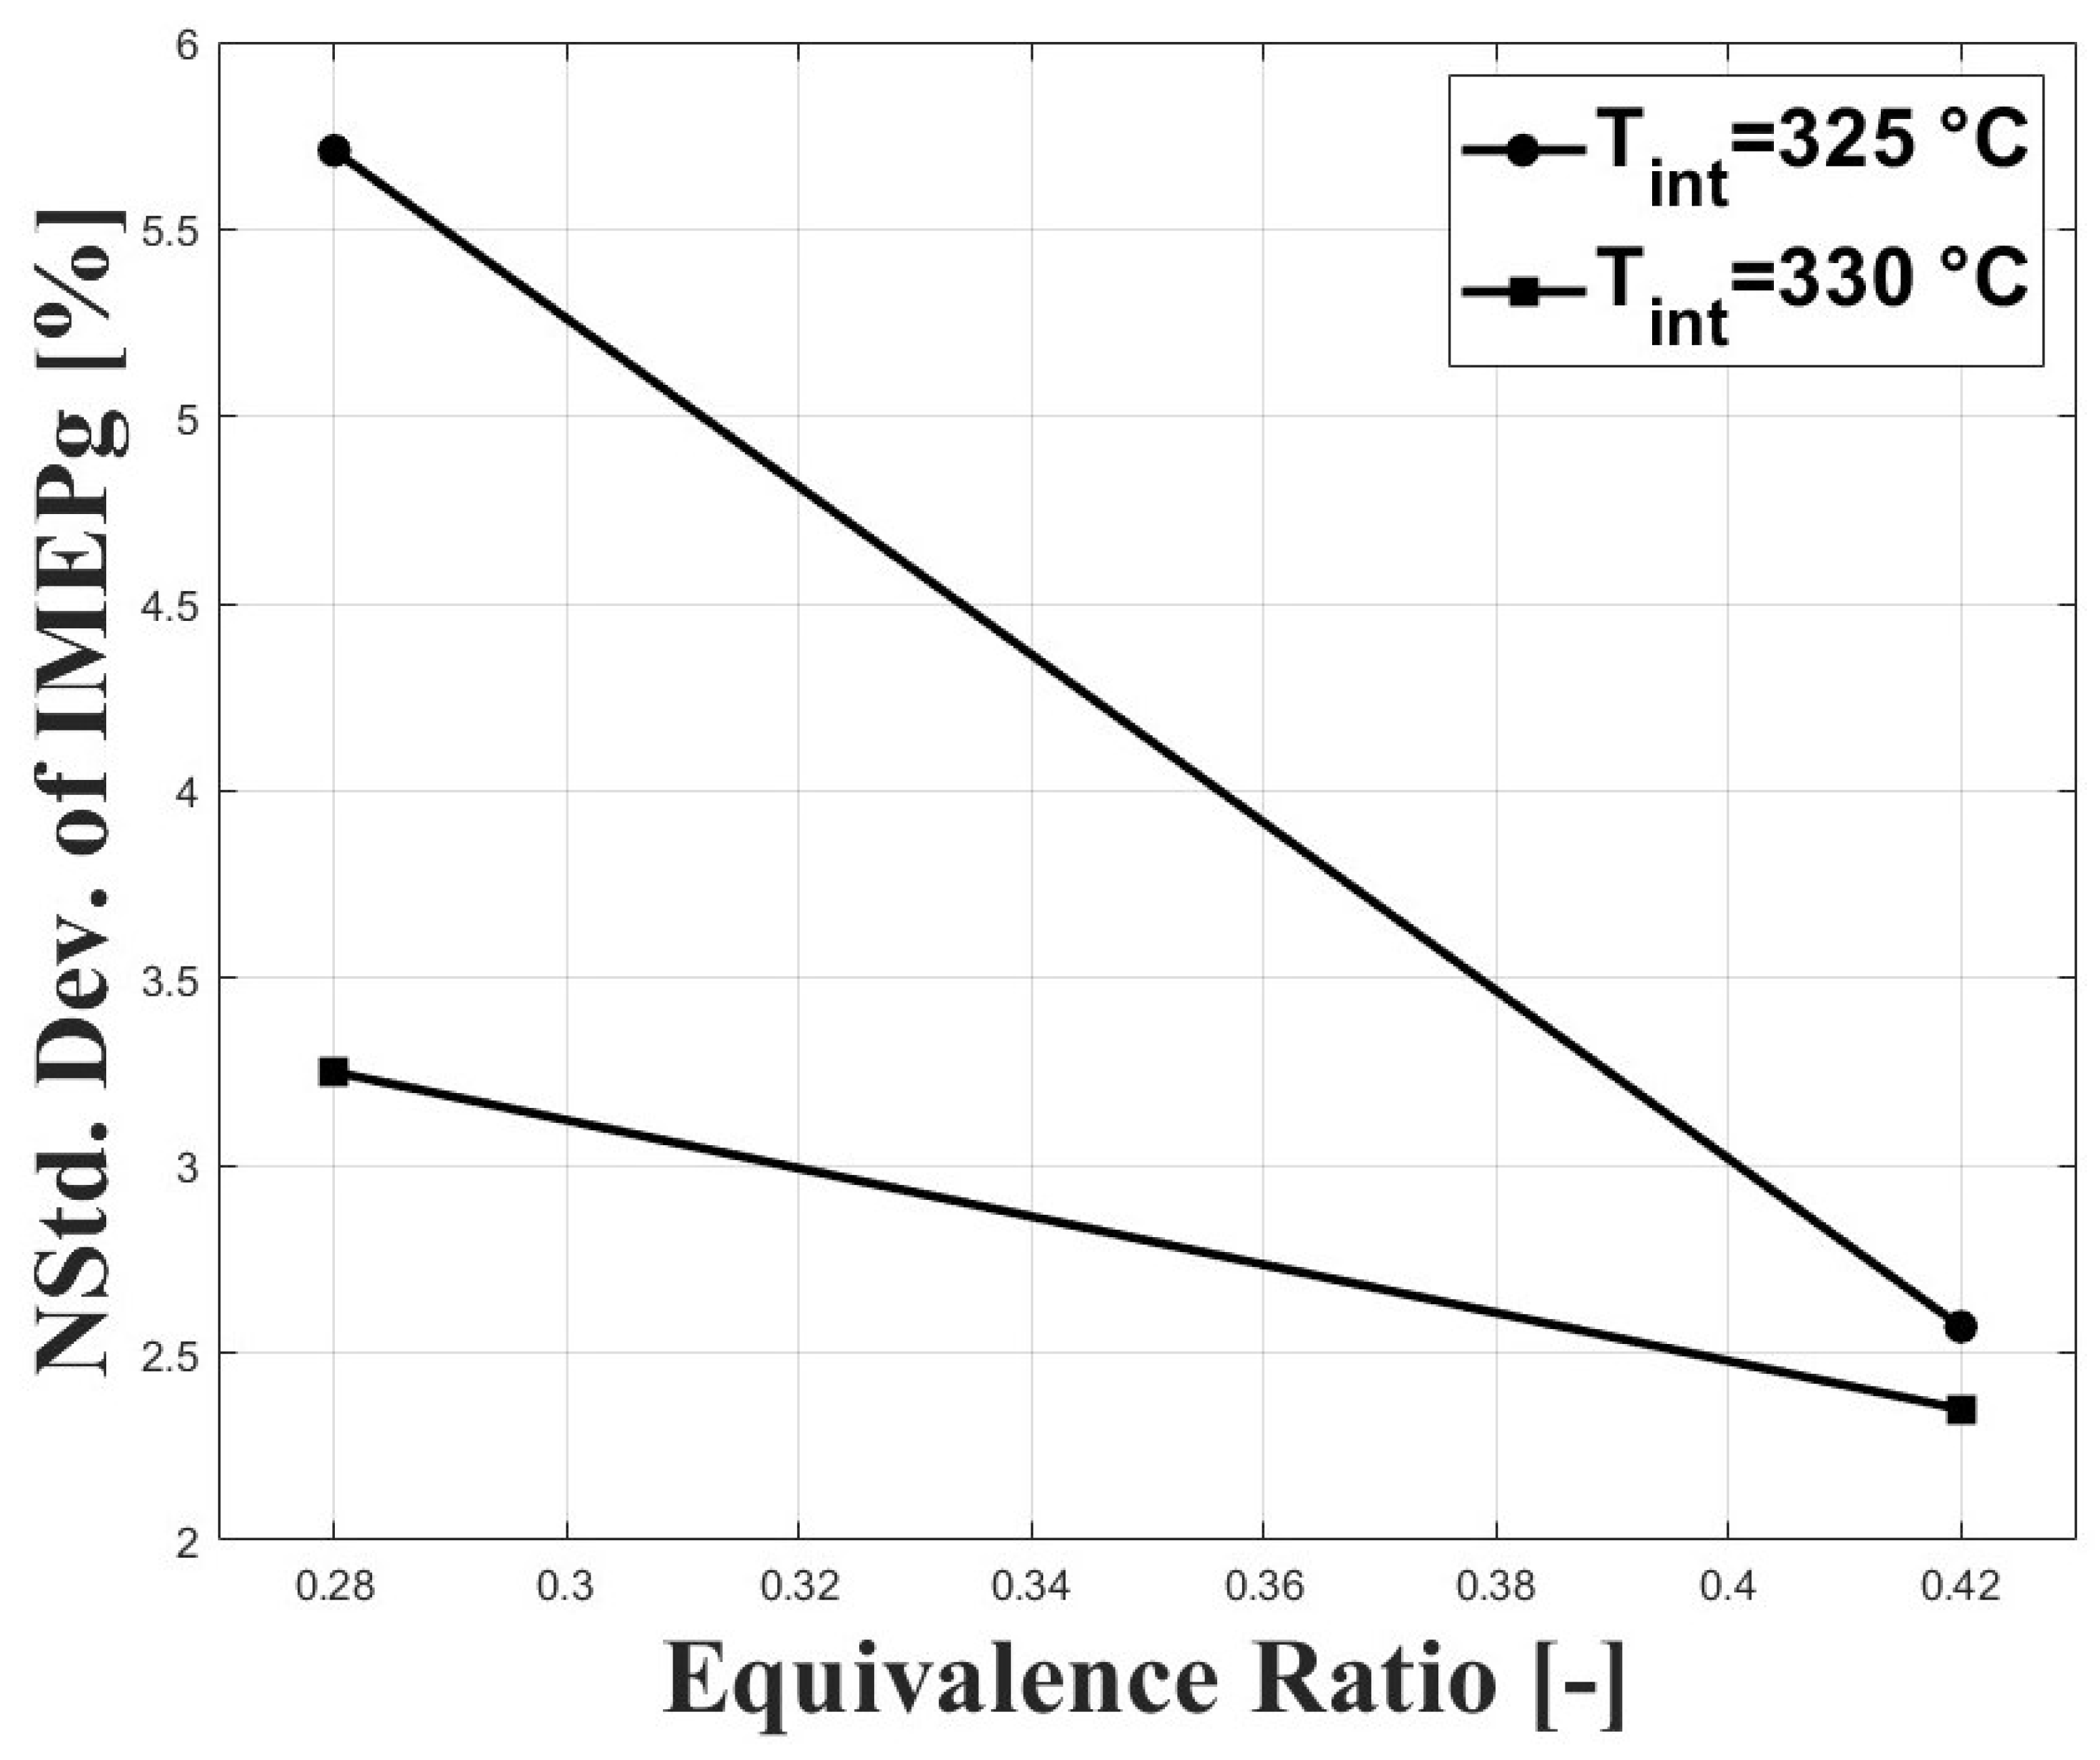
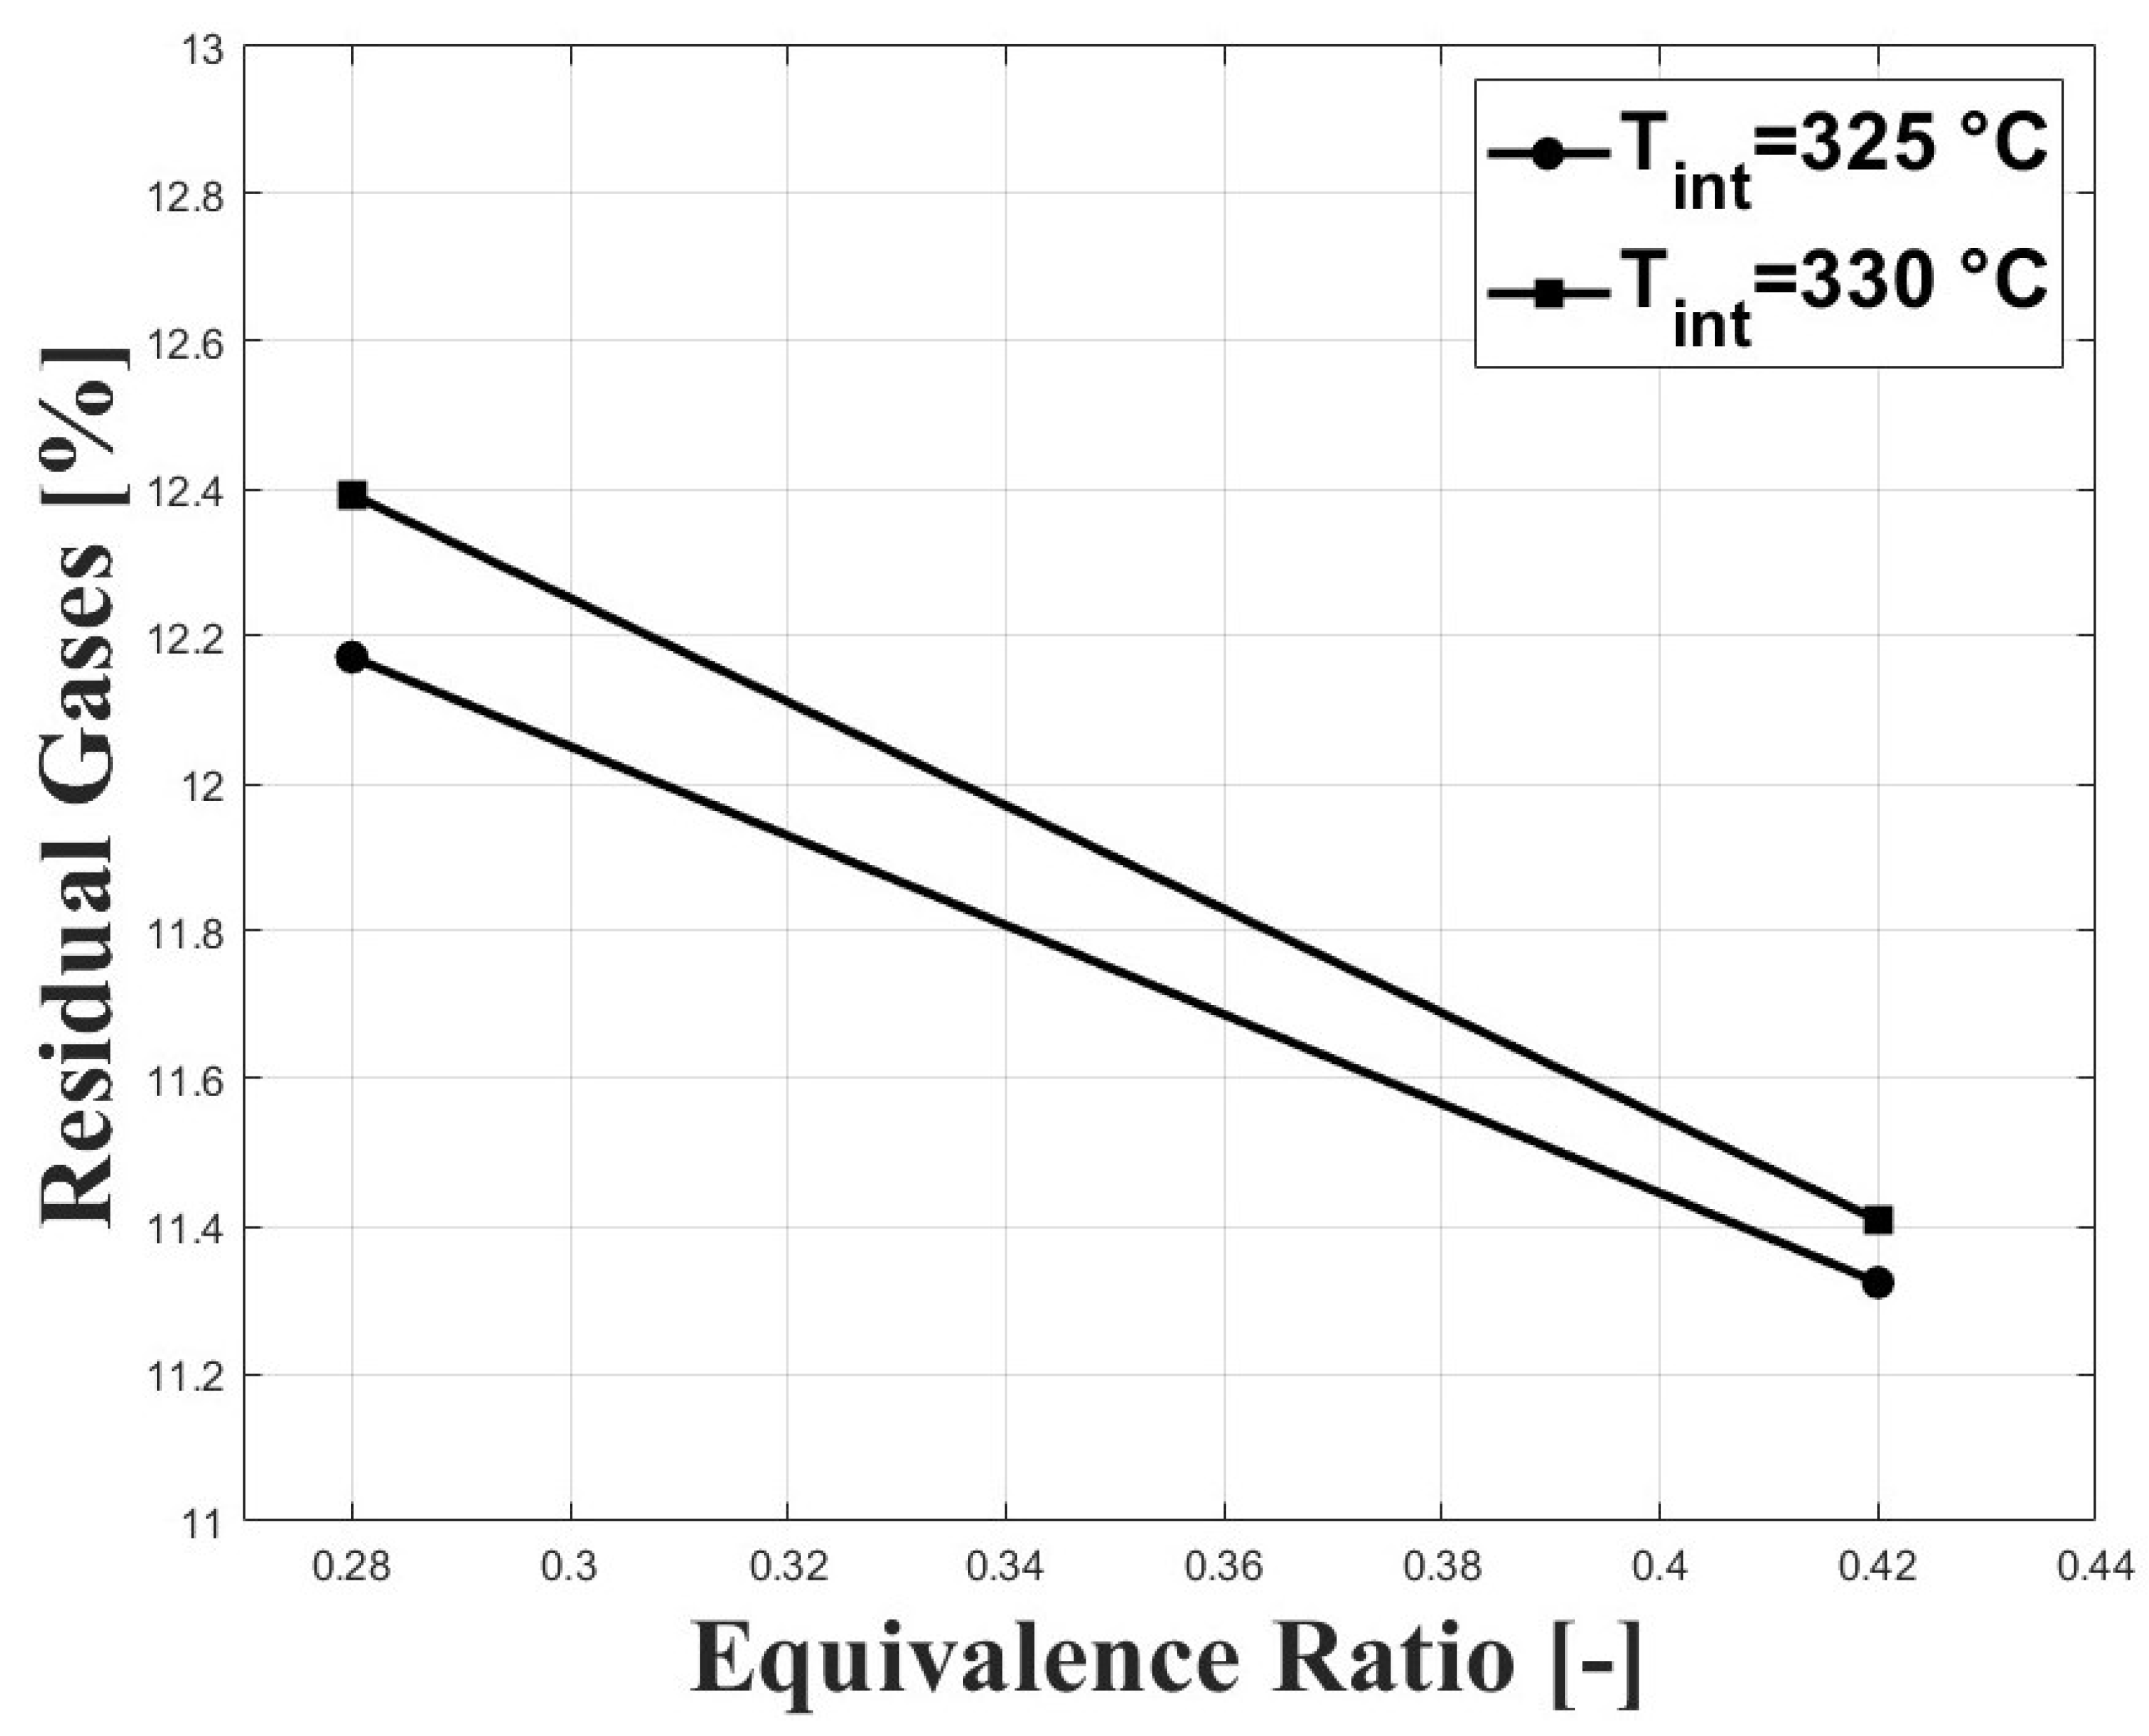
Figure 7 shows the normalized standard deviation of IMEPg and Figure 8 shows the percentage of residual gases, with both figures related by the equivalence ratio. When the equivalence ratio was increased, combustion was delayed due to higher concentration of CO in the charge (see Figure 3 and Figure 4). However, cycle-to-cycle variations were significantly reduced, as can be seen in Figure 7. It can be observed that at an equivalence ratio of the engine operated with higher combustion instability, especially at the intake temperature of 325 C. This trend is explained by the higher percentage of residual gases presented at lower equivalence ratios, as can be seen in Figure 8. Higher charge dilution leads to increased cyclic variability for heat release rates and in-cylinder pressure traces [9]. In Figure 8, it can be observed that the estimated residual gases inside the cylinder from the previous cycle are greater that the expected values for compression ignition engines [14], which is explained by the high crank angle interval at which the intake and exhaust valves remain open in the exhaust and intake strokes (see IVC and EVO in Table 1). The greater values of residual gases for the equivalence ratio of compared with the ratio of explain the lowered pressure peak when the intake temperature increases (see Figure 5).

Figure 7.
Coefficient of variation of IMEPn; P bar.
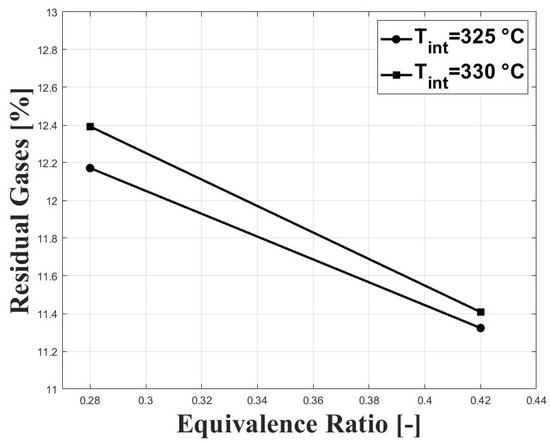
Figure 8.
Percentage of estimated residual gases inside the cylinder; P bar.
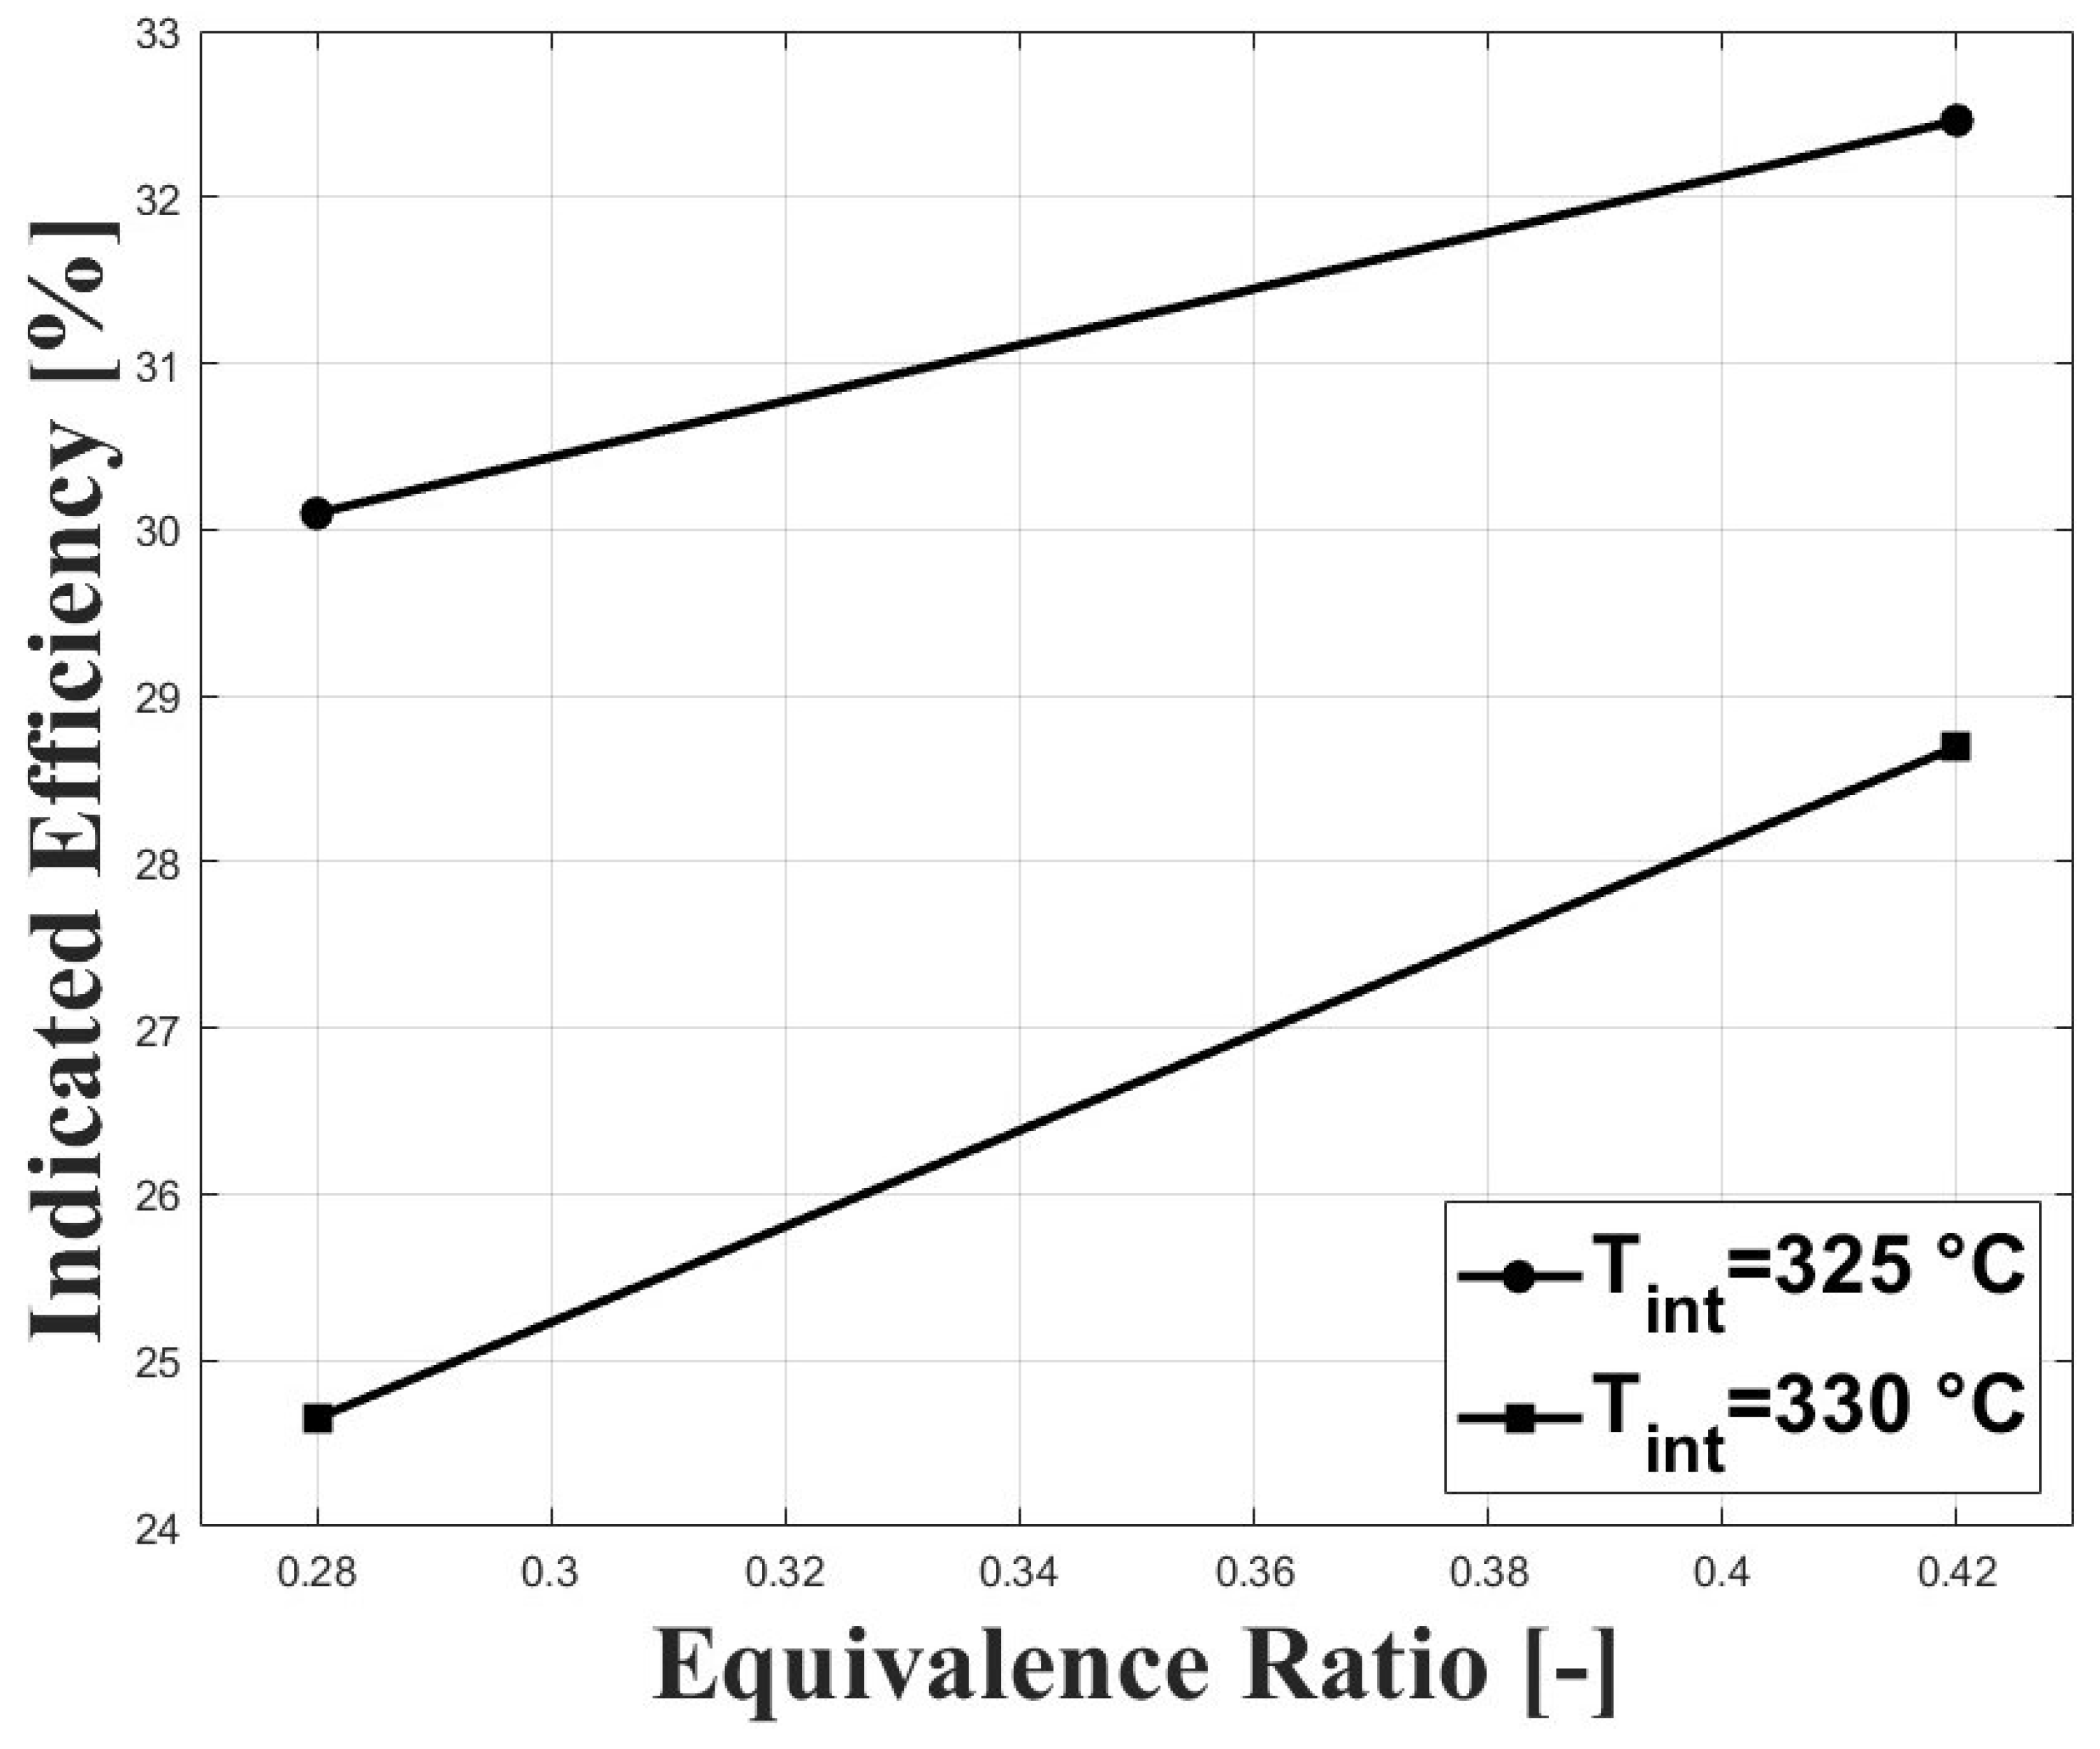
The high intake temperature requirement to operate an HCCI engine fueled with biogas at sub-atmospheric conditions has a strong effect on power output because of the reduced volumetric efficiency at these conditions. Figure 9 and Figure 10 show the IMEPn and indicated efficiency, respectively, under the tested conditions. The highest IMEpn was around bar for an equivalence ratio of and intake temperature of 325 C. Previous research performed on biogas-fueled HCCI engines at sea level by Bedoya et al. [7] reported an IMEPg of about 5 bar for boosted intake pressure close to 2 bar. As expected, higher intake temperatures led to reduced IMEPn because of the reduced charge density. The higher net indicated efficiencies were around for this study, and were lower compared with the aforementioned research on biogas HCCI combustion [7], in which gross indicated efficiencies close to were reported.
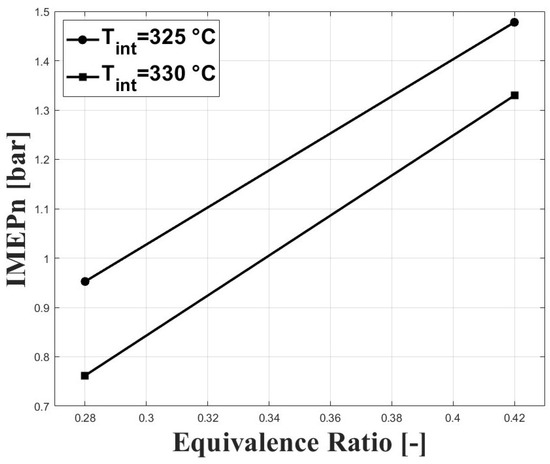
Figure 9.
IMEPn at different conditions of equivalence ratio and intake temperature; P bar.

Figure 10.
Indicated efficiency at different conditions of equivalence ratio and intake temperature; P bar.
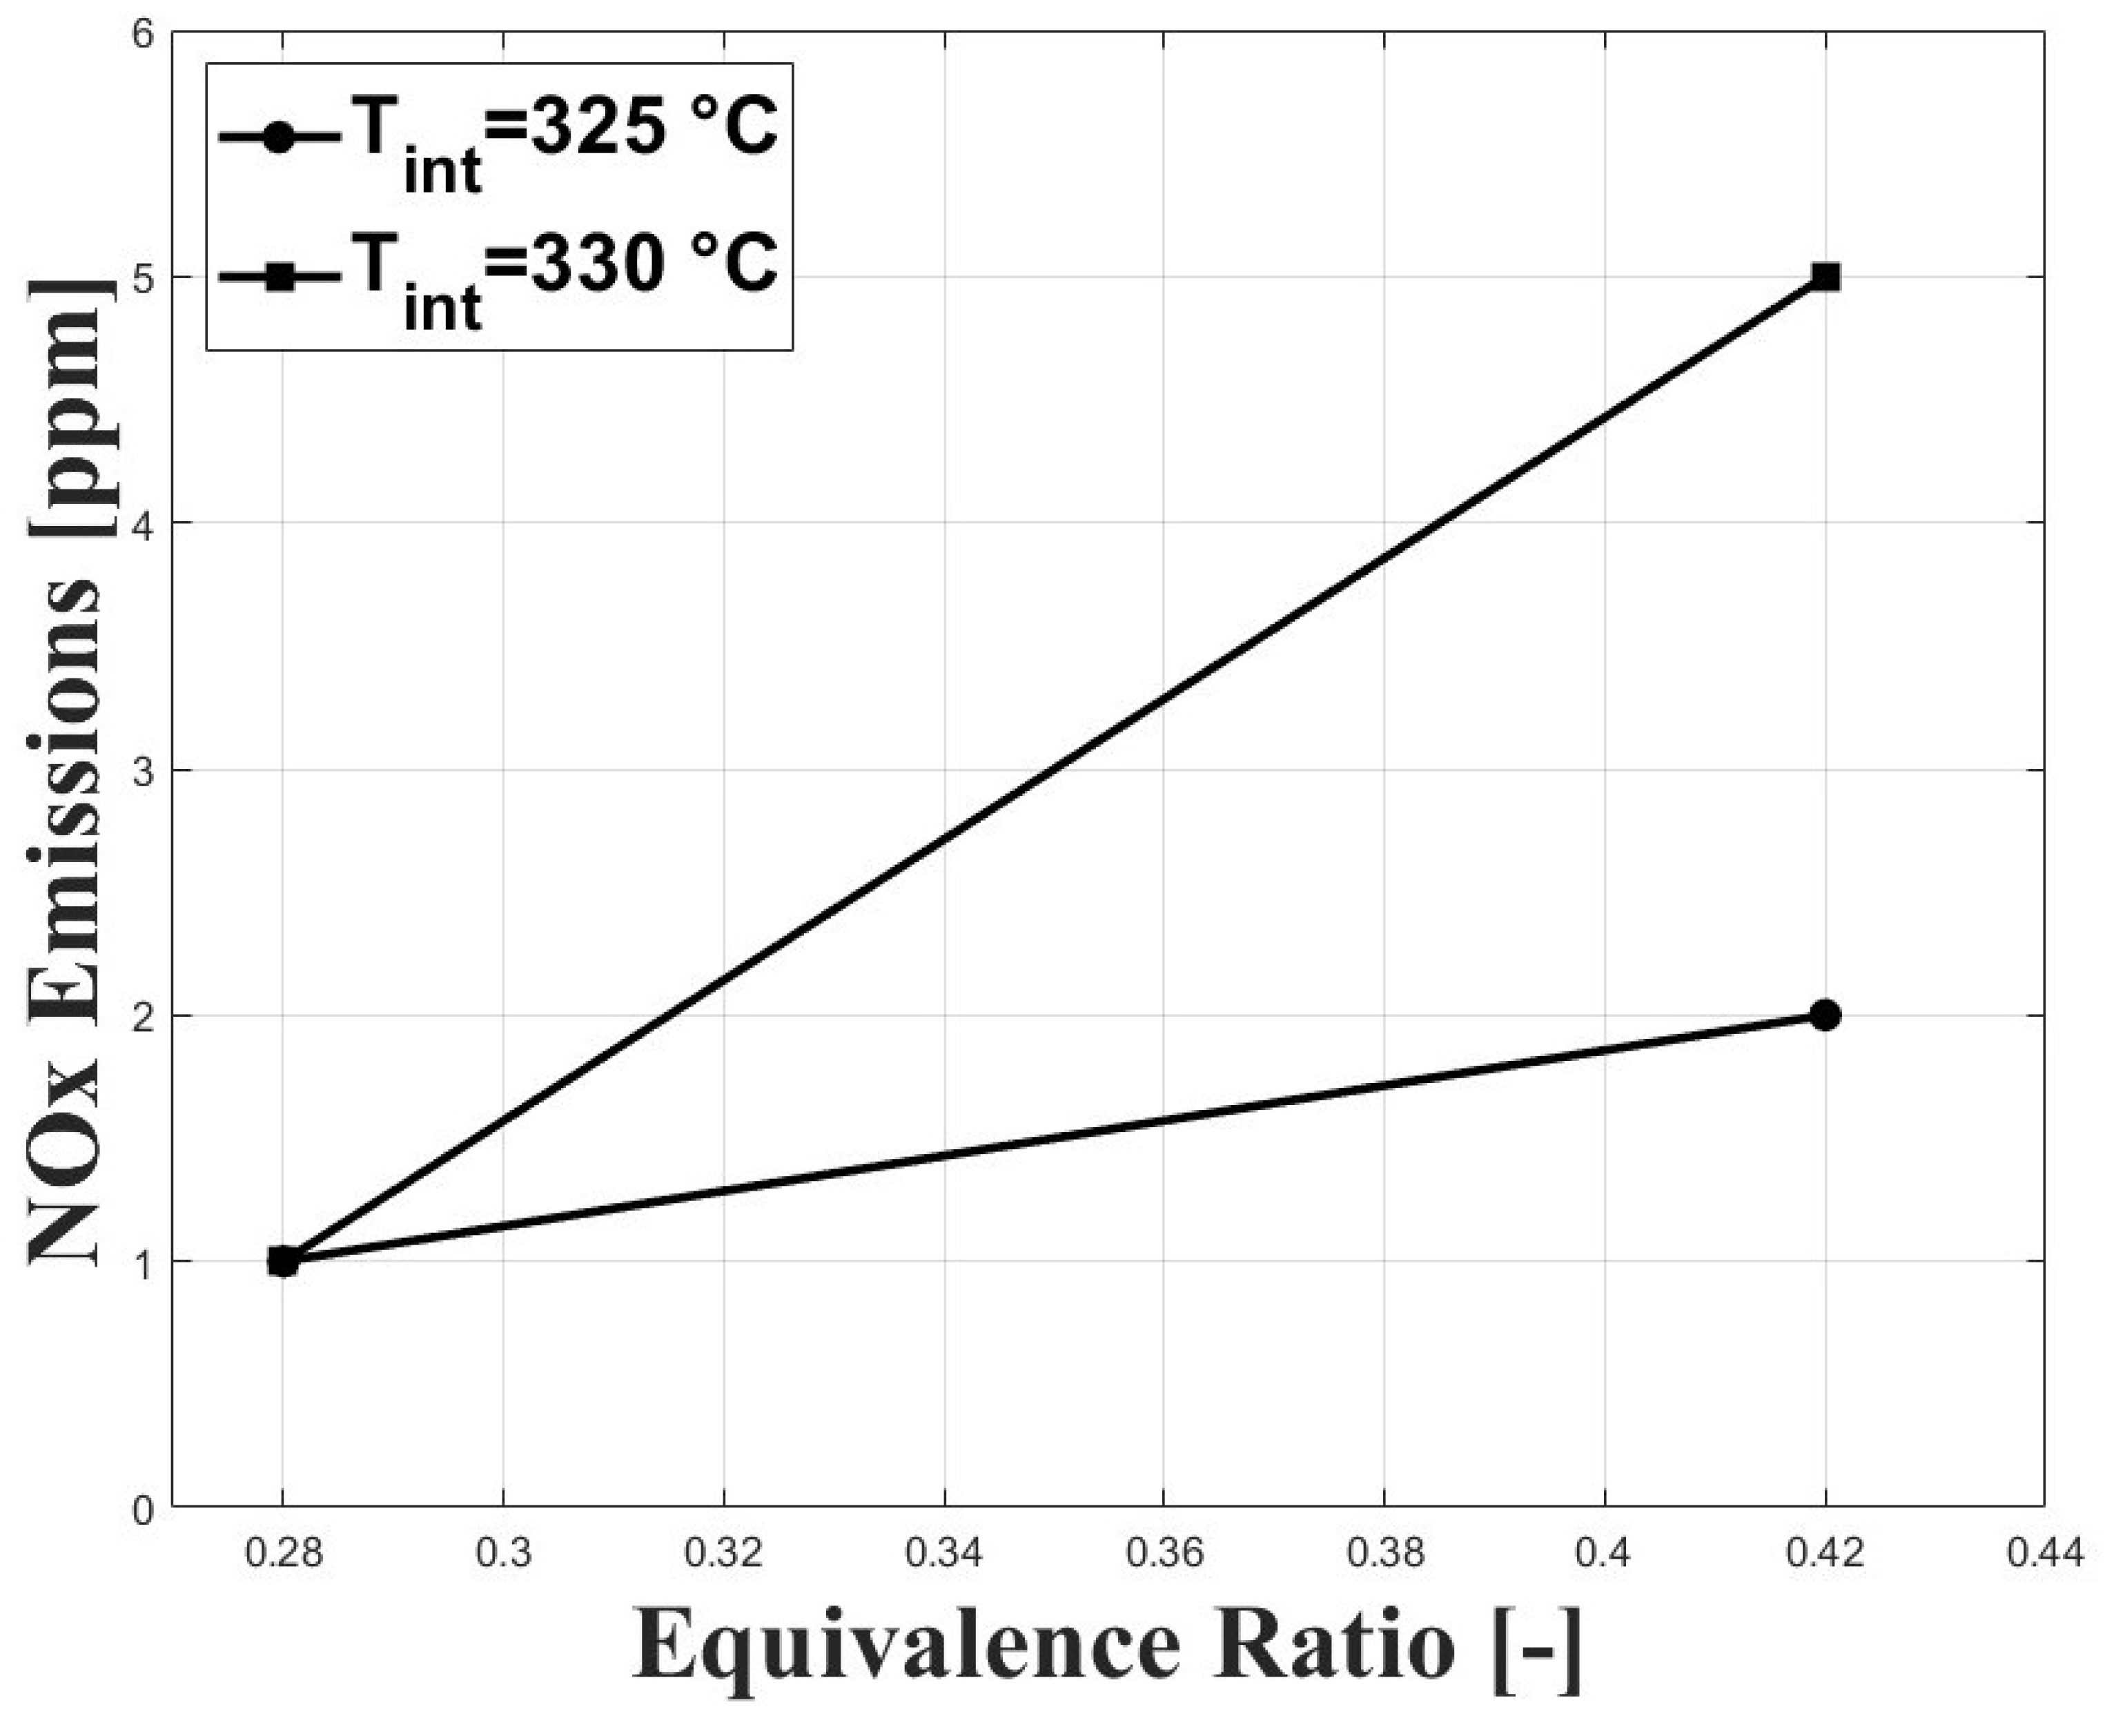
Figure 11 shows the NOx emissions in relation to the evaluated conditions. As expected, NOx emissions were increased with higher equivalence ratios; however, the concentrations remained ultra-low, which is a feature of HCCI combustion. Similar results on NOx emissions were reported in previous research by Bedoya et al. [7].

Figure 11.
Emissions of NOx at different conditions of equivalence ratio and intake temperature; P bar.
3.2. Numerical Results
The analysed experimental results have shown that operating an HCCI engine fueled with biogas at sub-atmospheric conditions leads to lowered IMEP and indicated efficiencies as compared with previous research performed at sea level. For this reason, the effect of increasing intake pressure and intake ozone addition on intake temperature requirements was evaluated using a single-zone model with detailed chemical kinetics.
To ensure that the numerical results had adequate physical correspondence with the experimental results expected when the same strategies were applied, a set of simulations was run using the single-zone approach.
As mentioned above, the combustion timing was defined as the crank angle for the peak molar fraction of HO. The experimental IVC conditions were used to run simulations under the single-zone approach. The charge composition was defined according to the estimated experimental equivalence ratios and residual gas fractions (RGF). Figure 12 and Figure 13 show the simulated and experimental ignition timings. The results are shown for the GRI and San Diego mechanisms (both the original mechanism and the version including the ozone kinetics submechanism from Halter et al. [22]). In Figure 12, it can be seen that the GRI mechanism shows better agreement with experimental data for the condition when combustion is delayed. However, when combustion is highly delayed the model predicts ignition timings closer to TDC. This could be associated with the effects of turbulence and charge stratification for ignition timings greater than 2 CAD aTDC, which are not completely accounted for in the simplified single-zone model. On the other hand, the two San Diego mechanisms show lower agreement with the experimental data for delayed conditions, and better agreement for ignition timings near the TDC compared to GRI . In Figure 13, it can be observed that inclusion of the ozone submechanism has a slight effect on the simulated results, showing slight combustion advancement. Thus, it can be assumed that any effect on combustion advancement when ozone is added to the charge and the ozone submechanism is used is strictly related to the kinetic effect of this species.
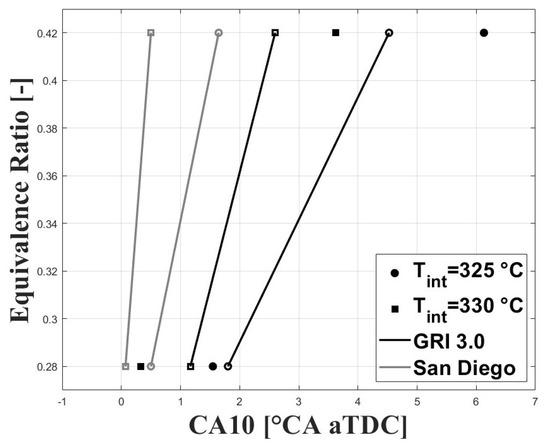
Figure 12.
Simulated and experimental ignition timing using original mechanisms. P bar.
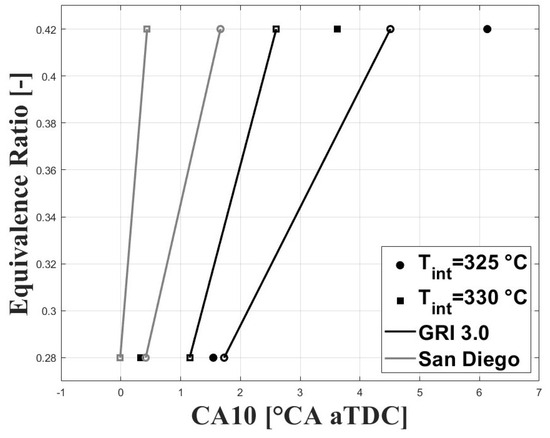
Figure 13.
Simulated and experimental ignition timing using mechanisms with ozone kinetic sub.mechanism; P bar.
The results presented in Figure 12 and Figure 13 show that the single-zone approach can be used to estimate the IVC conditions that lead to safe ignition timings (i.e., without high cycle-to-cycle variations or excessive ringing intensity) even under delayed combustion conditions. However, for ignition timings greater than 2 CAD aTDC the effect of turbulence and charge stratification on this process become significant, and the results are no longer suitable.
3.3. Effect of Boosted Intake Pressure on Intake Temperature
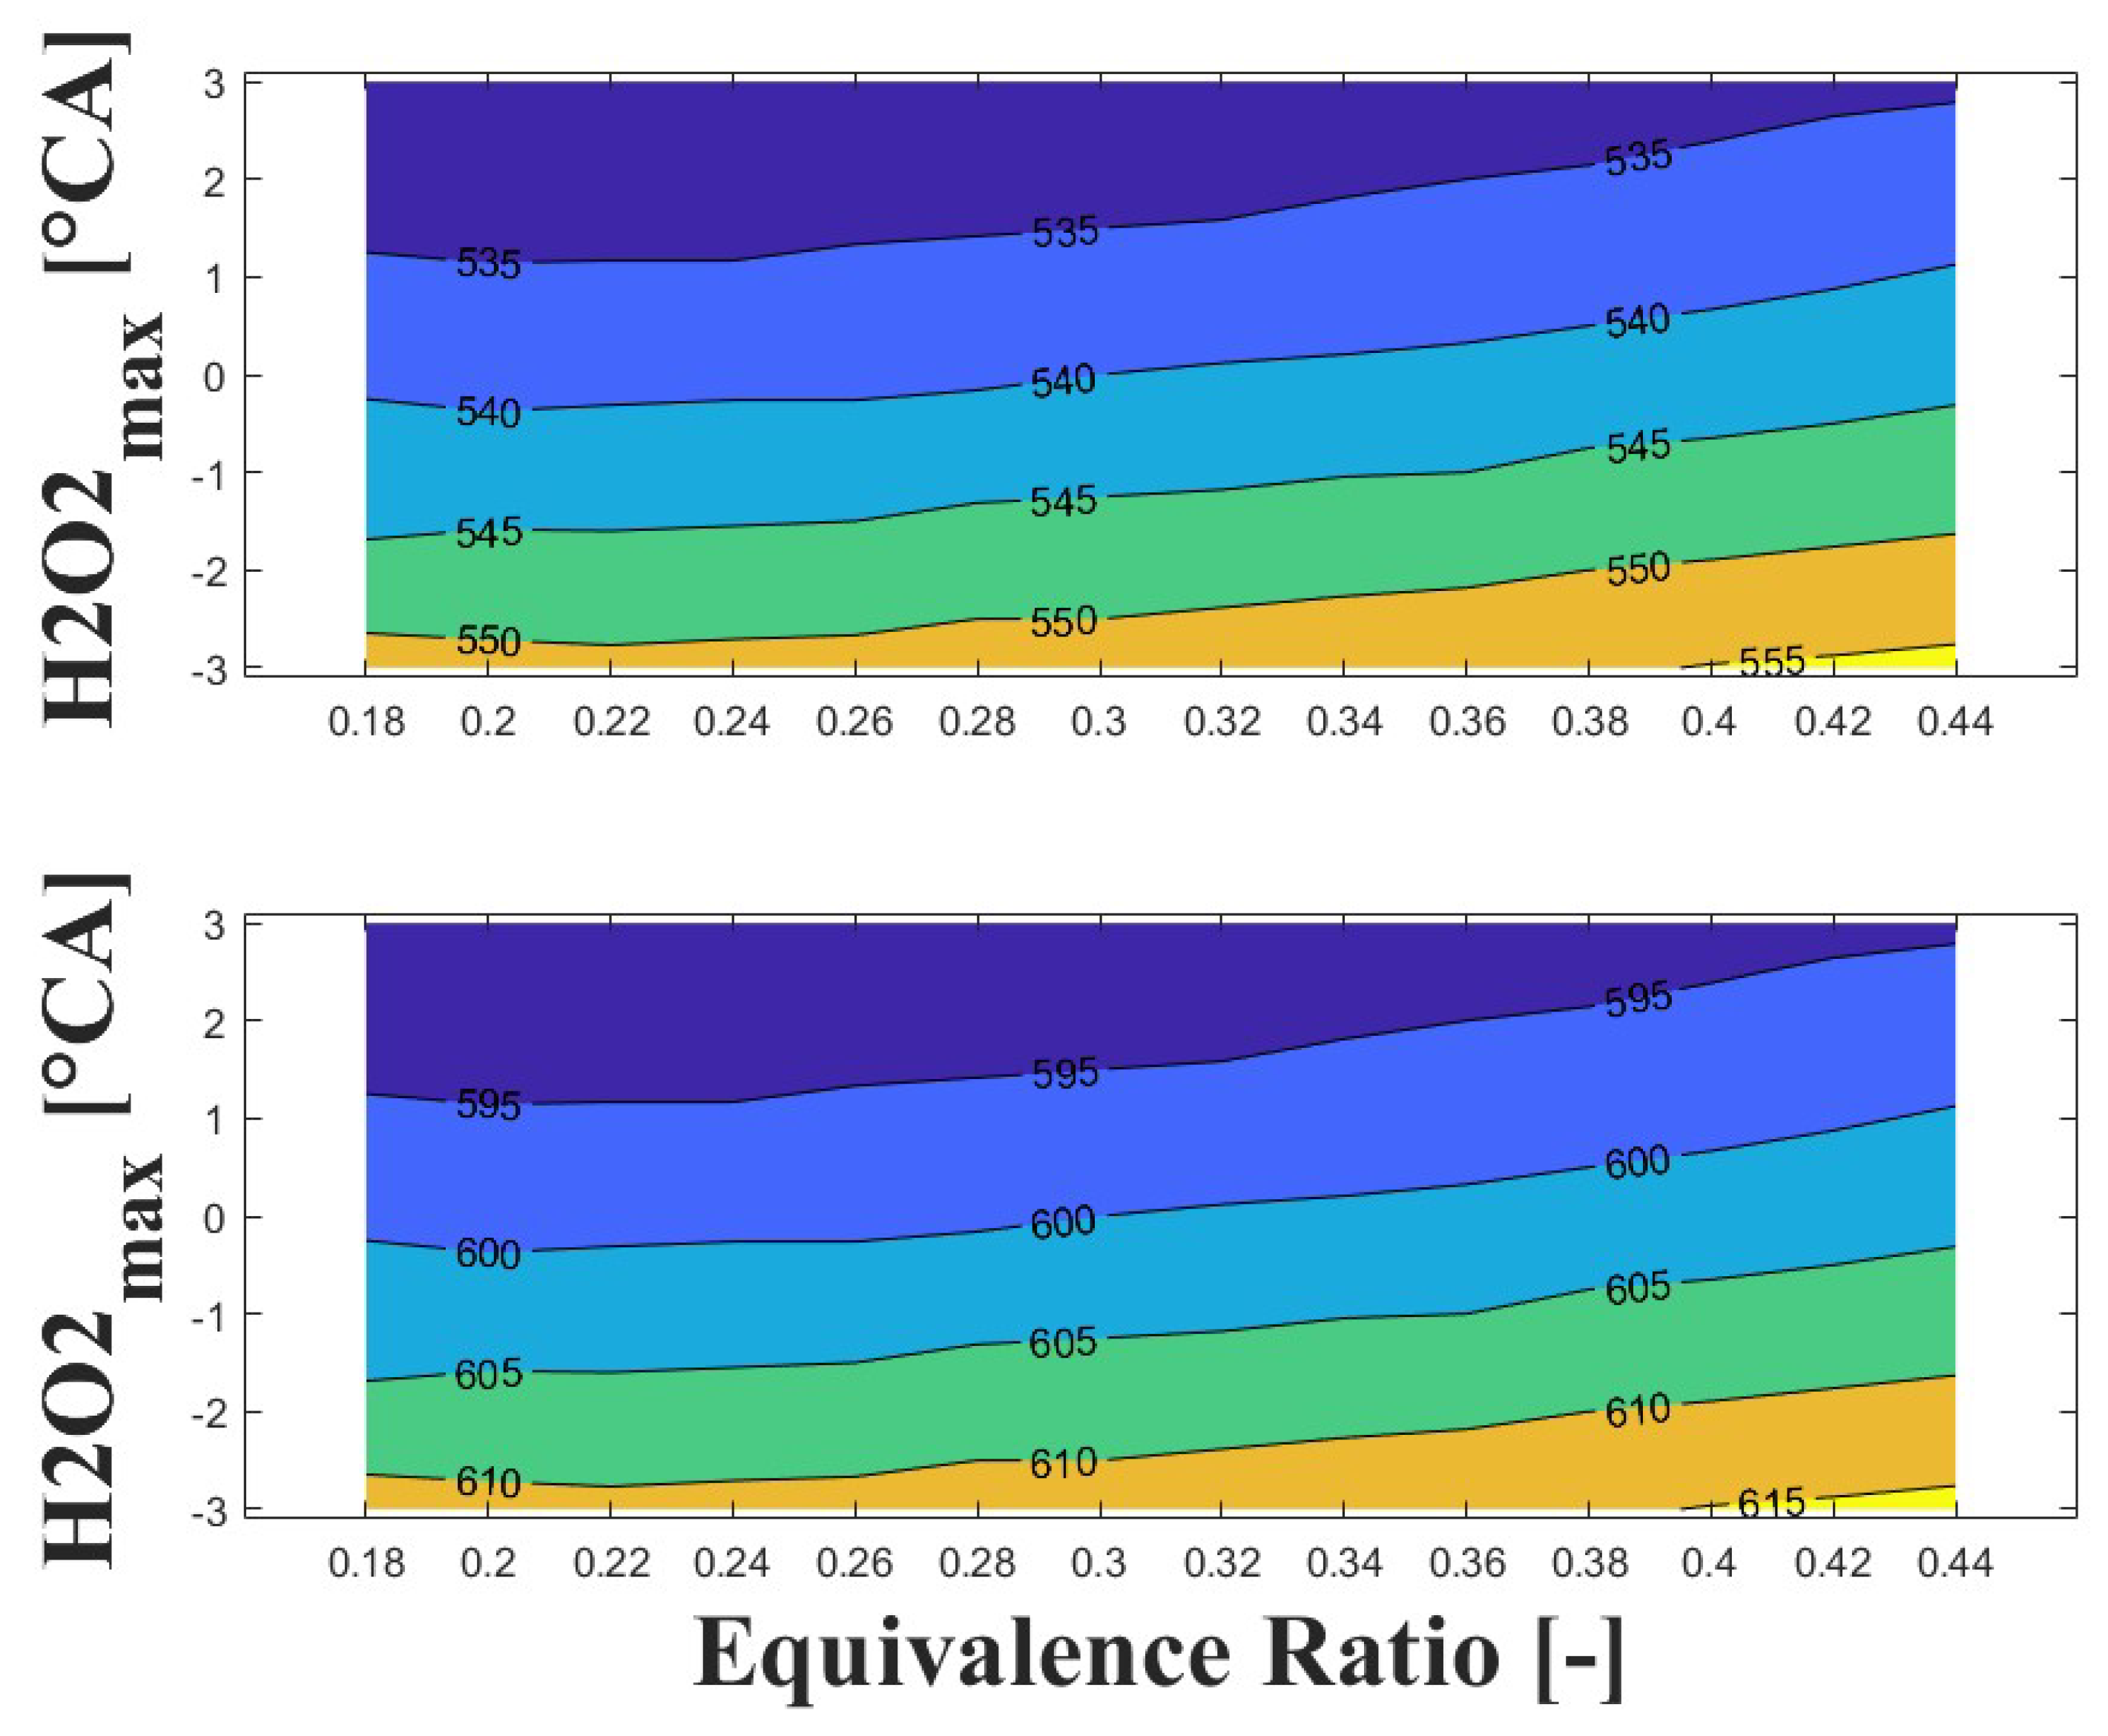
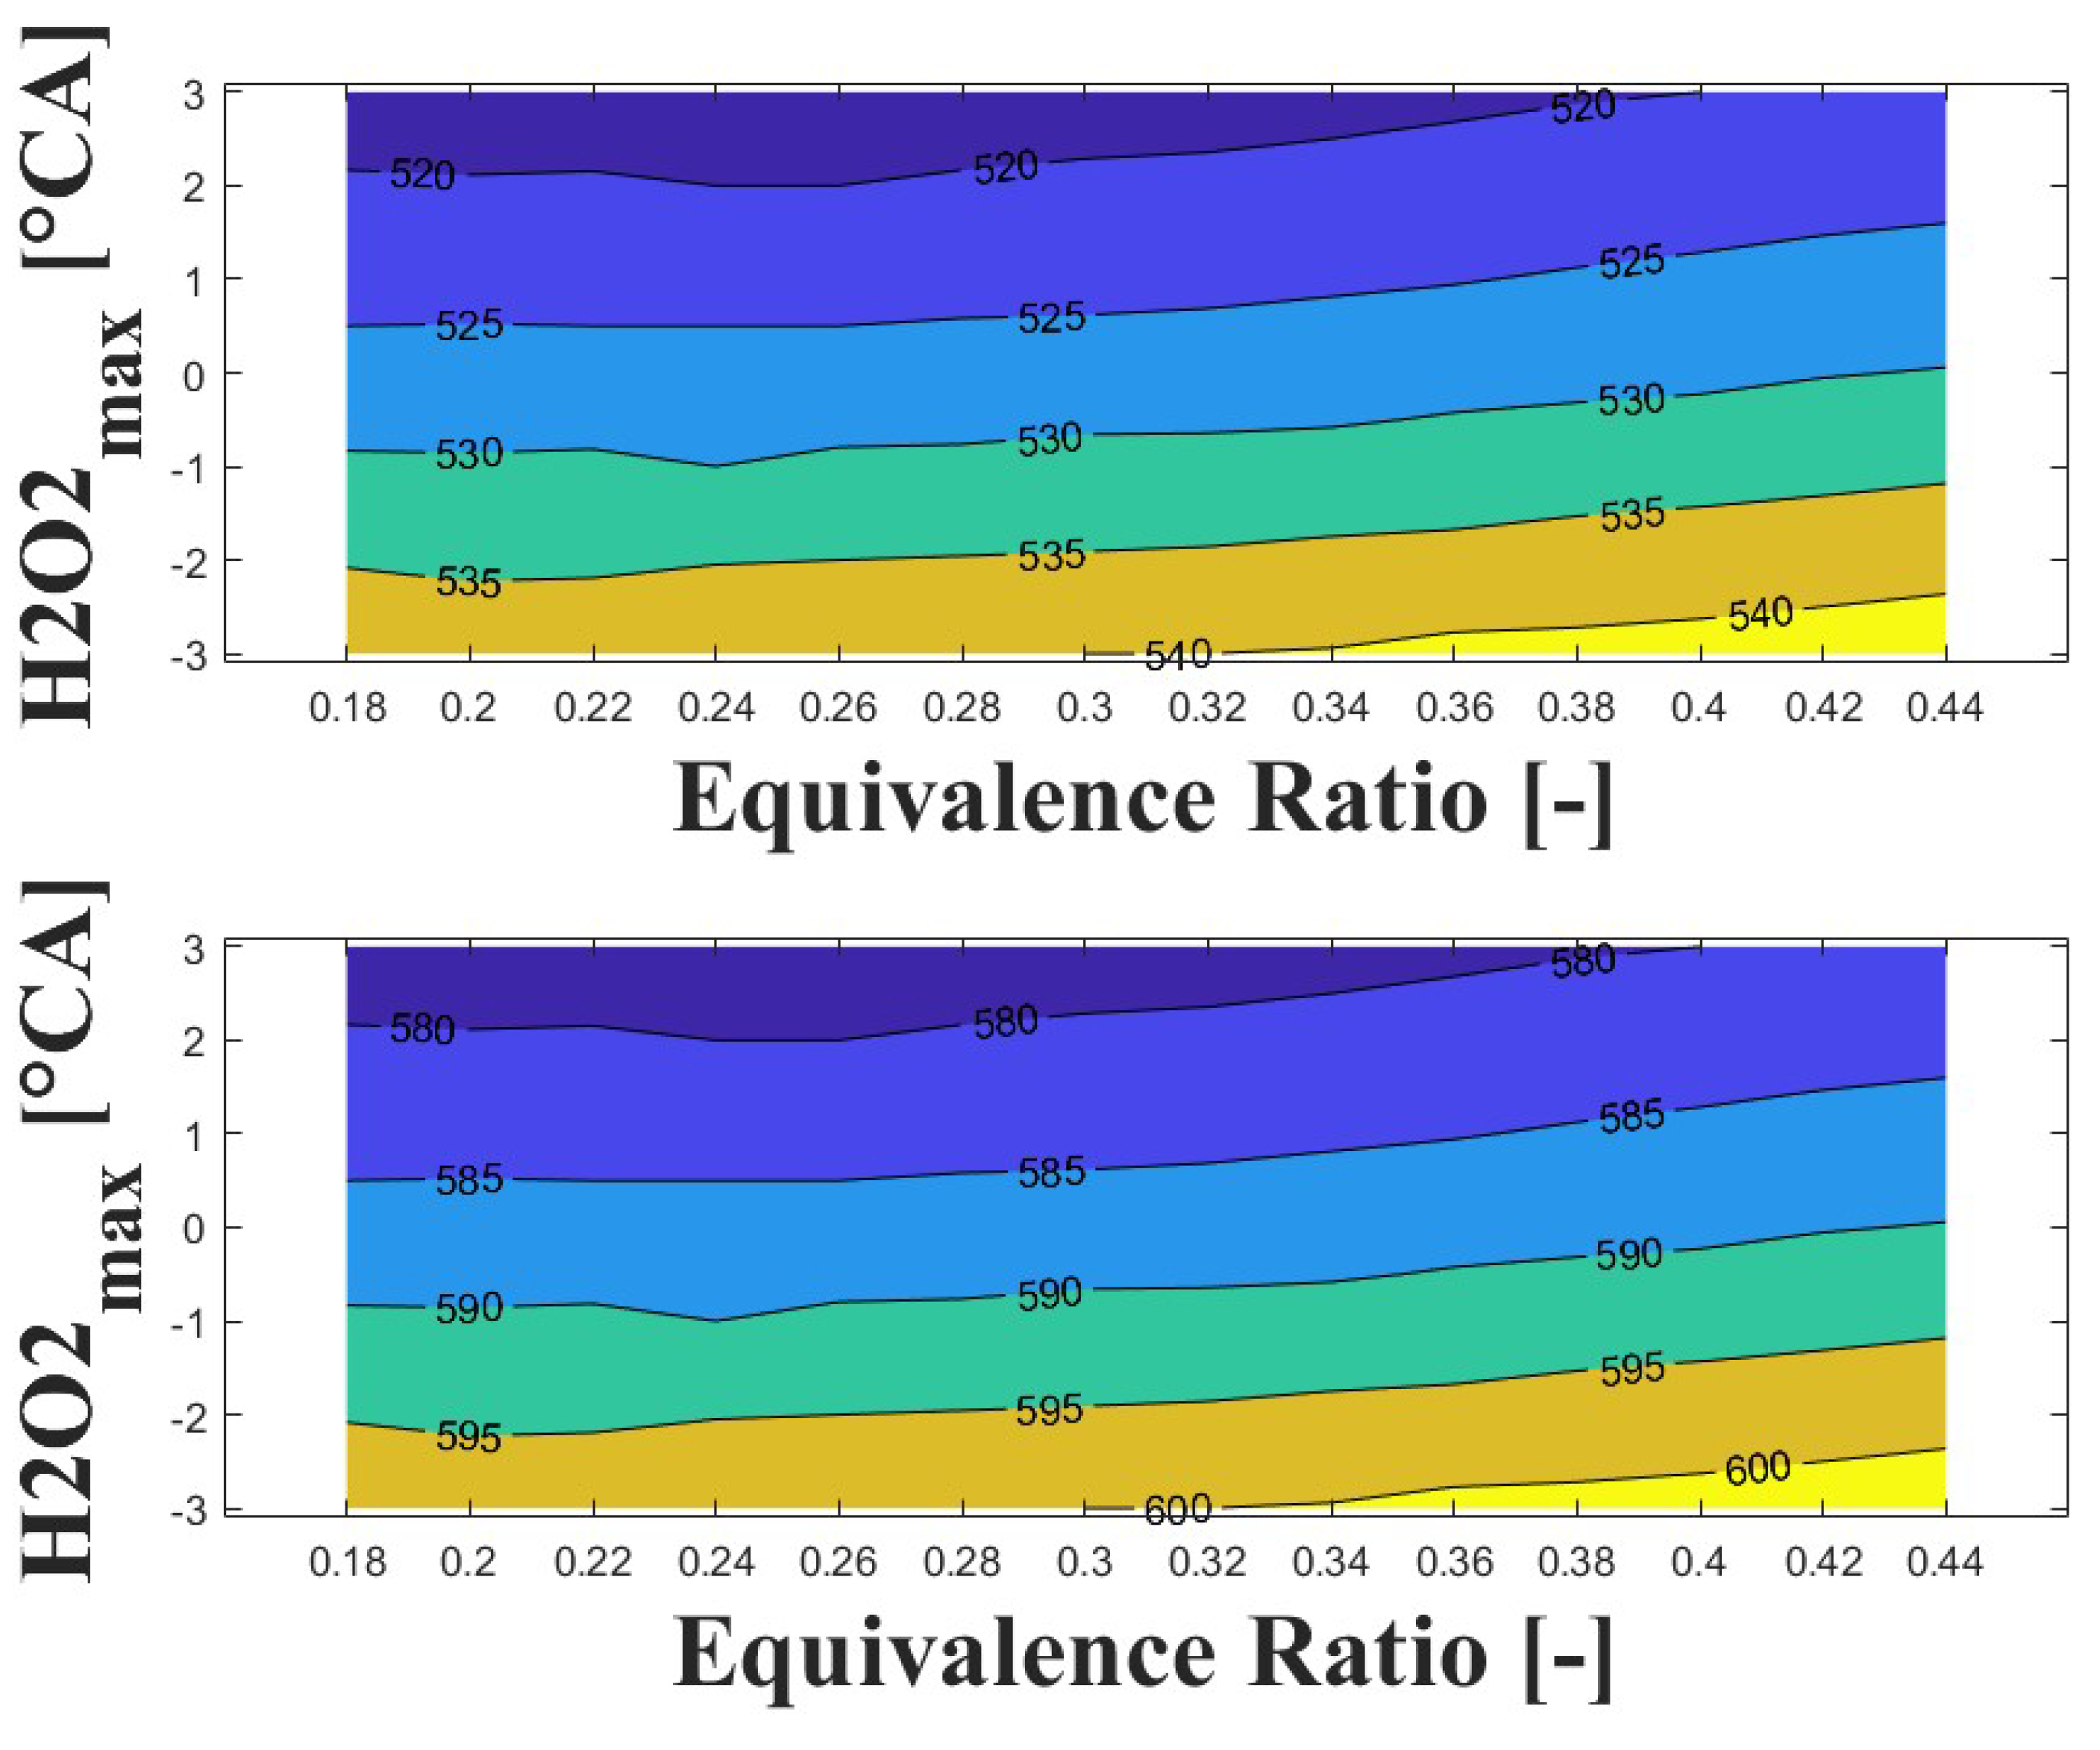
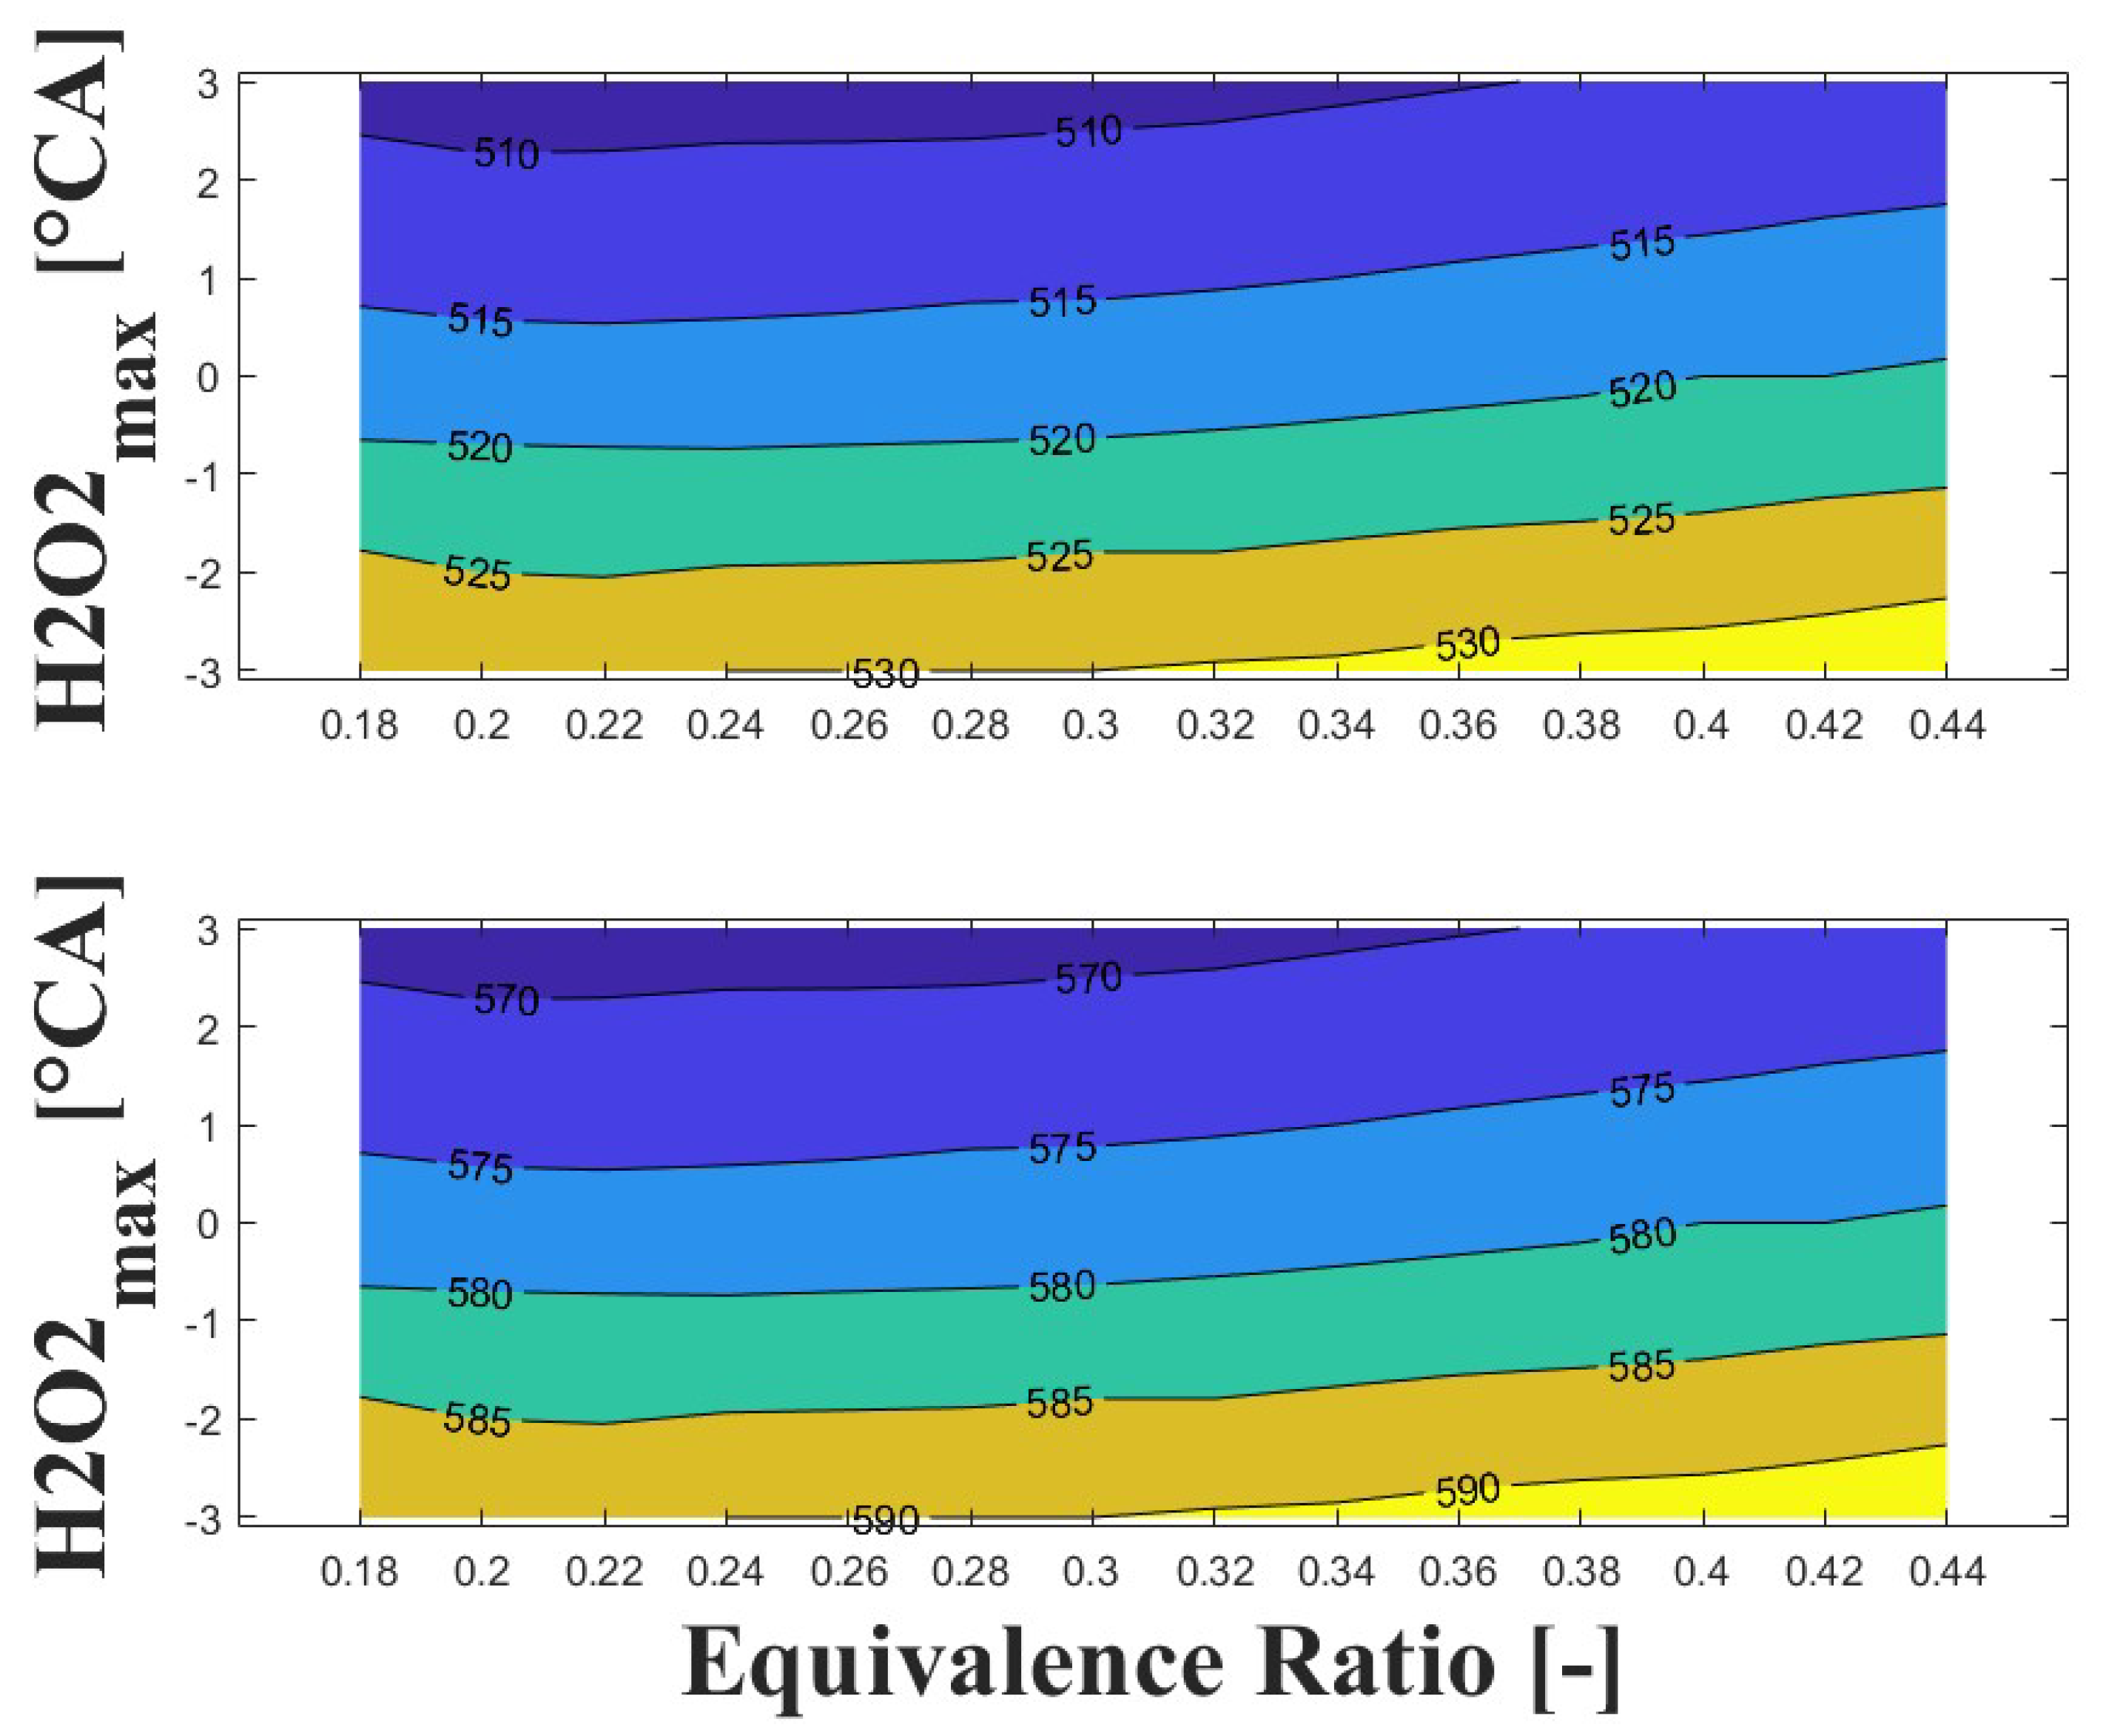
Figure 14, Figure 15 and Figure 16 show the effect of increasing the intake pressure on the intake temperature required to reach safe operating conditions. It can be observed that is possible to reduce the intake temperature by up to 25 C for the same equivalence ratio and ignition timing when the intake pressure is increased around to times. This effect has been reported in previous papers [24,25,26].

Figure 14.
IVC (top) and intake (bottom) temperature maps for safe operating condition; P bar and 1800 rpm.

Figure 15.
IVC (top) and intake (bottom) temperature maps for safe operating condition; P bar and 1800 rpm.

Figure 16.
IVC (top) and intake (bottom) temperature maps for safe operating condition; P bar and 1800 rpm.
The important information conveyed by Figure 14, Figure 15 and Figure 16 is the temperature required for safe operation, which is shown in the bottom graph of each figure. This temperature was always observed to be 50 and 60 C higher than the temperature calculated during the experiments at the IVC. The figures show that the lowest temperature requirements are associated with medium-lean equivalence ratios and delayed ignition timings, while high-lean and advanced ignition timings require the highest temperatures. In the case of the engine used in the research, high temperatures above 290 C were required to achieve a safe operating condition in the zone of delayed ignition timing, which could adversely affect engine efficiency and lead to derating compared to diesel operation, this being a drawback of using HCCI combustion in microgeneration with biogas or other biofuels with high resistance to auto-ignition. Additionally, these high temperatures could impact the lubrication system due to heating of the in-cylinder surfaces during the intake stroke, which could modify the lubricant properties and increase the wear on engine parts, potentially reducing engine lifespan and increasing the frequency of required maintenance.
3.4. Effect of Ozone Addition on Intake Temperature
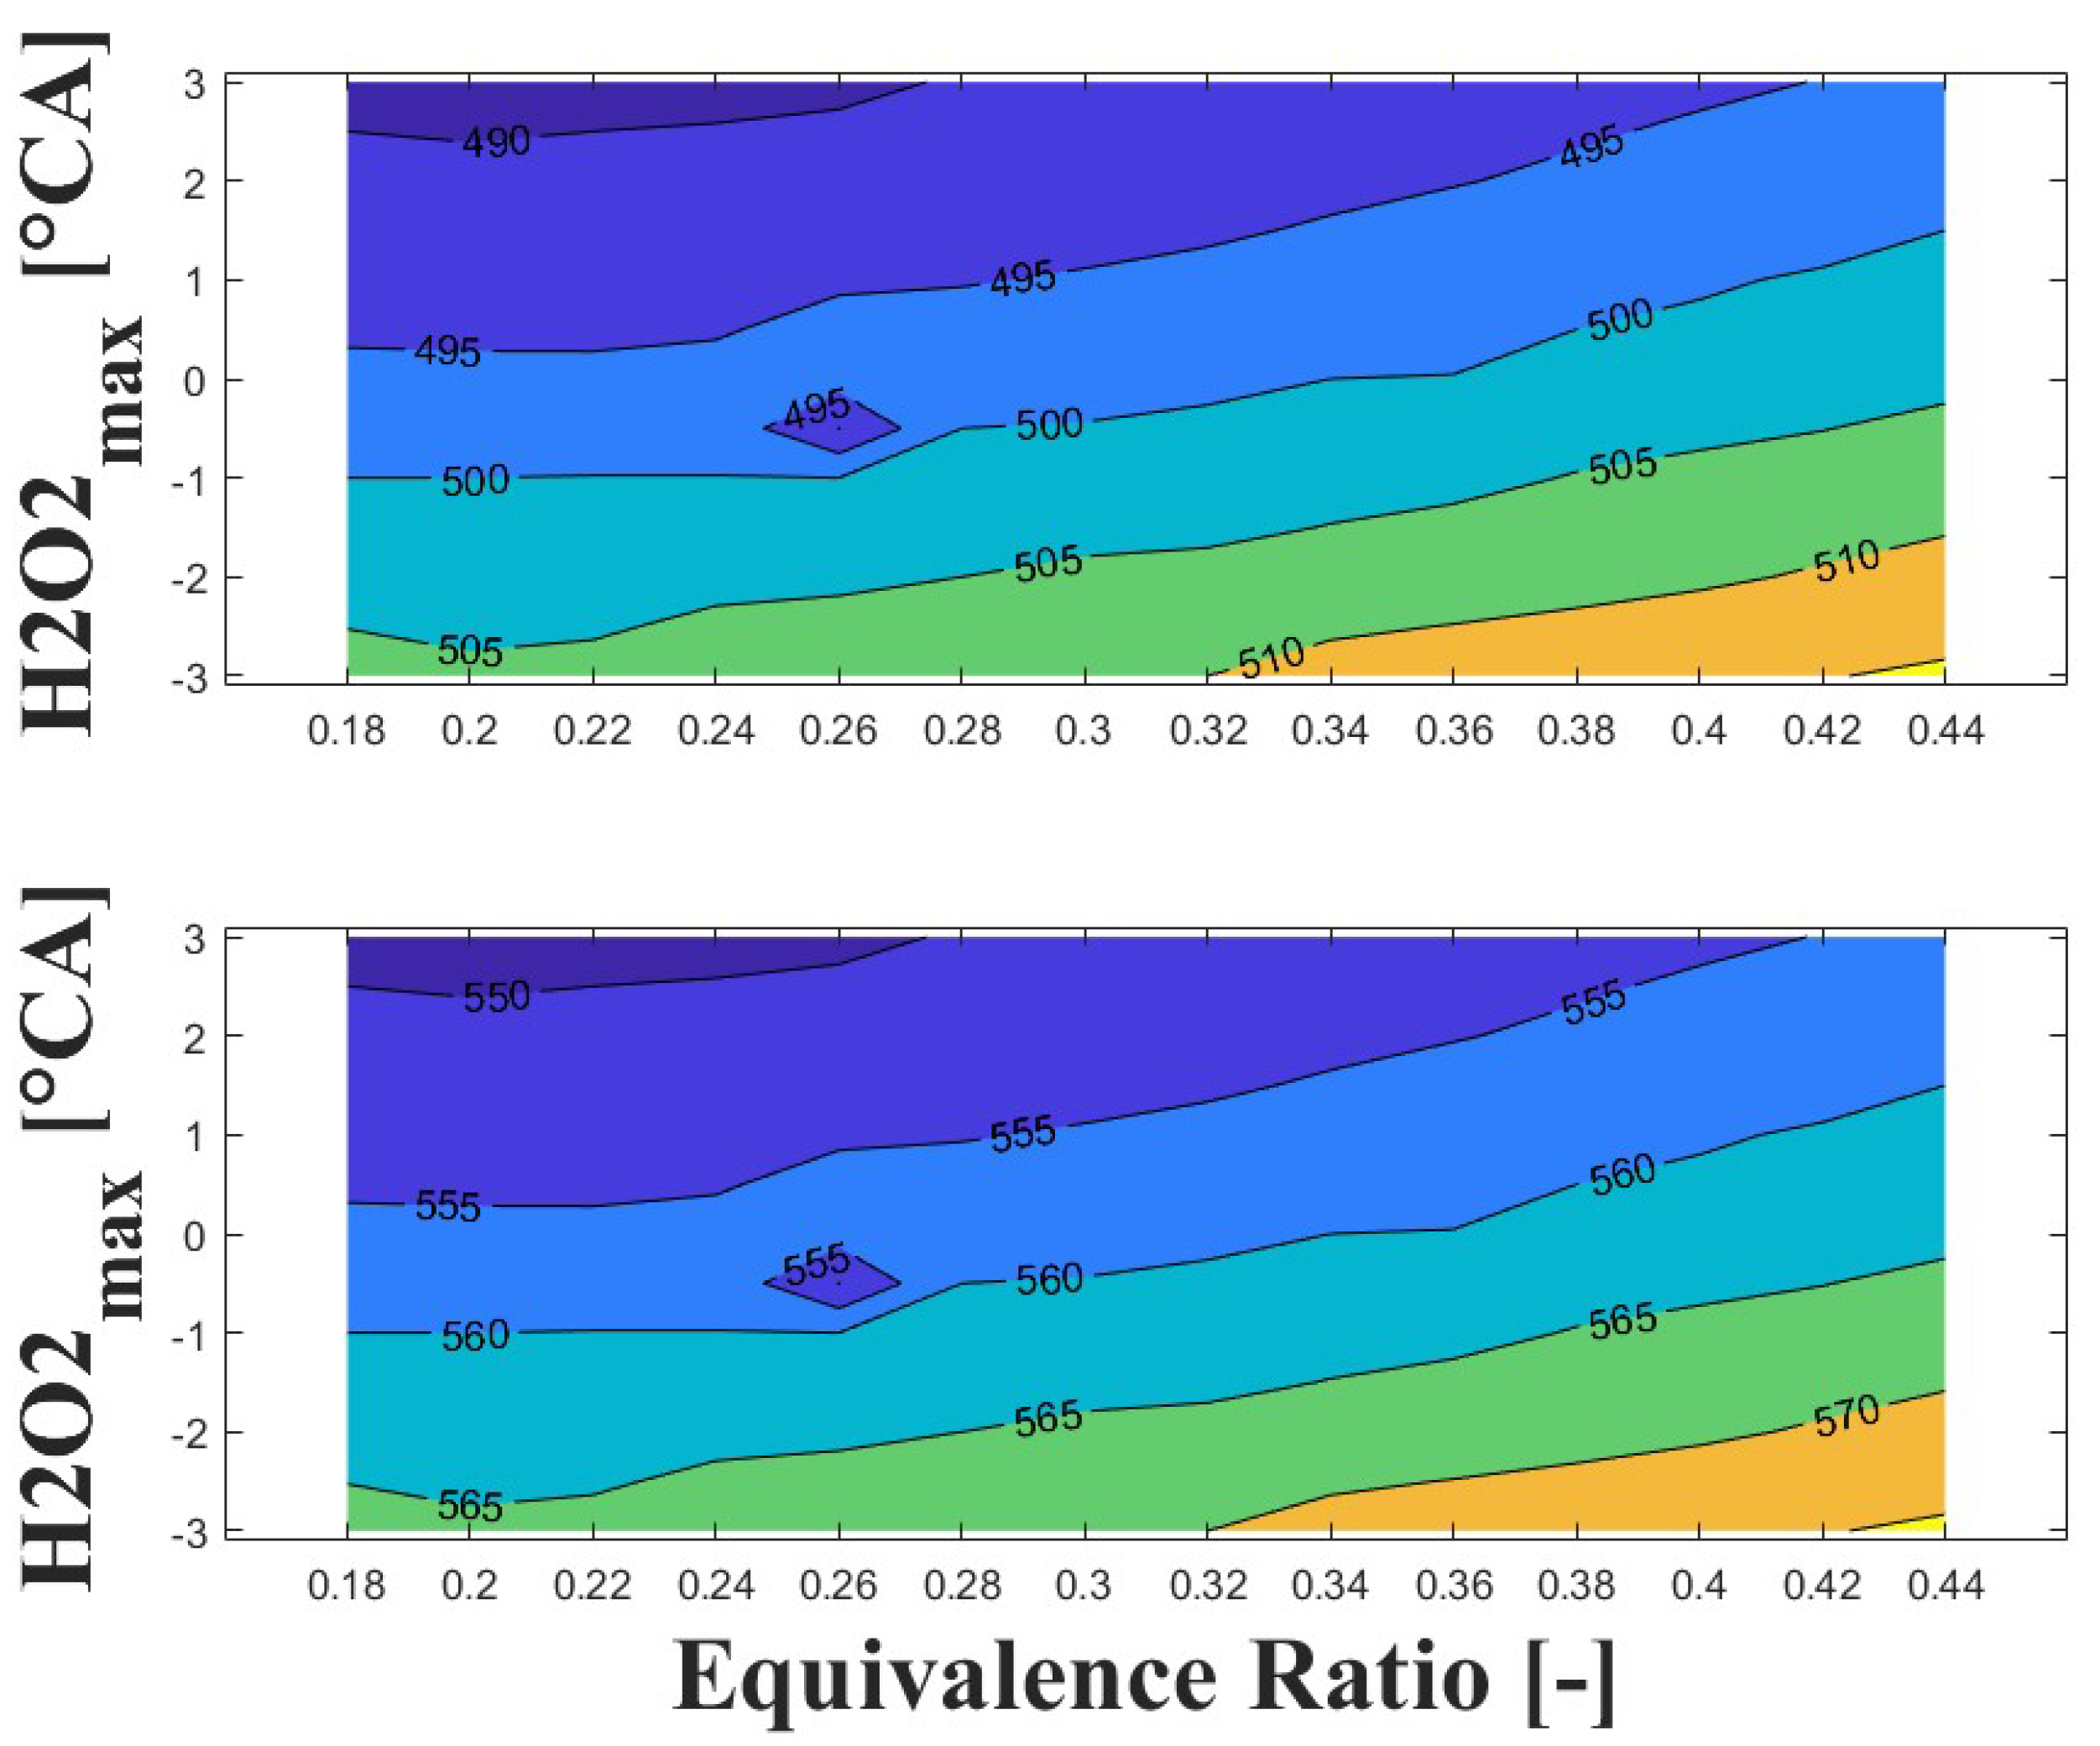
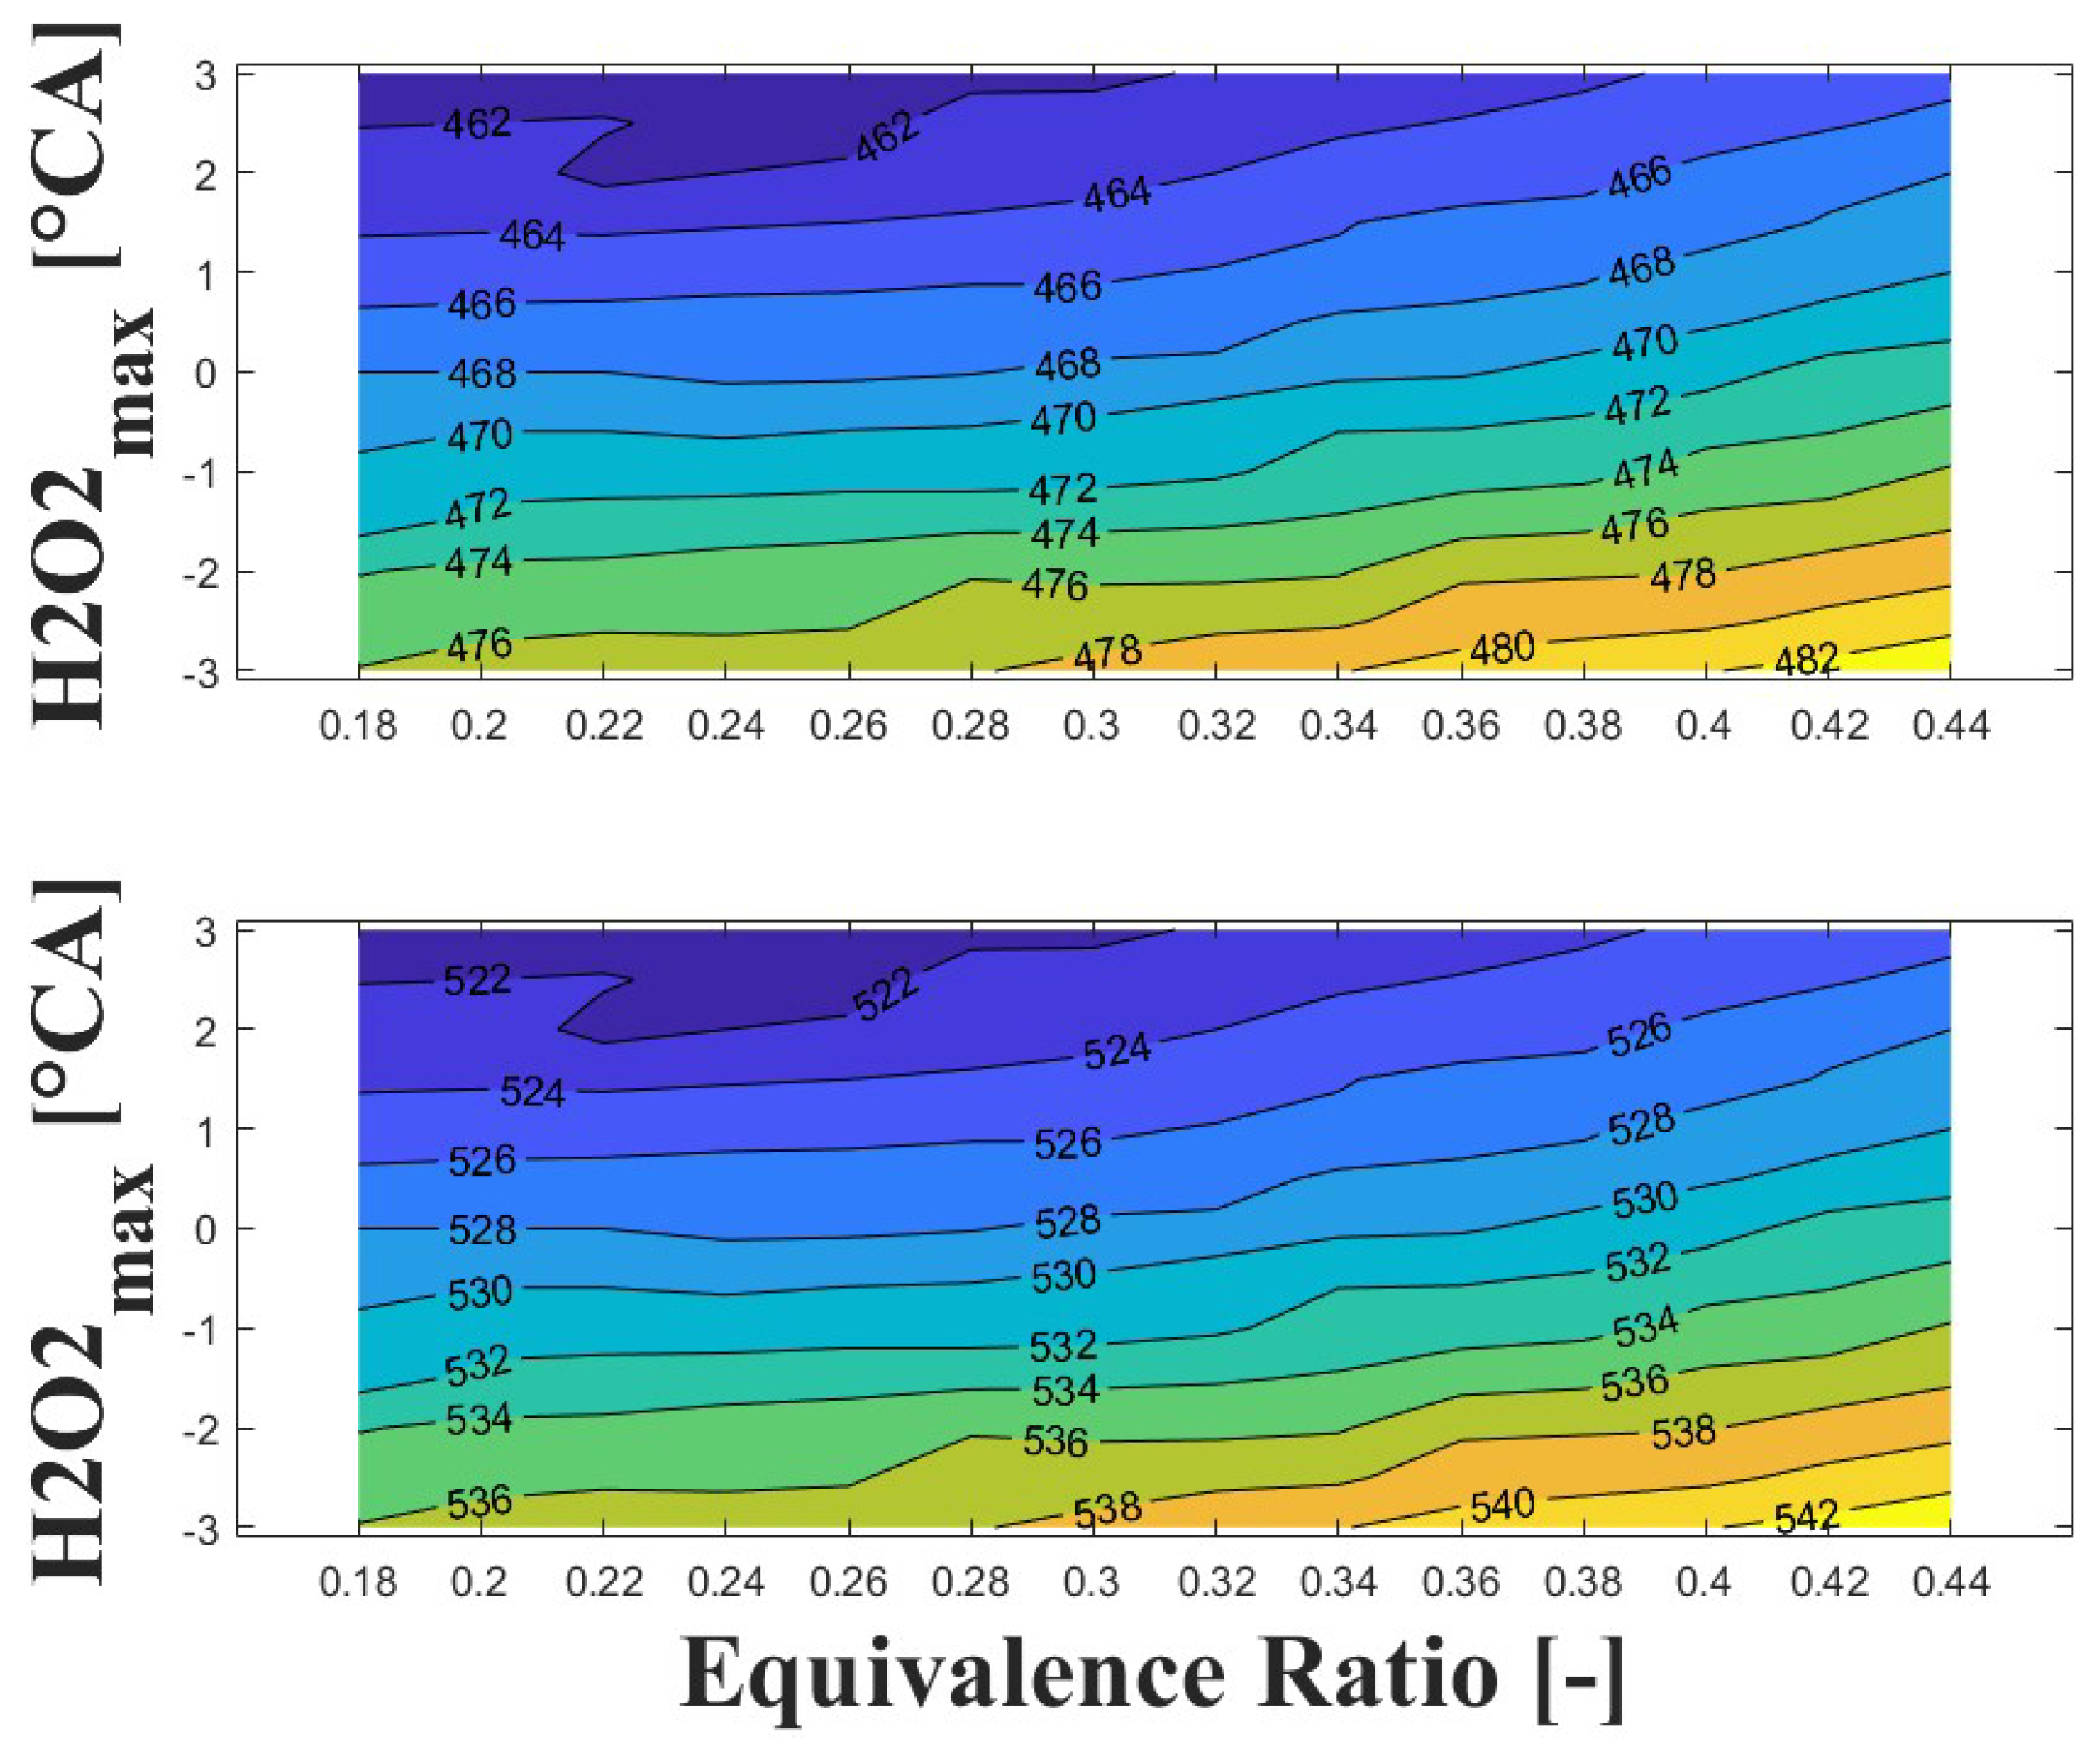
Figure 17 and Figure 18 show the effect of ozone addition on the intake temperature required to reach safe operating condition for additions of 100 and 500 ppm, respectively. For ozone addition, a molar balance was used to ensure the same C/O ratio as the baseline condition (i.e., entry of only biogas and air). It can be observed in the Figure 17 that addition of only 100 ppm of ozone reduces the intake temperature required to reach safe operating condition by around 50 C. Compared to the baseline conditions, the intake temperature is around 280 C for an ultra-lean equivalence ratio and delayed ignition timing, while for a lean equivalence ratio and advanced ignition timing the intake temperature is around to 300 C. This represents a significant improvement in engine power output and derating compared to the baseline operating conditions.
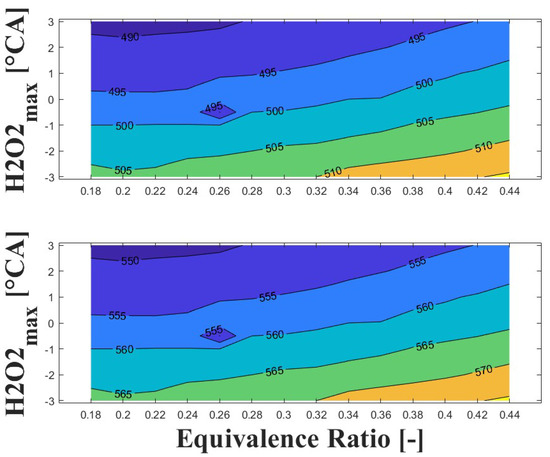
Figure 17.
IVC (top) and intake (bottom) temperature maps for safe operating condition; P bar, ozone addition ppm, and 1800 rpm.
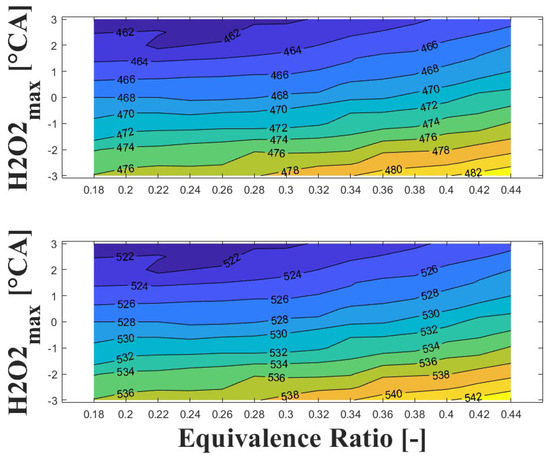
Figure 18.
IVC (top) and intake (bottom) temperature maps for safe operating condition; P bar, ozone addition ppm, and 1800 rpm.
When ozone addition is increased to 500 ppm (as shown in Figure 18), the required intake temperature to reach safe operating conditions decreases to around 250 C for an ultra-lean equivalence ratio and delayed ignition timing. Similarly, for a lean equivalence ratio and advanced ignition timing, the intake temperature decreases to around 270 C.
Regarding to the boosted intake pressure strategy, the ozone addition strategy shows better performance in reducing the required intake temperature. The reduction is between 20 C and 50 C with ozone addition of 100 ppm and 500 ppm, respectively, compared to an intake pressure of 2 bar at the same equivalence ratio and ignition timing. With respect to the baseline, the ozone addition strategy appears to be a better option for reducing the intake temperature of a high-speed HCCI engine fueled with biogas for power generation at sub-atmospheric conditions.
4. Conclusions
In this research, an air-cooled naturally aspirated Diesel engine operating at high engine speed was conditioned to run in HCCI mode while being fueled with biogas for power generation. Experimental tests were conducted under sub-atmospheric conditions (1500 m.a.s.l.). The four conditions studied here (high engine speed, biogas as fuel, an air-cooled system, and sub-atmospheric conditions) represent technical challenges, as these conditions negatively affect the auto-ignition process. To reach HCCI combustion based on combustion duration and NO concentrations, high intake temperatures above 320 C were required and highly diluted charges (close to ) were obtained. These conditions led to low IMEPn (around bar) and low indicated efficiency (close to ), which are below the values reported in previous studies on biogas-fueled HCCI combustion. To explore potential improvements in the performance of the tested engine, two strategies to reduce intake temperature were explored using a zero-dimensional detailed kinetic model, specifically, boosted intake pressure and ozone addition. Boosting the intake pressure up to 2 bar gauge can reduced the intake temperature to around 300 C for centered combustion, while addition of 500 ppm ozone to the charge allows the intake temperature to be reduced to around 250 C. These results show that ozone addition is a better alternative to increase the IMEPn and indicated efficiency in HCCI engines fueled with biogas thanks to the lower intake temperature required for stable combustion. The results achieved in this study are important for the design and implementatoin of biogas-fueled HCCI engines for microgeneration systems at high altitudes above sea level, which is a common scenario in developing countries. Future research on other strategies that can improve the performance of HCCI engines running biogas will be addressed by the authors in future studies involving more complete numerical approaches that allow the estimation of regulated emissions and combustion instabilities.
Author Contributions
Conceptualization, S.H.Q. and I.D.B.; Methodology, S.H.Q. and A.D.M.R.; Software, S.H.Q.; Investigation, S.H.Q.; Writing—original draft, S.H.Q.; Writing—review & editing, S.H.Q., A.D.M.R. and I.D.B.; Supervision, I.D.B. All authors have read and agreed to the published version of the manuscript.
Funding
The authors gratefully acknowledge the financial support provided by the Colombia Scientific Program within the framework of the Ecosistema Científico (Contract No. FP44842-218-2018). The authors acknowledge the financial support provided by the University of Antioquia through the research project identified by the code PRG 2017-16268.
Data Availability Statement
Not applicable.
Conflicts of Interest
The authors declare no conflict of interest. The funders had no role in the design of the study; in the collection, analyses, or interpretation of data; in the writing of the manuscript; or in the decision to publish the results.
Abbreviations
The following abbreviations are used in this manuscript:
| aTDC | After top dead centre |
| bcme | Billion cubic metres equivalent |
| bTDC | Before top dead centre |
| int | Intake |
| rpm | Revolutions per minute |
| AFR | Air fuel ratio |
| BTE | Brake Thermal Efficiency |
| CA10 | Crank angle of of cumulative heat release |
| CA50 | Crank angle of of cumulative heat release |
| CAD | Crank angle degree |
| CNG | Compressed natural gas |
| CO | Carbon monoxide |
| CO | Carbon dioxide |
| EVO | Exhaust valve opening |
| GHG | Greenhouse gases |
| H | Hydrogen |
| HC | unburned hydrocarbons |
| HCCI | Homogeneous Charge Compression Ignition |
| HRR | Heat release rate |
| ICE | Internal combustion engine |
| IMEP | Indicated Mean Effective Pressure |
| IMEPg | Gross indicated mean effective pressure |
| IMEPn | Net indicated mean effective pressure |
| IVC | Intake valve closure |
| LHV | Low heating value |
| NO | Nitrogen oxides |
| NVO | Negative valve overlap |
| PM | Particulate matter |
| PV | Photovoltaic |
| RGF | Residual gas fraction |
| TDC | Top dead center |
References
- IEA. World Energy Outlook 2022; IEA: Paris, France, 2022.
- Kapoor, R.; Ghosh, P.; Tyagi, B.; Vijay, V.K.; Vijay, V.; Thakur, I.S.; Kamyab, H.; Nguyen, D.D.; Kumar, A. Advances in biogas valorization and utilization systems: A comprehensive review. J. Clean. Prod. 2020, 273, 123052. [Google Scholar] [CrossRef]
- Sun, Q.; Li, H.; Yan, J.; Liu, L.; Yu, Z.; Yu, X. Selection of appropriate biogas upgrading technology-a review of biogas cleaning, upgrading and utilisation. Renew. Sustain. Energy Rev. 2015, 51, 521–532. [Google Scholar] [CrossRef]
- Paolini, V.; Petracchini, F.; Segreto, M.; Tomassetti, L.; Naja, N.; Cecinato, A. Environmental impact of biogas: A short review of current knowledge. J. Environ. Sci. Health Part A 2018, 53, 899–906. [Google Scholar] [CrossRef] [PubMed]
- Dec, J.E. Advanced compression-ignition engines—Understanding the in-cylinder processes. Proc. Combust. Inst. 2009, 32, 2727–2742. [Google Scholar] [CrossRef]
- Blizman, B.J.; Makel, D.B.; Mack, J.H.; Dibble, R.W. Landfill gas fueled hcci demonstration system. In Proceedings of the Internal Combustion Engine Division Fall Technical Conference, Aachen, Germany, 7–10 May 2006; Volume 42606, pp. 327–347. [Google Scholar]
- Bedoya, I.D.; Saxena, S.; Cadavid, F.J.; Dibble, R.W.; Wissink, M. Experimental study of biogas combustion in an HCCI engine for power generation with high indicated efficiency and ultra-low NOx emissions. Energy Convers. Manag. 2012, 53, 154–162. [Google Scholar] [CrossRef]
- Bedoya, I.D.; Saxena, S.; Cadavid, F.J.; Dibble, R.W.; Wissink, M. Experimental evaluation of strategies to increase the operating range of a biogas-fueled HCCI engine for power generation. Appl. Energy 2012, 97, 618–629. [Google Scholar] [CrossRef]
- Kozarac, D.; Vuilleumier, D.; Saxena, S.; Dibble, R.W. Analysis of benefits of using internal exhaust gas recirculation in biogas-fueled HCCI engines. Energy Convers. Manag. 2014, 87, 1186–1194. [Google Scholar] [CrossRef]
- Depcik, C.; Mangus, M.; Ragone, C. Ozone-assisted combustion—Part I: Literature review and kinetic study using detailed n-heptane kinetic mechanism. J. Eng. Gas Turbines Power 2014, 136, 091507. [Google Scholar] [CrossRef]
- Nishida, H.; Tachibana, T. Homogeneous charge compression ignition of natural gas/air mixture with ozone addition. J. Propuls. Power 2006, 22, 151–157. [Google Scholar] [CrossRef]
- Kubesh, J.; King, S.R.; Liss, W.E. Effect of Gas Composition on Octane Number of Natural Gas Fuels; Technical Report; SAE Technical Paper; SAE: Warrendale, PA, USA, 1992. [Google Scholar]
- Montgomery, D.C. Design and Analysis of Experiments; John Wiley & Sons: Hoboken, NJ, USA, 2017. [Google Scholar]
- Heywood, J.B. Internal Combustion Engine Fundamentals; McGraw-Hill Education: New York, NY, USA, 2018. [Google Scholar]
- Chang, J.; Güralp, O.; Filipi, Z.; Assanis, D.; Kuo, T.W.; Najt, P.; Rask, R. New heat transfer correlation for an HCCI engine derived from measurements of instantaneous surface heat flux. SAE Trans. 2004, 113, 1576–1593. [Google Scholar]
- Namazian, M.; Heywood, J.B. Flow in the piston-cylinder-ring crevices of a spark-ignition engine: Effect on hydrocarbon emissions, efficiency and power. SAE Trans. 1982, 91, 261–288. [Google Scholar]
- Ortiz-Soto, E.A.; Vavra, J.; Babajimopoulos, A. Assessment of residual mass estimation methods for cylinder pressure heat release analysis of HCCI engines with negative valve overlap. J. Eng. Gas Turbines Power 2012, 134, 082802. [Google Scholar] [CrossRef]
- Sjöberg, M.; Dec, J.E.; Babajimopoulos, A.; Assanis, D. Comparing enhanced natural thermal stratification against retarded combustion phasing for smoothing of HCCI heat-release rates. SAE Trans. 2004, 113, 1557–1575. [Google Scholar]
- Aceves, S.M.; Smith, J.R.; Westbrook, C.K.; Pitz, W. Compression ratio effect on methane HCCI combustion. J. Eng. Gas Turbines Power. 1999, 121, 569–574. [Google Scholar] [CrossRef]
- Bedoya, I.D.; Cadavid, F.; Saxena, S.; Dibble, R.; Aceves, S.; Flowers, D. A Sequential Chemical Kinetics-CFD-Chemical Kinetics Methodology to Predict HCCI Combustion and Main Emissions; Technical Report; SAE Technical Paper; SAE: Warrendale, PA, USA, 2012. [Google Scholar]
- Bedoya, I.; Saxena, S.; Dibble, R.; Cadavid, F. Exploring Optimal Operating Conditions for Stationary Power Generation from a Biogas-Fueled HCCI Engine. In Proceedings of the 7th US National Technical Meeting of the Combustion Institute, Georgia Institute of Technology, Atlanta, GA, USA, 20–23 March 2011; pp. 2172–2177. [Google Scholar]
- Halter, F.; Higelin, P.; Dagaut, P. Experimental and detailed kinetic modeling study of the effect of ozone on the combustion of methane. Energy Fuels 2011, 25, 2909–2916. [Google Scholar] [CrossRef]
- Quintana, S.H.; Castano-Mesa, E.S.; Bedoya, I.D. Experimental Study of the Polytropic Coefficient for an Air-Cooled, High-Compression-Ratio, Spark-Ignition Engine Fueled with Natural Gas, Biogas, and a Propane–Syngas Blend. Energy Fuels 2018, 32, 2376–2384. [Google Scholar] [CrossRef]
- Zhao, F.; Asmus, T.N.; Assanis, D.N.; Dec, J.E.; Eng, J.A.; Najt, P.M. Homogeneous Charge Compression Ignition (HCCI) Engines; SAE: Warrendale, PA, USA, 2003. [Google Scholar]
- Saxena, S.; Bedoya, I.D. Fundamental phenomena affecting low temperature combustion and HCCI engines, high load limits and strategies for extending these limits. Prog. Energy Combust. Sci. 2013, 39, 457–488. [Google Scholar] [CrossRef]
- Duan, X.; Lai, M.C.; Jansons, M.; Guo, G.; Liu, J. A review of controlling strategies of the ignition timing and combustion phase in homogeneous charge compression ignition (HCCI) engine. Fuel 2021, 285, 119142. [Google Scholar] [CrossRef]


Disclaimer/Publisher’s Note: The statements, opinions and data contained in all publications are solely those of the individual author(s) and contributor(s) and not of MDPI and/or the editor(s). MDPI and/or the editor(s) disclaim responsibility for any injury to people or property resulting from any ideas, methods, instructions or products referred to in the content. |
© 2023 by the authors. Licensee MDPI, Basel, Switzerland. This article is an open access article distributed under the terms and conditions of the Creative Commons Attribution (CC BY) license (https://creativecommons.org/licenses/by/4.0/).