Article

Design of Energy Communities and Data-Sharing: Format and Open Data

1
Department of Energy, Systems, Territory and Constructions Engineering, University of Pisa, L.go Lucio Lazzarino 1, 56122 Pisa, Italy
2
UNESCO Chair on “Sustainable Energy Communities”, University of Pisa, L.go Lucio Lazzarino 1, 56122 Pisa, Italy
3
University School of Advanced Studies IUSS Pavia, Piazza Della Vittoria 15, 27100 Pavia, Italy
*
Authors to whom correspondence should be addressed.
Energies 2023, 16(17), 6268; https://doi.org/10.3390/en16176268
Submission received: 7 July 2023 / Revised: 18 August 2023 / Accepted: 19 August 2023 / Published: 29 August 2023
(This article belongs to the Special Issue Energy Communities Implementation)

Abstract

:
Governments are promoting energy community (EC) policies to encourage joint investment and the operation of shared energy assets by citizens, industries, and public authorities, with the aim of promoting economic, social, and environmental benefits. However, ECs require appropriate planning and energy management strategies, which require data that are rarely clean and well-structured. Data providers rarely adhere to a common format for data sharing, which hinders the development of ECs. As the number of ECs is expected to grow significantly, this poses significant issues for stakeholders to quickly and efficiently develop projects. To address this issue, in this paper we propose a literature-based analysis and classification to derive the major data needs for EC planning, as well as a template format for data sharing. Our literature review on ECs successfully identifies the main data required to properly describe this system and its components. Their classification further clarifies that data structures shall account for tabular-like data of various types and flexible dimentionality, or cardinality. A public release of an open dataset for a case study in Pisa, Italy is also provided, supported by realistic or real data for testing the sizing and operation of ECs. The results suggest that data standard practices are needed, and this paper can lay the foundation for their standardization for ECs to fast-forward their deployment as support policy and technical decision-making.

1. Introduction

1.1. Motivation

To cope with climate change, society shall undergo a “decarbonization process” to meet its needs with sustainable practices. Energy plays a critical role, and increasing the penetration of renewable sources is of utmost importance [1]. In recent years, decentralized energy production, also using renewable energy sources (RESs), has risen attention as a viable option to support energy transition, especially under the energy community (EC) paradigm. In ECs, citizens, small consumers, and public authorities can group together, collectively participate in common energy investments, jointly coordinate to align demand and consumption supported by decentralized energy assets, and promote a positive environmental and social impact on local communities [2]. Generally, to reach high levels of sustainability, ECs exploit distributed RESs, providing cost-effective clean energy to the participants, reducing energy losses and carbon emissions. This type of EC is classically known as the renewable energy community (REC). Interest is increasing regarding the development of the optimal planning, design, and operation of ECs, to meet the objectives of sustainability or the reduction in energy demands of these entities while preserving users satisfaction. However, the data to feed the mathematical models necessary for this relevant optimization procedure are rarely available, as well as their formatting characteristics. Identifying the key data of the energy systems mostly used in EC context; collecting details ontheir environmental, economic, and social impact [3]; and then developing a proper format to foster their sharing and implementation in optimization analyses would be advantageous for the scientific community and support multi-objective studies, as well as the development and validation of energy models and optimization strategies. However, limited studies have covered this topic.
The study of ECs involves the needs for multidisciplinary skills involving various aspects of technical, social, and economic considerations [4,5]. As a result, there are different approaches and methodologies for studying and analyzing these communities that overall need to be quantified. While each project or research study related to ECs may vary significantly, it is the role of the developer or modeller to capture the main characteristics of the system and quantify them to appropriately feed decision tools for energy planning. Given that no data standardization is available, issues of interpretability of data and duplication of data handling are arising.
To promote standardization and facilitate comparison among studies, we propose a first literature-based abstract classification of the data needs for energy modeling in ECs while also proposing a standardized data format for collecting and reporting information related to ECs. To accomplish this, a literature review about energy communities is conducted and analyzed to identify the main characteristics required for techno-economic and user behavior analysis. Moreover, we created and shared an open dataset by collecting real and realistic data about the characteristics of a possible EC located in Pisa, Italy.
This effort is expected to lay the foundations for a common data structure that can facilitate data sharing, analysis, and faster decision making. To the best of the author’s knowledge, this represents the pioneering effort in this direction within the existing literature.

1.2. Literature Analysis

The literature analysis is structured as follows. First, we provide an overview about ECs and their adoption in recent years. Secondly, we discuss the state of the art of techno-economic modeling for ECs. Finally, we present the available datasets related to ECs, to be used for further research and analysis works in this field.

1.2.1. Energy Communities Adoption

In recent decades, renewable energy sources and energy efficiency have been identified as key drivers for achieving a decarbonized energy system [6]. The European Union has been working towards a sustainable energy system and society through a set of directives, including the clean energy package. In this context, renewable energy communities (RECs) have received particular attention, as defined by the Renewable Energy Directive REDII 2018/2001 [7] and the Electricity Market Directive 2019/944 [8]. An REC is a group of residential or industrial users whose participation should improve social welfare and achieve environmentally friendly goals as a non-profit entity. Users can choose their energy provider and express their desired electricity purchase price while participating in electric markets through demand side management (DSM) or demand response (DR) programs. Users can join or leave the community together with their personal point of delivery (POD), as a form of further flexibility. However, crucial aspects like technical skills of community members, the ownership of assets, and criteria for fair benefits sharing must be considered. Regarding Europe, connecting ECs in Sub-Saharan Africa can improve access to energy facilities and promote a renewed way of thinking about energy resources to tackle energy injustice [9]. In Latin America and the Caribbean, adequate access to education is crucial for local communities, researchers, and policy makers to ensure sustainable renewable energy projects and the preservation of biodiversity [10].

1.2.2. Techno-Economic Modeling

The modeling of energy communities can benefit from the literature on energy systems; while ECs are not only a technical system, social, organizational, and political considerations cannot be disregarded [11]. Many studies have focused on the optimal planning of the entire community as a whole, with economic objectives [12,13]. However, EC policies are explicitly promoting the involvement of citizenship in energy matters to promote environmental, social, and economic impact [6], and these aspects are increasingly being considered in EC planning [5], alongside the fair redistribution of the benefits across the whole community [4]. Various technologies, components, and sizes of community have been proposed, which imply different data requirements and solving techniques [11]. However, the level of complexity in which components, users, and their interactions are modeled must be balanced between computational time and the accuracy of the results. The most widely used technique for energy systems modeling and optimization is mixed integer linear programming (MILP) [14], but the larger the problem, the larger the computational complexity. Research studies have investigated the sizing and optimal planning of electrical assets, as well as the concept of exit clauses and different mechanisms for sharing benefits among members [4,15]. Other studies have explored internal energy transactions between users, including an environmental objective in the methodology [16]. Additionally, some authors have proposed an energy hub model that considers both electrical and thermal renewable assets for sizing and management [17]. On the other hand, characterizing the socio-economic preferences of users in ECs is notoriously challenging [5], and indeed social science research have been widely addressing this topic, e.g., by means of surveys [18]. Those techniques can be valuable for estimating the preferences and parameters of energy modeling to successfully perform comprehensive socio-economic and environmental planning of a community. While methodologies vary greatly, the input data required for the different tools are often similar. To facilitate data sharing and lay the foundations for further data standards, in this study we first propose an analysis of the major technologies and the main parameters needed by energy modeling techniques for optimizing EC.

1.2.3. Available Datasets

This section presents report papers dealing with datasets covering a wide range of aspects related to ECs, such as their energy generation and consumption profiles, socio-economic and environmental impacts, and the technical and economic performance of different energy technologies and solutions, with the aim of identifying the key elements that can be used for further research and development activities in this field. The paper by [19] provides a dataset focused on Norwegian energy communities. The dataset includes various types of data, such as household consumption data obtained from smart meter measurements and divided into consumer groups, appliance consumption data collected from Norwegian households, electric vehicle data related to charging patterns, simulated photovoltaic power generation data based on temperature and irradiance data sets, and wholesale electricity prices. All datasets are filtered by season, weekday/weekend, and time segment and are fitted to either a normal, exponential, or log-normal distribution. On the other hand, the authors in [20] publicly reviewed available datasets, tools, and models that can be used to optimize the design and operation of local energy communities (LECs). They also provided guidelines for different roles in real-world LECs, including aspiring and existing LECs. The article highlights the importance of open source datasets, tools, and models in grounding expectations and providing visibility on future energy and cash flows for LECs and other stakeholders. It also points out some of the limitations in currently available open source resources, e.g., the limited geographical availability of electricity demand datasets, and suggests future research directions, e.g., implementing a more holistic framework for integrating different elements of an LEC. The study [21] provides valuable information for investigating a dataset about electrical power consumption data and load profiles for several major household appliances in the US, including refrigerators, air conditioners, and washers. The data, measured in one-second intervals, is available online and intended for use by researchers to develop realistic load models and analyze demand response algorithms for home energy management. Another recent data document [22] discusses the construction of a data set of the energy consumption behavior of a residential community, including photovoltaic generation and appliance usage profiles. The dataset was based on real data collected from 50 residential households and a public building. The article explains the process of gathering and normalizing the data and randomly attributing renewable solar energy to some households. The dataset can be used to examine and prove certain models related to the behavior of energy consumption. It may be useful for researchers studying renewable energy communities or distributed energy resources in general.
The proposed literature analysis highlights that existing works have focused on gathering data for ECs, but limited research has been focused on identifying the needed input data for sizing ECs.

1.3. Contributions and Organization of the Paper

This study contributes to the scientific literature by (a) identifying the major input quantities needed for sizing ECs; (b) classifying them; and (c) drawing guidelines for a data format, also including a practical case study for a realistic case study in Pisa, Italy. Based on a wide literature analysis, we describe the main components used in ECs, their main parameters, and their dimensionality to proper characterize the technical, economic, environmental, and social characteristics needed for energy planning. The analysis is functional to characterize the type and dimensionality of data, to describe the abstract data structure for ECs and requirements of dataformats to guide data collection, and the development of data standards. Moreover, we also present an open dataset obtained through real data from several sources that researchers can use for further studies and as a reference instance for algorithm benchmarking. This is expected to lay the foundations for guidelines on data format and sharing that is highly needed for interoperability and the widespread deployment of ECs. Considering privacy and copyright considerations, certain data have been intentionally perturbed. Consequently, in the ensuing sections, we will discuss data that are referred to as realistic, denoting data that have been subject to controlled alterations for specific reasons.
The paper is structured as follows: Section 2 describes the main assets of ECs and their main parameters, Section 3 introduces the proposed data structure, and in Section 4 conclusions are drawn.

2. Modeling of Energy Communities

In the following, we describe the features of the most useful parameters and data for modeling a generic EC while classifying their cardinality to lay the foundations for data platforms. In doing so, we first identified the different quantities and technologies needed for optimizing ECs, such as user load profiles and renewables production. Then, we reviewed the existing literature on RES and extrapolated their most relevant parameters in modeling an EC. Indeed, to the best of the authors’ knowledge, there is no standard data format across ECs. These parameters have been divided by topic, along with a brief description and a summary table. Moreover, contrary to the literature, we also included the classification of technologies and the cardinality of the information to store that are needed when dealing with data formats. Each table includes columns such as the name of the parameter in the proposed data format, and cardinality, representing the dimensionality of the parameter to facilitate specific parsing. If a parameter α has a cardinality of n × m × o , the corresponding data will be organized in a multidimensional matrix of size n × m × o . If  α is absent, the information is considered to be a scalar value. In the following sections, we explain how to represent such a data matrix in the proposed format. Furthermore, there are columns for description, unit, value, and ref, where value reports the range used in the proposed dataset (see Section 3 for further details).

2.1. Generic Parameters

This section provides an overview of the general parameters used to contextualize the subsequent data-driven modeling of all the elements involved in designing ECs. These parameters are provided in Table 1.
The first parameter we considered is the temporal granularity Δ t of all the data, which is needed to capture the variability of renewable sources and load. For example, setting Δ t = 1 means that each consideration about user loads, PV generations, etc., is made every minute.
To avoid handling a massive number of data, such as for every day of the year, it may be advantageous to select a subset of relevant and representative periods within the analyzed time-frame. In this context, T represents the number of intervals considered in the analysis. The starting date and the number of time-steps of every interval t are, respectively, given by S t and D t . For the sake of brevity in the subsequent dissertation, we denote T ¯ as the sum of D t over all intervals: T ¯ = i = 1 T D t .
The generic parameters include the latitude λ and longitude ϕ , expressed in the degree and comma notation, which serve to geolocate the EC.
Furthermore, the number of users/households N in the EC is taken into account. Another crucial aspect in managing an EC is the presence of prosumers among the users. A prosumer refers to an energy user who can act as both a producer and consumer of electricity. Prosumers generate their own energy, typically using renewable sources like solar panels or wind turbines. They have the ability to consume power taken from the grid and, in other hours, feed the network with the electricity they have produced in excess with respect to their own needs. It is important to note that the energy production that a prosumer has self-consumed cannot be considered as part of the energy community. Consequently, it needs to be filtered out or treated separately in the collective energy management of the EC. Thus, the parameter PRn is a boolean vector assigned to each user, with a value of 1 indicating a prosumer and 0 a passive user.
Finally, ρ t represents the electricity price at time t.

2.2. User Load Profiles

Electrical power consumption data and load profiles of household appliances are crucial elements for an EC because they drive the shared energy and consequently the business plan of the EC. Therefore, they are the key elements on which energy management algorithms are developed, such as demand response, whose usage is highly dependent on the social preferences of the household. Despite the fact that demand response mechanisms are already well-diffused in large commercial and industrial customers, the same does not apply to the residential sector [21], where its deployment requires the flexible dispatch of a potentially large number of appliances, such as washing machines, clothes dryers, air conditioners, electric water heaters, electric ovens, dishwashers, and refrigerators. In the following, we detail the major inputs required for energy modeling, of which some parameters, e.g., equivalent costs of demand response, are subjective with regard to the user and may be estimated using surveys or social science analyses [18]. As this paper is focused on energy modeling, other papers may be more suited to the methodologies for estimating that number [11,28].
From an energy modeling perspective, the load profiles of households depend on the usage of their appliances. However, different appliances have different functioning mechanisms that can be classified as fixed, adjustable, and shiftable [29].The different levels of flexibility offered by the different users have specific preferences. The fixed-load category includes appliances whose power consumption is constant and cannot be changed, such as for a fridge with a fixed temperature. In the adjustable-load category, we can find appliances whose operating condition is not fixed, i.e., the power consumption can vary according to the possibility of better ecologically satisfying the load (e.g., the eco-program in modern washers) or the cycle end time can vary according to the instantaneous power consumption, such as for the charge of electrical vehicles (EVs). Finally, the schedulable-load appliances are characterized by the flexibility of starting and ending their working cycle, with a fixed power consumption when they are switched on. Examples are washing machines, dishwashers, and microwaves. Schedulable loads also depend on the willingness of the users to change their preferred time window for using the appliance.
Table 2 resumes the main parameters that can be used to model user load profiles in an EC. The list of parameters start with the number of fixed, adjustable, and shiftable appliances for every user through parameters N f i x , N a d j , and N s h f . Fixed loads are the simplest user-loads from a modeling perspective since the only required parameter is P f i x for each fixed appliance. On the other hand, there are a few parameters involved in the modeling of an adjustable load. The boolean attribute E C O a d j represents the possibility for the considered load to have a more ecological alternative or not. In any case, the minimum and maximum power for satisfying the adjustable load are given by P a d j m i n and P a d j m a x , as well as the starting time S a d j and the maximum duration D a d j . In this way, it is possible to realistically and flexibly model the features of the adjustable load, i.e., according to the specific device and user wills. Regarding the shiftable loads, the consumed power P s h f is fixed but can be satisfied in one of the S time-slots, each one with its starting time S s , duration D s , and considering the duration of the shiftable load D s h f . Some of the most significant social aspects in the study of an EC can be observed precisely in the loads and preferences that users have in resizing or shifting their loads. Therefore, two continuous parameters ranging from 0.0 to 1.0 are introduced for each schedulable and adjustable load for every user [5]. These parameters, denoted as P R F a d j , encapsulate user preferences related to adjustable loads. A value of 0.0 signifies strong opposition towards load reduction, whereas a value of 1.0 indicates enthusiastic agreement to minimize the load as much as possible. On the other hand, P R F s h f represents preferences for shiftable loads and their respective time slots. A score of 0.0 signifies disapproval of the designated time slot, while a score of 1.0 reflects a strong liking for the slot.
In summary, these continuous parameters provide valuable insights into users’ attitudes toward load management and temporal adjustments within the EC, shedding light on the intricate interplay of social dynamics and energy consumption.
We mention a few comprehensive data sources of user load data at an EC level (i.e., household), which have been used to partially or totally fill Table 2. These include data from the study of [21] and a free forum for the public to share their energy usage data developed by the National Renewable Energy Laboratory, Lawrence Berkeley National Laboratory (LBNL), and Argonne National Laboratory [30].
Finally, the work of [31] produced a Matlab tool, which allows one to generate synthetic electricity load profiles of houses using a consumer load model, considering the Stockholm region of Sweden. The user can change select model parameter values and generate data for different time resolutions and periods.
Table 2. User load parameters.
CardinalityDescriptionUnitValueRef
N f i x NNumber of fixed-load appliances-1 *[5]
N a d j NNumber of adjustable-load appliances-1 *[5,32,33,34]
N s h f NNumber of shiftable-load appliances-1 *[5,25]
E C O a d j N × N a d j Boolean attribute of adjustable load (1 if eco available, 0 otherwise)-0 *-
P f i x N × N f i x × T ¯ Fixed load powerW0–5312 *[21]
E a d j N × N a d j × T ¯ Adjustable load required energyWh0–1323 *[35]
P a d j m i n N × N a d j × T ¯ Minimum adjustable load powerW0–4499 *[32,34,35,36]
P a d j m a x N × N a d j × T ¯ Maximum adjustable load powerW0–6087 *[32,34,35,36]
P R F a d j N × N a d j Preference of adjustable load to be reduced - 0.0–1.0 [5]
P s h f N × N s h f Shiftable load powerW800–5200 *[25]
S a d j N × N a d j Starting time of adjustable-loaddate08:00–17:40 *[32,34,36]
D a d j N × N a d j Maximum duration of adjustable loadmin20–180 *[32,34,36]
S N × N s h f Number of time-slots for a shiftable load-1 *[5,25,33]
S s N × N s h f × S Starting time of time-slotdate6:30–19:30 *[5,25,33]
D s N × N s h f × S Duration of time-slot for shiftable loadmin40–450 *[5,25]
D s h f N × N s h f × S Duration of shiftable loadmin10–120 *[5,25]
P R F s h f N × N s h f × S Preference of shiftable load - 0.0-1.0 [5]
* Refers to data sample at https://github.com/dimitri-thomopulos/DASH-EC, accessed on 9 August 2023.

2.3. Photovoltaic Generation Profiles

Photovoltaic systems (PV) are widely used RES in both residential and industrial applications, making them a fundamental technology within an EC. The modeling of PV generation began with the pioneering work of Evans [37] in 1981. Since then, more detailed models have been proposed to address the challenges of accurately capturing PV generation, including the use of metaheuristics to extract precise parameters from the complex and nonlinear characteristics of PV models [38]. This approach has gained significant attention and has proven effective in various scenarios, such as households, communities, and consumer behavior, enabling more accurate predictions of PV generation and the improved management of renewable energy resources. Table 3 summarizes the essential elements used in modeling PV generation.
The list of parameters starts with N P V , which represents the number of available PV models, and  Z P V , indicating the number of installed systems for each PV model.
The power output of PV systems is strongly influenced by solar irradiance, which represents the amount of solar energy received per unit area. As the irradiance increases, the power production of the PV system also tends to rise. This relationship can be attributed to the physical properties of PV cells, which convert sunlight into electrical energy. When the solar irradiance is high, more photons strike the PV cells, leading to the increased generation of electron–hole pairs. Consequently, a greater amount of current is produced, resulting in higher power output. Conversely, when the irradiance is low, fewer photons interact with the PV cells, leading to a reduced generation of electron–hole pairs and a corresponding decrease in power output. Therefore, understanding the correlation between PV power and solar irradiance is crucial for accurately predicting and optimizing the performance of PV systems in various applications. Solar irradiance, in turn, consists of various components and is dependent on solar coordinates and the geometric angles of inclination. These factors contribute to its overall value and determine the amount of solar energy that reaches a specific location.
The solar coordinates, including the altitude and azimuth solar angles α A and α S , describe the position of the sun relative to a given point on the Earth’s surface. These coordinates, along with the geometric angles of inclination, i.e, the tilt and azimuth PV angles β P V and γ P V , play a crucial role in determining the intensity and distribution of solar radiation [49].
As already mentioned, solar irradiance encompasses various components, including beam, diffuse, and reflected irradiance. The global irradiance g i represents the total power per unit area received on a surface and is obtained by summing these three components: beam irradiance b h i , which results from direct solar rays; diffuse irradiance d h i , which arises from scattered sunlight; and reflected irradiance r i , which is the portion of solar radiation reflected off surfaces [40,41].
In the literature, in some cases, the cell temperature or at least the air temperature T e x t is also taken into account to provide a more accurate description of power. Incorporating ambient temperature data provides further insights into the overall thermal conditions that can impact the operation and power generation of the photovoltaic system. Accounting for these temperature factors enhances the accuracy of power modeling and enables a more comprehensive understanding of the performance of solar energy systems [40].
Dimensional data, specifically the length L P V and width W P V of the PV modules, can provide valuable information for system design and implementation. These parameters are valuable for considering spatial constraints and construction limitations.
The effective power produced by the PV system at time t is represented by P P V , which may differ from the nominal power PPV,nom. From an economic perspective, the cost of a PV system typically follows a step-wise trend, with the number of steps defined by n o p P V . Each step is characterized by the power extremes O P P V and incurs a capital expenditure (CAPEX) cost C I P V related to the investment, along with additional maintenance and operating costs C O P V typically amounting to 2–5% of the CAPEX. The expected life of the PV system is given by E L P V .
To estimate the time series of available production by a photovoltaic plant, some simulation tools have been proposed. A notorious example is the photovoltaic geographical information system (PVGIS) [50], developed by the Joint Research Centre of the European Union, which allows users to estimate PV production by selecting or entering the location’s latitude and longitude, along with parameters such as solar radiation database, PV technology, installed peak power, system loss, mounting position, slope, and azimuth. PVGIS provides simulated production data for download or viewing through its webpage. Another popular simulation tool for PV energy production is Renewable Ninja [51]. It enables users to estimate the performance of a PV system by specifying the location, system size, module type, tilt angle, and orientation. The tool utilizes weather data and satellite imagery to generate hourly estimates of energy production for a given location.

2.4. Wind Energy Generation Profiles

Electricity generation can also be obtained from wind turbines. According to [52], wind turbines are capable of converting the kinetic energy of wind into electrical energy. Comprising essential components such as the rotor, blades, hub, nacelle, and tower, wind turbines facilitate the capture and conversion of wind energy. The rotor and blades efficiently capture the wind’s kinetic energy and convert it into rotational energy, which is subsequently transferred to a generator housed within the nacelle. Additionally, the nacelle incorporates a control system responsible for ensuring the turbine’s optimal and safe operation.
Table 4 resumes the usable elements that are used for predicting wind generation in a certain zone.
In the modeling of wind turbine generation, a set of parameters plays a crucial role. These parameters include N w t , denoting the number of available wind turbine models, and  T w t , indicating the number of installed wind turbines for each model.
Extensive research, as documented by [52,53,54], has highlighted several key factors influencing wind turbine energy production. These factors encompass the horizontal and vertical components of wind speed, represented by U g r d and V g r d , respectively. In a typical Cartesian coordinate system, the  U g r d component represents the wind speed along the x-axis or the east–west direction. On the other hand, the  V g r d component represents the wind speed along the y-axis or the north–south direction. If necessary, the Pythagorean theorem can be used to compute the effective value and direction of the wind speed components.
More sophisticated models consider also the parameters V i n , V o u t , and  V r which play a significant role in characterizing the wind speed and its effects on electricity generation from wind turbines. V i n represents the minimum or cut-in wind speed. It is the threshold wind speed at which a wind turbine starts to generate electricity. Below this value, the turbine may not produce any significant power output. V o u t refers to the maximum or cut-out wind speed. It is the wind speed at which the wind turbine reaches its maximum power output and beyond which the turbine is shut down or curtailed for safety reasons. Operating the turbine at wind speeds higher than V o u t may cause excessive stress on the turbine components. V r denotes the reference wind speed. It is typically a design parameter specific to a particular wind turbine model or site. The reference wind speed represents the wind speed at which the turbine is designed to achieve its nominal or rated power output. It serves as a reference point for wind turbine performance evaluation and power curve characterization. These parameters, namely, V i n , V o u t , and  V r , help define the operational range and performance characteristics of a wind turbine. They contribute to determining the start-up, maximum power, and shutdown conditions, ensuring the turbine operates efficiently and safely within specified wind speed ranges.
In some cases, non-linear curves with a few multiplicative coefficients, typically not exceeding 6, are also proposed in the literature. These parameters are often extracted from empirical tests. Therefore, six wind power coefficients ( a , b , c , d , e , f ) are considered sufficient to cover most of the functional forms commonly used in wind power modeling.
Notably, the effective power output at time t is indicated by P w t , which may deviate from the nominal power Pwt,nom under low wind speed conditions.
It is also crucial to consider the generation of noise D B w t during wind turbine operation, particularly within the context of ECs. Noise emissions can potentially pose risks or discomfort to individuals, necessitating thorough examination and mitigation strategies.
Economically, the cost structure of wind turbine systems exhibits a step-wise trend, wherein n o p w t defines the number of steps. Each step encompasses specific power extremes O P w t and incurs CAPEX costs C I w t related to initial investments, as well as maintenance and operating expenses C O w t . The projected lifespan of a wind turbine system is denoted by E L w t .
It is worth mentioning that simulation tools have been developed to estimate the time-series of renewable production by wind, which can be used to feed EC planning tools. The first one is Wunderground [57], also known as Weather Underground, a popular online weather service that provides various meteorological information and forecasts. It collects weather data from a wide range of sources, including weather stations, personal weather stations, and meteorological organizations. Another one is Renewable Ninja [51], an online renewable energy assessment tool that provides data and analytics for various renewable energy resources, including wind energy. It offers insights into the wind potential of specific locations and helps assess the feasibility of wind energy projects. Finally, we cite AEOLIAN [58], an Italian web-based service that aims to provide accurate and reliable wind resource data for the Italian territory. It offers a database accessible through a user-friendly WebGIS tool, providing info on the general distribution of wind resources across Italy and helps identify areas suitable for wind energy exploitation.

2.5. Hydro-Electric

Hydroelectric power plants, specifically “run-of-river” systems, are a renewable energy technology that harnesses the kinetic energy of flowing water to generate electricity.
Table 5 summarizes the essential elements used in modeling hydro-electric generation.
In the context of ECs, the modeling of hydro-turbines involves considering the number of available hydro-turbine models, denoted as N h y d r o , along with their respective installations within the community, represented by Z h y d r o . The effective hydropower output, denoted as P h y d r o , may deviate from the nominal power, Phydro,nom, and is influenced by factors such as the effective flow rate, Q h y d r o , and the minimum and maximum working flow rates, Q h y d r o , m i n and Q h y d r o , m a x , respectively. Additionally, the net head height, H h y d r o , which represents the vertical distance between the water source and the turbine, significantly impacts hydropower generation. The turbine efficiency, denoted as η h y d r o , determines the effectiveness of converting kinetic energy into electrical power.
It is worth noting that run-of-river hydroelectric plants differ from cascade hydro generation. Run-of-river systems operate by utilizing the natural flow of a river without the need for large reservoirs, allowing water to flow freely through the turbine (see, e.g., [59]). On the other hand, cascade hydro generation involves a series of interconnected reservoirs with varying water levels, allowing for better control of water flow and storage (see, e.g., [60]. The choice between these approaches depends on various factors, including the availability of suitable water resources and the specific objectives of the renewable energy community. However, in the case of an energy community, the utilization of a run-of-river system is more plausible.
From an economic perspective, the cost of a hydro turbine system within an EC follows a step-wise trend, where the number of steps is defined by n o p h y d r o . Each step represents different power extremes, O P h y d r o , and incurs a CAPEX cost, C I h y d r o , which includes the initial investment and ongoing maintenance and operating costs, denoted as C O h y d r o . The expected life of the hydro turbine system is given by E L h y d r o .
Tools used for modeling hydro-electric power include HOMER Hydro Module [61] and RETScreen [62], which can be used to provide a comprehensive view by considering technical, financial, and environmental aspects.
Table 5. Hydro turbine parameters.
CardinalityDescriptionUnitValueRef
N h y d r o -Number of available models of hydro-turbines-1 *-
Z h y d r o N h y d r o Number of already installed hydro-turbines-0 *-
Q h y d r o T ¯ Effective flowm 3 /s7.96–69.6 *[59]
Q h y d r o , m i n -Minimum working flowm 3 /s5 *[59]
Q h y d r o , m a x -Maximum working flowm 3 /s30 *[59]
H h y d r o -Net headm14 *[63]
η h y d r o -Efficiency-70 *[63]
P h y d r o T × N h y d r o Effective hydro powerkW0.08–0.30 *[59]
Phydro,nom-Nominal powerkW0.3 *[64]
n o p h y d r o -Number of extremes of a scale cost function-5 *[64]
O P h y d r o n o p h y d r o Power extremes of a scale cost functionkW500 − > 10,000[64]
C I h y d r o n o p h y d r o Basically CAPEX cost€ / kW2300–6000[46,64]
C O h y d r o N h y d r o Annual operating cost per P w t € / kW34.5–90[65]
E L h y d r o -Expected lifeyears25 *[66]
* Refers to data sample at https://github.com/dimitri-thomopulos/DASH-EC, accessed on 9 August 2023.

2.6. Battery Energy Storage System Features

Battery Energy Storage Systems (BESS) are critical for the integration of renewable energy into the grid, and Lithium–ion (Li-ion) batteries are commonly used due to their high energy density, simple working principle, and decreasing costs. Among them, lithium–iron–phosphate (LiFePO 4 ) batteries are gaining popularity due to their higher stability, lower specific costs, and longer lifespan. Several studies include BESS modeling, but there is no standard approach. Five main types of BESS models are identified: ideal, charging/discharging efficiency, charging/discharging and self-discharging efficiency, degradation, and the simulation tool. Many studies limit their analysis to charging and discharging efficiencies, with only a few considering the self-discharging process or battery degradation. Further research is needed to integrate degradation phenomena in long-term studies [15,67,68,69,70].
Table 6 summarizes the essential elements used in modeling BESS usage in ECs.
Such table starts with N b s which is the number of available models of BESS and B b s , which indicates, for each model, the number of already installed BESS. According to the literature [71,72], the main features that influence the power modeling of BESS are the self-discharge, charge, and discharge coefficients η s l f , η c h , η d c h . The effective charging or discharging power at time t is P c h and P d c h , respectively. Moreover, the knowledge of the initial state of charge S O C 0 is essential to model the subsequent states, knowing also the nominal capacity C b s n . As for the economical aspects, the cost of a BESS is typically given only from its purchase C I b s .

2.7. Heat Pumps

Decarbonizing thermal loads is classically difficult, due to the high requirements of the buildings and the limited number of options compared with solutions for electrical loads [75]; in the literature, this problem is recognized as a bottleneck [76]. Nowadays, the most widespread solution to reduce the fossil-fuel requirements for buildings involves electrically driven heat pumps, which can provide both cooling and heating loads to buildings. Focusing on heating loads, the heat is typically taken from an external source (e.g., outdoor air, ground-source, or water) and released in indoor spaces via a compression cycle using electricity. The most widespread typology of heat pumps is the air-source one, which exchanges energy with external air and provides heating/cooling for building through a thermal exchange with either indoor air or water-based terminal units. Heat exchangers and a vapor compressor are considered as a key technology to link the electric and thermal energy sectors [77]. During the last decades, their electricity-to-heat efficiency, known as COP (coefficient of performance), has increased, enabling the use of less electricity to provide the same thermal outputs. At the same time, their use fosters the exploitation of renewable energy sources: as an example, electrical energy provided by photovoltaic modules can be successfully employed to supply heating/cooling load through the compressor. In this way, it is possible to increase the rate of decarbonization in the building sector, which represents a high share of the final energy consumption. On the other hand, without a proper strategy to reduce electricity-related emissions, the employment of heat pump may not result competitive in the context of building loads, also because of the high operative costs of electrical energy compared with fossil fuels.
Integration of heat pumps in ECs is highly recommended for a twofold reason: they increase the share of self-consumption of electrical energy from RES, and they can also provide a flexible load to manage, avoiding mismatch between production and consumption. An additional increase in flexibility can be reached if thermal storages are used together with heat pumps: in this way, hot water provided during daytime (so when the production of RES is at its maximum) can be stored in thermal energy systems and then used during nighttime. However, there are limits in this flexible behaviour, depending on the thermal comfort experienced by the users. In some pieces of research [78,79], the proper operation of heat pumps has proven to mitigate over-voltage problems due to photovoltaic production.
Table 7 summarizes the essential elements used in modeling heat pumps.
To successfully integrate heat pumps into ECs, it is important to have data on the thermal loads and the efficiency of the heating generators. Thermal loads (both heating and cooling) can be monitored: they strongly depends on envelope characteristics, external climate and users’ preference, so it is not possible to generalize. If a monitoring campaign is not achievable, dynamic simulation tools can be employed (e.g., TRNSYS, EnergyPlus). Then, the dynamic efficiency of the heat pump is also needed, to check the amount of electrical energy to run the compressor and evaluate the rate of self consumption by RES. Also in this case, having monitored data allows one to obtain a good correlation between loads and factors influencing the COP (e.g., temperature lift, capacity ratio).
If these data are not available, it is also possible to use models. Typically, COP can be evaluated using two different methods:
  • Utilizing manufacturers’ data to provide COP at different values of internal and external temperature and capacity ratio. A regression analysis is then performed to assess the system’s performance for each combination of temperature and thermal load;
  • Employing equations specified in technical standards [80,81]. These equations express the COP at full load as the product of the exergetic efficiency of the inverse thermodynamic cycle ( η I I ) and the ideal Carnot efficiency ( C O P i d ). The influence of partial load conditions is evaluated through a reduction factor ( f C R ).
Also the threshold values of operating ranges of heat pump should be known. Generally, heat pumps cannot properly operate at too low external temperatures or too high supply temperatures.
Table 7. Heat pump parameters.
CardinalityDescriptionUnitValueRef
N H P - Number of heat pump models available in the EC-1 *-
Z H P N H P Number of installed heat pumps for each model-1 *-
Q n o m , H N H P Nominal capacity of the heat pump in heating modekW200 *[82,83]
Q n o m , C N H P Nominal capacity of the heat pump in cooling modekW200 *[82,83]
Q H N H P × T ¯ Thermal load provided by the heat pump in heating modekW0–192.3 *[84]
Q C N H P × T ¯ Thermal load provided by the heat pump in cooling modekW0–109.3 *[84]
T ¯ H N H P × T ¯ Supply fluid temperature in heating modeK50 *[85]
T ¯ C N H P × T ¯ Supply fluid temperature in cooling modeK10 *[86]
T e x t T ¯ Ambient temperatureK−1.9–28.9 *[50]
C O P n o m , H N H P Nominal coefficient of performance in heating mode-3.35 *[82,83]
T n o m , H N H P Nominal supply temperature in heating modeK45 *[82,83]
T n o m , e x t N H P Nominal ambient temperature in heating modeK7 *[82]
C O P n o m , C N H P Nominal coefficient of performance in cooling mode-3.51 *[82,83]
T n o m , C N H P Nominal supply temperature in cooling modeK7 *[83]
T n o m , e x t N H P Nominal ambient temperature in cooling modeK35 *[82]
C I H P N H P CAPEX cost€/kW700[45,64]
E L H P -Expected lifeyears15 *[87]
* Refers to data sample at https://github.com/dimitri-thomopulos/DASH-EC, accessed on 9 August 2023.

2.8. Solar Thermal

Solar thermal collectors (also known as solar thermal) are devices converting solar energy into thermal energy, typically for domestic or small-commercial applications [45,64,88]. They are mainly used for space heating and domestic hot water; in some applications, the solar energy collected through them can also be used for cooling services, together with an absorption chiller, or for drying applications [45,64,89]. In this analysis, we focus only on solar collectors for heating and domestic hot water purposes, and for typical civil applications: in other words, we do not consider parabolic collectors, solar furnaces, and solar towers for electricity production. Table 8 summarizes the essential elements used in modeling solar thermal collectors.
In civil applications, flat-type collectors are typically used. They consist of an absorber plate, tubes for the circulating fluid, and a glazing cover. The absorber has specific thermal and optimal properties (high absorptance for solar radiation and low emissivity on infrared wavelength), to maximize the absorbed radiation (both beam and diffuse radiation), which are then transferred to the fluid circulating in the risers. A glazed cover is usually present in the front of the collector, to limit the thermal losses due to convection with ambient air. In mild-hot climates, the glazed cover may be absent.
Another type of solar thermal collector is the evacuated tube collector, which consists of an evacuated cylindrical tube with a heat pipe inserted into it. The use of a vacuum-sealed tube reduces the thermal losses, so this type of collector is characterized by high efficiency and high values of temperature that can be reached by the circulating fluid.
The optimal position for solar thermal depends on the roof where it is installed on. As a general rule of thumb, solar thermal should face south in the north hemisphere, with an inclination of the latitude of the location [90]. Of course, shadowing from other buildings or other orographic obstacles should be avoided.
Solar thermal collectors use either ambient air or water to deliver the thermal load to the building. In the former case, the collector is known as a solar air heater, and in the latter as a solar water heater. The main advantages to use air as heat transfer fluid are: no freezing/boiling problems, lower cost, and absence of expansion vessel. However, as the air heat transfer coefficient is lower than the water one, a higher flow rate is necessary to deliver the same thermal load, with the consequence on the collector surface and electrical energy at the fan. Using air allows one to directly warm up the indoor spaces; a heat exchanger is instead necessary to warm the water within a domestic hot water tank. Solar water heaters, instead, are not often used directly for space heating and domestic water purposes, due to the presence of antifreezing fluids mixed with air. Hot water tanks are used to store the warm water and use it in a following moment for domestic hot water or space heating purposes.
One of the most widespread models to evaluate efficiency of solar thermal has been provided by [90]: it uses the optical properties of the collector, the coefficients related to thermal losses, the ambient temperature, the solar radiation, and the inlet temperature. The presence of a thermal storage should be considered as influencing the overall performance of the system: see also Section 2.9. Also, TRNSYS, RETScreen, and EnergyPlus can be used to evaluate the delivered thermal energy and the efficiency of the solar thermal collectors.
Table 8. Solar thermal parameters.
CardinalityDescriptionUnitValueRef
N S T - Number of solar thermal collectors available in the EC-1 *-
Z S T N S T Number of installed solar thermal collectors for each model-3 *-
A S T N S T Area of installed solar thermal for each modelm 2 2.5 *[82]
β S T N S T Tilt angle of installed solar thermal for each model°30.0 *[91]
γ S T N S T Orientation angle of installed solar thermal for each model°0.0 *[91]
b h i T ¯ Beam irradiance on the horizontalW/m 2 0.0–735 *[50]
d h i T ¯ Diffuse horizontal irradiance on the horizontalW/m 2 0.0–295 *[50]
r i T ¯ Reflected irradiance on the horizontalW/m 2 0.0 *[50]
g i T ¯ Global irradiance on the horizontalW/m 2 0.0–858 *[50]
T e x t T ¯ Ambient temperatureK−1.9–28.9 *[50]
T i n N S T × T ¯ Inlet fluid temperature at each STK13.6–71.5 *[91]
m ˙ N S T × T ¯ Fluid flow rate for each STkg/s0.0–3.3 *[92]
c N S T Specific heat capacity for the circulating fluid in each STkJ/kgK4.19 *[92]
η 0 N S T Optical efficiency of each ST-0.79 *[82]
I A M N S T Incidence angle modifier-0.94 *[82]
α 1 N S T First factor for heat loss correction valueW/m 2 K3.59 *[82]
α 2 N S T Second factor for heat loss correction valueW/m 2 K 2 0.01 *[82]
C I S T N S T CAPEX cost€/collector1200[82]
E L S T -Expected lifeyears15 *[93]
* Refers to data sample at https://github.com/dimitri-thomopulos/DASH-EC, accessed on 9 August 2023.

2.9. Thermal Storage

Thermal energy storage (TES) is an important element for a renewable energy communities as it enables excess heat provided by renewable sources or by heat pumps to be stored for use during times of low energy production. Traditionally, TES has consisted of a large volume of water used to decouple the generation to the load, thus obtaining a double beneficial result: on one hand, this decreases the size of the heating and cooling generators; on the other hand, it exploits periods of low operating cost or high production from RES to meet the loads required in less convenient periods [94].
However, in recent years, the literature has reported many interesting results on various different TES-related topics, e.g., materials, optimal sizing and management. The first way to categorize TES considers the type of heat transfer and the storage material [95,96]:
  • Considering the type of heat transfer, two concepts can be defined:
    -
    Active systems, where the thermal energy is stored using engineering systems, controlling the heat transfer through forced convection and mass flow rate;
    -
    Passive systems, where instead thermal energy is stored through natural convection, without specific control systems;
  • Considering the storage material, two categories can be defined:
    -
    Sensible storage, which is the most common type of storage; among the used materials, the most widespread are water, air, rocks, sand, and building construction materials such as bricks and concrete;
    -
    Latent storage, which consists of materials storing thermal energy through a phase change, usually a solid-liquid phase change; these materials are known as phase change materials (PCMs).
A common application of TES is the integration with solar thermal: in the passive configuration, the thermal storage is closed to the solar collector; it takes advantage of the increasing temperature within the risers to move the warm water in the store. In larger systems, the thermal storage may be situated in other locations, far from the solar collectors, and using pumps to circulate the water. Another typical integration of TES is related to heat pumps: heating energy and cooling energyare provided by the thermal generator during periods with high COPs or high RES production, stored within the TES, and then used during peak loads.
Another novel technology is to use the building core itself as thermal storage [95]: some examples include the use of TES in double skin facades or suspended ceilings, also incorporating thermal activated materials.
The previous analyzed configurations refer to systems to be used on hourly or daily basis (the heat provided during daytime can be used during nighttime). In very large systems, however, it is possible to also store energy on a seasonal basis, exploiting solar energy provided during summer months during the winter period. This type of storage, known as seasonal thermal energy storage, can be used in areas with high building density, such as ECs. Even though various types of thermal storage systems exist, a common characteristic is their utilization of the ground, which allows for the construction of large-sized tanks or volumes. Examples include tank thermal storage, aquifer thermal storage, and borehole thermal storage.
The actual efficiency of a thermal storage within an EC depends on its size and its control; furthermore, the capital costs are factors strongly influencing the feasibility of TES introduction within a grid.
Table 9 summarizes the essential elements used in modeling TES.
The most common parameters used to model thermal storage (and assess its suitability) are the heat capacity of the storage material, its mass, the rate of charge and discharge (in other words, the power available to meet the load), and the temperature difference the storage is subject to. Tools used for modeling thermal storage include TRNSYS, EnergyPlus, and Matlab.

2.10. Combined Cooling, Heating, and Power

Even if they generally use fossil fuels, combined cooling, heating, and power systems (CCHPs) can be successfully integrated within an energy community: the possibility of providing electrical energy together with heating and cooling loads allows for the high overall efficiency of these systems and a strong reduction in carbon dioxide emissions. IEA research [109] has revealed that the global capacity of those systems is estimated to almost double up to 2030.
CCHP systems usually include a power generation unit (e.g., microturbines, internal combustion engines, and fuel cells), often fueled by natural gas; as a byproduct, the heat is recovered and used for many heating applications, even at different temperature levels. If only heating is recovered, these systems are known as combined heating and power (CHP) or cogenerators. The recovered heat can also be used in absorption chiller or heat pump to provide cooling load: these systems are CCHPs.
There are three typical operating modes of a CCHP [88]:
  • The following electrical load: the fuel flow rate is chosen to meet the electrical load; the thermal load provided is partially recovered, depending on the actual users’ requirements; in case of a surplus, the thermal energy is stored or wasted; and in case of a deficit, a backup thermal system is used;
  • The following thermal load: the fuel flow rate is chosen to meet the buildings’ thermal load; the electrical energy is used for the electrical requirement, which involves considering either to sell the surplus to the grid if exceeding the users’ load or purchasing an additional amount of energy from the grid in case of deficit;
  • The base load: the fuel flow rate is chosen to provide a fixed amount of electrical energy and thermal energy, which does not depend on the actual buildings’ load.
Recently, renewable sources have also been used to fuel CCHP systems. As an example, Denmark [110] has increased the ratio of RES used in CHP from 20% to 64% in 30 years, mainly by using biomass. In some other cases, energy from sun or waste recovery is also used. In [111], the authors discuss the advantages of using biomass gasification as a fuel in small-scale CHPs. Among them, the most important one is the possibility of the exploitation of local biomass resources with high efficiency, providing both heating and electrical energy, differently from mere direct combustion, which only provides heating low at a very-low thermal efficiency. In [112], the authors discuss the technoeconomic feasibility assessment of a CHP using municipal solid waste to provide heat and electricity for a university campus. The results shows that a high amount of CO 2 emission can be saved through the use of this CHP.
The assessment of the feasibility of a CHP within a grid is strongly affected by its purchase cost, and the thermal and electrical loads it should meet, at least partially. In an EC, this evaluation is even more important, due to the presence of renewable sources, providing non-programmable energy, which should be used as a priority, then changing the instantaneous share of thermal/electrical energy needed from the buildings. As the cogeneration plant cannot overcome a minimum capacity ratio, the aleatory of RES can reduce the efficiency of CCHP, leading to energy waste or RES curtailment, as recognized by various pieces of research [113,114].
Table 10 summarizes the essential elements used in modeling CCHPs.
The main parameters used to model CCHPs include the provided electrical, the heating and cooling load, the electrical and thermal efficiencies, the level of temperatures the heat is recovered at, the fuel consumption rate, and the capacity factor. Tools used for modeling cogenerators include TRNSYS, EnergyPlus, and HOMER.

2.11. Biomass and Other Thermal Generators

Backup thermal generators should be present in an energy community as it may be impossible or unfeasible to meet the overall thermal loads only with the previously mentioned systems: due to their intermittence and aleatory, solar thermal collectors may provide only a share of the load, especially in the daytime and in summer in the absence of thermal storages; heat pumps may operate in inefficient conditions, or even stop operating in particularly extreme external conditions.
Typical backup generators are boilers, providing heating load by fuel combustion. Nowadays, natural gas is the most widespread fuel used for heating: it represents more than 40% of the heating mix in the European Union and more than 60% in the United States [123]. If used in condensing boilers, efficiency can be around 100%.
However, to reach the goals of CO2 reduction, the heating system should use low-emission fuels. Examples could be: a biomass source, a mixture of natural gas and hydrogen, and a mixture of natural gas and biogas.
Biomass, which is derived from organic materials, can certainly play a role in the context of reducing fossil-fuel use; however, its emission factor is quite high [124]. The direct combustion of biomass is the most widespread process; it contributes to 97% of the biomass use of energy production [125]. The efficiency of biomass boilers is, however, very low; besides, particular technologies are necessary to reduce NOx and SOx during the combustion process [111].
A mixture of natural gas and biogas, which is produced from raw biomass materials, or a mixture of natural gas and hydrogen, known as hydrogen-enriched natural gas, are also considered promising options in the heating sector. In particular, hydrogen can also be produced using renewable energy sources through electrolysis technology. This process is known as power-to-gas: electrical energy from RES is used to split water into hydrogen and oxygen, thus allowing for the injection in the gas grid: it can be used for a heating service, or the pipeline itself can act as an energy buffer [126].
Table 11 summarizes the basic elements used in modeling biomass.
Considering all the possible solutions that can be employed to provide heating, the main parameters include all the features of the fuel: its heating value, its consumption rate, and its efficiency in the combustion process.

2.12. Connection to Energy Networks

The users of the EC are generally connected to the electricity grid, yet other energy networks may apply, e.g., the gas infrastructure. The connection characteristics and the regulation in force may enable trading electricity using institutional markets and/or by means of private agreements within the members of the EC, which can play a role in the overall techno-economic and environmental performances of the community. In Table 12, the major parameters regulating the connection are reviewed and summarized. A number N V of energy networks (usually electricity and gas) may be available to each user, which implies yearly costs due to the type of connection and energy flow. In particular, the type of contract and the maximum capacity of the connection are usually quantized with power values P C V and specific costs O C V . In particular, for each energy network, the construction costs C I V for establishing the connection also apply. The energy flow is generally charged by various fees, the most notable being the purchase π V B and selling π V S prices, also including transport tariffs. Moreover, excise or taxes π V E on consumption apply. In the field of ECs, the so-called reward π V R , awarded to shared energy, applies as well. A Boolean variable N E T V , n is assigned to each user and energy network (set to 1 if the energy network is available, and 0 otherwise).

3. Data Structure for Renewable Energy Communities

Based on the extensive literature analyses and other novel parameters introduced in 
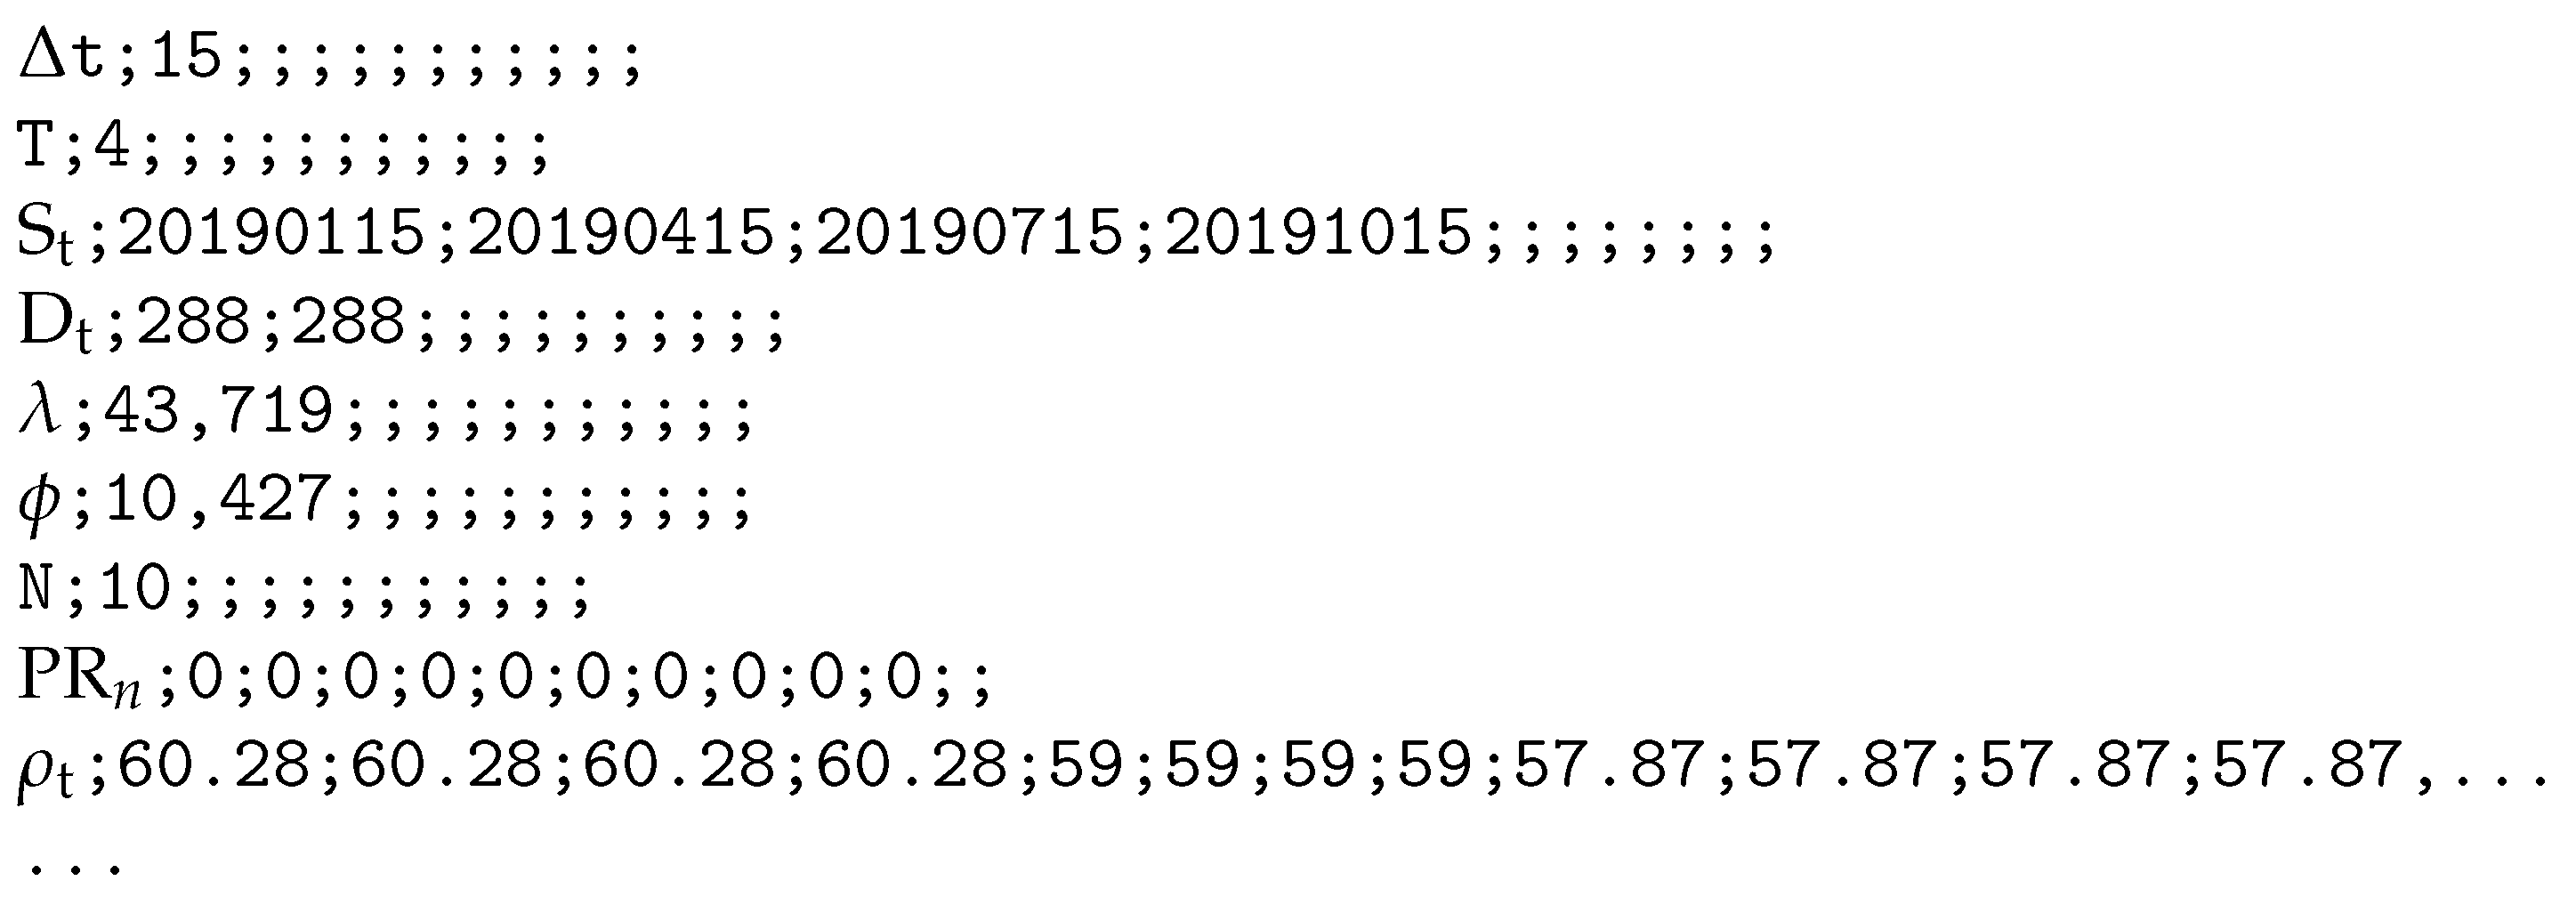
Section 2, in the following we present a proposal of the data structure that captures the major inputs needed for modeling energy communities, including all the various electric and thermal assets involved, with the aim of overcoming the current lack of common data format across ECs. To guarantee the readability of the format by most software, we propose a tabular format as shown in Figure 1 as a CSV file, where the first column and the first row pertaining to a specific data point contain the corresponding data label. This visual arrangement aims to improve the usability and accessibility of data.
The CSV is a very generic, flexible, and accessible file format that enables addressing different data dimensions and cardinalities, wherein the dimensions of the parameters are consistently indicated before the data itself.This versatility is exemplified by its utilization in various fields, as demonstrated in previous works like [132]. In the case of multidimensional matrices, they are projected into two-dimensional matrices. For example, a data set with dimensions of n × m × o will be represented as o matrices of size n × m in the CSV format.
The data format encompasses diverse types of information, where certain details may be missing. Some data may appear redundant as they are interrelated. This design enables the integration of different data sources within a single unified format. In cases where a particular data point is not available, the corresponding element may be replaced with the symbol “-”.
A first dataset with real and realistic data, concerning a potential EC in Pisa and following the presented data format, is available in the GitHub repository https://github.com/dimitri-thomopulos/DASH-EC, accessed on 9 August 2023. The proposed case can be considered representative of the Italian scenario, since, according to the recent national regulation that is being entered in force, users may join and form ECs if they are served by the same primary substation [130]. This highlights the significant number of ECs that may be potentially created, which in turn leads to standardization needs. We mention that some of the proposed data are realistic due to privacy concerns. In these instances, the data have undergone slight manipulation to ensure coherence without compromising privacy rights.
An example with a temporal resolution ( Δ t ) of 15 min and 4 intervals of 3 days and 10 consumers should be formatted as in Figure 1.
Proposing a standardized data format for ECs is crucial for several reasons. Firstly, ECs are a rapidly growing field that encompasses a wide range of stakeholders, including energy providers, consumers, regulators, and researchers. With such diverse participants, having a unified data format becomes essential for seamless communication, efficient collaboration, and accurate analysis.
Secondly, the interdisciplinary nature of EC management poses significant challenges. Integrating various aspects such as energy production, consumption patterns, environmental impacts, and socioeconomic factors requires the harmonization of data from multiple sources. A standardized format would facilitate data collection, aggregation, and comparison, enabling researchers and practitioners to gain deeper insights into the performance and dynamics of ECs.
Additionally, a common data format would enhance the accessibility and usability of EC-related information. By providing a user-friendly platform that aggregates case studies from around the world, stakeholders can easily access valuable data, benchmark performance, and identify best practices. This not only accelerates the development of innovative solutions but also encourages the proliferation of knowledge and information sharing within the EC community.
Moreover, a standardized data format would pave the way for establishing benchmarks and reference points for EC management. By analyzing and comparing data across different communities, researchers and policymakers can identify successful strategies, evaluate the effectiveness of policies, and drive continuous improvement. These benchmarks would serve as valuable resources for developing new problem-solving techniques and enhancing the overall performance and sustainability of ECs.
Therefore, proposing a format for standardized data in renewable energy communities is a crucial step toward fostering collaboration, improving data management, and promoting innovation. By providing a unified platform and benchmarks, this approach can unlock the full potential of ECs, leading to more efficient and effective renewable energy systems on a global scale.
In addition, our vision extends to the future inclusion of this standardized format in widely used file formats such as JSON, as well as in any programming language that demonstrates user-friendly capabilities. By embracing multiple formats and languages, we aim to maximize accessibility and ease of use for stakeholders involved in ECs. This approach acknowledges the diverse backgrounds and preferences of users, enabling them to work with familiar tools and languages while adhering to a unified data format.

4. Conclusions

This paper presents a comprehensive literature-based analysis to identify the major input data for sizing ECs, classify them, and propose a data format template for sharing the needed information, to promote standardization, facilitate data sharing, and fast-forward ECs development. Environmental, social, and economical aspects have been taken into account, providing a comprehensive outlook on ECs that can be useful to several stakeholders, such as researchers and public authorities, to minimize the carbon footprint.
The proposed literature-based analysis highlights that various components covering electricity, thermal, and cooling needs are needed, whose parameterization requires information of different types and sizes, to be captured by data standards. In particular, the cardinality of those data has been extensively reviewed, and the results suggest that tabular-like formats can successfully capture the required needs. However, the format shall be sufficiently flexible to adapt to ECs with various numbers of members, technologies of energy production, types of storage and conversion, energy vectors, and market structures. A template for a numerical case study in Pisa, Italy is also proposed to suggest the suitability of the proposed data format for planning and operation studies. The proposed dataset employs a CSV-format, as an example, and it is largely populated with data derived from measurements.
These findings lay the groundwork for defining standards of data collection and data sharing for ECs and energy systems, which is of utmost importance to facilitate the widespread adoption of decentralized renewable sources. Future works may involve carrying out real case studies exploiting the collection and utilization of data in the presented format, as well as the definition of possible notable instances of data for algorithm benchmarking.

Author Contributions

Conceptualization, D.F. and D.T.; methodology, D.F., D.T., E.G. and E.S.; software, D.T., E.G.; validation, D.P.; formal analysis, D.T. and E.S.; investigation, D.T., E.G., I.M. and E.S.; resources, D.T., I.M. and E.S.; data curation, D.T. and E.G.; writing—original draft preparation, D.T., E.G. and E.S.; writing—review and editing, D.F., D.T., E.G. and D.P.; supervision, D.F., D.T. and D.P.; project administration, M.R., D.F. and D.T.; and funding acquisition, M.R. All authors have read and agreed to the published version of the manuscript.

Funding

The research has been conducted during and with the support of the Italian inter-university PhD course in Sustainable Development and Climate Change (https://www.phd-sdc.it/) and carried out in the framework of the project “AUTENS” (Sustainable Energy Autarky), funded by the University of Pisa, Italy (PRA 2020 programme).

Institutional Review Board Statement

Not applicable.

Data Availability Statement

Data are available on https://github.com/dimitri-thomopulos/DASH-EC, accessed on 9 August 2023.

Conflicts of Interest

The authors declare no conflict of interest.

Abbreviations

The following abbreviations are used in this manuscript:
ECEnergy communities
RECRenewable energy communities
RESRenewable energy systems
PVPhotovoltaic
HPHeat pump
COPCoefficient of performance
STSolar thermal
TESThermal energy storage
CHPCombined heat and power
CCHPCombined cooling, heating, and power
CAPEXPurchase cost

References

  1. Torabi Moghadam, S.; Di Nicoli, M.V.; Manzo, S.; Lombardi, P. Mainstreaming energy communities in the Transition to a Low-Carbon Future: A Methodological Approach. Energies 2020, 13, 1597. [Google Scholar] [CrossRef]
  2. Mutani, G.; Santantonio, S.; Beltramino, S. Indicators and representation tools to measure the technical-economic feasibility of a renewable energy community. The case study of villar pellice (italy). Int. J. Sustain. Dev. Plan. 2021, 16, 1–11. [Google Scholar] [CrossRef]
  3. Rathnayaka, A.; Potdar, V.; Dillon, T.; Kuruppu, S. Framework to manage multiple goals in community-based energy sharing network in smart grid. Int. J. Electr. Power Energy Syst. 2015, 73, 615–624. [Google Scholar] [CrossRef]
  4. Fioriti, D.; Frangioni, A.; Poli, D. Optimal sizing of energy communities with fair revenue sharing and exit clauses: Value, role and business model of aggregators and users. Appl. Energy 2021, 299, 117328. [Google Scholar] [CrossRef]
  5. Mariuzzo, I.; Fioriti, D.; Guerrazzi, E.; Thomopulos, D. International Journal of Electrical Power and Energy Systems Multi-objective planning method for renewable energy communities with economic, environmental and social goals. Int. J. Electr. Power Energy Syst. 2023, 153, 109331. [Google Scholar] [CrossRef]
  6. Lowitzsch, J.; Hoicka, C.E.; van Tulder, F.J. renewable energy communities under the 2019 European Clean Energy Package – Governance model for the energy clusters of the future? Renew. Sustain. Energy Rev. 2020, 122, 109489. [Google Scholar] [CrossRef]
  7. Directive (EU) 2018/2001 of the European Parliament and of the Council on the promotion of the use of energy from renewable sources. Off. J. Eur. Union 2018, 2018, 82–209.
  8. European Parliament; Council of the European Union. Directive (EU) 2019/944 on Common Rules for the Internal Market for Electricity and Amending Directive 2012/27/EU. Off. J. Eur. Union 2019, 2019. Available online: http://data.europa.eu/eli/dir/2019/944/oj (accessed on 9 August 2023).
  9. Ambole, A.; Koranteng, K.; Njoroge, P.; Luhangala, D.L. A Review of energy communities in Sub-Saharan Africa as a Transition Pathway to Energy Democracy. Sustainability 2021, 13, 2128. [Google Scholar] [CrossRef]
  10. Hampl, N. Equitable energy transition in Latin America and the Caribbean: Reducing inequity by building capacity. Renew. Sustain. Energy Transit. 2022, 2, 100035. [Google Scholar] [CrossRef]
  11. Gjorgievski, V.Z.; Cundeva, S.; Georghiou, G.E. Social arrangements, technical designs and impacts of energy communities: A review. Renew. Energy 2021, 169, 1138–1156. [Google Scholar] [CrossRef]
  12. Ye, G.; Li, G.; Wu, D.; Chen, X.; Zhou, Y. Towards cost minimization with renewable energy sharing in cooperative residential communities. IEEE Access 2017, 5, 11688–11699. [Google Scholar] [CrossRef]
  13. Moncecchi, M.; Meneghello, S.; Merlo, M. A Game Theoretic Approach for Energy Sharing in the Italian renewable energy communities. Appl. Sci. 2020, 10, 8166. [Google Scholar] [CrossRef]
  14. Cosic, A.; Stadler, M.; Mansoor, M.; Zellinger, M. Mixed-integer linear programming based optimization strategies for renewable energy communities. Energy 2021, 237, 121559. [Google Scholar] [CrossRef]
  15. Norbu, S.; Couraud, B.; Robu, V.; Andoni, M.; Flynn, D. modeling the redistribution of benefits from joint investments in community energy projects. Appl. Energy 2021, 287. [Google Scholar] [CrossRef]
  16. Fleischhacker, A.; Lettner, G.; Schwabeneder, D.; Auer, H. Portfolio optimization of energy communities to meet reductions in costs and emissions. Energy 2019, 173, 1092–1105. [Google Scholar] [CrossRef]
  17. Ebrahimi, M. Storing electricity as thermal energy at community level for demand side management. Energy 2020, 193, 116755. [Google Scholar] [CrossRef]
  18. De Vizia, C.; Patti, E.; MacIi, E.; Bottaccioli, L. A User-Centric View of a Demand Side Management Program: From Surveys to Simulation and Analysis. IEEE Syst. J. 2022, 16, 1885–1896. [Google Scholar] [CrossRef]
  19. Berg, K.; Löschenbrand, M. A data set of a Norwegian energy community. Data Brief 2022, 40, 116755. [Google Scholar] [CrossRef]
  20. Kazmi, H.; Munné-Collado, Í.; Mehmood, F.; Syed, T.; Driesen, J. Towards data-driven energy communities: A review of open-source datasets, models and tools. Renew. Sustain. Energy Rev. 2021, 148, 111290. [Google Scholar] [CrossRef]
  21. Pipattanasomporn, M.; Kuzlu, M.; Rahman, S.; Teklu, Y. Load profiles of selected major household appliances and their demand response opportunities. IEEE Trans. Smart Grid 2014, 5, 742–750. [Google Scholar] [CrossRef]
  22. Goncalves, C.; Barreto, R.; Faria, P.; Gomes, L.; Vale, Z. energy community Consumption and Generation Dataset with Appliance Allocation. IFAC-PapersOnLine 2022, 55, 285–290. [Google Scholar] [CrossRef]
  23. Setlhaolo, D.; Xia, X.; Zhang, J. Optimal scheduling of household appliances for demand response. Electr. Power Syst. Res. 2014, 116, 24–28. [Google Scholar] [CrossRef]
  24. Moret, F.; Pinson, P. Energy Collectives: A Community and Fairness Based Approach to Future Electricity Markets. IEEE Trans. Power Syst. 2019, 34, 3994–4004. [Google Scholar] [CrossRef]
  25. Nazemi, S.D.; Jafari, M.A.; Zaidan, E. An incentive-based optimization approach for load scheduling problem in smart building communities. Buildings 2021, 11, 237. [Google Scholar] [CrossRef]
  26. ur Rehman, H.; Reda, F.; Paiho, S.; Hasan, A. Towards positive energy communities at high latitudes. Energy Convers. Manag. 2019, 196, 175–195. [Google Scholar] [CrossRef]
  27. Cielo, A.; Margiaria, P.; Lazzeroni, P.; Mariuzzo, I.; Repetto, M. renewable energy communities business models under the 2020 Italian regulation. J. Clean. Prod. 2021, 316, 128217. [Google Scholar] [CrossRef]
  28. Bielig, M.; Kacperski, C.; Kutzner, F.; Klingert, S. Evidence behind the narrative: Critically reviewing the social impact of energy communities in Europe. Energy Res. Soc. Sci. 2022, 94, 102859. [Google Scholar] [CrossRef]
  29. Gatsis, N.; Giannakis, G.B. Cooperative multi-residence demand response scheduling. In Proceedings of the 2011 45th Annual Conference on Information Sciences and Systems, CISS 2011, Baltimore, MD, USA, 23–25 March 2011; pp. 1–6. [Google Scholar] [CrossRef]
  30. National Renewable Energy Laboratory. End-Use Load Profiles for the U.S. Building Stock; National Renewable Energy Laboratory: Golden, CO, USA, 2023. [Google Scholar]
  31. Broden, D.A.; Paridari, K.; Nordstrom, L. Matlab applications to generate synthetic electricity load profiles of office buildings and detached houses. In Proceedings of the 2017 IEEE Innovative Smart Grid Technologies—Asia: Smart Grid for Smart Community, ISGT-Asia 2017, Auckland, New Zealand, 4–7 December 2017; pp. 1–6. [Google Scholar] [CrossRef]
  32. Entriken, R.; Hu, R.L.; Skorupski, R.; Ye, Y. A Mathematical Formulation for Optimal Load Shifting of Electricity Demand. IEEE Trans. Smart Grid 2015, 6, 1–46. [Google Scholar]
  33. Qayyum, F.A.; Naeem, M.; Khwaja, A.S.; Anpalagan, A.; Guan, L.; Venkatesh, B. Appliance Scheduling Optimization in Smart Home Networks. IEEE Access 2015, 3, 2176–2190. [Google Scholar] [CrossRef]
  34. van Leeuwen, G.; AlSkaif, T.; Gibescu, M.; van Sark, W. An integrated blockchain-based energy management platform with bilateral trading for microgrid communities. Appl. Energy 2020, 263, 114613. [Google Scholar] [CrossRef]
  35. Gatsis, N.; Giannakis, G.B. Residential demand response with interruptible tasks: Duality and algorithms. In Proceedings of the 2011 50th IEEE Conference on Decision and Control and European Control Conference, Orlando, FL, USA, 12–15 December 2011; pp. 1–6. [Google Scholar] [CrossRef]
  36. Althaher, S.; Mancarella, P.; Mutale, J. Automated Demand Response From Home Energy Management System Under Dynamic Pricing and Power and Comfort Constraints. IEEE Trans. Smart Grid 2015, 6, 1874–1883. [Google Scholar] [CrossRef]
  37. Evans, D.L. Simplified method for predicting photovoltaic array output. Sol. Energy 1981, 27, 555–560. [Google Scholar] [CrossRef]
  38. Gu, Z.; Xiong, G.; Fu, X. Parameter Extraction of Solar Photovoltaic Cell and Module Models with Metaheuristic Algorithms: A Review. Sustainability 2023, 15, 3312. [Google Scholar] [CrossRef]
  39. Božiková, M.; Bilčík, M.; Madola, V.; Szabóová, T.; Kubík, Ľ.; Lendelová, J.; Cviklovič, V. The effect of azimuth and tilt angle changes on the energy balance of photovoltaic system installed in the southern slovakia region. Appl. Sci. 2021, 11, 8998. [Google Scholar] [CrossRef]
  40. Huld, T.; Müller, R.; Gambardella, A. A new solar radiation database for estimating PV performance in Europe and Africa. Sol. Energy 2012, 86, 1803–1815. [Google Scholar] [CrossRef]
  41. Huld, T.; Gracia Amillo, A.M. Estimating PV module performance over large geographical regions: The role of irradiance, air temperature, wind speed and solar spectrum. Energies 2015, 8, 5159–5181. [Google Scholar] [CrossRef]
  42. Rojasri, K.; Deepak, A.; Sreedevi, D. Simulation and Comparison of Current-Voltage characteristics of Photovoltaic cells by varying Panel Length and Width for Green Energy. In Proceedings of the 14th International Conference on Mathematics, Actuarial Science, Computer Science and Statistics, MACS 2022, Karachi, Pakistan, 12–13 November 2022; pp. 1–4. [Google Scholar] [CrossRef]
  43. Li, C.; Cai, W.; Luo, H.; Zhang, Q. Power utilization strategy in smart residential community using non-cooperative game considering customer satisfaction and interaction. Electr. Power Syst. Res. 2019, 166, 178–189. [Google Scholar] [CrossRef]
  44. Di Lorenzo, G.; Rotondo, S.; Araneo, R.; Petrone, G.; Martirano, L. Innovative power-sharing model for buildings and energy communities. Renew. Energy 2021, 172, 1087–1102. [Google Scholar] [CrossRef]
  45. EN 15459-1:2017; Energy performance of buildings—Economic evaluation procedure for energy systems in buildings—Part 1: Calculation procedures, Module M1-14. European Committee for Standardization (CEN): Brussels, Belgium, 2017.
  46. Xiao, M.; Junne, T.; Haas, J.; Klein, M. Plummeting costs of renewables—Are energy scenarios lagging? Energy Strategy Rev. 2021, 35, 100636. [Google Scholar] [CrossRef]
  47. Lu, Y.; Khan, Z.; Gunduz, H.; Wang, W.; Li, J.; Zhang, X.P. Economic Performance of Net-Zero energy community under Reward-Penalty Mechanism Considering PV System Reliability. Environ. Clim. Technol. 2019, 23, 26–42. [Google Scholar] [CrossRef]
  48. Fthenakis, V.M.; Kim, H.C. Photovoltaics: Life-cycle analyses. Sol. Energy 2011, 85, 1609–1628. [Google Scholar] [CrossRef]
  49. Bukovszki, V.; Magyari, Á.; Braun, M.; Párdi, K.; Reith, A. Energy modeling as a trigger for energy communities: A joint socio-technical perspective. Energies 2020, 13, 2274. [Google Scholar] [CrossRef]
  50. European Commission. Photovoltaic Geographical Information System; European Commission: Brussels, Belgium, 2023. [Google Scholar]
  51. Pfenninger, S.; Staffel, I. Renewables.ninja. Available online: https://www.renewables.ninja/ (accessed on 9 August 2023).
  52. Burton, T.; Jenkins, N.; Sharpe, D.; Bossanyi, E. Wind Energy Handbook; Wiley: Hoboken, NJ, USA, 2002. [Google Scholar]
  53. Moschella, M.; Tucci, M.; Crisostomi, E.; Betti, A. A Machine Learning Model for Long-Term Power Generation Forecasting at Bidding Zone Level. In Proceedings of the 2019 IEEE PES Innovative Smart Grid Technologies Europe, ISGT-Europe 2019, Bucharest, Romania, 29 September–2 October 2019. [Google Scholar] [CrossRef]
  54. Paish, O. Small hydro power: Technology and current status. Renew. Sustain. Energy Rev. 2002, 6, 537–556. [Google Scholar] [CrossRef]
  55. Yamani Douzi Sorkhabi, S.; Romero, D.A.; Yan, G.K.; Gu, M.D.; Moran, J.; Morgenroth, M.; Amon, C.H. The impact of land use constraints in multi-objective energy-noise wind farm layout optimization. Renew. Energy 2016, 85, 359–370. [Google Scholar] [CrossRef]
  56. Ortegon, K.; Nies, L.F.; Sutherland, J.W. Preparing for end of service life of wind turbines. J. Clean. Prod. 2013, 39, 191–199. [Google Scholar] [CrossRef]
  57. The Weather Company. Wunderground. Available online: https://www.wunderground.com/ (accessed on 9 August 2023).
  58. Ricerca Sistema Energetico S.p.A. Atlante EOLico ItaliANo. Available online: http://atlanteeolico.rse-web.it/ (accessed on 9 August 2023).
  59. Tsuanyo, D.; Amougou, B.; Aziz, A.; Nka Nnomo, B.; Fioriti, D.; Kenfack, J. Design models for small run-of-river hydropower plants: A review. Sustain. Energy Res. 2023, 10, 1–23. [Google Scholar] [CrossRef]
  60. van Ackooij, W.; D’Ambrosio, C.; Thomopulos, D.; Trindade, R.S. Decomposition and shortest path problem formulation for solving the hydro unit commitment and scheduling in a hydro valley. Eur. J. Oper. Res. 2021, 291, 935–943. [Google Scholar] [CrossRef]
  61. Homer Energy.HOMER Pro: Hydro Module. Available online: https://www.homerenergy.com/index.html (accessed on 9 August 2023).
  62. Canada Government. RETScreen® Clean Energy Management Software. Available online: https://natural-resources.canada.ca/maps-tools-and-publications/tools/modelling-tools/retscreen/7465 (accessed on 9 August 2023).
  63. Orehounig, K.; Mavromatidis, G.; Evins, R.; Dorer, V.; Carmeliet, J. Towards an energy sustainable community: An energy system analysis for a village in Switzerland. Energy Build. 2014, 84, 277–286. [Google Scholar] [CrossRef]
  64. Politecnico di Milano. Reneable Energy Report; Technical Report; Politecnico di Milano: Milan, Italy, 2018. [Google Scholar]
  65. Singh, V.K.; Singal, S.K. Analysis for operation cost of run of river SHP schemes. ISH J. Hydraul. Eng. 2022, 28, 125–130. [Google Scholar] [CrossRef]
  66. Atlason, R.S.; Unnthorsson, R. Energy return on investment of hydroelectric power generation calculated using a standardised methodology. Renew. Energy 2014, 66, 364–370. [Google Scholar] [CrossRef]
  67. Pimm, A.J.; Palczewski, J.; Morris, R.; Cockerill, T.T.; Taylor, P.G. Community energy storage: A case study in the UK using a linear programming method. Energy Convers. Manag. 2020, 205, 112388. [Google Scholar] [CrossRef]
  68. Cao, W.; Xiao, J.W.; Cui, S.C.; Liu, X.K. An efficient and economical storage and energy sharing model for multiple multi-energy microgrids. Energy 2022, 244, 123124. [Google Scholar] [CrossRef]
  69. Wu, C.; Zhou, D.; Lin, X.; Wei, F.; Chen, C.; Ma, Y.; Huang, Y.; Li, Z.; Dawoud, S.M. A novel energy cooperation framework for community energy storage systems and prosumers. Int. J. Electr. Power Energy Syst. 2022, 134, 107428. [Google Scholar] [CrossRef]
  70. Xiao, J.W.; Yang, Y.B.; Cui, S.; Liu, X.K. A new energy storage sharing framework with regard to both storage capacity and power capacity. Appl. Energy 2022, 307, 118171. [Google Scholar] [CrossRef]
  71. Hoickaa, C.E.; MacArthur, J.L. From tip to toes: Mapping community energy models in Canada and New Zealand. Energy Policy 2018, 121, 162–174. [Google Scholar] [CrossRef]
  72. Guo, J.; Zhang, P.; Wu, D.; Liu, Z.; Liu, X.; Zhang, S.; Yang, X.; Ge, H. Multi-objective optimization design and multi-attribute decision-making method of a distributed energy system based on nearly zero-energy community load forecasting. Energy 2021, 239, 122124. [Google Scholar] [CrossRef]
  73. Marchi, B.; Pasetti, M.; Zanoni, S. Life Cycle Cost Analysis for BESS Optimal Sizing. Energy Procedia 2017, 113, 127–134. [Google Scholar] [CrossRef]
  74. Long, C.; Wu, J.; Zhou, Y.; Jenkins, N. Peer-to-peer energy sharing through a two-stage aggregated battery control in a community Microgrid. Appl. Energy 2018, 226, 261–276. [Google Scholar] [CrossRef]
  75. Wang, Y.; Wang, J.; He, W. Development of efficient, flexible and affordable heat pumps for supporting heat and power decarbonisation in the UK and beyond: Review and perspectives. Renew. Sustain. Energy Rev. 2022, 154, 111747. [Google Scholar] [CrossRef]
  76. Madurai Elavarasan, R.; Pugazhendhi, R.; Irfan, M.; Mihet-Popa, L.; Khan, I.A.; Campana, P.E. State-of-the-art sustainable approaches for deeper decarbonization in Europe – An endowment to climate neutral vision. Renew. Sustain. Energy Rev. 2022, 159, 112204. [Google Scholar] [CrossRef]
  77. Fischer, D.; Madani, H. On heat pumps in smart grids: A review. Renew. Sustain. Energy Rev. 2017, 70, 342–357. [Google Scholar] [CrossRef]
  78. Brunner, M.; Rudion, K.; Tenbohlen, S. PV curtailment reduction with smart homes and heat pumps. In Proceedings of the 2016 IEEE International Energy Conference, ENERGYCON 2016, Leuven, Belgium, 4–8 April 2016; pp. 1–6. [Google Scholar] [CrossRef]
  79. Dallmer-Zerbe, K.; Fischer, D.; Biener, W.; Wille-Haussmann, B.; Wittwer, C. Droop controlled operation of heat pumps on clustered distribution grids with high PV penetration. In Proceedings of the 2016 IEEE International Energy Conference, ENERGYCON 2016, Leuven, Belgium, 4–8 April 2016. [Google Scholar] [CrossRef]
  80. EN 15316-4-2:2017; European Committee for the Standardization (Cen) Heating Systems in Buildings-Method for Calculation of System Energy Requirements and System Efficiencies-Part 4-2: Space Heating Generation Systems, Heat Pump Systems Heizsysteme in GebäUden-Rechenmethode FüR Den Energiebedarf UND Die Systemeffizienz-Tei. European Committee for Standardization (CEN): Brussels, Belgium, 2017; pp. 1–103.
  81. EN 14825:2018; European Committee for the Standardization (Cen) Air Conditioners, Liquid Chilling Packages and Heat Pumps, with Electrically Driven Compressors, for Space Heating and Cooling—Testing and Rating at Part Load Conditions and Calculation of Seasonal Performance. European Committee for Standardization (CEN): Brussels, Belgium, 2018.
  82. European Committee for Standardization (CEN). CEN Keymark. Available online: https://www.cencenelec.eu/about-cen/keymark/ (accessed on 13 June 2023).
  83. European Commission. EPREL—European Product Registry for Energy Labelling. Available online: https://eprel.ec.europa.eu/screen/home (accessed on 3 July 2023).
  84. Martins, N.R.; Bourne–Webb, P.J. Providing renewable cooling in an office building with a Ground–Source heat pump system hybridized with natural ventilation & personal comfort systems. Energy Build. 2022, 261, 111982. [Google Scholar] [CrossRef]
  85. Arabkoohsar, A.; Khosravi, M.; Alsagri, A.S. CFD analysis of triple-pipes for a district heating system with two simultaneous supply temperatures. Int. J. Heat Mass Transf. 2019, 141, 432–443. [Google Scholar] [CrossRef]
  86. Liang, C.; Wang, Y.; Li, X. Energy-efficient air conditioning system using a three-fluid heat exchanger for simultaneous temperature and humidity control. Energy Convers. Manag. 2022, 270, 116236. [Google Scholar] [CrossRef]
  87. IEA. Are Renewable Heating Options Cost-Competitive with Fossil Fuels in the Residential Sector? IEA: Paris, France, 2021. [Google Scholar]
  88. Zhang, T.; Yang, H. High Efficiency Plants and Building Integrated Renewable Energy Systems: Building-Integrated Photovoltaics (BIPV); Elsevier: Amsterdam, The Netherlands, 2018; pp. 441–595. [Google Scholar] [CrossRef]
  89. Park, S.R.; Pandey, A.K.; Tyagi, V.V.; Tyagi, S.K. Energy and exergy analysis of typical renewable energy systems. Renew. Sustain. Energy Rev. 2014, 30, 105–123. [Google Scholar] [CrossRef]
  90. Kalogirou, S.A. Solar Thermal Collectors and Applications. Prog. Energy Combust. Sci. 2004, 30, 231–295. [Google Scholar] [CrossRef]
  91. Tang, R.; Yang, Y.; Gao, W. Comparative studies on thermal performance of water-in-glass evacuated tube solar water heaters with different collector tilt-angles. Sol. Energy 2011, 85, 1381–1389. [Google Scholar] [CrossRef]
  92. Tiwari, A.; Dubey, S.; Sandhu, G.S.; Sodha, M.S.; Anwar, S.I. Exergy analysis of integrated photovoltaic thermal solar water heater under constant flow rate and constant collection temperature modes. Appl. Energy 2009, 86, 2592–2597. [Google Scholar] [CrossRef]
  93. Boerema, N.; Morrison, G.; Taylor, R.; Rosengarten, G. High temperature solar thermal central-receiver billboard design. Sol. Energy 2013, 97, 356–368. [Google Scholar] [CrossRef]
  94. Balaras, C.A.; Dascalaki, E.G. Energy Efficiency in Building Renovation; Elsevier: Amsterdam, The Netherlands, 2018; pp. 675–810. [Google Scholar] [CrossRef]
  95. Navarro, L.; de Gracia, A.; Colclough, S.; Browne, M.; McCormack, S.J.; Griffiths, P.; Cabeza, L.F. Thermal energy storage in building integrated thermal systems: A review. Part 1. active storage systems. Renew. Energy 2016, 88, 526–547. [Google Scholar] [CrossRef]
  96. Navarro, L.; de Gracia, A.; Niall, D.; Castell, A.; Browne, M.; McCormack, S.J.; Griffiths, P.; Cabeza, L.F. Thermal energy storage in building integrated thermal systems: A review. Part 2. Integration as passive system. Renew. Energy 2016, 85, 1334–1356. [Google Scholar] [CrossRef]
  97. Sarbu, I.; Sebarchievici, C. A Comprehensive Review of Thermal Energy Storage. Sustainability 2018, 10, 191. [Google Scholar] [CrossRef]
  98. Alva, G.; Lin, Y.; Fang, G. An overview of thermal energy storage systems. Energy 2018, 144, 341–378. [Google Scholar] [CrossRef]
  99. Urbanucci, L.; D’Ettorre, F.; Testi, D. A comprehensive methodology for the integrated optimal sizing and operation of cogeneration systems with thermal energy storage. Energies 2019, 12, 875. [Google Scholar] [CrossRef]
  100. Brosseau, D.; Kelton, J.W.; Ray, D.; Edgar, M.; Chisman, K.; Emms, B. Testing of Thermocline Filler Materials and Molten-Salt Heat Transfer Fluids for Thermal Energy Storage Systems in Parabolic Trough Power Plants. J. Sol. Energy Eng. 2005, 127, 109–116. [Google Scholar] [CrossRef]
  101. Jouhara, H.; Żabnieńska-Góra, A.; Khordehgah, N.; Ahmad, D.; Lipinski, T. Latent thermal energy storage technologies and applications: A review. Int. J. Thermofluids 2020, 5–6, 100039. [Google Scholar] [CrossRef]
  102. Huang, M.J.; Eames, P.C.; Norton, B. Thermal regulation of building-integrated photovoltaics using phase change materials. Int. J. Heat Mass Transf. 2004, 47, 2715–2733. [Google Scholar] [CrossRef]
  103. Sakurai, M.; Bilgen, E.; Tsutsumi, A.; Yoshida, K. Solar UT-3 thermochemical cycle for hydrogen production. Sol. Energy 1996, 57, 51–58. [Google Scholar] [CrossRef]
  104. Erek, A.; Dincer, I. Numerical heat transfer analysis of encapsulated ice thermal energy storage system with variable heat transfer coefficient in downstream. Int. J. Heat Mass Transf. 2009, 52, 851–859. [Google Scholar] [CrossRef]
  105. Torregrosa-Jaime, B.; López-Navarro, A.; Corberán, J.M.; Esteban-Matías, J.C.; Klinkner, L.; Payá, J. Experimental analysis of a paraffin-based cold storage tank. Int. J. Refrig. 2013, 36, 1632–1640. [Google Scholar] [CrossRef]
  106. Aloini, D.; Dulmin, R.; Mininno, V.; Raugi, M.; Schito, E.; Testi, D.; Tucci, M.; Zerbino, P. A multi-objective methodology for evaluating the investment in building-integrated hybrid renewable energy systems. J. Clean. Prod. 2021, 329, 129780. [Google Scholar] [CrossRef]
  107. Celsius City. Thermal Energy Storage. 2020. Available online: https://celsiuscity.eu/ (accessed on 9 August 2023).
  108. IEA. Seasonal thermal energy storage - Report on state of the art and necessary further R+D. In IEA-SHC Task 45 Large Systems; IEA: Paris, France, 2015; pp. 1–48. [Google Scholar]
  109. International Energy Agency. Combined Heat and Power. Available online: https://www.osti.gov/etdeweb/servlets/purl/21589339 (accessed on 13 June 2023).
  110. Johansen, K.; Werner, S. Something is sustainable in the state of Denmark: A review of the Danish district heating sector. Renew. Sustain. Energy Rev. 2022, 158, 112117. [Google Scholar] [CrossRef]
  111. Situmorang, Y.A.; Zhao, Z.; Yoshida, A.; Abudula, A.; Guan, G. Small-scale biomass gasification systems for power generation (<200 kW class): A review. Renew. Sustain. Energy Rev. 2020, 117, 109486. [Google Scholar] [CrossRef]
  112. Esfilar, R.; Bagheri, M.; Golestani, B. Technoeconomic feasibility review of hybrid waste to energy system in the campus: A case study for the University of Victoria. Renew. Sustain. Energy Rev. 2021, 146, 111190. [Google Scholar] [CrossRef]
  113. Volpe, R.; Catrini, P.; Piacentino, A.; Fichera, A. An agent-based model to support the preliminary design and operation of heating and power grids with cogeneration units and photovoltaic panels in densely populated areas. Energy 2022, 261, 125317. [Google Scholar] [CrossRef]
  114. Hu, K.; Chen, L.; Chen, Q.; Wang, X.H.; Qi, J.; Xu, F.; Min, Y. Phase-change heat storage installation in combined heat and power plants for integration of renewable energy sources into power system. Energy 2017, 124, 640–651. [Google Scholar] [CrossRef]
  115. Li, J.; Xu, W.; Zhang, X.; Feng, X.; Chen, Z.; Qiao, B.; Xue, H. Control method of multi-energy system based on layered control architecture. Energy Build. 2022, 261, 111963. [Google Scholar] [CrossRef]
  116. Kong, X.Q.; Wang, R.Z.; Huang, X.H. Energy optimization model for a CCHP system with available gas turbines. Appl. Therm. Eng. 2005, 25, 377–391. [Google Scholar] [CrossRef]
  117. EPA United States Environmental Protection Agency. CHP Technologies; EPA United States Environmental Protection Agency: Washington, DC, USA, 2023. [Google Scholar]
  118. US Department of Energy. DOE Recognized CHP Packaged Systems and Suppliers; US Department of Energy: Washington, DC, USA, 2022. [Google Scholar]
  119. Wang, J.J.; Jing, Y.Y.; Zhang, C.F. Optimization of capacity and operation for CCHP system by genetic algorithm. Appl. Energy 2010, 87, 1325–1335. [Google Scholar] [CrossRef]
  120. Bejan, A.; Tsatsaronis, G.; Moran, M.J. Thermal Design and Optimization; Wiley-Interscience Publication, Wiley: Hoboken, NJ, USA, 1995. [Google Scholar]
  121. Paradigma.; Red, C.P.K. Listino 2018—Cogeneratori. 2018. Available online: https://www.paradigmaitalia.it/sites/default/files/2018-03/lp_041_rev.00_listino_compact_power_2018_3.pdf (accessed on 9 August 2023).
  122. Wegener, M.; Malmquist, A.; Isalgue, A.; Martin, A.; Arranz, P.; Camara, O.; Velo, E. A techno-economic optimization model of a biomass-based CCHP/heat pump system under evolving climate conditions. Energy Convers. Manag. 2020, 223, 113256. [Google Scholar] [CrossRef]
  123. International Energy Agency. Heating Report. Available online: https://www.iea.org/reports/heating (accessed on 13 June 2023).
  124. Ahmed, O.Y.; Ries, M.J.; Northrop, W.F. Emissions factors from distributed, small-scale biomass gasification power generation: Comparison to open burning and large-scale biomass power generation. Atmos. Environ. 2019, 200, 221–227. [Google Scholar] [CrossRef]
  125. Sansaniwal, S.K.; Pal, K.; Rosen, M.A.; Tyagi, S.K. Recent advances in the development of biomass gasification technology: A comprehensive review. Renew. Sustain. Energy Rev. 2017, 72, 363–384. [Google Scholar] [CrossRef]
  126. Burheim, O.S. Chapter 8—Hydrogen for Energy Storage; Academic Press: Cambridge, MA, USA, 2017; pp. 147–192. [Google Scholar] [CrossRef]
  127. Börjesson, M.; Ahlgren, E.O. Biomass gasification in cost-optimized district heating systems-A regional modeling analysis. Energy Policy 2010, 38, 168–180. [Google Scholar] [CrossRef]
  128. Guedes, R.E.; Luna, A.S.; Torres, A.R. Operating parameters for bio-oil production in biomass pyrolysis: A review. J. Anal. Appl. Pyrolysis 2018, 129, 134–149. [Google Scholar] [CrossRef]
  129. Cardoso, J.; Silva, V.; Eusébio, D. Techno-economic analysis of a biomass gasification power plant dealing with forestry residues blends for electricity production in Portugal. J. Clean. Prod. 2019, 212, 741–753. [Google Scholar] [CrossRef]
  130. ARERA. ARERA–Statistical Data. Available online: https://www.arera.it/it/dati/elenco_dati.htm (accessed on 9 August 2023).
  131. Enel. E-Distribuzione: Importi per Le Connessioni. Available online: https://www.e-distribuzione.it/connessione-alla-rete/importi-per-le-connessioni.html (accessed on 9 August 2023).
  132. Thomopulos, D.; d’Ambrosio, C.; van Ackooij, W.; Stéfanon, M. Generating Hydro Unit-Commitment Instances. Top Off. J. Span. Soc. Stat. Oper. Res. 2023. in press. Available online: https://hal.science/hal-04179739 (accessed on 9 August 2023).
Figure 1. Example of data format.
Energies 16 06268 g001
Table 1. Generic parameters.
CardinalityDescriptionUnitValueRef
Δ t -Time-stepmin15 *[5,23]
T-Number of temporal evaluation intervals-4 *[24]
S t TStarting date of every interval (ddmmyyyy, 00:00 UTC)date15/01/2019 –15/10/2019 *[25]
D t TNumber of time-steps Δ t for each interval-288 *-
T ¯ -Size of an array of the discontinuous period over all the intervals-1152 *-
λ -Latitude of the EC° (Decimal degrees)43.719 *[26]
ϕ -Longitude of the EC° (Decimal degrees)10.427 *[26]
N-Numbers of users in the EC-10 *[5,24]
PRnNBoolean attribute of user (1 if prosumer, 0 if passive user)-0 *[24]
ρ t T ¯ Electricity price€/kWh39.4–99.2 *[14,24,27]
* Refers to data sample at https://github.com/dimitri-thomopulos/DASH-EC, accessed on 9 August 2023.
Table 3. PV generation parameters.
CardinalityDescriptionUnitValueRef
N P V -Number of available models of PV-2 *-
Z P V N P V Number of PV already installed for every model-0 *-
α A T ¯ Solar altitude angle°−67.3–67.8[39]
α S T ¯ Solar azimuth angle°−179.6–178.9[39]
β P V N P V × T ¯ Tilt angle of PV°55 *[39]
γ P V N P V × T ¯ Azimuth angle of PV40 *°[39]
b h i T ¯ Beam Horizontal IrradianceW/m 2 0–800 *[40,41]
d h i T ¯ Diffuse Horizontal IrradianceW/m 2 0–316 *[40,41]
r i T ¯ Reflected IrradianceW/m 2 0 *[40,41]
g i T ¯ Global Irradiance = b h i + d h i + r i W/m 2 0–943 *[40,41]
T e x t T ¯ Air temperature C1.1–28.9 *[41]
L P V N P V Lengthm1.67–1.99 *[42]
W P V N P V Widthm0.99 *[42]
P P V N P V × T ¯ Effective PV powerkW0–0.28 *[43]
PPV,nom N P V Nominal powerkW0.27–0.30 *[44]
n o p P V -Number of extremes of a scale cost function-4 *[45]
O P P V n o p P V Power extremes of a scale cost functionkW20 − > 1000[45]
C I P V n o p P V CAPEX cost€/kW700–1550[46]
C O P V N P V Annual operating cost per P P V €/kW10.5–23.25[45]
E L P V -Expected lifeyears30 *[47,48]
* Refers to data sample at https://github.com/dimitri-thomopulos/DASH-EC, accessed on 9 August 2023.
Table 4. Wind energy generation predictors.
CardinalityDescriptionUnitValueRef
N w t -Number of available models of wind turbine-2 *-
T w t N w t Number of wind turbines already installed for each model-0 *-
U g r d T ¯ Wind speed on W to E directionm/s−3.7–4.13 *[53]
V g r d T ¯ Wind speed on S to N directionm/s−2.21–4.96 *[53]
V i n N w t Minimum wind speedm/s1.5 *[52,54]
V o u t N w t Maximum wind speedm/s52.5 *[52,54]
V r N w t Reference wind speedm/s11 *[52,54]
a , b , c , d , e , f 6 × N w t Wind power coefficients--[52]
P w t N w t , T Effective wind powerkW0–0.24 *[52,54]
Pwt,nom N w t Nominal powerkW3–5 *-
n o p w t -Number of extremes of a scale cost function-4* [45]
O P w t n o p w t Power extremes of a scale cost functionkW500 − > 5000[45]
C I w t n o p w t CAPEX cost€/kW1100–1840[46]
C O w t N w t Annual operating cost per P w t €/kW200–330[45]
D B w t N w t NoisedB45[55]
E L w t -Expected lifeyears20 *[56]
* Refers to data sample at https://github.com/dimitri-thomopulos/DASH-EC, accessed on 9 August 2023.
Table 6. BESS parameters.
CardinalityDescriptionUnitValueRef
N b s -Number of available models of BESS-2 *-
B b s N b s Number of BESS already installed for each model-1–4 *-
η s l f N b s Self-discharge coefficient-0.008–0.010 *[71]
η c h N b s Charge coefficient-0.975–0.978 *[71,72]
η d c h N b s Discharge coefficient-0.920–0.950 *[71,72]
P c h -Charge powerkW3.76–3.92 *[71,72]
P d i s -Discharge powerkW3.65–3.80 *[71,72]
S O C 0 -Initial state of charge%100 *[73]
C I b s N b s Basically CAPEX cost€/kWh550–580[5]
C b s n N b s Nominal capacitykWh3.84–4.00 *[74]
E L b s -Expected lifeyears15 *[14]
* Refers to data sample at https://github.com/dimitri-thomopulos/DASH-EC, accessed on 9 August 2023.
Table 9. Thermal storage parameters.
CardinalityDescriptionUnitValueRef
N T S - Number of thermal storages available in the EC-1 *-
Z T S N T S Number of installed thermal storages for each model-1 *-
V T S N T S Volume of each TS modelm 3 0.475 *[97,98]
S T S N T S Surface of each TS model subject to thermal lossm 2 9.0 *[99]
k b o l l , T S N T S Heat loss coefficient for each TS modelW/K2.49 *[97,100]
T T S , e x t N T S × T ¯ Temperature of the environment where the TS is installedK−1.9–28.9 *[100]
c N T S Specific heat capacity of the fluid within the TSkJ/kgK4.19 *[97,100,101]
ρ N T S Density of the fluid within the TSkg/m 3 1000 *[97,98,101]
T m a x N T S Maximum temperature to be reached inside the TSK80 *[102]
λ T S N T S Latent heat of the phase-change materialkJ/kg-[98,101]
T P C N T S Melting temperature of the phase-change materialK-[98]
η H E N T S Efficiency of heat exchange from the helix to the bulk-0.65 *[103]
T T S , i n , g N S T × T ¯ Inlet temperature of the fluid from generatorK13.6–76.5 *[104]
m ˙ i n , g N S T × T ¯ Flow rate of the fluid from generatorkg/s0–3.3 *[105]
T T S , i n , l N S T × T ¯ Inlet temperature of the fluid used for the loadK15.0–25.0 *[104]
m ˙ i n , l N S T × T ¯ Flow rate of the fluid used for the loadkg/s0.0–0.2 *[105]
C I T S N T S CAPEX cost€/m 3 712.5[106,107,108]
* Refers to data sample at https://github.com/dimitri-thomopulos/DASH-EC, accessed on 9 August 2023.
Table 10. Cogenerator parameters.
CardinalityDescriptionUnitValueRef
N C C H P - Number of CCHP systems available in the EC-1 *-
Z C C H P N C C H P Number of installed CCHP systems for each model-1 *-
T H , C C H P N T , C C H P Levels of supply temperature delivered by each CCHP system-1 *[115]
Q ˙ C N C C H P × T ¯ Thermal energy recovered for cooling from each CCHPkW0.0 *[116]
Q ˙ H N C C H P × N T , C C H P × T ¯ Heat recovered from each CCHP for each level of supply temperaturekW6.6–14.3 *[117,118]
E ˙ e l N C C H P × T ¯ Electrical energy provided by each CCHPkW3.3–8.3 *[117,118]
η H N C C H P × T ¯ Thermal efficiency of each CCHP for heat recovery-0.6–0.7 *[116,117,118]
η C N C C H P × T ¯ Thermal efficiency of each CCHP for cooling-0.6–0.7 *[116]
η e l N C C H P × T ¯ Electrical efficiency of each CCHP-0.0 *[116,117,118]
m ˙ f u e l N C C H P × T ¯ Fuel flow rate for each CCHPkg/s0.3 *[116]
L H V f u e l N C C H P Lower heating value of the flow rate for each CCHPMJ/kg13 *[119]
C I C C H P N C C H P CAPEX cost€/kW37,589[120,121]
E L C C H P -Expected lifeyears15 *[122]
* Refers to data sample at https://github.com/dimitri-thomopulos/DASH-EC, accessed on 9 August 2023.
Table 11. Biomass system parameters.
CardinalityDescriptionUnitValueRef
N B - Number of thermal generators available in the EC-1 *-
Z B N B Number of installed thermal generators for each model-1 *-
Q ˙ H N B × T ¯ Heating load provided by each thermal generatorkW0.0–14.8 *[83]
η H N B Heating efficiency of each thermal generator-0.96 *[124,127]
L H V f u e l N B Lower heating value of the flow rate for each thermal generatorMJ/kg13 *[128]
C I B N B CAPEX cost€/kW6000[106]
E L B -Expected lifeyears15 *[129]
* Refers to data sample at https://github.com/dimitri-thomopulos/DASH-EC, accessed on 9 August 2023.
Table 12. Connection to energy networks.
CardinalityDescriptionUnitValueRef
N V -Number of energy vectors-1 *-
N C P V N V Number of available committed power capacities-1 *-
N E T V , n N × N V Boolean attribute of every user and every energy vector (1 if energy vector available, 0 otherwise)-1 *-
P C V N V × N C P V Available committed power capacities by vectorkW3 *[130]
O C V N V × N C P V Yearly cost for each committed power capacity€/y30 *[4]
π V B N V × N C P V × T ¯ Variable buying energy price€/kWh0.16 *[4]
π V E N V × N C P V × T ¯ Excise€/kWh0.02 *[4]
π V S N V × N C P V × T ¯ Selling energy price€/kWh0.05 *[4]
π V R N V × N C P V × T ¯ Reward to the community for the shared energy€/kWh0.10 *[4]
C I V N V × N C P V Connection cost500[131]
* Refers to data sample at https://github.com/dimitri-thomopulos/DASH-EC, accessed on 9 August 2023.
Disclaimer/Publisher’s Note: The statements, opinions and data contained in all publications are solely those of the individual author(s) and contributor(s) and not of MDPI and/or the editor(s). MDPI and/or the editor(s) disclaim responsibility for any injury to people or property resulting from any ideas, methods, instructions or products referred to in the content.

