
Impact of Influent Composition and Operating Conditions on Carbon and Nitrogen Removal from Urban Wastewater in a Continuous-Upflow (Micro)Aerobic Granular Sludge Blanket Reactor

 , , , , and
Abstract
:1. Introduction
2. Materials and Methods
2.1. Wastewater Composition and Source of Inoculum
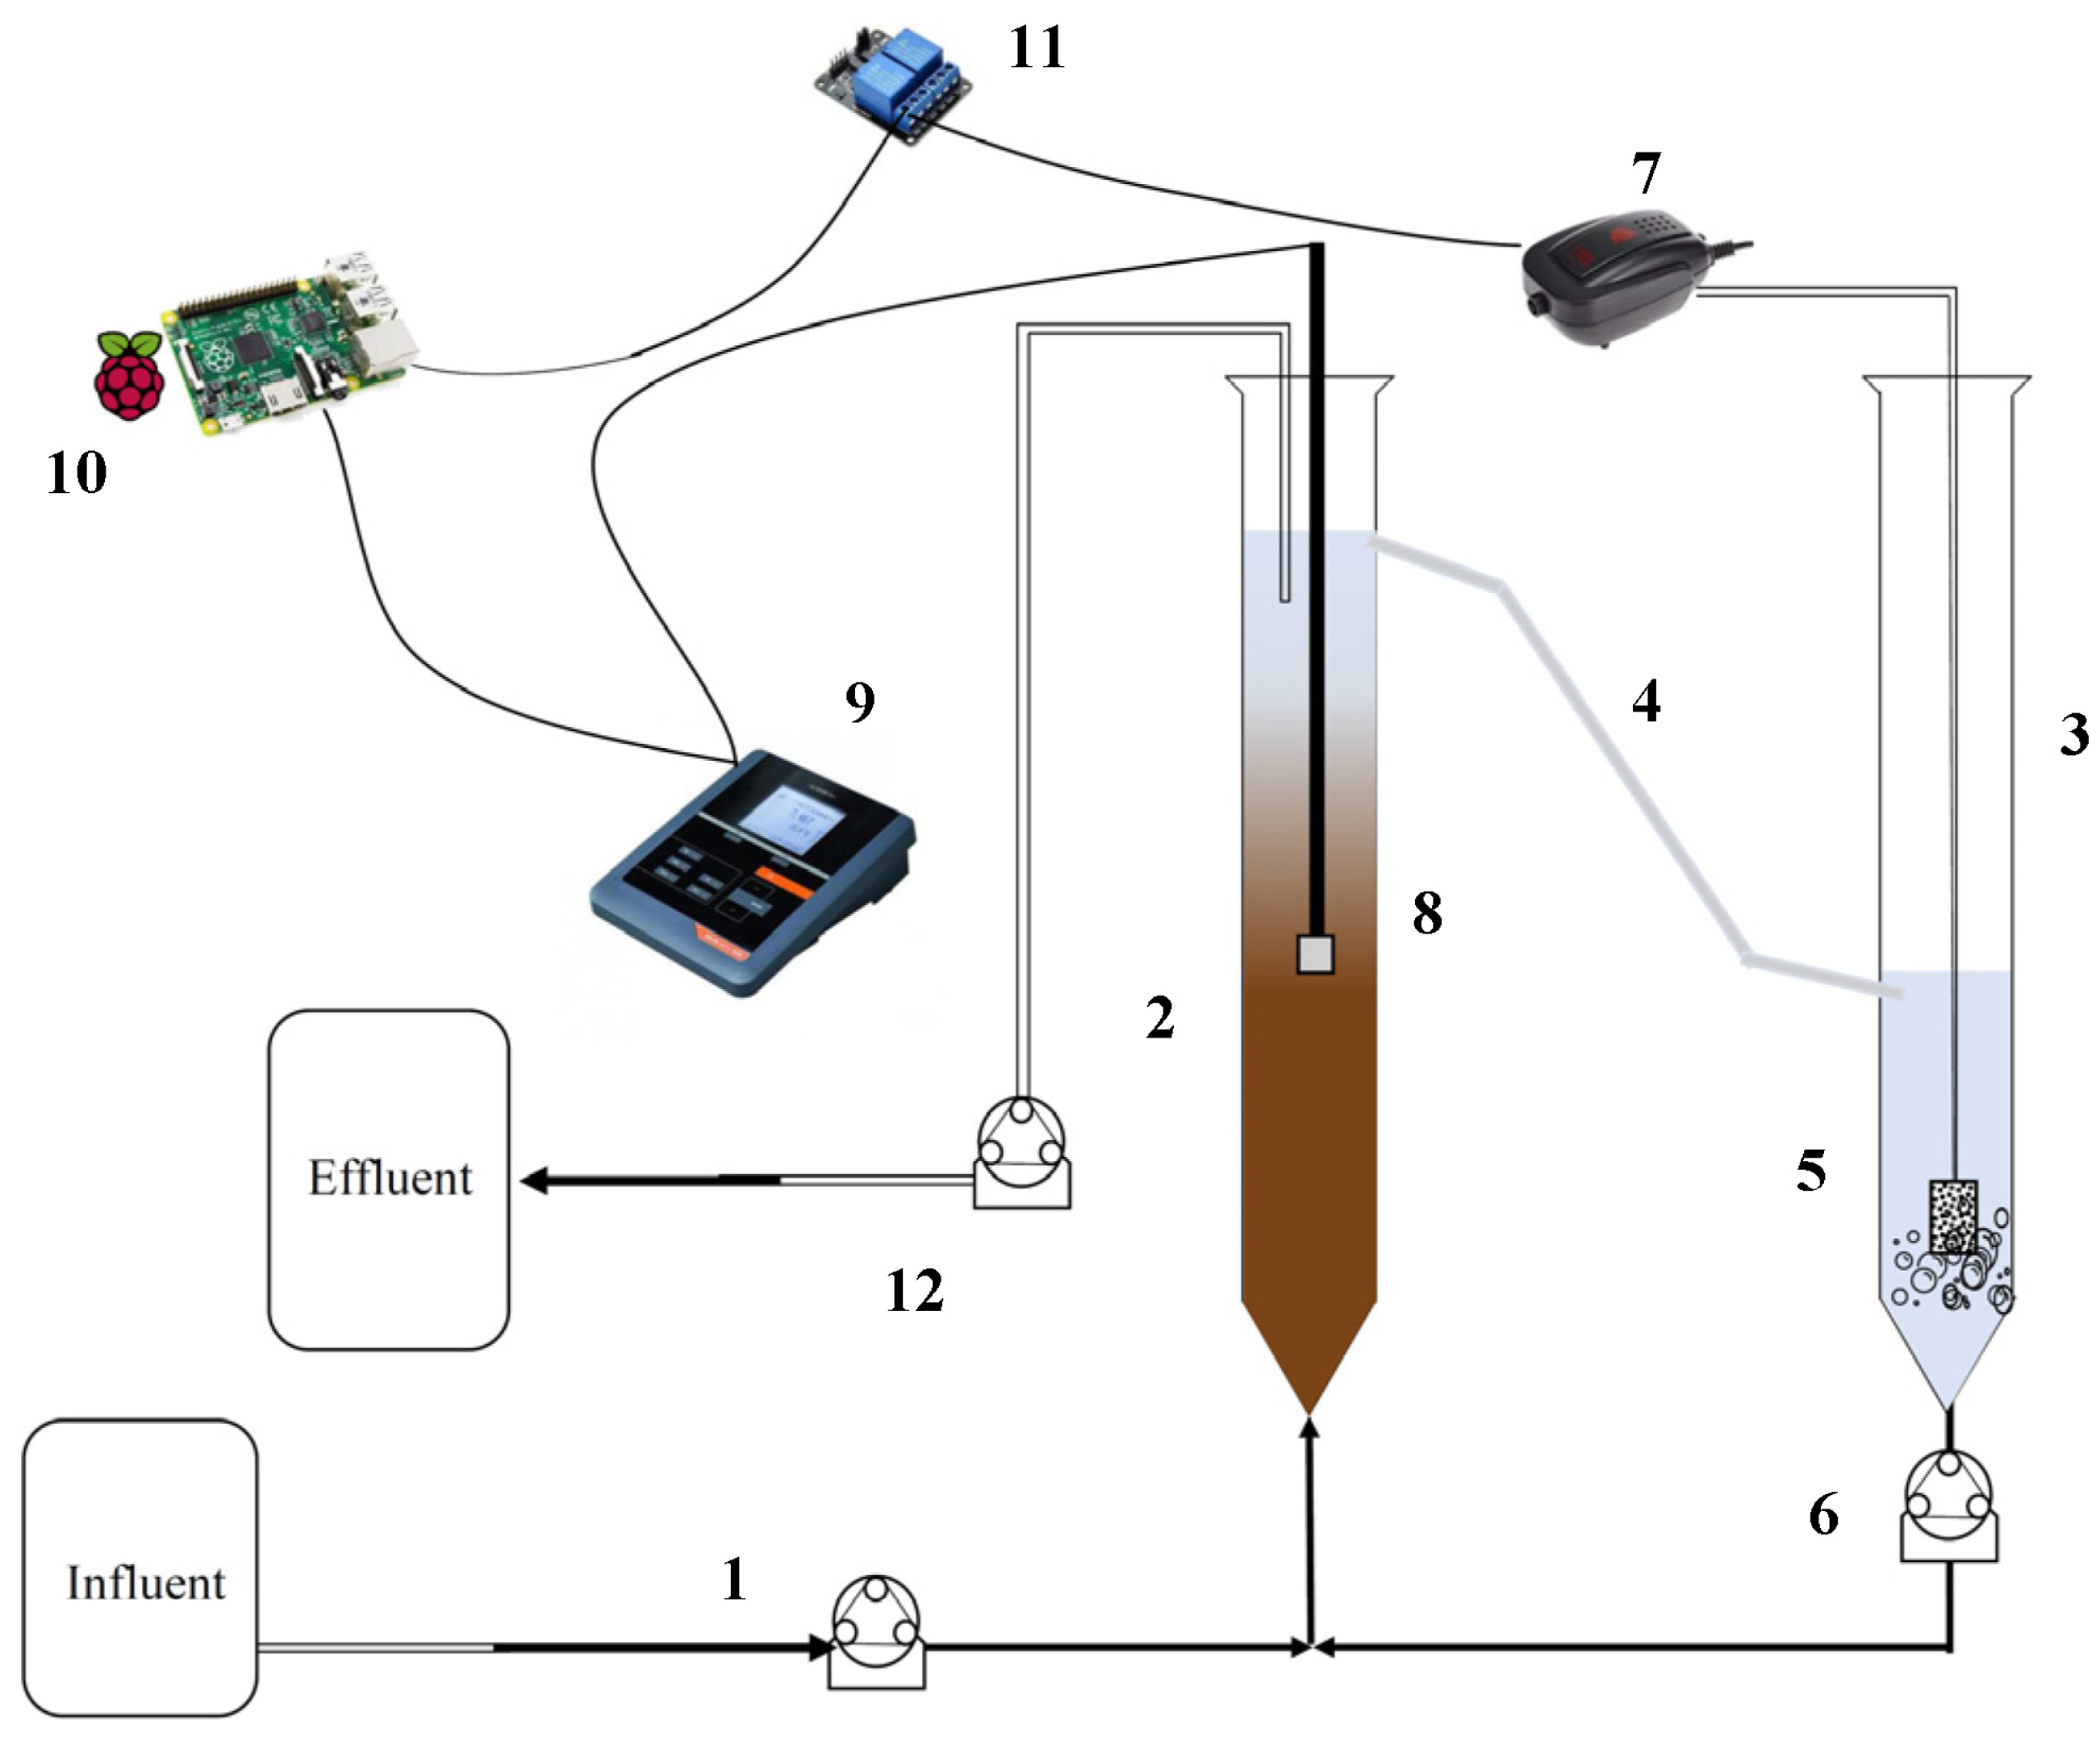
2.2. Experimental Set-up
2.3. Experimental Design
2.4. Anoxic Batch Activity Test
2.5. Calculations
- [N-NH4+INF] and [N-NH4+EFF] are the influent and effluent N-NH4+ concentrations, respectively;
- [CODINF] and [CODEFF] are the influent and effluent COD concentrations, respectively;
- [N-NOX−INF] and [N-NOX−EFF] are the influent and effluent N-NOX− (nitrate- and nitrite-nitrogen) concentrations, respectively.
2.6. Analytical Methods
2.7. Energy and Economic Assessment of the UAGSB Reactor
2.8. Statistical Data Analysis
3. Results and Discussion
3.1. Effect of DO Concentration on COD and N Removal Efficiencies of the UAGSB Reactor
3.2. Performance of the UAGSB Reactor under Different Feed C/N Ratios
3.3. Effect of HRT on the Performance of the UAGSB Reactor
3.4. Preliminary Cost Evaluation
4. Practical Applications and Future Research
5. Conclusions
Supplementary Materials
Author Contributions
Funding
Data Availability Statement
Acknowledgments
Conflicts of Interest
References
- Dodds, W.K.; Smith, V.H. Nitrogen, phosphorus, and eutrophication in streams. Inl. Waters 2016, 6, 155–164. [Google Scholar] [CrossRef]
- Bumbac, C.; Ionescu, I.A.; Tiron, O.; Badescu, V.R. Continuous flow aerobic granular sludge reactor for dairy wastewater treatment. Water Sci. Technol. 2015, 71, 440–445. [Google Scholar] [CrossRef]
- Ma, W.; Han, Y.; Ma, W.; Han, H.; Zhu, H.; Xu, C.; Li, K.; Wang, D. Enhanced nitrogen removal from coal gasification wastewater by simultaneous nitrification and denitrification (SND) in an oxygen-limited aeration sequencing batch biofilm reactor. Bioresour. Technol. 2017, 244, 84–91. [Google Scholar] [CrossRef] [PubMed]
- Zinatizadeh, A.A.L.; Ghaytooli, E. Simultaneous nitrogen and carbon removal from wastewater at different operating conditions in a moving bed biofilm reactor (MBBR): Process modeling and optimization. J. Taiwan Inst. Chem. Eng. 2015, 53, 98–111. [Google Scholar] [CrossRef]
- Seifi, M.; Fazaelipoor, M.H. Modeling simultaneous nitrification and denitrification (SND) in a fluidized bed biofilm reactor. Appl. Math. Model. 2012, 36, 5603–5613. [Google Scholar] [CrossRef]
- Di Capua, F.; Iannacone, F.; Sabba, F.; Esposito, G. Simultaneous nitrification–denitrification in biofilm systems for wastewater treatment: Key factors, potential routes, and engineered applications. Bioresour. Technol. 2022, 361, 127702. [Google Scholar] [CrossRef]
- Yan, L.; Zhang, S.; Hao, G.; Zhang, X.; Ren, Y.; Wen, Y.; Guo, Y.; Zhang, Y. Simultaneous nitrification and denitrification by EPSs in aerobic granular sludge enhanced nitrogen removal of ammonium-nitrogen-rich wastewater. Bioresour. Technol. 2016, 202, 101–106. [Google Scholar] [CrossRef] [PubMed]
- Yan, Y.; Lu, H.; Zhang, J.; Zhu, S.; Wang, Y.; Lei, Y.; Zhang, R.; Song, L. Simultaneous heterotrophic nitrification and aerobic denitrification (SND) for nitrogen removal: A review and future perspectives. Environ. Adv. 2022, 9, 100254. [Google Scholar] [CrossRef]
- Wang, J.; Rong, H.; Cao, Y.; Zhang, C. Factors affecting simultaneous nitrification and denitrification (SND) in a moving bed sequencing batch reactor (MBSBR) system as revealed by microbial community structures. Bioprocess Biosyst. Eng. 2020, 43, 1833–1846. [Google Scholar] [CrossRef]
- Chai, H.; Xiang, Y.; Chen, R.; Shao, Z.; Gu, L.; Li, L.; He, Q. Enhanced simultaneous nitrification and denitrification in treating low carbon-to-nitrogen ratio wastewater: Treatment performance and nitrogen removal pathway. Bioresour. Technol. 2019, 280, 51–58. [Google Scholar] [CrossRef]
- Iannacone, F.; Di Capua, F.; Granata, F.; Gargano, R.; Esposito, G. Shortcut nitrification-denitrification and biological phosphorus removal in acetate- and ethanol-fed moving bed biofilm reactors under microaerobic/aerobic conditions. Bioresour. Technol. 2021, 330, 124958. [Google Scholar] [CrossRef] [PubMed]
- Zhao, Y.; Liu, D.; Huang, W.; Yang, Y.; Ji, M.; Nghiem, L.D.; Trinh, Q.T.; Tran, N.H. Insights into biofilm carriers for biological wastewater treatment processes: Current state-of-the-art, challenges, and opportunities. Bioresour. Technol. 2019, 288, 121619. [Google Scholar] [CrossRef] [PubMed]
- Wang, F.; Lu, S.; Wei, Y.; Ji, M. Characteristics of aerobic granule and nitrogen and phosphorus removal in a SBR. J. Hazard. Mater. 2009, 164, 1223–1227. [Google Scholar] [CrossRef]
- Gao, D.; Liu, L.; Liang, H.; Wu, W.M. Aerobic granular sludge: Characterization, mechanism of granulation and application to wastewater treatment. Crit. Rev. Biotechnol. 2011, 31, 137–152. [Google Scholar] [CrossRef]
- Lettinga, G.; van Velsen, A.F.M.; Hobma, S.W.; de Zeeuw, W.; Klapwijk, A. Use of the upflow sludge blanket (USB) reactor concept for biological wastewater treatment, especially for anaerobic treatment. Biotechnol. Bioeng. 1980, 22, 699–734. [Google Scholar] [CrossRef]
- Kumari, K.; Suresh, S.; Arisutha, S.; Sudhakar, K. Anaerobic co-digestion of different wastes in a UASB reactor. Waste Manag. 2018, 77, 545–554. [Google Scholar] [CrossRef] [PubMed]
- Tan, L.C.; Papirio, S.; Luongo, V.; Nancharaiah, Y.V.; Cennamo, P.; Esposito, G.; van Hullebusch, E.D.; Lens, P.N.L. Comparative performance of anaerobic attached biofilm and granular sludge reactors for the treatment of model mine drainage wastewater containing selenate, sulfate and nickel. Chem. Eng. J. 2018, 345, 545–555. [Google Scholar] [CrossRef]
- Shin, H.S.; Lim, K.H.; Park, H.S. Effect of shear stress on granulation in oxygen aerobic upflow sludge bed reactors. Water Sci. Technol. 1992, 26, 601–605. [Google Scholar] [CrossRef]
- Zeng, R.J.; Lemaire, R.; Yuan, Z.; Keller, J. Simultaneous nitrification, denitrification, and phosphorus removal in a lab-scale sequencing batch reactor. Biotechnol. Bioeng. 2003, 84, 170–178. [Google Scholar] [CrossRef]
- Yang, H.G.; Li, J.; Liu, J.; Ding, L.B.; Chen, T.; Huang, G.X.; Shen, J.Y. A case for aerobic sludge granulation: From pilot to full scale. J. Water Reuse Desalination 2016, 6, 188–194. [Google Scholar] [CrossRef]
- Li, J.; Ding, L.; Cai, A.; Huang, G.; Horn, H. Aerobic Sludge Granulation in a Full-Scale Sequencing Batch Reactor. BioMed Res. Int. 2014, 2014, 268789. [Google Scholar] [CrossRef] [PubMed]
- He, Q.; Chen, L.; Zhang, S.; Chen, R.; Wang, H. Bioresource Technology Hydrodynamic shear force shaped the microbial community and function in the aerobic granular sequencing batch reactors for low carbon to nitrogen (C/N) municipal wastewater treatment. Bioresour. Technol. 2019, 271, 48–58. [Google Scholar] [CrossRef] [PubMed]
- De Kreuk, M.K.; Kishida, N.; Loosdrecht, M.C.M. Van Aerobic granular sludge—state of the art. Water Sci. Technol. 2007, 55, 75–81. [Google Scholar] [CrossRef] [PubMed]
- Rosa-masegosa, A.; Muñoz-palazon, B.; Gonzalez-martinez, A.; Fenice, M.; Gorrasi, S.; Gonzalez-lopez, J. New Advances in Aerobic Granular Sludge Technology Using Continuous Flow Reactors: Engineering and Microbiological Aspects. Water 2021, 13, 1792. [Google Scholar] [CrossRef]
- Changqing, L.; Shuai, L.; Feng, Z. The oxygen transfer efficiency and economic cost analysis of aeration system in municipal wastewater treatment plant. Energy Procedia 2011, 5, 2437–2443. [Google Scholar] [CrossRef]
- Campanelli, M.; Foladori, P.; Vaccari, M. Consumi Elettrici ed Efficienza Energetica nel Trattamento Delle Acque Reflue; Maggiori Editore: Santarcangelo di Romagna, Italy, 2013; ISBN 8838783683. [Google Scholar]
- Gu, Y.; Li, Y.; Yuan, F.; Yang, Q. Optimization and control strategies of aeration in WWTPs: A review. J. Clean. Prod. 2023, 418, 138008. [Google Scholar] [CrossRef]
- Zidan, A.; Nasr, M.; Fujii, M.; Ibrahim, M.G. Environmental and Economic Evaluation of Downflow Hanging Sponge Reactors for Treating High-Strength Organic Wastewater. Sustainability 2023, 15, 6038. [Google Scholar] [CrossRef]
- Dadebo, D.; Ibrahim, M.G.; Fujii, M.; Nasr, M. Sequential treatment of surfactant-laden wastewater using low-cost rice husk ash coagulant and activated carbon: Modeling, optimization, characterization, and techno-economic analysis. Bioresour. Technol. Rep. 2023, 22, 101464. [Google Scholar] [CrossRef]
- Papirio, S.; Esposito, G.; Pirozzi, F. Biological inverse fluidized-bed reactors for the treatment of low pH- and sulphate-containing wastewaters under different COD/SO42− conditions. Environ. Technol. 2013, 34, 1141–1149. [Google Scholar] [CrossRef]
- He, Q.; Zhang, W.; Zhang, S.; Wang, H. Enhanced nitrogen removal in an aerobic granular sequencing batch reactor performing simultaneous nitrification, endogenous denitrification and phosphorus removal with low superficial gas velocity. Chem. Eng. J. 2017, 326, 1223–1231. [Google Scholar] [CrossRef]
- Wan, C.; Yang, X.; Lee, D.J.; Sun, S.; Liu, X.; Zhang, P. Influence of hydraulic retention time on partial nitrification of continuous-flow aerobic granular-sludge reactor. Environ. Technol. 2014, 35, 1760–1765. [Google Scholar] [CrossRef] [PubMed]
- Li, J.; Cai, A.; Wang, M.; Ding, L.; Ni, Y. Aerobic granulation in a modified oxidation ditch with an adjustable volume intraclarifier. Bioresour. Technol. 2014, 157, 351–354. [Google Scholar] [CrossRef] [PubMed]
- Kent, T.R.; Bott, C.B.; Wang, Z. State of the art of aerobic granulation in continuous fl ow bioreactors. Biotechnol. Adv. 2018, 36, 1139–1166. [Google Scholar] [CrossRef] [PubMed]
- Xu, D.; Li, J.; Liu, J.; Qu, X.; Ma, H. Advances in continuous flow aerobic granular sludge: A review. Process Saf. Environ. Prot. 2022, 163, 27–35. [Google Scholar] [CrossRef]
- Liu, X.; Dong, C. Simultaneous COD and nitrogen removal in a micro-aerobic granular sludge reactor for domestic wastewater treatment. Syst. Eng. Procedia 2011, 1, 99–105. [Google Scholar] [CrossRef]
- Li, Y.Z.; He, Y.L.; Ohandja, D.G.; Ji, J.; Li, J.F.; Zhou, T. Simultaneous nitrification-denitrification achieved by an innovative internal-loop airlift MBR: Comparative study. Bioresour. Technol. 2008, 99, 5867–5872. [Google Scholar] [CrossRef] [PubMed]
- Juang, Y.C.; Adav, S.S.; Lee, D.J.; Tay, J.H. Stable aerobic granules for continuous-flow reactors: Precipitating calcium and iron salts in granular interiors. Bioresour. Technol. 2010, 101, 8051–8057. [Google Scholar] [CrossRef]
- Chen, Y.C.; Lin, C.J.; Chen, H.L.; Fu, S.Y.; Zhan, H.Y. Cultivation of Biogranules in a continuous flow reactor at low dissolved oxygen. Water Air Soil Pollut. Focus 2009, 9, 213–221. [Google Scholar] [CrossRef]
- Wan, C.; Sun, S.; Lee, D.J.; Liu, X.; Wang, L.; Yang, X.; Pan, X. Partial nitrification using aerobic granules in continuous-flow reactor: Rapid startup. Bioresour. Technol. 2013, 142, 517–522. [Google Scholar] [CrossRef]
- Beun, J.J.; Van Loosdrecht, M.C.M.; Heijnen, J.J. Aerobic granulation in a sequencing batch airlift reactor. Water Res. 2002, 36, 702–712. [Google Scholar] [CrossRef]
- Vishniac, W.; Santer, M. The Thiobacilli. Bacteriol. Rev. 1957, 21, 195–213. [Google Scholar] [CrossRef] [PubMed]
- Sguanci, S.; Lubello, C.; Caffaz, S.; Lotti, T. Long-term stability of aerobic granular sludge for the treatment of very low-strength real domestic wastewater. J. Clean. Prod. 2019, 222, 882–890. [Google Scholar] [CrossRef]
- Liu, T.; He, X.; Jia, G.; Xu, J.; Quan, X.; You, S. Simultaneous nitrification and denitrification process using novel surface-modified suspended carriers for the treatment of real domestic wastewater. Chemosphere 2020, 247, 125831. [Google Scholar] [CrossRef] [PubMed]
- Iannacone, F.; Di Capua, F.; Granata, F.; Gargano, R.; Esposito, G. Simultaneous nitrification, denitrification and phosphorus removal in a continuous-flow moving bed biofilm reactor alternating microaerobic and aerobic conditions. Bioresour. Technol. 2020, 310, 123453. [Google Scholar] [CrossRef] [PubMed]
- Kiskira, K.; Papirio, S.; van Hullebusch, E.D.; Esposito, G. Influence of pH, EDTA/Fe(II) ratio, and microbial culture on Fe(II)-mediated autotrophic denitrification. Environ. Sci. Pollut. Res. 2017, 24, 21323–21333. [Google Scholar] [CrossRef] [PubMed]
- APHA. Standard Methods for the Examination of Water and Wastewater; American Water Works Association: Denver, CO, USA; American Public Works Association: Kansas City, MI, USA; Water Environment Federation: Alexandria, VA, USA, 2005. [Google Scholar]
- ISRA-CNR. Analytical Methods for Water. Agenzia per la Protezione Dell’ambiente e per i Servizi Tecnici (APAT) Istituto di Ricerca Sulle Acque—Consiglio Nazionale Delle Ricerche; ISRA-CNR: Rome, Italy, 2003; ISBN 8844800837. [Google Scholar]
- Di Capua, F.; Mascolo, M.C.; Pirozzi, F.; Esposito, G. Simultaneous denitrification, phosphorus recovery and low sulfate production in a recirculated pyrite-packed biofilter (RPPB). Chemosphere 2020, 255, 126977. [Google Scholar] [CrossRef] [PubMed]
- Bonomo, L. Trattamenti Delle Acque Reflue; McGraw-Hill: Milano, Italy, 2008; Volume 4, ISBN 9788838691645. [Google Scholar]
- Qambar, A.S.; Al Khalidy, M.M. Optimizing dissolved oxygen requirement and energy consumption in wastewater treatment plant aeration tanks using machine learning. J. Water Process Eng. 2022, 50, 103237. [Google Scholar] [CrossRef]
- Campano, E. idrico Piano d’Ambito Regionale. Available online: https://www.enteidricocampano.it/wp-content/uploads/2021/12/Relazione-PDA-Regionale_rev1_2021.pdf (accessed on 15 March 2023).
- Show, K.Y.; Lee, D.J.; Tay, J.H. Aerobic granulation: Advances and challenges. Appl. Biochem. Biotechnol. 2012, 167, 1622–1640. [Google Scholar] [CrossRef]
- Zhou, D.; Niu, S.; Xiong, Y.; Yang, Y.; Dong, S. Microbial selection pressure is not a prerequisite for granulation: Dynamic granulation and microbial community study in a complete mixing bioreactor. Bioresour. Technol. 2014, 161, 102–108. [Google Scholar] [CrossRef]
- Campo, R.; Sguanci, S.; Caffaz, S.; Mazzoli, L.; Ramazzotti, M.; Lubello, C.; Lotti, T. Efficient carbon, nitrogen and phosphorus removal from low C/N real domestic wastewater with aerobic granular sludge. Bioresour. Technol. 2020, 305, 122961. [Google Scholar] [CrossRef]
- Wang, X.; Wang, S.; Xue, T.; Li, B.; Dai, X.; Peng, Y. Treating low carbon/nitrogen (C/N) wastewater in simultaneous nitrification-endogenous denitrification and phosphorous removal (SNDPR) systems by strengthening anaerobic intracellular carbon storage. Water Res. 2015, 77, 191–200. [Google Scholar] [CrossRef]


| Urban Wastewater Characteristics | Reactor Configuration | Process Conditions | Scale | NH4+-N RE (%) | COD RE (%) | TN RE (%) | Reference | |
|---|---|---|---|---|---|---|---|---|
| Synthetic | COD = 144–628 mg∙L−1 N-NH4+ = 20–72 mg∙L−1 | Micro-aerobic granular sludge reactor | DOinflux = 0.11–0.25 g∙L−1∙d−1 HRT = 5–10 h | Lab-scale, V = 18 L | 40–86 | 93–95 | 51–82 | [31] |
| Real | COD = 150–300 mg∙L−1 | UASB | HRT = 10–48 h T= 20 °C | Lab-scale, V = 8 L | / | 82–86 | / | [32] |
| Real | COD = 602–866 mg∙L−1 N-NH4+ = 48 mg∙L−1 | UASB | HRT = 8.8–24 h T = 25–30 °C | Pilot-scale, V = 2.75 m3 | / | 60 (as sCOD) | / | [33] |
| Real | COD = 450–8150 mg∙L−1 N-NH3+ = 31.2–141.9 mg∙L−1 | UASB | HRT = 24.85–106.85 h T = 22.4–30.7 °C | Real-scale, 7800 m3 | / | 45–88 | 25.3 | [34] |
| Synthetic | COD = 500 mg∙L−1 TN = 50–56 mg∙L−1 | UASB | HRT = 9–22 h T = 25–35 °C | Lab-scale, V = 0.9 L | / | 84–94 | <73 | [35] |
| Synthetic | N-NH4+ = 512–594 mg∙L−1 | Continuous-flow airlift reactor (ALR) | HRT = 5.41–22.8 h | Lab-scale, V = 9.2 L | 94.4–100 | / | / | [36] |
| Synthetic | Organic loading rate (OLR) = 7.0 kg COD∙m−3∙d−1 N-NH4+ * = 21 mg∙L−1 * | Continuous-flow aerobic granular sludge reactor | HRT = 24 h | Lab-scale, V= 6.8 L | / | 83–84 | / | [37] |
| Real | COD = 200–400 mg∙L−1 N-NH4+ = 30–40 mg∙L−1 | Modified oxidation ditch (MOD) | HRT = 3 h | Lab-scale, V = 60 L | 95 | 90 (as BOD5) | / | [21] |
| Synthetic | COD * = 514 mg∙L−1 N-NH4+ * = 63 mg∙L−1 | Continuous-flow aerobic granular sludge reactor | DO = 0.3–3.5 mg O2∙L−1 HRT = 10 h | Lab-scale, V = 890 mL | / | 85 | / | [38] |
| Synthetic | COD = 350–1500 mg∙L−1 N-NH4+ * = 53.3 mg∙L−1 | Continuous-flow aerobic granular sludge reactor | DO = 7.0 mg O2∙L−1 | Lab-scale V= 11.9 L | 6–60 | 90–97 | / | [39] |
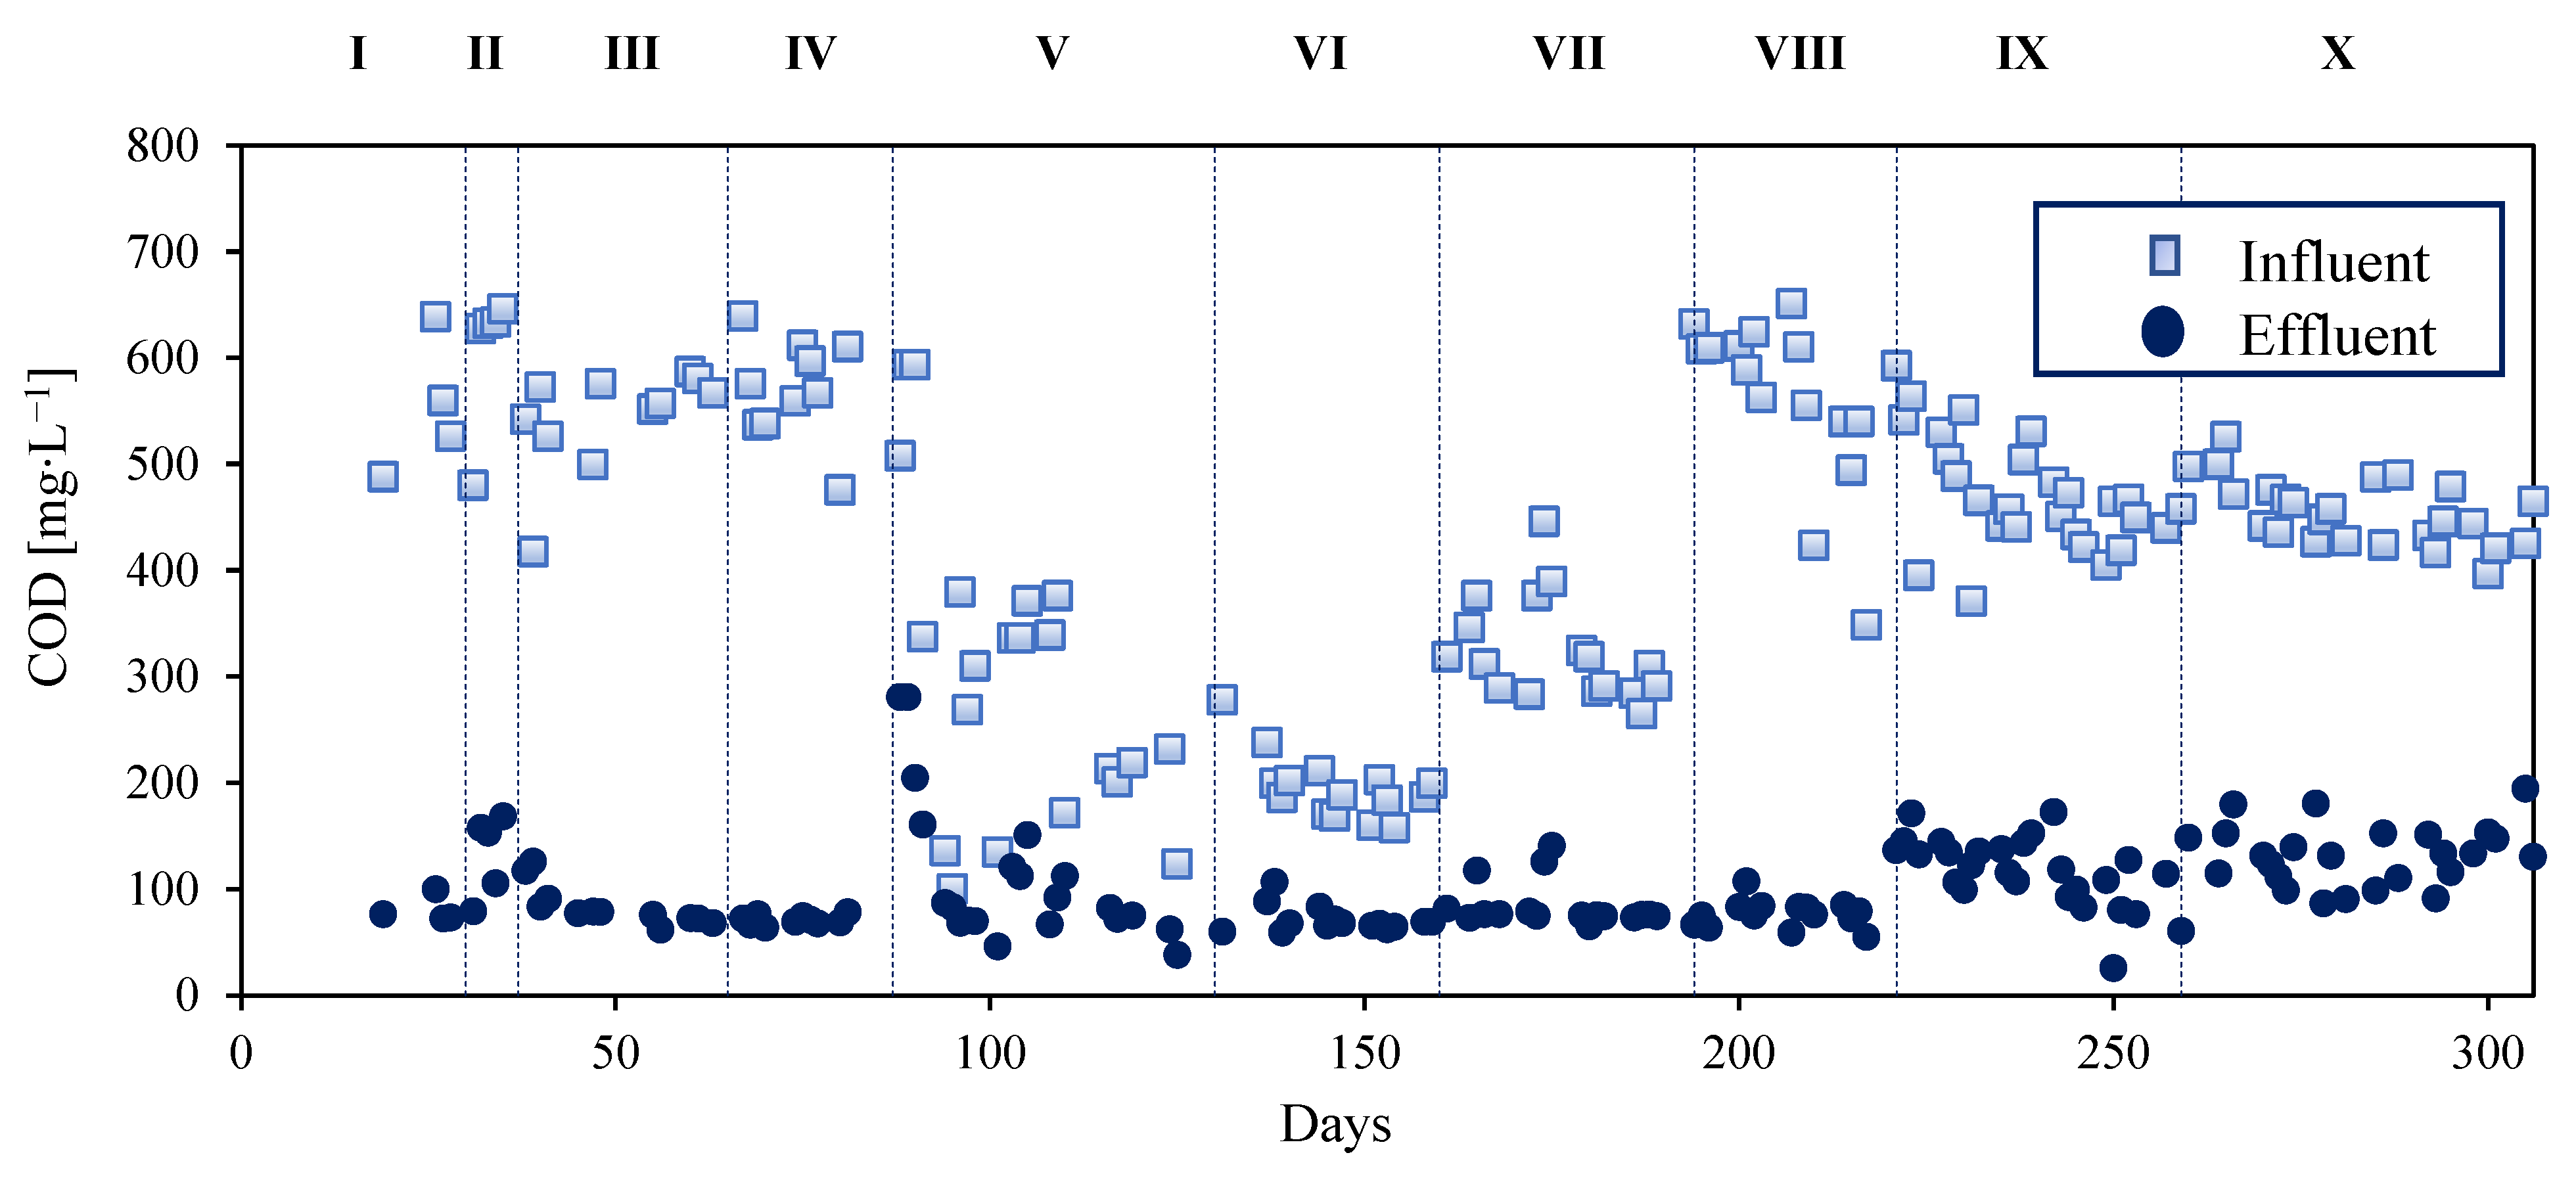
| Synthetic | COD = 195–604 mg∙L−1 N-NH4+ = 37.9–45.3 mg∙L−1 | Continuous-upflow aerobic granular sludge blanket | DO = 0.01–6.0 mg O2∙L−1 C/N = 4.7–13.5 HRT = 6–24 h | Lab-scale, V = 600 mL | 63–100 | 61–88 | 28–88 (as TIN) | This study |
| Period | Duration (days) | DO Range (mg∙L−1) | HRT (h) | Feed P-PO43− (mg∙L−1) | Feed COD (mg∙L−1) | Feed N-NH4+ (mg∙L−1) | Feed C/N |
|---|---|---|---|---|---|---|---|
| I | 0–30 | 4.0–6.0 | 24 | 56.4 ± 25.0 | 552 ± 55 | 38.8 ± 6.4 | 12.1 ± 1.4 |
| II | 31–37 | 2.0–4.0 | 24 | 7.5 ± 1.8 | 604 ± 62 | 45.3 ± 2.5 | 13.3 ± 1.4 |
| III | 38–65 | 1.0–2.0 | 24 | 8.2 ± 4.8 | 543 ± 47 | 43.3 ± 2.9 | 12.7 ± 1.5 |
| IV | 66–87 | 0.02–1.60 | 24 | 6.6 ± 3.1 | 571 ± 45 | 42.6 ± 4.3 | 13.5 ± 1.4 |
| V | 88–130 | 0.12–2.09 | 24 | 8.7 ± 3.1 | 287 ± 141 | 39.9 ± 8.5 | 7.0 ± 2.5 |
| VI | 131–160 | 0.10–2.07 | 24 | 6.7 ± 2.2 | 195 ± 30 | 42.1 ± 2.0 | 4.7 ± 0.9 |
| VII | 161–193 | 0.03–1.86 | 24 | 9.7 ± 2.7 | 324 ± 47 | 40.8 ± 2.2 | 8.0 ± 1.1 |
| VIII | 194–220 | 0.01–0.30 | 24 | 10.5 ± 2.9 | 560 ± 80 | 41.5 ± 4.3 | 13.6 ± 2.2 |
| IX | 221–258 | 0.01–1.22 | 12 | 12.7 ± 3.6 | 472 ± 54 | 41.4 ± 2.1 | 11.4 ± 1.4 |
| X | 259–306 | 0.01–0.07 | 6 | 10.5 ± 1.8 | 455 ± 30 | 37.9 ± 3.3 | 12.1 ± 1.2 |
| Period | NH4+-N RE (%) | TIN RE (%) | COD RE (%) | TININF,G (%) | TINREM,G (%) | TINDEN (%) |
|---|---|---|---|---|---|---|
| I | 93 ± 12 | 83 ± 12 | 85 ± 1 | 46 ± 5 | 60 ± 8 | 32 ± 8 |
| II | 100 ± 0 | 88 ± 2 | 78 ± 4 | 47 ± 4 | 54 ± 5 | 40 ± 5 |
| III | 95 ± 6 | 85 ± 5 | 84 ± 5 | 48 ± 7 | 51 ± 21 | 42 ± 16 |
| IV | 94 ± 8 | 82 ± 6 | 88 ± 1 | 52 ± 5 | 63 ± 8 | 30 ± 8 |
| V | 97 ± 5 | 64 ± 19 | 61 ± 16 | 20 ± 10 | 30 ± 15 | 45 ± 15 |
| VI | 99 ± 2 | 28 ± 8 | 63 ± 7 | 14 ± 4 | 53 ± 18 | 14 ± 8 |
| VII | 97 ± 6 | 61 ± 12 | 74 ± 4 | 28 ± 4 | 47 ± 12 | 34 ± 13 |
| VIII | 99 ± 2 | 84 ± 12 | 86 ± 3 | 55 ± 9 | 67 ± 15 | 29 ± 15 |
| IX | 90 ± 13 | 77 ± 10 | 75 ± 6 | 40 ± 6 | 53 ± 11 | 37 ± 12 |
| X | 63 ± 18 | 64 ± 15 | 71 ± 8 | 41 ± 6 | 68 ± 10 | 21 ± 10 |
| MLE | UAGSB | ||
|---|---|---|---|
| Flow rate | m3∙year−1 | 759,200 | 759,200 |
| VN | m3 | 1678 | 2080 |
| VD | m3 | 721 | - |
| OD | kg O2∙h−1 | 79.2 | 73.6 |
| N. diffusers | - | 270 | 203 |
| Typical standard aeration efficiency (SAE) | kg O2∙kWh−1 | 2.5 | 2.5 |
| Max. power | kWh∙year−1 | 277,560 | 258,020 |
| Max. energetic costs | EUR∙year−1 | 32,752 | 30,446 |
| Max. energetic costs | EUR∙m−3 | 0.43 | 0.40 |
| Construction costs | EUR | 128,700 | 111,603 |
| Air diffusers costs | EUR | 5097 | 3820 |
| Total CAPEX | EUR | 133,797 | 115,422 |
Disclaimer/Publisher’s Note: The statements, opinions and data contained in all publications are solely those of the individual author(s) and contributor(s) and not of MDPI and/or the editor(s). MDPI and/or the editor(s) disclaim responsibility for any injury to people or property resulting from any ideas, methods, instructions or products referred to in the content. |
© 2023 by the authors. Licensee MDPI, Basel, Switzerland. This article is an open access article distributed under the terms and conditions of the Creative Commons Attribution (CC BY) license (https://creativecommons.org/licenses/by/4.0/).
Share and Cite
Lanzetta, A.; Di Capua, F.; Panneerselvam, B.; Mattioli, D.; Esposito, G.; Papirio, S. Impact of Influent Composition and Operating Conditions on Carbon and Nitrogen Removal from Urban Wastewater in a Continuous-Upflow (Micro)Aerobic Granular Sludge Blanket Reactor. Energies 2023, 16, 6303. https://doi.org/10.3390/en16176303
Lanzetta A, Di Capua F, Panneerselvam B, Mattioli D, Esposito G, Papirio S. Impact of Influent Composition and Operating Conditions on Carbon and Nitrogen Removal from Urban Wastewater in a Continuous-Upflow (Micro)Aerobic Granular Sludge Blanket Reactor. Energies. 2023; 16(17):6303. https://doi.org/10.3390/en16176303
Chicago/Turabian StyleLanzetta, Anna, Francesco Di Capua, Balamurugan Panneerselvam, Davide Mattioli, Giovanni Esposito, and Stefano Papirio. 2023. "Impact of Influent Composition and Operating Conditions on Carbon and Nitrogen Removal from Urban Wastewater in a Continuous-Upflow (Micro)Aerobic Granular Sludge Blanket Reactor" Energies 16, no. 17: 6303. https://doi.org/10.3390/en16176303