Article

Cooperative Voltage and Frequency Regulation with Wind Farm: A Model-Based Offline Optimal Control Approach

1
Power Research Institute of State Grid Shaanxi Electric Power Company Limited, Xi’an 710100, China
2
State Key Laboratory of Electrical Insulation and Power Equipment, Shaanxi Key Laboratory of Smart Grid, School of Electrical Engineering, Xi’an Jiaotong University, Xi’an 710049, China
*
Author to whom correspondence should be addressed.
Energies 2023, 16(17), 6307; https://doi.org/10.3390/en16176307
Submission received: 1 August 2023 / Revised: 22 August 2023 / Accepted: 27 August 2023 / Published: 30 August 2023
(This article belongs to the Section A3: Wind, Wave and Tidal Energy)

Abstract

:
Converter blocking is a serious malfunction encountered in high voltage direct current (HVDC) transmission systems. During sending-end converter blocking, the resultant active power and reactive power surplus in the sending-end power system lead to a severe increase in bus voltage and grid frequency. Consequently, this poses a substantial threat to the stability of the power system. Traditional control techniques generally control the frequency and voltage separately, which makes it challenging to regulate them jointly. This research paper introduces a collaborative approach for optimal control of voltage and frequency to address this issue. State space models for converter bus voltage and grid frequency prediction are developed using the bus voltage sensitivity matrices and system swing equation. The regulation of the converter bus voltage and grid frequency are intrinsically integrated using the explicit model predictive control (EMPC). When blocking occurs and results in an increase in the converter bus voltage and grid frequency, the EMPC controller regulates the output of active power and reactive power from the wind farm to realize the cooperative regulation of the converter bus voltage and grid frequency. The applicability and effectiveness of this strategy have been confirmed through simulation studies.

1. Introduction

Renewable energy, e.g., wind energy, has emerged as a prominent alternative for addressing the energy crisis due to its favorable economic and environmental characteristics [1]. However, the location of large wind farms is often remote, offshore, and far from the main load centers [2]. In order to enable efficient energy distribution and long-distance transmission of wind energy, high voltage direct current (HVDC) transmission systems are usually adopted. HVDC transmission systems offer advantages such as low line costs, low power losses, rapid and flexible power regulation, and absence of system stability concerns, making them well suited for grid connectivity and the transmission of power over extended distances and at high-capacity levels [3]. Modern power systems are actively involved in the development of HVDC transmission technology, indicating its increasing prominence in the near future [4]. Nonetheless, HVDC transmission does possess certain drawbacks, e.g., the possible occurrence of converter blocking.
Converter-blocking incidents in HVDC transmission are critical faults that can lead to severe consequences. When the converter station experiences an abrupt blocking, the DC transmission line is disconnected immediately [5], resulting in a sudden rise in frequency owing to the excessive active power that cannot be transmitted. Moreover, the surplus reactive power from the sending-end converter station is redirected back to the sending-end power grid, causing the overvoltage phenomenon [6]. Figure 1 shows the dynamics of the sending-end converter bus voltage and grid frequency after the converter blocking. In Figure 1, when the blocking occurs, the sending-end converter bus voltage and grid frequency both increase significantly. Consequently, it becomes imperative to implement cooperative control of bus voltage and grid frequency during DC blocking in the HVDC transmission system.
Some strategies have been presented to tackle the problem regarding controlling frequency and voltage in the context of HVDC blocking. In [7], a control scheme based on a PID controller is utilized, incorporating control performance standards and an event-triggered load frequency control approach. This method focuses on managing the frequency of the system. In [8], a proportional–integral–derivative double-derivative controller architecture is presented for effective control of perturbed load frequency in the power grids with time delays. This approach specifically addresses the challenge of deteriorated load frequency control performance caused by inevitable communication time delays, which are prevalent in power system networks with open communication links.
An optimal control technique is proposed in [9] to manage demand response and generation units using sampled data. This method is based on the linear quadratic regulator (LQR) theory and is applicable to load frequency control systems with both constant and time-varying delays, irrespective of the demand response. Reference [10] introduces an intelligent control approach based on adaptive dynamic programming for frequency regulation. This method focuses on adjusting the power outputs of microturbines and energy storage systems when integrating photovoltaic power generation into microgrids. In order to regulate frequency while adhering to voltage restrictions across all buses in networked microgrid systems with diverse topological structures and operating modes, reference [11] proposes a distributed model predictive control (MPC) controller. In the proposed strategy, the MPC modifies the voltage-sensitive load voltages to effectively control the frequency. Other effective frequency control strategies, including deloading and synchronverter, were widely used by many researchers [12].
Regarding voltage control, reference [13] employs a combination of PID controllers to realize cooperative control of active and reactive power and multiturbine distribution control for voltage support. To regulate voltage using buck-type DC–DC converters, reference [14] introduces a novel hybrid controller that integrates PID controllers with adaptive neuro-fuzzy inference systems. In [15], an effective control strategy is developed by combining adaptive droop control and LQR to handle the high dynamic variations associated with power oscillations and voltage deviations in a multiterminal grid system. The proposed control technique mitigates oscillations in deviation signals and facilitates power-sharing among terminals based on converter rating. Reference [16] proposes a feeder-level global voltage control strategy guided by the principles of MPC theory. This strategy takes into account voltage qualification rate, control cost, and network loss objectives, enabling real-time voltage control in the distribution network at the millisecond timescale. Wind farms can also provide other ancillary services, including power quality improvement, voltage ride through, and power oscillation damping [17].
The previously discussed frequency and voltage control methods have certain limitations. The PID controller is unable to control both frequency and voltage simultaneously. Additionally, the use of PID controllers can lead to inaccurate control. The LQR controller, on the other hand, is not able to explicitly handle the constraints of control inputs and outputs [18]. This limitation can result in the wind farm’s output power exceeding its power rating and negatively impacting the stability of the power system’s operation.
MPC controllers offer the advantage of joint frequency and voltage control, as well as the ability to incorporate additional constraints on control inputs and outputs. However, due to being an online control method, MPC requires more computational resources and longer computation times.
In this study, an explicit model predictive control (EMPC) controller is utilized to effectively regulate the active and reactive power outputs of the wind farm while considering the power limits. This control strategy aims to regulate the converter bus voltage and grid frequency at the HVDC sending end. This strategy of employing the EMPC controller ensures the stability of the power system’s operation.
Currently, EMPC controllers have gained popularity in addressing multiobjective control problems that involve constraints. In the context of DC–DC power supplies, reference [19] proposes an EMPC strategy specifically tailored for such systems. Similarly, in [20], EMPC is employed to optimize the charge control problem in lithium-ion batteries. By precomputing explicit solutions and representing the charging behavior using piecewise affine functions, the proposed control approach effectively moves the constrained optimization offline. To address the significant computational burden associated with online optimization in MPC, reference [21] applies EMPC to manage the assist torque generated by electric power steering systems. This utilization of EMPC mitigates the computational effort by eliminating the need for recurrent online optimization.
This paper presents a combined control approach to achieve simultaneous frequency and voltage control in the presence of converter blocking, building upon the aforementioned observations. The relationship between system frequency and the wind farm active power is determined through the power system swing equation. Additionally, the voltage sensitivity matrices are utilized to describe the relationship between bus voltage, active power output, and reactive power output of the wind farm. State-space equations for grid frequency and bus voltage are established by incorporating the system swing equation and voltage sensitivity matrices.
To ensure reliable system operation, various constraints related to the wind farm’s output power limits must be satisfied. A cost function is developed by considering the deviation of control values from reference values and the magnitude of input value changes. Using this cost function and the constraints, the EMPC controller divides the state space into critical regions, each associated with a specific feedback control law. This enables the controller to search for predefined control laws through lookup tables, eliminating the need for online optimization.
By solving the multiparametric quadratic programming problem offline, EMPC determines the explicit control laws. However, as the constant terms of the state-space equations are time-varying, a single controller cannot accurately capture the system’s power regulation. Therefore, based on the gain scheduling theory, the proposed control strategy comprises five controllers. The appropriate controller is selected based on the current value of the constant term. The calculated optimal solution serves as the power reference for the wind farm.
This approach allows for simultaneous control of frequency and voltage within the predefined limits, avoiding the significant computational costs associated with online optimization and the control errors that may arise from separate control methods.
This article presents a control strategy on the basis of the EMPC. The key contributions of this work are listed as follows:
  • The EMPC controllers enable cooperative and optimal control of frequency and voltage, facilitating simultaneous regulation of both parameters.
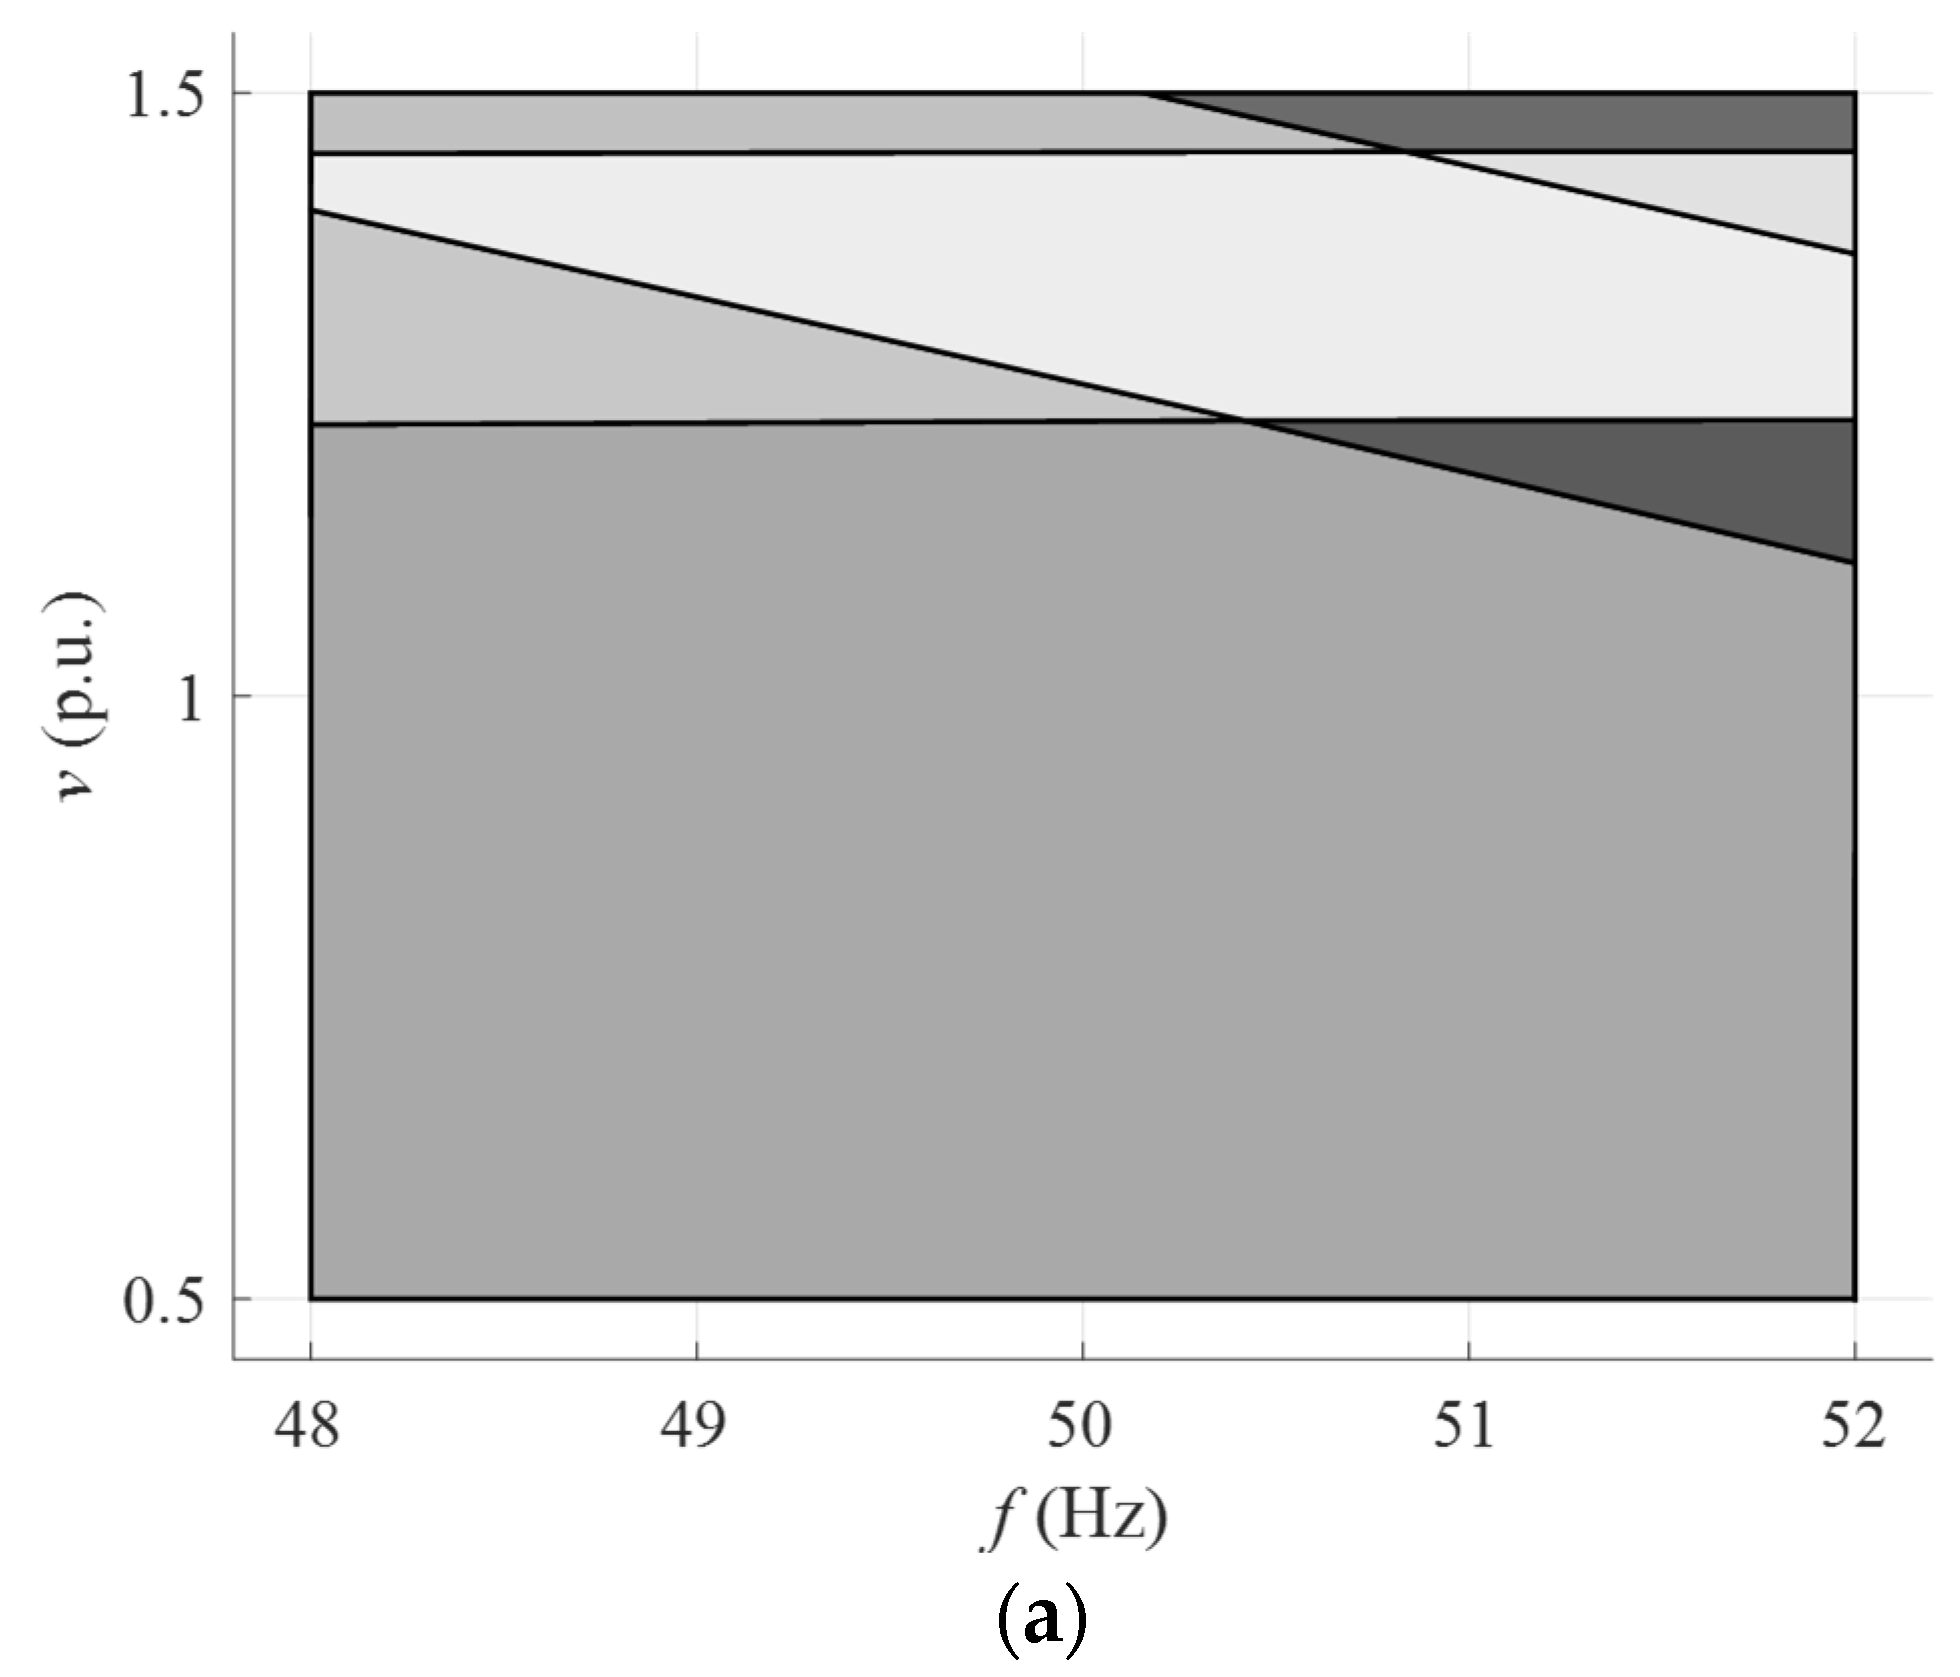
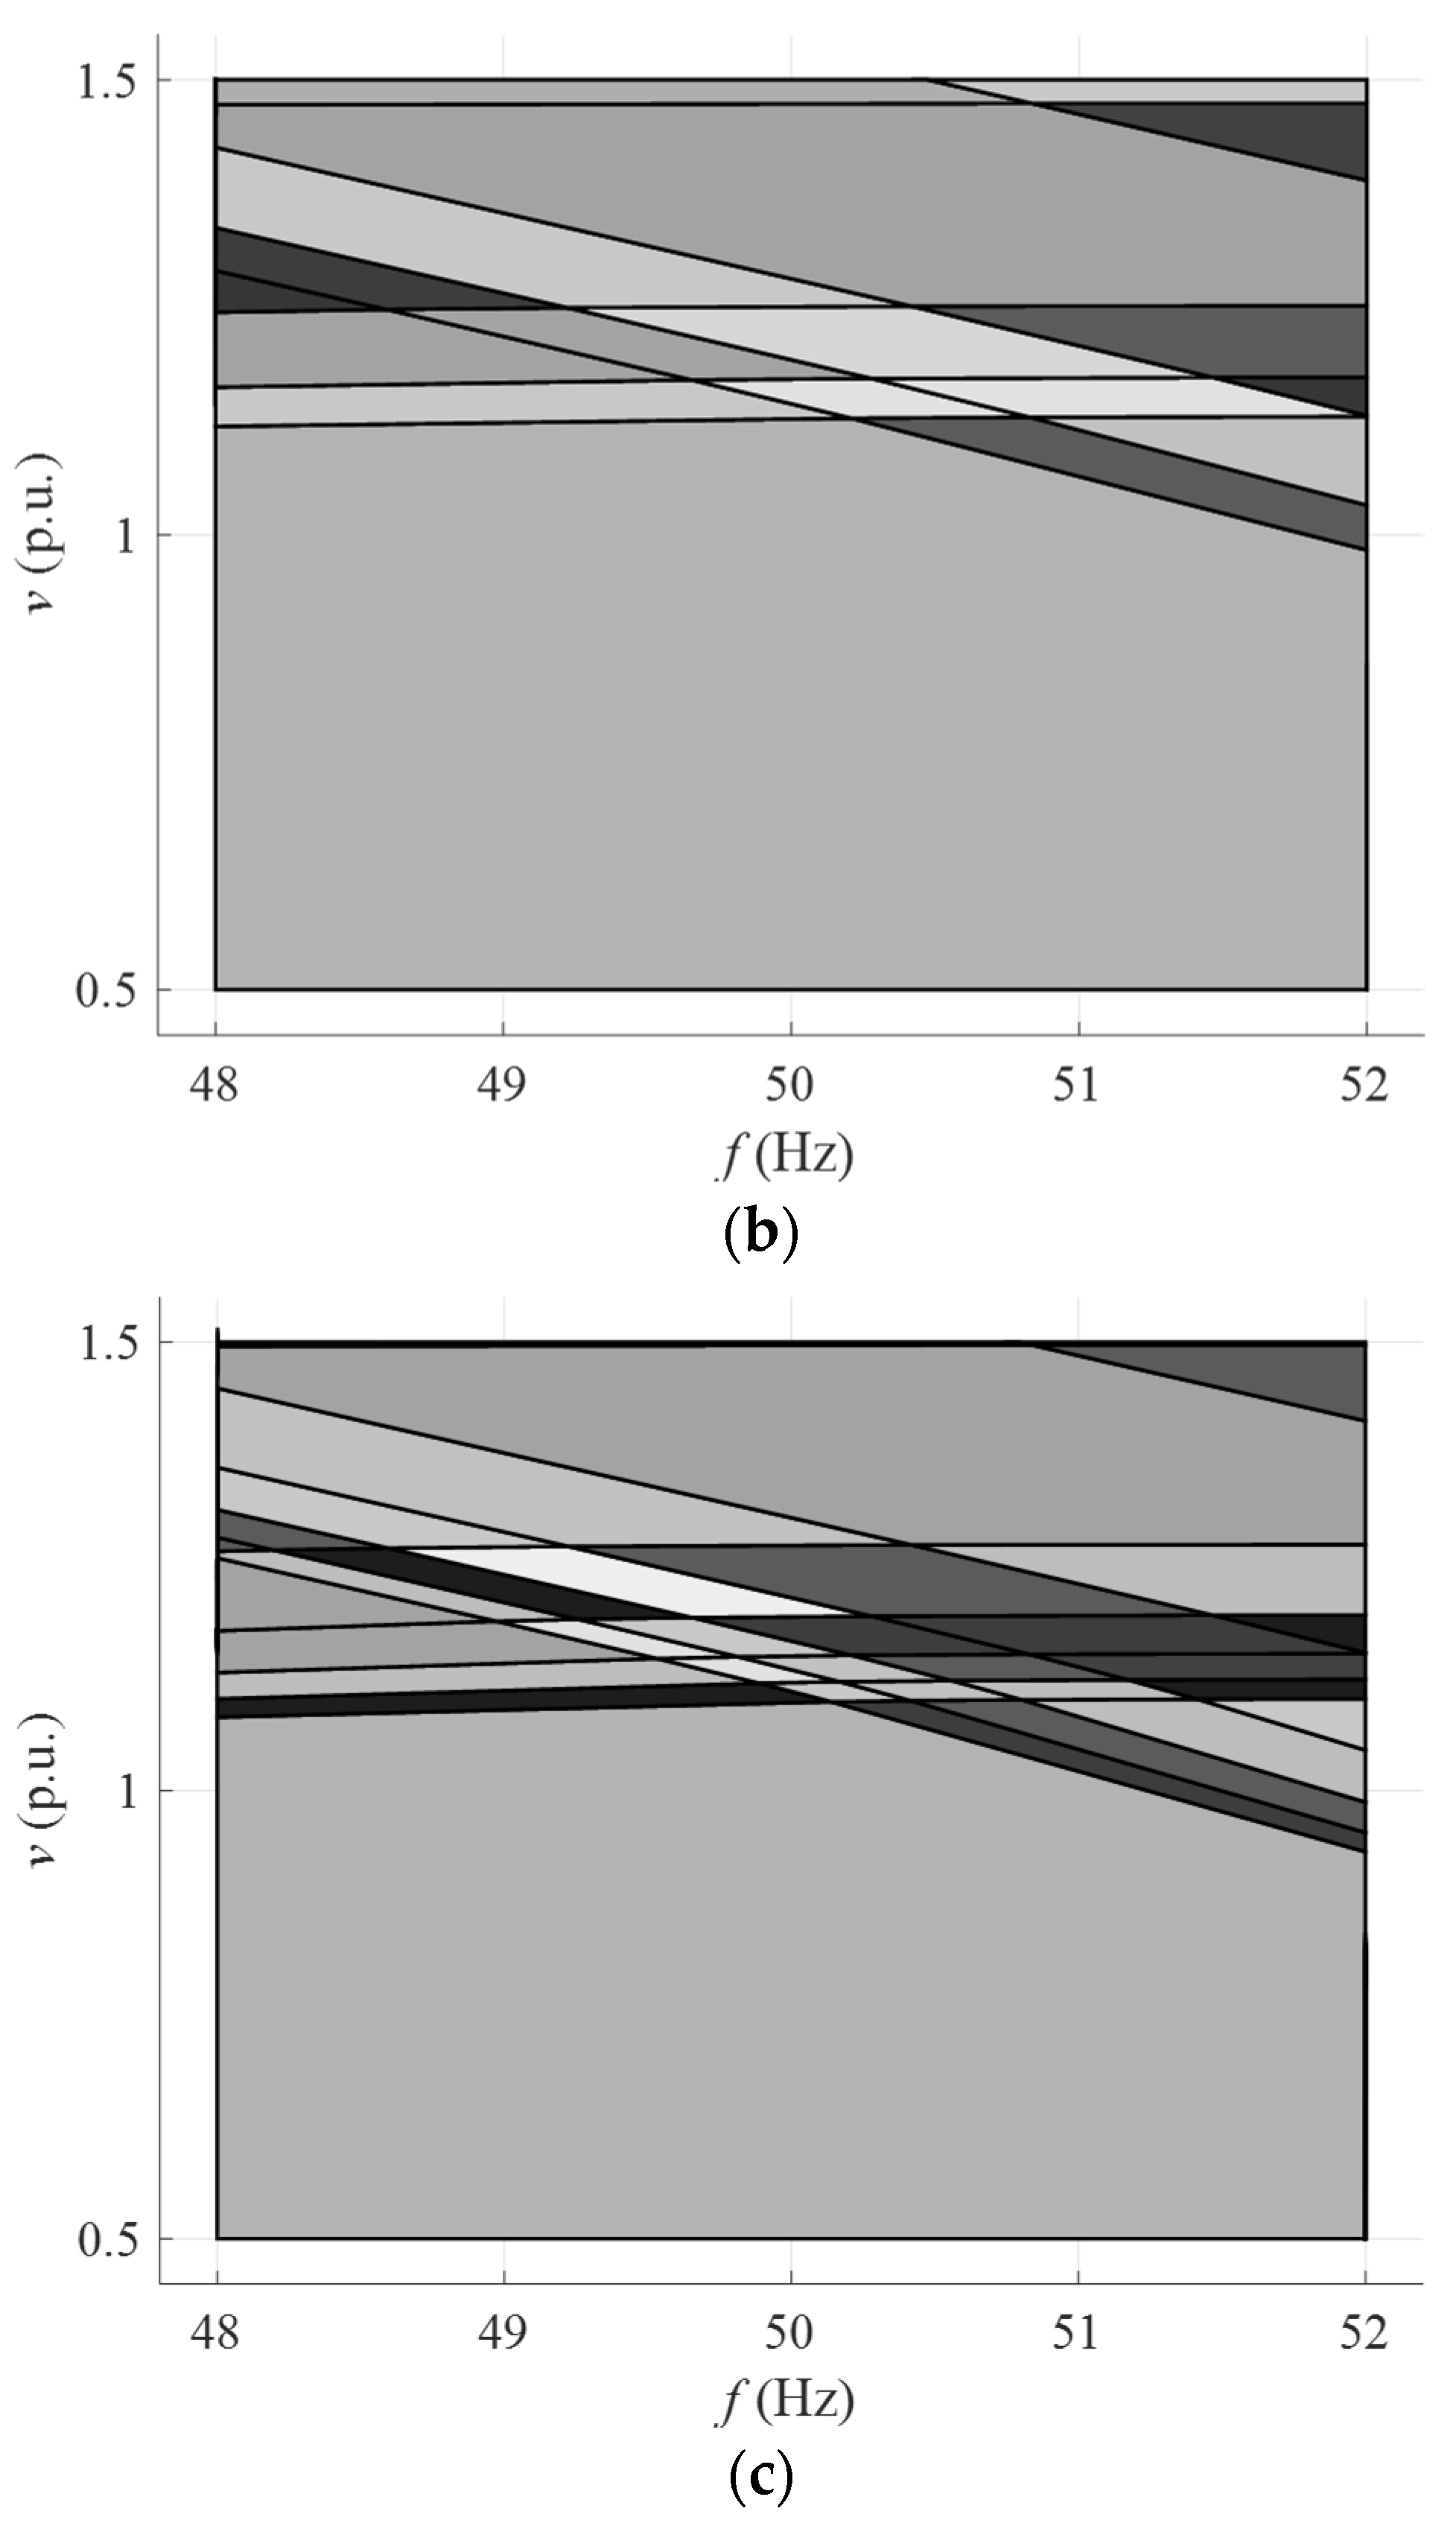
  • The proposed control strategy addresses constraints using the Karush–Kuhn–Tucker (KKT) condition and effectively handles the multiparametric quadratic programming problem [22]. The controllers ensure that the power output of the wind farm remains within the specified limits.
  • The simulation allows for adaptable modifications to the control magnitude. By adjusting the prediction horizons of the EMPC controller, the amplitude of the active and reactive power output from the wind farm can be customized.
Consequently, this control strategy presented in the study can effectively manage any scenario involving frequency and voltage regulation resulting from unexpected load fluctuations.
The subsequent sections of this article are organized logically as follows: Section 2 elaborates on the investigated power grid models for bus voltage and grid frequency. Section 3 describes the control approach on the basis of EMPC. Section 4 presents the simulation setup and results. Finally, Section 5 provides the conclusions drawn from the study.

2. System Description and Modeling

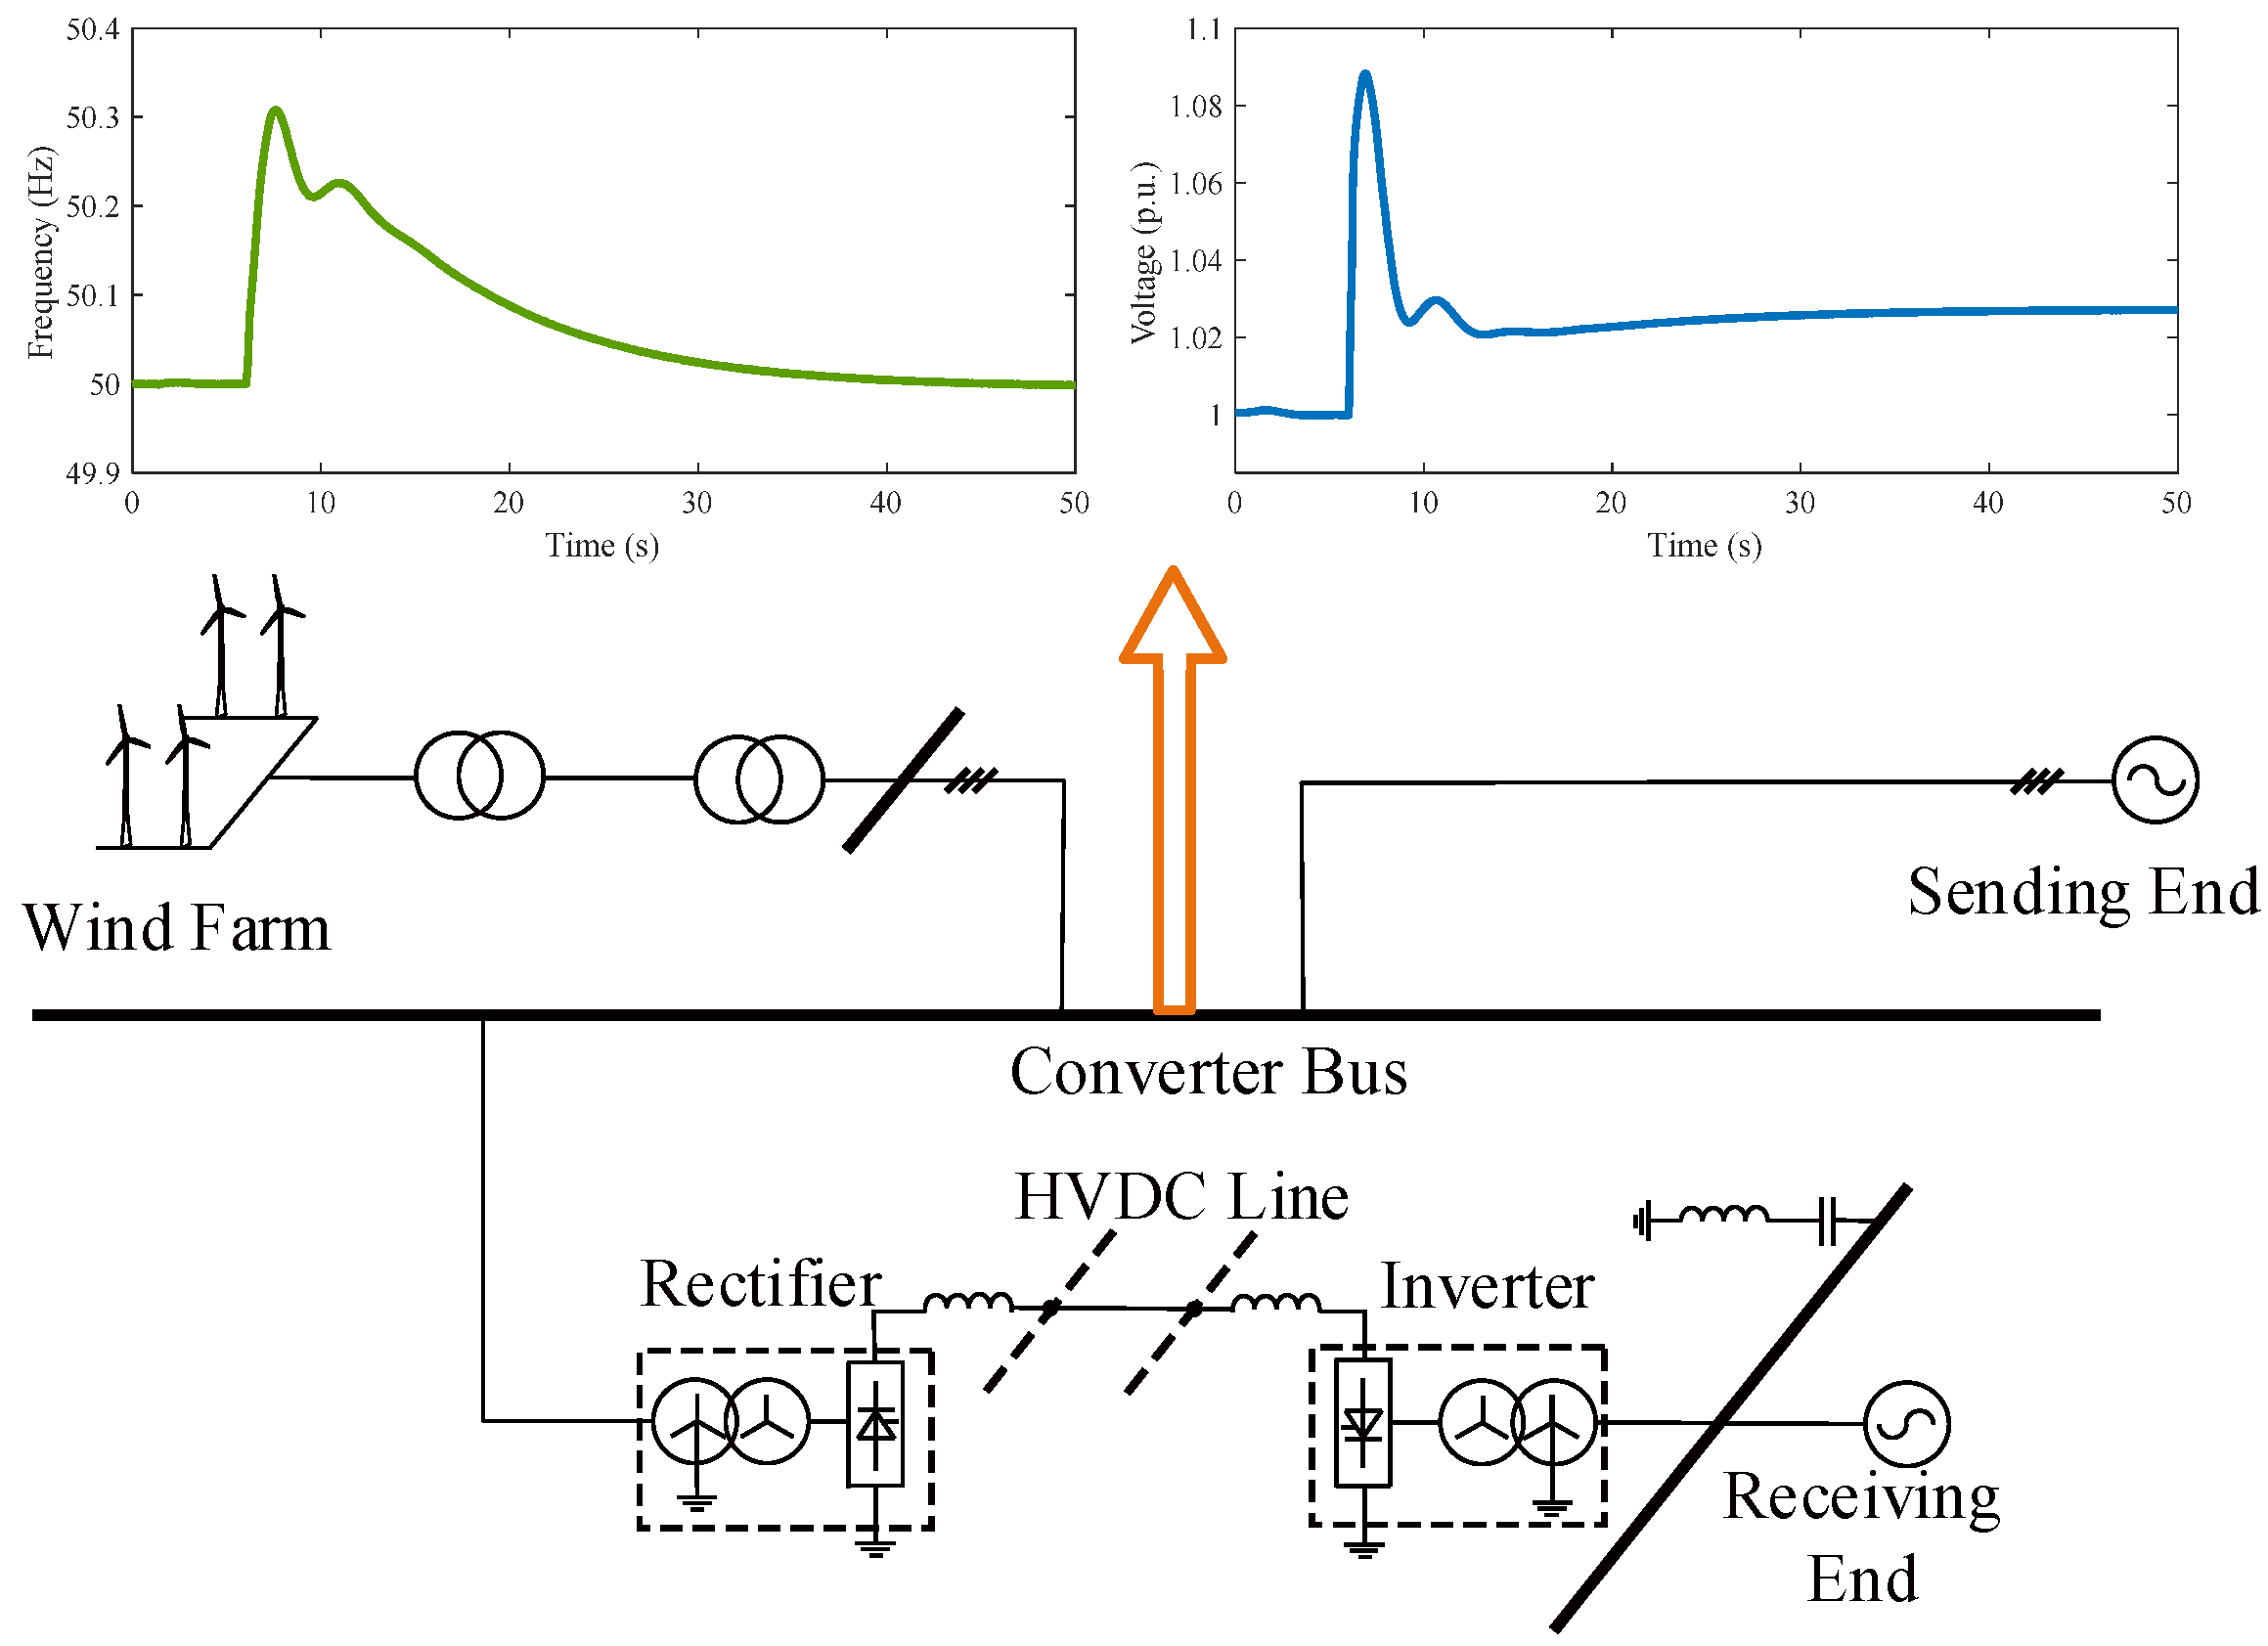
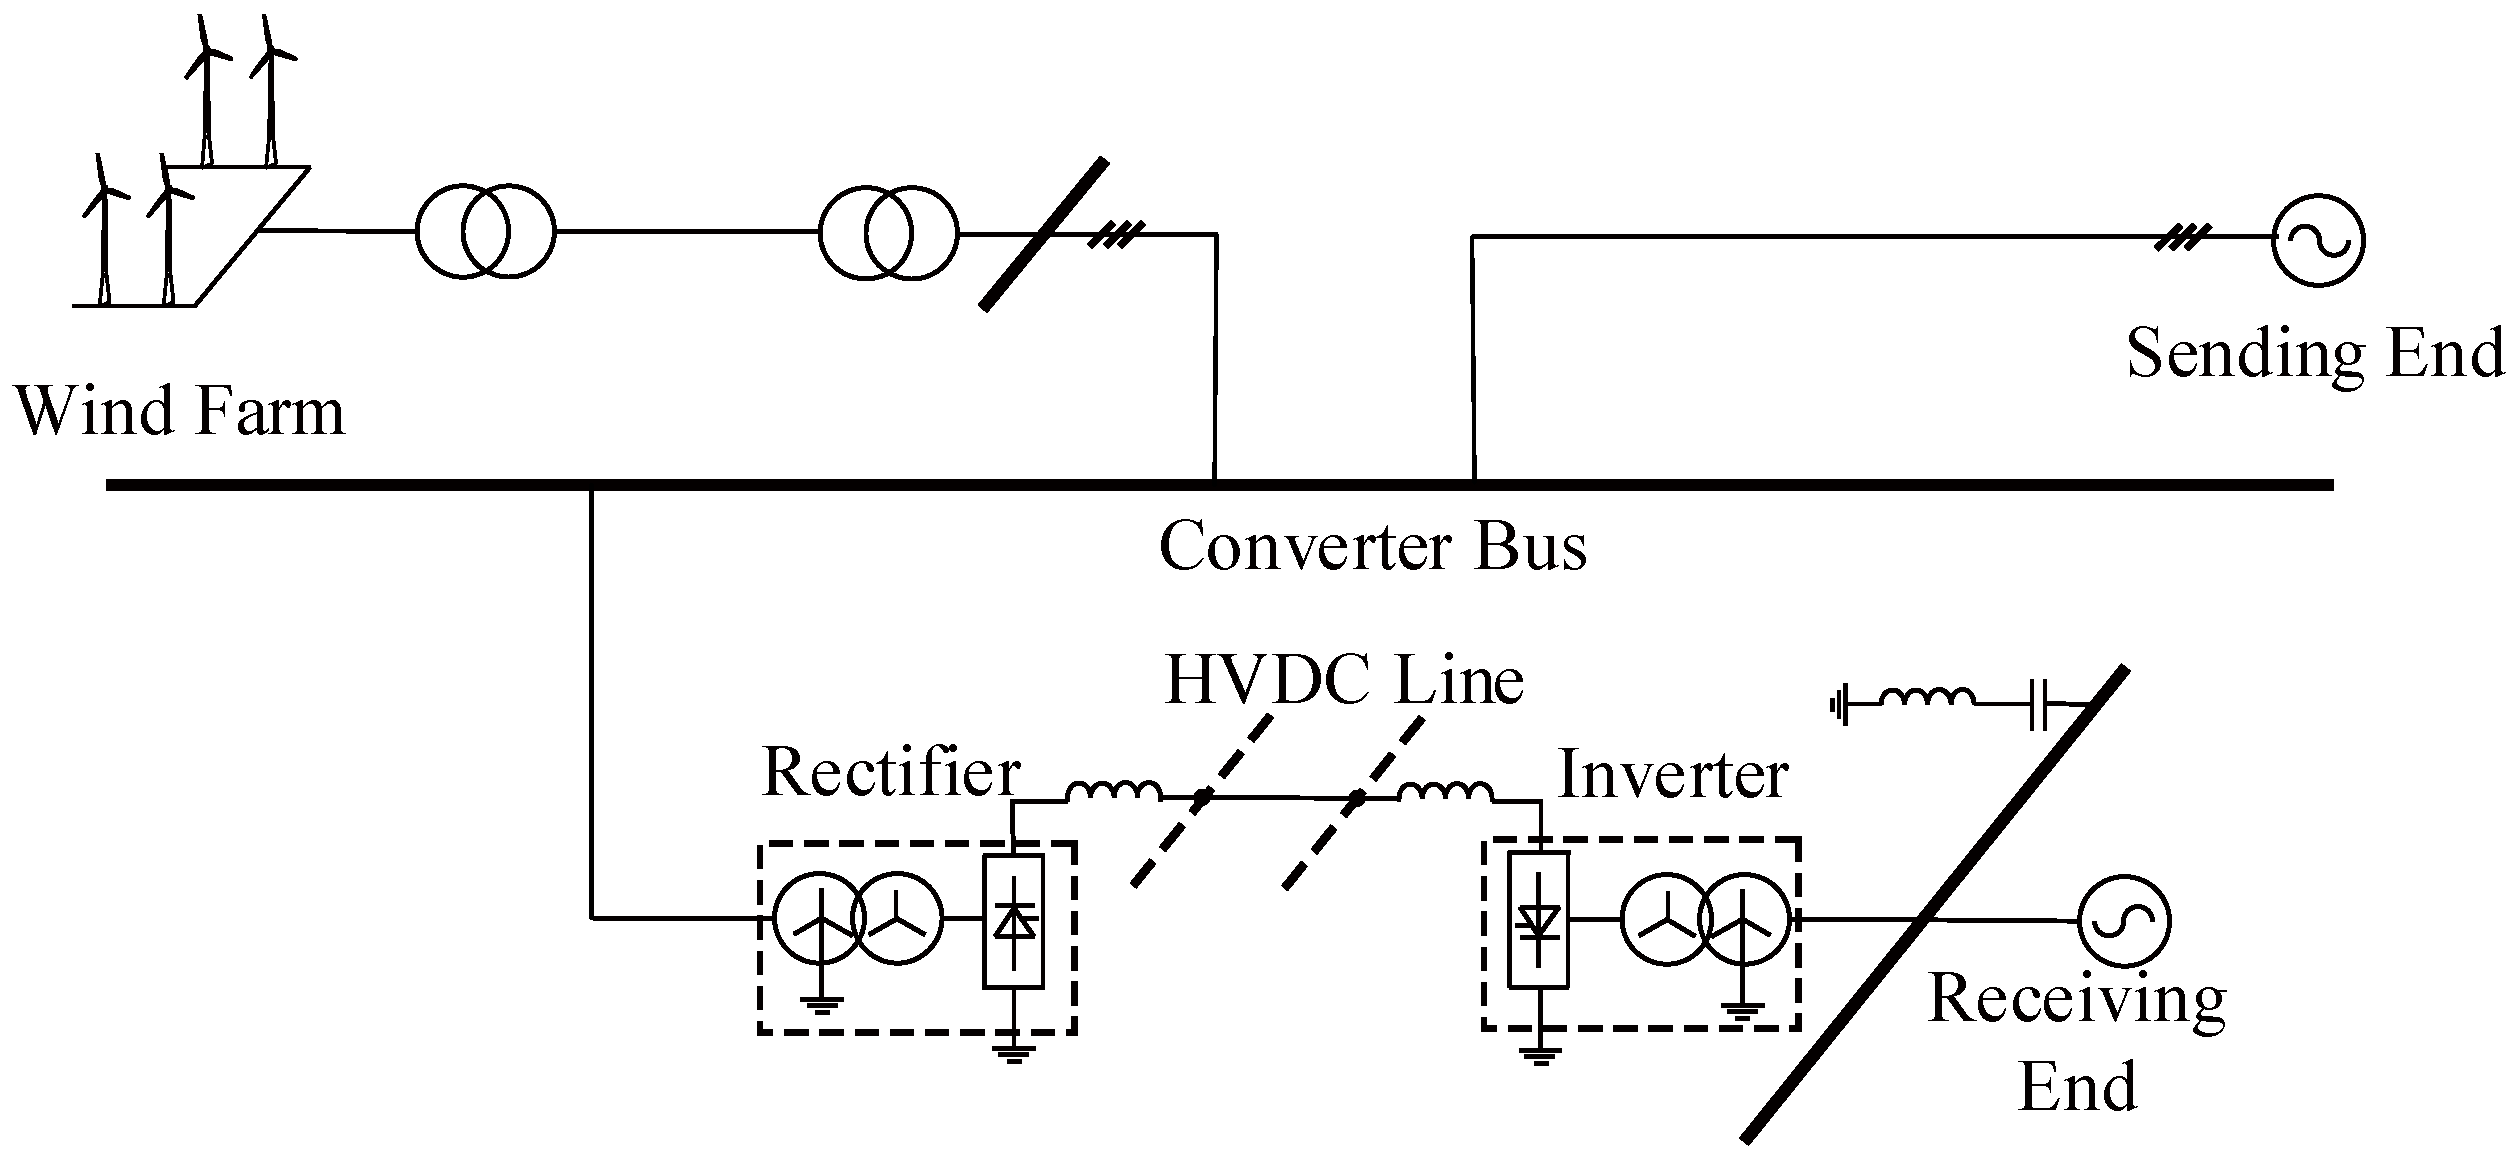
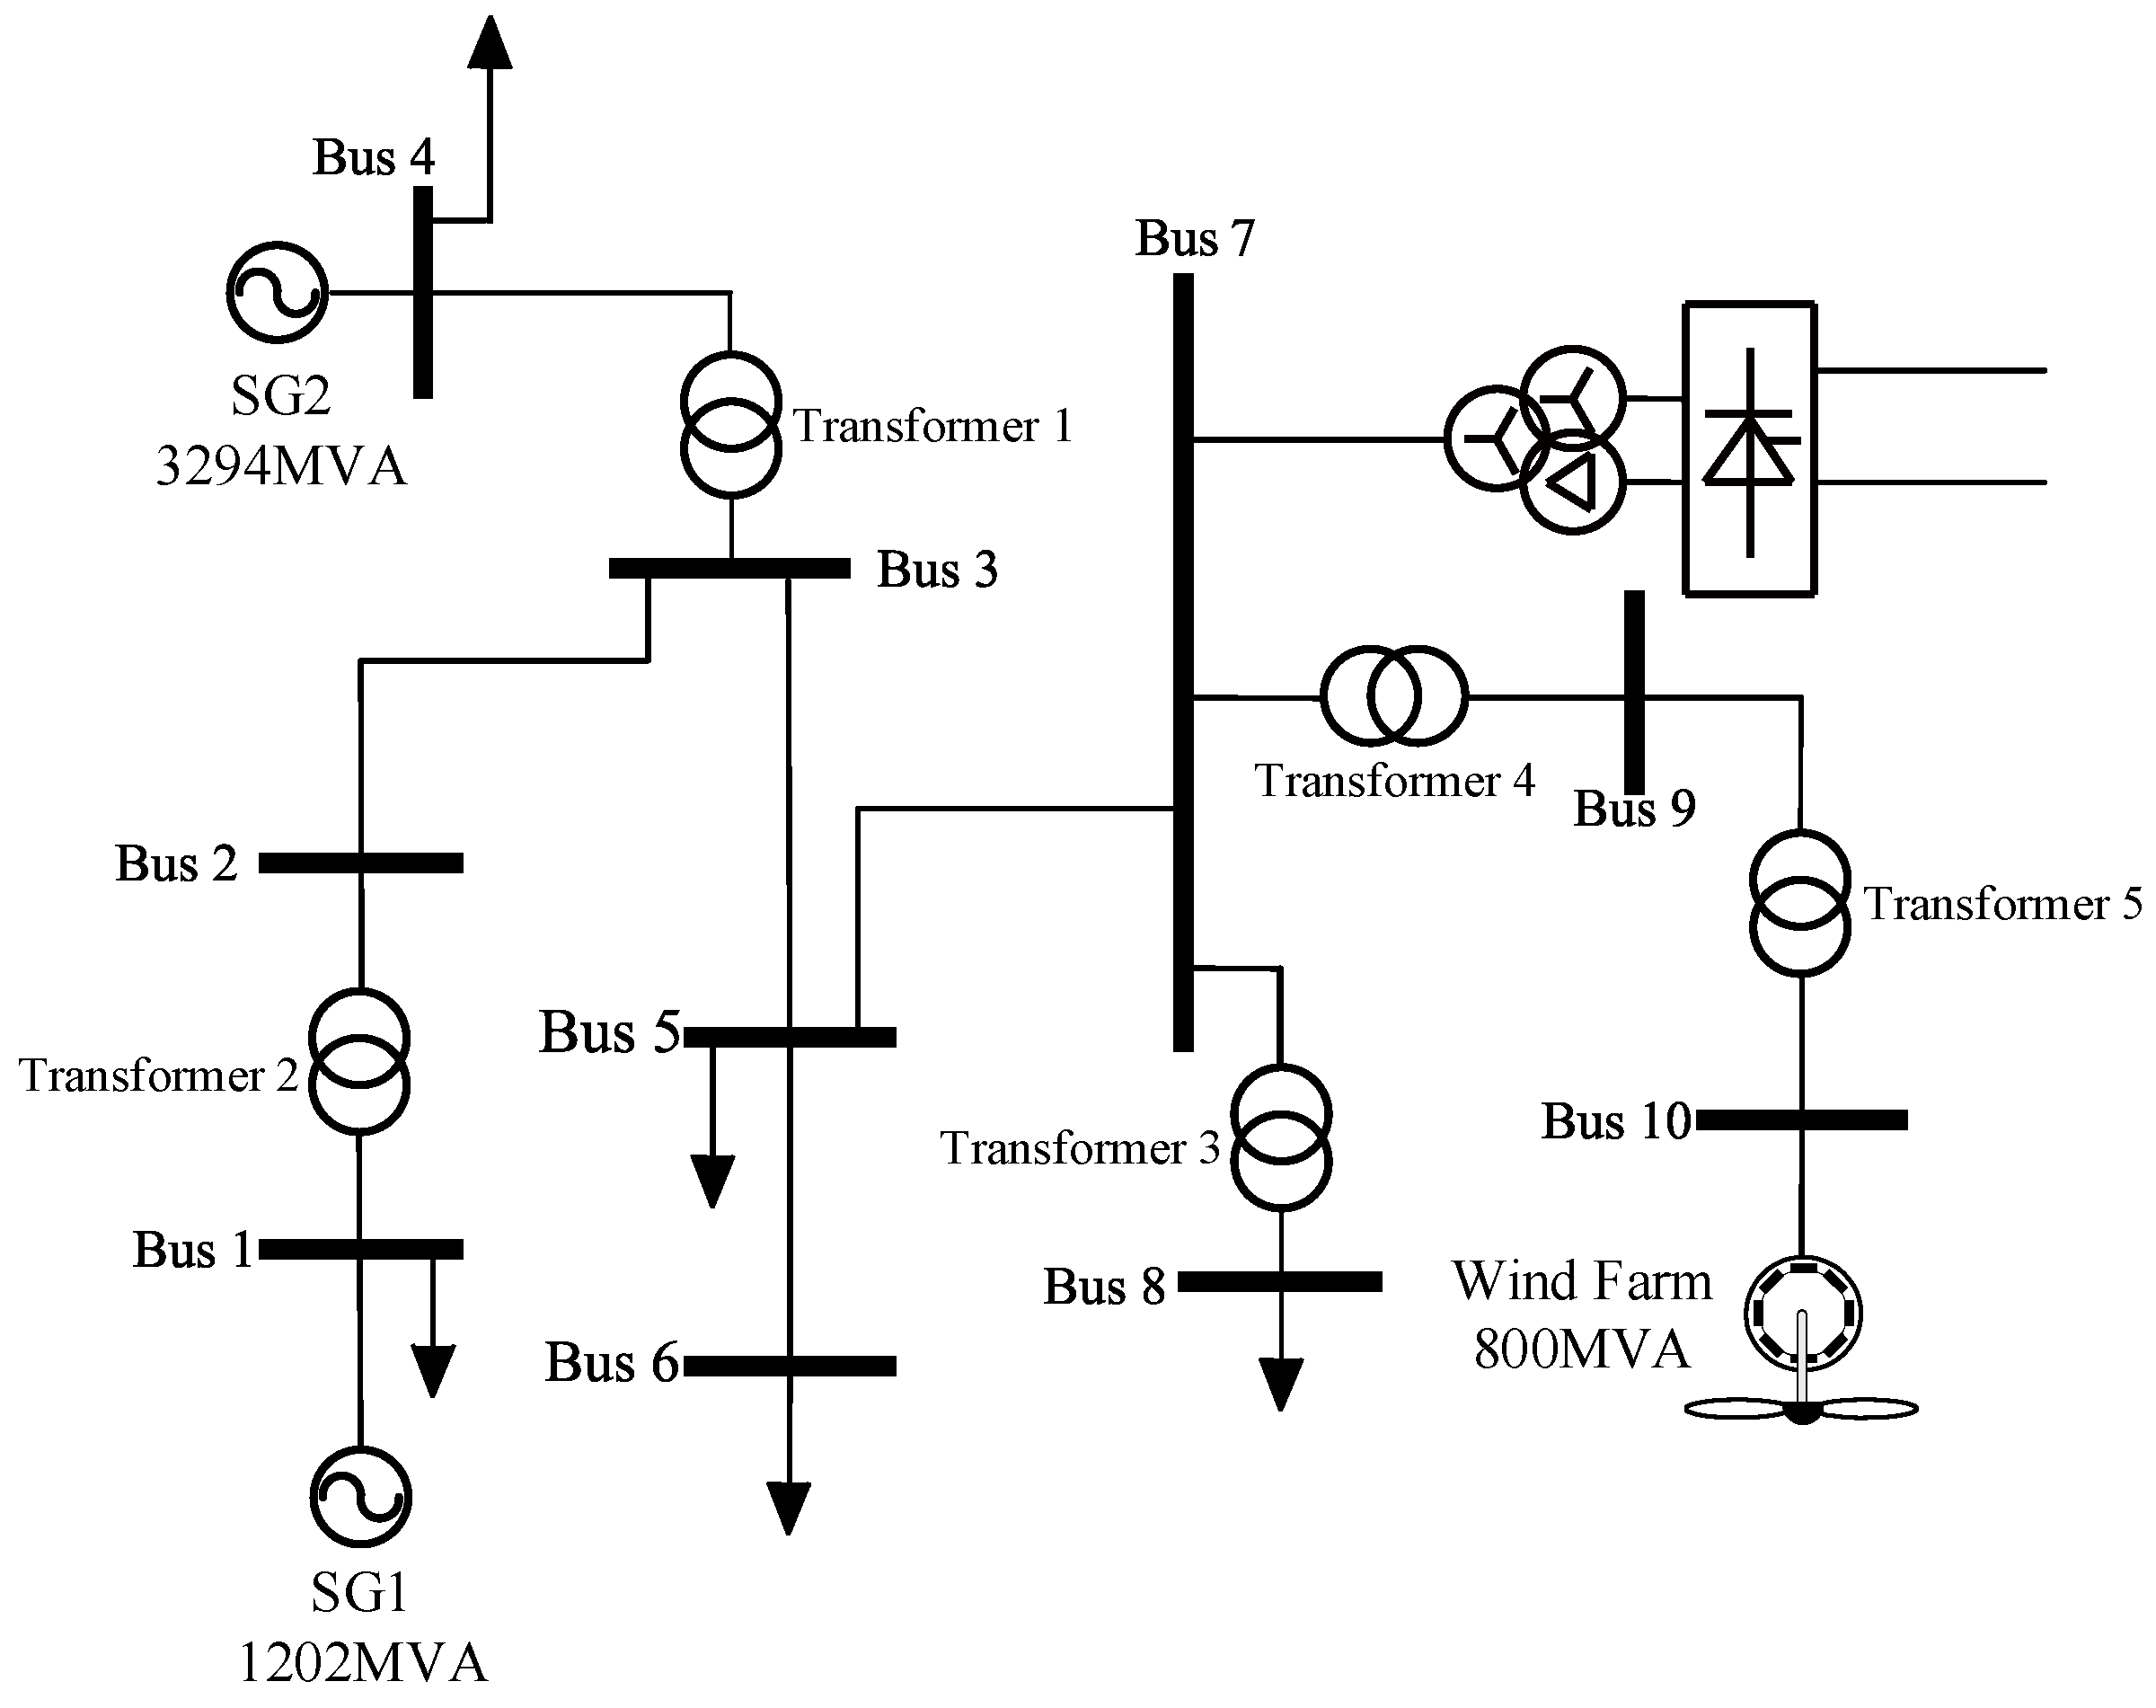
2.1. System Description

Figure 2 illustrates the investigated power system, encompassing a large wind farm and components of the HVDC transmission system. These components include the rectifier station, the DC line, the inverter station, and the power system at the receiving end. To connect the wind farm to the converter bus, setup transformers are employed, serving as integral elements of the HVDC sending-end power grid.

2.2. Frequency Dynamics Model

The power system’s grid frequency is dependent on the active power balance within the system. In cases where the active power generated does not align with the active power load demand, the system frequency will deviate according to the power imbalance. Consequently, a deviation from the nominal frequency will occur. The time-varying nature of the frequency fluctuation can be approximated using references [23,24].
2 H f n d f d t = P SG P L + P WF + D f P LN f n f f n .
The equation described is commonly referred to as the swing equation. Here, H denotes the inertia time constant, fn denotes the nominal system frequency, f denotes the current system frequency, t denotes the current time, PSG denotes the active power of the synchronous generators, PWF denotes the wind farm active power, and PL denotes the grid load. PLN denotes the load demand of the power grid with the nominal system frequency, and Df is the damping factor.

2.3. Voltage Dynamics Model

In the HVDC system, the converter bus voltage of the sending-end grid is influenced by both active and reactive power. Therefore, the voltage magnitude at the sending-end converter bus can be approximated using the Taylor approximation [23,24], as shown in Equation (2).
v o ,   k = v o ,   k 1 + v o ,   k 1 P WF Δ P W + v o ,   k 1 Q WF Δ Q WF ,
where vo, k denotes the voltage magnitude of the converter bus at the time step k, ΔPWF and ΔQWF represent the various active or reactive power inputs generated by the wind farm, and ∂vo,k/∂PWF and ∂vo,k/∂QWF are the voltage sensitivities. Applying the updated Jacobean matrix as a foundation for the Newton–Raphson power flow problem is an effective approach for calculating voltage sensitivity.

3. Control Strategy

3.1. Control Principle

This study aims to develop a cooperative control approach for the wind farm that can effectively provide both voltage and frequency support in the power system. To mitigate over-frequency conditions, it is essential to decrease the wind farm active power. Similarly, to address overvoltage situations, reductions in both active and reactive power are required. The reliable operation of the power grid at the sending end necessitates the control of active and reactive power within specific power limits for the wind farm. A crucial challenge is how to achieve simultaneous regulation of frequency and voltage during HVDC blocking events. To address this, an EMPC-based controller is employed in this strategy, which facilitates multiobjective control while adhering to the imposed constraints. By implementing this control strategy, the wind farm can contribute to maintaining the stability of the power system by regulating both frequency and voltage.
The proposed control strategy is illustrated in Figure 3, providing an overview of the proposed approach. The EMPC controller plays a crucial role in this strategy by monitoring the frequency f and voltage v at the sending-end grid and comparing them to predefined reference values. These reference values are carefully determined by the system to ensure efficient and reliable operation of the power grid. In the event of a converter-blocking incident at an HVDC converter station, both the voltage v and frequency f will deviate from their respective reference values. To effectively coordinate with various subcontrollers, the EMPC controller requires information on the previous moment’s active and reactive power from the wind farm. By utilizing system information, e.g., the voltage sensitivities, the EMPC controller calculates the references for the active and reactive power of the wind farm, denoted as Pref and Qref, respectively.
Voltage sensitivity quantifies the extent of voltage changes at a specific point in the system when there is a variation in generator power output. Subsequently, the calculated references for active and reactive power are communicated to the wind farm for control purposes. It is worth noting that the communication delay typically falls within the millisecond timeframe, which is significantly shorter than the time required for wind turbines to adjust their rotational speed. Therefore, the communication delay does not adversely affect the performance of the proposed control strategy [23].

3.2. EMPC Controller Design

The EMPC controller primarily aims to compute the references of active power and reactive power, Pref and Qref, for the wind farm when the HVDC blocking occurs. To capture the dynamics of the system frequency and converter bus voltage, a discrete-time model is developed using the zero-order-hold discretization method. By incorporating Equations (1) and (2), the system frequency and converter bus voltage dynamics are rewritten as follows [23]:
f k + 1 = f k + T s f n 2 H ( P SG P L + P WF + D f P LN ( f n f f n ) ) , v k + 1 = v k + v k P WF ( P WF , k P WF , k 1 ) + v k Q WF ( Q WF , k Q WF , k 1 ) ,
where k represents the time step, and Ts denotes the sampling time. The system’s state space equation can be written by connecting the two equations as
x k + 1 = A x k + B u k + f , y k = C x k ,
with
x k = f k v k T , y k = f k v k T , u k = Δ P WF ,   k Δ Q WF ,   k T , A = 1 0 0 1 , B = T s f n 2 H 0 v k P WF v k Q WF , C = 1 0 0 1 , f = T s f n 2 H ( P G P L ) v k P WF P WF ,   k - 1 v k Q WF Q WF ,   k - 1 .
The prediction model for EMPC is the one given above. f and v are the control outputs, and PWF and QWF are the control inputs.
Alternatively, EMPC determines the control laws in an explicit form during an offline process. The EMPC controller operates within a prediction and control horizon denoted as N. The optimization problem solved by EMPC is indicated as [25].
min J = Δ x k + N | k T Φ p Δ x k + N | k + i = 0 N 1 Δ x k + i | k T Φ x Δ x k + i | k + Δ u k + i | k T Φ u Δ u k + i | k , s . t .   x k + 1 = A x k + B u k + f , x min x k + i | k x max , i = 1 , , N , u min u k + i | k u max , i = 0 , 1 , , N 1 ,
where Φp is the terminal penalty matrix, and the weighting matrices are Φx and Φu. The state variable xk+i|k at the time step i can be written as follows using the above-mentioned prediction model
x k + i | k = A i x k + j = 0 i 1 A j B u k + i 1 j | k .
Combining (5) with (6), the cost function is expressed as
J ( x k ) = 1 2 x k T Y x k + min U 1 2 U T H U + x k T F U , s . t .   G U W + E x k
Here, xk represents the state value at the current moment k, and Y, H, F, G, W, and E are constant parameters. The aforementioned optimization proposition’s KKT condition is
H u * + F T x k G a T λ a * = 0 , G a u * = W a + E a x k , λ i * = 0 , G i u * W i + E i x k , λ a * 0 ,
where λ is the Lagrange multiplier, the superscript * represents the optimal value, and the subscripts a and i stand for active and inactive constraints, respectively. The following equation can be established using the two equations in (8).
H G a T G a 0 u * λ a * = 0 W a F T E a x k .
According to the above equation, we can obtain
u * = K a x x k + c u ,
λ a * = L a x x k + c λ ,
with
c u = H 1 G a T ( G a H 1 G a T ) 1 W a , K a x = H 1 G a T ( G a H 1 G a T ) 1 ( G a H 1 F T + E a ) H 1 F T , c λ = ( G a H 1 G a T ) 1 W a , L a x = ( G a H 1 G a T ) 1 ( G a H 1 F T + E a ) .
By replacing the variables of the inequality in the KKT condition with (10) and (11), we can obtain
L a x x k + c λ 0 , G i K a x x k + ( G i c u W i E i x k ) 0 .
Since the above-mentioned inequalities are all linear inequalities with respect to the current moment state xk, the state space can be divided into a number of separate critical regions. In each of the critical regions, a control law can be obtained. The critical regions and control laws are calculated beforehand. Different critical regions are chosen based on the state values, and corresponding control laws are applied [26].

3.3. Wind Farm Local Controller Design

This research centers on the direct-drive wind energy conversion system (WECS) employing a permanent magnet synchronous generator (PMSG). This system, denoted as PMSG-based WECS, has gained widespread adoption in commercial setups and holds particular appeal for expansive wind farms [27]. The local control mechanism for the wind farm is designed to uphold either the pursuit of maximum power point tracking or the attainment of nominal torque generation. In accordance with the mechanical dynamic model, the amount of aerodynamic power, denoted as Pa, that can be harnessed by the turbine blades is represented as follows:
P a = 1 2 ρ π R 2 C p β , λ W s 3 ,
where ρ is the air density, R is the radius of the turbine blade, Ws is the wind speed faced by the PMSG, and Cp is the power coefficient for the given pitch angle β and tip-speed-ratio λ. The aerodynamic power Pa is transmitted to the generator by a shaft, whose dynamical behavior can be described as
d ω d t = 1 J C ( T m T e ) = 1 J C ( P a ω P e ω ) .
Here, ωi is the rotor mechanical angular speed, JC is the combined inertia of the wind turbine and generator, Tm is the mechanical torque of the wind turbine, and Te is the electromagnetic torque of PMSG. From (14), we see that Te directly depends on the PMSG active output power Pe [28].
It is feasible to write the electrical dynamic model of PMSG in d-q coordinate as
d i d d t = R W L d i d + p L q L d ω i q + 1 L d v d d i q d t = p L d L q w i d R W L q i q + 1 L q v q p ω φ L q .
Here, id is the d-axis stator current, iq is the q-axis stator current, Rw is the winding resistance, Ld is the d-axis inductance, Lq is the q-axis inductance, p is the pole pairs, ω is the rotor angular speed, vd is the d-axis stator voltage, vq is the q-axis stator voltage, and φ is the permanent magnetic flux. In this study, the local control of the wind farm is classical PID control. The PID control strategy is shown in Figure 4 [29].

4. Simulation Studies

4.1. Simulation Setup

In this part, a series of simulations are conducted to assess the efficacy of the proposed control strategy. All of the simulations are executed using MATLAB and Simulink platforms. The power grid utilized in the simulations comprises two conventional generators, one large wind farm, and the HVDC transmission line. This study employs the power system with a single-line depicted in Figure 1 as the foundation for the analysis of the simulations.
Figure 5 depicts the arrangement of the simulation configuration. The simulation framework is established upon a 10-node power system model. The original grid frequency stands at 50 Hz, with a prescribed tolerance band of 20 mHz. The conventional generators are emulated using the representative synchronous generators. In order to replicate the wind farm scenario, a prototypical permanent magnet synchronous generator is deployed. In the proposed setup, two conventional generators are incorporated, characterized by nominal active power capacities of 1202 MW and 3294 MW, correspondingly. SG1 is linked to Bus 1 within the power system, whereas SG2 is interconnected with Bus 4. Our cumulative consumption of active power in all loads is approximately 4500 MW. The wind farm with a nominal power capacity of 800 MVA is connected to the system on Bus 10 through a three-phase transformer. The HVDC transmission system operates on Bus 7 at the nominal active power of 500 MW (500 kV/1 kA) [30]. Table 1 displays the parameters for each three-phase transformer in the simulation model. Similarly, Table 2 displays the parameters of the AC line impedances. The time step in simulations is set as 0.1 ms.
In the offline-controlled EMPC approach, predetermined affine control laws are utilized in the simulation. The control strategy is divided into five EMPC controllers, which are categorized based on the variations in the constant terms in the system model. Each controller includes a prediction model with a specific constant term. Specifically, since the nominal active power of HVDC in operation is 500 MW, the maximum active power surplus during converter blocking is 500 MW. In the event of blocking, the wind farm’s active power output experiences a maximum decrease of 500 MW, and the controller is divided into segments of 100 MW for calculation purposes. These constant terms, referred to as Pk−1 and Qk−1, are arranged in ascending order for the prediction models of the five controllers: [800 MW, 0 MVar], [700 MW, −50 MVar], [600 MW, −100 MVar], [500 MW, −150 MVar], and [400 MW, −200 MVar]. Throughout the operation, the parameter input for the model is the active power generated by the wind farm in the previous time step, and the selection of the appropriate controller depends on the active power value at the previous time step. Additionally, a constraint is imposed to ensure that the wind farm’s active power output remains within a feasible range. The weighting matrices used by all five controllers are identical, and a prediction time horizon of 5 is set for each controller.
Figure 6 depicts the critical region diagrams associated with the controllers, where each subfigure represents the frequency along the horizontal axis and the voltage along the vertical axis. The critical regions are visually distinguished by employing various colors. Within each critical region, when both the frequency and voltage fall within that particular region, a specific control law is obtained [26]:
u = F i x + g i . if   A i x b i
The matrices Fi, gi, Ai, and bi represent parameter matrices. These matrices are computed for each critical region using Equations (8)–(12) and exhibit variations among different critical regions. To explain the meaning of Figure 6, the control law for the three selected critical regions, i.e., control regain A, control regain B, and control regain C, in Figure 6a are presented in Table 3.

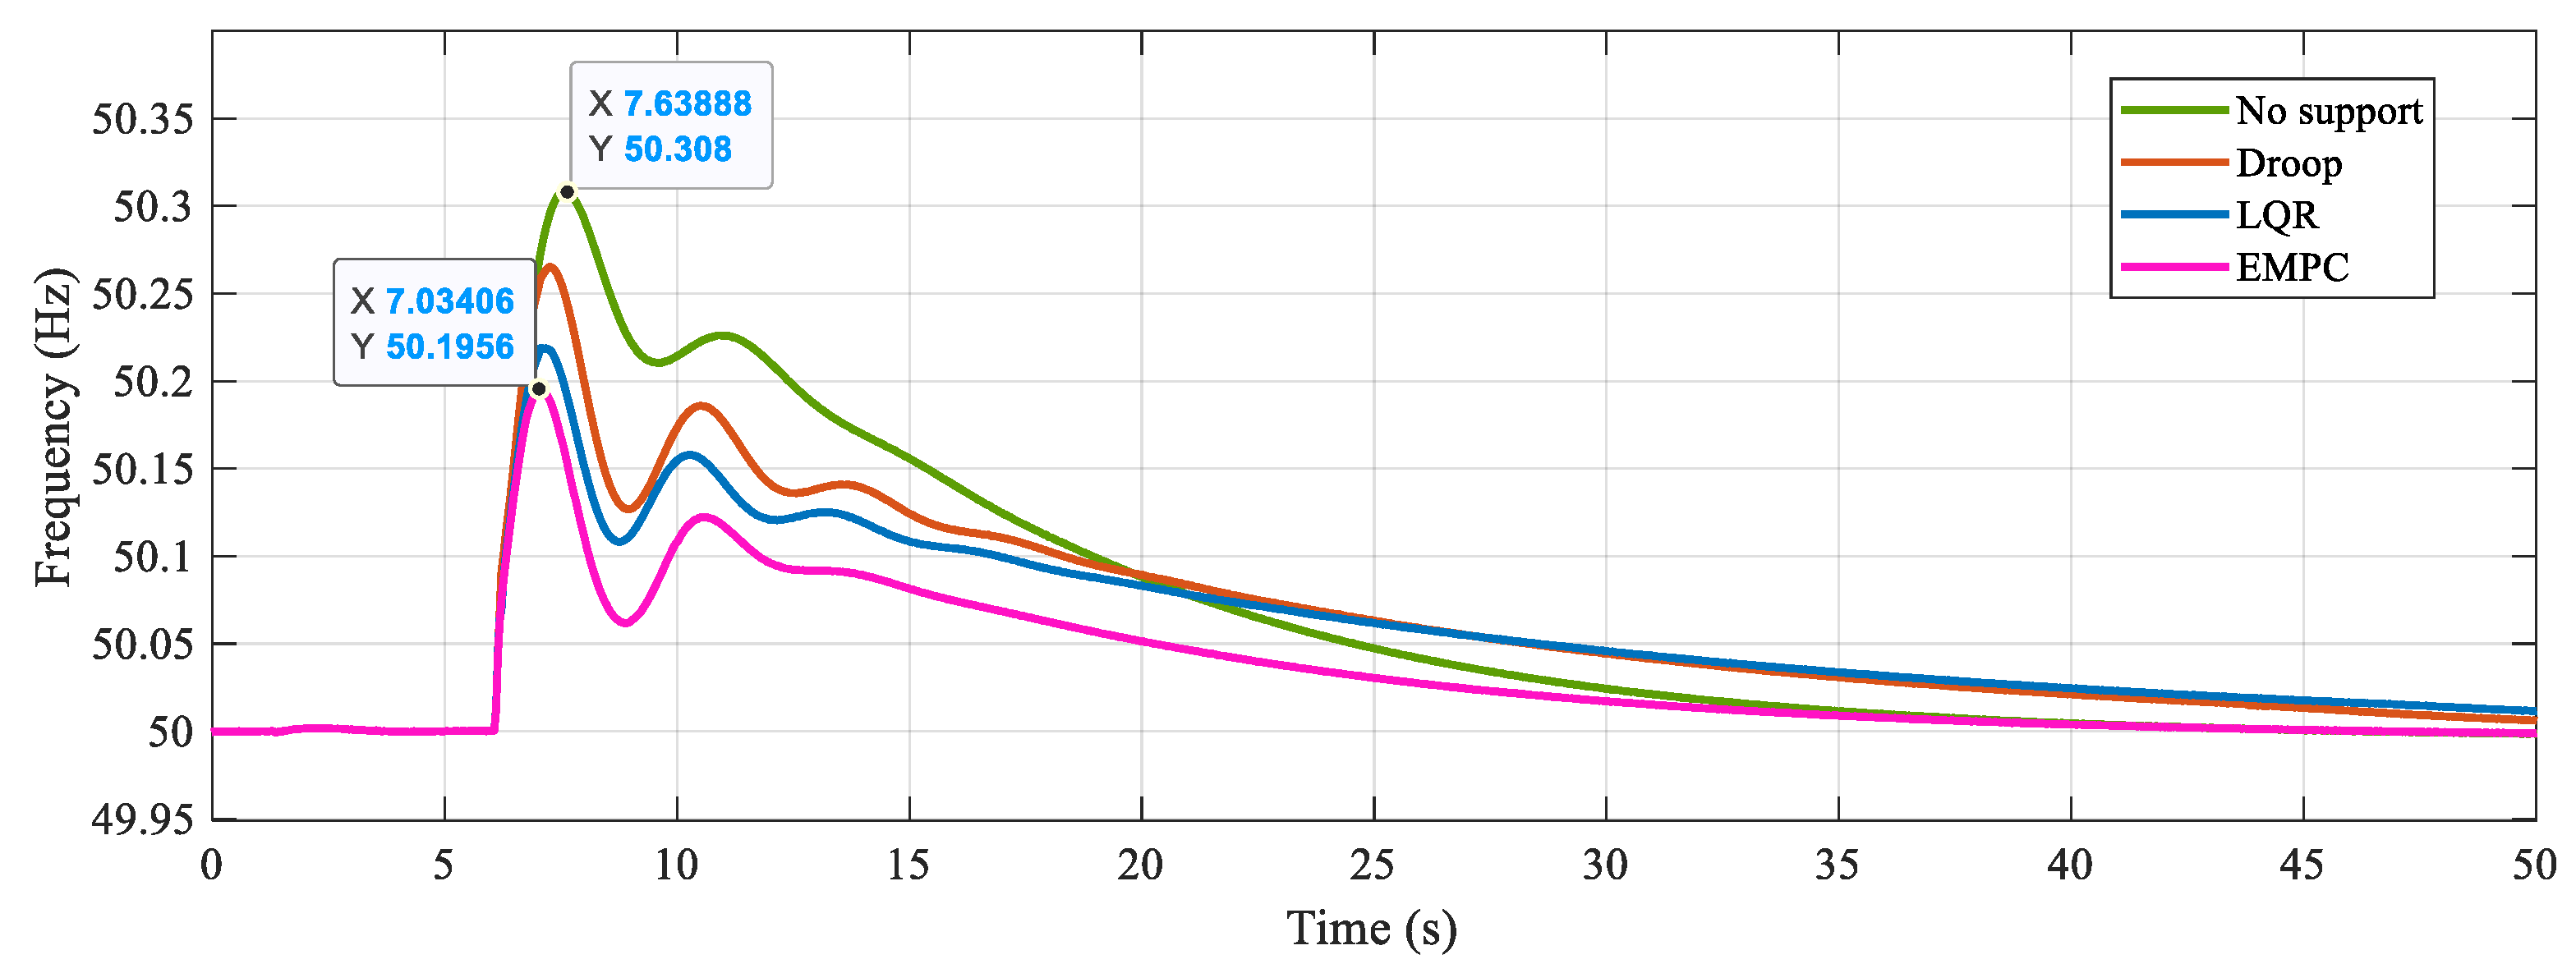
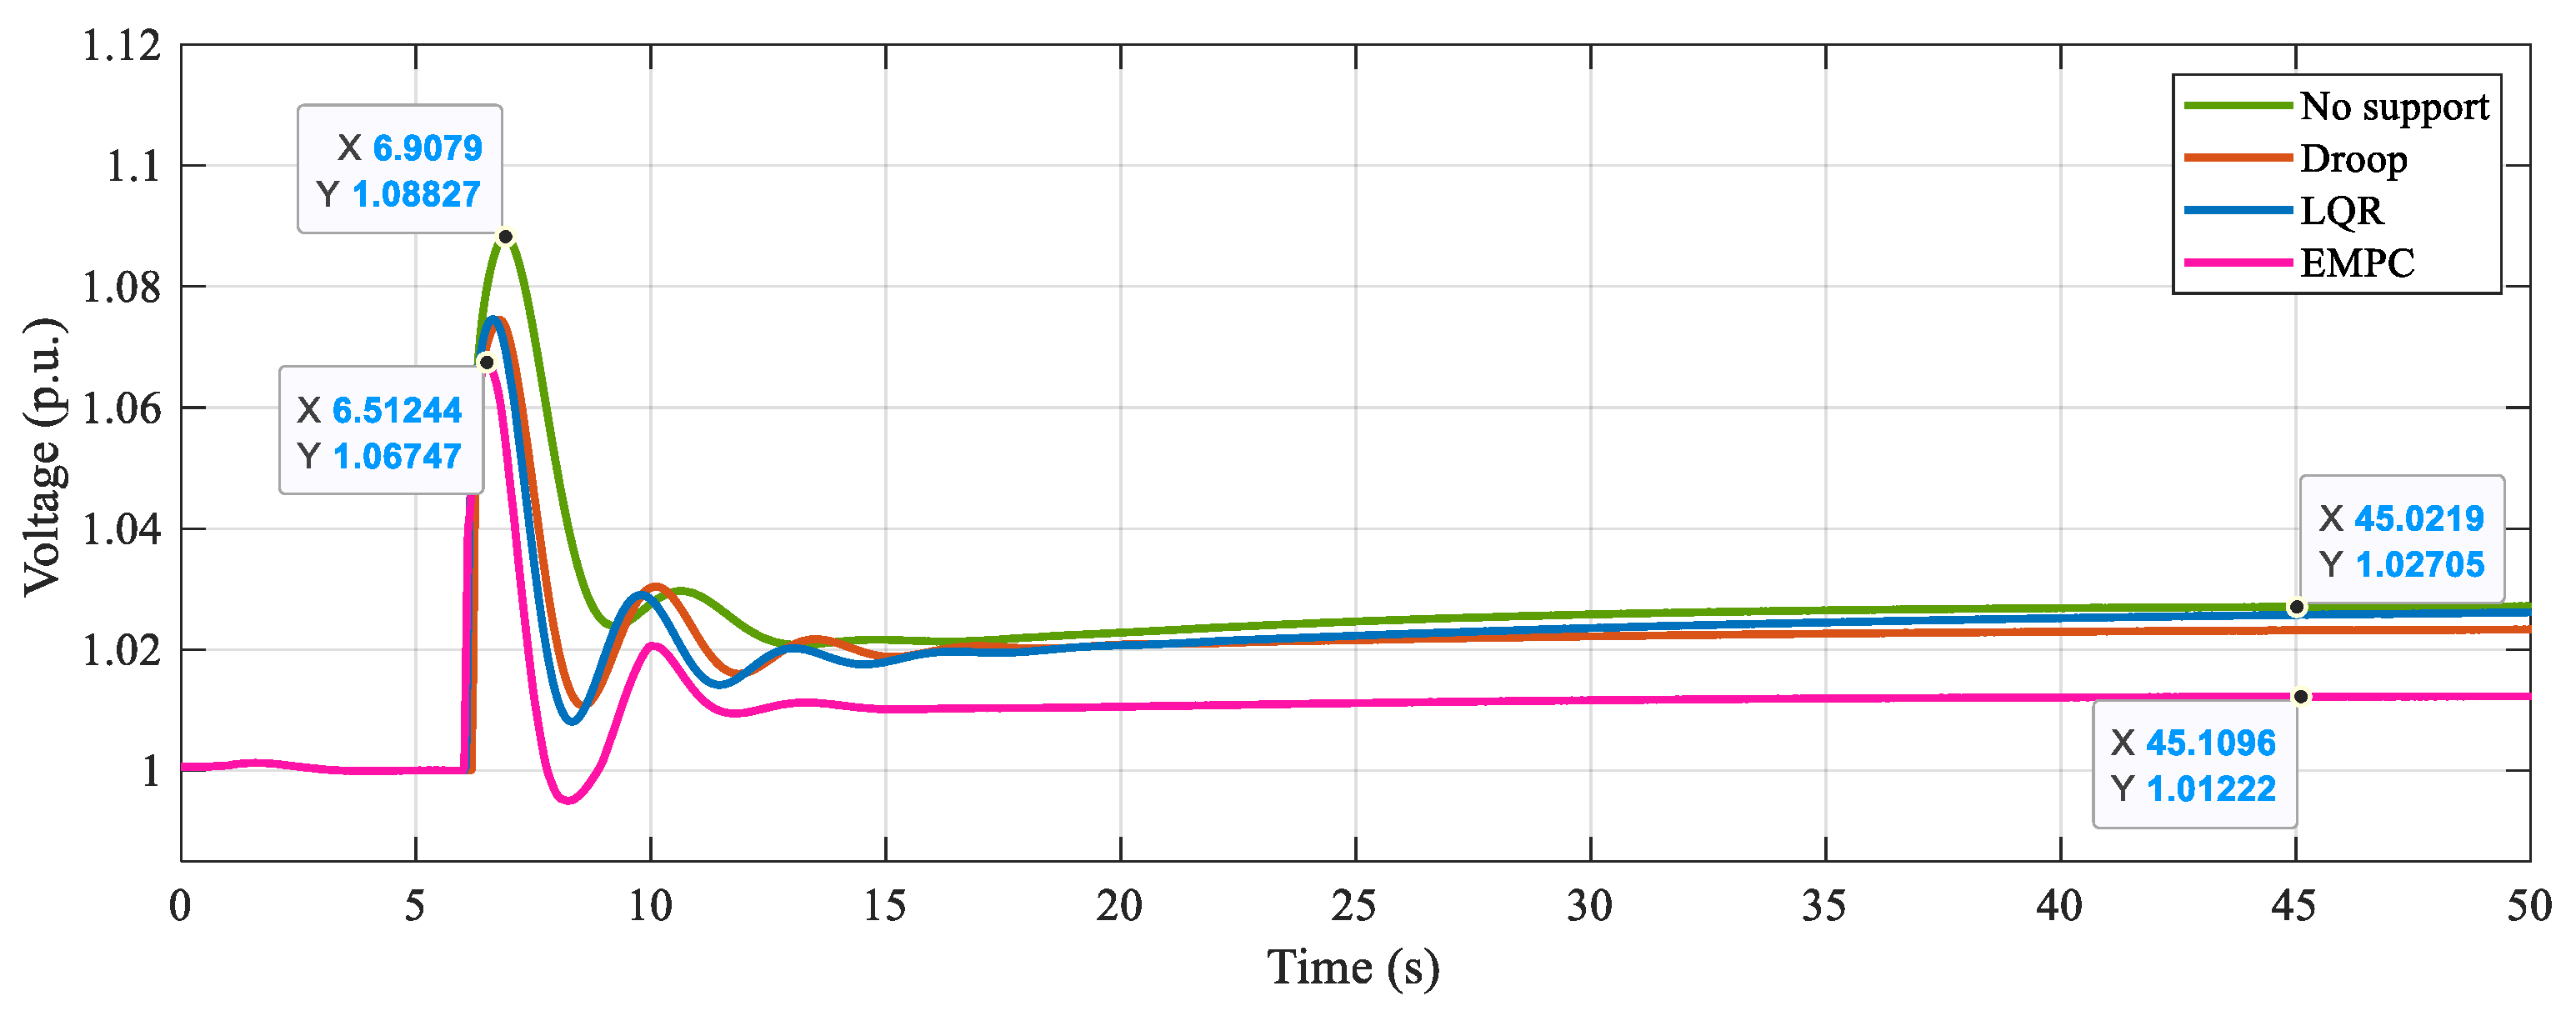
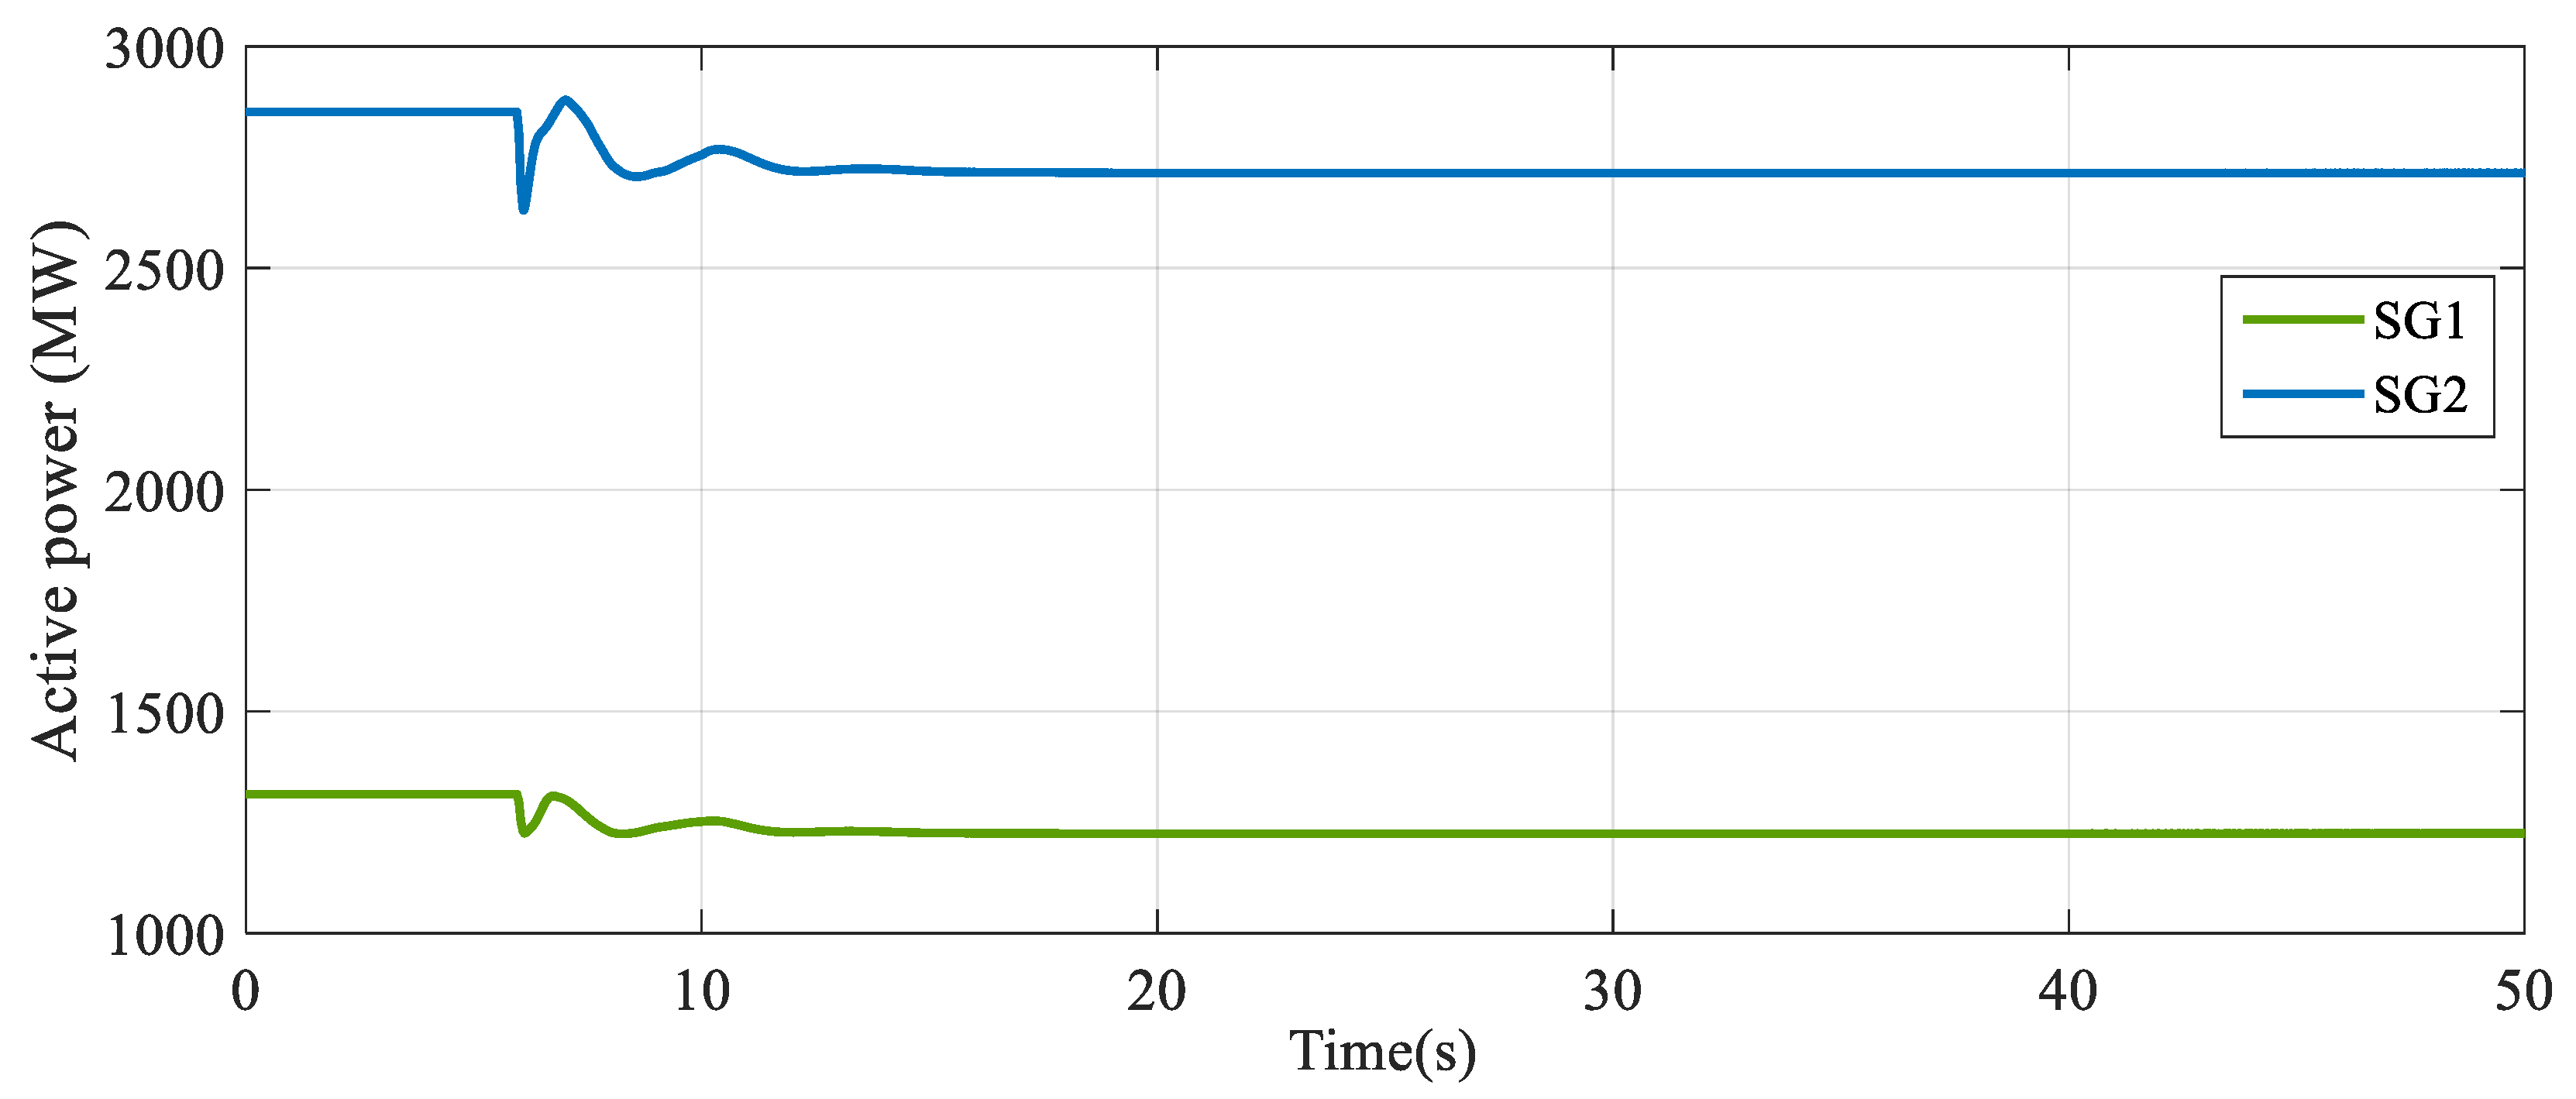
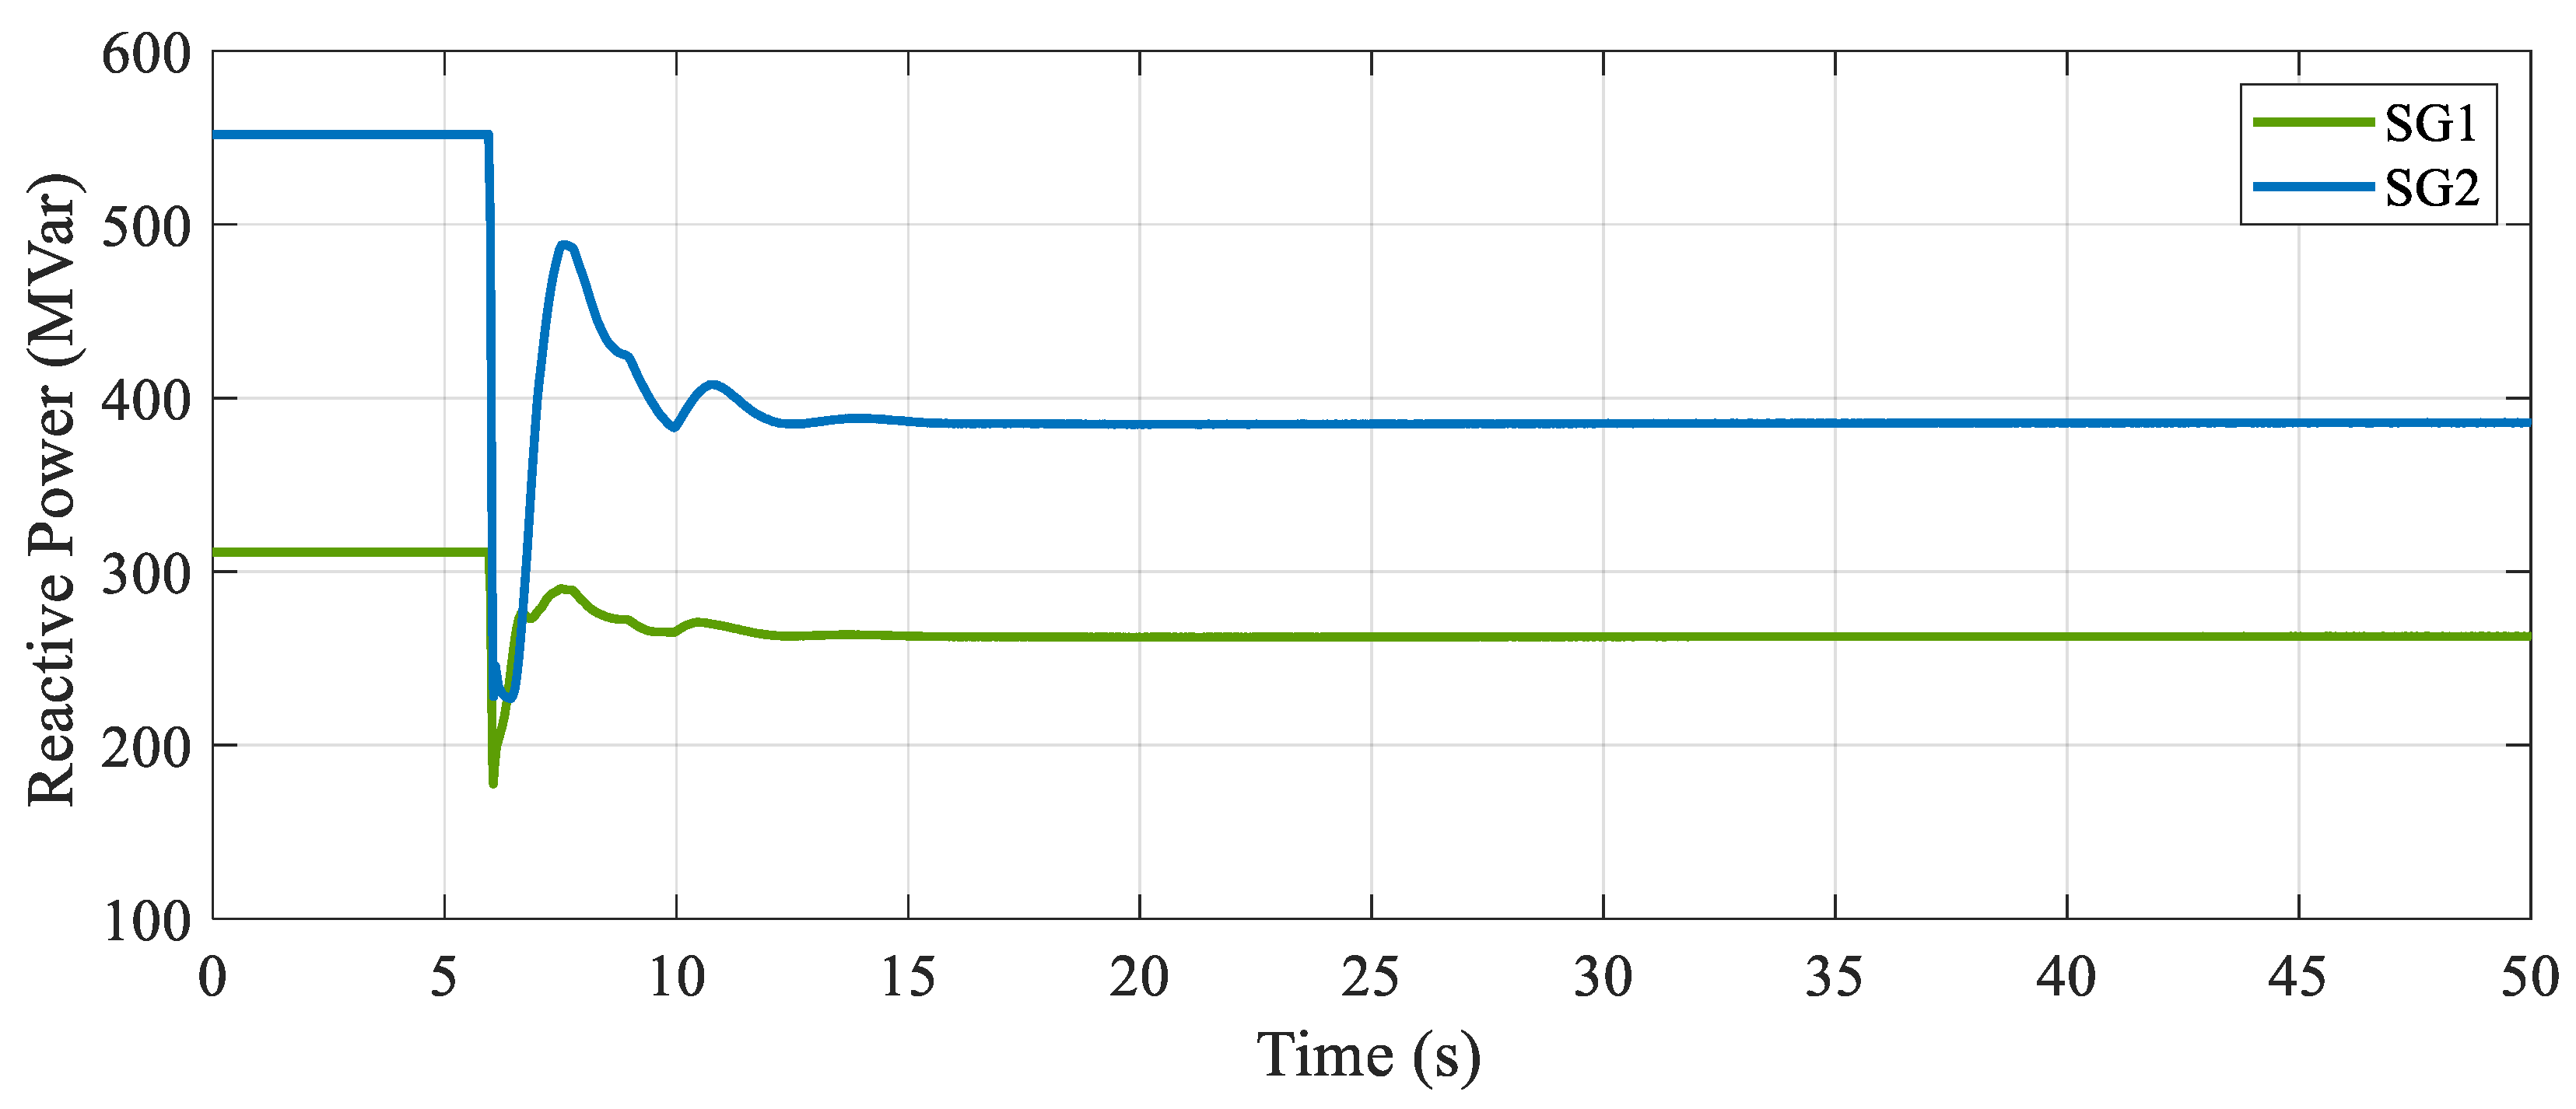
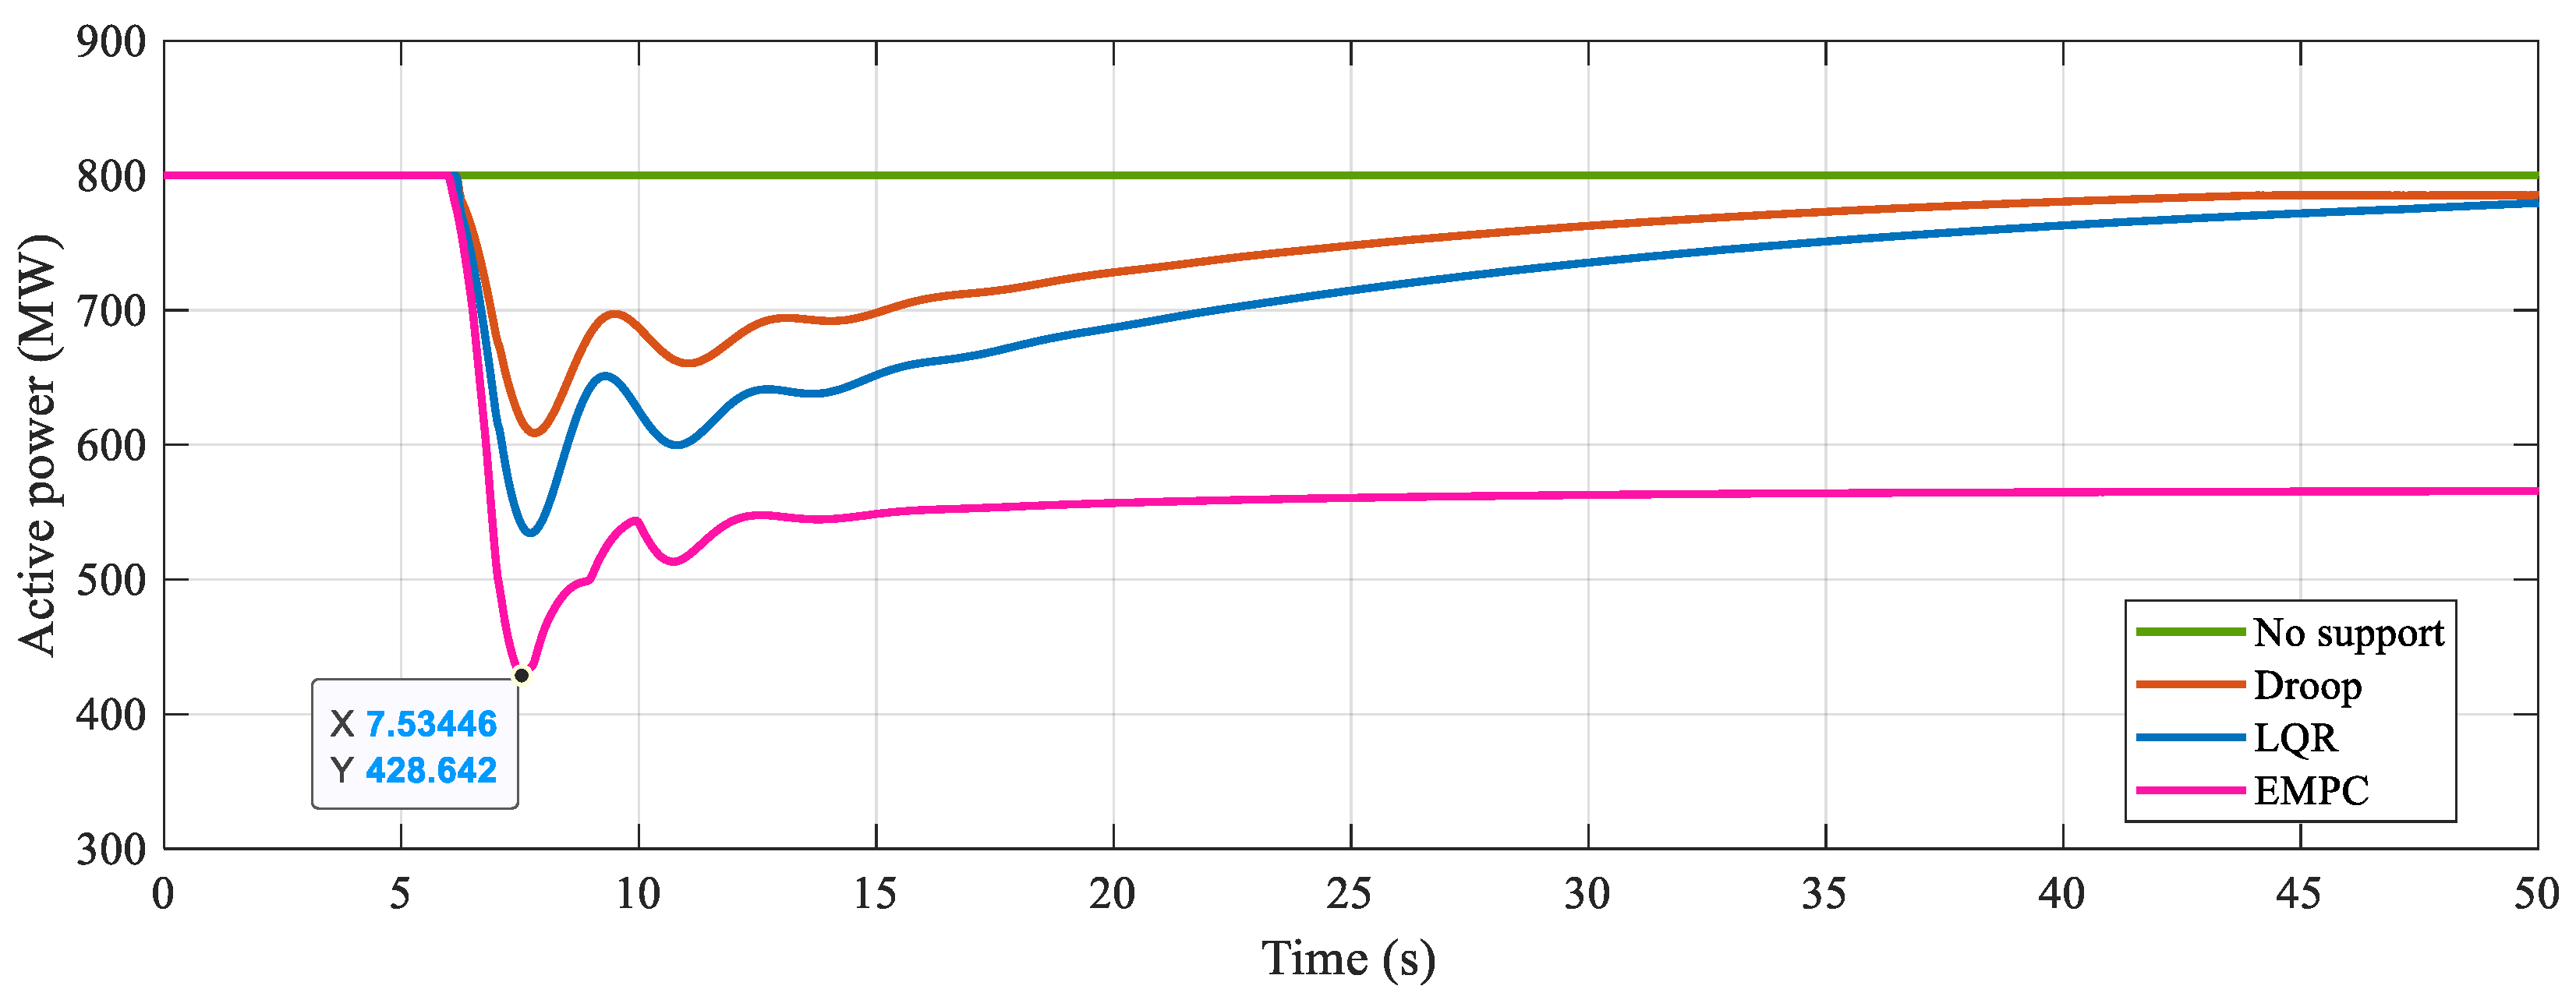
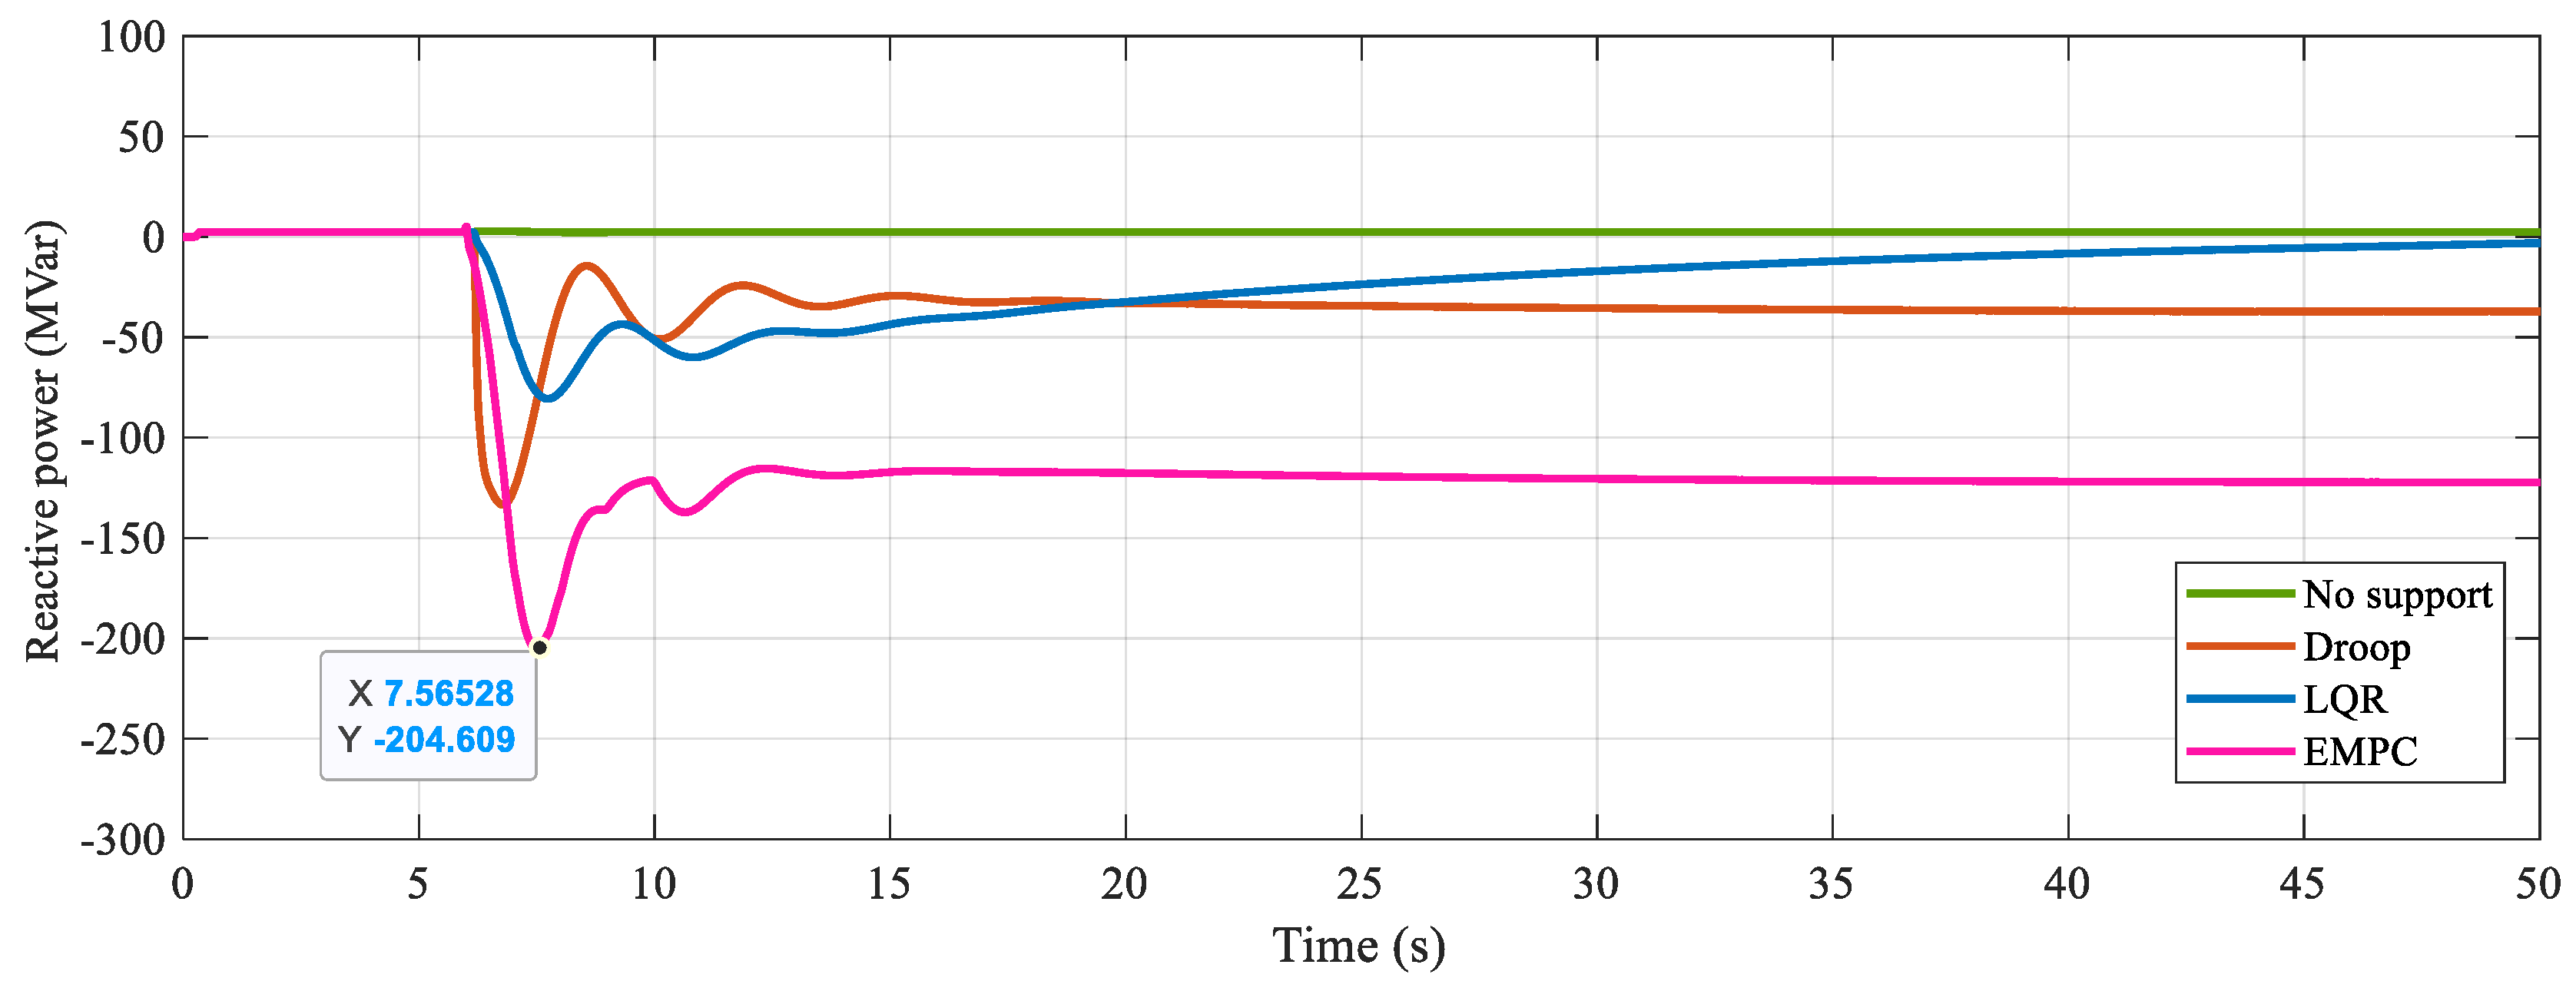
4.2. EMPC Control Performance

Within this subsection, we assess the combined control strategy’s efficacy in converter-blocking conditions. To demonstrate this, the duration of the simulation is 50 s. To replicate the occurrence of converter blocking, at t = 6 s, the converter was intentionally blocked.
Initially, during the simulation’s onset, the system exhibited normal behavior. However, when the blocking event transpired, the absence of support resulted in an increase in the frequency of the system to 50.308 Hz. However, thanks to the power system’s primary frequency regulation mechanism, the system frequency graduate returned to the nominal 50 Hz, as depicted in Figure 7.
Equipped with the EMPC controller, whenever the grid frequency deviates from the nominal frequency value, the EMPC controller issues an order to the wind farm, directing it to reduce its active power output. As a result of the EMPC controller’s intervention, the grid frequency experiences a rise to 50.195 Hz. Notably, the peak frequency is reduced by 0.183 Hz in comparison to the scenario without EMPC control. At t = 40 s, the frequency ultimately returns to the desired 50 Hz. Consequently, when compared to the no-support condition, droop control, and LQR, the EMPC controller exhibits the ability to mitigate both peak and steady-state frequency values, showcasing its superior control effectiveness.
Figure 8 illustrates the dynamics of the voltage at the sending-end converter bus. When there is no support from the wind farm, the voltage of the converter bus experiences an increase of up to 1.088 p.u. due to an excess of active and reactive power. The converter bus voltage stabilizes at 1.027 p.u. as its steady-state value. In the presence of the EMPC controller, whenever the bus voltage deviates from the reference voltage value, the wind farm receives a command instructing it to reduce not only its active power but also reactive power. Through the implementation of the proposed EMPC controller, peak voltage at the bus drops from 1.088 p.u. to 1.067 p.u., with a decrease of 0.021 p.u. compared to the scenario without EMPC control. By t = 45 s, it shows that the voltage returns to a value of 1.012 p.u. When compared to the no-support condition, droop control, and LQR control, the presented control strategy achieves a reduction in both peak voltage values and steady-state voltage values.
Based on the aforementioned observations, we can draw the conclusion that the frequency and voltage show the maximum decrease in peak value and steady-state value under the EMPC controller. This outcome underscores the superior steady-state properties and control performance of the EMPC strategy.
Conventional generators similarly reduce power output during frequency and voltage control in response to the HVDC converter blocking. Figure 9 and Figure 10 show the dynamics in the active power and reactive power of the conventional generators. When the converter blocking occurs, the frequency and bus voltage of the system increase, and both conventional generators reduce their power output to regulate the frequency and voltage.
Figure 11 depicts the wind farm active power when converter blocking occurs. In the absence of control actions, the wind farm continually generates 800 MW of active power. However, under the regulation of the proposed EMPC controller, the active power output of the wind farm is reduced in response to the blocking incident. A total of 372 MW of active power is reduced at most. Comparatively, when compared to the no-support condition, droop control, and LQR control strategies, the EMPC approach yields superior control outcomes.
Figure 12 illustrates the reactive power output of the wind farm when the HVDC converter blocking occurs. In this simulation, the power factor of the wind farm is set to 1. In the absence of control actions, the wind farm exhibits a continual reactive power output of 0 MVar. However, under the regulation of the EMPC controller, to mitigate the excessive reactive power brought by the HVDC blocking incident, the wind farm starts to absorb the reactive power. Around 205 MW of reactive power is reduced at most. These findings highlight the superior control outcomes achieved by the EMPC strategy.
While other controllers can also provide frequency and voltage support, it should be noted that droop control can solely regulate frequency and voltage independently. The separate control approach fails to achieve the optimal regulation of both frequency and voltage. On the other hand, by employing an LQR controller, a single controller can achieve combined control by simultaneously regulating voltage and frequency in a cooperative manner. However, the LQR controller lacks the capability to address constraints within the control framework. In contrast, the EMPC controller possesses the ability to calculate optimal control inputs based on a cost function, thereby enabling simultaneous control of the frequency of the grid and bus voltage while adhering to the power constraints imposed on the wind farm. Table 4 compares various control approaches based on factors like cost, benefits, etc.

4.3. EMPC Controller Adjustment

In this subsection, we conduct simulations utilizing various prediction horizons to assess their influence on critical regions and control effects. Different prediction horizons have an impact on the critical regions and control outcomes. As the prediction horizon increases, the number of critical regions increases, and the control results improve. Figure 13 exhibits the distinct EMPC critical regions under different prediction horizons. The significance of the different critical regions in Figure 13 is the same as in Figure 6. Table 5 presents the control outcomes for different prediction horizons.

4.4. Simulation Scenario Adjustment

When the wind speed or the transmitted power of the HVDC in the system changes, the proposed strategy is still applicable to this system. In this subsection, we concentrate on the effects of control strategies at various system starting states, including variations in wind speed and different HVDC transmitted power. Since the frequency and voltage adjustments are made within a few tens of seconds after the HVDC blocking occurs, the wind speed and load do not change significantly during this time. In the simulation, the wind speed and load are varied by changing the initial values.
Table 6 shows the control results under different active power outputs of the wind farm. Different wind speeds are reflected in different wind farm power outputs. Table 7 shows the control results under different HVDC capacities. According to the data in the table, we can see that after changing the wind speed or changing the HVDC transmitted power, the proposed control strategy can still effectively provide synergistic control for the grid frequency and the bus voltage.

5. Conclusions

This article introduces a cooperative control strategy for wind farms during the blocking at converter stations, aiming to achieve simultaneous regulation of frequency and voltage. The proposed approach involves the design of an EMPC controller to govern the power output of the wind farm. By detecting deviations in frequency and voltage within specified constraints, optimal references for active and reactive power are computed. Through simulation studies, the presented strategy successfully achieves cooperative control of system frequency and converter bus voltage. The results demonstrate that the EMPC controller effectively reduces peak values and steady-state deviations in the grid frequency and bus voltage during the HVDC blocking. Comparative analysis against the original system, droop control, and LQR reveals the superior control performance of EMPC. In future research, the inclusion of scenarios that involve multiple wind farms can be taken into consideration as additional research.

Author Contributions

Conceptualization, H.L., X.L. and Y.Y.; methodology, H.L., X.L. and W.X.; software, H.L., X.L., W.X. and Y.Y.; validation, Y.Y., Y.Z. and P.K.; formal analysis, P.K.; investigation, H.L., X.L. and P.K.; resources, H.L., X.L. and W.X.; data curation, P.K.; writing—original draft preparation, H.L.; writing—review and editing, X.L., W.X., Y.Y., Y.Z. and P.K.; visualization, W.X.; supervision, X.L. and P.K.; project administration, P.K.; funding acquisition, H.L. All authors have read and agreed to the published version of the manuscript.

Funding

This research was funded by the Science and Technology Project of State Grid Shaanxi Electric Power Company (Project name: Research on combined frequency and voltage control strategy of wind farm in the context of HVDC transmission in Shaanxi power grid. Project number: 5226KY220015).

Data Availability Statement

The data that support the findings of this study are available from the corresponding author upon reasonable request.

Conflicts of Interest

The authors declare no conflict of interest.

References

  1. Pradhan, C.; Bhende, C.N.; Samanta, A.K. Adaptive virtual inertia-based frequency regulation in wind power systems. Renew. Energy 2018, 115, 558–574. [Google Scholar] [CrossRef]
  2. Toolabi Moghadam, A.; Sarani, E.; Rezaie, M.; Sheykhi, E.; Azimian, M.; Mohammed, A.H. Optimal Planning and Bidding Strategy for Wind Farms in Joint Balancing and Day-Ahead Energy Markets. IET Renew. Power Gener. 2022, 16, 3299–3310. [Google Scholar] [CrossRef]
  3. Wan, Y.; Mao, M.; Zhou, L.; Xi, X.; Xie, B.; Zhou, S. Review on topology-based dc short-circuit fault ride-through strategies for MMC-based HVDC system. IET Power Electron. 2020, 13, 203–220. [Google Scholar] [CrossRef]
  4. Wang, S.; Zhao, C.; Fan, L.; Bo, R. Distributionally robust unit commitment with flexible generation resources considering renewable energy uncertainty. IEEE Trans. Power Syst. 2022, 37, 4179–4190. [Google Scholar] [CrossRef]
  5. Wang, W.; Xiong, X.; Li, M.; Yu, R. A flexible control strategy to prevent sending-end power system from transient instability under HVDC repetitive commutation failures. IEEE Trans. Power Syst. 2020, 35, 4445–4458. [Google Scholar] [CrossRef]
  6. Taylor, C.W.; Lefebvre, S. HVDC controls for system dynamic performance. IEEE Trans. Power Syst. 1991, 6, 743–752. [Google Scholar] [CrossRef]
  7. Shangguan, X.C.; He, Y.; Zhang, C.K.; Jin, L.; Yao, W.; Jiang, L.; Wu, M. Control performance standards-oriented event-triggered load frequency control for power systems under limited communication bandwidth. IEEE Trans. Control Syst. Technol. 2021, 30, 860–868. [Google Scholar] [CrossRef]
  8. Kumar, M.; Hote, Y.V. Robust PIDD2 controller design for perturbed load frequency control of an interconnected time-delayed power systems. IEEE Trans. Control Syst. Technol. 2020, 29, 2662–2669. [Google Scholar] [CrossRef]
  9. Lin, C.; Hu, B.; Shao, C.; Li, W.; Li, C.; Xie, K. Delay-dependent optimal load frequency control for sampling systems with demand response. IEEE Trans. Power Syst. 2022, 37, 4310–4324. [Google Scholar] [CrossRef]
  10. Mu, C.; Zhang, Y.; Jia, H.; He, H. Energy-storage-based intelligent frequency control of microgrid with stochastic model uncertainties. IEEE Trans. Smart Grid 2020, 11, 1748–1758. [Google Scholar] [CrossRef]
  11. Liu, K.; Liu, T.; Tang, Z.; Hill, D.J. Distributed MPC-based frequency control in networked microgrids with voltage constraints. IEEE Trans. Smart Grid 2019, 10, 6343–6354. [Google Scholar] [CrossRef]
  12. de Oliveira, J.D.A.; de Araújo Lima, F.K.; Tofoli, F.L.; Branco, C.G.C. Synchronverter-based frequency control technique applied in wind energy conversion systems based on the doubly-fed induction generator. Electr. Power Syst. Res. 2023, 214, 108820. [Google Scholar] [CrossRef]
  13. Dong, Z.; Li, Z.; Du, L.; Liu, Y.; Ding, Z. Coordination strategy of large-scale DFIG-based wind farm for voltage support with high converter capacity utilization. IEEE Trans. Sustain. Energy 2020, 12, 1416–1425. [Google Scholar] [CrossRef]
  14. Shaikh, U.A.; AlGhamdi, M.K.; AlZaher, H.A. Novel product ANFIS-PID hybrid controller for buck converters. J. Eng. 2018, 2018, 730–734. [Google Scholar] [CrossRef]
  15. Yadav, O.; Prasad, S.; Kishor, N.; Negi, R.; Purwar, S. Controller design for MTDC grid to enhance power sharing and stability. IET Gener. Transm. Distrib. 2020, 14, 2323–2332. [Google Scholar] [CrossRef]
  16. Xu, J.; Jia, Y.; Liao, S.; Lei, X.; Yu, J.; Gao, W.; Yao, L.; Ke, D.; Li, X.; Yang, J.; et al. Phasor measurement units-based fast voltage control strategy for distribution network with high-penetration distributed photovoltaic. IET Renew. Power Gener. 2023, 17, 1165–1179. [Google Scholar] [CrossRef]
  17. Debouza, M.; Ahmed, A. Grid ancillary services from doubly fed induction generator-based wind energy conversion system: A review. IEEE Access 2018, 7, 7067–7081. [Google Scholar] [CrossRef]
  18. Okyere, E.; Bousbaine, A.; Poyi, G.T.; Joseph, A.K.; Andrade, J.M. LQR controller design for quad-rotor helicopters. J. Eng. 2019, 2019, 4003–4007. [Google Scholar] [CrossRef]
  19. Beccuti, A.G.; Mariéthoz, S.; Cliquennois, S.; Wang, S.; Morari, M. Explicit model predictive control of DC–DC switched-mode power supplies with extended Kalman filtering. IEEE Trans. Ind. Electron. 2009, 56, 1864–1874. [Google Scholar] [CrossRef]
  20. Tian, N.; Fang, H.; Wang, Y. Real-time optimal lithiumion battery charging based on explicit model predictive control. IEEE Trans. Ind. Inform. 2020, 17, 1318–1330. [Google Scholar] [CrossRef]
  21. Lee, J.; Chang, H.J.; Ahn, H.S. Explicit MPC for column-type EPS systems. IET Electr. Power Appl. 2020, 14, 91–100. [Google Scholar] [CrossRef]
  22. Qiu, Y.; Lin, J.; Liu, F.; Song, Y. Explicit MPC based on the Galerkin method for AGC considering volatile generations. IEEE Trans. Power Syst. 2019, 35, 462–473. [Google Scholar] [CrossRef]
  23. Zhang, Y.; Kou, P.; Yu, L.; Liang, D. Coordinated voltage and frequency control for HVDC sending end under pole-block fault: Using model predictive control. Int. J. Electr. Power Energy Syst. 2022, 136, 107655. [Google Scholar] [CrossRef]
  24. Kou, P.; Liang, D.; Yu, L.; Gao, L. Nonlinear model predictive control of wind farm for system frequency support. IEEE Trans. Power Syst. 2019, 34, 3547–3561. [Google Scholar] [CrossRef]
  25. Bemporad, A.; Morari, M.; Dua, V.; Pistikopoulos, E.N. The explicit linear quadratic regulator for constrained systems. Automatica 2002, 38, 3–20. [Google Scholar] [CrossRef]
  26. Bemporad, A.; Borrelli, F.; Morari, M. Model predictive control based on linear programming—The explicit solution. IEEE Trans. Autom. Control 2002, 47, 1974–1985. [Google Scholar] [CrossRef]
  27. Chinchilla, M.; Arnaltes, S.; Burgos, J.C. Control of permanent-magnet generators applied to variable-speed wind-energy systems connected to the grid. IEEE Trans. Energy Convers. 2006, 21, 130–135. [Google Scholar] [CrossRef]
  28. Baccino, F.; Conte, F.; Grillo, S.; Massucco, S.; Silvestro, F. An optimal model-based control technique to improve wind farm participation to frequency regulation. IEEE Trans. Sustain. Energy 2015, 6, 993–1003. [Google Scholar] [CrossRef]
  29. Zhang, Z. On Control of Grid-Tied Back-to-Back Power Converters and Permanent Magnet Synchronous Generator Wind Turbine Systems. Ph.D. Thesis, Technische Universität München, München, Germany, 19 October 2016. [Google Scholar]
  30. Li, X.; Li, H.; Yan, Y.; Kou, P. Combined Frequency and Volt-age Support by Wind Farm with Linear Quadratic Regulator under Converter Blocking. In Proceedings of the 2022 12th International Conference on Power and Energy Systems (ICPES), Guangzhou, China, 23–25 December 2022; pp. 35–39. [Google Scholar]
Figure 1. Dynamics of the bus voltage and grid frequency during the HVDC converter blocking.
Energies 16 06307 g001
Figure 2. Block diagram of the investigated power system with HVDC transmission system.
Energies 16 06307 g002
Figure 3. Block diagram of the presented EMPC-based control strategy.
Energies 16 06307 g003
Figure 4. Wind farm local control strategy.
Energies 16 06307 g004
Figure 5. Configuration of the power system simulation model.
Energies 16 06307 g005
Figure 6. Diagram of the EMPC critical regions. (a) The critical regions of Controller 1. (b) The critical regions of Controller 3. (c) The critical regions of Controller 5.
Energies 16 06307 g006aEnergies 16 06307 g006b
Figure 7. System frequency dynamics in the HVDC sending-end power grid after the HVDC converter blocking.
Energies 16 06307 g007
Figure 8. Converter bus voltage dynamics in the sending-end power grid after the HVDC converter blocking.
Energies 16 06307 g008
Figure 9. Dynamics in the active power of the conventional generators.
Energies 16 06307 g009
Figure 10. Dynamics in the reactive power of the conventional generators.
Energies 16 06307 g010
Figure 11. Dynamics in the active power of the wind farm.
Energies 16 06307 g011
Figure 12. Dynamics in the reactive power of the wind farm.
Energies 16 06307 g012
Figure 13. Diagram of the critical regions of EMPC Controller 1 under different prediction horizons. (a) The prediction horizon is 3. (b) The prediction horizon is 5. (c) The prediction horizon is 7.
Energies 16 06307 g013aEnergies 16 06307 g013b
Table 1. Parameters of the three-phase transformer in the simulation model.
The Three-Phase TransformerPower (MVA)V1/V2 (kV)
Transformer 1220013.8/500
Transformer 2220013.8/500
Transformer 3100013.8/500
Transformer 4100013.8/500
Transformer 510002.4/13.8
Table 2. Parameters of the AC line impedances.
AC LineResistance (Ohms)Inductance (H)
Bus 2–Bus 31.0670.078
Bus 3–Bus 50.3040.022
Bus 5–Bus 60.140.010
Bus 5–Bus 70.2970.022
Table 3. Control law for three selected critical regions in Figure 6a.
Critical RegionFgAb
A 4 . 6566 × 10 10 0 . 0000 1 . 1641 × 10 10 7 . 2760 × 10 12 1 . 1039 × 10 10 0 . 0000 1 . 2197 × 10 10 2 . 8675 × 10 12 1 . 1039 × 10 10 0 . 0000 5 . 5567 × 10 12 2 . 8675 × 10 12 69 . 7816 958 . 0057 0 . 3770 682 . 2691 0 . 0000 0 . 0000 0 . 0000 0 . 0000 320 . 0000 300 . 0000 320 . 0000 300 . 0000 320 . 0000 300 . 0000 5279 . 6731 686 . 6048 800 . 0000 0 . 0000 0 . 0003 0 . 9999 0 . 0720 0 . 9974 1 . 0000 0 . 0000 0 . 9999 0 . 0003 0 . 0726 0 . 9974 0 . 0006 0 . 9999 1 . 2374 4 . 8788 52 . 0000 48 . 0001 5 . 1634 1 . 4461
B 267 . 7219 3310 . 2682 9 . 6030 2357 . 8251 199 . 2443 2411 . 9223 8 . 3003 1718 . 0066 132 . 1038 1574 . 7483 6 . 0486 1121 . 7146 65 . 8364 777 . 5142 3 . 1773 553 . 8415 0 . 0000 0 . 0000 0 . 0000 0 . 0000 1 , 7496 . 3627 1877 . 6794 1 , 3174 . 1393 1302 . 9904 8979 . 9414 819 . 2825 4869 . 3343 394 . 9766 800 . 0000 0 . 0000 1 . 0000 0 . 0000 0 . 9999 0 . 0010 0 . 9999 0 . 0018 0 . 9999 0 . 0023 0 . 9999 0 . 0025 1 . 0000 0 . 0000 0 . 0000 1 . 0000 0 . 0041 0 . 9999 0 . 0806 0 . 9967 52 . 0000 51 . 9991 51 . 9984 51 . 9980 51 . 9977 48 . 0000 0 . 5000 0 . 9236 5 . 1720
C 4 . 6566 × 10 10 0 . 0000 1 . 1641 × 10 10 7 . 2759 × 10 12 1 . 1039 × 10 10 0 . 0000 1 . 2197 × 10 10 2 . 8675 × 10 12 138 . 0714 1847 . 7467 1 . 8132 1315 . 9649 68 . 7829 912 . 3053 1 . 0861 649 . 7513 0 . 0000 0 . 0000 0 . 0000 0 . 0000 320 . 0000 300 . 0000 320 . 0000 300 . 0000 9593 . 2184 1255 . 1184 5172 . 1390 610 . 1667 800 . 0000 0 . 0000 0 . 0009 0 . 9999 0 . 0734 0 . 9973 0 . 0014 0 . 9999 0 . 0745 0 . 9972 1 . 1265 4 . 8608 1 . 1817 5 . 0047
Table 4. Comparison between different control methods.
Frequency
Reduction (Hz)
Voltage
Reduction (V)
CostImplementation
Complexity
AdvantagesShortcomings
Droop control0.0430.014lowlowSimple
implementation
No coordinated
control
LQR control0.0930.014moderatehighCooperative controlCannot handle
constraints
EMPC control0.1120.021highhighCooperative control can be performed
under constraints
Takes up more
storage resources
Table 5. EMPC Control results under different prediction horizons.
Prediction HorizonsThe Peak Value of Frequency (Hz)The Peak Value of Voltage (p.u.)
350.2331.074
450.2181.070
550.1961.067
650.1881.064
750.1821.062
Table 6. Control results under different active power outputs of wind farm.
Different ModelNo SupportDroop ControlLQR ControlEMPC Control
600 MWPeak frequency
(Hz)
50.3395.29050.24150.232
Peak voltage
(V)
1.0931.0781.0781.069
700 MWPeak frequency
(Hz)
50.3275.28250.23550.210
Peak voltage
(V)
1.0901.0761.0761.068
800 MWPeak frequency
(Hz)
50.30850.26550.21950.196
Peak voltage
(V)
1.0881.0751.0751.067
Table 7. Control results under different HVDC capacities.
Different ModelNo SupportDroop ControlLQR ControlEMPC Control
400 MW/
160 MVar
Peak frequency
(Hz)
50.25050.22650.18150.163
Peak voltage
(V)
1.0681.0581.0581.052
450 MW/
180 MVar
Peak frequency
(Hz)
50.28150.24550.20250.183
Peak voltage
(V)
1.0781.0661.0661.060
500 MW/
200 MVar
Peak frequency
(Hz)
50.30850.26550.21950.196
Peak voltage
(V)
1.0881.0751.0751.067
Disclaimer/Publisher’s Note: The statements, opinions and data contained in all publications are solely those of the individual author(s) and contributor(s) and not of MDPI and/or the editor(s). MDPI and/or the editor(s) disclaim responsibility for any injury to people or property resulting from any ideas, methods, instructions or products referred to in the content.

