Article

The Effect of Leading-Edge Wavy Shape on the Performance of Small-Scale HAWT Rotors

1
Faculty of Mechanical Engineering, University of Prishtina “Hasan Prishtina”, 10000 Prishtina, Kosovo
2
Faculty of Mechanical Engineering, Niğde Ömer Halisdemir University, Niğde 51240, Turkey
*
Author to whom correspondence should be addressed.
Energies 2023, 16(17), 6405; https://doi.org/10.3390/en16176405
Submission received: 4 August 2023 / Revised: 23 August 2023 / Accepted: 28 August 2023 / Published: 4 September 2023
(This article belongs to the Special Issue Advances in Renewable Energy Research and Applications)

Abstract

:
The purpose of this experimental work was to investigate the role of the leading-edge wavy shape technique on the performance of small-scale HAWT fixed-pitch rotor blades operating under off-design conditions. Geometric parameters such as amplitude and wavelength were considered design variables to generate five different wavy shape blade models in order to increase the aerodynamic performance of the rotor with a diameter of 280 mm. A dedicated airfoil type S822 for small wind turbine application from the NREL Airfoil Family was chosen to fulfil both the aerodynamic and structural aspects of the blades. Rotor models were tested in a wind tunnel for different wind speeds while maintaining constant rotational speed to provide the blade-tip chord Reynolds number of 4.7 × 10⁴. The corrected tunnel data, in terms of power coefficients and tip-speed ratios, were compared first with the literature to validate the experimental approach, and then among themselves. It was observed that for minimal sizes of tubercles, the performance of the rotor increases by about 40% compared to the RB1 baseline rotor model for a low tip-speed ratio. Conversely, for the maximum size of the tubercles, there is a marked decrease of about 51% of the rotor performance for a moderate tip-speed ratio compared to the RB1 rotor model. Among these models, specifically, the RB2 rotor model with the smallest values of amplitude and wavelength provides a 2.8% higher peak power coefficient compared to the RB1 rotor model, and at the same time preserves higher performance values for a broad range of tip-speed ratios.

1. Introduction

1.1. Turbine Efficiency for Sustainable Energy: An Overview

In accordance with Emeis [1], increasing global attention is being focused on the application of renewable resources due to its effects in reducing greenhouse effects and global warming. One of these sources is wind energy, as it is estimated that it can sufficiently provide the energy required and can be harnessed on the Earth’s surface. At present, the challenge is to determine how to utilize this energy at the largest possible scale, with the highest efficiency and minimum cost.
There are two types of wind-converting machines: the horizontal axis wind turbine (HAWT) and the vertical axis wind turbine (VAWT) [2]. However, in terms of performance, horizontal axis wind turbines surpass vertical shaft turbines, which is why it is more common to observe the former with extraordinary dimensions and capacities. In this aspect, small wind turbines, which had a global installed capacity of over 1.73 gigawatts by 2018 [3], are foreseen as a very significant part of the future sustainable energy mix and represent an efficient method for reducing greenhouse gas emissions [4]. According to the IEC 61400-2: 2013 standard, wind turbines having a rotor swept area less than 200 m2, corresponding to a maximum power output of 70 kW, are considered to be small wind turbines [5]. Due to their construction characteristics, reliability, and low cost, they can be utilized in both urban and rural areas, and even for on-grid application. However, these machines are most commonly fixed-pitch regulated, because conditions in which they operate are characterized by poor performance that may be several times lower than the Betz limit (~0.593) [5,6]. Such characteristic results are mainly due to the mismatch of the blade profile and the operational speed of the rotor with the extremely severe and sensitive working conditions as a consequence of increased viscosity forces. These forces stimulate the formation of laminar separation bubbles, particularly when the Reynolds number is lower than 1 × 10⁵, which has a significant impact on the performance of airfoils [7,8,9,10,11,12,13,14]. Therefore, a unique shape of the rotor blade balanced with the above requirements is necessary to effectively master these highly viscous forces in the fluid.

1.2. Optimizing Rotor Blade Performance Using the Leading-Edge Tubercle Technique

The key step to designing an efficient rotor blade shape is choosing the right airfoil profile for the given Reynolds number flow since it significantly affects the rotor’s performance [6,8]. The Reynolds number is a crucial non-dimensional parameter that usually varies throughout the rotor radius by reaching minimum values in the vicinity of the hub, whereas the maximum values are reached close to the tip of the blade. As the tip region is considered to be the part where most of the torque of the power is produced [5,15,16], it is often the case that the representative Reynolds number for a small wind turbine is determined for the blade-tip chord. This is one of the main reasons why other parts of the blade closer to the hub suffer from a significant drop in performance. In addition to the large number of traditional existing airfoils, several other profiles have been designed specifically for small wind turbines. Studies have shown that chambered thin airfoils are the most common profiles for low Reynolds number flows [7,8,17,18]. However, for Reynolds numbers lower than 1 × 10⁵, the data for airfoils are limited. Therefore, using an undedicated airfoil profile for these operating conditions was reported in many studies to be associated with a significant decrease in performance [5,8,16,19]. This issue was also addressed by Burdett et al. [20], which suggests the necessity of using methods to control the flow, and that passive flow devices may present an alternative, significant contribution to both the aerodynamic and economic aspects. A solution inspired by aquatic animals, which share the same operational conditions as small wind turbines, is known as the leading-edge tubercle technique. This technique, proven to be effective by several studies, improves the aerodynamic characteristics of airfoils without consuming additional energy. It particularly excels under specific operating conditions, such as low Reynolds number regimes, which are characterized by highly severe and sensitive working conditions due to increased viscosity forces and high angles of attack, and ensures smoothed stall characteristics. This concept derives from the idea that animals have evolved over time to adapt to the terms and challenges of nature [21]. For this reason, this natural aerodynamic mechanism added to the leading edges of the rotor blades aims to imitate a certain mass, such as the humpback whale’s wing shape. This generates the so-called counter-rotating streamwise vortices, with the purpose of effectively controlling the laminar separation bubbles over the wings and preventing the stall occurrence or progression along the spanwise direction, akin to the effective swimming pattern observed in aquatic animals [12,13,22].

1.3. Enhancing Airfoil Performance with Tubercles

Many studies of the effects of leading-edge tubercles on the aerodynamic performance of airfoil wings and wind turbine blades under different conditions have been conducted numerically and experimentally.
Usually, an optimal airfoil is selected for the maximun value of the glide ratio (CL/CD), which corresponds to an optimal angle of attack. The maximum lift coefficient, whose value is achieved for larger angles of attack, is another very important aerodynamic quantity as it determines the stall angle of an airfoil. Beyond this value, the lift is reduced and the performance is reduced. Studies indicate that the tubercle geometry significantly affects aerodynamic characteristics of airfoils. According to Fish and Battle [13] and Miklosovic et al. [12], the humped shape of the whale’s wings, along with their leading edges, are responsible for the efficiency of the maneuverability employed when catching its prey. They pointed out that this natural mechanism improves the maximum lift coefficient of the whale’s wings at high angles of attack, especially when these animals take narrow turns, and thus improves their stall characteristics by smoothing and delaying the occurrence. In addition, the authors suggest that this morphology of the humpback flippers may serve as an alternative to improving engineering designs. This technique is observed to improve the glide ratio of a swept wing at pre-stall angles of attack by varying the main parameters such as the amplitude and the wave length [23]. Miklosovic et al. [12] conducted an experimental study of the effects of the tubercles along the leading edge on two scaled models similar to humpback whale flippers using an NACA 0020 airfoil at angles of attack ranging from −2° to 20°. The study found that models with tubercles were able to delay the stall occurrence to a significant degree compared to clean models at Reynolds numbers between 5.05 × 10⁵ and 5.2 × 10⁵. According to the authors, this was attributed to the presence of bumps which delayed the stall angle by nearly 40% and improved the post-stall characteristics. However, for an angle of attack lower than 8.5°, no effect was observed. Haque et al. [24] also carried out an experimental study of a wing consisting of an NACA 4412 airfoil with curved and straight leading edges at an air speed of around 23.71 m/s corresponding to Re = 1.82 × 10⁵ and at several angles of attack ranging from −4° to 24°. It was found that the wavy-shaped model performed better at an angle of attack below 12°. Hansen et al. [25] conducted an experimental study to determine the influence of leading-edge tubercles on the performance of two different airfoil types at angles of attack ranging from −4° to 25° and Re = 1.2 × 10⁵. NACA 65-021 and NACA 0021 airfoils were used to generate 10 wing models by taking several values of the amplitude, and multiplying the mean chord length by 3%, 6%, and 11%; and the wavelength, and multiplying the mean chord length by 11%, 21%, 43%, and 86%. These values for amplitude and wavelength were taken from Fish and Battle [13]. It was found that, as the amplitude decreased, a higher maximum lift coefficient and larger stall angle and improved post-stall characteristics were obtained. Furthermore, with the reduction in the wavelength of tubercles, benefits were found in all aspects of aerodynamic performance. They also suggested that models with tubercles having the smallest amplitude performed better compared to an unmodified airfoil. Sudhakar et al. [26] conducted an experimental investigation of the impact of leading-edge tubercles on different airfoil types at low Reynolds numbers. The test was conducted at three Reynolds numbers, Re = 1 × 10⁵, 1.5 × 10⁵, and 2 × 10⁵, and for several angles of attack ranging from −6° to 24°. They found that tubercles on the S1223 airfoil positively affected the aerodynamic characteristics in all three flow regimes, resulting in delayed stall, an increase in lift, and elimination of the hysteresis loop compared to the baseline model. On the other hand, no significant improvements were observed regarding the NACA 4415 airfoil. Johari et al. [27] performed an experimental study to investigate the effects of sinusoidal tubercles on the performance of the NACA 634-021 airfoil type. Several models were generated by varying the amplitude from 2.5% to 12% of the chord length and wavelengths from 25% to 50% of the chord length for Re = 1.83 × 10⁵. They found that improvements were noted in the post-stall regime where the lift coefficient increased nearly 50% compared to the baseline airfoil. They also suggested that the amplitude of tubercles can significantly influence the resultant force and moment coefficient, but the wavelength and the leading-edge radius have only a minor impact. In their wind tunnel experiments, Guerreiro and Sousa [28] investigated the effects of the aspect ratio, leading-edge geometry, and Reynolds number on the micro-air vehicle wing lift forces. The tests were conducted on several wing models having amplitudes of 6% and 12% of the mean chord length, and wavelengths of 25% and 50% of the mean chord length, at angles of attack from 0° to 30° and at the Reynolds numbers of 7 × 10⁴ and 14 × 104. It was found that a proper combination of the amplitude and the wavelength resulted in an increase of 45% of the maximum lift coefficient for the highest Reynolds number and for an angle of attack larger than the straight baseline stall angle. For the lowest Reynolds number, the benefits were for low angles of attack. According to Wei et al. [29], regarding the impact of protuberances on hydrofoil performance at a Reynolds number of 1.4 × 10⁴, it was observed that, in this flow condition, a greater amplitude and shorter wavelength were favorable in managing flow separation. Furthermore, according to the study by Bolzon et al. [30] regarding the impact of bumps located on the leading edge of an airplane’s wings at a low angle of attack of 1° to 8° and at Re = 2.2 × 10⁵, the observations indicated that this passive mechanism resulted in a reduction in aerodynamic coefficients while concurrently enhancing the lift-to-drag ratio. Natarajan et al. [31] carried out an experimental study on the leading edge of a NACA 4415 airfoil for different angles ranging from 6° to 18° at Re = 1.2 × 10⁵. They revealed that the presence of the tubercles resulted in the formation of several smaller separation bubbles, instead of the single long bubble along the blade length that was noticed in the unmodified airfoil. They also found that tubercles were very effective beyond the stall condition of the modified airfoil.

1.4. Advancing Wind Turbine Performance with Tubercles

The rotational rotor speed defined by the tip-speed ratio plays a crucial role in its performance because only one of its values gives the maximum efficiency [10,11,17,32]. This non-dimensional parameter is closely related to the solidity of the rotor, which varies depending on the size of the wind turbine rotors and their purpose [32,33]. For the purposes of electricity generation, small wind turbine rotors are characterized by a relatively low solidity as they have to spin faster. Furthermore, due to the spinning work principle of the wind turbine rotor, the flow over their blade surfaces is three-dimensional in nature, where the root and the tip regions are strongly affected by trailing vortices due to the complexity of the flow that develops in these two extreme parts of the blade [5,34,35,36]. Addressing these issues can considerably influence the increase in the blade productivity and minimization of power loss, where only tip losses can represent a nearly 10% decrease in the Annual Energy Production (AEP) [35]. On the other hand, the root region is characterized by larger solidity and pitch angle than the tip region because this part of the blade is considered the most significant contributor to ensuring the strength and rigidity of the blade structure, as well as the factor initiating system at low wind speeds [5,33]. However, it is claimed that even the root part of the rotor blades affects the increase in the performance of the wind turbine [36]. Due to these specifics, the root region is more prone to the onset of stall occurrence and spread towards the tip of the blade, thus causing a decrease in its performance. Therefore, a challenge remains the early prevention of the expansion in this negative phenomenon, both in the streamwise and spanwise directions of the blade. By contrast with the airfol wings, there are a limited number of research studies dealing with the application of the leading-edge tubercle technique for improving wind turbine performance [37]. Pedro and Kobayashi [38] found that the presence of tubercles on an idealized humpback whale flipper at an angle of attack of 15°, in addition to changing the vorticity distribution along the model span, leads to the increase in momentum exchange and consequently stalls prevention. Moreover, a reduction in the tip vortex strength was noticed as a consequence of the compartmentalization of the flow due to the differences in chord lengths of the crests and troughs of tubercles. Van Nierop et al. [39] suggested that the higher the pressure gradient at the troughs, the later the flow separation will be initiated behind the tubercles crests. In the approach proposed by the authors, the conditions are created for the separation to be initiated in this zone so as to ensure gradual global stall characteristics. Abate et al. [37] carried out a numerical study of tubercles’ effect on the performance of the two-bladed NREL Phase VI wind turbine with a radius of 5 m and a rated power of 20 kW. Several blade configurations were generated using an S809 airfoil section by varying the non-dimensional amplitude from 1% to 5% and the non-dimensional wavelength from 1.6% to 7.5%. These fixed-pitch wind turbines having a tip pitch angle of 3° were tested for constant RPM using CFD code in a fully turbulent flow condition at four different flow speeds ranging from 5 to 20 m/s, corresponding to Reynolds number between 104 and 106 along their blade lengths. It was noticed that the maximum effect was achieved at the highest wind speed or in off-design conditions for high amplitude and low wavelength; for the lowest wind speed, the effect was significantly reduced. They also highlighted the important role of the last tubercle situated at the tip of the blade and its geometric shape, since it can affect the tip vortex’s intensity. A computational study conducted by Abate and Mavris [40] analyzed the effects of different leading-edge tubercle positions on wind turbine blade performance. An NREL Phase VI wind turbine blade was used as the baseline model, which was compared with the six blade configurations generated by varying the tubercles’ spanwise location from 40% to 95% of the blade span. They found that the presence of tubercles within the range between 62% and 95% of the blade span showed better performance at a high wind speed of 20 m/s compared to other models, resulting in improved Annual Energy Production and shaft torque. Zhang and Wu [41] investigated the aerodynamics of wind turbine blades with sinusoidal leading edges. They generated the baseline model as a reference for comparison, which was the original NREL Phase VI blade model with a radius of 5.029 m and a root chord length of 0.737 m, with a straight leading edge, along with five blade model configurations with different amplitudes ranging from 1.25% to 3.75% of the aforementioned root chord length, and wavelengths ranging from 17% to 42% of the same root chord length. All the models were built using an S809 NREL airfoil section having a tip pitch angle of 3°. The blades were tested via CFD code under five dissimilar flow speeds ranging from 7 to 25 m/s. The results showed that, compared to the reference blade model, the wavy-shaped blade models improved the wind turbine blades’ aerodynamic performance under high course speeds or above the rated wind speed. Based on the findings, the key region along the blade where tubercles can be used to improve the aerodynamic performance extends from 60% of the rotor radius to the tip of the blade, resulting in high values of both amplitude and wavelength. They also suggested that this technique may be a useful mechanism even for pitch control wind turbines (modern wind turbines) with variable rotating speed. In their experimental study, Huang et al. [42] compared the performance of a smoothed leading-edge blade with different sinusoidally shaped blade models having a variable rotational speed at a wind speed of 6 to 10 m/s and a Reynolds number between 1.0 × 10⁵ and 3.0 × 10⁵. Four models were generated by combining the amplitude of 1.5% and 8.5% of the mean chord length of 9 cm with the wavelength of 6.5% and 15% of the same mean chord length. They reported that the presence of tubercles considerably improved the performance of the rotor models by effectively delaying the stall, but only for low wind speeds and a low tip-speed ratio. It was concluded that by increasing the wind speed, the rotational speed of the rotor also increased, which resulted in the deterioration of the small-scale wind turbine performance. Kim et al. [43] performed a numerical study on the effects of the leading-edge tubercles on the flow structure on a three-dimensional wing. They considered wing models previously studied by Miklosovic et al. [12] at a Reynolds number of 1.8 × 10⁵, based on free-stream velocity and mean chord length. They reported positive effects of tubercles since the stall angle was delayed by 7° (with an angle of attack from 8° to 15°), while the maximum lift coefficient was increased by nearly 22%. Ng et al. [44] studied the impact of leading-edge tubercles on fatigue loadings on wind turbine blades. They noticed that tubercles with an amplitude of 20% of the chord and a wavelength of 50% of the chord, distributed from the root (20% R) to the blade tip (95% R), decreased the flapwise root-bending moment by 6% compared to the unmodified configuration. The authors suggest that positioning the tubercles near the tip of the blade improved the performance during stall occurrences from large tip deflections. An improvement was also observed when tubercles were closer to the root of the blade, as this area tends to stall earlier due to the lower rotational speed of the blade. Herráz et al. [34] studied the impact of the blade root flow on the performance of the wind turbine rotor. According to the authors, the flow at the root and tip regions is considered to be three-dimensional in nature and strongly influenced by the trailing vortices. This was attributed to the large difference in the angle of attack at the root region and at the tip, thus representing the most two critical zones where the flow separation may take place.

1.5. Problem Statement and Aims of the Research

Preliminary studies highlight a highly unstable operating environment in which small wind turbines usually operate, and they suggest the necessity of using flow control mechanisms, especially for profiles that operate below their design point. A very promising technique that does not require additional energy has been proven by many researchers as an acceptable solution for the treatment of this unfavorable condition, which affects the aerodynamic characteristics of profiles when subjected to such severe working conditions.
Therefore, the focus of this experimental study was to investigate the role of the leading-edge wavy shape on the performance of small-scale wind turbine rotor blades operating under off-design conditions at a Reynolds number of 4.7 × 10⁴, which is somewhat lower than the Reynolds number for which the selected airfoil type is designed. The wavy shape will characterize the entire length of the blade, from the root to the tip, with the purpose of enabling all the parts of the flow to be easily controlled as it is compartmented between the crests of the tubercles. Other objectives were to understand the effects of expanding the application range of the airfoil, beside the tip of the blade for which it is designed, and changing the wind speed while maintaining a constant rotational speed of the rotor blades. This was based on the suggestion from Abate et al. [37] that rotors may perform even better when they operate with variable rotational speed and with a pitch control mechanism. Geometric parameters of the leading-edge tubercles, such as amplitude and wavelength, are considered design variables to generate five different wavy-shaped rotor blades. The results measured in a wind tunnel, in terms of power coefficients and tip-speed ratios, were first corrected using the Van Treuren [9] approach for comparison purposes. A dedicated type S822 airfoil for small wind turbine application from the NREL Airfoil Family was chosen to fulfil both the aerodynamic and the structural aspects of the blades. It was observed that a specific tubercle geometry with smaller amplitude and wavelength applied to rotor blades with a fixed-pitch angle for the given operating conditions resulted in a better performance for the entire range of tip-speed ratios compared to the unmodified rotor blade model.

2. Material and Methodology

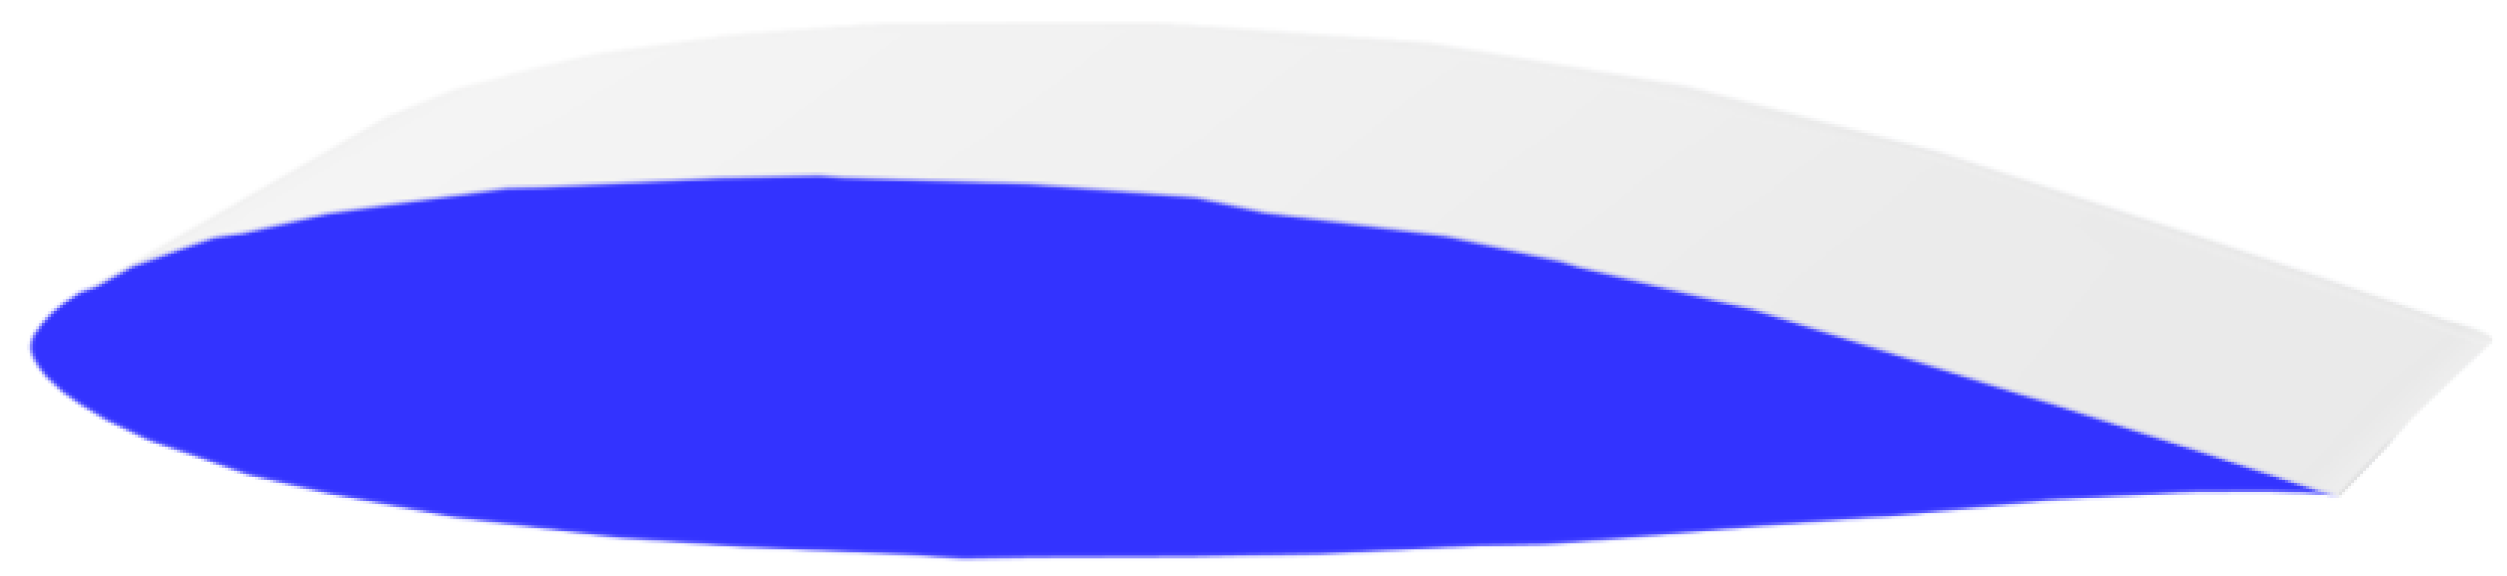
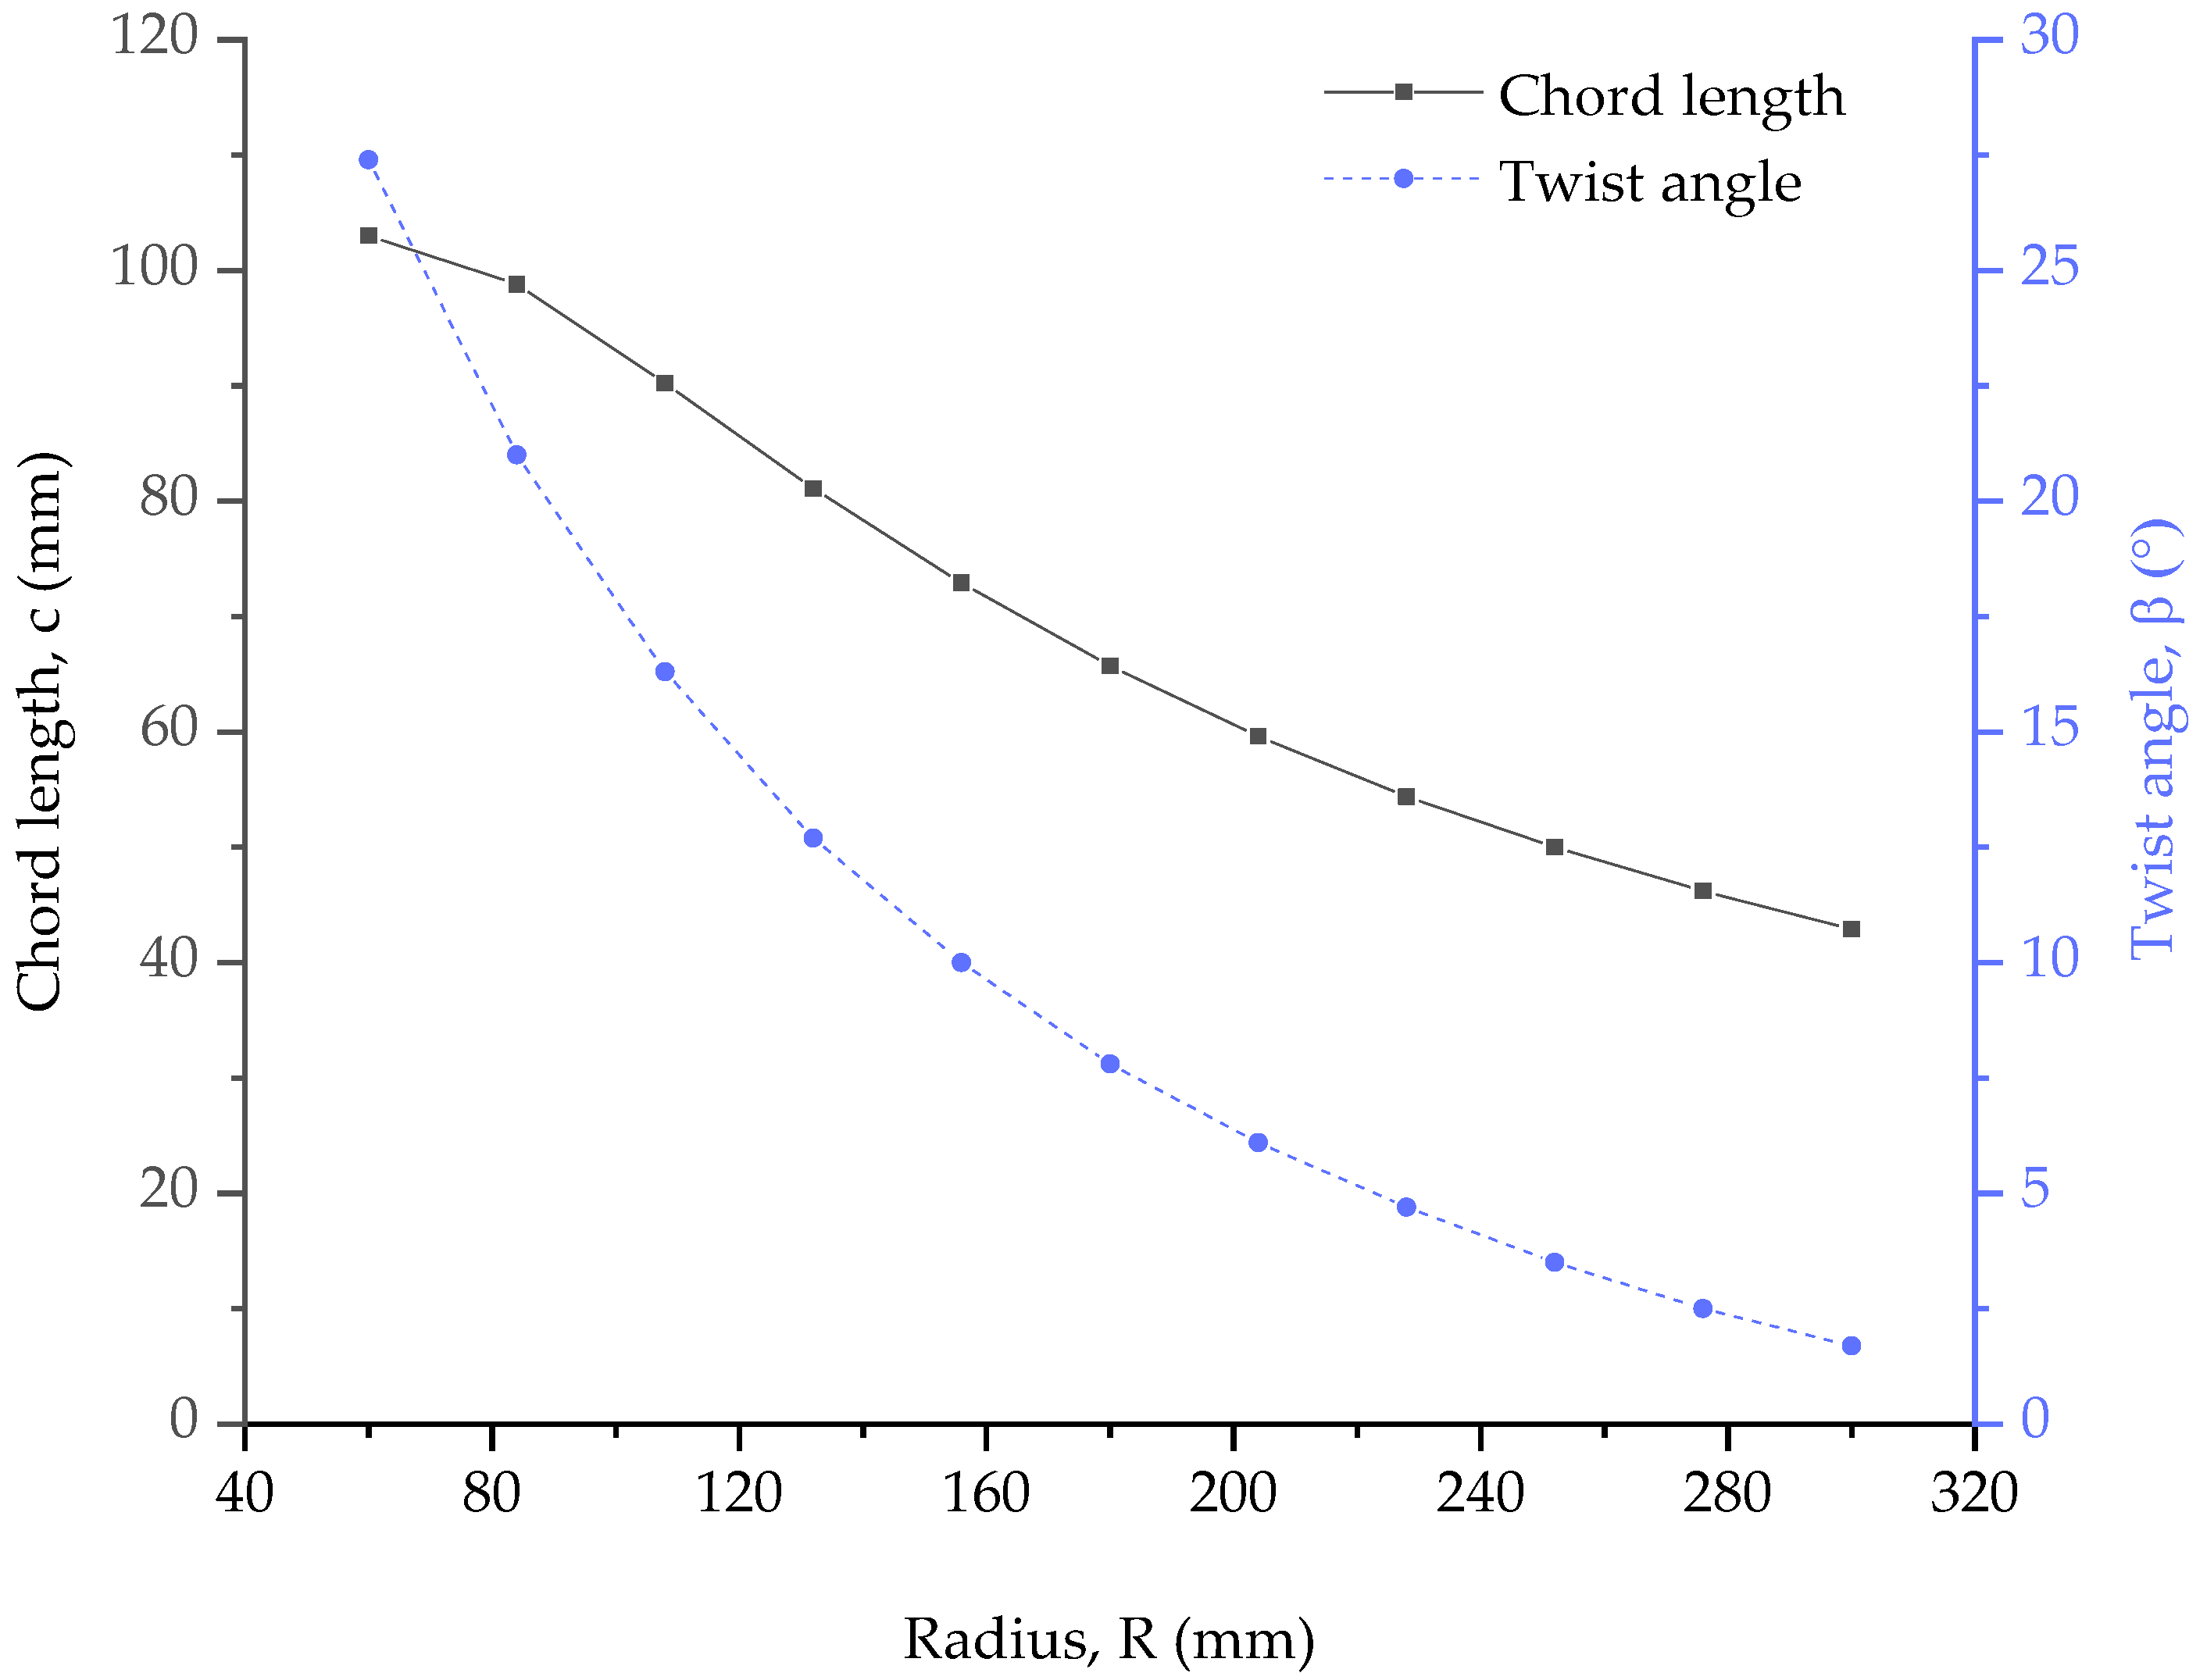
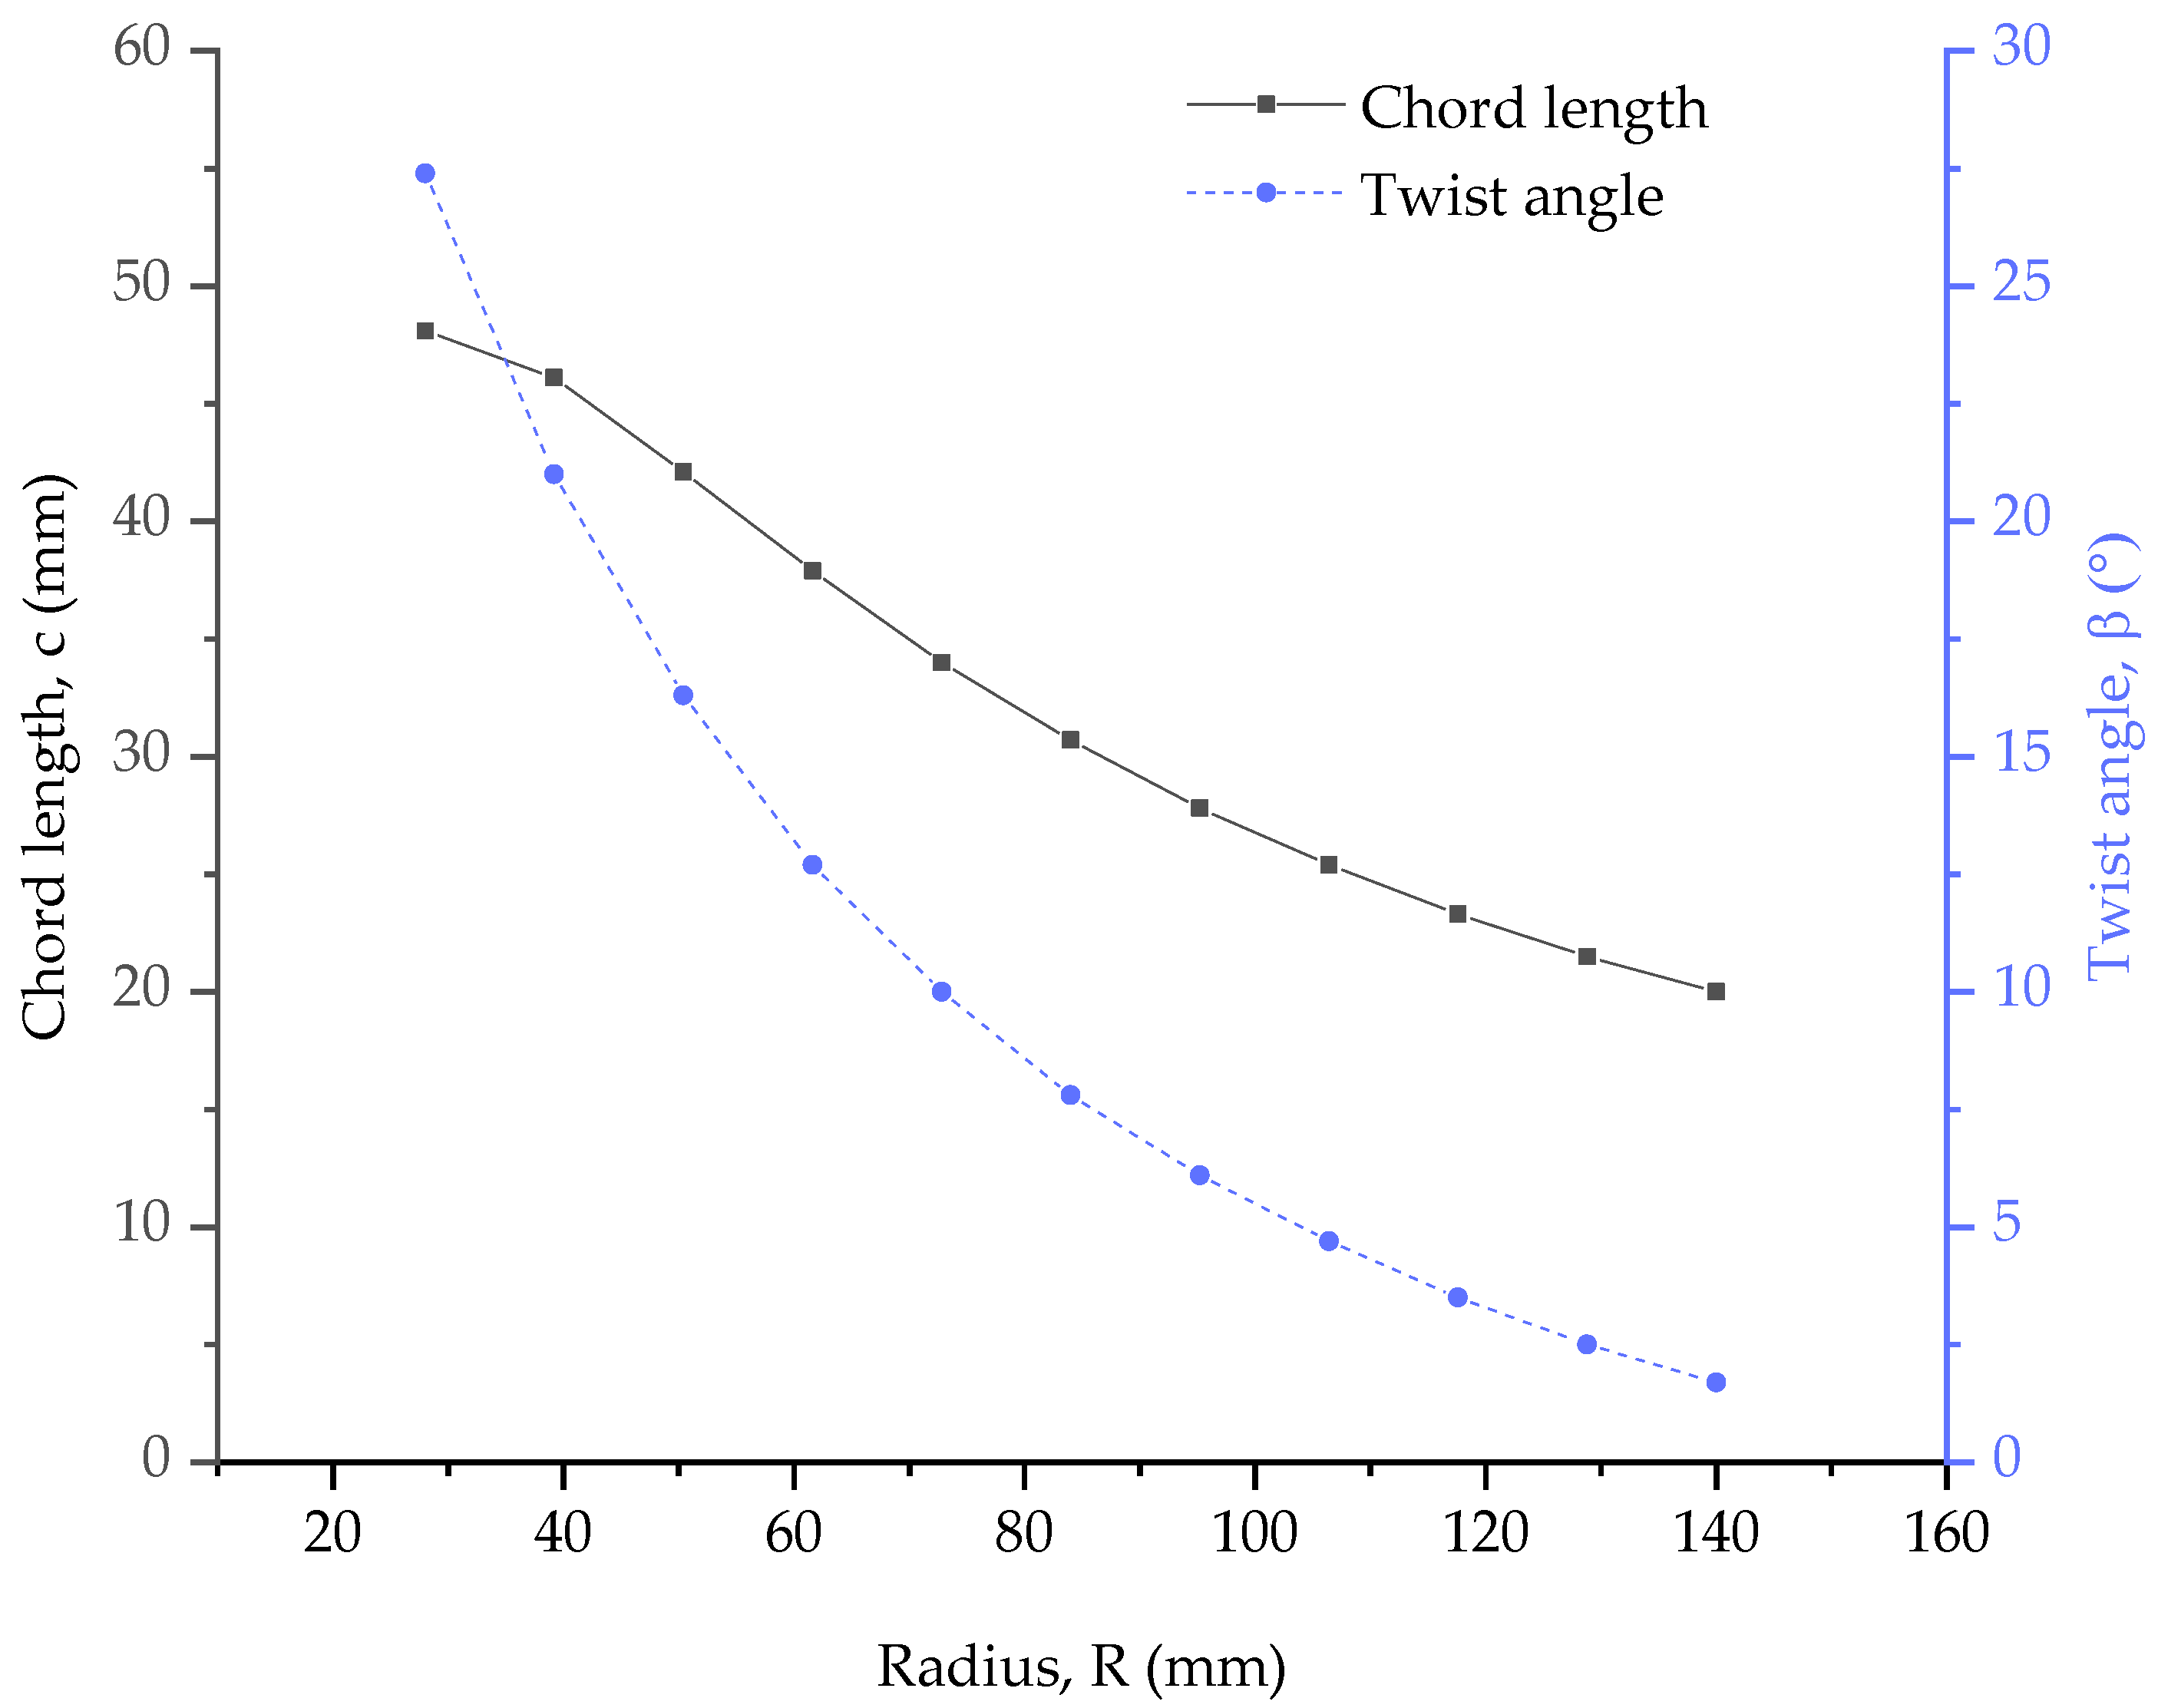
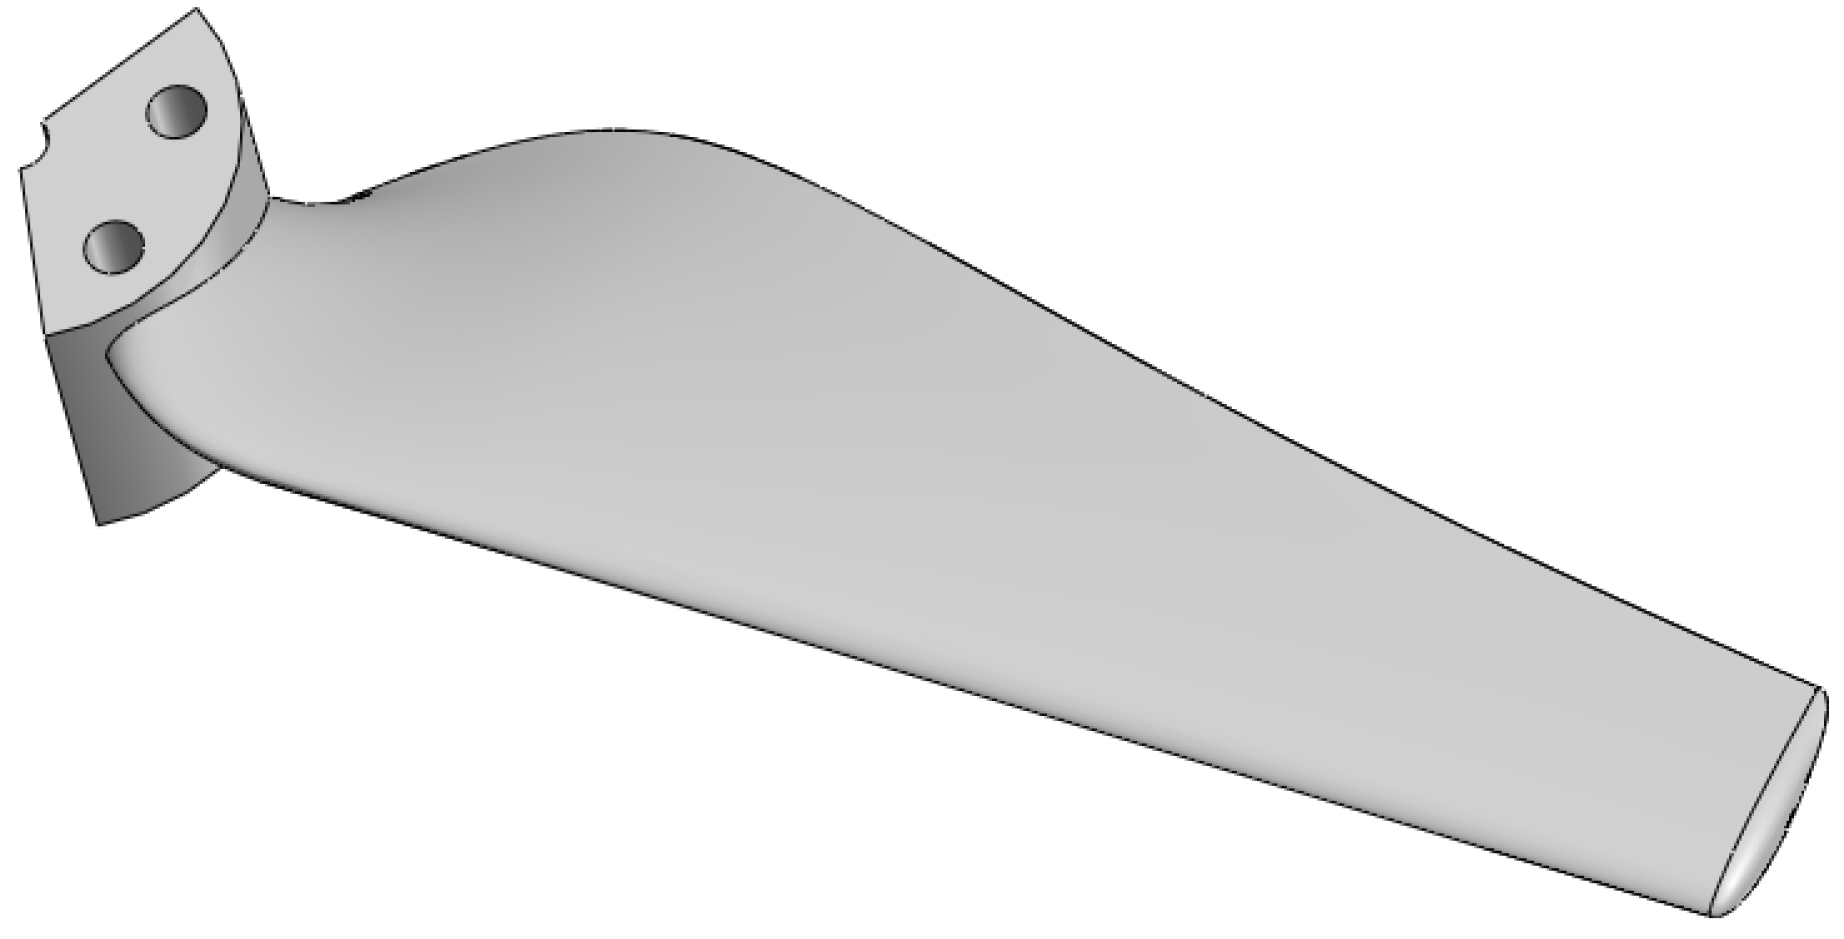
2.1. Rotor Blade Geometry Generation

2.1.1. Airfoil Selection

In general, the selection of an airfoil for the wind turbine rotor blades was made by taking into account the factor that defines its operating environment, which is the Reynolds number. This non-dimensional number is defined as follows:
R e = ρ · V r e l · c a v g μ
where ρ —air density, V r e l —relative velocity, c a v g —average chord length, μ —dynamic viscosity of the air.
The relative velocity at the tip of the blade was calculated as follows [16]:
V r e l = V 2 + V t i p 2
where V —wind speed, V t i p —blade-tip speed.
The efficient functioning of the system is enabled by the aerodynamic factor, strength, and rigidity of the airfoil. However, for small wind turbines, the choice of a very thin airfoil profile with a thickness of 5% of the chord, which is considered more favorable for very low Reynolds number flows by Sunada et al. [45], would significantly affect the structural aspect of the blade, specifically the root part. For this reason, it is necessary to find a solid balance between the sizes of this profile in relation to the large centrifugal forces that characterize small wind turbines [5]. In order to satisfy the above requirements, the S822 airfoil with a thickness of 16% at a 39.2% chord and a maximum camber of 1.8% at a 59.5% chord from the NREL Airfoil Family was chosen as a suitable solution, since choosing a thicker profile than 25% would greatly affect the aerodynamic aspect [5,46] (Figure 1). This dedicated profile for a small horizontal axis wind turbine application with a rotor diameter of 1 to 5 m is designed for a Reynolds number of 6 × 10⁵, specifically for the blade-tip region [8,47].
In this study, the aerodynamic quantities for the S822 airfoil, such as the maximum lift and minimum drag coefficients, and the corresponding angle of attack, were obtained using XFoil 6.9 for a Reynolds number of 1 × 10⁵ and Ncrit = 9, which are presented in the following sub-section.

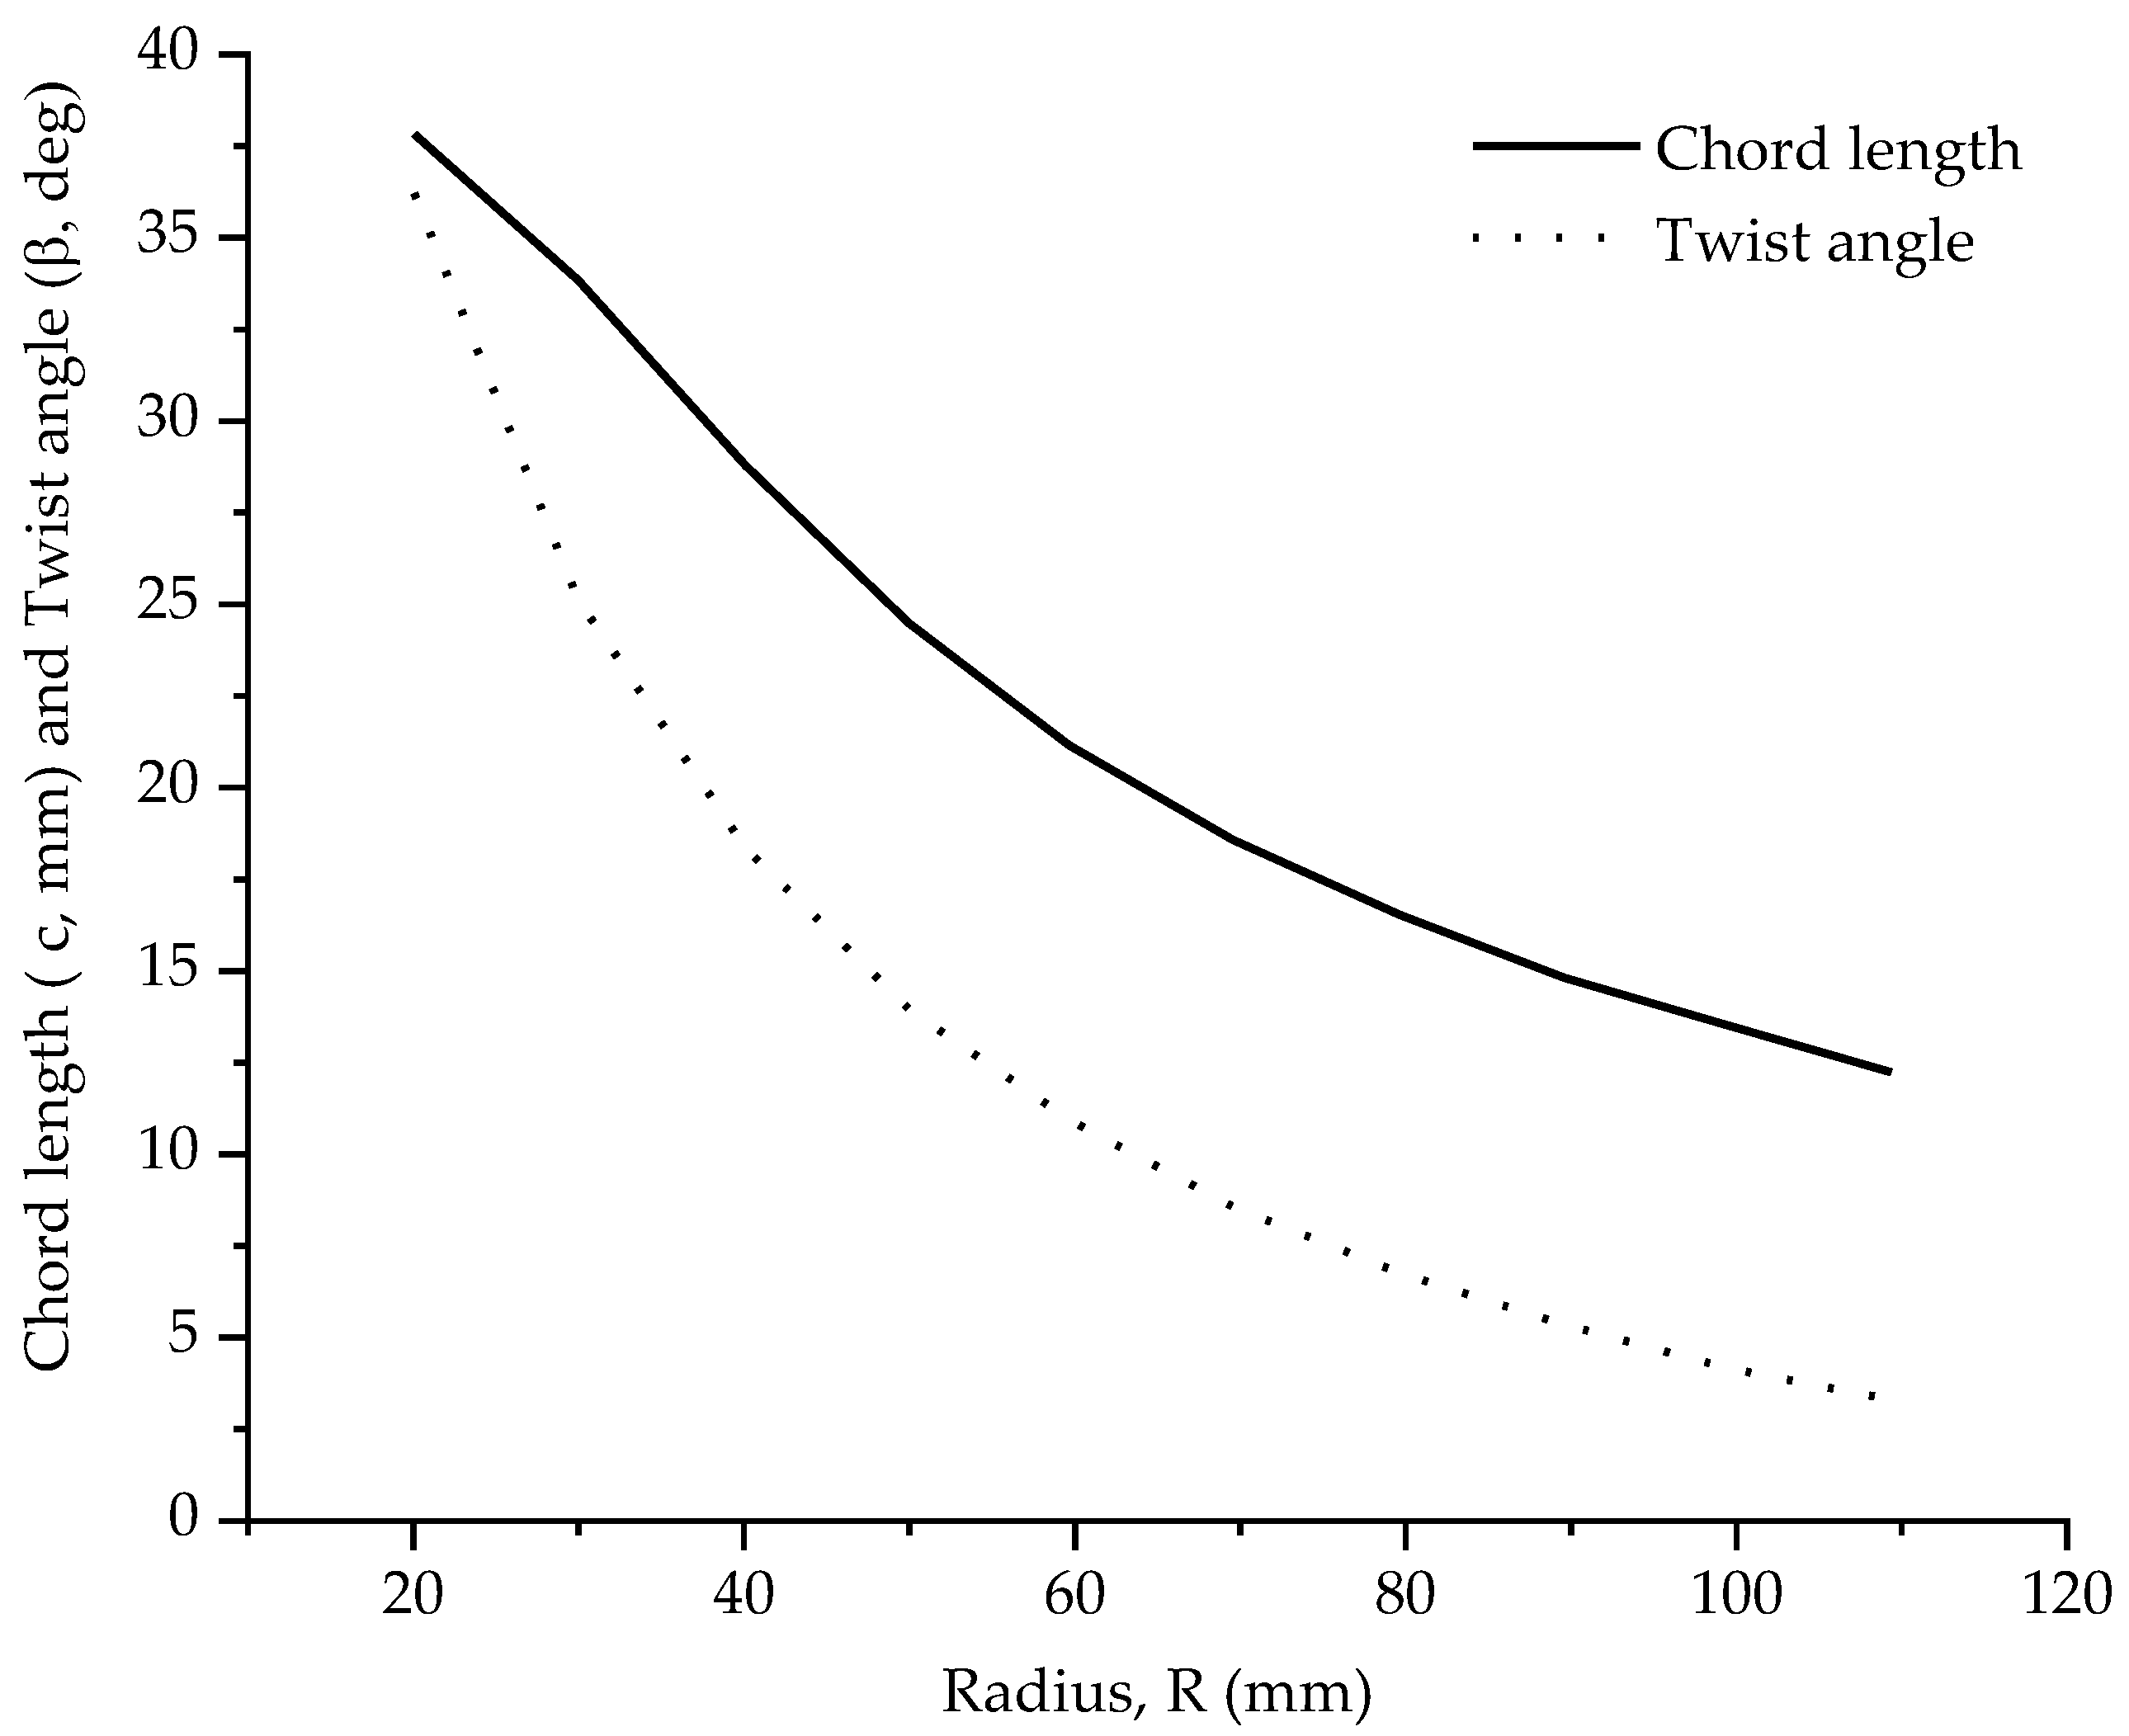
2.1.2. Blade Design Procedure

The geometry of the actual optimum baseline rotor blade model with a fixed-pitch angle and a radius of 140 mm was derived via a small-scale geometry of the original rotor blade model with a radius of 300 mm [46,48], which was designed according to Blade Element Momentum (BEM) equations. The Reynolds number for the original rotor design was selected to coincide with the limit value of 1 × 10⁵ mentioned previously in the literature. Below this value, the operating conditions begin to become significantly harsher, which significantly affects the aerodynamic performance of airfoils and the rotors. The wind speed was taken to be very close to the rated wind speed for small wind turbines (above 10 m/s) [5,6], while the optimum tip-speed ratio was taken to be in the range between 2 and 4 based on the suggestion for improved reliability of rotor performance and lower noise level [6]. The rotor solidity was chosen to be in the range between 15 and 30% to maintain the tip-speed ratio between its optimum values in order to achieve better power performance [6,49]. The body of the blade was made from a single S822 airfoil profile from root to tip. In this study, the blade-tip design has a simple rounded tip cap geometry. In Table 1, the input data for the original design of the rotor are introduced.
The Schmitz Method (Equations (3)–(6)) was used to obtain the optimum blade geometry such as chord and twist angle distributions [32,50]:
The local tip-speed ratio is calculated as
λ i = λ r i R
The local optimum relative inflow angle is calculated as
φ i = 2 3 · a t a n 1 λ i
The local optimum chord length is calculated as
c i = 16 · π · r i B · C L · sin 1 3 · arctan 1 λ i 2
The local optimum twist angle is calculated as
β i = φ i α
In Figure 2, chord and twist angle values and other quantities for the original blade geometries (R = 300 mm) for each station along its length are presented.
Figure 3 represents the chord and twist angle values for the small-scale blade geometry.
Figure 4 shows the three-dimensional geometry of the RB1 baseline blade model.
The rotor blade models were drawn in CAD software (Solidworks 2019) and printed on a Wanhao Duplicator 9 3D printer using ABS material, and were sanded with 1000-grit sandpaper after the printing process, but not dyed. The surface roughness of the baseline blade model and the wavy-shape models was approximately 0.001 and 0.011 mm, respectively.

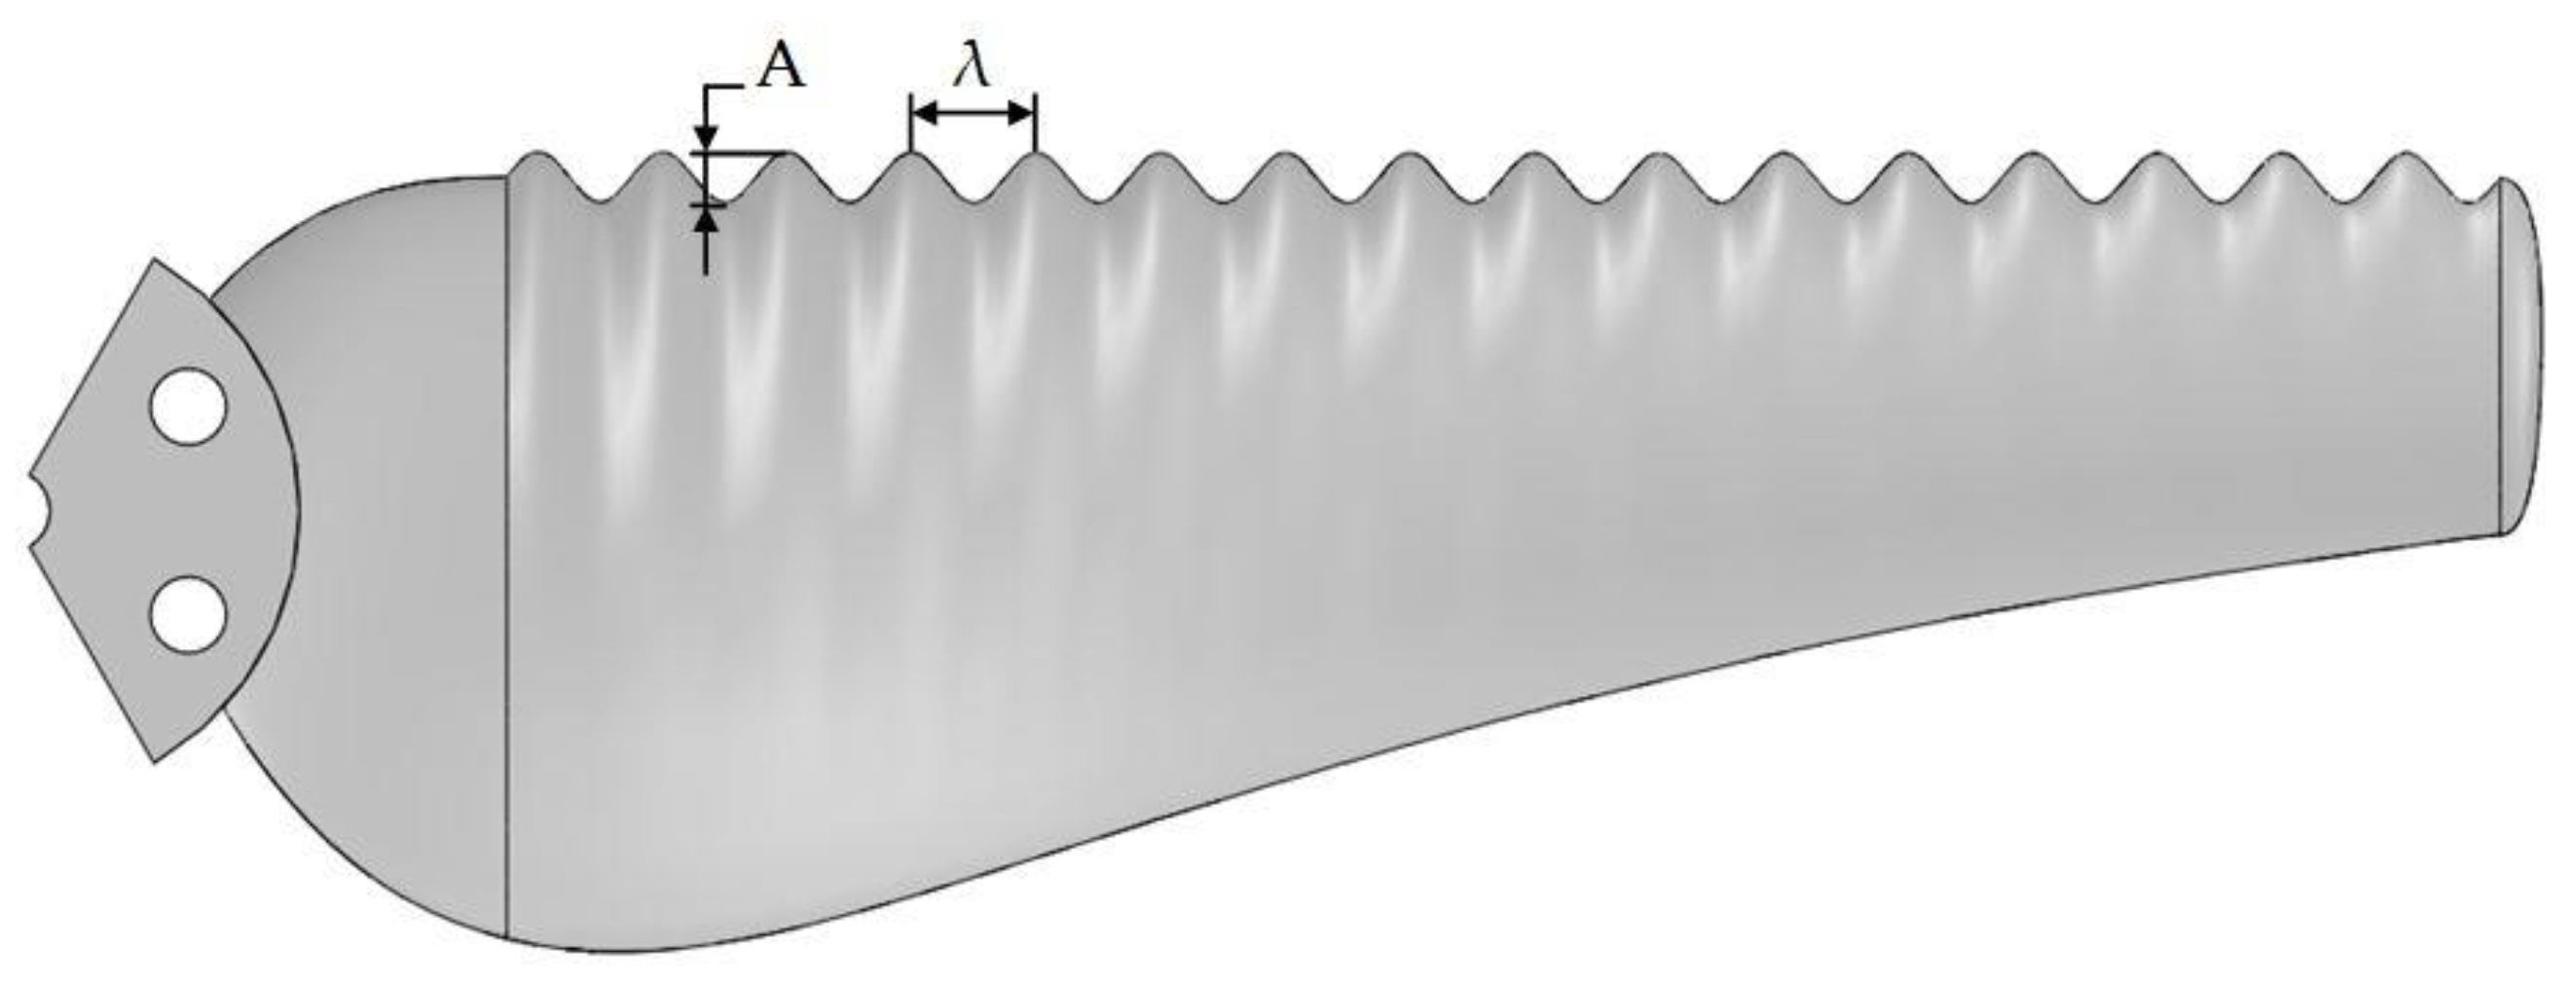
2.2. Generation of Wavy-Shape Blade Models

Using the leading-edge tubercle technique, following the methodologies outlined by Abate et al. [37] and Hansen et al. [25], five different configurations were produced by modifying the amplitude and wavelength parameters (Table 2) in accordance with Equation (7) (Figure 5). The wave’s amplitude (A) was determined by multiplying the average chord length of the blade by the values of 0.03, 0.06, 0.09, 0.11, and 0.14 [46]. Conversely, the wavelength (λ) was derived by multiplying the average blade chord length with the factors of 0.11, 0.14, 0.22, 0.29, and 0.43 [46]. Tubercles span from 20% of the rotor radius to the tips of the blades. The present rotor blades have an average chord length (cavg) of 32.4 mm.
The tubercles’ shape along the leading edge of the blade was calculated using the following equation [37]:
y = y 0 + A 2 · sin 2 · π · x λ
where y 0 is the coordinate of the starting point of the sinusoidal path, which is equal to 18.66 mm, A is the amplitude, λ is the wavelength, and x is the extension of the bumps from the root (0.2 R = 28 mm) to the tip of the blade.
In Table 2, all rotor blade models are introduced, distinguished by the letter RB, which stands for the rotor blade model, and an ordinal number from 1 to 6.

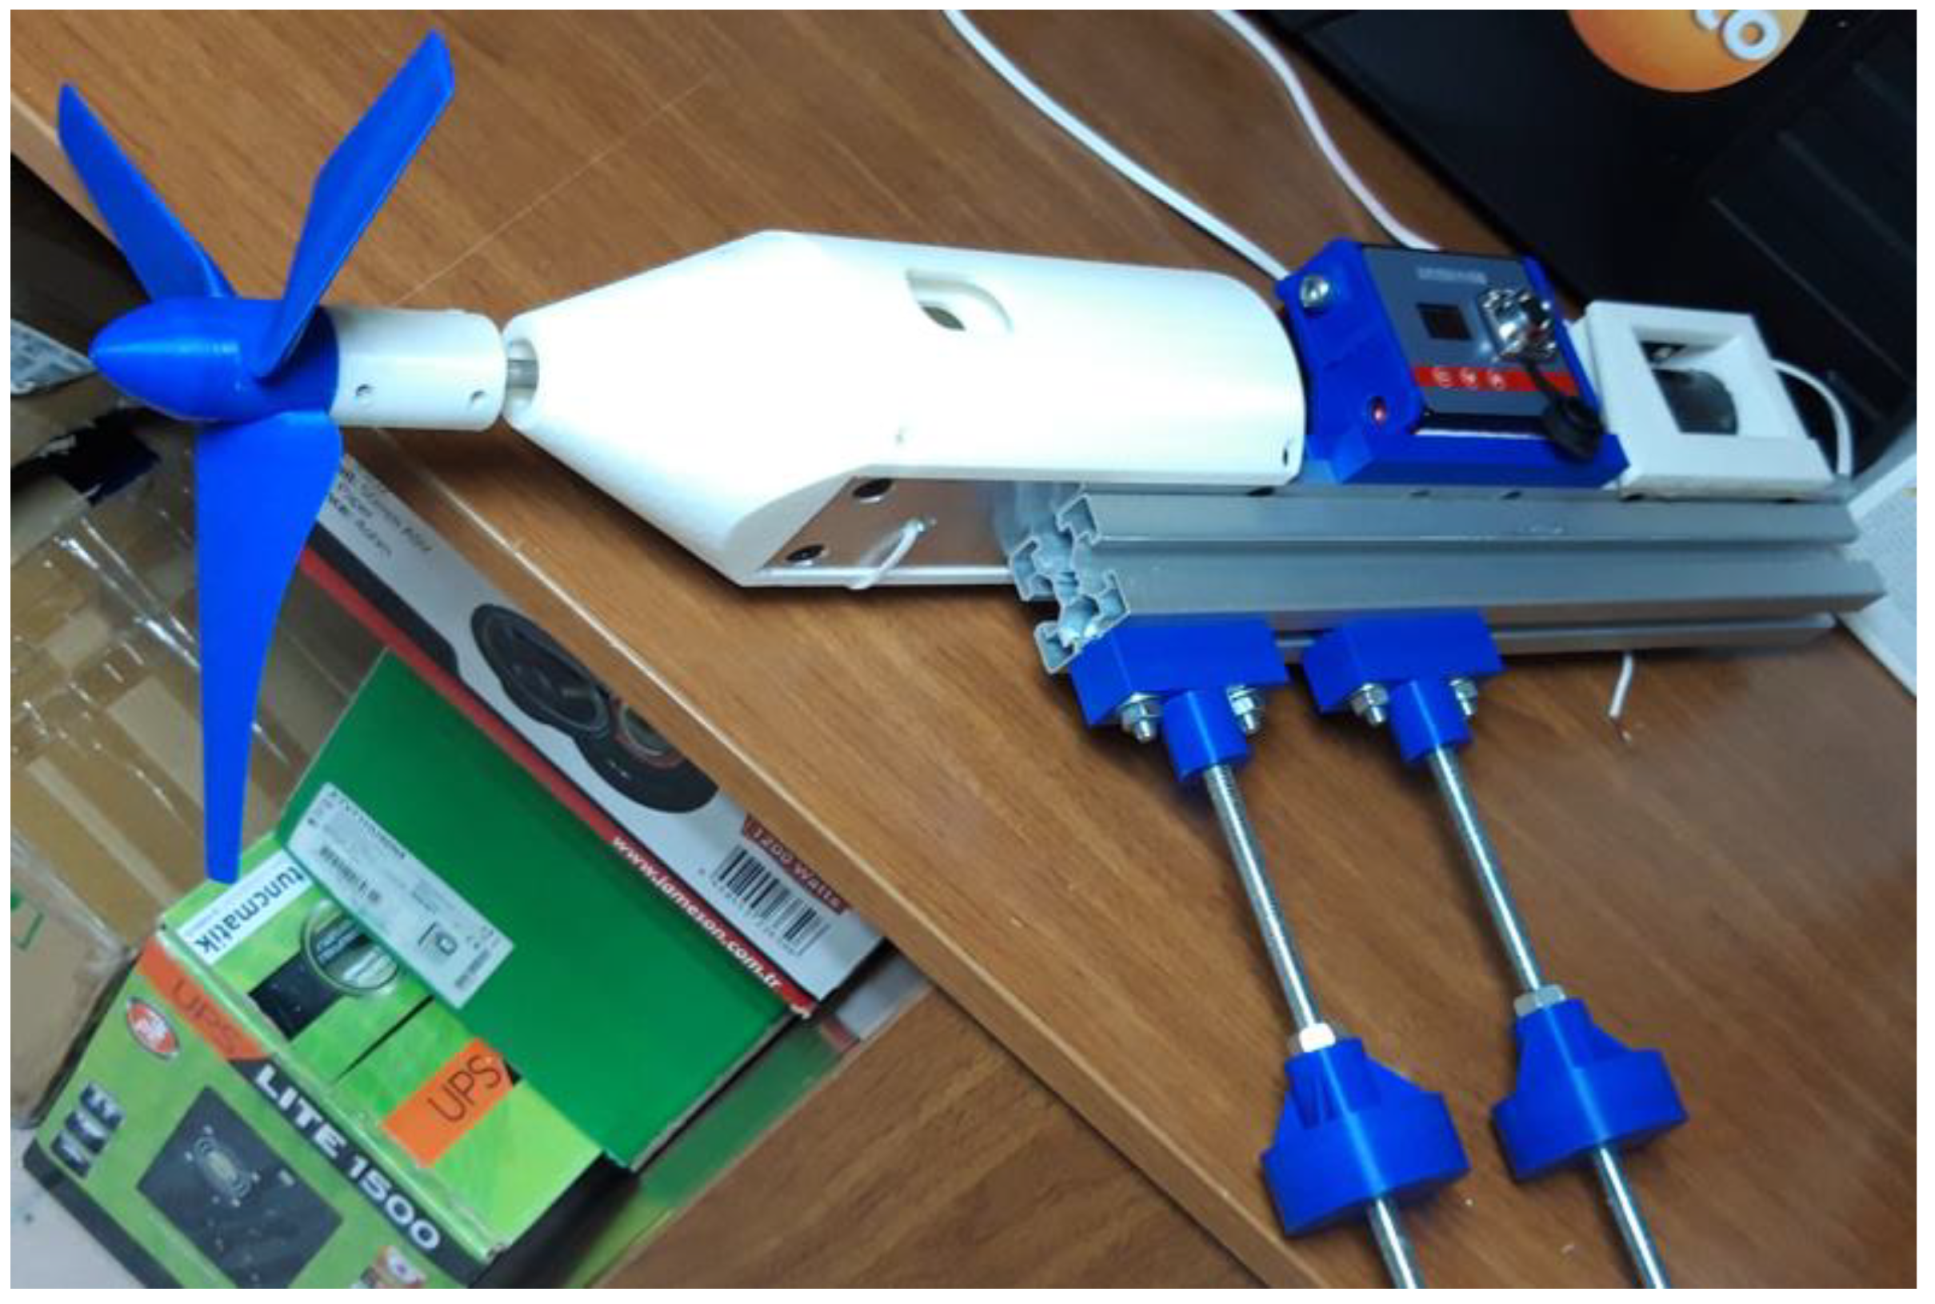
2.3. Experimental Setup

For this experimental investigation, which originates from a PhD thesis [46], a wind tunnel with a square cross-section test section was utilized, capable of achieving velocities up to 30 m/s (depicted in Figure 6). The test section possessed a square cross-sectional shape measuring 0.58 m × 0.58 m at the entry. Constructed from Plexiglas material, the side walls of the test section are slightly angled (0.3°) towards the exit, ensuring a uniform static pressure throughout the entirety of the test area. The turbulence intensity within the wind tunnel remains below 1% for flow velocities between 3 and 20 m/s.
Velocity, temperature, and pressure measurements were conducted using a Pitot-static tube micro-manometer (ManoAir 500, Schiltknecht Messtechnik AG, Schaffhausen, Switzerland). The speed of the rotor shaft was monitored using an optical laser sensor (Monarch Instrument ROS, USA), which was connected to an external data acquisition and analysis device known as OROS OR35 (USA). To regulate the wind tunnel’s adjustable flow velocity, a frequency inverter (Schneider electric, Altivar 71, 4 kW, France) was employed. To gauge the mechanical torque and rotational speed of the rotor shaft, a rotary torque sensor (DYN-200, China) was utilized.
As shown in Figure 6 and Figure 7, the wind rotor is horizontally mounted in the test area, connected via two rod supports to the lower wall of the test section. The torque sensor is positioned between the wind rotor and the DC motor (Maxon RE50 Ø 50 mm, Switzerland) and is powered by the DC power supply (TT T-ECHNI-C YH-605D, China). Additionally, an electronic load device known as Rigol DL3021 Precision (China) is connected with the DC motor, which functions as a braking mechanism. This setup ensures that the desired rpm of the rotor shaft is upheld, regardless of changing flow conditions.
For each test session, the procedures were replicated three times, and the resulting power coefficient curves illustrate the average values derived from these measurements. Wind tunnel data was gathered using the NI PCle-6323 data acquisition card (DAQ) (National Instruments, Austin, TX, USA) to acquire voltage signals by means of the MiniCTA software (Dantec Dynamics, Denmark), which is integrated into the computer system.

2.3.1. Testing Method

It is suggested by several authors that when downscaling small wind turbine models for wind tunnel testing, due to the high sensitivity of the flow regime, matching the Reynolds number in addition to the tip-speed ratio and geometric scaling is a necessity [51,52]. However, scaling in such a way led to impractical test conditions as it required high wind speeds of around 19.3 m/s, which manifested in vibrations of the entire turbine structure in the wind tunnel test section. Thus, taking into account the current laboratory conditions and the suggestion by Post and Boirum [53], who emphasize the vital importance of maintaining the same tip-speed ratio for such conditions and bypassing the achievement of matching the Reynolds number, it was decided to conduct experiments at lower wind speeds.
The appropriate method for testing and measuring the aerodynamic characteristics of the proposed rotors was implemented using the baseline rotor blade model (RB1).
In this study, considering the constraints of the laboratory setup [46], it was advantageous to conduct experimental investigations by maintaining the tip chord-based Reynolds number unchanged while varying flow speeds. This approach involved keeping the relative velocity constant at the blade tip within a range of tip-speed ratios from 2 to 5, as recommended by Kishore et al. [6].
The testing methodology, according to the reference literature [46], was executed while considering a rotor speed of 2866 rpm and its corresponding blade-tip speed of 42 m/s, given a rotor radius of 140 mm. This setup resulted in a calculated relative velocity of 43.29 m/s at the blade tip, achieved for a tip-speed ratio of 4 and wind speed of 10.5 m/s, in accordance with Equation (2). The chosen tip-speed ratio was an intermediate value, falling between 3 and 5, and was coupled with wind speeds ranging from 8.4 m/s to 14 m/s. The resulting blade-tip-chord-based Reynolds number for this specific scenario was 4.7 × 10⁴, based on Equation (1). This computation considered a blade-tip chord length of 20 mm, an approximate air density of 1 kg/m3, a relative velocity of 43.29 m/s, and an air dynamic viscosity of 18.56 × 10⁻⁶. The atmospheric pressure was taken as 86 kPa, representing the conditions in Niğde town (Turkey), accompanied by an air temperature of 27 °C.
In the initial testing phase, it was observed that the rotor models did not initiate rotation at flow velocities below approximately 10 m/s due to the resistive loads generated by the bearings and the DC electric motor. Consequently, a higher initial flow velocity was employed to initiate rotor motion, which was then subsequently adjusted to the desired operating flow speed.

2.3.2. Tunnel Blockage Correction

In the present study, wind tunnel blockage was calculated using Equation (8) and was about 18.9% [46]; this value is about twice as large as the limit of 10% suggested by the literature [9,54], below which correction of the measured results is not a necessity.
B T = B · A r o t o r A t u n n e l
where B —number of blades, A r o t o r —rotor swept area, A t u n n e l —cross-sectional area of test section.
The power coefficients for each case computed from the mechanical torque and tip-speed ratios were corrected for tunnel blockage effects according to the Van Treuren approach [9]. The blockage factor was determined separately for each rotor model being tested in the wind tunnel for each wind speed, with and without the rotor in the test section.

2.3.3. Uncertainty in the Measurement

The uncertainty associated with design parameters was determined using the Akbıyık approach [55] under the maximum performance condition of the baseline rotor model (RB1). This condition corresponds to a tip-chord-based Reynolds number of 4.7 × 10⁴, which in turn corresponds to a wind speed of 11.29 m/s, a blade-tip speed of 42 m/s, a rotor shaft speed of 2866 rpm, an air density of approximately 1 kg/m3, a local atmospheric pressure of 86 kPa, and a temperature of 27 °C [36,37].
Given these values, the uncertainty in flow speed was calculated to be approximately 1.3%, while the uncertainty in the tip-speed ratio was around 1.4%. The uncertainty in the power coefficient was estimated at 4.1%, and that of the Reynolds number was about 1.8%.

2.4. Validation of the Proposed Rotor Model

Due to the specific size of the scaled rotor, the authors were unable to find a model with the same characteristics, that is, designed with the same parameters and tested under the same conditions. Therefore, to validate the proposed baseline rotor model, the experimental results obtained in the wind tunnel were compared to the study of Lanzafame et al. [56], following the suggestion of Bakırcı and Yılmaz [50], who found that the power coefficient and the optimal tip-speed ratio does not depend on the radius of the wind turbine but on the number of blades. For this reason, the results of the wind turbine rotor from the literature with the approximate diameter and tip-speed ratio, and an equal number of blades, were obtained.
The characteristics of the selected rotor model for comparison purposes were as follows: rotor radius 112.5 mm, three blades, operational Reynolds number lower than 8 × 10⁴, optimal tip-speed ratio ~3.3, NACA 4415 airfoil, rotor solidity ~19%, rotational speed 2450 rpm, wind speed range from 5 to 30 m/s, and blockage ratio 0.159.
In the following figure (Figure 8), the reference rotor blade geometry, such as chord and twist angle distributions, is depicted.

3. Results and Discussion

The laboratory tests were performed to understand the effects of leading-edge tubercles on rotor blade models for several wind speeds between 8.5 and 15.5 m/s at the entry point of the test section. Measurements were taken at various tip-speed ratios, spanning the range from 2 to 5.
Firstly, a reference curve was determined from the experimental data obtained by using the RB1 rotor model as a base, which will serve later for the comparison of the obtained curves of the modified rotor models. Furthermore, the same rotor model was used to determine the proper performance testing method for the given conditions. In Figure 9, the RB1 baseline rotor model mounted on the support structure is presented.

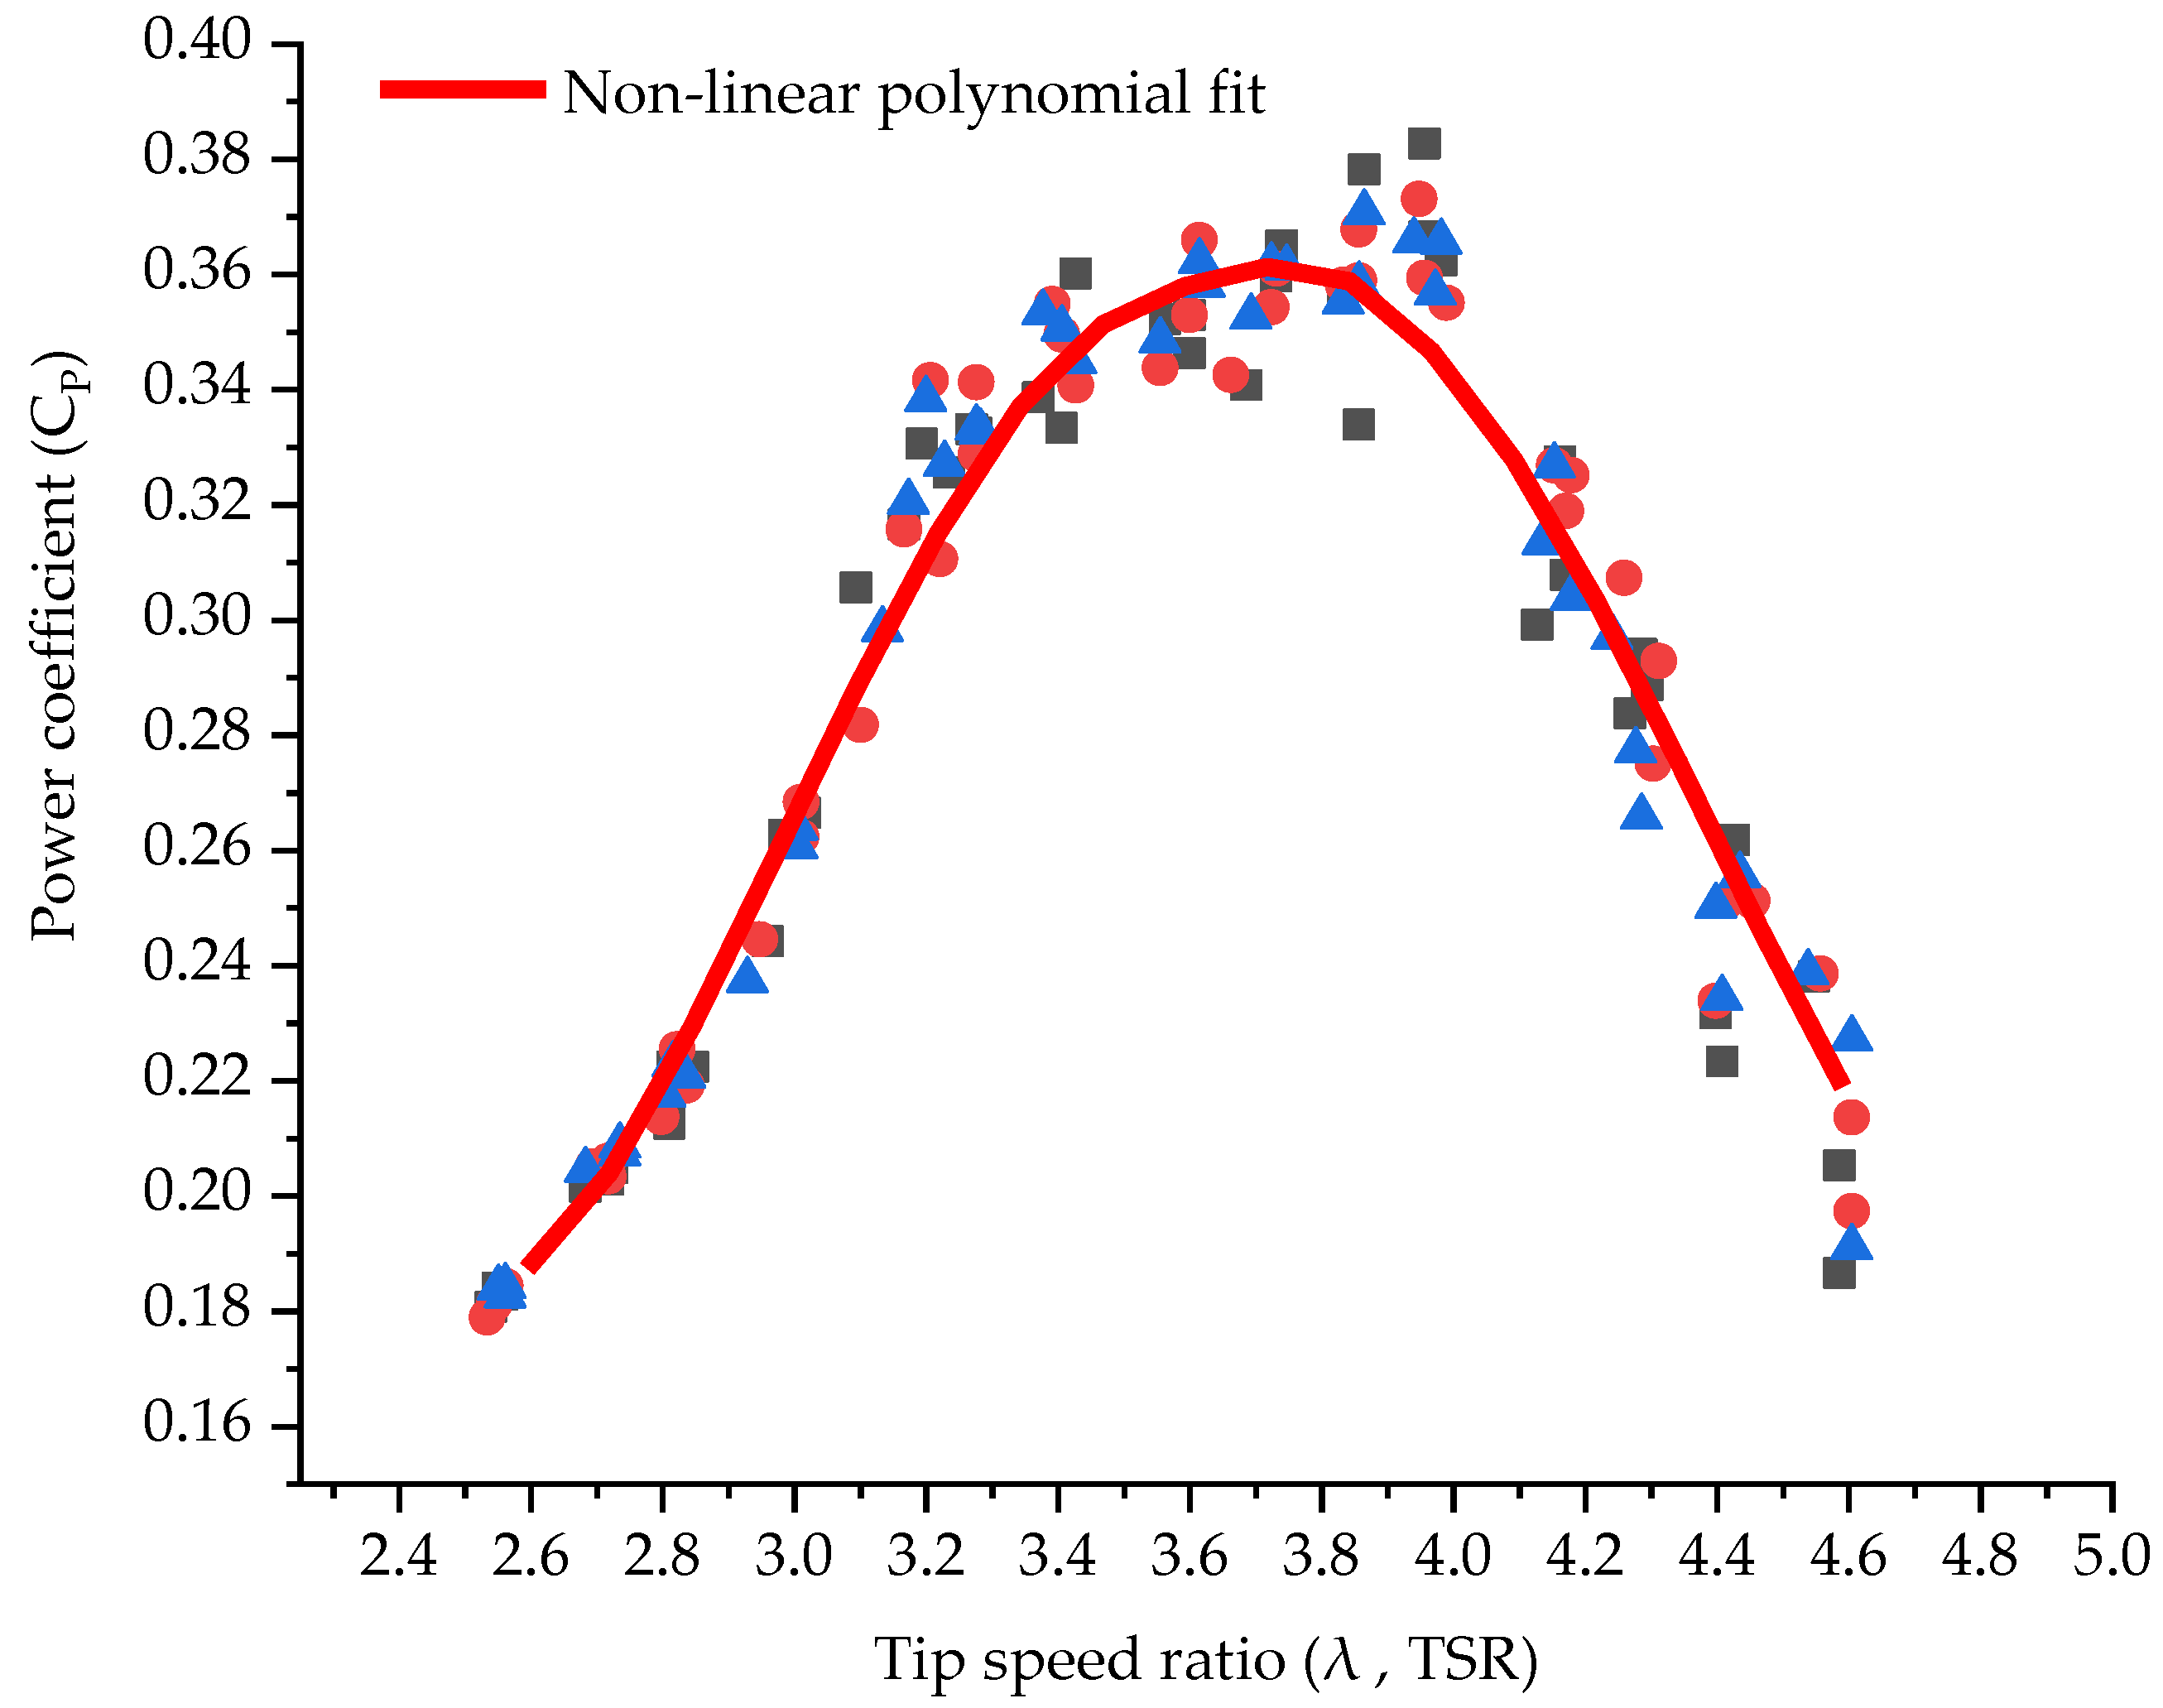
3.1. Representative Power Coefficient Curve

Three experimental measurement cycles were derived to determine the representative average power coefficient curve of the corrected RB1 rotor model to be used later as a reference, in comparison with modified rotor blade models under the same flow conditions. During each measurement, the mechanical torque and rpm values were captured three times via a digital camera. Subsequently, the average power coefficient was calculated by correcting the recorded data. Figure 10 shows the representative power coefficient curve, which was obtained using a non-linear polynomial fit. The total error in the experimental data represents a scatter of ±4.1%. As shown in the figure, the stability of the rotor was affected by the tip-speed ratio, especially for higher values.
As is evident from the figure, the curve’s shape is distinctly characterized by a steep incline, a maximum value, and then a steep decline, indicating that the rotor ran fast at small tip-speed ratios, while decreasing quickly after reaching its maximum power coefficient. The highest power coefficient, of 0.361, was attained at a tip-speed ratio of 3.717, which closely aligns with the design tip-speed ratio of 3.658.
This graph was used as a reference model for comparison with the other rotor model configurations.

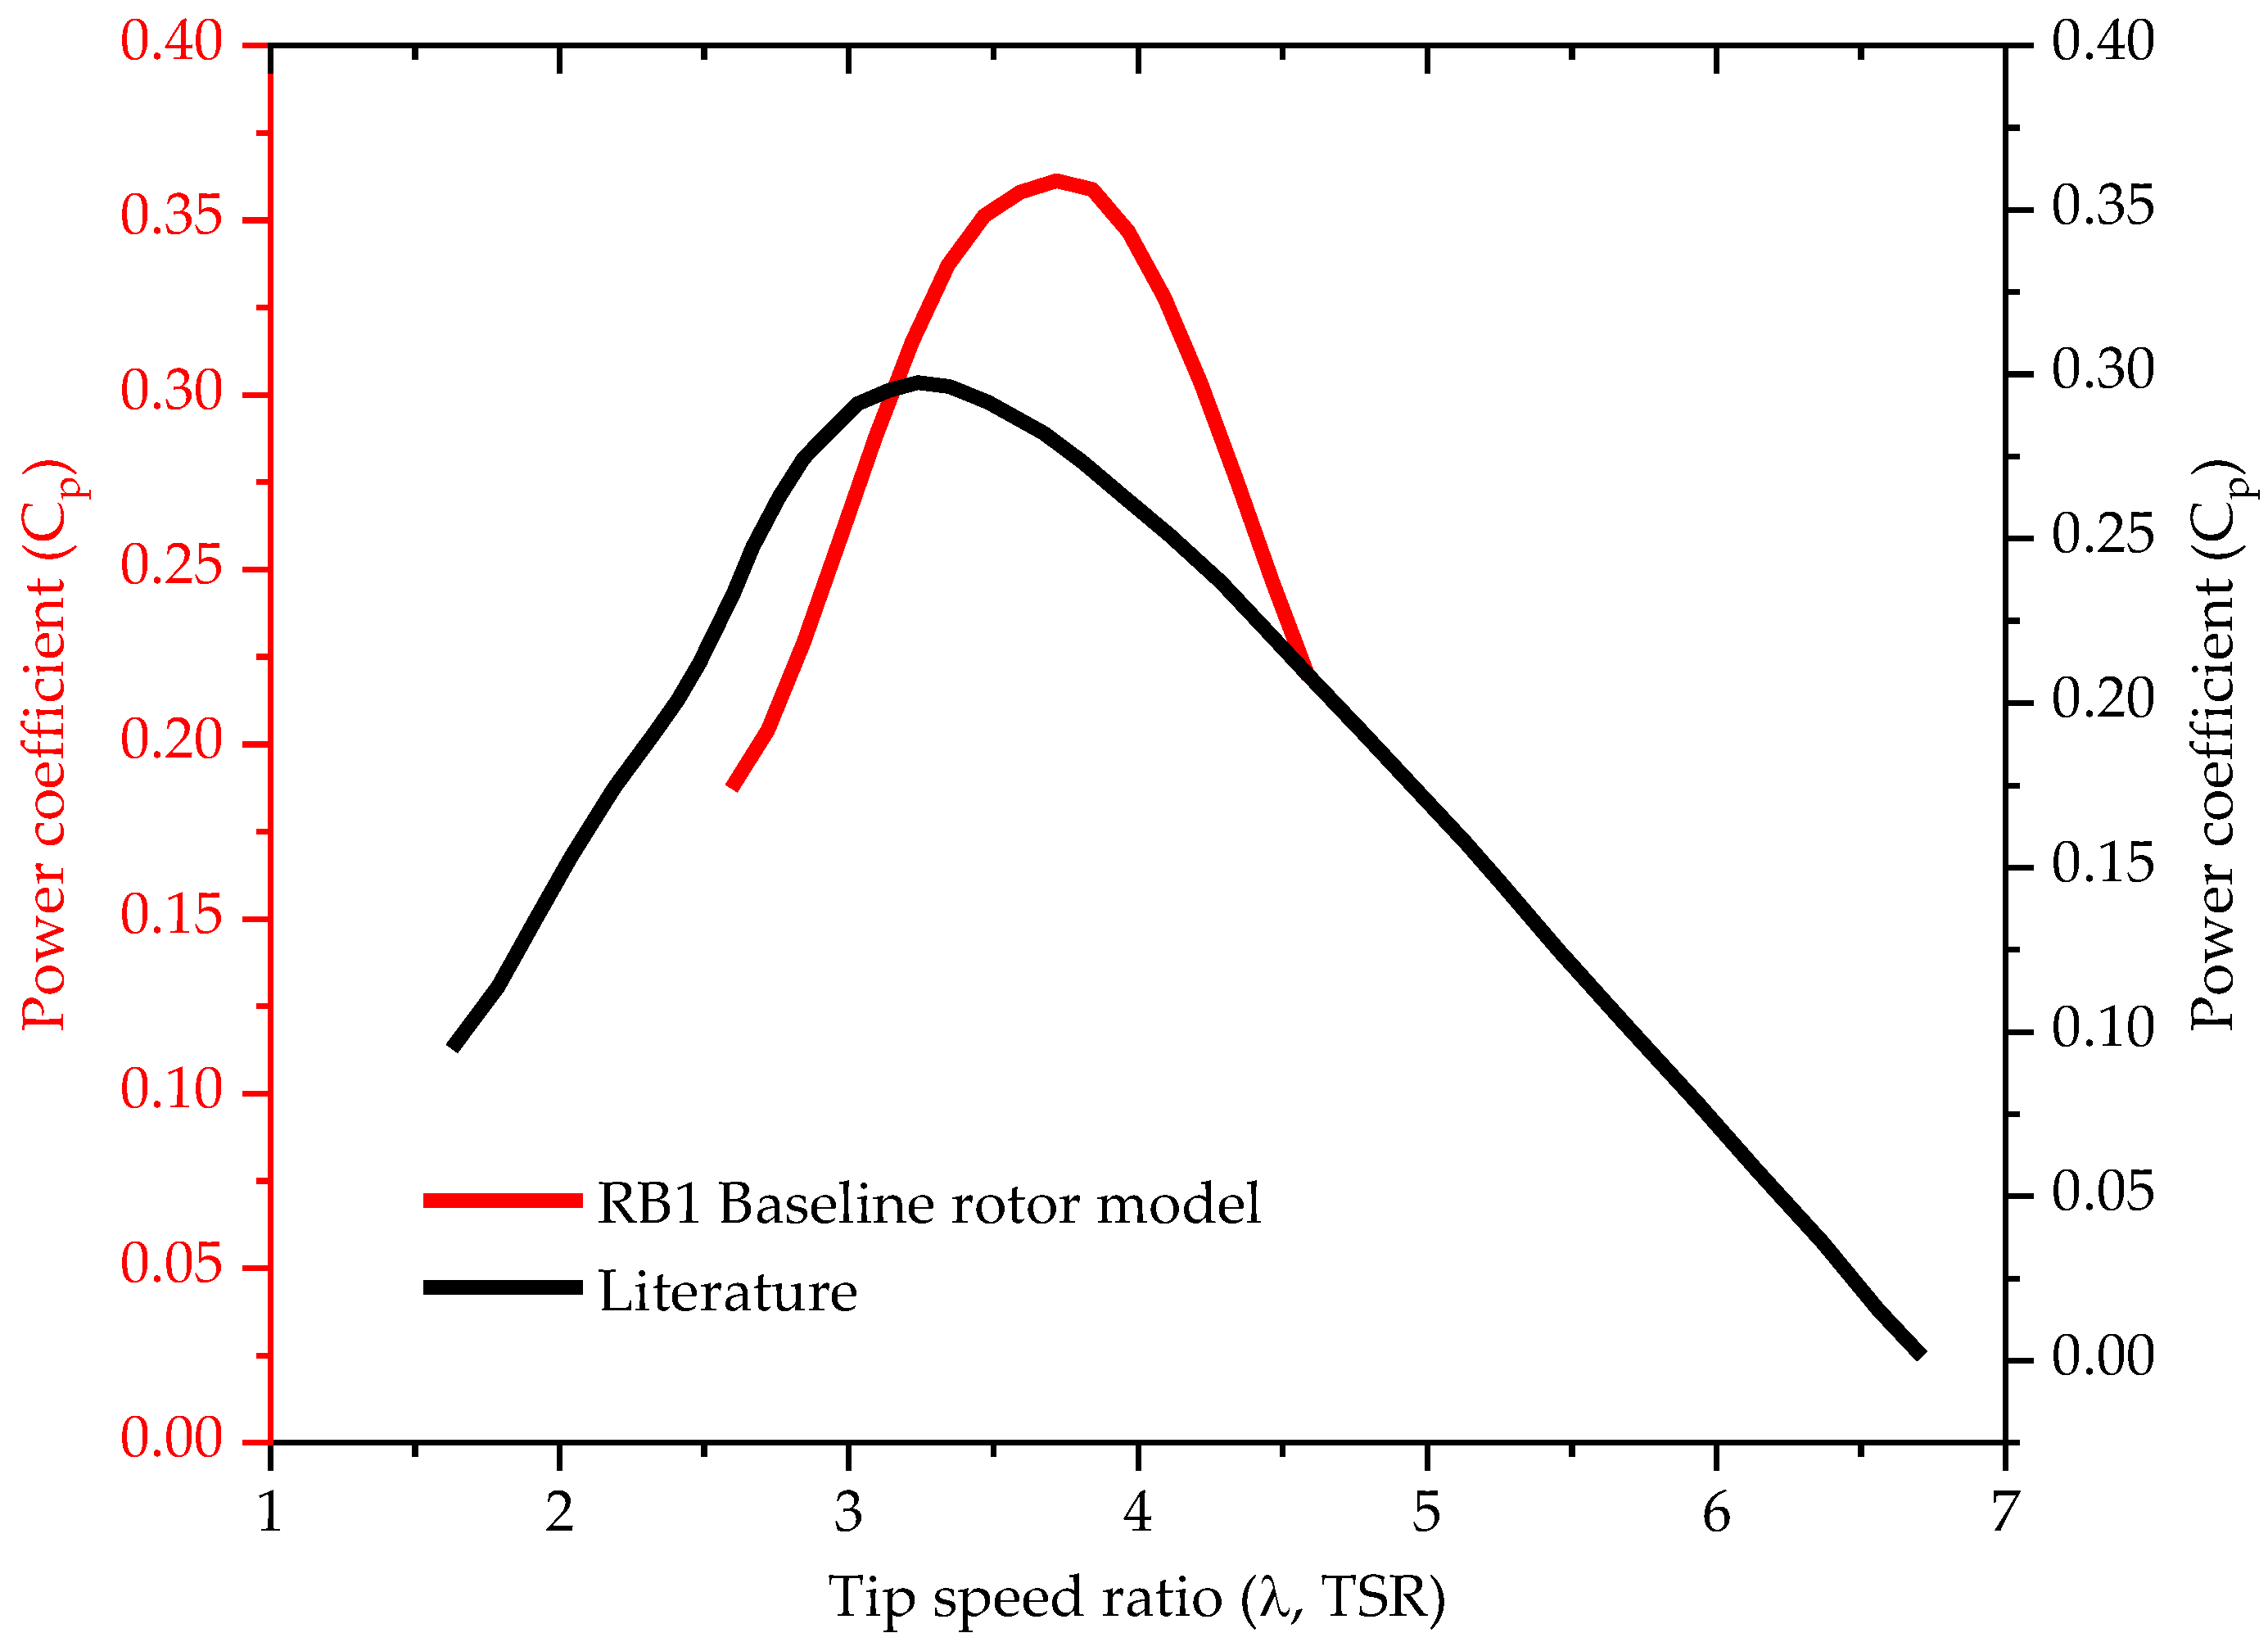
3.2. RB1 Baseline Rotor Model and Validation

Figure 11 depicts the experimental result of the rotor model from the literature [56], in terms of the power coefficient and tip-speed ratio, obtained for approximately similar test conditions. By comparing the results from Figure 10 and Figure 11, it can be seen that the rotor model discussed in the literature demonstrates improved performance at lower tip-speed ratios, specifically up to 3.2, which is near its optimal tip-speed ratio. At this range, it achieves a peak power coefficient of approximately 0.294. After this point, the performance of the rotor drops significantly with the increase in the tip-speed ratio up to around 4.5. This could be expected due to the different rotor design parameters, one of which is the airfoil profile. It is therefore acceptable to validate the chosen approach when there are no data for rotor models designed with the same parameters and tested for the same conditions.

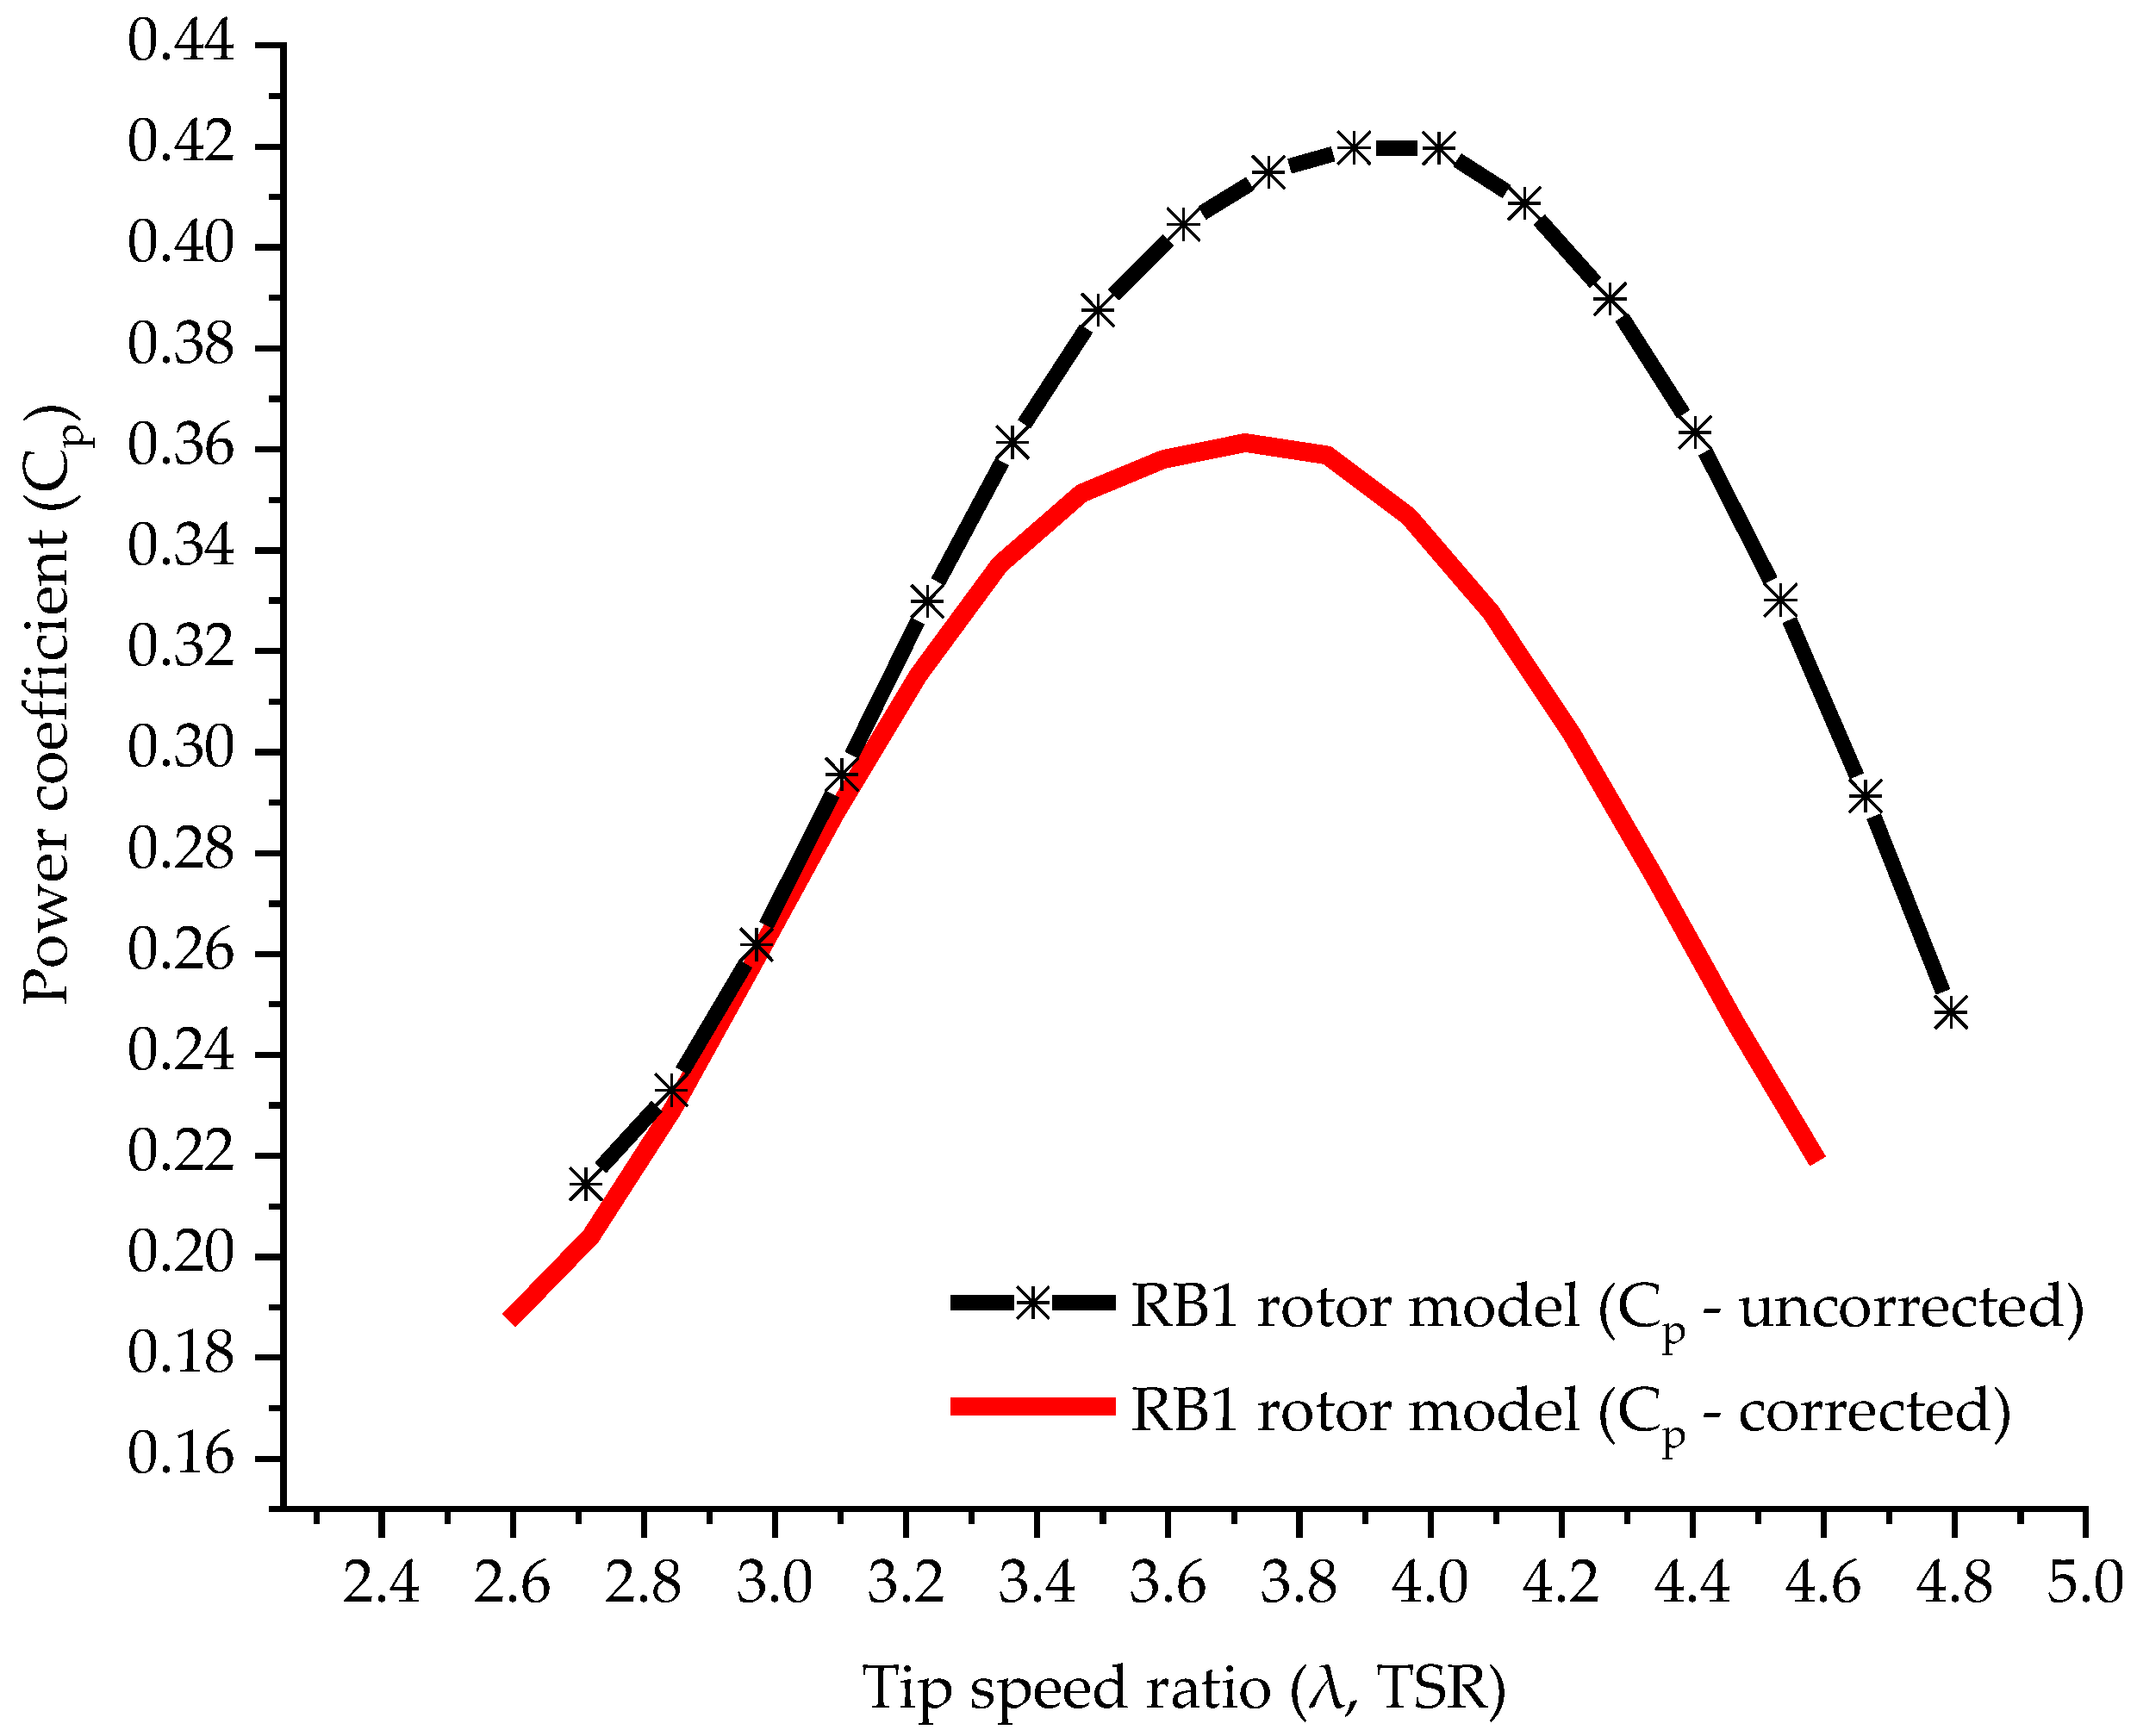
3.3. Wind Tunnel Blockage Correction

Due to the considerable presence of the rotor within the test section, it became essential to implement blockage corrections to account for the influence of interfering objects. A blockage factor was separately determined for all rotor models for each free stream velocity as the ratio of the measured wind speed with and without the presence of the rotor inside the test section [9]. Figure 12 shows the situation before and after application of the tunnel blockage factor to the power coefficient curve for the RB1 rotor model. It is evident that at lower tip-speed ratios, the impact of the blockage ratio is minimal.

3.4. RB2 Rotor Model

Figure 13 illustrates the power coefficient curves for the RB1 and RB2 rotor models. This particular model configuration is characterized by the smallest wave parameters, having an amplitude of 1 mm and a wavelength of 3.5 mm. The graph shows that by changing the shape of the leading edge of the RB1 rotor model for the same working conditions, the efficiency increases and consequently fulfills the purpose of the experiment for improving the effectiveness of the blade shape.
According to the graph, the RB2 rotor model has a wider shape of the power coefficient curve profile, which extends over the RB1 rotor model. This means that this model exhibited better performance characteristics compared to the RB1 rotor model over the entire range of tip-speed ratios, especially from tip-speed ratios from 2.5 to 3.5, where the wind speed is high, and from 4 to 4.5 for lower flow speeds. As depicted in Figure 13, the RB2 rotor model showed an increase in performance of about 40% compared to the RB1 rotor model for low tip-speed ratios. The highest power coefficient of 0.371 was obtained for λ = 3.654, which is close to the design tip-speed ratio. Meanwhile, this model exhibits a maximum power coefficient that is approximately 2.8% higher than that of the RB1 rotor model. Furthermore, it maintains its advantages across the entire range of tip-speed ratios.

3.5. RB3 Rotor Model

As the amplitude and wavelength values are increased from 1 to 2 mm and from 3.5 to 5 mm, respectively, a notable decrease in the model’s performance is observed. However, within the range of tip-speed ratios from 3.46 to 4.1, this model exhibited poorer performance compared to the RB1 rotor model. Figure 14 visually represents the power coefficient curves for the RB1 and RB3 rotor models. Notably, the maximum power coefficient of 0.352 is achieved at a wavelength of 3.46, which is approximately 2.6% lower than that of the RB1 rotor model and 5.4% lower than that of the RB2 rotor model. However, an important characteristic can be noticed, namely, that the maximum power coefficient is shifted to a smaller value of the tip-speed ratio and there is a rapidly growing trend beyond the tip-speed ratio of 4.1.

3.6. RB4 Rotor Model

Figure 15 displays the power coefficient curves for the RB1 and RB4 rotor models. The power coefficient curves of RB4 and RB1 rotor models show remarkable similarity for tip-speed ratios up to 3.15, with only a slight divergence beyond 4.21. In the range between these two values, there is a discernible disadvantage of 9.1% of the RB3 rotor model compared to the RB1 rotor model, and approximately 12.1% compared to the RB2 rotor model. The highest power coefficient of 0.331 is obtained at a wavelength of 3.465. It is also apparent that the highest performance of this profile is attained at nearly the same tip-speed ratio as the RB3 rotor model.

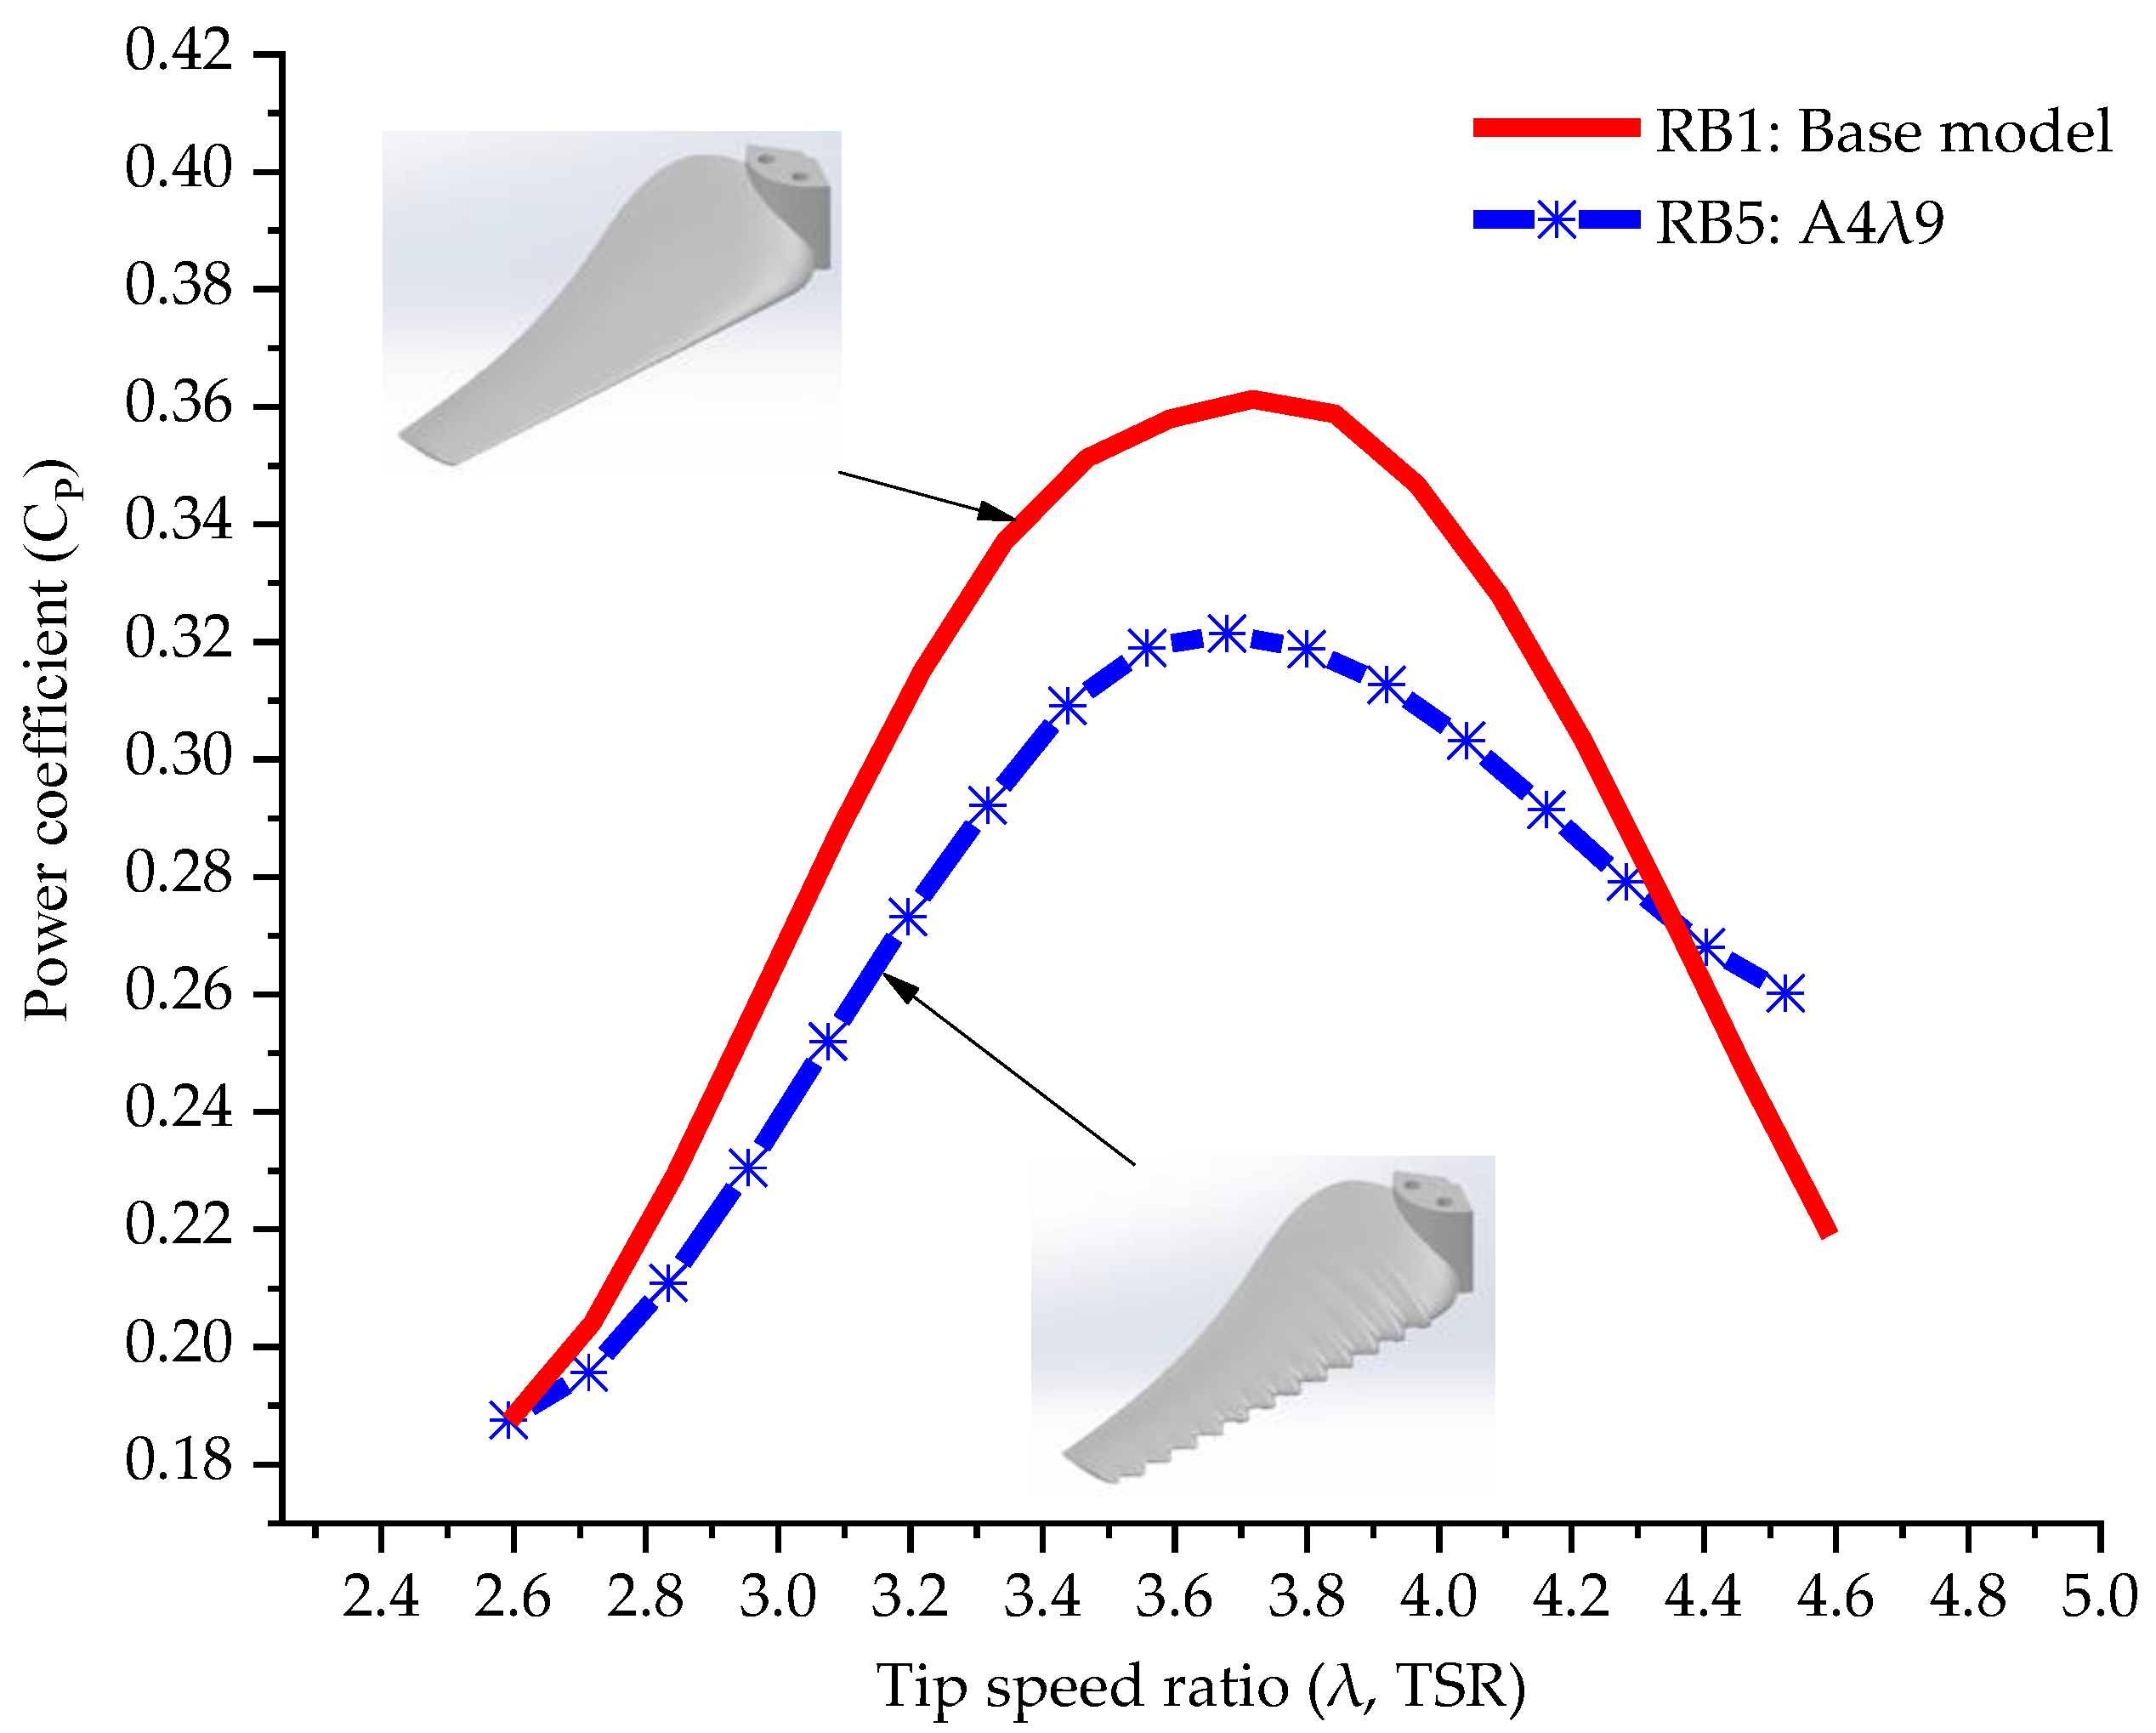
3.7. RB5 Rotor Model

As the amplitude quadruples and the wavelength almost triples, a trend of continuous decline in the model efficiency is observed. Figure 16 illustrates the power coefficient of RB1 and RB5 rotor models. The graph depicted indicates that the RB5 rotor model exhibited lower performance compared to the RB1 rotor model up to a tip-speed ratio of 4.35. However, beyond this point, an upward trend in performance becomes evident. The peak power coefficient of 0.321 is achieved at a wavelength of 3.679.

3.8. RB6 Rotor Model

As shown in Figure 17, the RB6 rotor model did not exhibit any improvement throughout the examined range of tip-speed ratios. Referring to the graph, there is a significant decrease of approximately 51% in rotor performance for intermediate tip-speed ratios in comparison to the RB1 rotor model. The peak power coefficient achieved by this model is approximately 0.299, occurring at a wavelength of 3.813.

4. Conclusions

This study focused on examining the aerodynamic efficiency of different designs of small-scale horizontal axis wind turbine rotor blades, applying a passive flow control approach. The leading-edge tubercle technique was employed to produce various configurations by modifying the blade’s geometry. The rotor blades were constructed using the NREL S822 airfoil, encompassing the entire span from the blade’s root to its tip. This design aimed to satisfy both structural integrity and aerodynamic performance considerations. In this paper, five distinct configurations (RB2, RB3, RB4, RB5, and RB6) were generated, incorporating tubercles along the entire length of the leading edge. These configurations were generated by varying the amplitude and the wavelength of the tubercles. The baseline rotor model (RB1) underwent validation and served as a reference point for comparison with the modified rotor blade models. All tests were conducted under stable operating conditions.
Based on the results obtained from the wind tunnel experiments, the specific conclusions are as follows:
-
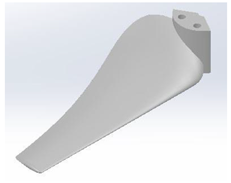
The baseline rotor model (RB1) exhibited a higher peak power coefficient in comparison to the rotor model referenced from the literature. This higher coefficient was achieved for a nearly identical tip-speed ratio. Nonetheless, when considering relatively similar design parameters, such as rotor solidity, number of blades, tunnel blockage, and design tip-speed ratio, but with distinct airfoil profiles, the study’s results did not reveal any consistent patterns or trends.
-
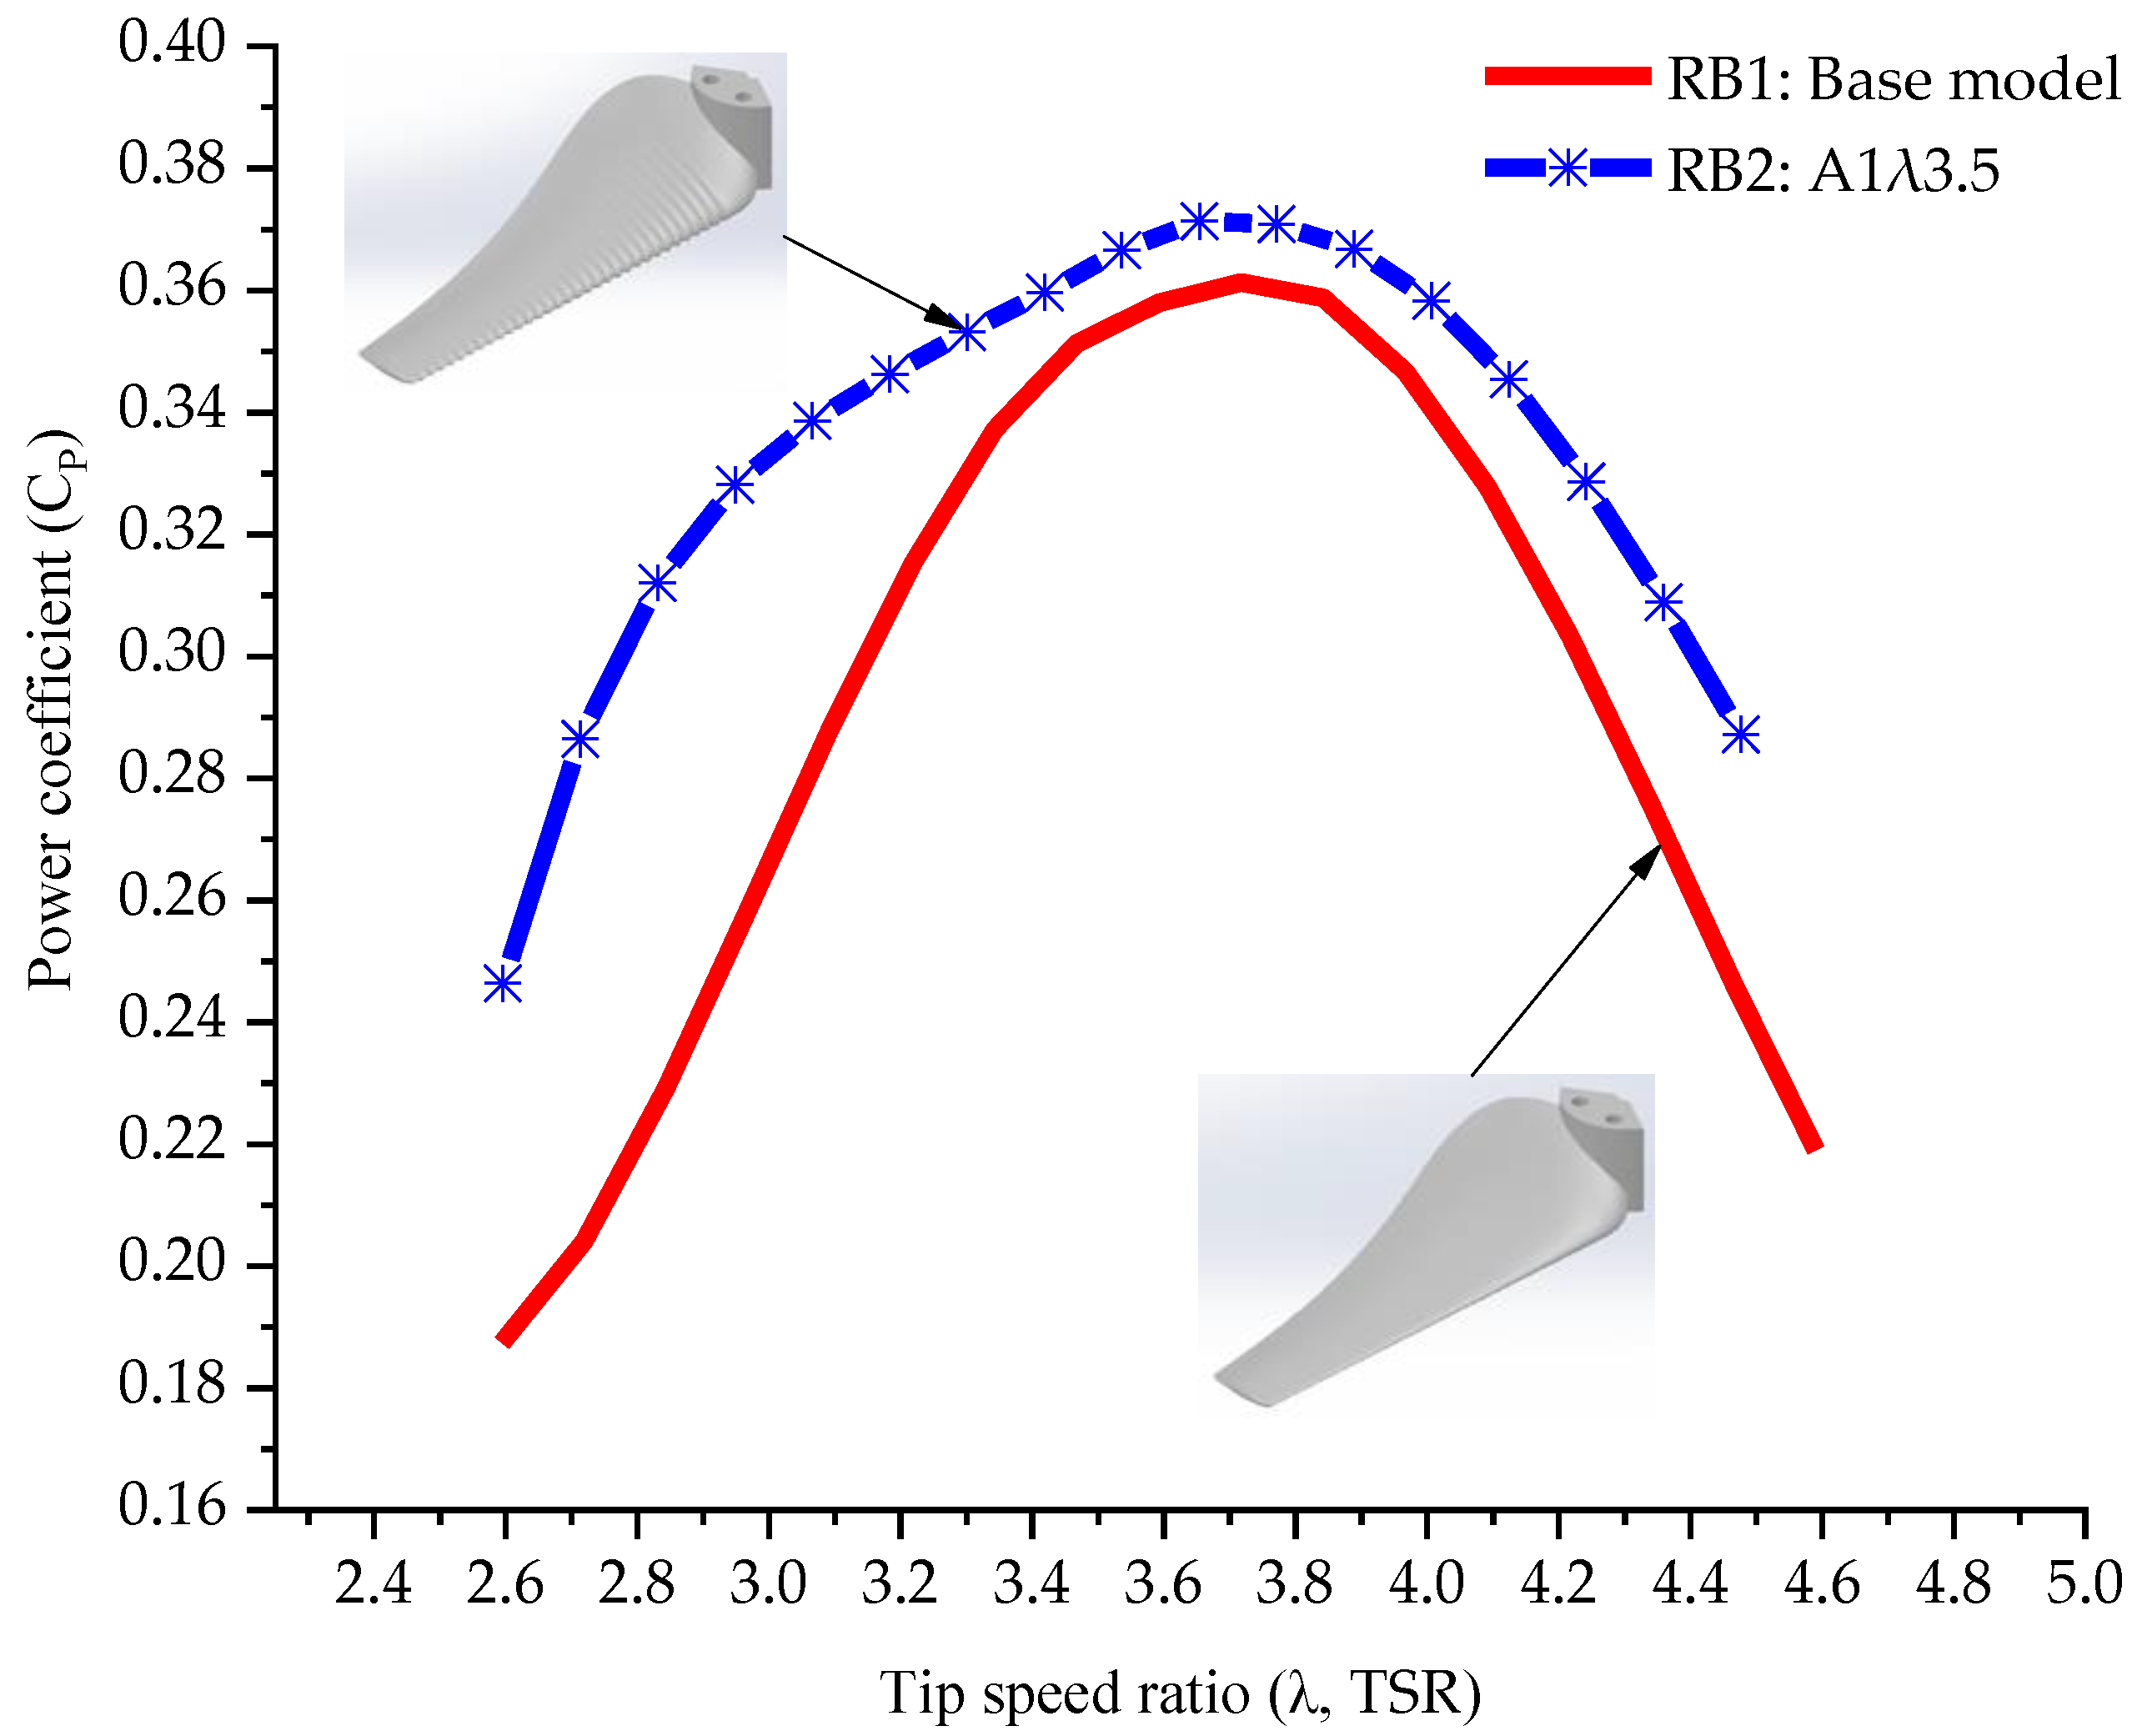
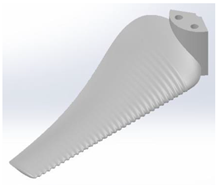
Among the various leading-edge tubercle configurations investigated, the RB2 rotor model with an amplitude of 1 mm and a wavelength of 3.5 mm outperformed all other rotor models, including the baseline rotor model (RB1), across the entire range of tip-speed ratios examined in this study. For low tip-speed rations, this model demonstrated a significant performance improvement of around 40% compared to the baseline rotor model (RB1). The reduction in this advantage to approximately 2.8% occurred when the RB2 rotor model reached its peak power coefficient. The improved performance of the RB2 rotor model compared to the RB1 rotor model can be attributed to factors such as the increased number of bumps, their subtle dimensions, and enhanced surface roughness. These characteristics collectively altered the airflow structure, influencing both chordwise and spanwise directions. This effect was particularly pronounced during high flow speeds, aligning with findings highlighted in the literature review. Furthermore, it is apparent that the configuration, along with the subtle disparity in the amplitudes of the initial and terminal bumps situated at both blade ends, play a crucial role. According to the existing literature, these specific characteristics can influence the intensity of root and tip vortices of the blade, particularly under conditions of elevated flow speeds.
-
The RB3 rotor model demonstrated its effectiveness primarily within the range of smaller values of tip-speed ratios, approximately up to 3.5, when compared to the RB1 rotor model.
-
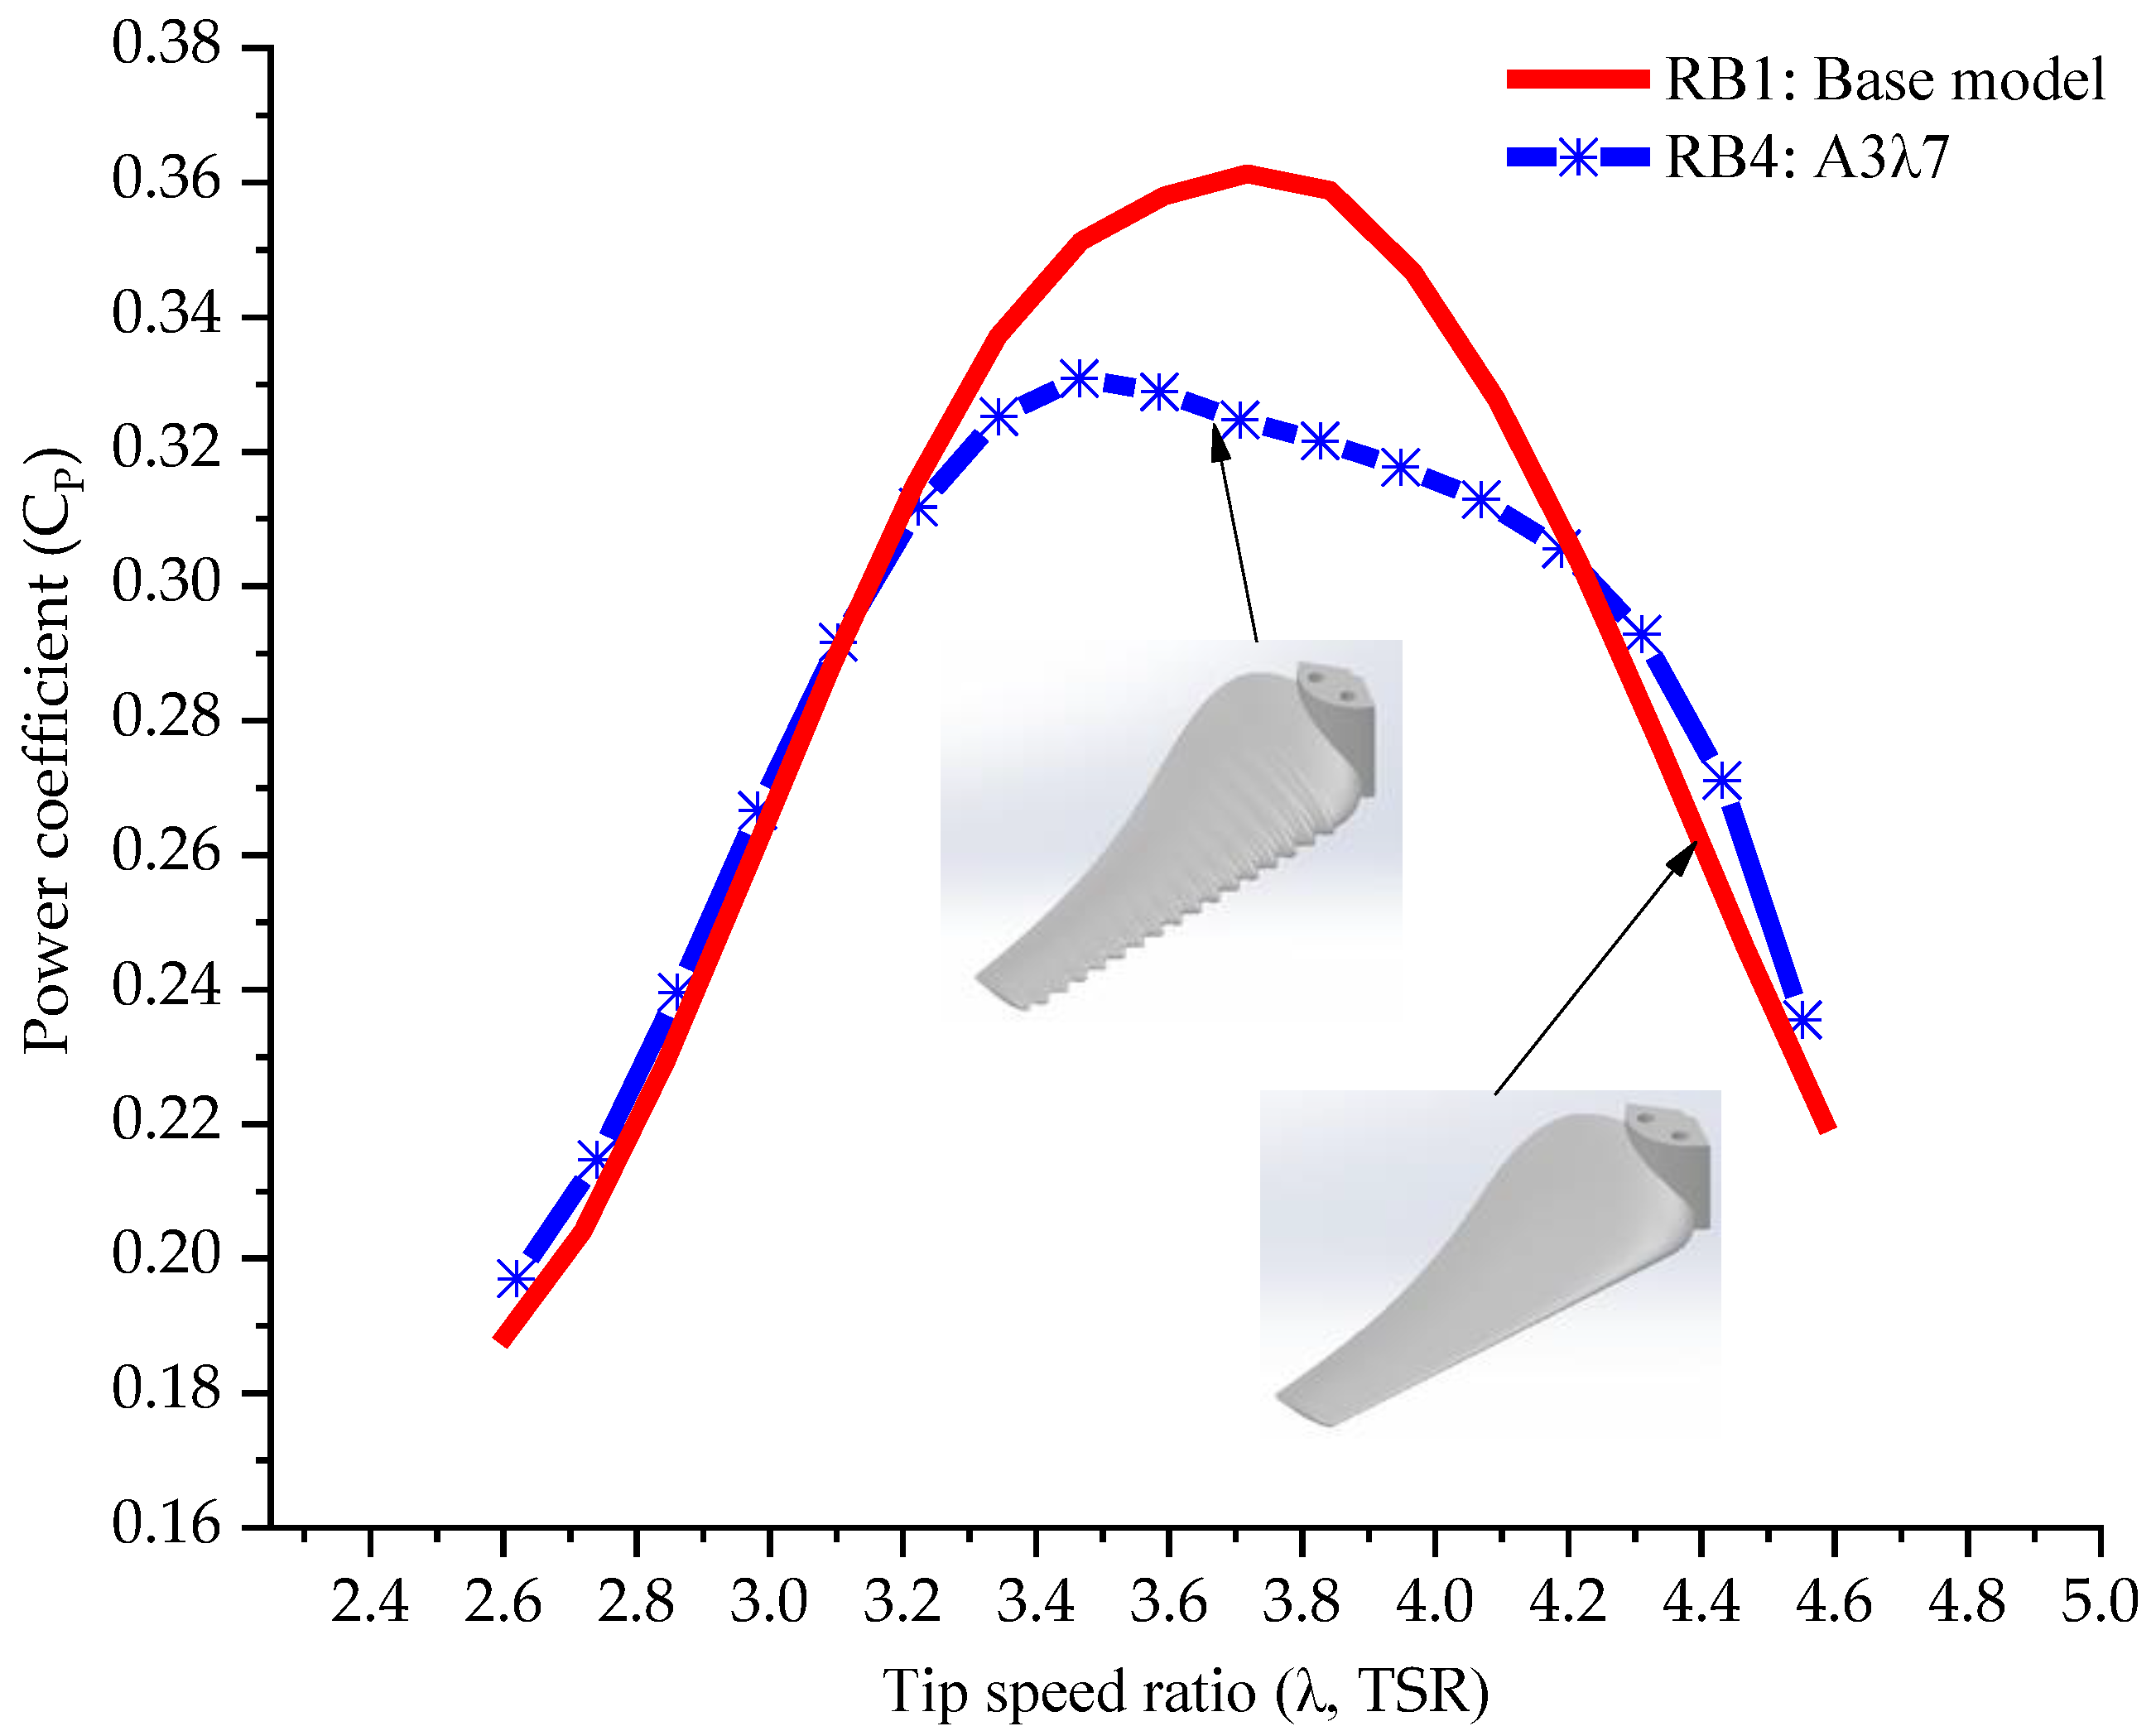
A marginal advantage of the RB4 rotor model over RB1 was observed at tip-speed ratios up to 3.15 and beyond 4.21.
-
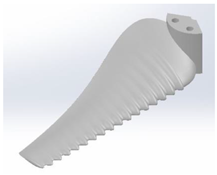
As the amplitude and wavelength are further increased, the rotor’s efficiency experiences a relatively gradual decline, while still maintaining the general shape of the curve.
According to the experimental findings, it was evident that the chosen methodology, which involved utilizing the S822 airfoil to fulfill both aerodynamic and structural considerations, along with maintaining consistent profile usage across the blade length, successfully achieved the objectives set forth in this study.
Given the experimental nature of this study, it would be interesting to further extend the research by incorporating Computational Fluid Dynamics (CFD) simulations. By integrating CFD code, a more comprehensive insight into the flow physics surrounding the blade and the rotor in general could be obtained. This enhanced understanding would shed light on the precise effects of the applied technique, offering a more comprehensive perspective on the subject.

Author Contributions

Conceptualization, R.M.; Methodology, R.M. and Y.E.A.; Software, R.M.; Validation, Y.E.A.; Investigation, R.M.; Resources, R.M.; Data curation, R.M.; Writing—original draft, R.M.; Writing—review & editing, Y.E.A.; Visualization, R.M.; Supervision, Y.E.A. All authors have read and agreed to the published version of the manuscript.

Funding

This research received no external funding.

Data Availability Statement

Not applicable.

Conflicts of Interest

The authors declare no conflict of interest.

Nomenclature

α angle of attack
A wave amplitude
A r o t o r rotor swept area
A t u n n e l cross-sectional area of test section
β i local twist angle
B number of blades
B T tunnel blockage
c a v g average chord length of the blade
c i local chord
C L lift coefficient
C D drag coefficient
C P power coefficient
φ i local inflow angle
λ tip-speed ratio
λ i local tip-speed ratio
λ w wavelength
μ dynamic viscosity of the air
N number of blade elements
r i local radius
R rotor radius
R e Reynolds number
ρ air density
σ rotor solidity
y sine wave equation
y 0 location of the starting point of the sine wave path
V t i p blade-tip speed
V r e l relative velocity
V wind speed
x extension of the bumps from root to the blade tip

References

  1. Emeis, S. Wind Energy Meteorology; Springer: Berlin/Heidelberg, Germany, 2013; ISBN 978-3-642-30522-1. [Google Scholar]
  2. Gharaati, M.; Xiao, S.; Wei, N.J.; Martínez-Tossas, L.A.; Dabiri, J.O.; Yang, D. Large-eddy simulation of helical- and straight-bladed vertical-axis wind turbines in boundary layer turbulence. J. Renew. Sustain. Energy 2022, 14, 053301. [Google Scholar] [CrossRef]
  3. Statista.com. Available online: https://www.statista.com/statistics/269885/capacity-of-small-wind-turbines-worldwide/ (accessed on 15 January 2023).
  4. Shah, H.; Mathew, S.; Lim, C.M. A novel low reynolds number airfoil design for small horizontal axis wind turbines. Wind Eng. 2014, 38, 377–391. [Google Scholar] [CrossRef]
  5. Wood, D. Small Wind Turbines: Analysis, Design, and Application (Green Energy and Technology); Springer: Berlin/Heidelberg, Germany, 2011. [Google Scholar]
  6. Kishore, R.; Stewart, C. Priya Wind Energy Harvesting: Micro-to-Small Scale Turbines; Walter de Gruyter GmbH & Co KG: Berlin, Germany, 2018. [Google Scholar]
  7. Winslow, J.; Otsuka, H.; Govindarajan, B.; Chopra, I. Basic Understanding of Airfoil Characteristics at Low Reynolds Numbers (104–105). J. Aircr. 2018, 55, 1050–1061. [Google Scholar] [CrossRef]
  8. Giguère, P.; Selig, M.S. Low Reynolds number airfoils for small horizontal axis wind turbines. Wind Eng. 1997, 21, 367–380. [Google Scholar]
  9. Van Treuren, K.W. Small-scale wind turbine testing in wind tunnels under low reynolds number conditions. J. Energy Resour. Technol. Trans. ASME 2015, 137, 051208. [Google Scholar] [CrossRef]
  10. Hau, E. Wind Turbines: Fundamentals, Technologies, Application, Economics; Springer Science & Business Media: Berlin/Heidelberg, Germany, 2013; ISBN 9783642271519. [Google Scholar]
  11. Schmitz, S. Aerodynamics of Wind Turbines: A Physical Basis for Analysis and Design; Wiley: Hoboken, NJ, USA, 2020; ISBN 9781119405597. [Google Scholar]
  12. Miklosovic, D.S.; Murray, M.M.; Howle, L.E.; Fish, F.E. Leading-edge tubercles delay stall on humpback whale (Megaptera novaeangliae) flippers. Phys. Fluids 2004, 16, L39–L42. [Google Scholar] [CrossRef]
  13. Fish, F.E.; Battle, J.M. Hydrodynamic design of the humpback whale flipper. J. Morphol. 1995, 225, 51–60. [Google Scholar] [CrossRef]
  14. Lissaman, P.B.S. Low-Reynolds-number airfoils. Annu. Rev. Fluid Mech. 1983, 15, 223–239. [Google Scholar] [CrossRef]
  15. Burton, T.; Jenkins, N.; Sharpe, D.; Bossanyi, E. Wind Energy Handbook, 2nd ed.; John Wiley & Sons: Hoboken, NJ, USA, 2011; ISBN 9780470699751. [Google Scholar]
  16. Manwell, J.F.; McGowan, J.G.; Rogers, A.L. Wind Energy Explained: Theory, Design and Application; John Wiley & Sons: Hoboken, NJ, USA, 2010; ISBN 9780470015001. [Google Scholar]
  17. Hansen, M.O.L. Aerodynamics and Design of Horizontal-Axis Wind Turbines. In Wind Energy Engineering: A Handbook for Onshore and Offshore Wind Turbines; Academic Press: Cambridge, MA, USA, 2017; ISBN 9780128094297. [Google Scholar]
  18. McLean, D. Understanding Aerodynamics: Arguing from the Real Physics; Wiley: Hoboken, NJ, USA, 2012; ISBN 9781118454220. [Google Scholar]
  19. Mathew, S.; Geeta Susan, P. Advances in Wind Energy Conversion Technology; Springer Science & Business Media: Berlin/Heidelberg, Germany, 2011; ISBN 978-3-540-88257-2. [Google Scholar]
  20. Burdett, T.; Gregg, J.; Van Treuren, K. A Numerical Study on Improving Airfoil Performance at Low Reynolds Numbers for Small-Scale Wind Turbines using Intentional Roughness. In Proceedings of the 50th AIAA Aerospace Sciences Meeting Including the New Horizons Forum and Aerospace Exposition, Nashville, TN, USA, 9–12 January 2012; American Institute of Aeronautics and Astronautics: Reston, VA, USA, 2012. [Google Scholar]
  21. Primrose, S.B. Biomimetics: Nature-Inspired Design and Innovation; Wiley: Hoboken, NJ, USA, 2020; ISBN 9781119683322. [Google Scholar]
  22. Miklosovic, D.S.; Murray, M.M.; Howle, L.E. Experimental evaluation of sinusoidal leading edges. J. Aircr. 2007, 44, 1404–1408. [Google Scholar] [CrossRef]
  23. Bolzon, M.D.P.; Kelso, R.M.; Arjomandi, M. Formation of vortices on a tubercled wing, and their effects on drag. Aerosp. Sci. Technol. 2016, 56, 46–55. [Google Scholar] [CrossRef]
  24. Haque, M.N.; Ali, M.; Ara, I. Experimental Investigation on the Performance of NACA 4412 Aerofoil with Curved Leading Edge Planform. Procedia Eng. 2015, 105, 232–240. [Google Scholar] [CrossRef]
  25. Hansen, K.L.; Kelso, R.M.; Dally, B.B. Performance variations of leading-edge tubercles for distinct airfoil profiles. AIAA J. 2011, 49, 185–194. [Google Scholar] [CrossRef]
  26. Sudhakar, S.; Venkatakrishnan, L.; Ramesh, O.N. The influence of leading-edge tubercles on airfoil performance at low Reynolds numbers. In Proceedings of the AIAA SciTech 2020 Forum, Orlando, FL, USA, 6–10 January 2020. [Google Scholar]
  27. Johari, H.; Henoch, C.; Custodio, D.; Levshin, A. Effects of leading-edge protuberances on airfoil performance. AIAA J. 2007, 45, 2634–2642. [Google Scholar] [CrossRef]
  28. Guerreiro, J.L.E.; Sousa, J.M.M. Low-Reynolds-Number Effects in Passive Stall Control Using Sinusoidal Leading Edges. AIAA J. 2012, 50, 461–469. [Google Scholar] [CrossRef]
  29. Wei, Z.; New, T.H.; Cui, Y.D. An experimental study on flow separation control of hydrofoils with leading-edge tubercles at low Reynolds number. Ocean Eng. 2015, 108, 336–349. [Google Scholar] [CrossRef]
  30. Bolzon, M.D.; Kelso, R.M.; Arjomandi, M. The effects of tubercles on swept wing performance at low angles of attack. In Proceedings of the 19th Australasian Fluid Mechanics Conference (AFMC 2014), Melbourne, Australia, 8–11 November 2014. [Google Scholar]
  31. Natarajan, K.; Sudhakar, S.; Paulpandian, S. Experimental Studies On The Effect Of Leading Edge Tubercles On Laminar Separation Bubble. In Proceedings of the 52nd Aerospace Sciences Meeting, National Harbor, MD, UDA, 13–17 January 2014; American Institute of Aeronautics and Astronautics: Reston, VA, USA, 2014. [Google Scholar]
  32. Gasch, R.; Twele, J. Wind Power Plants: Fundamentals, Design, Construction and Operation, 2nd ed.; Springer Science & Business Media: Berlin/Heidelberg, Germany, 2012; ISBN 9783642229381. [Google Scholar]
  33. Rosato, M.A. Small Wind Turbines for Electricity and Irrigation; CRC Press: Boca Raton, FL, USA, 2018. [Google Scholar]
  34. Herráez, I.; Akay, B.; van Bussel, G.J.W.; Peinke, J.; Stoevesandt, B. Detailed analysis of the blade root flow of a horizontal axis wind turbine. Wind Energy Sci. 2016, 1, 89–100. [Google Scholar] [CrossRef]
  35. Branlard, E. Wind Turbine Tip-Loss Corrections: Review, Implementation and Investigation of New Models. Master’s Thesis, Technical University of Denmark, Lyngby, Denmark, 2011. [Google Scholar]
  36. Døssing, M.; Madsen, H.A.; Bak, C. Aerodynamic optimization of wind turbine rotors using a blade element momentum method with corrections for wake rotation and expansion. Wind Energy 2012, 15, 563–574. [Google Scholar] [CrossRef]
  37. Abate, G.; Mavris, D.N.; Sankar, L.N. Performance effects of leading edge tubercles on the NREL Phase VI wind turbine blade. J. Energy Resour. Technol. Trans. ASME 2019, 141, 051206. [Google Scholar] [CrossRef]
  38. Carreira Pedro, H.; Kobayashi, M. Numerical Study of Stall Delay on Humpback Whale Flippers. In Proceedings of the 46th AIAA Aerospace Sciences Meeting and Exhibit, Reno, NV, USA, 7–10 January 2008; American Institute of Aeronautics and Astronautics: Reston, VA, USA, 2008. [Google Scholar]
  39. van Nierop, E.A.; Alben, S.; Brenner, M.P. How Bumps on Whale Flippers Delay Stall: An Aerodynamic Model. Phys. Rev. Lett. 2008, 100, 054502. [Google Scholar] [CrossRef]
  40. Abate, G.; Mavris, D.N. Performance Analysis of Different Positions of Leading Edge Tubercles on a Wind Turbine Blade. In Proceedings of the 2018 Wind Energy Symposium, Kissimmee, FL, USA, 8–12 January 2018; American Institute of Aeronautics and Astronautics: Reston, VA, USA, 2018. [Google Scholar]
  41. Zhang, R.-K.; Wu, V.D.J.-Z. Aerodynamic characteristics of wind turbine blades with a sinusoidal leading edge. Wind Energy 2012, 15, 407–424. [Google Scholar] [CrossRef]
  42. Huang, G.-Y.; Shiah, Y.C.; Bai, C.-J.; Chong, W.T. Experimental study of the protuberance effect on the blade performance of a small horizontal axis wind turbine. J. Wind Eng. Ind. Aerodyn. 2015, 147, 202–211. [Google Scholar] [CrossRef]
  43. Kim, H.; Kim, J.; Choi, H. Flow structure modifications by leading-edge tubercles on a 3D wing. Bioinspir. Biomim. 2018, 13, 066011. [Google Scholar] [CrossRef] [PubMed]
  44. Ng, B.F.; New, T.H.D.; Palacios, R. Bio-inspired Leading-Edge Tubercles to Improve Fatigue Life in Horizontal Axis Wind Turbine Blades. In Proceedings of the 35th Wind Energy Symposium, Grapevine, TX, USA, 9–13 January 2017; American Institute of Aeronautics and Astronautics: Reston, VA, USA, 2017. [Google Scholar]
  45. Sunada, S.; Sakaguchi, A.; Kawachi, K. Airfoil Section Characteristics at a Low Reynolds Number. J. Fluids Eng. 1997, 119, 129–135. [Google Scholar] [CrossRef]
  46. Morina, R. Development of a Horizontal Axis Wind Turbine Blade Profile Based on Passive Flow Control Methods. Ph.D. Thesis, Niğde Ömer Halisdemir University, Niğde, Turkey, 2021. [Google Scholar]
  47. Tangler, J.; Somers, D. NREL Airfoil Families for HAWTs; National Renewable Energy Lab. (NREL): Golden, CO, USA, 1995. [Google Scholar]
  48. Brusca, S.; Lanzafame, R.; Messina, M. Flow similitude laws applied to wind turbines through blade element momentum theory numerical codes. Int. J. Energy Environ. Eng. 2014, 5, 313–322. [Google Scholar] [CrossRef]
  49. Duquette, M.M.; Swanson, J.; Visser, K.D. Solidity and blade number effects on a fixed pitch, 50W horizontal axis wind turbine. Wind Eng. 2003, 27, 299–316. [Google Scholar] [CrossRef]
  50. Bakırcı, M.; Yılmaz, S. Theoretical and computational investigations of the optimal tip-speed ratio of horizontal-axis wind turbines. Eng. Sci. Technol. Int. J. 2018, 21, 1128–1142. [Google Scholar] [CrossRef]
  51. Burdet, T.A.; Van Treuren, K.W. Scaling small-scale wind turbines for wind tunnel testing. In Proceedings of the ASME Turbo Expo 2012: Turbine Technical Conference and Exposition, Copenhagen, Denmark, 11–15 June 2012. [Google Scholar]
  52. Burdett, T.A.; Van Treuren, K.W. A Theoretical and Experimental Comparison of Optimizing Angle of Twist Using BET and BEMT. In Proceedings of the ASME Turbo Expo 2012: Turbine Technical Conference and Exposition, Copenhagen, Denmark, 11–15 June 2012; Volume 6: Oil and Gas Applications; Concentrating Solar Power Plants; Steam Turbines; Wind Energy. American Society of Mechanical Engineers: New York, NY, USA, 2012; pp. 797–809. [Google Scholar]
  53. Post, S.; Boirum, C. A Model Wind Turbine Design-Build-Test Project. In Proceedings of the ASME 2011 International Mechanical Engineering Congress and Exposition, Denver, CO, USA, 11–17 November 2011; Volume 5: Engineering Education and Professional Development. ASME: New York, NY, USA, 2011; pp. 213–218. [Google Scholar]
  54. Katz, J. Automotive Aerodynamics; Kurfess, T., Ed.; Wiley: Hoboken, NJ, USA, 2016; ISBN 9781119185727. [Google Scholar]
  55. Coleman, H.W.; Steele, W.G. Experimentation, Validation, and Uncertainty Analysis for Engineers: Fourth Edition; John Wiley & Sons: Hoboken, NJ, USA, 2018; ISBN 9781119417989. [Google Scholar]
  56. Lanzafame, R.; Mauro, S.; Messina, M. Numerical and experimental analysis of micro HAWTs designed for wind tunnel applications. Int. J. Energy Environ. Eng. 2016, 7, 199–210. [Google Scholar] [CrossRef]
Figure 1. Reference airfoil geometry (NREL S822).
Energies 16 06405 g001
Figure 2. Arrangement of chord lengths and angles of twist of the original blade model.
Energies 16 06405 g002
Figure 3. Arrangement of chord lengths and angles of twist of the small-scale blade model.
Energies 16 06405 g003
Figure 4. Three-dimensional RB1 baseline blade model.
Energies 16 06405 g004
Figure 5. Leading-edge tubercle parameters.
Energies 16 06405 g005
Figure 6. A schematic view of the wind tunnel setup [46].
Energies 16 06405 g006
Figure 7. Turbine rotor mounted in the wind tunnel.
Energies 16 06405 g007
Figure 8. Chord and twist angle distributions from the literature [56].
Energies 16 06405 g008
Figure 9. RB1 baseline rotor model mounted on the support structure.
Energies 16 06405 g009
Figure 10. Representative power coefficient (Cp) against tip speed ratio (λ, TSR) curve with all measurement points [46].
Energies 16 06405 g010
Figure 11. Power coefficient (Cp) against tip-speed ratio (λ, TSR) of the RB1 baseline rotor model and the rotor from the reference literature [46,56].
Energies 16 06405 g011
Figure 12. Power coefficient curves (Cp) against tip-speed ratio (λ, TSR) for tunnel blockage [46].
Energies 16 06405 g012
Figure 13. Power coefficient (Cp) against tip-speed ratio (λ, TSR) for the RB2 rotor model [46].
Energies 16 06405 g013
Figure 14. Power coefficient (Cp) against tip-speed ratio (λ, TSR) for the RB3 rotor model [46].
Energies 16 06405 g014
Figure 15. Power coefficient (Cp) against tip-speed ratio (λ, TSR) for the RB4 rotor model [46].
Energies 16 06405 g015
Figure 16. Power coefficient (Cp) against tip-speed ratio (λ, TSR) for the RB5 rotor model [46].
Energies 16 06405 g016
Figure 17. Power coefficient (Cp) against tip-speed ratio (λ, TSR) for the RB6 rotor model [46].
Energies 16 06405 g017
Table 1. Original rotor parameters [46].
ParameterValue
Rotor radius (R), mm300
Wind speed (V), m/s9
Air density (ρ), kg/m31.225
Reynolds number (Re)1 × 10⁵
Number of blades (B)3
Tip-speed ratio (TSR, λ)3.658
Rotor solidity (σ), %22.1
Lift coefficient (CL)0.9256
Drag coefficient (CD)0.02168
Angle of attack (α), °8.5
Lift/drag ratio (CL/CD)42.7
No. blade elements (N)10
Table 2. Rotor blade models [46].
RB1—Base ModelRB2—A1λ3.5
Energies 16 06405 i001Energies 16 06405 i002
RB3—A2λ5RB4—A3λ7
Energies 16 06405 i003Energies 16 06405 i004
RB5—A4λ9RB6—A5λ14
Energies 16 06405 i005Energies 16 06405 i006
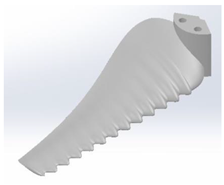
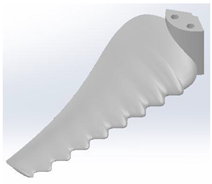
Disclaimer/Publisher’s Note: The statements, opinions and data contained in all publications are solely those of the individual author(s) and contributor(s) and not of MDPI and/or the editor(s). MDPI and/or the editor(s) disclaim responsibility for any injury to people or property resulting from any ideas, methods, instructions or products referred to in the content.

