Abstract
Recently, there has been growing recognition of the significance of energy and environmental challenges. Utilization of lithium-ion batteries in electric vehicles has shown considerable potential and benefits for tackling these issues. The effective management of battery temperature has become a crucial factor in the advancement and widespread adoption of lithium-ion batteries in electric vehicles. In this study, a thermo-coupled pseudo-two-dimensional (P2D) electrochemical model is employed to simulate the heat generation of the NCM811-21700 cylindrical battery cell at various discharge rates at an ambient temperature of 25 °C, and is validated by experimental data. The validation results demonstrate that the thermo-coupled P2D model can effectively predict the battery voltage curve during the discharge process with less than 4% errors. Although there is a slightly larger error in the temperature prediction during the battery 2C and 3C discharge processes, the maximum error approaches 10%, which is still generally within an acceptable range. In addition, the battery’s electrochemical and thermal characteristics during discharge are presented. The suggested thermo-coupled electrochemical model can be used for applications in the thermal management system of the NCM811-21700 battery.
1. Introduction
Currently, a significant portion (approximately 80%) of the world’s energy provision hinges on carbonaceous resources, such as anthracite, petroleum, and methane. The preponderance of energy production and use is often associated with ecological degradation and deleterious impacts on H. sapiens’ wellness. In the face of our global community’s mounting dependence on renewable energy pathways, vehicles propelled by electricity, or EVs, represent an auspicious means of creating a more pristine and sustainable environment. This is largely due to the batteries’ superior capabilities to preserve a constant supply of energy derived from these greener alternatives [1,2,3]. Batteries are mechanisms that employ an electrochemical interaction between two or more cells to supply energy to electric appliances. They encompass numerous prevalent aspects, such as the self-discharge rate, specific energy, operational parameters, toxicity, recharging period, and C-rate. One essential trait is battery capacity, which is shaped by the reversible conditions of electrochemical activity. This attribute represents the maximum volume of electricity that a battery can accumulate and dispense. This capacity decreases with the deployment of electrodes or electrolytes. The C-rate refers to the charging or discharging rate and is used to measure the discharging of a battery relative to its maximum capacity [4].
Research on Battery Thermal Management Systems (BTMS) can be broadly classified into two approaches: direct measurements and indirect calculations. Direct measurement methods involve conducting experimental analyses to investigate the battery’s heat generation characteristics. However, these methods are time-consuming and expensive and may not comprehensively understand the thermal state and temperature distribution within batteries. In contrast, indirect calculation methods rely on numerical models of batteries to assess their internal thermal conditions, which can be challenging to measure experimentally. Despite these limitations, indirect calculation methods offer more efficient and cost-effective approaches for evaluating the thermal characteristics of lithium-ion batteries [5]. Several battery models with varying complexities have been developed that provide utility across various applications. Based on the level of physical insight, battery models are divided into three types: white box, gray box, and black box models, which are represented by the electrochemical model, equivalent circuit model (ECM), and neural network model, respectively [6]. Among these, the electrochemical model represented by the Newman P2D model can best capture the various characteristics of a battery and is widely combined with a thermal model to analyze the thermal characteristics of batteries. According to the Newman P2D model, Zadeh et al. [7] developed a numerical model to conduct battery capacity fade analysis to improve battery life and safety for different BTMS. The results indicate that utilizing liquid cooling channels for phase change material (PCM) cooling can meet the temperature constraints and significantly improve the performance of the battery heat management system. Li et al. successfully created a P2D thermo-coupled electrochemical model for a LiFePO4/Graphene (LFP/G) hybrid cathode lithium-ion battery using ANSYS FLUENT [8], which effectively captured the regulation of temperature distribution, working voltage, current density, and total heat generation characteristics of the battery. The experimental results demonstrated strong agreement with the simulations and provided accurate validation of the hottest area within the LFP/G battery. It should be emphasized that despite some studies [9,10,11] claiming to employ a 3D electrochemical model by providing the governing equations in three dimensions, they simplify the model during the solution process. Many variables, such as the electrolyte concentration and current density, are solved in a one-dimensional form. Consequently, there are few examples of genuinely coupling a 3D electrochemical model with a 3D thermal model.
The commercial NCM811-21700 cylindrical lithium-ion battery cell had a cathode containing approximately 80% nickel, 10% cobalt, and 10% manganese, with a diameter of 21 mm and a length of 70 mm. This class of batteries, relative to its predecessors such as the 18650 or NCA-21700 cylindrical batteries, offers a more voluminous energy density while maintaining a compact structure. The increased energy storage capacity makes the NCM811-21700 cell popular for applications ranging from electric vehicles to portable electronic devices [12,13]. Notably, the renowned electric vehicle manufacturer Tesla has incorporated these cells into its products, emphasizing their potential to advance the green energy landscape. Numerous studies have been conducted on 21700 cylindrical Li batteries from several perspectives. Yang et al. [14] conducted experimental and numerical studies on the thermal management of NCM-21700 batteries. The Newman, Tiedemann, Gu, and Kim (NTGK) battery model was adapted for temperature prediction of the battery cell at different discharge rates and depths of discharge (DoDs). The results showed that the experimental data validated the predictions at each discharge rate well. Moosavi et al. [15] developed an analytical thermal model based on the integral transform technique for temperature prediction of a cylindrical lithium-ion cell. The results show that the 21700 battery performs best in high-charge or discharge applications. Lin et al. [16] presented a novel comparison between the utilization of the average specific heat capacity and variable specific heat capacity to calculate the instantaneous heat generation of an NCM-21700 battery. The findings revealed that this particular battery exhibited more significant specific volume heat generation than the pouch-type batteries documented in the existing literature. Zhang et al. [17] developed an equivalent circuit model (ECM) at the half-cell level on a 21700 battery cell. The model was parameterized using an experimental method and exhibited high modeling and estimation accuracy. Research on 21700 batteries related to the module or pack level has also been conducted [18]. Kang et al. [19] examined the thermal behavior of a 1S18P 21700 battery pack using a numerical method. The cell temperature was predicted with an error of less than 0.5 °C. Sahin et al. [20] simulated a BTMS for a module with 12 21700 cells. An electrochemical–thermal model was used to predict the thermal characteristics and was validated by experiments. The results indicate that the novel cooling method can effectively reduce the maximum cell temperature and the temperature difference between cells. A hexagonal cell module was developed for various discharge rates. These designs incorporated a phase change material (PCM) composed of a graphene–paraffin composite with high thermal conductivity. The results indicated that the PCM structure effectively regulated the thermal parameters, ensuring that the battery temperature remained stable and consistent [21]. Sheng et al. [22] developed a cellular liquid cooling jacket system for a 21700 lithium-ion battery module. The findings indicate that employing interlaced flow directions leads to a reduced standard deviation in the temperature and a more uniform thermal distribution.
From the literature review, it can be observed that there needs to be more research on NCM811-21700 batteries than on the more commonly studied 18,650 batteries, particularly in the field of numerical modeling. The P2D model, which can effectively represent the electrochemical and thermal characteristics of batteries, is frequently utilized in numerical studies of 18,650, 26,650 [7,9,10,23], and other types of batteries [8,11,24,25]. However, numerical studies utilizing P2D models to simulate the thermal performance of NCM811-21700 batteries are limited. Therefore, in this study, a numerical analysis of the thermal characteristics of an NCM811-21700 lithium-ion battery cell was performed using a thermally coupled Newman P2D electrochemical model. The heat generated by the battery cell was evaluated at various discharge rates and ambient temperatures. The results are validated using experimental data. Additionally, this study analyzes the electrochemical characteristics of the battery, and the developed model will be extensively applied in research related to the BTMS of the NCM811-21700 battery.
2. Numerical Methods
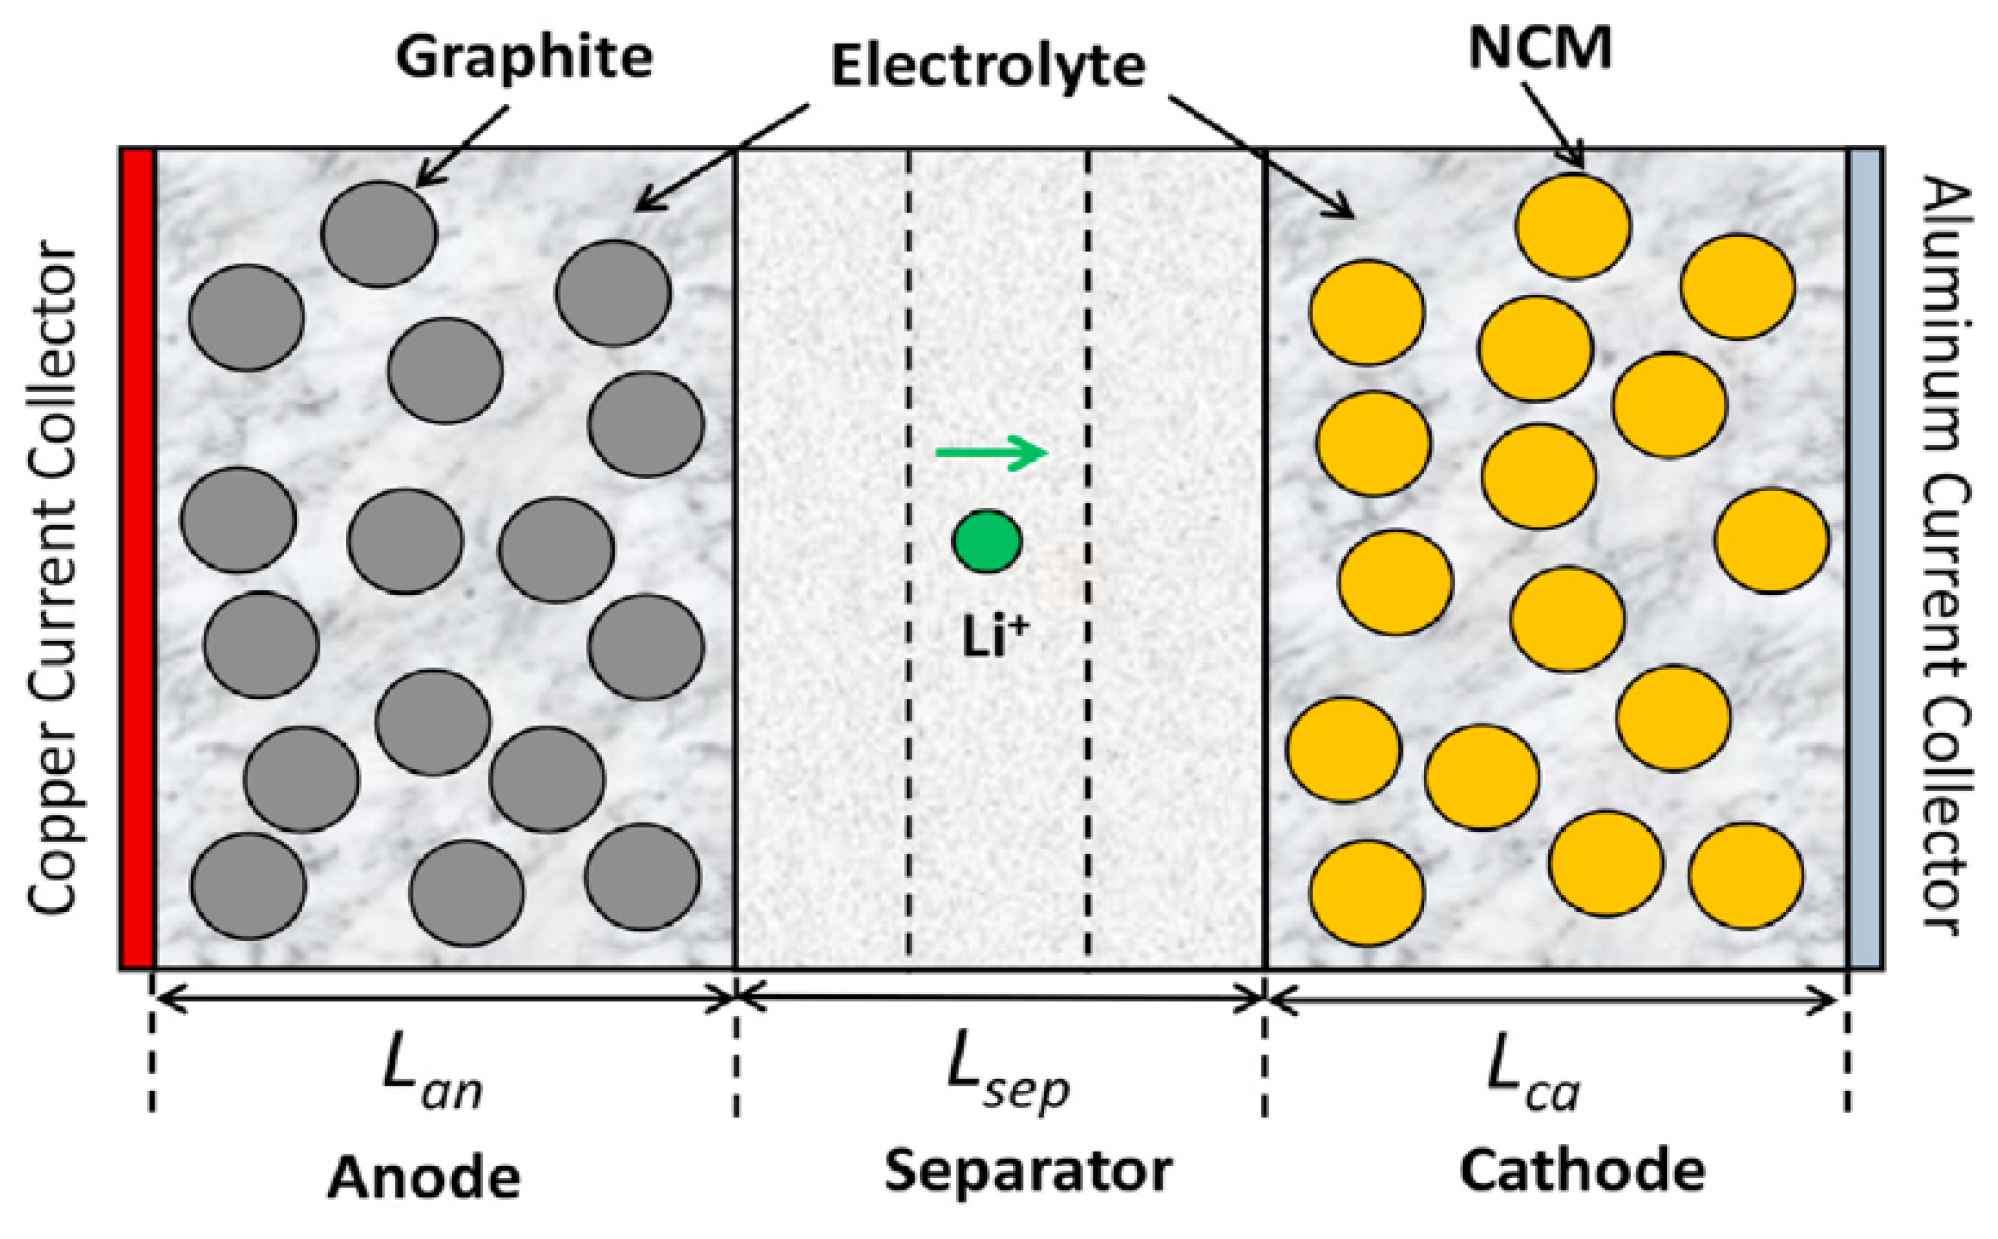
An electrochemical–thermal model was established for a 5 Ah NCM811-21700 cylindrical battery cell using the commercial CFD software ANSYS FLUENT 2022R1 [26]. The electrochemical model was based on the physical-based Newman P2D model, which evaluated the ion concentration and potential distribution of the battery cell [5]. The heat generation, heat dissipation, and temperature distribution of the battery cell were calculated by coupling P2D and thermal models. The cell structure consisted of several layers, including current collectors, porous electrodes, and a separator along the cell thickness, which was used for the thermally coupled Newman P2D electrochemical model, and is shown in Figure 1.

Figure 1.
The representative cell structure used for thermally coupled P2D electrochemical model [27].
2.1. Model Description
The Newman P2D model is a physics-based model developed by Newman et al. that uses porous electrodes and concentrated solution theories [28]. The model is termed “pseudo” because its second dimension follows the electrode’s radius rather than being a true second dimension. This model functions similarly to the 1D model but also incorporates the impact of diffusion in the electrolyte and solid (electrode) phases and the Butler–Volmer kinetics for simulating electrode kinetics. In this study, a thermally coupled electrochemical model was solved using commercial CFD software ANSYS FLUENT 2022R1. The conservation equations for the electrolyte and solid phases, effective properties, and energy conservation equations for the thermal model in the FLUENT solver are presented in Table 1. Some assumptions for the P2D modeling are listed as follows [24]:
1. The local reaction current density is described by the Butler–Volmer equation;
2. In both the positive and negative electrodes, the active material particles have a spherical shape and are evenly distributed;
3. Li+ ions move within the electrolyte mainly due to diffusion and electro-migration processes;
4. Side reactions are ignored (jside in Equation (4) is equal to 0);
5. The transportation phenomenon of the electrolyte is governed by the theory of concentration solutions.

Table 1.
Governing equations of thermally coupled Newman P2D model [26,27].
Table 1.
Governing equations of thermally coupled Newman P2D model [26,27].
| Electrochemical Model | Governing Equations | |
|---|---|---|
| Lithium conservation in the solid phase: | (1) | |
| Lithium conservation in the electrolyte phase: | (2) | |
| Charge conservation in solid phase: | (3) | |
| Charge conservation in the electrolyte phase: | (4) | |
| The Butler–Volmer equation: | The current flux at the active material pore-wall surface due to lithium intercalation reaction as a function of over-potential η: | |
| (5) | ||
| where η is defined by: | ||
| (6) | ||
| and i0 is the exchange current density defined by: | ||
| (7) | ||
| Effective properties: | (8) | |
| (9) | ||
| (10) | ||
| (11) | ||
| (12) | ||
| (13) | ||
| (14) | ||
| Thermal model | Governing equations | |
| The energy conservation equation | (15) | |
| (16) | ||
| (17) | ||
| (18) | ||
| (19) | ||
| (20) | ||
2.2. Model Parameters
The dependability of the Newman P2D model is critically contingent on the precision of its constituent parameters. Each is meticulously fine-tuned to the specific design and chemistry of the individual cells. Consequently, the extrapolation of parameters from a single-cell design to a universal application is untenable. This underlines the primary challenge in battery modeling, which is to identify an optimal set of parameters tailored for a specific battery type. Certain researchers might endeavor to calibrate the model for congruence with empirical data, as suggested in [29]. However, given the intricate nature of the model and the sheer magnitude of its parameters, such a method frequently proves unfeasible without a robust initial approximation of these parameters. Therefore, the use of parameters sourced from the literature is another option. In this study, the physical and electrochemical parameters are obtained from identifying previous studies [30,31,32] and are listed in Table 2.
Table 2.
Physical and electrochemical parameters used in the development of Newman P2D model [30,31,32].
Considering the cell composition, which includes numerous distinct thin layers, maintaining the same thermal model implies that each layer corresponds to a set of partial differential equations (PDEs). However, this approach, which is computationally demanding, offers only a marginal improvement in accuracy. Therefore, to simplify the model, the thermal and physical parameters of the active material were assumed to be constant and uniform. Then, the effective density and effective specific heat capacity can be evaluated [32]:
The effective thermal conductivity was calculated using the series-parallel connection method, which is similar to the calculation of series-parallel resistance. The effective thermal conductivity in the radial (u) and axial (z) directions is given by:
An expression for the OCP curve was required in the simulation and was fitted as a function of stoichiometry for both the positive and negative electrodes from the experimental dataset [30]. In this study, the correlations in the literature are represented as polynomials in the stoichiometry by Equations (25) and (26) and are shown in Figure 2.
Up = −19.873 Stoip6 + 65.095 Stoip5 − 84.587 Stoip4 + 55.137 Stoip3 − 17.819 Stoip2 + 0.867 Stoip + 4.650
Un = 179.953 Stoin6 − 606.287 Stoin5 + 800.323 Stoin4 − 522.821 Stoin3 + 175.486 Stoin2 − 28.411 Stoin + 1.907
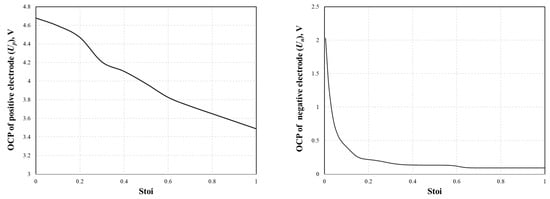
Figure 2.
Fitted OCP curves of positive (left) and negative (right) electrodes as the function of stoichiometry.
The electrolyte diffusivity for the electrode and conductivity of the electrolyte are concentration-dependent and are expressed by Equations (27) and (28) [30], as shown in Figure 3.
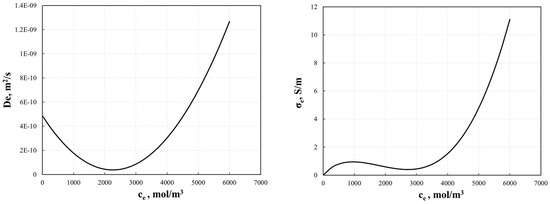
Figure 3.
Electrolyte diffusivity for electrode, De, and conductivity for electrolyte, σe, used in the P2D model.
Equations (15)–(20) show that several mechanisms contribute to heat generation within battery systems. Notably, the irreversible and reversible heat components are perceived as crucial and primarily attributable to heat generation from active materials. In scenarios with high C-rates, more than half of the heat generation typically originates from irreversible heat (qohm), which is frequently referred to as ohmic heat loss. Conversely, at lower C-rates (1C or less), the significance of reversible heat generation (qre) was amplified. This form of heat generation is a consequence of entropy variations induced by intercalation reactions and is contingent upon the system’s internal temperature and open-circuit voltage (OCV). At various lithiation stages, the positive electrode’s entropic term was practically insignificant. The remaining lithiation stages did not demonstrate substantial value. This implies that the behavior of the whole cell is chiefly influenced by the negative electrode, following the same pattern but with an inverse magnitude. Heat generation in a cell that can be reversed is governed primarily by the negative electrode [31]. Therefore, in this study, the entropic term ∂U/∂T in Equation (17) is fixed as a function of State of Charge (SOC) (Figure 4) and can be expressed as [31]:
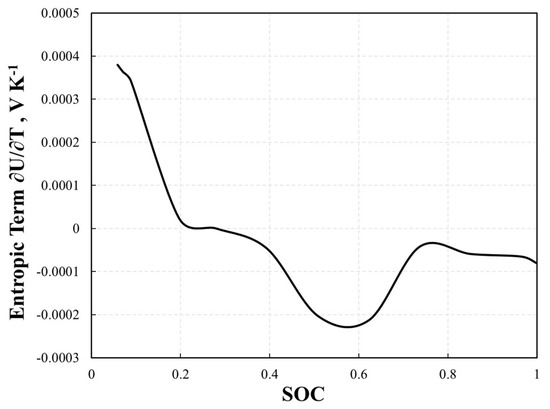
Figure 4.
The fitted entropic term ∂U/∂T as a function of SOC.
2.3. Mesh, Boundary Conditions, and Initial Conditions
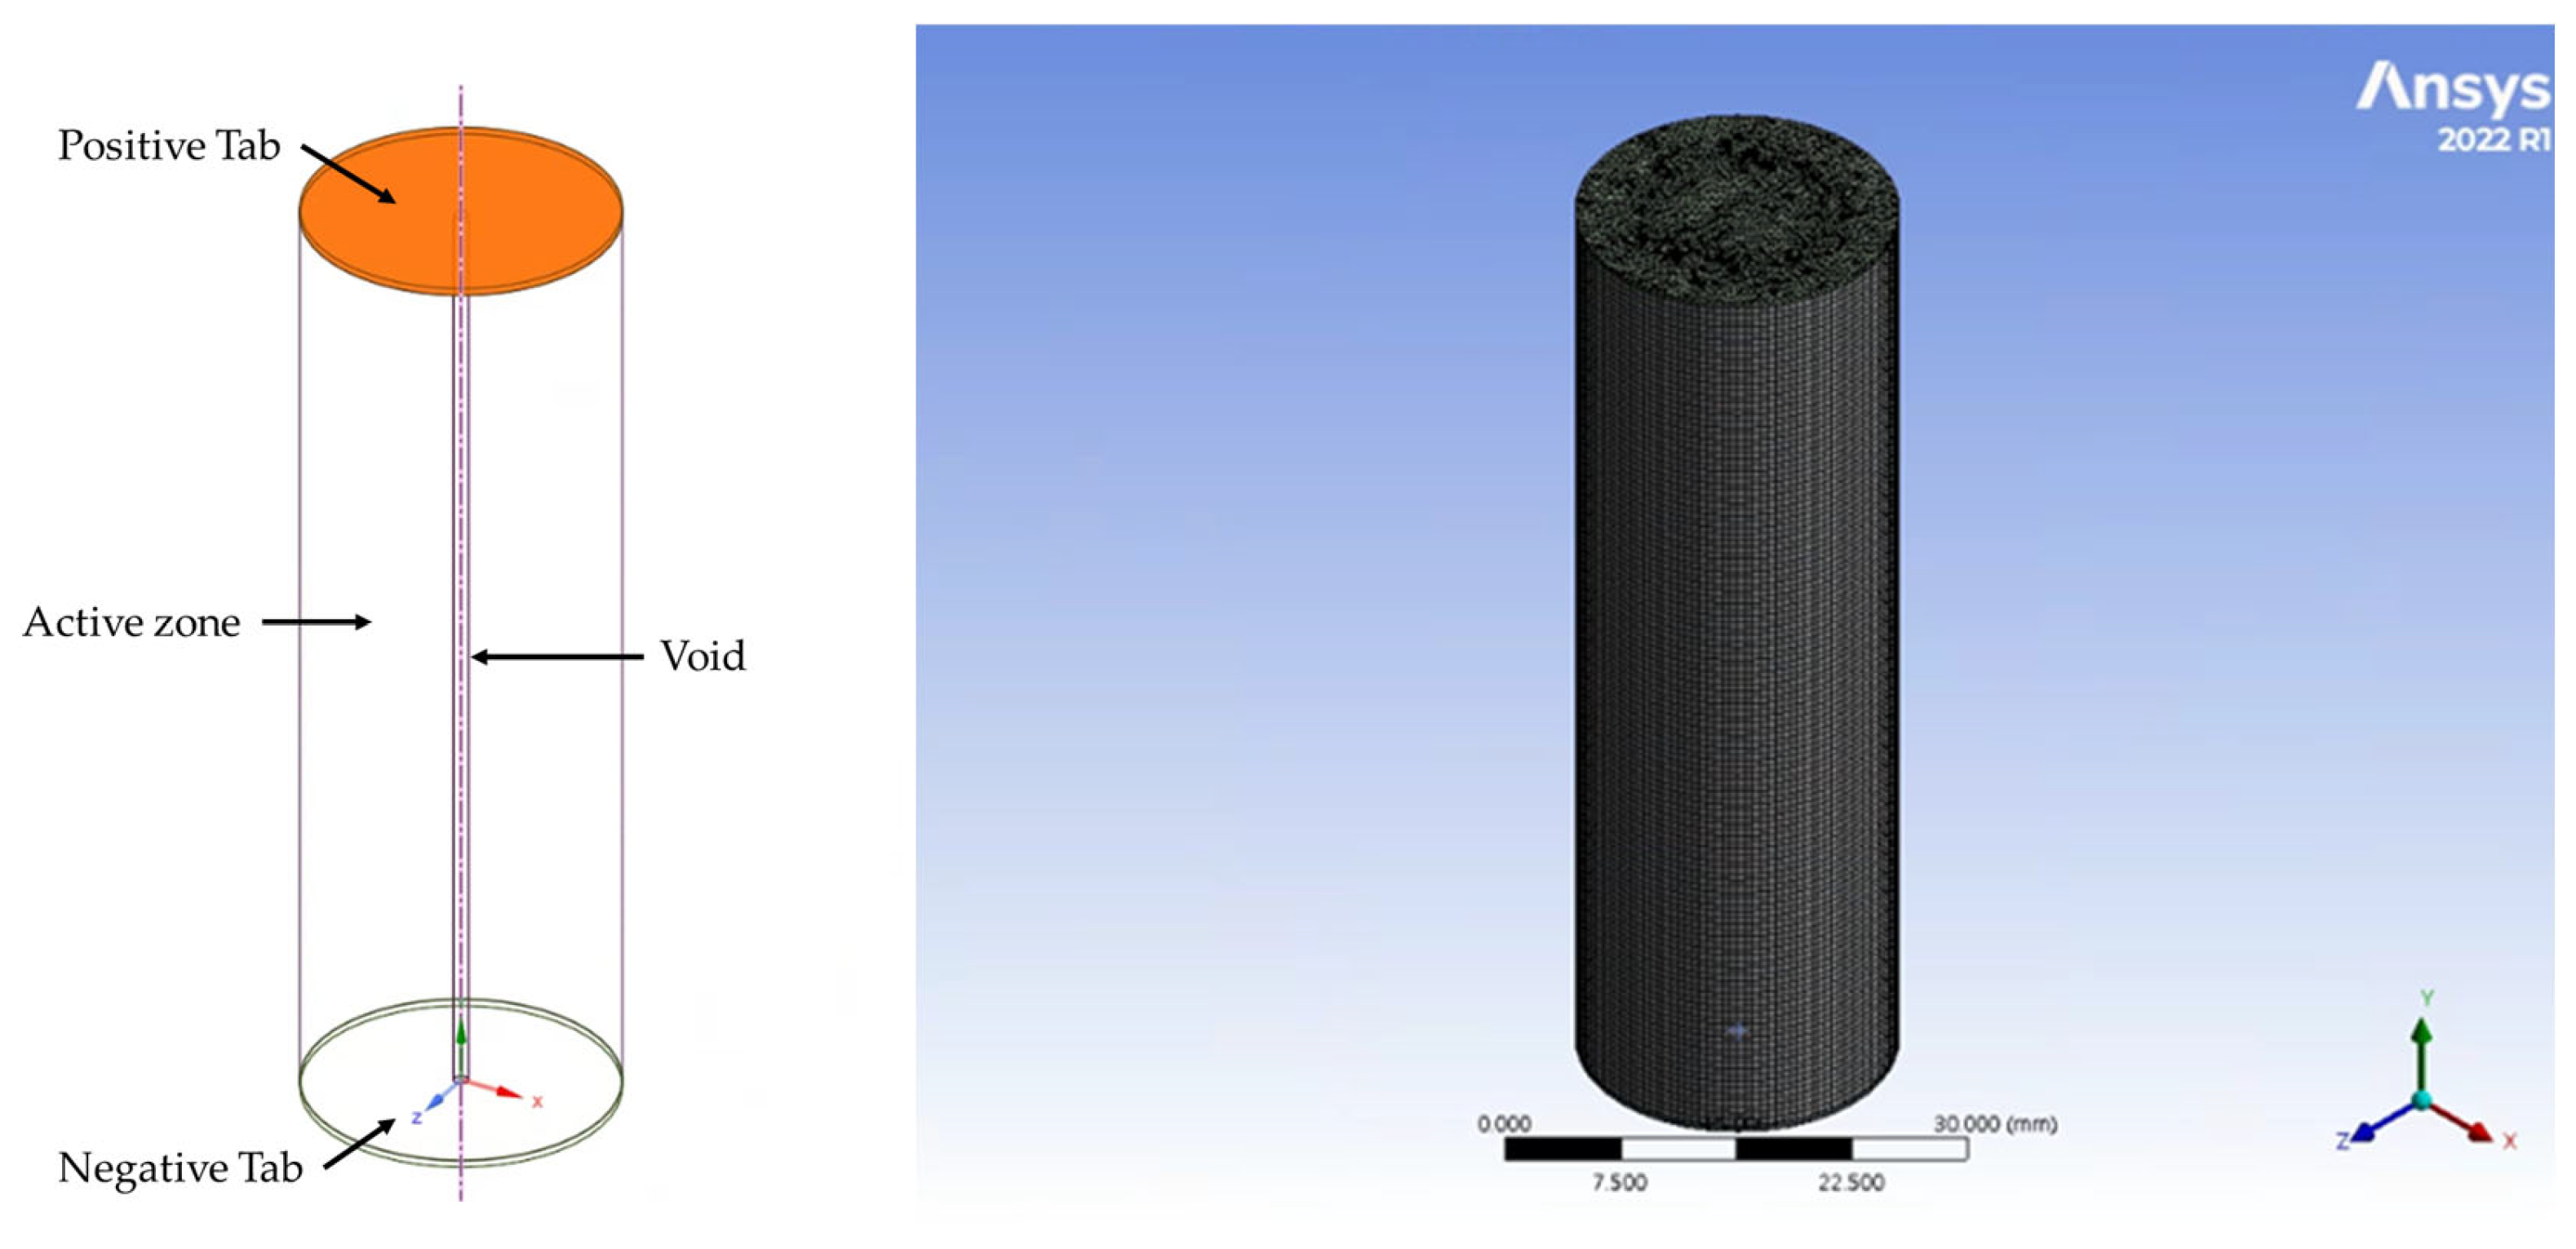
A sketch of the 5 Ah NCM811-21700 cylindrical cell is shown in Figure 5. The cell structure was simplified to an active zone, a positive tab, a negative tab, and a void. This study used the commercial computational fluid dynamics (CFD) software ANSYS FLUENT to solve a thermally coupled P2D electrochemical model. In total, 317,372 tetrahedral and hexahedral elements were generated, as shown in Figure 5. Because most governing equations are solved in the solid domain, the mesh quality does not significantly impact the computational results; thus, a mesh-independent test is not required for this study. The shell of the battery was set to be 0.34 mm [31] with a constant convective heat transfer coefficient (15 W/m2K). The density, thermal conductivity, and specific heat capacity of the shell material are 7900 kg/m3, 15 W/mK, and 477 J/kgK, respectively [31]. The internal temperature of the cell was set as equal to the ambient temperature at initial time. The discharge process at various C-rates was simulated using the transient solution method with a time step size of 1s. Additionally, a User Define Function (UDF) was used to define the entropic term ∂U/∂T in the FLUENT environment.
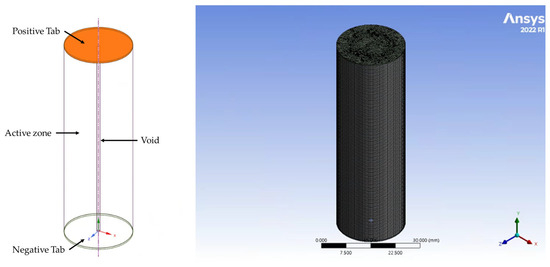
Figure 5.
Simplified cell geometry and mesh of the NCM811-21700 cylindrical cell.
3. Results and Discussion
Numerical simulations were conducted on the 5 Ah NCM811-21700 cylindrical cell at discharge rates of 1C, 2C, and 3C under a temperature of 25 °C. This study aims to comprehend the cell thermal attributes under varying discharge rates during discharge and validate the thermally coupled Newman P2D model for thermal and electrochemical performance prediction. The outcomes are derived from the cell depth of discharge (DoD), which signifies the extent of battery discharge, where “1” indicates a fully charged state, and “0” represents a fully discharged state. The DoD of the discharge process can be evaluated as:
3.1. Model Validation
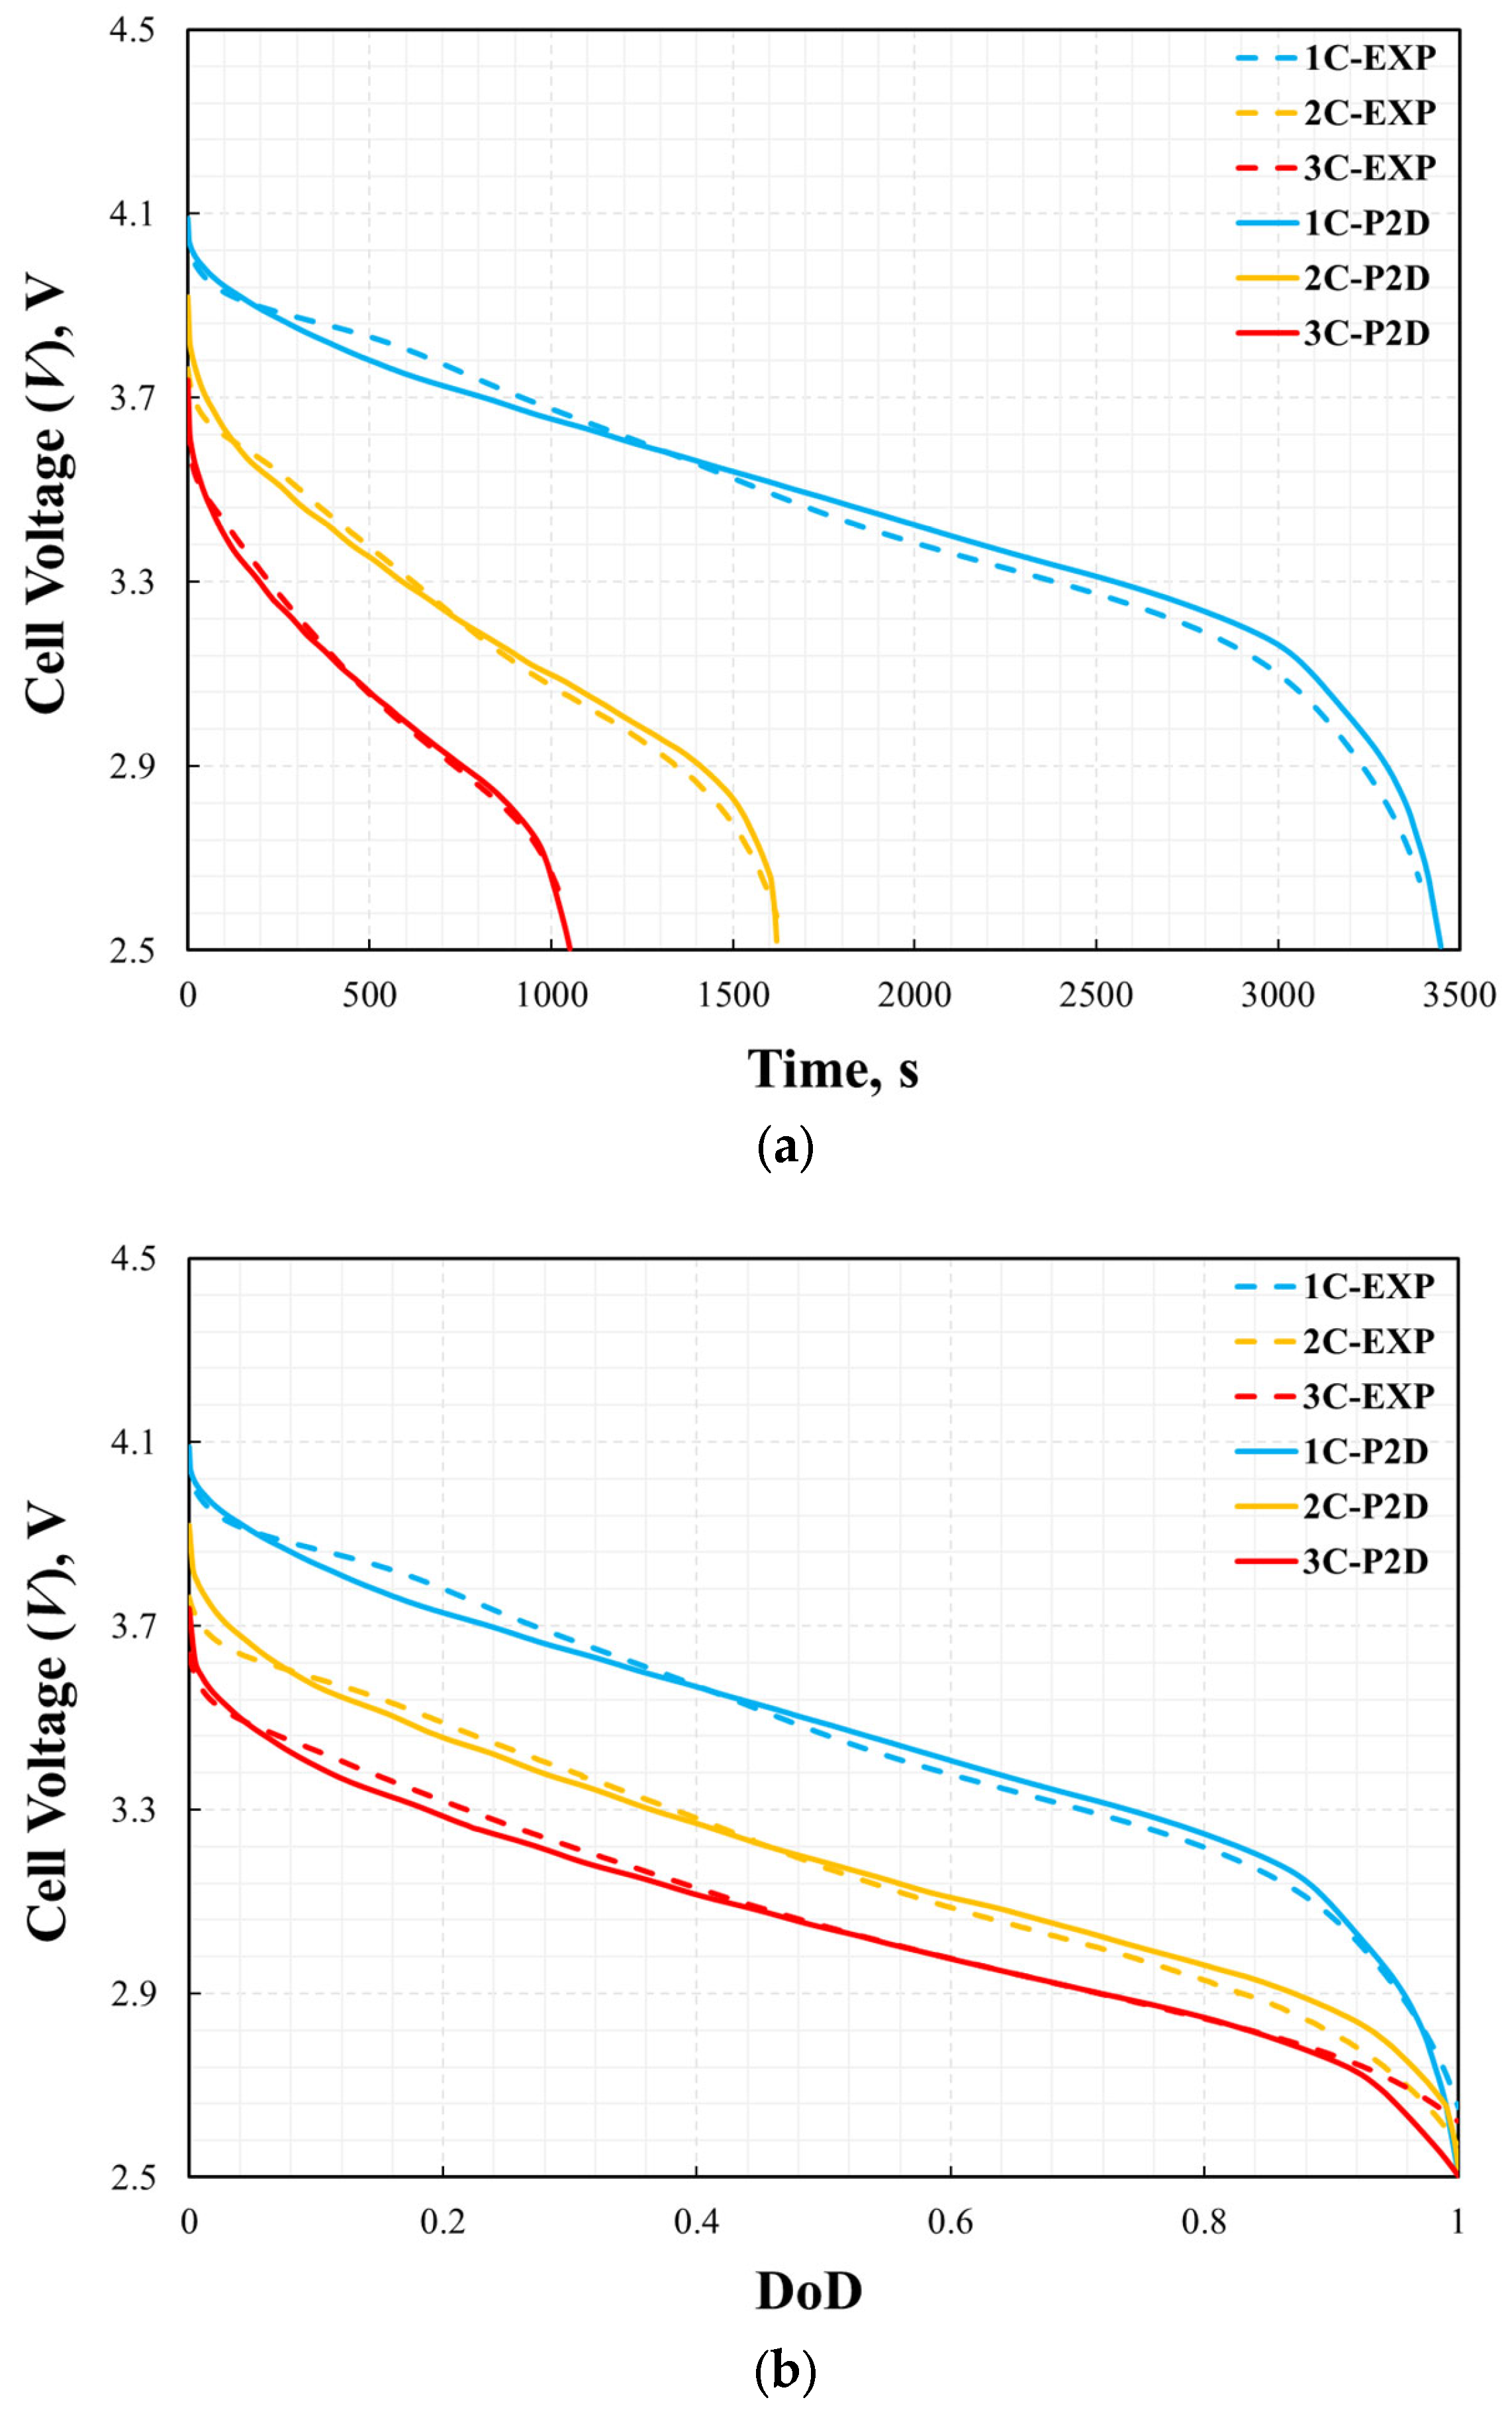
The developed thermally coupled electrochemical P2D model was validated using data obtained from an experimental study by Catenaro et al. [33]. Initially, the model was validated using experimental data of battery voltage versus time and DoD during the discharge process with the different discharge rates of 1C, 2C, and 3C at a steady ambient temperature of 25 °C. As shown in Figure 6, the simulation results of the cell voltage are consistent with the experimental data for every discharge rate. An error analysis was also performed. Given the discrepancy in the number of simulation results and experimental data, the error analysis was conducted according to the following steps: First, the simulation results were fitted into a polynomial about the DoD. The DoD values from the experimental data were substituted into this polynomial to obtain the corresponding fitted values. Finally, the fitted values were used for error calculations against the experimental data. Therefore, the error between simulation result and experimental can be defined as:
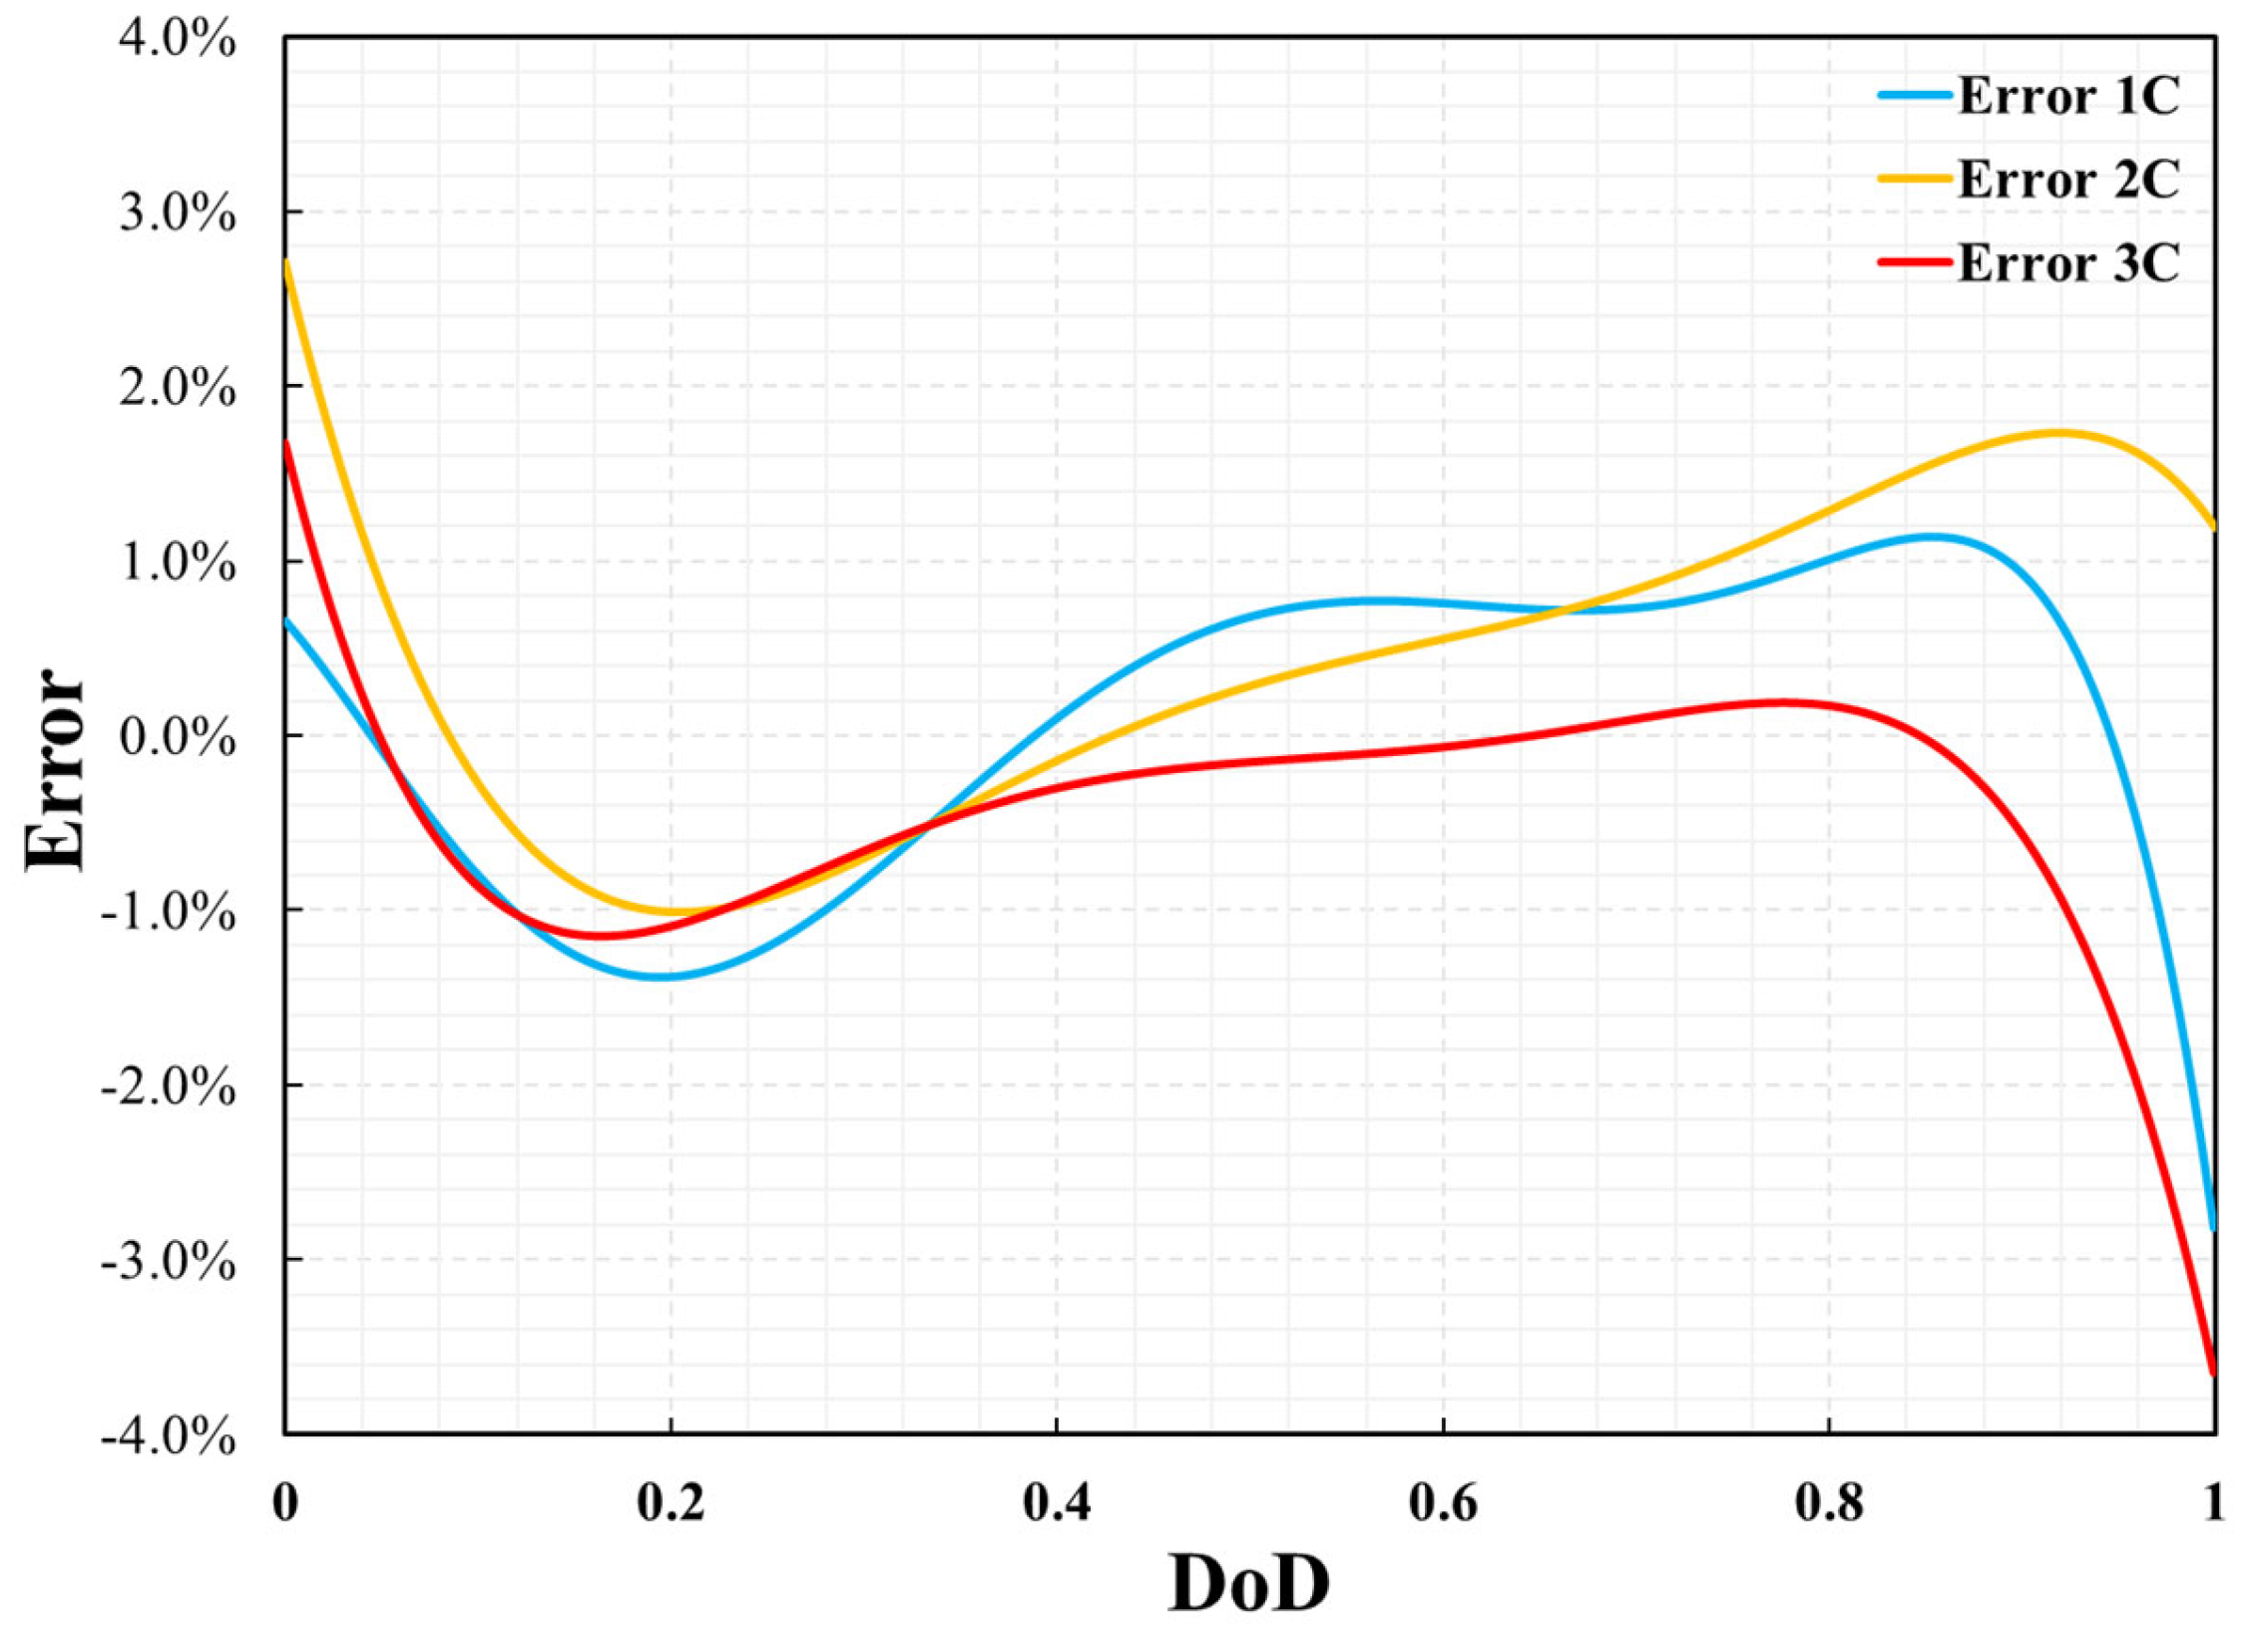
where θfitted and θexp indicate the fitted data from the simulation result and the experiment data, respectively. The error in the cell voltage is shown in Figure 7. The maximum errors for 1C, 2C, and 3C were 2.8%, 2.7%, and 3.6%, respectively. Larger errors usually appear at the beginning or end of battery discharge. This may be due to unstable measurements of the battery at the beginning or end of discharge. The P2D model accurately reflected the voltage change during the battery discharge process.
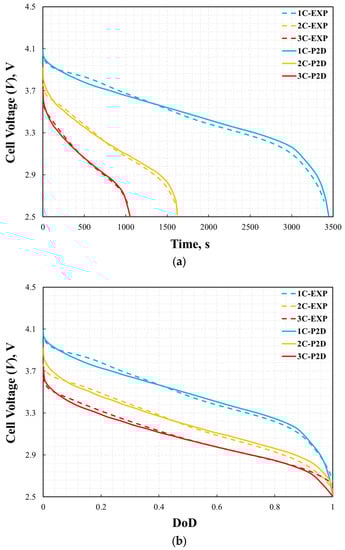
Figure 6.
Validation of cell voltage curves: voltage vs. time (a) and depth of discharge (b).
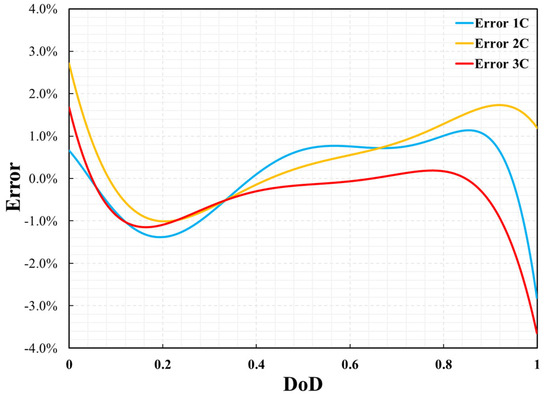
Figure 7.
Errors of cell voltage between simulation results and experimental data.
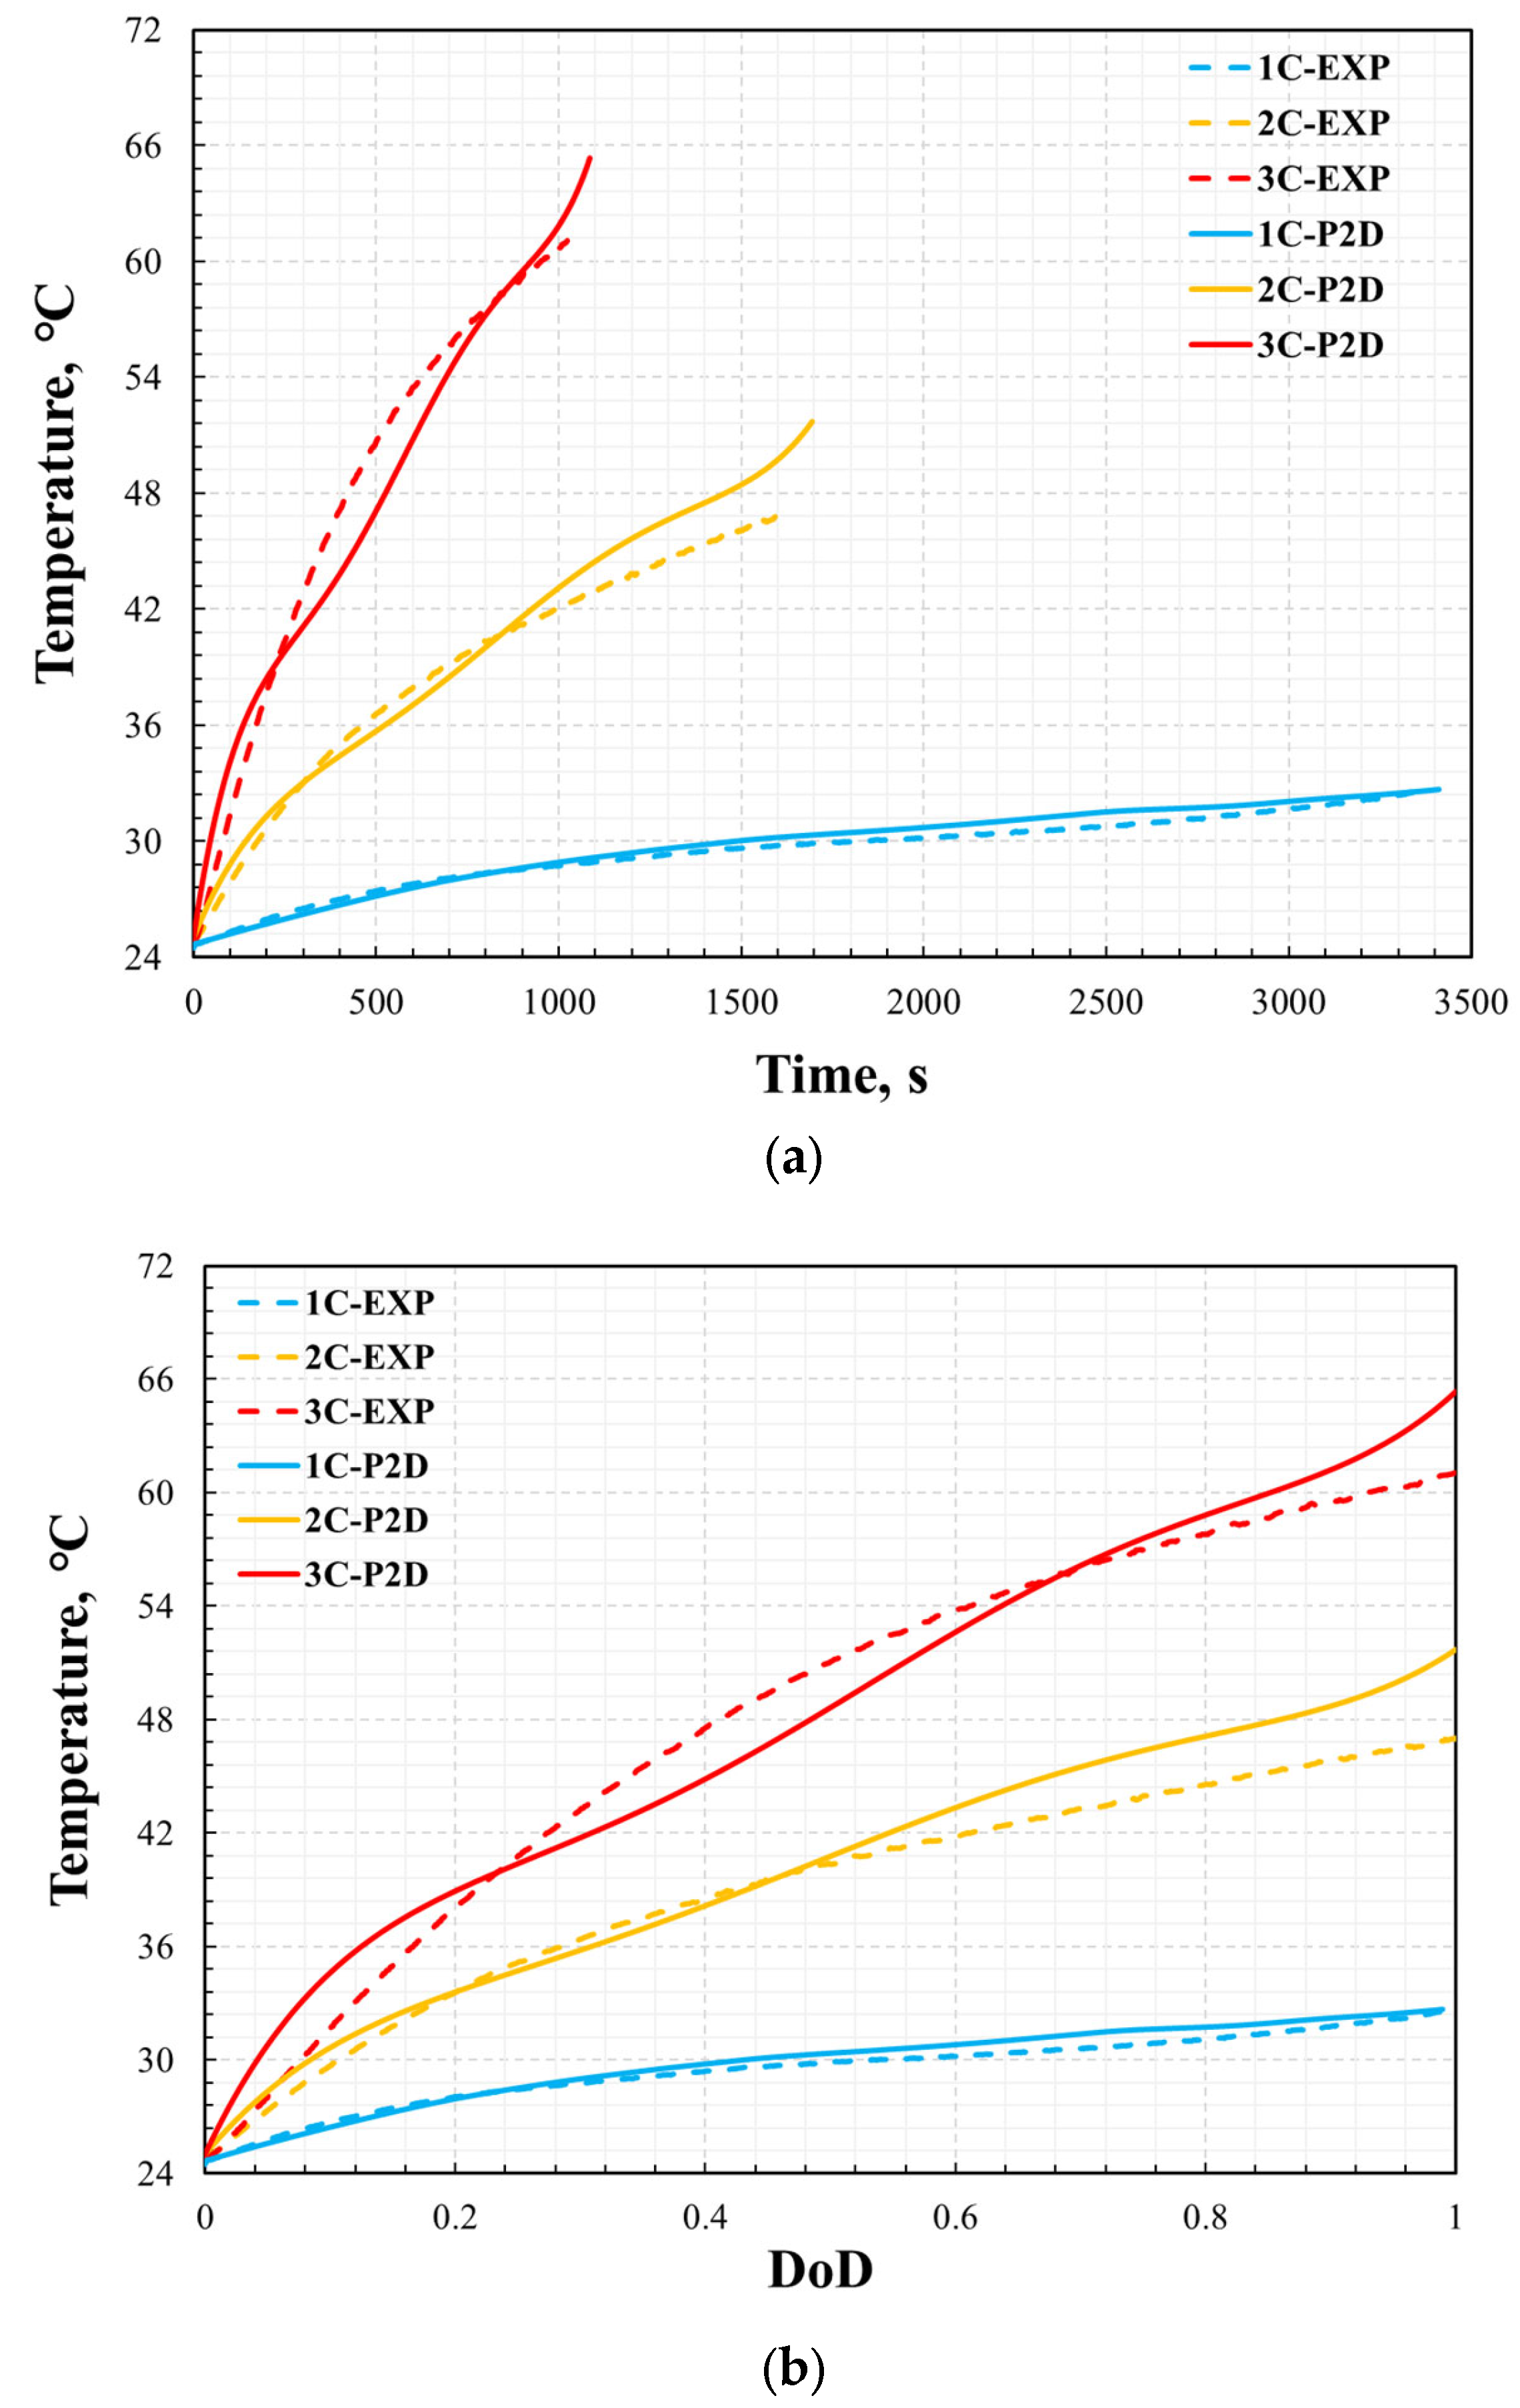
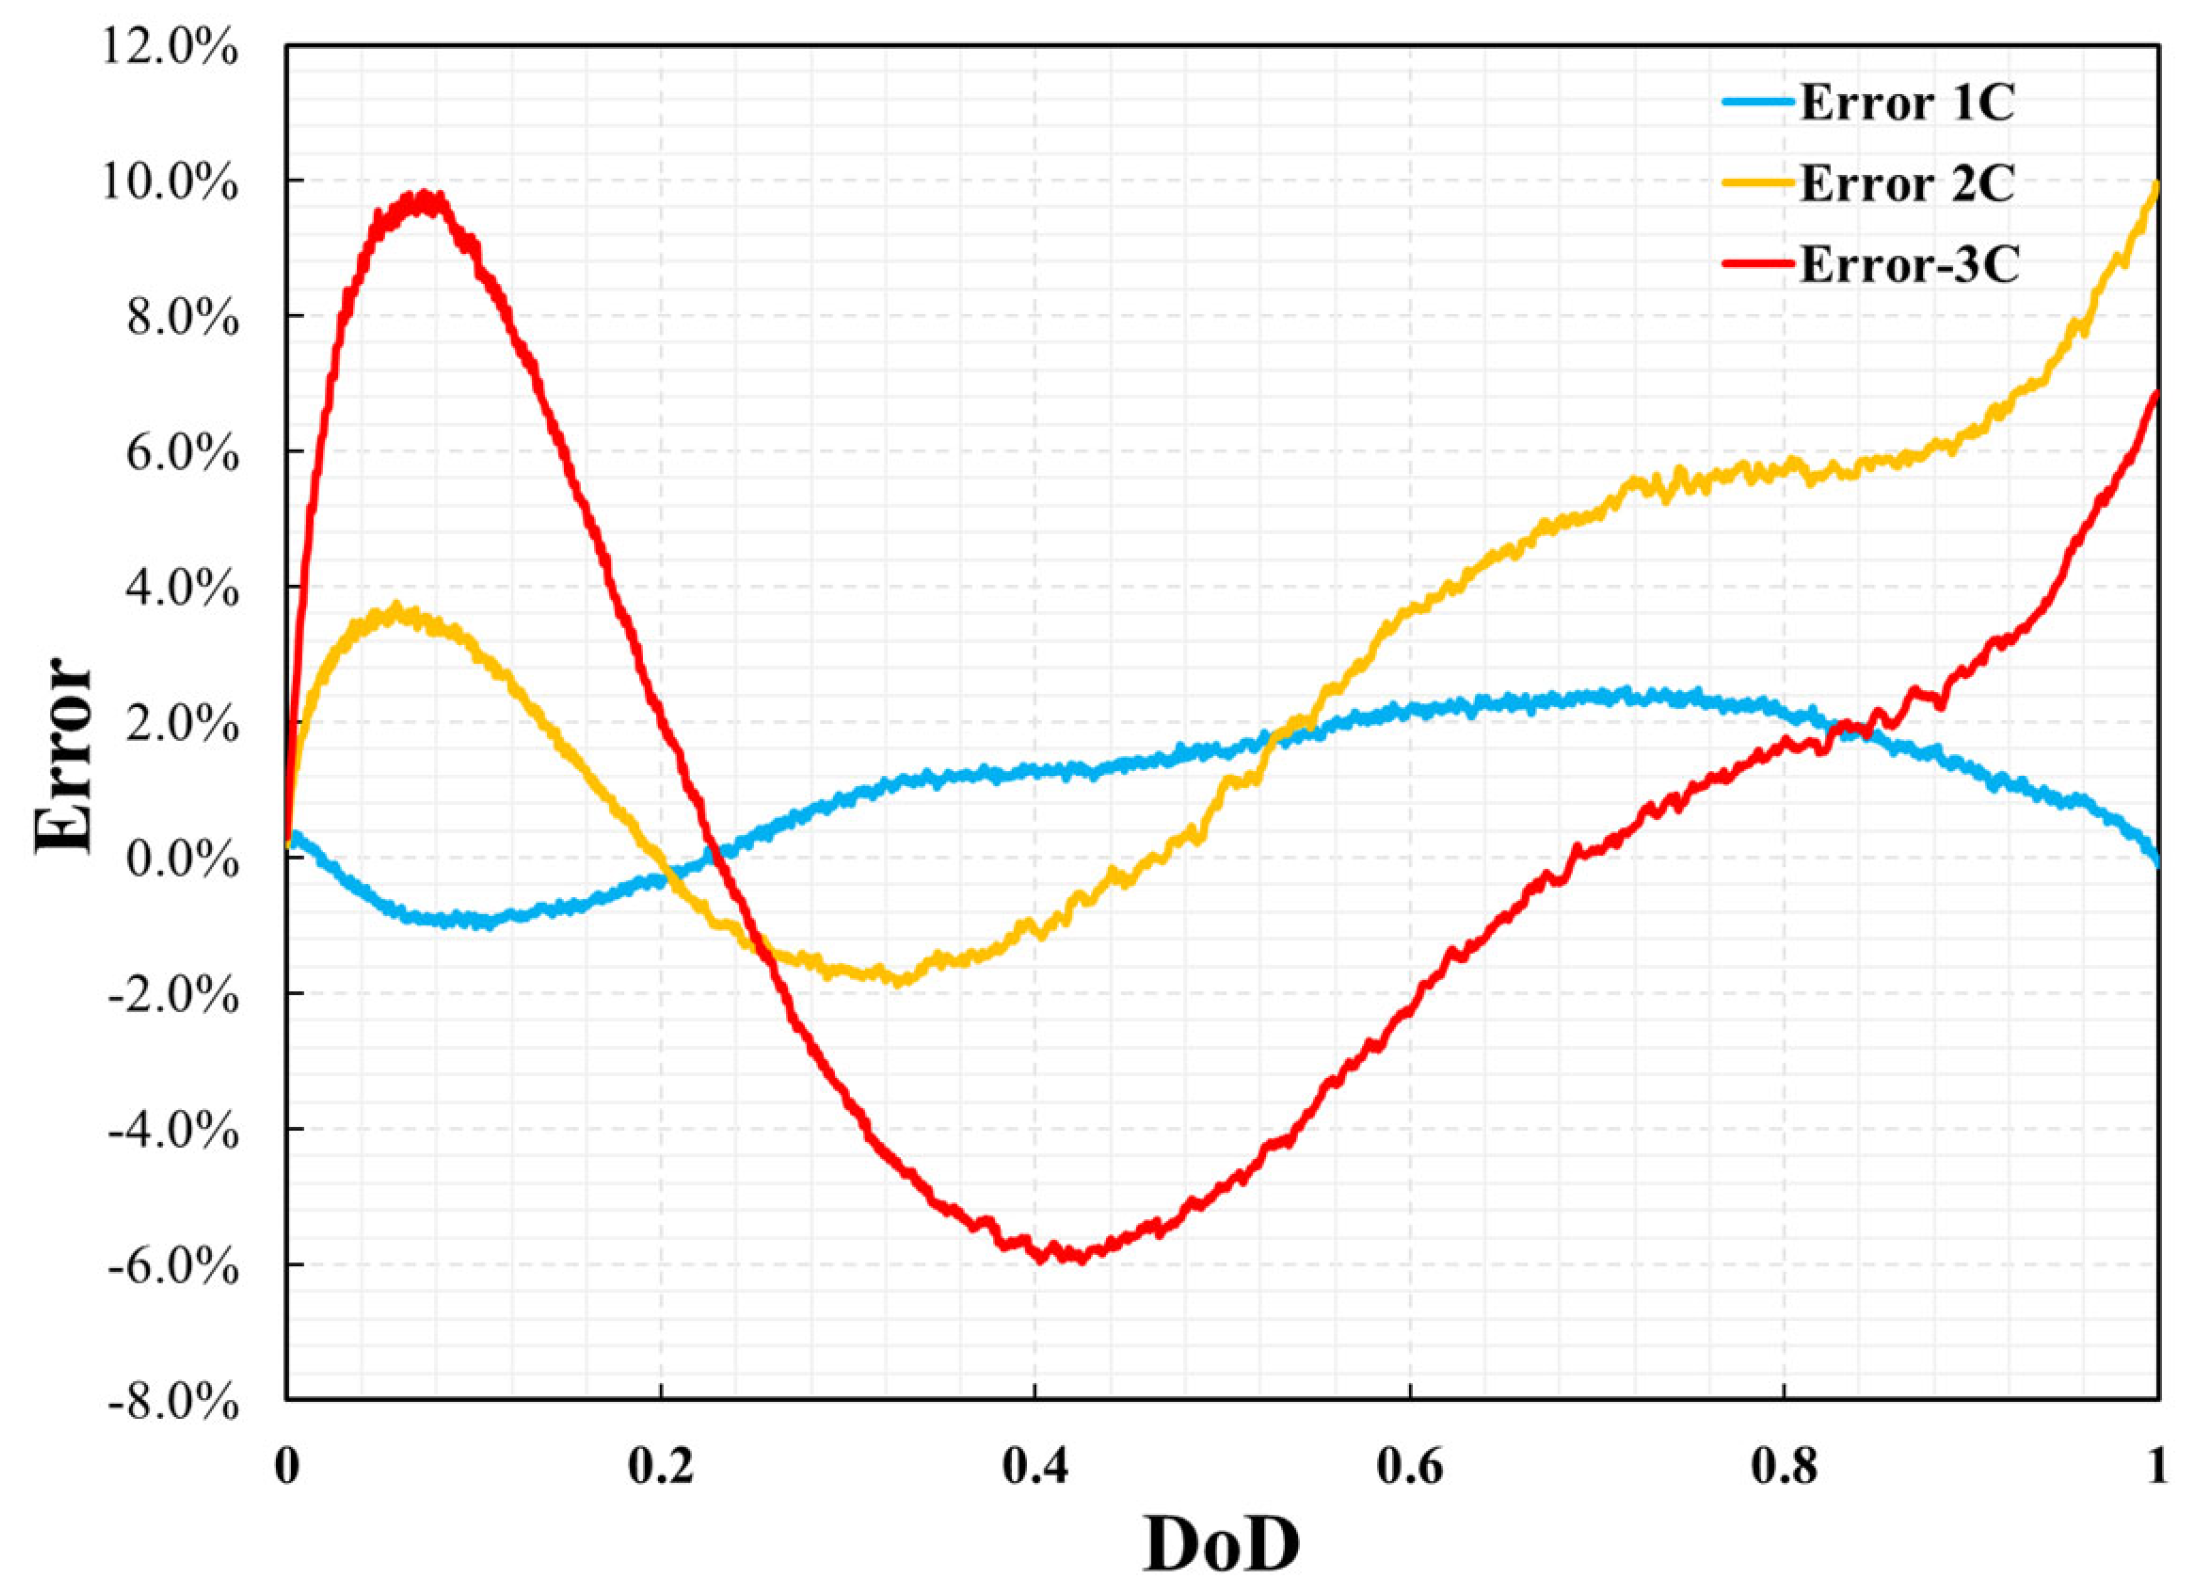
The thermal performance is also validated by the comparison of the cell surface temperature profile between simulation results and experimental data versus time and DoD during the discharge process with the different discharge rates of 1C, 2C, and 3C at a steady ambient temperature of 25 °C. As shown in Figure 8 and Figure 9, the error in the temperature profile was relatively large, especially under the conditions of 2C and 3C. The same method was used to analyze the error in the temperature profile. The maximum errors at 1C, 2C, and 3C were 2.4%, 9.7%, and 9.8%, respectively. The temperature profile under the 1C discharge process was significantly smaller than those of 2C and 3C. This is because, in the P2D model, there are many parameters based on temperature variables, such as the specific heat of the battery and thermal conductivity. However, this study did not consider the effect of temperature on these parameters because of the lack of reference data. However, the measurement of battery temperature also has significant instability. This is affected by the measurement location, measurement accuracy, and external heat transfer conditions. Even in a constant temperature chamber, the heat transfer coefficient on the battery surface is uncertain. Therefore, when the battery was discharged at 2C and 3C, the temperature was much higher than the reference temperature, which led to large errors in the simulation results. In addition, the temperature error curve was not as smooth as the voltage error curve. This was likely because the temperature measurements were less stable than the voltage measurements during the experimental process. However, compared with other numerical analysis studies [8,13,14] on batteries of the same type, this error was not significant. Therefore, it can be said that the model’s reliability has been verified under the ambient temperature of 25 °C.
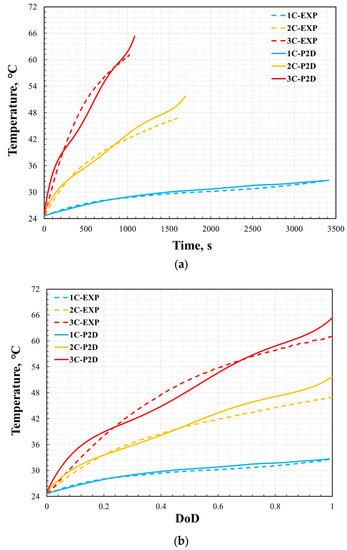
Figure 8.
Validation of cell temperature: temperature vs. time (a) and depth of discharge (b).
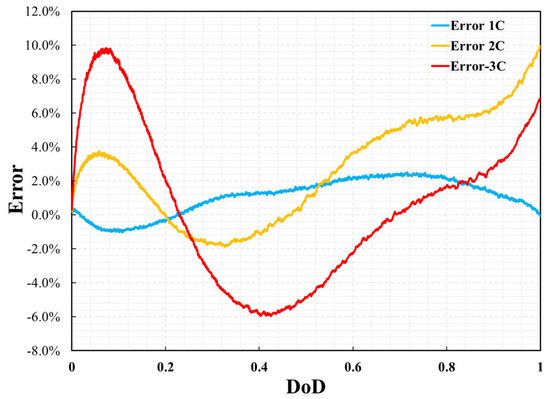
Figure 9.
Errors of cell temperature between simulation results and experimental data.
3.2. Electrochemical and Thermal Analysis
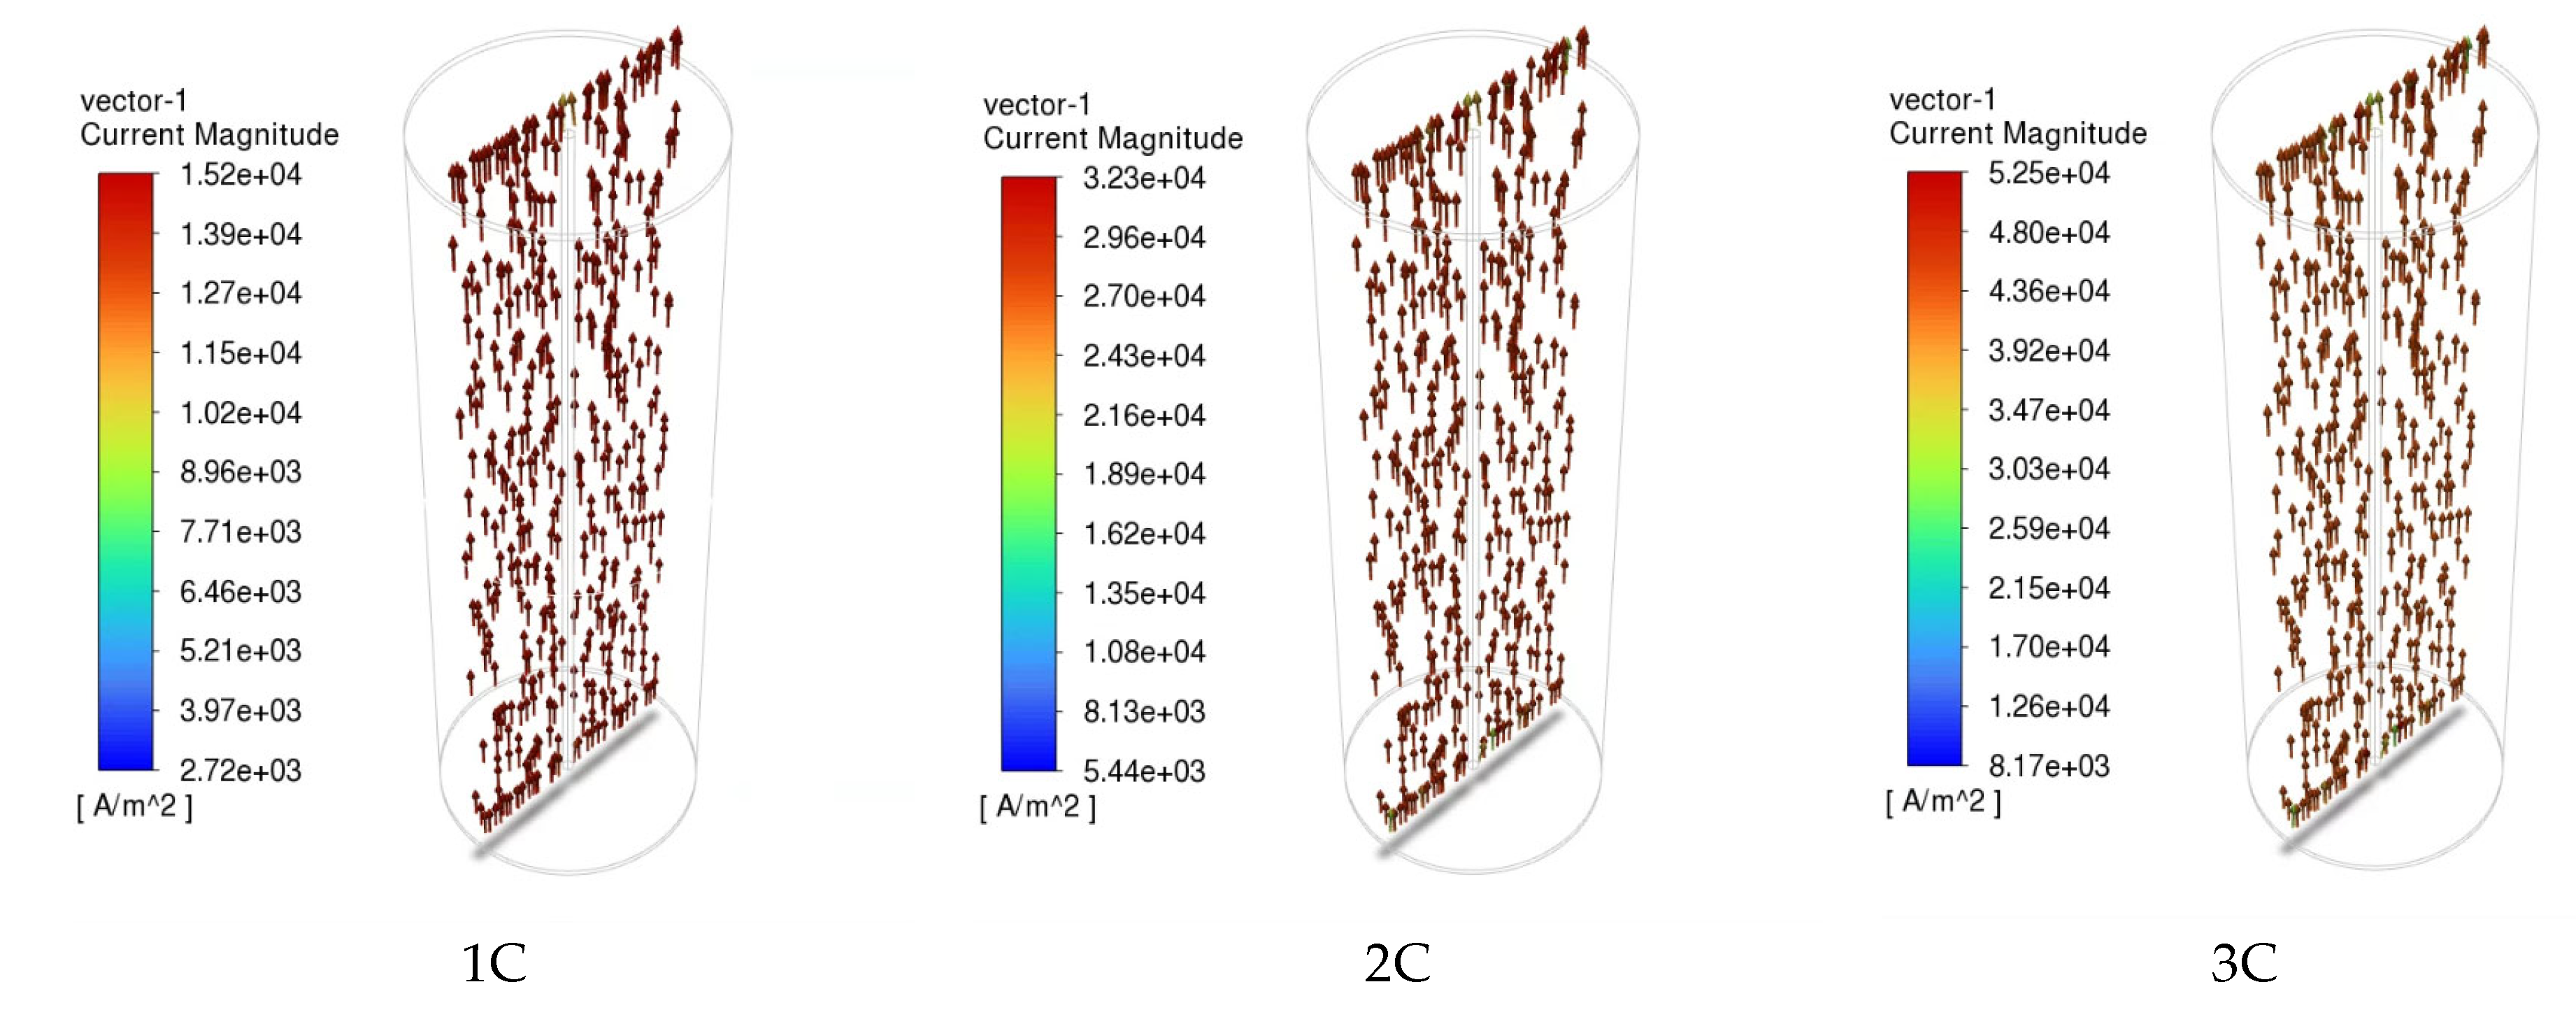
The distribution of the current density inside the NCM811-21700 battery under the 1C, 2C, and 3C discharge processes is presented in Figure 10. The arrows are colored according to the magnitude of the current density. As shown in Figure 10, the direction of the arrows indicates that the electrical current is input via the negative current collector tab (bottom) and then output through the positive current collector tab (top). The magnitude of the current density correlates well with the discharge rate. In lithium-ion batteries, electrolyte solutions play the role of ionic conductors and unavoidably create concentration gradients during the operation of the battery. Recent studies [34] reveal that beyond these gradients, unique lithium-ion (Li+) concentration waves are generated in the electrolyte of graphite-based porous electrode/lithium cells. This particular phenomenon was also scrutinized in this simulation’s approaches and is presented in Figure 11. The formation of these waves stems from the irregularities in the reaction distribution within the porous electrode, and they are influenced by both thermodynamic factors, such as open-circuit voltage (OCV), and kinetic factors, such as the unevenness of the charge transfer reaction.

Figure 10.
Current density inside of the cell at various discharge rates.
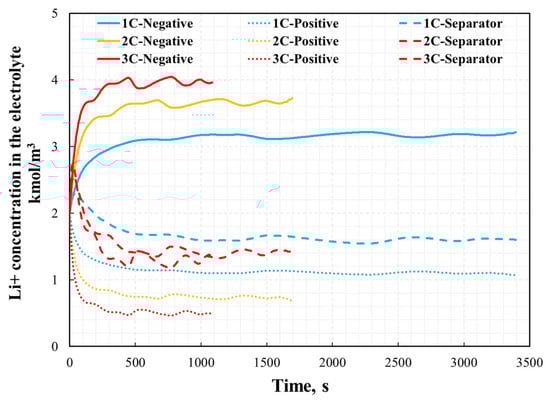
Figure 11.
Lithium-ion concentration in the electrolyte phase in different location under various discharge rate.
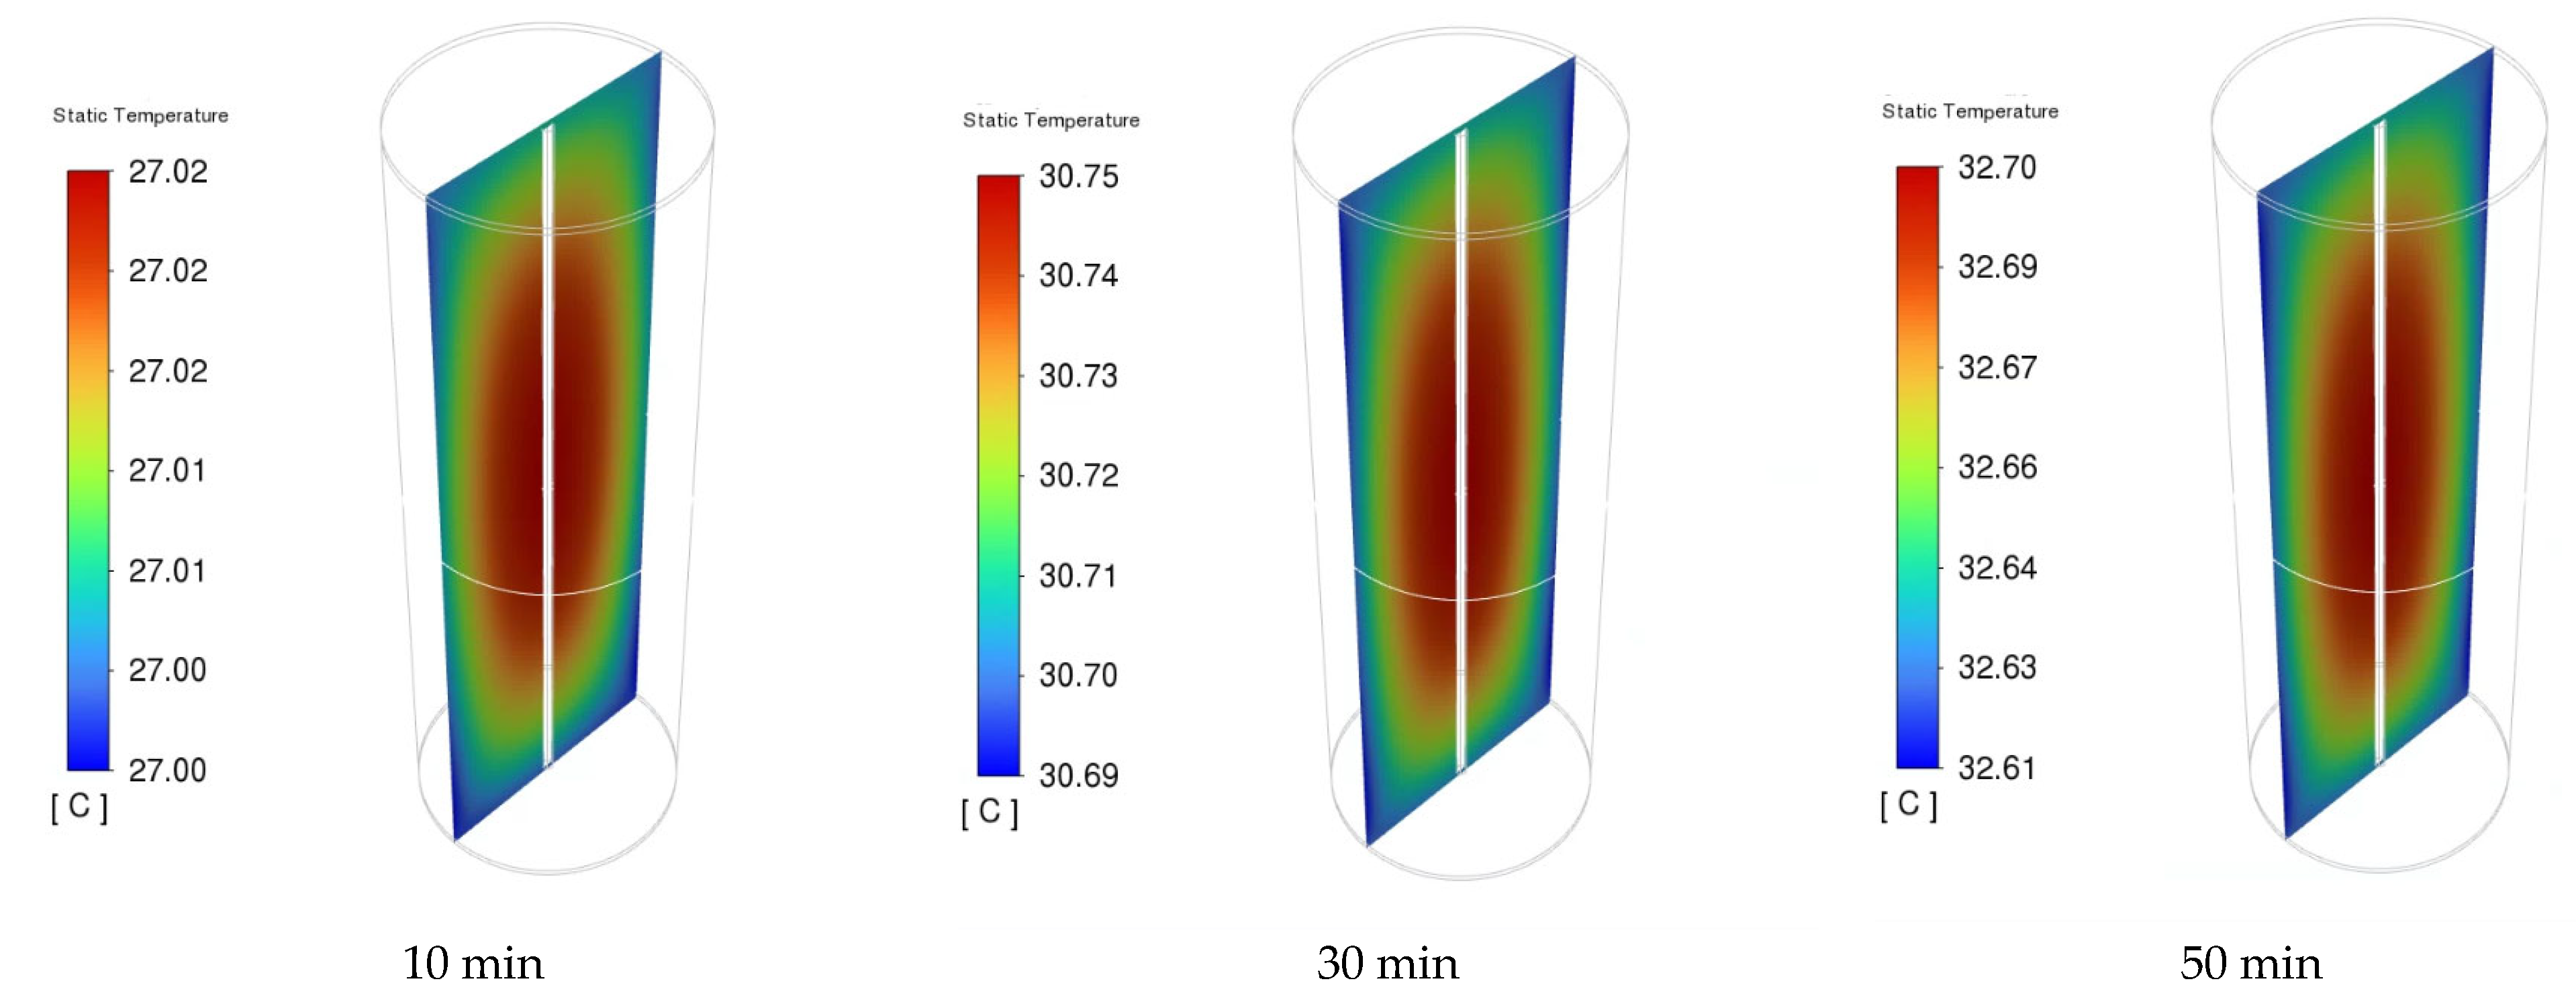
Figure 12 presents the distribution of the NCM811 21700 battery cell voltage of the 1C discharge rate at time intervals of 10, 30, and 50 min. During the discharging process, the cell voltage was not uniform across the entire cell. However, there was a slight drop in the overall battery working voltage from 2 to 50 min of discharge time, indicating a stable discharge voltage of the NCM811 battery. A significant potential gradient is observed near the positive end (top) of the cell. This can be attributed to the composition of the positive current collector and tab made of Al foil, in contrast to the negative current collector and tab (bottom tab) made of Cu foil, which has a higher electrical conductivity than Al foil. Moreover, the unevenness of the local cell voltage can be attributed to the heterogeneous electrochemical reaction rate in the battery. The local cell voltage was determined from the difference in potential between the positive and negative current collectors. The temperature distributions inside the battery cell under a 1C discharge rate at 10, 30, and 50 min are presented in Figure 13. The temperature gradient in the battery from the center to the outside surface is presented because of heat loss to the constant-temperature boundary condition. Although the temperature difference between the battery surface and the center is small, it can still be observed that this temperature difference increases with increasing discharge time.
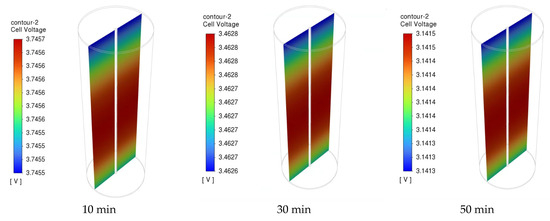
Figure 12.
The cell voltage of the battery under 1C discharge rate at different time.

Figure 13.
The cell temperature distribution of the battery under 1C discharge rate at different times.
4. Conclusions
This study employed a thermally coupled electrochemical P2D model to represent the electrochemical and thermal characteristics of an NCM811-21700 cylindrical lithium-ion battery. The model parameters were obtained from other studies owing to the challenges and limitations of parameter identification. The commercial CFD software ANSYS FLUENT 2022R1 was used to solve the thermal and electrochemical submodels. Simulations were conducted to represent the discharge process under the discharge rates of 1C, 2C, and 3C, with a constant ambient temperature of 25 °C. The voltage curves and temperature profiles versus the discharge time and DoD were validated using experimental data. The validation results indicated that the model represented voltage curves with errors of less than 4% for every discharge rate. The maximum errors in the cell voltage at 1C, 2C, and 3C were 2.7%, 2.8%, and 3.6%, respectively. The errors of the temperature profiles were minor, and the maximum error at 1C, 2C, and 3C were 2.4%, 9.7%, and 9.8%, respectively. However, this error is still acceptable, considering the uncertainty in the selection of model parameters and the instability in measuring the battery temperature. Using the validated model, the electrochemical and thermal characteristics of an NCM811 battery were obtained from numerical simulations. The vector diagram of the current density, variation of lithium-ion concentration in the electrolyte phase, and the distribution of the internal voltage and temperature in the battery during the discharge process are discussed as being reasonable. This also indicates that the model developed in this study can be effectively applied to the thermal management research of the NCM811-21700 cylindrical battery.
A limitation of this study is that the effect of ambient temperature was not investigated owing to the lack of investigation of temperature-dependent parameters. Future experimental work is expected to involve performance testing, parameter identification, and numerical model validation for the NCM811-21700 battery under different ambient temperature conditions. Furthermore, the presented P2D model is only applied to investigate the thermal and electrochemical performance during the discharge process at the cell level. Models for the charging process as well as at the module and pack levels still need to be developed and validated in future work.
Author Contributions
J.L. performed system modeling and numerical analyses and drafted the manuscript. S.C. discussed the results. S.-C.K. organized the overall evaluation and reviewed the manuscript. All authors have read and agreed to the published version of the manuscript.
Funding
This research was supported by a National Research Foundation of Korea (NRF) grant funded by the Korean government (MSIT) (No. 2019R1A5A8080290).
Data Availability Statement
Data is unavailable due to privacy restrictions.
Conflicts of Interest
The authors declare no conflict of interest.
Nomenclature
| as | Solid/electrolyte interfacial area per unit volume, m2/m3 | |
| ce | Concentration of lithium in the electrolyte, mol/m3 | |
| cs | Concentration of lithium in the active material particles, mol/m3 | |
| Cp | Specific heat capacity, J/kgK | |
| De | Diffusion coefficient of electrolyte, m2/s | |
| Ds | Diffusion coefficient of lithium in the active material, m2/s | |
| Ed | Diffusion activation energy, kJ/mol | |
| Er | Reaction activation energy, kJ/mol | |
| F | Faraday’s constant, C/mol | |
| f± | Average molar activity coefficient | |
| i0 | Exchange current density, A/m2 | |
| jint | Pore-wall current flux due to lithium intercalation reaction, A/m2 | |
| jside | Pore-wall current flux due to side reactions, A/m2 | |
| km | Reaction rate constant, m2.5/mol0.5s | |
| l | Thickness, µm | |
| Q | Cell capacity, Ah | |
| q | Volumetric heat generation, W/m3 | |
| r | Particle radius, µm | |
| R | Gas constant, J/mol2K | |
| t+ | Transference number lithium ion | |
| T | Temperature, K | |
| U | Open circuit voltage of the cell, V | |
| Un | Open circuit potential of the negative electrode, V | |
| Up | Open circuit potential of the positive electrode, V | |
| V | Cell voltage, V | |
| v | Cell volume, m3 | |
| Greek letters | ||
| αa | Charge transfer coefficient at anode | |
| αc | Charge transfer coefficient at cathode | |
| β | Bruggeman exponent | |
| εe | Electrolyte volume fraction | |
| εs | Active material volume fraction | |
| λ | Thermal conductivity, W/m2K | |
| ρ | Density, kg/m3 | |
| σe | Ionic conductivity of electrolyte, S/m | |
| σs | Electronic conductivity in solid phase material, S/m | |
| ϕe | Electrolyte phase potential, V | |
| ϕs | Solid phase potential, V | |
| η | Local surface over potential, V | |
| Subscripts and superscripts | ||
| 0 | Initial value | |
| n | Negative electrode | |
| p | Positive electrode | |
| e | Electrolyte phase | |
| s | Solid phase | |
| max | Maximum | |
| min | Minimum | |
| eff | Effective value | |
| amb | Ambient | |
References
- Jaguemont, J.; Mierlo, J.V. A comprehensive review of future thermal management systems for battery-electrified vehicles. J. Energy Storage 2000, 31, 101551. [Google Scholar] [CrossRef]
- Alptekin, E. Emission, injection and combustion characteristics of biodiesel and oxygenated fuel blends in a common rail diesel engine. Energy 2017, 119, 44–52. [Google Scholar] [CrossRef]
- Tete, P.R.; Gupta, M.M.; Joshi, S.S. Developments in battery thermal management systems for electric vehicles: A technical review. J. Energy Storage 2021, 35, 102255. [Google Scholar] [CrossRef]
- Thakur, A.K.; Prabakaran, R.; Elkadeem, M.R.; Sharshir, S.W.; Arıcı, M.; Wang, C.; Zhao, W.; Hwang, J.Y.; Saidur, R. A state of art review and future viewpoint on advance cooling techniques for Lithium–ion battery system of electric vehicles. J. Energy Storage 2020, 32, 101771. [Google Scholar] [CrossRef]
- Chen, Z.; Qin, Y.; Dong, Z.; Zheng, J.; Liu, Y. Numerical study on the heat generation and thermal control of lithium-ion battery. Appl. Therm. Eng. 2023, 211, 119852. [Google Scholar] [CrossRef]
- Zhang, C.; Li, K.; Mcloone, S.; Yang, Z. Battery Modelling Methods for Electric Vehicles–A Review. In Proceedings of the 2014 European Control Conference (ECC), Strasbourg, France, 24–27 June 2014. [Google Scholar]
- Zadeh, P.G.; Gholamalizadeh, E.; Wang, Y.; Chung, J.D. Electrochemical modeling of a thermal management system for cylindrical lithium-ion battery pack considering battery capacity fade. Case Stud. Therm. Eng. 2022, 32, 101878. [Google Scholar] [CrossRef]
- Li, Y.; Qi, F.; Guo, H.; Guo, Z.; Li, M.; Wu, W. Characteristic investigation of an electrochemical-thermal coupled model for a LiFePO4/Graphene hybrid cathode lithium-ion battery. Case Stud. Therm. Eng. 2019, 13, 100387. [Google Scholar]
- Liu, Z.; Wang, H.; Yang, C.; Zhao, J. Simulation study of lithium-ion battery thermal management system based on a variable flow velocity method with liquid metal. Appl. Therm. Eng. 2020, 179, 115578. [Google Scholar] [CrossRef]
- Chiew, J.; Chinb, C.S.; Toh, W.D.; Gao, Z.; Jia, J.; Zhang, C.Z. A pseudo three-dimensional electrochemical-thermal model of a cylindrical LiFePO4/graphite battery. Appl. Therm. Eng. 2019, 147, 450–463. [Google Scholar] [CrossRef]
- Liu, Y.; Tang, S.; Li, L.; Liu, F.; Jiang, L.; Jia, M.; Ai, Y.; Yao, C.; Gu, H. Simulation and parameter identification based on electrochemical-thermal coupling model of power lithium ion-battery. J. Alloys Compd. 2020, 844, 156003. [Google Scholar]
- Waldmann, T.; Scurtu, R.G.; Richter, K.; Wohlfahrt-Mehrens, M. 18650 vs. 21700 Li-ion cells–A direct comparison of electrochemical, thermal, and geometrical properties. J. Power Sources 2020, 472, 228614. [Google Scholar] [CrossRef]
- Kumar, R.; Chavan, S. Thermal Investigation of Cylindrical Lithium-ion Batteries for Different Loading using Experimental and Numerical Techniques. J. Electrochem. Soc. 2022, 169, 120504. [Google Scholar] [CrossRef]
- Yang, T.F.; Lin, P.Y.; Teng, L.T.; Rashidi, S.; Yan, W.M. Numerical and experimental study on thermal management of NCM-21700 Li-ion battery. J. Power Sources 2022, 548, 232068. [Google Scholar] [CrossRef]
- Moosavi, A.; Ljung, A.L.; Lundström, T.S. Design considerations to prevent thermal hazards in cylindrical lithium-ion batteries: An analytical study. J. Energy Storage 2021, 38, 102525. [Google Scholar] [CrossRef]
- Lin, C.; Wen, H.; Liu, L.; Liu, S.; Ma, T.; Fan, B.; Wang, F. Heat generation quantification of high-specific-energy 21700 battery cell using average and variable specific heat capacities. Appl. Therm. Eng. 2021, 184, 116215. [Google Scholar] [CrossRef]
- Zhang, C.; Amietszajew, T.; Li, S.; Marinescu; Offer, G.; Wang, C.; Guo, Y.; Bhagat, R. Real-time estimation of negative electrode potential and state of charge of lithium-ion battery based on a half-cell-level equivalent circuit model. J. Energy Storage 2022, 51, 104362. [Google Scholar] [CrossRef]
- Rahmani, E.; Fattahi, A.; Panahi, E.; Mahmoudi, Y. Thermal management improvement for a pack of cylindrical batteries using nanofluids and topological modifications. J. Power Sources 2023, 564, 232876. [Google Scholar] [CrossRef]
- Kang, T.; Park, S.; Lee, P.Y.; Cho, I.H.; Yoo, K.; Kim, J. Thermal Analysis of a Parallel-Configured Battery Pack (1S18P) Using 21700 Cells for a Battery-Powered Train. Electronics 2020, 9, 447. [Google Scholar] [CrossRef]
- Sahin, R.C.; Gocmen, S.; Cetkin, E. Thermal management system for air-cooled battery packs with flow-disturbing structures. J. Power Sources 2022, 551, 232214. [Google Scholar] [CrossRef]
- Wang, H.; Wang, Y.; Hu, F.; Shi, W.; Hu, X.; Li, H.; Chen, S.; Lin, H.; Jiang, C. Heat generation measurement and thermal management with phase change material based on heat flux for high specific energy power battery. Appl. Therm. Eng. 2021, 194, 117053. [Google Scholar] [CrossRef]
- Sheng, L.; Zhang, H.; Su, L.; Zhang, Z.; Zhang, H.; Li, K.; Fang, Y.; Ye, W. Effect analysis on thermal profile management of a cylindrical lithium-ion battery utilizing a cellular liquid cooling jacket. Energy 2021, 220, 119725. [Google Scholar] [CrossRef]
- Zhang, X.; Li, P.; Huang, B.; Zhang, H. Numerical investigation on the thermal behavior of cylindrical lithium-ion batteries based on the electrochemical-thermal coupling model. Int. J. Heat Mass Transf. 2022, 199, 123449. [Google Scholar] [CrossRef]
- Li, H.; Saini, A.; Liu, C.; Yang, J.; Wang, Y.; Yang, T.; Pan, C.; Chen, L.; Jiang, H. Electrochemical and thermal characteristics of prismatic lithium-ion battery based on a three-dimensional electrochemical-thermal coupled model. J. Energy Storage 2021, 42, 102976. [Google Scholar] [CrossRef]
- Li, H.; Liu, C.; Saini, A.; Wang, Y.; Jiang, H.; Yang, T.; Chen, L.; Pan, C.; Shen, H. Coupling multi-physics simulation and response surface methodology for the thermal optimization of ternary prismatic lithium-ion battery. J. Power Sources 2019, 438, 226974. [Google Scholar] [CrossRef]
- Ansys Fluent Theory Guide; Ansys, Inc.: Canonsburg, PA, USA, 2021.
- Astaneh, M.; Andric, J.; Löfdahl, L.; Stopp, P. Multiphysics simulation optimization framework for lithium-ion battery pack design for electric vehicle applications. Energy 2022, 239, 122092. [Google Scholar] [CrossRef]
- Doyle, M.; Fuller, T.F.; Newman, J. Modeling of Galvanostatic Charge and Discharge of the Lithium/Polymer/Insertion Cell. J. Electrochem. Soc. 1993, 140–146, 1526–1533. [Google Scholar] [CrossRef]
- Crawford, A.J.; Choi, D.; Balducci, P.J.; Subramanian, V.R.; Viswanathan, V.V. Lithium-ion battery physics and statistics-based state of health model. J. Power Sources 2021, 501, 230032. [Google Scholar] [CrossRef]
- Chen, C.H.; Planella, F.B.; O’Regan, K.; Gastol, D.; Widanage, W.D.; Kendrick, E. Development of Experimental Techniques for Parameterization of Multi-scale Lithium-ion Battery Models. J. Electrochem. Soc. 2020, 167, 080534. [Google Scholar] [CrossRef]
- O’Regan, K.; Planella, F.B.; Widanage, W.D.; Kendrick, E. Thermal-electrochemical parameters of a high energy lithium-ion cylindrical battery. Electrochim. Acta 2022, 425, 140700. [Google Scholar] [CrossRef]
- Nie, P.; Zhang, S.W.; Ran, A.; Yang, C.; Chen, S.; Li, Z.; Zhang, X.; Deng, W.; Liu, T.; Kang, F.; et al. Full-cycle electrochemical-thermal coupling analysis for commercial lithium-ion batteries. Appl. Therm. Eng. 2021, 184, 116258. [Google Scholar] [CrossRef]
- Catenaro, E.; Rizzo, D.M.; Onori, S. Experimental analysis and analytical modeling of Enhanced-Ragone plot. Appl. Eng. 2021, 291, 116473. [Google Scholar] [CrossRef]
- Chen, Z.; Danilov, D.L.; Eichel, R.A.; Notten, P.H.L. Li+ concentration waves in a liquid electrolyte of Li-ion batteries with porous graphite-based electrodes. Energy Storage Mater. 2022, 48, 475–486. [Google Scholar] [CrossRef]


Disclaimer/Publisher’s Note: The statements, opinions and data contained in all publications are solely those of the individual author(s) and contributor(s) and not of MDPI and/or the editor(s). MDPI and/or the editor(s) disclaim responsibility for any injury to people or property resulting from any ideas, methods, instructions or products referred to in the content. |
© 2023 by the authors. Licensee MDPI, Basel, Switzerland. This article is an open access article distributed under the terms and conditions of the Creative Commons Attribution (CC BY) license (https://creativecommons.org/licenses/by/4.0/).