Article

The Blasting Vibration Characteristics of Layered Rock Mass under High-Pressure Gas Impact

1
School of Civil Engineering, Henan Polytechnic University, Jiaozuo 454003, China
2
Henan Key Laboratory Underground Engineering and Disaster Prevention, Jiaozuo 454000, China
*
Author to whom correspondence should be addressed.
Energies 2023, 16(18), 6454; https://doi.org/10.3390/en16186454
Submission received: 4 August 2023 / Revised: 24 August 2023 / Accepted: 30 August 2023 / Published: 6 September 2023
(This article belongs to the Section H: Geo-Energy)

Abstract

:
Firstly, the experimental test of blasting vibration was carried out to study the propagation characteristics of the peak particle velocity (PPV) and dominant frequency (DF) of the blasting vibration of layered rock mass under high-pressure gas impact. The test results show that the PPV and DF of blasting vibration of layered rock mass decrease gradually with the increase in distance from the explosion source. The PPV and DF of layered rock mass under the same impact pressure of high-pressure gas are lower than those of single rock mass at the same measuring points. With the increase in hole spacing, the PPV and DF of blasting vibration become smaller, and the blasting effect first becomes better and then worse. Next, the relationship models between the PPV and DF and their influencing factors were deduced by the dimensional analysis method, which can be simplified as exponential forms that decay with the scaled distance. In addition, through a numerical simulation test, it was found that the optimal hole spacing recommended in an excavation example of an underground pipe gallery is 100 cm. Finally, the blasting vibration effects under the two excavation methods of high-pressure gas impact and explosive blasting were numerically simulated and compared. The results indicate that high-pressure gas impact can significantly reduce the blasting vibration effect of layered rock mass compared with explosive blasting. This study has important theoretical guiding significance and practical value for revealing the propagation law, forecasting and controlling the harm of blasting vibration effect of layered rock mass caused by high-pressure gas impact.

1. Introduction

Traditional explosive blasting technology has the characteristics of high efficiency and low cost, but only about 20–30% of its explosion energy is used to break rock mass in engineering applications [1]. And the remaining energy will inevitably produce some harmful effects on the surrounding environment, such as blasting vibration effect, air overpressure, flyrock, air pollution and backbreak [2]. Among them, the blasting vibration effect is the most common and difficult to control [3,4]. The main cause of the blasting vibration effect is the direct action of blasting vibration waves excited by the explosion source in the propagation medium, which is determined by the parameters of the explosion source and propagation medium [5,6]. The randomness of the blasting source load and the complexity of the propagation medium determine the randomness and uncertainty of blasting vibration characteristics. The study of blasting vibration characteristics is the key link to analyze the mechanism of the blasting vibration effect and control the blasting vibration effect.
The existing research results of blasting vibration characteristics mainly focus on the influencing factors and variation laws of the main characteristic parameters of blasting vibration, mainly including the peak particle velocity (PPV) and dominant frequency (DF). In terms of the influencing factors and variation law of the PPV, many scholars [7,8,9] believe that the distance from the explosion source and the maximum charge per delay are the main influencing factors affecting the PPV, and they studied the variation law of the PPV with the two factors. Chen et al. [10] analyzed the influence of charge length on the attenuation characteristics of the PPV under cylindrical charge blasting. Zhao et al. [11] found that millisecond delay blasting can effectively reduce the PPV of ground vibration by comparing the environmental vibration characteristics caused by delayed blasting and simultaneous blasting. Gorgulu et al. [12] discussed the effect of blasting design parameters and rock properties on the PPV. Uysal et al. [13] studied the influence of the burden on the PPV, and they found that the PPV decreased with the increase in the burden. You et al. [14] studied the attenuation law of the PPV under high in situ stress, and the results show that the existence of an initial stress field has a significant impact on the PPV. Zhu et al. [15] made a detailed analysis of the vibration reduction effect of barrier holes on the PPV with blasting tests.
In terms of the influencing factors and variation law of the DF, Zhou et al. [16] and Alvarez-Vigil et al. [17] studied the attenuation law of the DF, and the results show that the DF attenuates with the increase in the distance from explosion source. Shi and Chen [18] found that the DF of the blasting vibration signal tended to decrease to a certain stable value with the increase in the maximum charge per section. Zhao et al. [19] studied the influence mechanism of the number of initiation sections on the DF, and the results show that the DF increases linearly with the increase in the number of sections. Trivino et al. [20] studied the characteristics of the DF with different initiation ways, and the results show that the spectrum distribution of forward initiation is concentrated and there is an obvious DF band. Yang et al. [21] found that the existence of a blasting free surface will lead to an increase in the DF, and the smaller the minimum burden, the more significant the influence of a free surface on the DF. Sun et al. [22] discussed the effect of the blast hole diameter and decoupling ratio on the DF attenuation and obtained that a smaller blast hole diameter or decoupling ratio leads to a higher initial value and faster attenuation of DF.
Given that the urbanization process and infrastructure construction have now been vigorously accelerated, the blasting industry is ushering in a broader development prospect. At the same time, the blasting technology is facing more complex operations and surrounding environments, such as dense buildings, and the requirements for blasting vibration are stricter. The high-pressure gas blasting represented by liquid CO2 blasting has the outstanding advantages of low vibration, green environmental protection and high safety. It is a powerful construction method supplement when explosive blasting operations cannot be carried out in complex environments. Although the vibration intensity caused by high-pressure gas blasting is low, the blasting vibration effect cannot be ignored because it is used in rock excavation engineering in urban sensitive environments with dense buildings, and its vibration requirements are high. In recent years, researchers at home and abroad have carried out a lot of work on blasting vibration characteristics and their influencing factors, and they have accumulated many useful research results. However, most research results focus on traditional explosive blasting, rarely mentioning high-pressure gas blasting, and there is almost no special research on layered rock mass. China is a vast country with complex and changeable geological conditions. The vertical section of the rock stratum generally presents the significant layered structure characteristics of soft rock in the upper part and hard rock in the lower part. Rock masses with layered structures in nature account for 2/3 of the land surface, and the proportion in China is as high as 77.3%. With the large-scale development of urban tunnels and underground projects in China, a large number of rock excavation projects constructed by the blasting method involve layered rock mass. The existence of interfaces in layered rock mass makes the dynamic mechanical behavior of rock mass and the propagation characteristics of blasting vibration more complex. Therefore, it is necessary to study the characteristics of blasting vibration caused by the excavation of high-pressure gas blasting in layered rock mass.
In this paper, the experimental and numerical simulation tests of blasting vibration of layered rock mass under high-pressure gas impact were carried out to study the characteristics of the PPV and DF of layered rock mass blasting vibration under high-pressure gas impact. This study has important theoretical guiding significance and practical value for revealing the propagation law, forecasting and controlling the harm of blasting vibration effect of layered rock mass caused by high-pressure gas impact.

2. Experimental Study on Blasting Vibration of Layered Rock Mass under High-Pressure Gas Impact

2.1. Experimental Test of Blasting Vibration of Layered Rock Mass

The size of the layered rock sample is 300 mm × 300 mm × 600 mm, in which soft and hard rock mass account for half of the sample, respectively, with hard rock at the bottom and soft rock at the top, as shown in Figure 1a. The mix proportions of the selected soft and hard rock simulation materials are 3:1.1:0.15 and 3:1.3:0.3, respectively, in which the first digit represents fine sand, the second digit represents cement, and the third digit represents gypsum. For soft rock material, 325 cement is used, and 425 cement is used for hard rock material. The measured physical and mechanical parameters of layered rock mass are shown in Table 1. During the fabrication of the layered rock sample, a blast hole with a diameter of 20 mm and a depth of 120 mm shall be reserved at the center of the side of the hard rock part. At the same time, a single rock sample of the same size (300 mm × 300 mm × 600 mm) is made of hard rock simulation material in order to facilitate comparative analysis, and the position, diameter and depth of the reserved blast hole are consistent with those of the layered rock sample, as shown in Figure 1b.
In the experimental test of blasting vibration, the test system of high-pressure gas impact developed by our research team is used to apply the impact load (as shown in Figure 2), and the impact pressure is set to 10 MPa. The fracturing pipe of the test system is 250 mm long and 16 mm in diameter. The blockage length is 40 mm, and the blockage material is a mixture of anchoring adhesive and curing agent. For the layered rock sample, PVDF sensors are pasted at the hole wall bottom, hole wall middle (40 mm from the hole bottom) and hole wall top (80 mm from the hole bottom) of the pressurized section except for the blockage. PVDF, also known as polyvinylidene fluoride, is a sensing material with strong piezoelectricity. And PVDF sensors in the experimental test are used to test the actual impact pressure at the hole wall. According to Ref. [23], the safety threshold of blasting vibration in a single direction shall be subject to the blasting vibration results in the vertical direction. Therefore, the TC-4850 blasting vibration tester is used to test the blasting vibration velocity in the vertical direction of the rock samples. Six measuring points are arranged along the central axis of the top surface of the samples, and the distance between the measuring points and the excavation section is 5 cm, 15 cm, 25 cm, 35 cm, 45 cm and 55 cm, respectively, as shown in Figure 1. The measuring points arranged for the layered rock sample are numbered CZ1, CZ2, CZ3, CZ4, CZ5 and CZ6, and the measuring points arranged for the single rock sample are numbered DZ1, DZ2, DZ3, DZ4, DZ5 and DZ6. The mechanical jack is used to impose displacement constraints on the limiting device of the rock sample in the experimental test of blasting vibration, as shown in Figure 3.

2.2. Experimental Test Results and Analysis

Based on the above experimental test, the time-history pressure curves are obtained at different positions of the hole wall, as shown in Figure 4. And the time-history curves of blasting vibration (velocity) of the layered and single rock samples at six measuring points are obtained. Due to space limitations, the time-history curves of blasting vibration at two representative measuring points are attached here, as shown in Figure 5 and Figure 6.
As can be seen from Figure 4, when the high-pressure gas propagates from the blowhole at the bottom of the fracturing pipe to the bottom of the hole, the impact pressure attenuates the whole process, and the impact pressure at the hole wall bottom is lower than the set initial pressure. The high-pressure gas then propagates from the hole bottom to the hole top, and its flow speed and energy will attenuate during the propagation process. This leads to an obvious attenuation trend of the peak pressure at different parts of the hole wall. That is, the peak pressure at the hole wall bottom is greater than at the hole wall middle and hole wall top. Furthermore, due to the fact that the peak pressure at the hole wall bottom occurs earlier than at the hole wall middle and hole wall top, the rise rate of the pressure curve at the hole wall bottom is higher than at the other two locations. Figures 8 and 9 in Ref. [24] show the time-history curves of hole wall pressure caused by explosive blasting. Comparing Figure 4 in this paper with Figures 8 and 9 in Ref. [24], the similarities and differences between the impact loads of high-pressure gas and explosive blasting can be obtained. The main similarity between the two is that their load time histories show a law of first rising and then falling. The differences between the two are as follows: the peak pressure caused by high-pressure gas impact is lower than that caused by explosive blasting; the time of rising and falling of the hole wall pressure caused by high-pressure gas impact is longer; and generally, the time-history curve of the hole wall pressure caused by high-pressure gas impact has only one peak, while two or more peaks can be observed in the time-history curve caused by explosive blasting.
The PPV and DF of blasting vibration at all measuring points of the layered and single rock samples are summarized in Table 2, and the variation curves of blasting vibration at all measuring points are drawn, respectively, as shown in Figure 7. By observing and analyzing Table 2 and Figure 7, the following laws can be obtained:
(1)
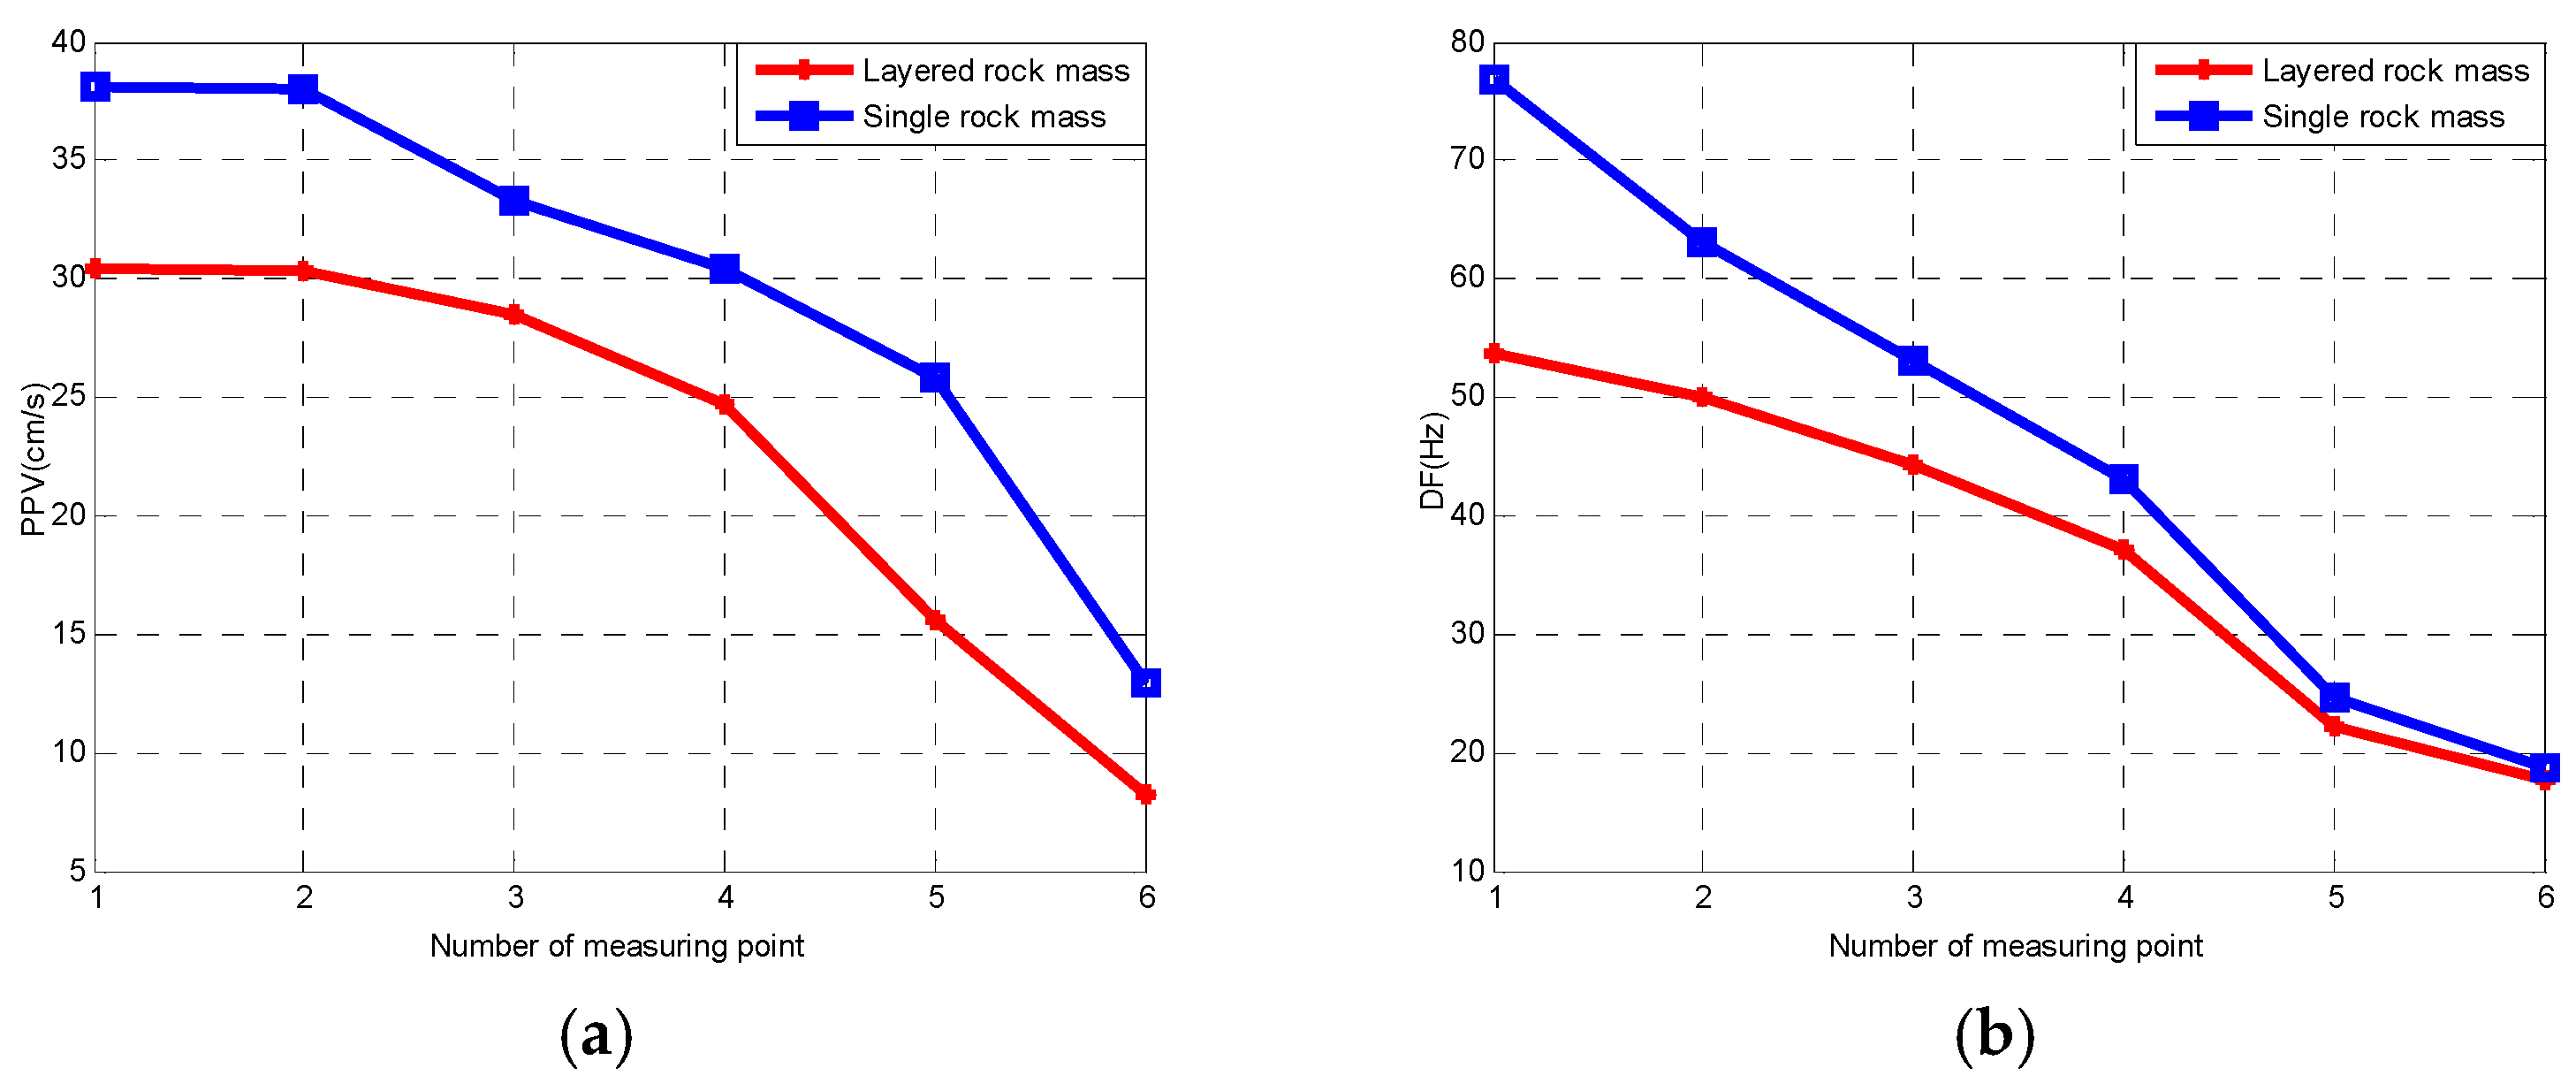
Under high-pressure gas impact, the PPV and DF of blasting vibration of layered and single rock masses decrease gradually with the increase in distance from the explosion source. From measuring point CZ1 to measuring point CZ6, the PPV of blasting vibration decreases from 30.45 cm/s to 8.24 cm/s, and the DF of blasting vibration decreases from 53.69 Hz to 17.60 Hz. This is because the impact energy from the high-pressure gas is continuously consumed during the propagation process in the medium, ultimately leading to a continuous decrease in the PPV and DF of blasting vibration.
(2)
Under the same impact pressure of high-pressure gas, the PPV of blasting vibration of layered rock mass is lower than that of single rock mass at each measuring point, which is mainly due to the vibration-amplitude reduction effect of layered rock mass at the interface of soft and hard rock.
The vibration-amplitude reduction rate at the measuring point i is defined here:
η i = v i d v i c v i d × 100 %
where v i d is the PPV of blasting vibration at the measuring point i of the single rock sample, and v i c is the PPV of blasting vibration at the measuring point i of the layered rock sample.
The vibration-amplitude reduction rates from measuring point CZ1 to measuring point CZ6 are calculated as 20.0%, 20.0%, 14.6%, 18.9%, 39.6% and 36.3%, respectively, with an average value of 24.9%. This shows that compared with single rock mass, the phenomenon of reducing the amplitude of blasting vibration under high-pressure gas impact is more obvious due to the existence of an interface in the layered rock mass. This can provide ideas for further research and utilization of the reducing effect of rock joints with different quantities and parameters on the amplitude of blasting vibration.
(3)
Under the same impact pressure of high-pressure gas, the DF of blasting vibration of layered rock mass is lower than that of single rock mass at each measuring point, which is mainly due to the vibration-frequency reduction effect of layered rock mass at the interface of soft and hard rock.
The vibration-frequency reduction rate at the measuring point i is defined here:
ζ i = f i d f i c f i d × 100 %
where f i d is the DF of blasting vibration at the measuring point i of the single rock sample, and f i c is the PPV of blasting vibration at the measuring point i of the layered rock sample.
The vibration-frequency reduction rates from measuring point CZ1 to measuring point CZ6 are calculated as 30.2%, 20.8%, 16.6%, 14.1%, 10.2% and 5.4%, respectively, with an average value of 16.2%. This shows that compared with single rock mass, the phenomenon of reducing the frequency of blasting vibration under high-pressure gas impact is more obvious due to the existence of an interface in the layered rock mass. This can provide ideas for further research and utilization of the reducing effect of rock joints with different quantities and parameters on the frequency of blasting vibration.
(4)
Whether the layered rock sample or the single rock sample, there is little difference between the PPV of blasting vibration at the measuring point C(D)Z1 and measuring point C(D)Z2, which is mainly due to the equal distance between the two measuring points and the bottom of the blast hole.

3. Blasting Vibration Models of Layered Rock Mass by Dimensional Analysis Method

3.1. PPV Model of Blasting Vibration by Dimensional Analysis Method

Dimensional analysis is a mathematical analysis method that can not only correctly determine the relationship between various physical quantities but also verify the correctness of the relationship models between physical quantities and influencing factors [25]. The dimensions of physical quantities are divided into basic dimensions and derived dimensions. In the International System of Units (SI), there are seven basic dimensions, including length, mass, time, thermodynamic temperature, amount of substance, current and luminous intensity. These seven basic dimensions are completely independent of each other, represented as L, M, T, Θ, N, I and J. Derived dimensions are dimensions derived from seven basic dimensions. The dimension of any physical quantity can be expressed as a functional relationship of the product of basic dimensions, where the relationship contains unknown dimensional indices. Then, using π theorem of dimensional analysis, which means that the dimensions on both sides of the functional relationship must be consistent, the unknown dimensional indices can be determined. The above is the basic idea of the dimensional analysis method.
In order to further analyze the blasting vibration propagation characteristics of layered rock mass under high-pressure gas impact, the dimensional analysis method is used to deduce the relationship models between the PPV and DF of blasting vibration and their various influencing factors. The main factors affecting the PPV and DF of blasting vibration in this paper are shown in Table 3, which are the initial impact pressure of high-pressure gas, distance from the explosion source, blast hole radius, density of soft rock, P-wave velocity of soft rock, density of hard rock and P-wave velocity of hard rock.
Firstly, the relationship model between the PPV of blasting vibration and its influencing factors is deduced.
According to variables P, R, r, Cp1, Vmax, ρ 1 , ρ 2 and Cp2, the dimensional coefficient matrix can be sorted into the following form:
A = [ 1 0 0 0 0 1 1 0 1 1 1 1 1 3 3 1 2 0 0 1 1 0 0 1 ] M L T
Since the rank of matrix A is 3, that is, there are three basic dimensions, the number of dimensionless quantities (physical quantities without units) is 8 − 3 = 5.
The following homogeneous equations are generated from the dimensional coefficient matrix:
[ 1 0 0 0 0 1 1 0 1 1 1 1 1 3 3 1 2 0 0 1 1 0 0 1 ] [ x 1 x 2 x 3 x 4 x 5 ] = 0
By solving the above equations, the following solutions can be obtained:
x 1 = [ 0 1 1 0 0 0 0 0 ] , x 2 = [ 0 0 0 1 1 0 0 0 ] , x 3 = [ 1 0 0 2 0 1 0 0 ] , x 4 = [ 1 0 0 2 0 0 1 0 ] , x 5 = [ 0 0 0 1 0 0 0 1 ]
Then, the five independent dimensionless quantities can be obtained:
{ π 1 = r 1 R π 2 = C p 1 1 V max π 3 = P 1 C p 1 2 ρ 1 π 4 = P 1 C p 1 2 ρ 2 π 5 = C p 1 1 C p 2
According to π theorem, the following PPV model of blasting vibration can be obtained:
V max = k ( R r ) α 1 ( ρ 1 C p 1 2 P ) α 2 ( ρ 2 C p 2 2 P ) α 3 ( C p 2 C p 1 ) α 4 C p 1
According to the basic relationships between the PPV of blasting vibration and its influencing factors, it can be inferred that in Equation (7), k is positive; α 1 , α 2 and α 3 are negative; and the sign of α 4 is undetermined. Based on Equation (7), the influence of various factors on the PPV of blasting vibration can be further explained as follows:
(1)
Define the scaled distance: R ¯ = R / r ; then the PPV of blasting vibration is inversely proportional to the scaled distance. If the blast hole radius (r) remains unchanged, the PPV of blasting vibration is inversely proportional to the distance from the explosion source (R). That is, the farther the measuring point is from the explosion source, the smaller the PPV of blasting vibration;
(2)
The PPV of blasting vibration is directly proportional to the initial pressure of high-pressure gas (P) and inversely proportional to the product ( ρ 1 C p 1 2 )of the wave impedance ( ρ 1 C p 1 ) and P-wave velocity of soft rock ( C p 1 ) and that of hard rock ( ρ 2 C p 2 2 );
(3)
The PPV of blasting vibration is linearly proportional to the P-wave velocity of soft rock ( C p 1 ) and nonlinearly exponential to the P-wave velocity ratio of hard and soft rock ( C p 2 / C p 1 );
(4)
When the explosion source factors, including the initial pressure of high-pressure gas (P) and the blast hole radius (r), and the rock mass factors, including the density of soft rock ( ρ 1 ), P-wave velocity of soft rock ( C p 1 ), density of hard rock ( ρ 2 ) and P-wave velocity of hard rock ( C p 2 ), remain unchanged, Equation (7) can be further simplified into the following formula:
V max = K ( R ¯ ) α
where K and α are undetermined coefficients, and the sign of the two coefficients is positive.
Equation (8) only has two unknown coefficients. If some PPV test data of blasting vibration of layered rock mass can be obtained, it is easy to fit a specific PPV model. Then, the fitted model can be used to predict the PPV of any measuring point.
The PPV results of the blasting vibration of layered rock mass in Table 2 are sorted according to the corresponding scaled distance. Since measuring point CZ1 and measuring point CZ2 are symmetrically distributed from the bottom of the blast hole, the test results of measuring points CZ2, CZ3, CZ4, CZ5 and CZ6 are selected to be fitted based on Equation (8). The fitted PPV model of blasting vibration of layered rock mass under high-pressure gas impact is as follows:
V max = 578.5 ( R r ) 1.62 ( R 2 = 0.8121 )
Affected by the test conditions and various uncontrollable factors in the test process, the test data cannot reach the completely ideal conditions. However, the determination coefficient (R2) of the PPV model of layered rock mass fitted with the test data is still large (0.8121), and the goodness of fitting is high. It shows that the PPV model of blasting vibration of layered rock mass under high-pressure gas impact deduced by the dimensional analysis method is feasible.

3.2. DF Model of Blasting Vibration by Dimensional Analysis Method

The factors affecting the DF of blasting vibration and their dimensions are shown in Table 3. Using the same dimensional analysis method above, the following DF model of blasting vibration can be deduced and obtained:
f = k ( R r ) β 1 ( ρ 1 C p 1 2 P ) β 2 ( ρ 2 C p 2 2 P ) β 3 ( C p 2 C p 1 ) β 4 r 1 C p 1
According to the basic relationships between the DF of blasting vibration and its influencing factors, it can be inferred that in Equation (10), k is positive, β 1 , β 2 and β 3 are negative, and the sign of β 4 is undetermined. Based on Equation (10), the influence of various factors on the DF of blasting vibration can be further explained as follows:
(1)
The DF of blasting vibration is inversely proportional to the scaled distance. If the blast hole radius (r) remains unchanged, the DF of blasting vibration is inversely proportional to the distance from the explosion source (R); that is, the farther the measuring point is from the explosion source, the smaller the DF of blasting vibration;
(2)
The DF of blasting vibration is directly proportional to the initial pressure of high-pressure gas (P) and inversely proportional to the product of the wave impedance and P-wave velocity of soft rock ( ρ 1 C p 1 2 ) and that of hard rock ( ρ 2 C p 2 2 );
(3)
The DF of blasting vibration is inversely linearly proportional to the blast hole radius (r), directly linearly proportional to the P-wave velocity of soft rock ( C p 1 ) and nonlinearly exponential to the P-wave velocity ratio of hard and soft rock ( C p 2 / C p 1 );
(4)
When the explosion source factors, including the initial pressure of high-pressure gas (P) and the blast hole radius (r), and the rock mass factors, including the density of soft rock ( ρ 1 ), P-wave velocity of soft rock ( C p 1 ), density of hard rock ( ρ 2 ) and P-wave velocity of hard rock ( C p 2 ), remain unchanged, Equation (14) can be further simplified into the following formula:
f = K ( R ¯ ) α
where K and α are undetermined coefficients, and the sign of the two coefficients is positive.
Equation (11) only has two unknown coefficients. If some DF test data of blasting vibration of layered rock mass can be obtained, it is easy to fit a specific DF model. Then, the fitted model can be used to predict the DF at any measuring point.
The DF results of blasting vibration of layered rock mass in Table 2 are sorted according to the corresponding scaled distance, and the results of measuring points CZ2, CZ3, CZ4, CZ5 and CZ6 are selected to be fitted based on Equation (11). The fitted DF model of blasting vibration of layered rock mass under high-pressure gas impact is as follows:
f = 4433.3 ( R r ) 1.40 ( R 2 = 0.9394 )
The determination coefficient (R2) of the DF model of layered rock mass fitted with the test data is still large (0.9394), and the goodness of fitting is high. It shows that the DF model of blasting vibration of layered rock mass under high-pressure gas impact deduced by the dimensional analysis method is feasible.

4. Numerical Simulation Study on the Blasting Vibration of Layered Rock Mass under High-Pressure Gas Impact

4.1. Feasibility Analysis on Numerical Simulation Test of Blasting Vibration of Layered Rock Mass

Based on the above experimental test of blasting vibration of layered rock mass under high-pressure gas impact, the numerical simulation test under the same working condition is carried out by LS-DYNA. And it is proposed to verify the feasibility of the numerical simulation test by comparing and analyzing the results of experimental and numerical simulation tests.
In the numerical simulation test of blasting vibration of layered rock mass, the RHT (Riedel–Hiermaier–Thoma) constitutive model is selected for soft rock and hard rock materials in layered rock mass. Most parameters of the RHT constitutive model are determined according to the tested physical and mechanical parameters of layered rock mass in Table 1, such as ro, shear, b0, b1, t1, fc, fs*, ft*, βc, βt, a1, a2, a3 and pel. Since the other parameters such as gc*, pcomp, af, nf, a, q0, n, epm, d1 and xi are not easy to obtain by test [26], the corresponding parameters of the concrete material model are adopted for them through the keyword *MAT_RHT in the K file. The RHT model parameters of soft and hard rock materials are shown in Table 4 and Table 5. A linear polynomial equation of state is adopted for air material, and the parameters of the air material model are shown in Table 6.
The numerical simulation model is established by the fluid–solid coupling method. The layered rock adopts the Lagrange algorithm, and the air and blockage adopt the ALE (Arbitrary Lagrange–Euler) algorithm. The mesh around the blast hole is encrypted. The high-pressure gas impact is realized by applying the measured time-history pressure data (shown in Figure 4) onto the three equal sections of the hole wall elements through the keyword *DEFINE_CURVE in the K file. The loading diagram of the hole wall pressure is shown in Figure 8.
Corresponding to the measuring points in the experimental test of blasting vibration, the six same measuring points of blasting vibration in the vertical (Y-axis) direction are extracted in the numerical simulation test. The simulation results of the PPV and DF of blasting vibration are compared with the experimental results, as shown in Table 7. In order to distinguish from the number of measuring points in the experimental test, the capital letter M is added before the number of measuring points in the numerical simulation test.
It can be seen from Table 7 that the PPV and DF results of blasting vibration in the experimental and numerical simulation tests have the same change trend that decreases with the increase in the distance from the explosion source. The main propagation characteristics of the PPV and DF of blasting vibration of layered rock mass are well reflected. For the PPV and DF, the simulation results are higher than the experimental results. For the PPV, the relative error from measuring point (M)CZ1 to measuring point (M)CZ6 is reduced from 35% to 11%, and the average error is 25%. For the DF, the relative error from measuring point (M)CZ1 to measuring point (M)CZ6 is reduced from 48% to 15%, and the average error is 33%.
The relative errors between the PPV and DF results of blasting vibration in the experimental and numerical simulation tests are small, so the model establishing and solving method of the numerical simulation test of blasting vibration in this paper is reasonable and feasible, and the same method can be used to carry out the subsequent numerical simulation test.

4.2. Analysis of the Blasting Vibration Characteristics of Layered Rock Mass

Here, the underground pipe gallery model constructed by the underground excavation method in layered rock mass in the county of Fuzhou is taken as the numerical simulation object. The specific project overview is as follows.
The excavation section area of the underground pipe gallery is 42.8 m2. Without considering the plain fill layer, there are two layers of different types of rock mass from the ground surface to the bottom of the pipe gallery. They are 4 m thick completely weathered granite and 6 m thick sandy strongly weathered granite, respectively. The granite in the excavation area is hard, so mechanical excavation is not suitable. The surrounding environment of the pipe gallery is complex. There are residential buildings near the ground surface, and the blasting vibration standard needs to be strictly controlled. The numerical simulation test of CO2 phase-change blasting with double holes is carried out in order to provide theoretical guidance for the construction scheme of high-pressure gas blasting in the layered rock mass. The size of the numerical model is 10 m × 10 m × 10 m, and the middle part of the lower rock mass is the excavation area. Two blast holes are drilled, of which the hole diameter is 110 mm, the hole spacing is 60 cm, and the hole depth is 1.5 m. One CO2 fracturing pipe is placed in each blast hole, with a pipe length of 0.6 m, a gas filling capacity of 2.8 kg, a constant impact pressure of 200 MPa and a blockage length of 0.9 m.
According to the above model establishing a method of the numerical simulation test, the double-hole model of layered rock mass under high-pressure gas blasting is established. Some material parameters of layered rock mass are shown in Table 8 [27]. In this paper, the piecewise exponential model of hole wall pressure is adopted, which was fitted by our team based on multiple experimental tests of hole wall pressure under high-pressure gas impact. Considering the running time of the numerical model, the pressure duration is taken as 1.5 s, and then the following three-hole wall pressure models are applied to the three equal sections of the hole wall elements:
p ( t ) = { 165.74 [ e 0.9 t e ( 1.92 8.22 i ) t ] 287.03 e ( 1.17 0.28 i ) t ( 0 t 0.3040 ) ( 0.3040 t 1.5 ) ( Hole wall bottom )
p ( t ) = { 68.62 [ e 0.82 t e ( 2.35 8.77 i ) t ] 106.91 e ( 0.93 0.16 i ) t ( 0 t 0.2840 ) ( 0.2840 t 1.5 ) ( Hole wall middle )
p ( t ) = { 42.10 [ e 0.73 t e ( 2.51 9.01 i ) t ] 63.57 e ( 0.78 0.15 i ) t ( 0 t 0.2780 ) ( 0.2780 t 1.5 ) ( Hole wall top )
As shown in Figure 9, taking the hole bottom section of the numerical model (Z = −150 cm) as the center, seven measuring points are arranged at the corresponding ground surface 0.5 m, 1.5 m, 2.5 m, 3.5 m, 4.5 m, 5.5 m and 6.5 m away from the section along the excavation direction (Z-axis direction), numbered D1, D2, D3, D4, D5, D6 and D7 in turn. The time-history curves of blasting vibration in the Y-axis (vertical) direction at the seven measuring points are extracted, as shown in Figure 10. Limited by the computer’s too-long operation time, the duration is intercepted for 1.5 s. The PPV and DF results of blasting vibration at seven measuring points are summarized in Table 9.
Based on Equations (8) and (11) deduced by the dimensional analysis method in Section 3, the PPV model of blasting vibration can be fitted by using the data in Table 9 as follows:
V max = 21056 ( R r ) 1.96 ( R 2 = 0.9906 )
And the fitted DF model of blasting vibration is
f = 609.05 ( R r ) 0.33 ( R 2 = 0.9777 )
It can be seen from Equations (16) and (17) that the PPV and DF models of blasting vibration deduced by dimensional analysis method are also applicable in a large range of scaled distance (120–180), and the goodness of fitting is very high. It further shows that the model forms of Equations (8) and (11) can be used to predict and analyze the characteristics of blasting vibration of layered rock mass under high-pressure gas impact.

4.3. Influence of Hole Spacing on Characteristics of Blasting Vibration

In addition to the working condition with a hole spacing of 60 cm, the numerical simulation tests of layered rock mass with a hole spacing of 80 cm, 100 cm and 120 cm are carried out under the condition of keeping other parameters in the above engineering example unchanged. Seven measuring points at the same position in Section 4.2 are selected to extract the PPV and DF of blasting vibration of the four working conditions with different hole spacing, which are summarized in Table 10 and Table 11.
The PPV and DF models of blasting vibration with a hole spacing of 60 cm have been fitted above, as shown in Equations (16) and (17). Based on the data in Table 10 and Table 11, the PPV and DF models of blasting vibration with a hole spacing of 80 cm, 100 cm and 120 cm are continuously fitted, respectively. The PPV and DF variation curves of blasting vibration with different hole spacing are shown in Figure 11 and Figure 12.
The fitted PPV model of blasting vibration with a hole spacing of 80 cm is
V max = 22924 ( R r ) 2.07 ( R 2 = 0.9869 )
The fitted PPV model of blasting vibration with a hole spacing of 100 cm is
V max = 24322 ( R r ) 2.19 ( R 2 = 0.9998 )
The fitted PPV model of blasting vibration with a hole spacing of 120 cm is
V max = 31501 ( R r ) 2.48 ( R 2 = 0.9725 )
The fitted DF model of blasting vibration with a hole spacing of 80 cm is
f = 788.60 ( R r ) 0.39 ( R 2 = 0.9955 )
The fitted DF model of blasting vibration with a hole spacing of 100 cm is
f = 928.82 ( R r ) 0.44 ( R 2 = 0.9965 )
The fitted DF model of blasting vibration with a hole spacing of 120 cm is
f = 981.80 ( R r ) 0.47 ( R 2 = 0.9938 )
By observing Figure 11 and Figure 12 and Equations (16)–(23), it can be seen that the PPV and DF attenuation laws of blasting vibration with different hole spacing highly conform to the basic forms of the models deduced by the dimensional analysis method. In addition to the experimental results, the exponential attenuation characteristics of the two main parameters of blasting vibration with respect to the scaled distance are proved again by the numerical simulation results. That is, with the increase in the scaled distance, the PPV and DF of blasting vibration show the law of exponential attenuation. At the same time, it is found that with the increase in hole spacing, the PPV and DF of blasting vibration at each corresponding measuring point become smaller, and the attenuation degree of PPV is greater. Comparing the PPV of blasting vibration at each measuring point with different hole spacing, it is 1.57 cm/s at measuring point D1 and attenuates to 0.84 cm/s at measuring point D7 with a hole spacing of 60 cm. It is 1.00 cm/s at measuring point D1 and attenuates to 0.54 cm/s at measuring point D7 with a hole spacing of 80 cm. It is 0.58 cm/s at measuring point D1 and attenuates to 0.30 cm/s at measuring point D7 with a hole spacing of 100 cm. It is 0.19 cm/s at measuring point D1 and attenuates to 0.09 cm/s at measuring point D7 with a hole spacing of 120 cm. Comparing the DF of blasting vibration at each measuring point with different hole spacing, it is 125.3 Hz at measuring point D1 and attenuates to 112.9 Hz at measuring point D7 with a hole spacing of 60 cm. It is 119.3 Hz at measuring point D1 and attenuates to 106.2 Hz at measuring point D7 with a hole spacing of 80 cm. It is 108.7 Hz at measuring point D1 and attenuates to 94.6 Hz at measuring point D7 with a hole spacing of 100 cm. It is 99.8 Hz at measuring point D1 and attenuates to 86 Hz at measuring point D7 with a hole spacing of 120 cm.
Comparing the regression coefficients of the fitted PPV models of blasting vibration with a different hole spacing of 60 cm, 80 cm, 100 cm and 120 cm, the coefficients K are 21,056, 22,924, 24,322 and 31,501, respectively, and the coefficients α are 1.96, 2.07, 2.19 and 2.48, respectively. It shows that the larger the hole spacing is, the more significant the attenuation of the PPV of blasting vibration is. Comparing the regression coefficients of the fitted DF models of blasting vibration with a different hole spacing of 60 cm, 80 cm, 100 cm and 120 cm, the coefficients K’ are 609.05, 788.60, 928.82 and 981.80, respectively, and the coefficients α’ are 0.33, 0.39, 0.44 and 0.47, respectively. It shows that the larger the hole spacing is, the more significant the attenuation of the DF of blasting vibration is. Within the distance from the explosion source of no more than 10 m, the PPV results of blasting vibration under four hole-spacing conditions of 60 cm, 80 cm, 100 cm and 120 cm have attenuated to less than 1 cm/s, and the DF results are about 100 Hz. Considering the blasting-vibration allowable standard of ground buildings, all four blasting schemes under four hole-spacing conditions meet the standard.
Then, the blasting effect is further considered, and the stress nephogram (in Y-axis and Z-axis direction) obtained from the simulation results under four hole-spacing conditions are shown in Figure 13. As shown in Figure 13, when the hole spacing is 60 cm and 80 cm, respectively, the red oval high-stress area between the two holes is densely connected, which corresponds to the macro crack-expansion area. Generally, the blasting fragmentation is small, and the energy utilization rate is not high under these two working conditions, but the blasting effect tends to be better with the increase in hole spacing. When the hole spacing is 100 cm, the red oval high-stress area is formed around the respective holes without intersection, and the green low-stress area forms a connection, which corresponds to the micro crack-expansion area. It shows that the blasting effect is better under this working condition. When the hole spacing increases to 120 cm, most of the cracks in the green low-stress area between the two holes are around their respective blast holes, which cannot form effective crack penetration, and only a few are connected. It shows that the blasting effect is poor under this working condition. In conclusion, considering the allowable standard of blasting vibration and blasting effect at the same time, the optimal hole spacing recommended in the engineering example is 100 cm.

5. Comparison of Blasting Vibration Effects under High-Pressure Gas Impact and Explosive Blasting

The same underground pipe gallery model in layered rock mass in Section 4.2 is used here, and the blasting vibration effects under the two excavation methods of high-pressure gas impact and explosive blasting are numerically simulated and compared. In the numerical model under high-pressure gas impact, the parameters of a single blast hole are the same as those in Section 4.2, except that the two blast holes are changed to four. Four holes are simultaneously detonated, and the hole spacing is taken as 100 cm, which is the optimal hole spacing determined in Section 4.3. The layout of blast holes and the location of extracted measurement points on the ground surface are shown in Figure 14. In the numerical model under explosive blasting, the number of holes, hole spacing, hole depth, blockage length and the center position of the hole layout are the same as those of the model under high-pressure gas impact. The explosive is an emulsion explosive; its density is 1200 kg/m3, its detonation velocity is 3200 m/s, and its parameters of the JWL equation of state are shown in Table 12 [28]. The diameter of the four blast holes for explosive blasting is 42 mm, the charge diameter is 32 mm (decoupled charge), and the charge weight of each hole is 0.6 kg. Similarly, the method of simultaneous initiation of four holes is adopted. Due to the two excavation methods being compared belonging to two completely different blasting methods, the above parameters are determined based on the premise that the cross-sectional area and footage of cut excavation are the same; that is, the effect of cut blasting is the same. For the established numerical models under high-pressure gas impact and explosive blasting, the time-history curves of blasting vibration velocity (in the vertical direction) at the same measurement points are extracted, respectively, as shown in Figure 15 and Figure 16. The PPV and DF of blasting vibration velocity at each measuring point under high-pressure gas impact and explosive blasting are obtained, as shown in Table 13.
It can be seen from Figure 15 and Figure 16 that the waveforms of the ground vibration caused by high-pressure gas impact and explosive blasting have certain similarities. Calculate the ratios of PPV at each measuring point under high-pressure gas impact and explosive blasting in Table 13, and they are 1:3.64, 1:5.34 and 1:3.98, respectively. It shows that the PPV of blasting vibration of layered rock mass caused by high-pressure gas impact is much smaller than that caused by explosive blasting. Compare the DF results at each measuring point under high-pressure gas impact and explosive blasting in Table 13, and the former is 38.5 Hz, 47.1 Hz and 46.9 Hz higher than the latter, respectively. It shows that the blasting vibration frequency caused by the high-pressure gas impact is higher, which is further away from the natural vibration frequency of the protected buildings, and the ground vibration effect is smaller. Therefore, compared with explosive blasting, the high-pressure gas impact can significantly reduce the blasting vibration effect of layered rock mass under the premise of the same cutting blasting effect.

6. Conclusions

Based on the experimental test by the high-pressure gas impact test system and numerical simulation by LS-DYNA, the propagation characteristics of the PPV and DF of blasting vibration of layered rock mass caused by high-pressure gas impact were analyzed. The main conclusions are as follows:
(1)
Under high-pressure gas impact, the PPV and DF of blasting vibration of layered rock mass decrease gradually with the increase in distance from the explosion source;
(2)
Under the same impact pressure of high-pressure gas, the PPV and DF of blasting vibration of layered rock mass are lower than those of single rock mass at the same measuring points due to the amplitude reduction and high-frequency filtering at the interface of soft and hard rock of layered rock mass. This can provide ideas for further research and utilization of the reducing effect of rock joints with different quantities and parameters on the amplitude and frequency of blasting vibration;
(3)
The relationship models between the PPV and DF of blasting vibration of layered rock mass under high-pressure gas blasting and their influencing factors were deduced by the dimensional analysis method. And the feasibility of the two proposed models was verified by the results of the experimental and numerical simulation tests;
(4)
With the increase in hole spacing, the blasting effect first becomes better and then worse, and the PPV and DF of blasting vibration become smaller. Considering the allowable standard of blasting vibration and blasting effect at the same time, the optimal hole spacing recommended in the engineering example in this paper is 100 cm;
(5)
Due to the lower peak pressure and longer duration of the hole wall pressure caused by high-pressure gas impact, high-pressure gas impact causes smaller PPV and larger DF compared with explosive blasting. Therefore, compared with explosive blasting, high-pressure gas impact can significantly reduce the blasting vibration effect of layered rock mass under the premise of the same cutting blasting effect;
(6)
Due to the limited experimental conditions, urgent time and other factors, this paper has some shortcomings that need to be further studied. Only the small-scale model test of horizontal layered rock mass with upper soft rock and lower hard rock under single-hole high-pressure gas impact is carried out in this paper. This will result in certain errors between the experimental results and the actual results, which, to some extent, affects the generalizability of the conclusions drawn based on the experimental results. More large-scale model tests of layered rock mass with different mix-proportion materials, different layered dip angles and more layers need to be further carried out to obtain experimental results that are closer to the actual results in engineering. The PPV and DF models of blasting vibration deduced by the dimensional analysis method, which contains more influencing factors, need to be further verified and applied. Numerical simulation tests of blasting vibration of layered rock mass under high-pressure gas blasting with multi-hole and millisecond conditions need to be carried out to obtain more and better blasting parameters.

Author Contributions

Conceptualization, H.W. and D.L.; methodology, H.W. and H.C.; software, J.Z.; validation, H.W.; formal analysis, H.W.; investigation, D.L.; resources, X.Y.; data curation, J.Z.; writing—original draft preparation, H.W. and J.Z.; writing—review and editing, D.L.; visualization, J.Z. and D.L.; supervision, X.Y. and H.C.; project administration, X.Y. All authors have read and agreed to the published version of the manuscript.

Funding

This paper is supported by the National Natural Science Foundation of China (Grant Nos. 51874123 and 51504082) and the opening project of Henan Key Laboratory of Underground Engineering and Disaster Prevention (Henan Polytechnic University) (No. KFKT 2022-02).

Data Availability Statement

The data in this manuscript have been presented in Table 1, Table 2, Table 3, Table 4, Table 5, Table 6, Table 7, Table 8, Table 9, Table 10, Table 11, Table 12 and Table 13.

Acknowledgments

The authors thank the anonymous reviewers for their remarks, which improved the paper.

Conflicts of Interest

The authors declare no conflict of interest. The authors declare that they have no known competing financial interests or personal relationships that could appear to have influenced the work reported in this paper.

References

  1. Khandelwal, M.; Monjezi, M. Prediction of flyrock in open pit blasting operation using machine learning method. Int. J. Min. Sci. Technol. 2013, 23, 313–316. [Google Scholar] [CrossRef]
  2. Wei, H.X.; Chen, J.F.; Zhu, J.; Yang, X.L.; Chu, H.B. A novel algorithm of Nested-ELM for predicting blasting vibration. Eng. Comput. 2022, 38, 1241–1256. [Google Scholar] [CrossRef]
  3. Cardu, M.; Coragliotto, D.; Oreste, P. Analysis of predictor equations for determining the blast-induced vibration in rock blasting. Int. J. Min. Sci. Technol. 2019, 29, 905–915. [Google Scholar] [CrossRef]
  4. Xu, S.D.; Li, Y.H.; Liu, J.P.; Zhang, F.P. Optimization of blasting parameters for an underground mine through prediction of blasting vibration. J. Vib. Control 2019, 25, 1585–1595. [Google Scholar] [CrossRef]
  5. Mohamed, M.T. Performance of fuzzy logic and artificial neural network in prediction of ground and air vibrations. Int. J. Rock Mech. Min. Sci. 2011, 48, 845–851. [Google Scholar] [CrossRef]
  6. Ghasemi, E.; Ataei, M.; Hashemolhosseini, H. Development of a fuzzy model for predicting ground vibration caused by rock blasting in surface mining. J. Vib. Control 2012, 19, 755–770. [Google Scholar] [CrossRef]
  7. Monjezi, M.; Hasanipanah, M.; Khandelwal, M. Evaluation and prediction of blast-induced ground vibration at Shur River Dam, Iran, by artificial neural network. Neural Comput. Appl. 2013, 22, 1637–1643. [Google Scholar] [CrossRef]
  8. Amiri, M.; Amnieh, H.B.; Hasanipanah, M.; Khanli, L.M. A new combination of artificial neural network and K-nearest neighbors models to predict blast-induced ground vibration and air-overpressure. Eng. Comput. 2016, 32, 631–644. [Google Scholar] [CrossRef]
  9. Armaghani, D.J.; Hasanipanah, M.; Amnieh, H.B.; Mohamad, E.T. Feasibility of ICA in approximating ground vibration resulting from mine blasting. Neural Comput. Appl. 2018, 29, 457–465. [Google Scholar] [CrossRef]
  10. Chen, S.H.; Wu, J.; Zhang, Z.H. Blasting vibration characteristics and PPV calculation formula considering cylindrical charge length. Environ. Earth Sci. 2017, 76, 674. [Google Scholar] [CrossRef]
  11. Zhao, K.; Zhao, D.F.; Zhang, D.; Zhuang, H.Y.; Chen, G.X. Characteristics of environmental vibration induced by millisecond-delay blasting in metro tunnel excavation. Explos. Shock Waves 2020, 40, 105201. [Google Scholar] [CrossRef]
  12. Gorgulu, K.; Arpaz, E.; Uysal, O.; Duruturk, Y.S.; Yuksek, A.G.; Kocaslan, A.; Dilmac, M.K. Investigation of the effects of blasting design parameters and rock properties on blast-induced ground vibrations. Arab. J. Geosci. 2015, 8, 4269–4278. [Google Scholar] [CrossRef]
  13. Uysal, O.; Arpaz, E.; Berber, M. Studies on the effect of burden width on blast-induced vibration in open-pit mines. Environ. Geol. 2007, 53, 643–650. [Google Scholar] [CrossRef]
  14. You, Y.Y.; Cui, Z.R.; Li, E.B. Numerical simulation on variation characteristics of blasting vibration particle peak velocity under high in-situ stress. Blasting 2020, 37, 36–42. [Google Scholar] [CrossRef]
  15. Zhu, J.B.; Zhao, R.; Li, Y.S.; Ma, Y.K.; Wang, J.X.; Peng, Q.; Guo, J. Experimental study of vibration reduction effect of barrier holes under blasting. Rock Mech. Rock Eng. 2023, 56, 1185–1198. [Google Scholar] [CrossRef]
  16. Zhou, J.R.; Lu, W.B.; Zhong, D.W.; Wu, L.; Leng, Z.D.; Yang, W.G. Attenuation characteristics of vibration frequency induced by vertical borehole blasting. Blasting 2019, 36, 14–20. [Google Scholar] [CrossRef]
  17. Alvarez-Vigil, A.E.; Gonzalez-Nicieza, C.; Lopez Gayarre, F.; Alvarez-Fernandez, M.I. Predicting blasting propagation velocity and vibration frequency using artificial neural networks. Int. J. Rock Mech. Min. Sci. 2012, 55, 108–116. [Google Scholar] [CrossRef]
  18. Shi, X.Z.; Chen, S.R. Explosive blasted per delay and burden effects on the time frequency characteristic of vibration induced by blast. J. China Coal Soc. 2009, 34, 345–349. [Google Scholar] [CrossRef]
  19. Zhao, M.S.; Liang, K.S.; Yu, D.Y.; Ren, S.F. Effect of segments on time frequency characteristics of blasting vibration signals. J. China Coal Soc. 2012, 37, 55–61. [Google Scholar] [CrossRef]
  20. Trivino, L.F.; Mohanty, B.; Milkereit, B. Seismic waveforms from explosive sources located in boreholes and initiated in different directions. J. Appl. Geophys. 2012, 87, 81–93. [Google Scholar] [CrossRef]
  21. Yang, J.H.; Lu, W.B.; Yan, P.; Jiang, Q.H.; Zhou, C.B. Influences of blast-created free surfaces on blasting vibration frequencies during full-face excavation. J. Vib. Shock 2016, 35, 192–197. [Google Scholar] [CrossRef]
  22. Sun, P.C.; Lu, W.B.; Zhou, J.R.; Huang, X.C.; Chen, M.; Li, Q. Comparison of dominant frequency attenuation of blasting vibration for different charge structures. J. Rock Mech. Geotech. Eng. 2022, 14, 448–459. [Google Scholar] [CrossRef]
  23. Chen, S.; Pang, H. Prediction and Control of Blasting Disasters; China Coal Industry Publishing House: Beijing, China, 2006. [Google Scholar]
  24. Yuan, Z.S.; Xu, Z.Y.; Pan, B.; Li, G.S. Discrete element simulation of blasting damage characteristics of granite under different decoupling coefficients. Chin. J. High Press. Phys. 2022, 36, 015301. [Google Scholar]
  25. Tan, Q. Dimensional Analysis; Press of University of Science and Technology of China: Hefei, China, 2005. [Google Scholar]
  26. Li, H.C.; Chen, Y.; Liu, D.S.; Huang, Y.H.; Zhao, L. Sensitivity analysis determination and optimization of rock RHT parameter. Trans. Beijing Inst. Technol. 2018, 38, 779–785. [Google Scholar] [CrossRef]
  27. Liu, X.L.; Li, Y.; Wang, X.Y.; Gurkalo, F. Anti-explosion performance of different anti-explosion structures under gas explosion in pipe gallery. Chin. J. High Press. Phys. 2019, 33, 195–204. [Google Scholar] [CrossRef]
  28. Wu, C.; Zhou, C.B.; Lu, S.W.; Cai, J.Y.; Wang, C. Numerical simulation on cylindrical charged explosives with different initiation. Blasting 2016, 33, 74–77, 91. [Google Scholar] [CrossRef]
Figure 1. Sizes of rock samples and layouts of measuring points: (a) Layered rock sample; (b) Single rock sample.
Energies 16 06454 g001
Figure 2. Test system of high-pressure gas impact.
Energies 16 06454 g002
Figure 3. Preparation for the experimental test of blasting vibration.
Energies 16 06454 g003
Figure 4. Time−history curves of hole wall pressure.
Energies 16 06454 g004
Figure 5. Time−history curves of blasting vibration of the layered rock sample: (a) Measuring point CZ1; (b) Measuring point CZ4.
Energies 16 06454 g005
Figure 6. Time−history curves of blasting vibration of the single rock sample: (a) Measuring point DZ1; (b) Measuring point DZ4.
Energies 16 06454 g006
Figure 7. Variation curves of blasting vibration at all measuring points: (a) PPV; (b) DF.
Energies 16 06454 g007
Figure 8. Loading diagram of hole wall pressure.
Energies 16 06454 g008
Figure 9. Layout of measuring points.
Energies 16 06454 g009
Figure 10. Time−history curves of blasting vibration at seven measuring points.
Energies 16 06454 g010
Figure 11. PPV variation curves of blasting vibration with different hole spacing.
Energies 16 06454 g011
Figure 12. DF variation curves of blasting vibration with different hole spacing.
Energies 16 06454 g012
Figure 13. Stress nephogram with different hole spacing: (a) Hole spacing of 60 cm; (b) Hole spacing of 80 cm; (c) Hole spacing of 100 cm; (d) Hole spacing of 120 cm.
Energies 16 06454 g013
Figure 14. Layout of blast holes and the location of extracted measurement points on the ground surface.
Energies 16 06454 g014
Figure 15. Time−history curves of blasting vibration velocity under high-pressure gas impact.
Energies 16 06454 g015
Figure 16. Time−history curves of blasting vibration velocity under explosive blasting.
Energies 16 06454 g016
Table 1. Physical and mechanical parameters of the layered rock mass.
Rock TypeDensity
(g/cm3)
Elasticity Modulus (GPa)Poisson’s RatioS-Wave Velocity
(km/s)
P-Wave Velocity
(km/s)
Compressive Strength
(MPa)
Tensile Strength
(MPa)
Cohesive Strength
(MPa)
Internal Friction Angle
(°)
Soft rock1.915.690.163.173.3915.931.564.6634.22
Hard rock2.019.540.213.283.8223.072.154.0241.67
Table 2. Results of blasting vibration in the experimental test.
Rock TypeC(D)Z1C(D)Z2C(D)Z3C(D)Z4C(D)Z5C(D)Z6
PPV (cm/s)DF
(Hz)
PPV (cm/s)DF
(Hz)
PPV (cm/s)DF
(Hz)
PPV (cm/s)DF
(Hz)
PPV (cm/s)DF
(Hz)
PPV (cm/s)DF
(Hz)
Layered rock mass30.4553.6930.3750.0228.4644.1924.6637.0315.6122.108.2417.60
Single
rock mass
38.0676.9237.9663.1933.3253.0030.4143.1225.8724.6212.9418.60
Table 3. Influencing factors and dimensions of blasting vibration velocity.
Variable TypeParameterSymbolUnitDimension
Dependent variablePPVVmaxm/s[L·T−1]
DFfs−1[T−1]
Independent variableInitial impact pressure of high-pressure gasPkg/m/s2 (Pa)[M·L−1·T−2]
Distance from explosion sourceRm[L]
Blast hole radiusrm[L]
Density of soft rock ρ 1 kg/m3[M·L−3]
P-wave velocity of soft rockCp1m/s[L·T−1]
Density of hard rock ρ 2 kg/m3[M·L−3]
P-wave velocity of hard rockCp2m/s[L·T−1]
Table 4. Parameters of RHT constitutive model of soft rock material.
roshearonempaepsfb0b1t1
1.910.033002−621.121.120.219499
anfcfs*ft*q0bt2
1.60.610.00015930.052730.0979280.68050.01050
e0ce0tecetbetacbetatptf
3.00 × 10−123.00 × 10−133.00 × 10183.00 × 10180.1999950.09999920.001
gc*gt*xid1d2epmafnf
0.530.70.50.0410.011.60.61
gammaa1a2a3pelpconpalpha
00.2194990.2458390.028710.00005310.631.1
Table 5. Parameters of RHT constitutive model of hard rock material.
roshearonempaepsfb0b1t1
2.0090.0577−621.121.120.2931613
anfcfs*ft*q0bt2
1.60.610.00023070.170350.09319460.68050.01050
e0ce0tecetbetacbetatptf
3.00 × 10−123.00 × 10−133.00 × 10183.00 × 10180.1999930.09999880.001
gc*gt*xid1d2epmafnf
0.530.70.50.0410.011.60.61
gammaa1a2a3pelpconpalpha
00.293160.328340.0383450.00007690.631.1
Table 6. Parameters of air material model.
Materialρ (kg/m3)C0C1C2C3C4C5C6V0E0 (MPa)
Air1.29300000.40.4010.25
Table 7. Comparison between experimental and simulation results of PPV and DF of blasting vibration.
Blasting VibrationNumber of Measuring Points
(M)CZ1(M)CZ2(M)CZ3(M)CZ4(M)CZ5(M)CZ6
PPVExperimental values/(cm/s)30.4530.3728.4624.6615.618.24
Simulation values/(cm/s)41.1140.3936.7130.0918.429.15
Relative error35%33%29%22%18%11%
DFExperimental values/(Hz)53.6950.0244.1937.0322.1017.60
Simulation values/(Hz)79.4670.5360.5448.8827.4020.24
Relative error48%41%37%32%24%15%
Table 8. Some material parameters of layered rock mass.
Rock TypeDensity
(kg/m3)
Cohesive Strength (kPa)Internal Friction Angle (°)Elasticity Modulus (GPa)Poisson’s Ratio
Completely weathered granite190020250.020.24
Sandy strongly weathered granite20003032540.21
Table 9. PPV and DF results of blasting vibration at seven measuring points.
Number of Measuring PointsDistance from Explosion Source (m)Scaled DistanceBlasting Vibration
PPV (cm/s)DF (Hz)
D17.02127.631.57125.3
D27.16130.181.45124.4
D37.43135.091.40123.1
D47.83142.361.29121.8
D58.32151.271.13120.1
D68.90161.820.98116.3
D79.55173.640.84112.9
Table 10. PPV results of blasting vibration with different hole spacing.
Number of Measuring PointD1D2D3D4D5D6D7
Hole spacing60 cm1.571.451.401.291.130.980.84
80 cm1.000.960.930.840.710.620.54
100 cm0.580.550.510.460.400.350.30
120 cm0.190.180.170.140.130.100.09
Table 11. DF results of blasting vibration with different hole spacing.
Number of Measuring PointD1D2D3D4D5D6D7
Hole spacing60 cm125.3124.4123.1121.8120.1116.3112.9
80 cm119.3118.5117.3113.9111.9108.5106.2
100 cm108.7107.8105.9104.1101.098.494.6
120 cm99.898.796.993.891.789.586.0
Table 12. Material parameters of emulsion explosive.
ρ
(kg/m3)
D
(m/s)
PCJ
GPa
A
GPa
B
GPa
R1R2ωE0
GPa
100032004.360.1821.014.20.90.154.192
Table 13. PPV and DF results of blasting vibration velocity under high-pressure gas impact and explosive blasting.
Numerical ModelCV1CV2CV3
PPV (cm/s)DF (Hz)PPV (cm/s)DF (Hz)PPV (cm/s)DF (Hz)
Under high-pressure gas impact1.46107.30.7799.70.4195.6
Under explosive blasting5.3468.84.1152.61.6348.7
Disclaimer/Publisher’s Note: The statements, opinions and data contained in all publications are solely those of the individual author(s) and contributor(s) and not of MDPI and/or the editor(s). MDPI and/or the editor(s) disclaim responsibility for any injury to people or property resulting from any ideas, methods, instructions or products referred to in the content.

