Abstract
The magnetically controlled reactor adjusts its output capacity based on the principle of magnetic saturation. Due to the iron core working in the saturated region, higher harmonics will be generated in the working current. A large number of harmonics will affect the power quality and safety of the power system. This study derives the expression for the harmonic content of a magnetically controlled reactor with a multistage saturated magnetic valve core structure. The magnetization curves of different iron core structures can be obtained through expressions. This study used different magnetization curves for simulations of magnetically controlled reactors. The suppression effect of the multilevel magnetic valve structure on harmonics was analyzed through simulation results. A prototype of a magnetically controlled reactor with a two-stage magnetic valve structure was manufactured, and dynamic response tests were conducted. The experimental results show that the harmonic content in the working current of the magnetically controlled reactor with a two-stage magnetic valve structure is less than 2%, which is much smaller than the harmonic content of ordinary magnetically controlled reactors in the past. This article verifies the suppression effect of the improved magnetic valve structure on harmonics through experiments.
1. Introduction
Magnetically controllable reactors are widely used in power systems because of their stepless adjustable advantages and fast response speeds. Based on the working principle of the magnetic valve type controllable reactor, the magnetically controlled reactor is in the core saturation area during normal operation, and inevitably generates higher harmonics during operation [1]. A large number of harmonics will cause voltage and current distortions, and have a serious impact on the power quality. In [2], the authors analyzed the danger of even harmonics being amplified to the system through simulation. Therefore, China has formulated corresponding maximum harmonic content standards for its power system to limit the harmonics in the system [3,4].
For three-phase magnetically controlled reactors, a reasonable winding connection method can effectively reduce the content of the third harmonic in the working current. For the high-content fifth harmonic, seventh harmonic, etc., it is necessary to study suppression methods for higher harmonics. In order to reduce the harmonics generated by magnetically controlled reactors, many experts and scholars have studied the mechanism of harmonic generation and its suppression methods in magnetically controlled reactors [5,6,7]. In [8], the authors, through theoretical calculation and simulation, found that the mechanism of harmonics would lead to excessive temperatures in the reactor winding and iron core. They also analyzed the mechanism that harmonics would cause increases in reactor operating losses, and built a Multiphysics simulation model to verify the theoretical calculation method.
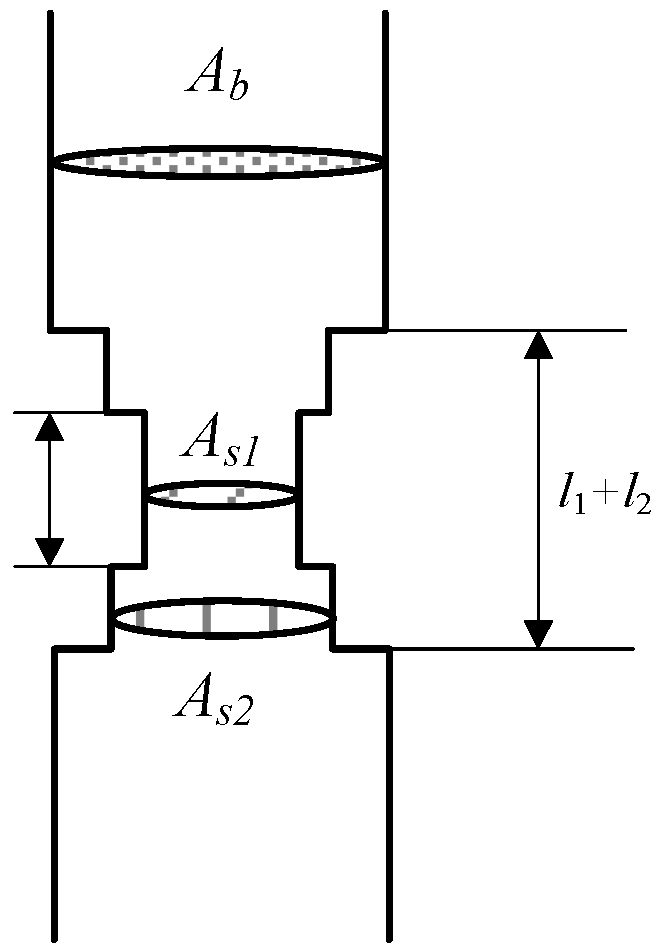
Scholars generally build models for research based on electromechanical transient simulation platforms. In [9,10], the authors proposed a calculation method for adjusting model parameters based on changes in iron core parameters in the simulation model of magnetically controlled reactors. Harmonic suppression can be achieved by changing the winding structure outside the iron core, or by adding an external power source. Reference [11] proposed a method of injecting additional harmonic voltage by adding harmonic voltage to the control winding of the control circuit, in order to counteract the harmonics generated by saturation in the iron core. Reference [12] proposed a method of phase shifting the harmonic current through a phase-shifting winding to eliminate higher-order harmonics, but this method cannot automatically adjust harmonic suppression when load fluctuations occur. Moreover, the harmonic internal suppression method mainly reduces the harmonic content by changing the structure of the magnetic valve in the core of the magnetically controlled reactor. For example, the double-stage magnetic valve type controllable reactor structure was proposed for the first time in reference [13]. In this magnetically controlled reactor, the magnetic valve is composed of two core columns with different cross-sectional areas and equal lengths, as shown in Figure 1. In reference [14], a mathematical model for the harmonic analysis of multistage saturated magnetic valve type controllable reactors was proposed, and the influence of the multistage magnetic valve structure on the output current harmonic of single-phase magnetically controlled reactors was analyzed. In [15], the authors proposed a multilevel magnetic valve structure to suppress harmonic content, and built a simulation model for calculation. Although good results were achieved in the simulation by changing the iron core structure to suppress the harmonics, the changed iron core structure increased the difficulty of the experiment and lacked corresponding experimental verification. In [16], the author proposed a method of adding an iron core in the control winding to reduce the harmonic content, and conducted simulation verification; however, a prototype was not designed for experimental verification. In [17], the author added an IGBT circuit to optimize the dynamic characteristics of the magnetically controlled reactor based on the multilevel magnetic valve structure, but this method did not reduce the harmonic content in the working current. Therefore, further analysis is needed to optimize the method of reducing harmonic content by changing the structure of the magnetically controlled reactor, and it is essential to make corresponding prototypes for dynamic response testing.

Figure 1.
Structure diagram of two-stage magnetic valve controllable reactor’s magnetic valve.
This research establishes a model of a multilevel saturated magnetic valve type magnetically controlled reactor, and derives the magnetization curve expressions under different magnetic valve structures. This study also uses different magnetization curves for simulation. The harmonic content was analyzed in the output current of magnetically controlled reactors under different magnetic valve structures. Dynamic response tests were conducted on magnetically controlled reactors with a changed iron core structure. The experimental results indicate that changing the iron core structure can reduce the harmonic content in the working current.
2. Study on Harmonic Mathematical Model of Three-Phase Magnetically Controlled Reactor
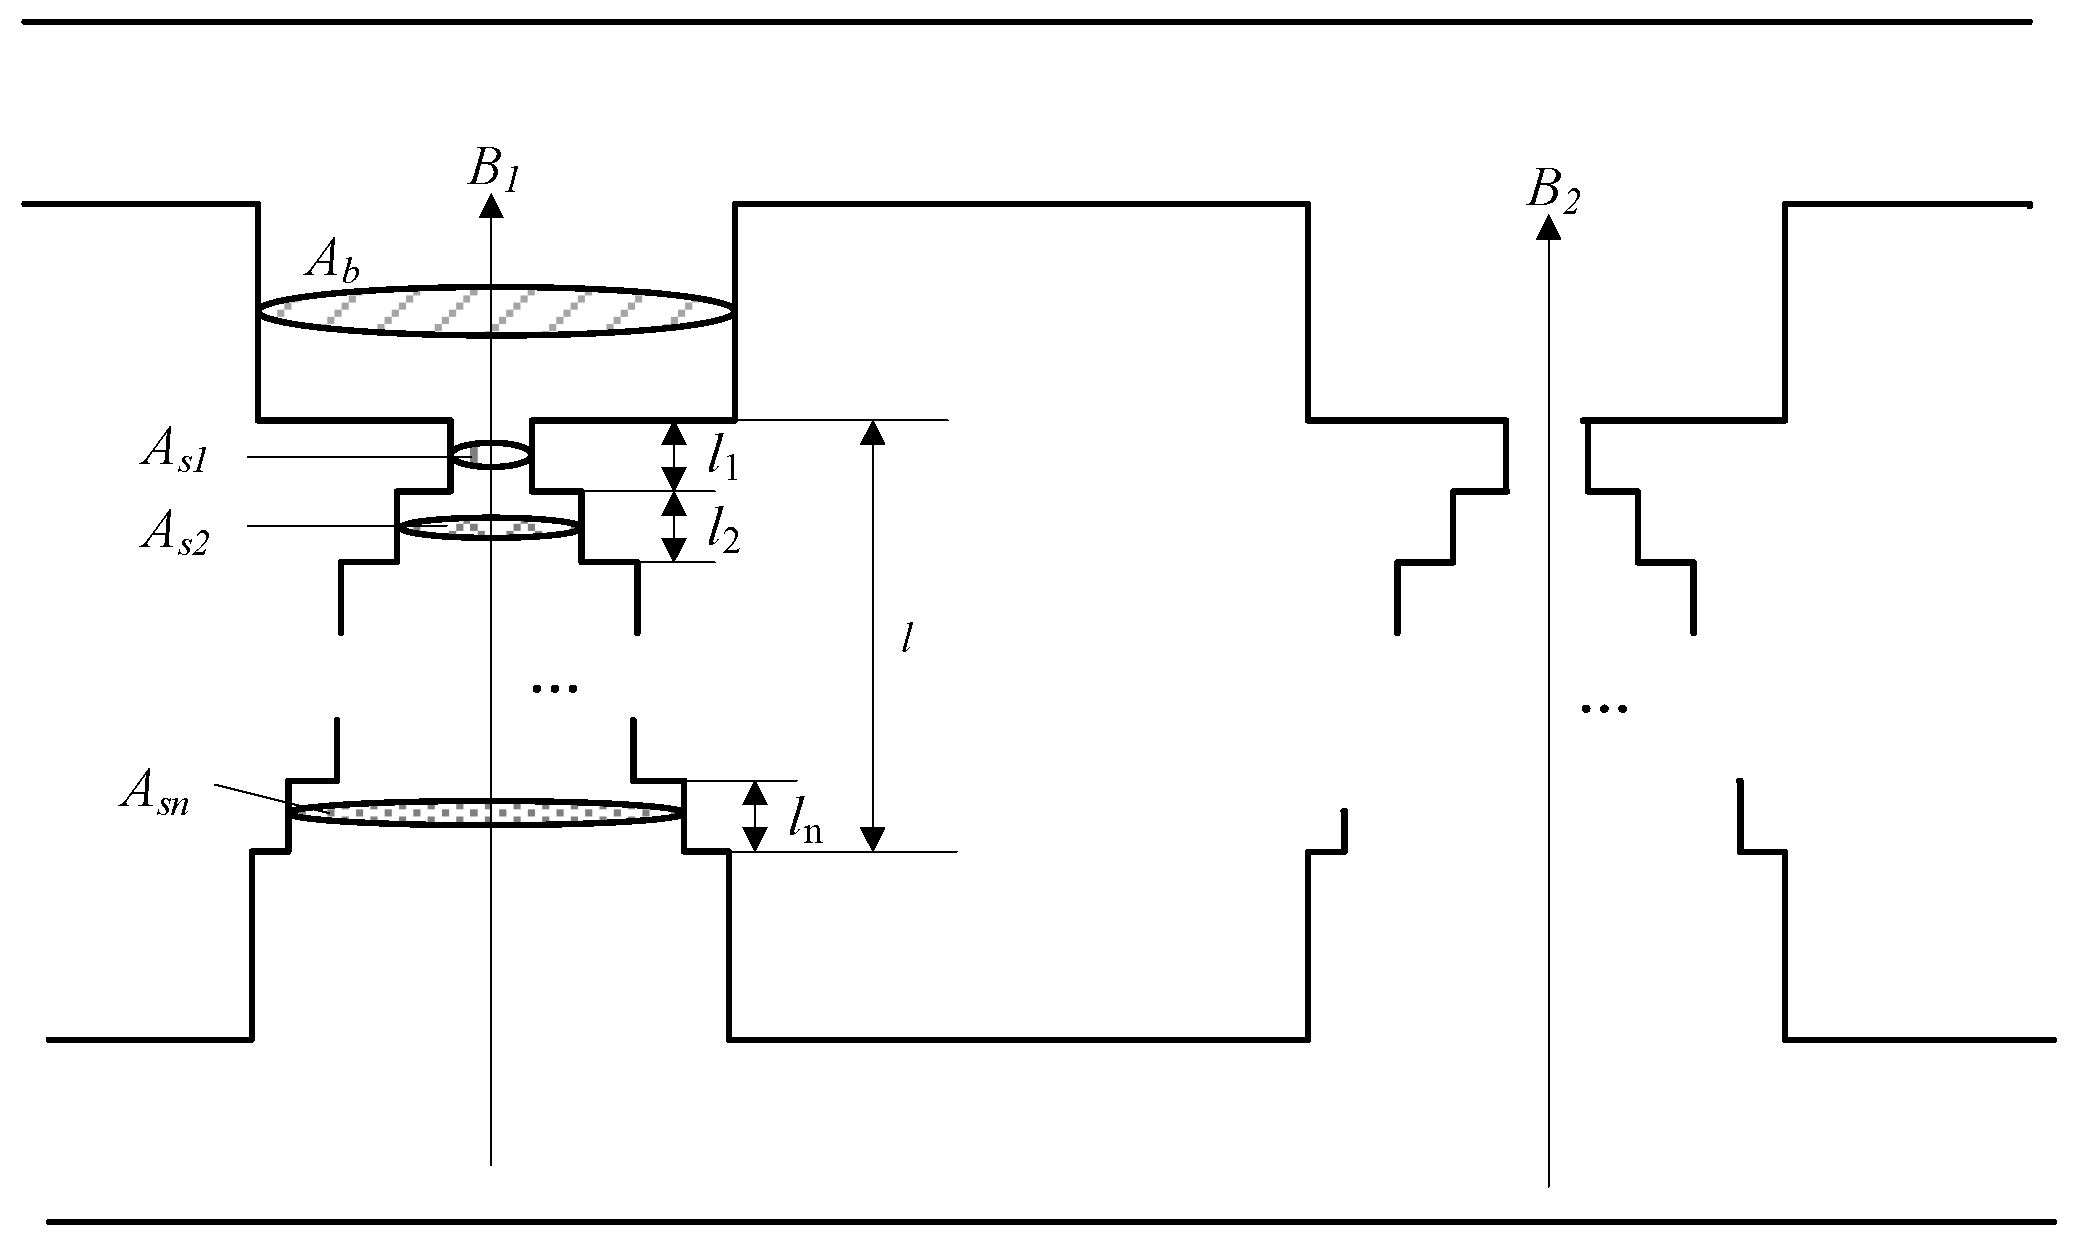
The structure of a multistage saturated magnetically controlled reactor is shown in Figure 2. Taking the structure of a single-phase magnetically controlled reactor as an example, the single-phase magnetically controlled reactor is designed as a symmetrical structure that consists of two iron cores. The magnetic valve structure of each iron core is composed of multiple small sections with unequal cross-sectional areas and lengths. The lengths and areas of each section are ln and Asn (n = 1, 2, 3...), respectively. The sum of the lengths of all of the sections is l.

Figure 2.
Structural diagram of multistage saturated magnetically controlled reactor.
The magnetic flux densities B1 and B2 passing through the two core columns of each phase of the magnetic control reactor are controlled by the DC magnetic flux density Bd. The saturation value of the magnetization curve in each stage of the magnetic valve segment is Bsn (n = 1, 2, 3...). The saturation of each section at the magnetic valve is defined as follows:
Since the material of the iron core is unchanged, the magnetic flux density of each magnetic valve section when saturated is related to the cross-sectional area. According to Equation (1), the magnetic saturation of each cross-section is also related to the cross-sectional area.
The entire magnetic valve section is equivalent to a magnetic valve section with an area of Ab, and the magnetic field intensity of the equivalent magnetic valve is He. According to Ampere’s loop law, it can be obtained as follows:
In the formula, Hk is the magnetic field intensity of the k-th level cross-section, lk is the length of the k-th level cross-section, i1 is the current flowing through the working winding of the left iron core in Figure 2, and N is the number of turns of the winding.
According to the law of magnetic flux continuity, the magnetic flux passing through a certain section can be regarded as the sum of the magnetic flux of the iron core and its corresponding air section:
In the formula, Bqn is the magnetic flux density of the corresponding air section of the cross-section.
Due to Ampere’s loop theorem, the magnetic field intensity of the iron core section of each section is equal to that of the corresponding air section:
In the formula, Hn is the equivalent magnetic field intensity of the n-th level magnetic valve; Htn is the magnetic field intensity of the iron core of the n-th level magnetic valve; and Hqn is the magnetic field intensity of the air section of the n-th level magnetic valve; μ0 is the magnetic permeability of air.
When the magnetic valves of levels 1 to k−1 are saturated, and the magnetic valves of levels k to n are not saturated; the corresponding magnetic field intensity can be obtained from Equations (2)–(4) as follows:
According to Equations (2) and (5), the equivalent magnetic field intensity of the iron core is as follows:
To sum up, there is a connection between the magnetic saturation of each section at the magnetic valve. The magnetization characteristics of the iron core magnetic valve section are as follows:
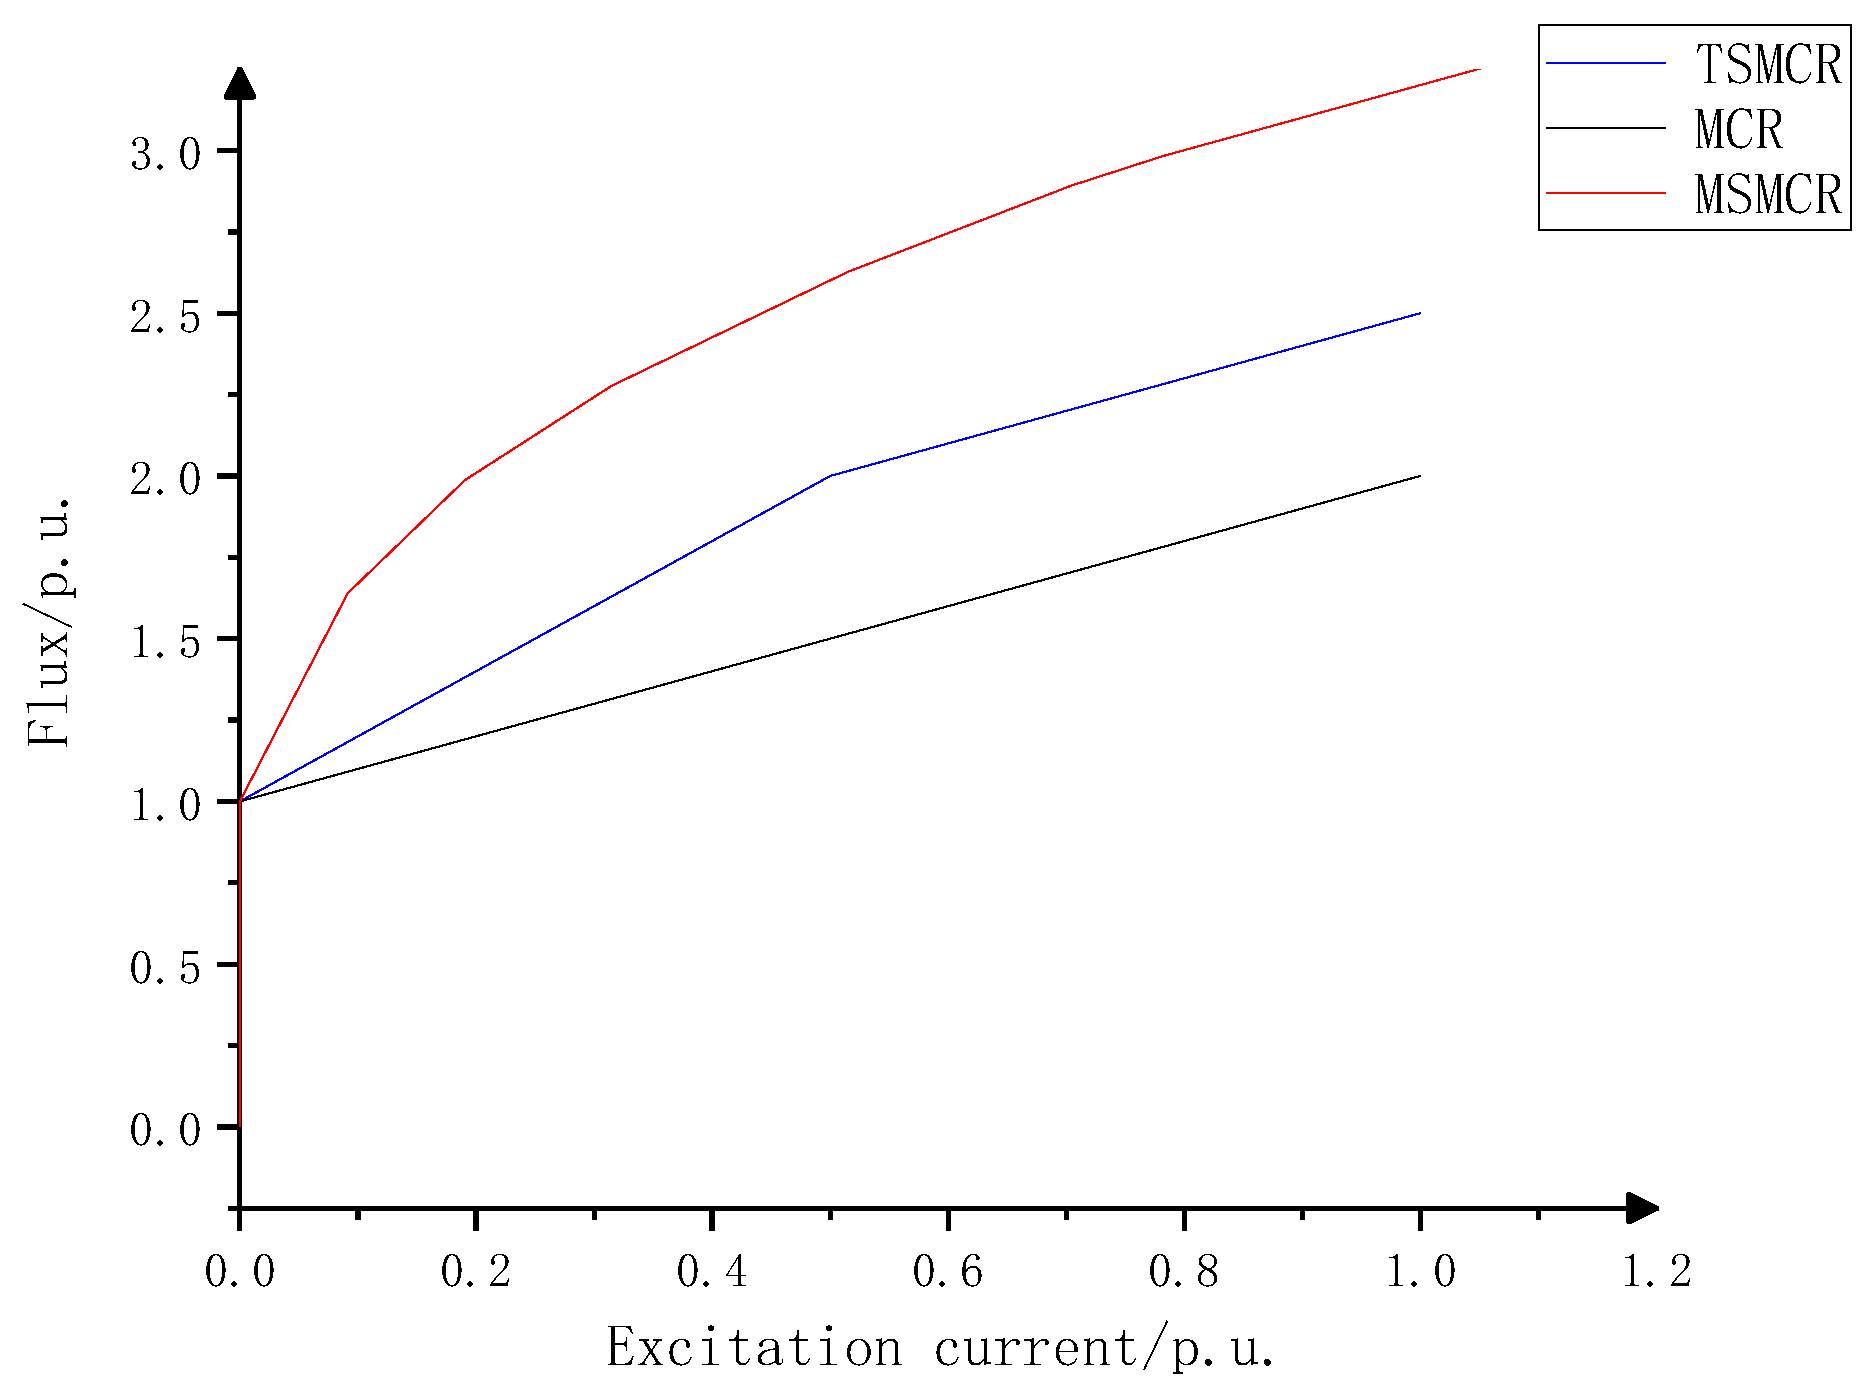
According to Equation (7), the magnetic saturation characteristic B–H curve of a multistage saturated magnetic valve should be composed of a series of segmented lines, and the slopes of the line segments should gradually decrease. The number of segments of the core magnetization curve is the same as the number of cross-sections of the magnetic valve. The particle swarm optimization algorithm is used to obtain magnetization curves for different saturation magnetron stages, as shown in Figure 3 [18].
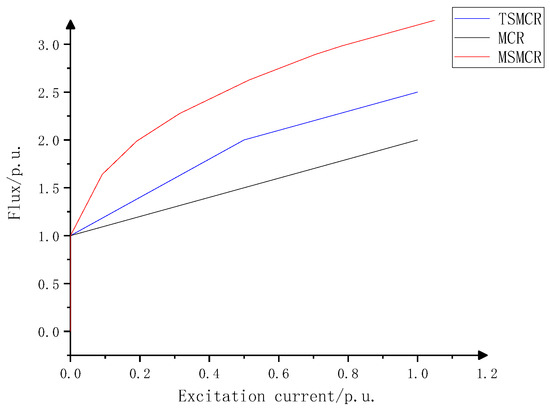
Figure 3.
Magnetization characteristic curves.
The three broken lines in the figure are the magnetization curves of a regular, a two-stage saturated magnetic valve type and a seven-stage saturated magnetic valve type magnetically controlled reactor.
Since the core of each phase of the magnetron reactor is of symmetrical structure, the magnetization characteristics the cores are the same. The total working current of each phase of the magnetically controlled reactor is the sum of the currents of the working windings on the two cores; thus, according to reference [19], the working current of each phase of the magnetic control reactor is the following:
where He1 and He2 are the equivalent magnetic field intensities of the two iron cores. B1 and B2 are the magnetic flux densities of the two iron cores shown in Figure 2.
Based on the above analysis, the mathematical model of harmonic distribution in the working current of the magnetically controlled reactor can be obtained as follows:
where i1* is the standard unit value of the fundamental wave current; i*(2m + 1) is the unit value of each harmonic; n is the number of sections at the core magnetic valve; and kn is the ratio of the area of section n to section 1.
From Equation (5), it can be seen that the harmonic content in the working current of the magnetically controlled reactor is mainly related to the parameters kn and lk. Through a mathematical analysis of Equation (5), it can be seen that by adjusting kn and lk, there are extreme points of each harmonic current, and the analysis process is not listed due to its length [20,21].
3. Simulation Analysis
3.1. Magnetization Curve of Magnetically Controlled Reactor
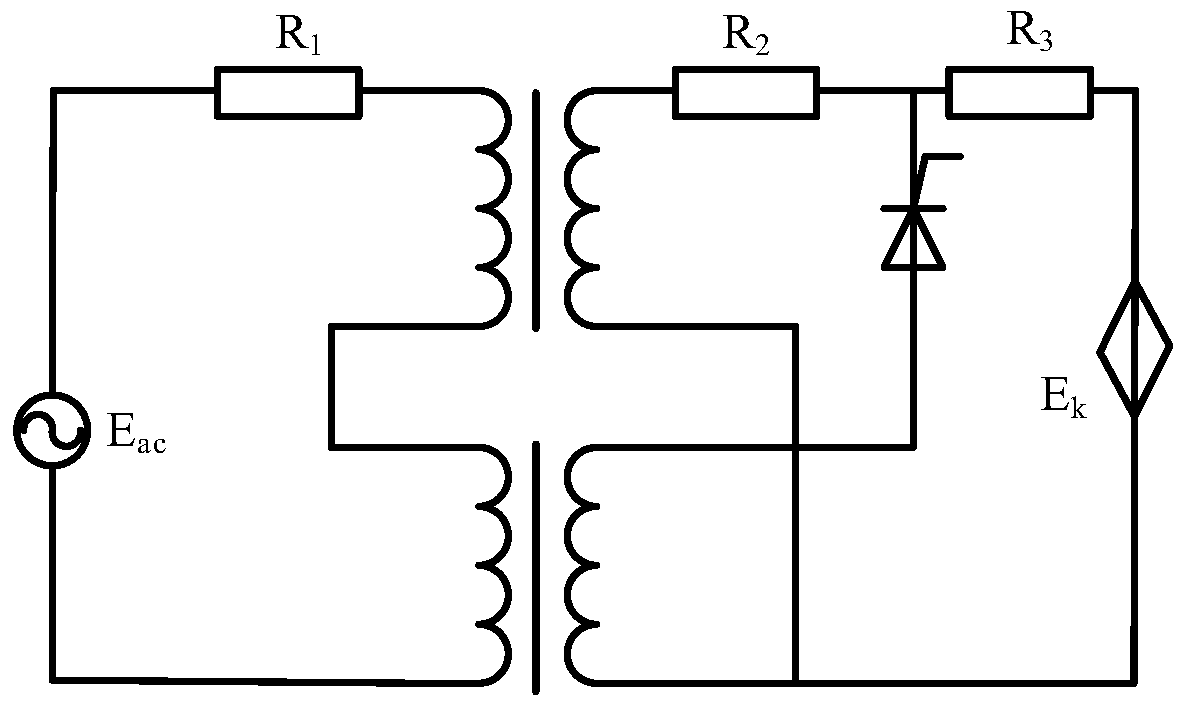
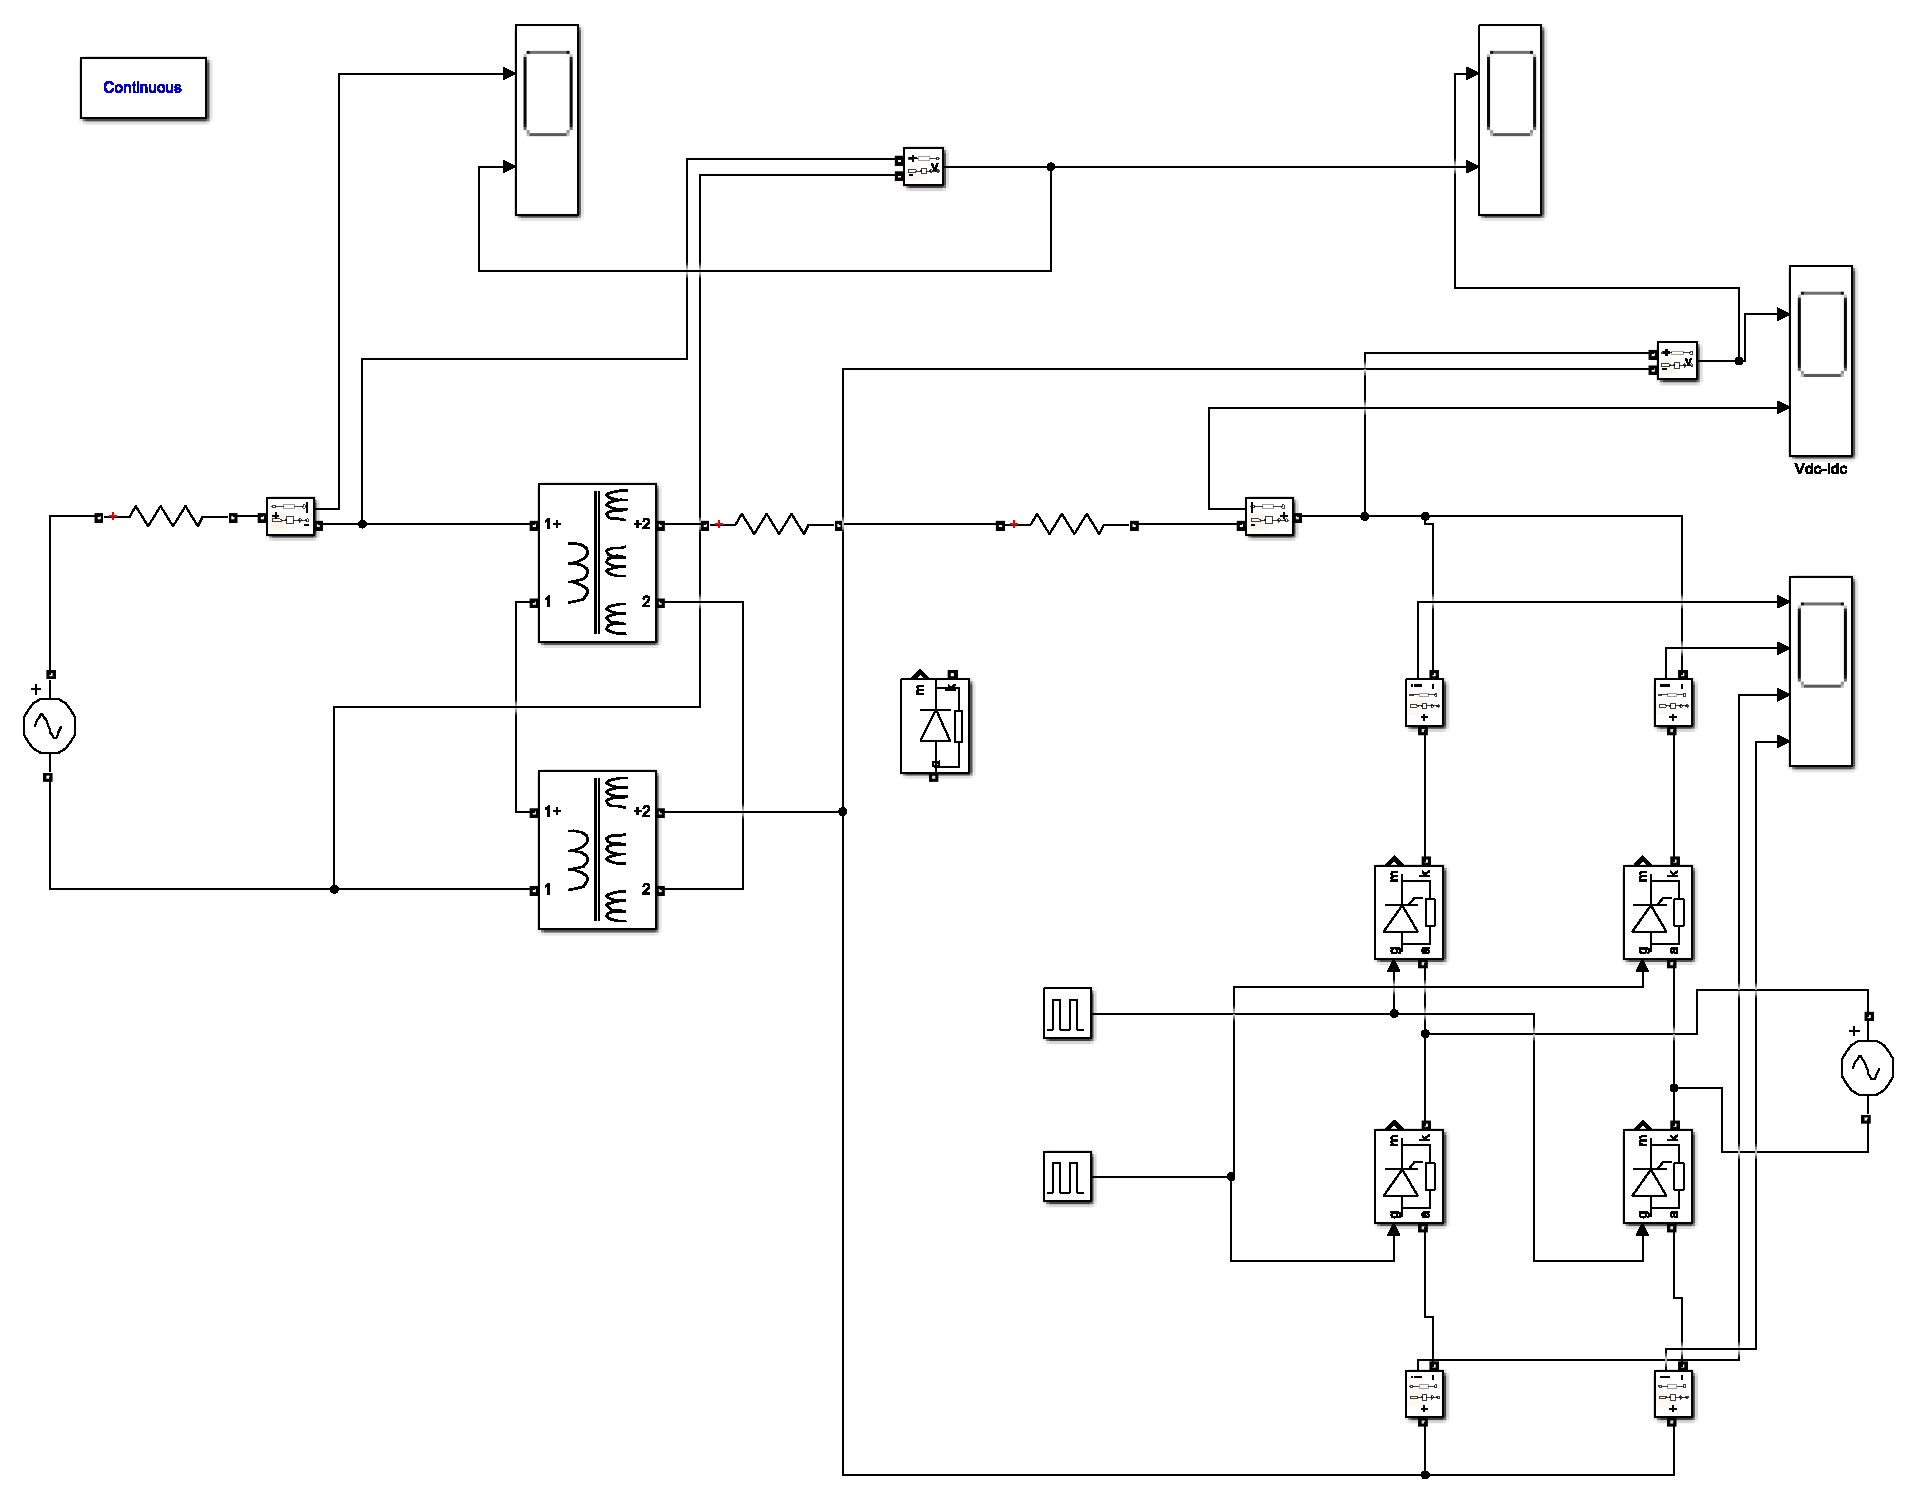
The circuit principle of single-phase magnetic controlled reactor is shown in Figure 4. In order to verify that the change in harmonic content in the working current of the magnetically controlled reactor with the core magnetic saturation is related to the parameters kn and lk, a single-phase magnetically controlled reactor simulation model based on the MATLAB/Simulink platform was built, as shown in Figure 5. The rated voltage of the magnetically controlled reactor is 35 kV and the rated working current is 300 A, of which the core magnetic saturation of the magnetically controlled reactor is β = π. That is, when the core is in the semi-limited saturation state, it is the rated working state of the magnetically controlled reactor.
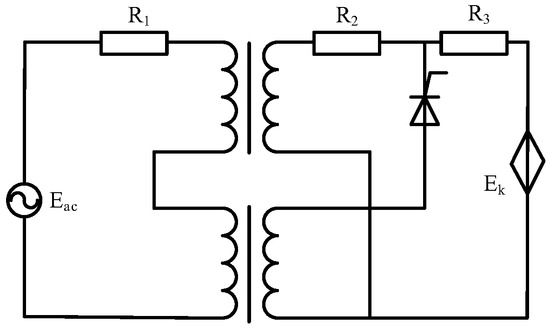
Figure 4.
Single-phase circuit diagram of magnetically controlled reactor.
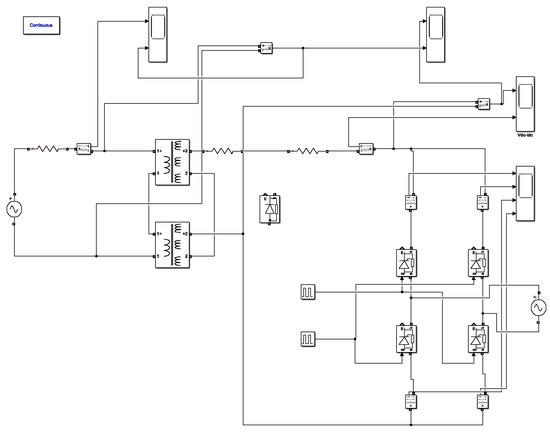
Figure 5.
Simulation model based on MATLAB platform.
In the simulation model, the core of each phase of the magnetically controlled reactor is composed of two transformer models with saturation characteristics. The single-phase circuit of the magnetically controlled reactor is shown in Figure 4 [22]. Therefore, the magnetization characteristic curves of the six transformer models in the three phases are set to be the same. We set the simulation model according to the magnetization curve shown in Figure 3 and input the magnetization curve coordinates under different structures into the attributed “saturation characteristics” of the simulation model.
In the model, the primary resistance is 0.32718 Ω, the primary leakage reactance is 2.616 Ω, the secondary resistance is 0.01 Ω, the secondary leakage reactance is 0.02 Ω and the magnetization resistance is 32,718 Ω.
3.2. Simulation Results
The rated voltage of the simulation model of the magnetically controlled reactor is 35 kV, and the rated capacity is 18 MVar. By changing the trigger angle of the thyristor in the control circuit, the magnetic saturation of the magnetically controlled reactor can be adjusted, thereby adjusting the operating current. The relationship between the trigger angle and magnetic saturation is the following:
where α is the trigger angle of the thyristor.
The relationship between the trigger angle of the thyristor and the fundamental wave and harmonics of the output current can be obtained through Equations (9) and (10).
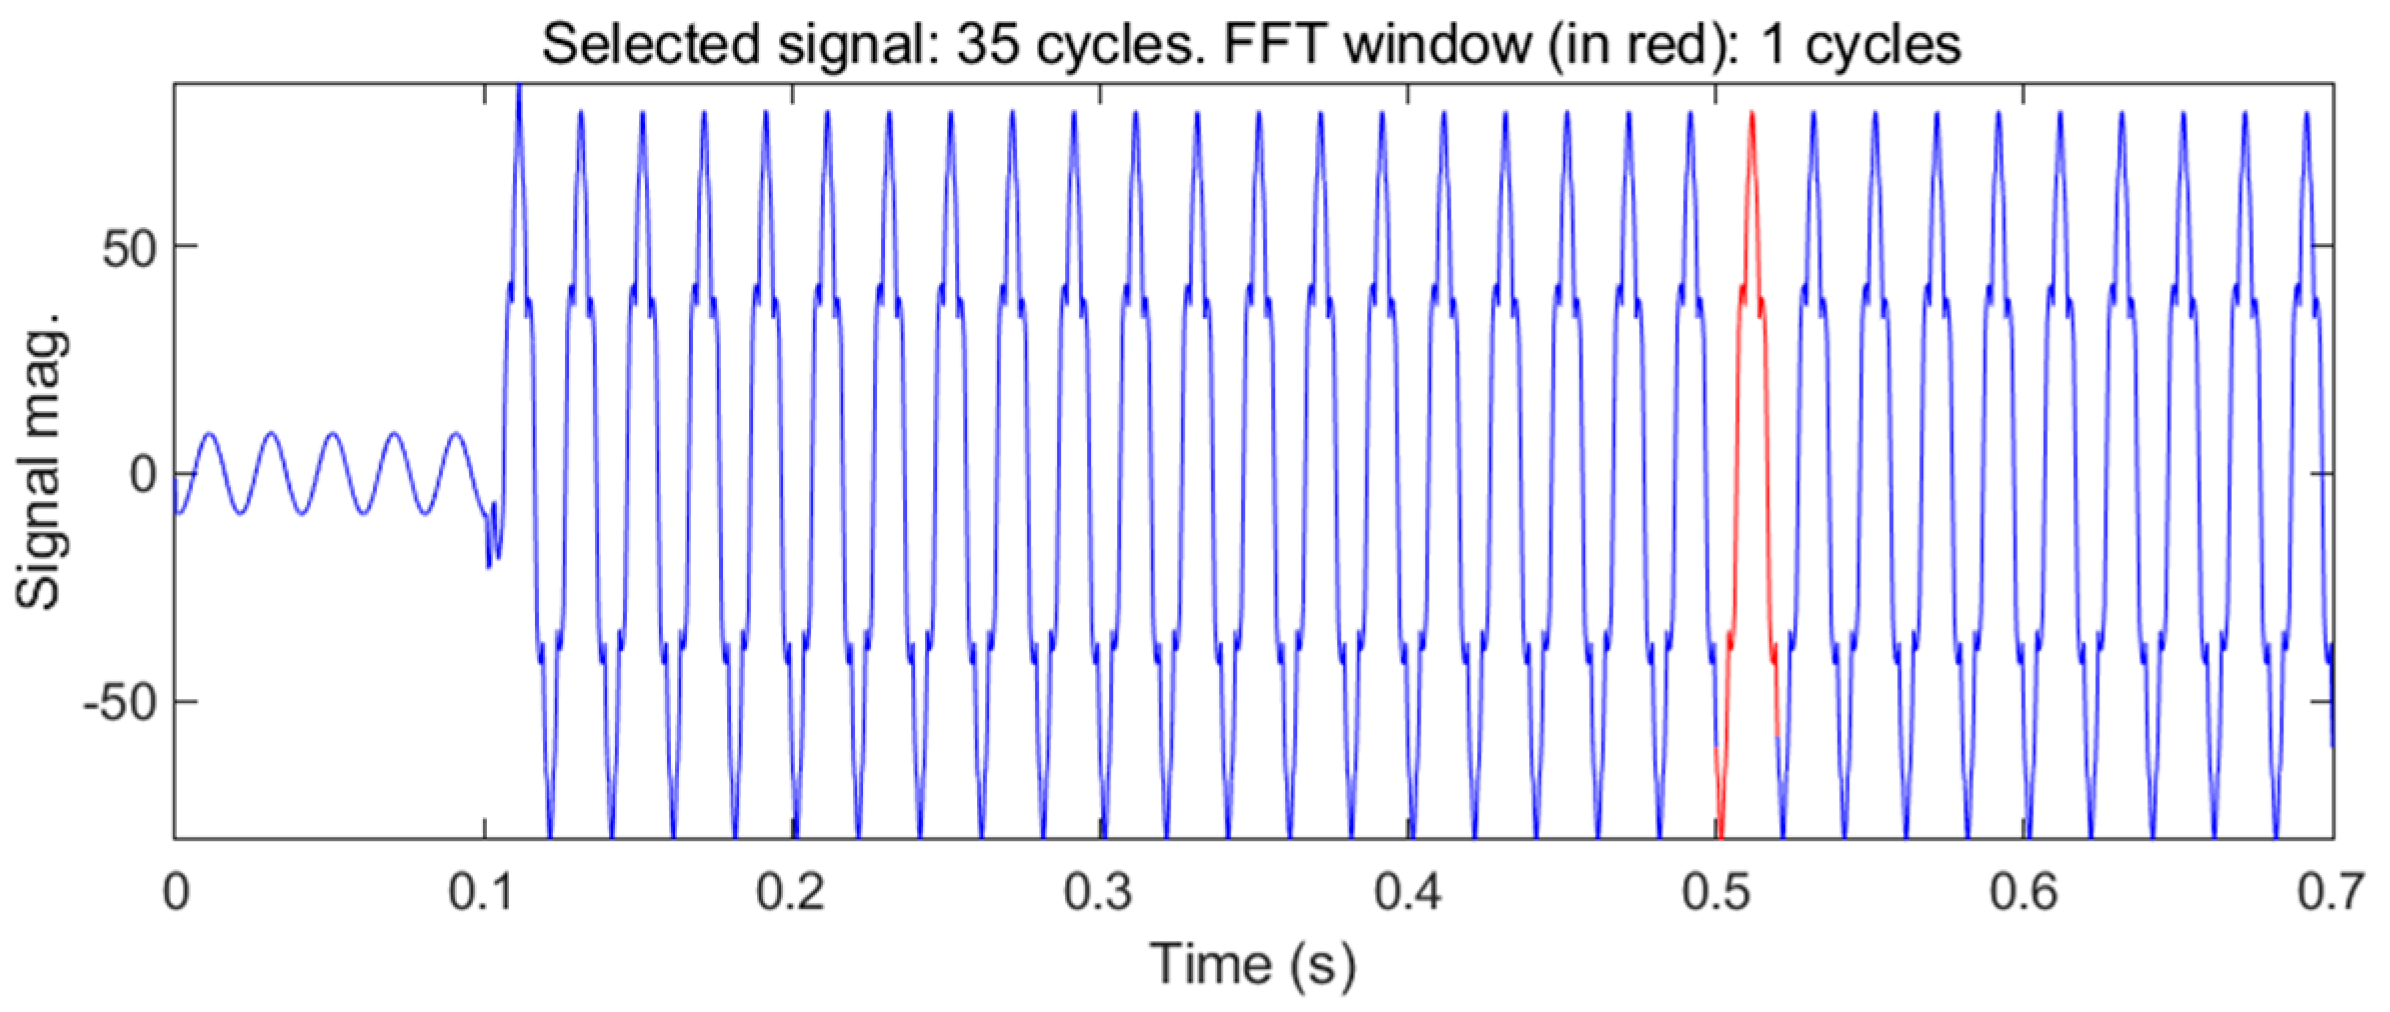
Select the current waveform of one cycle after the phase of a working current of the magnetically controlled reactor is stable, as shown in Figure 6, and analyze the harmonic content. Since the harmonic content of the working current is related to the magnetic saturation of the magnetically controlled reactor core, the harmonic content of the working current is observed when the magnetic saturations of the core are 0.3756 π, 0.5387 π, 0.6691 π, 0.8392 π and 0.948 π. The effective values of the magnetically controlled reactor’s output working current are 30 A, 75 A, 120 A, 210 A and 270 A, respectively. Under the conditions of different core magnetic saturation curves, the 5th and 7th harmonic contents of different operating currents are shown in Table 1.
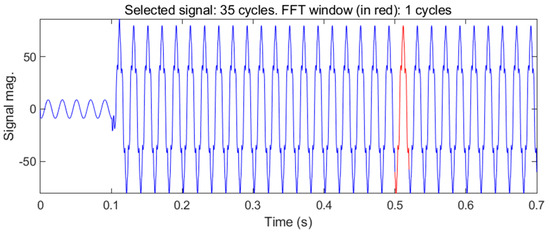
Figure 6.
Working current of phase A of the magnetically controlled reactor.

Table 1.
Harmonic content of working current under different core magnetic saturation curves. (a) Harmonic content when core magnetic saturation curve is MCR curve; (b) Harmonic content when core magnetic saturation curve is TSMCR curve; (c) Harmonic content when core magnetic saturation curve is MSMCR curve.
According to the data in Table 1, the total harmonic distortion (THD) in the working current can be effectively reduced by changing the structure of the core magnetic valve, as shown in Figure 7. When the magnetically controlled reactor outputs the rated current of 300 A, the magnetic saturation of the core is π; thus, the closer the working current is to the rated current, the lower the THD. When the working current is 30 A, the magnetic saturation of the core is the lowest in the selected working states, so the THD is the highest. When the TSMCR magnetic saturation curve and the MSMCR magnetic saturation curve are used for the core, the THD is reduced by 16.08% and 25.8%, respectively, compared with that when the MCR magnetic saturation curve is used.
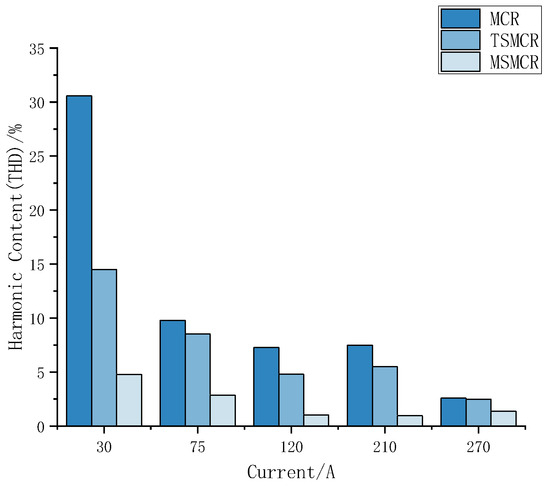
Figure 7.
Harmonic content (THD) in different magnetic saturation curves.
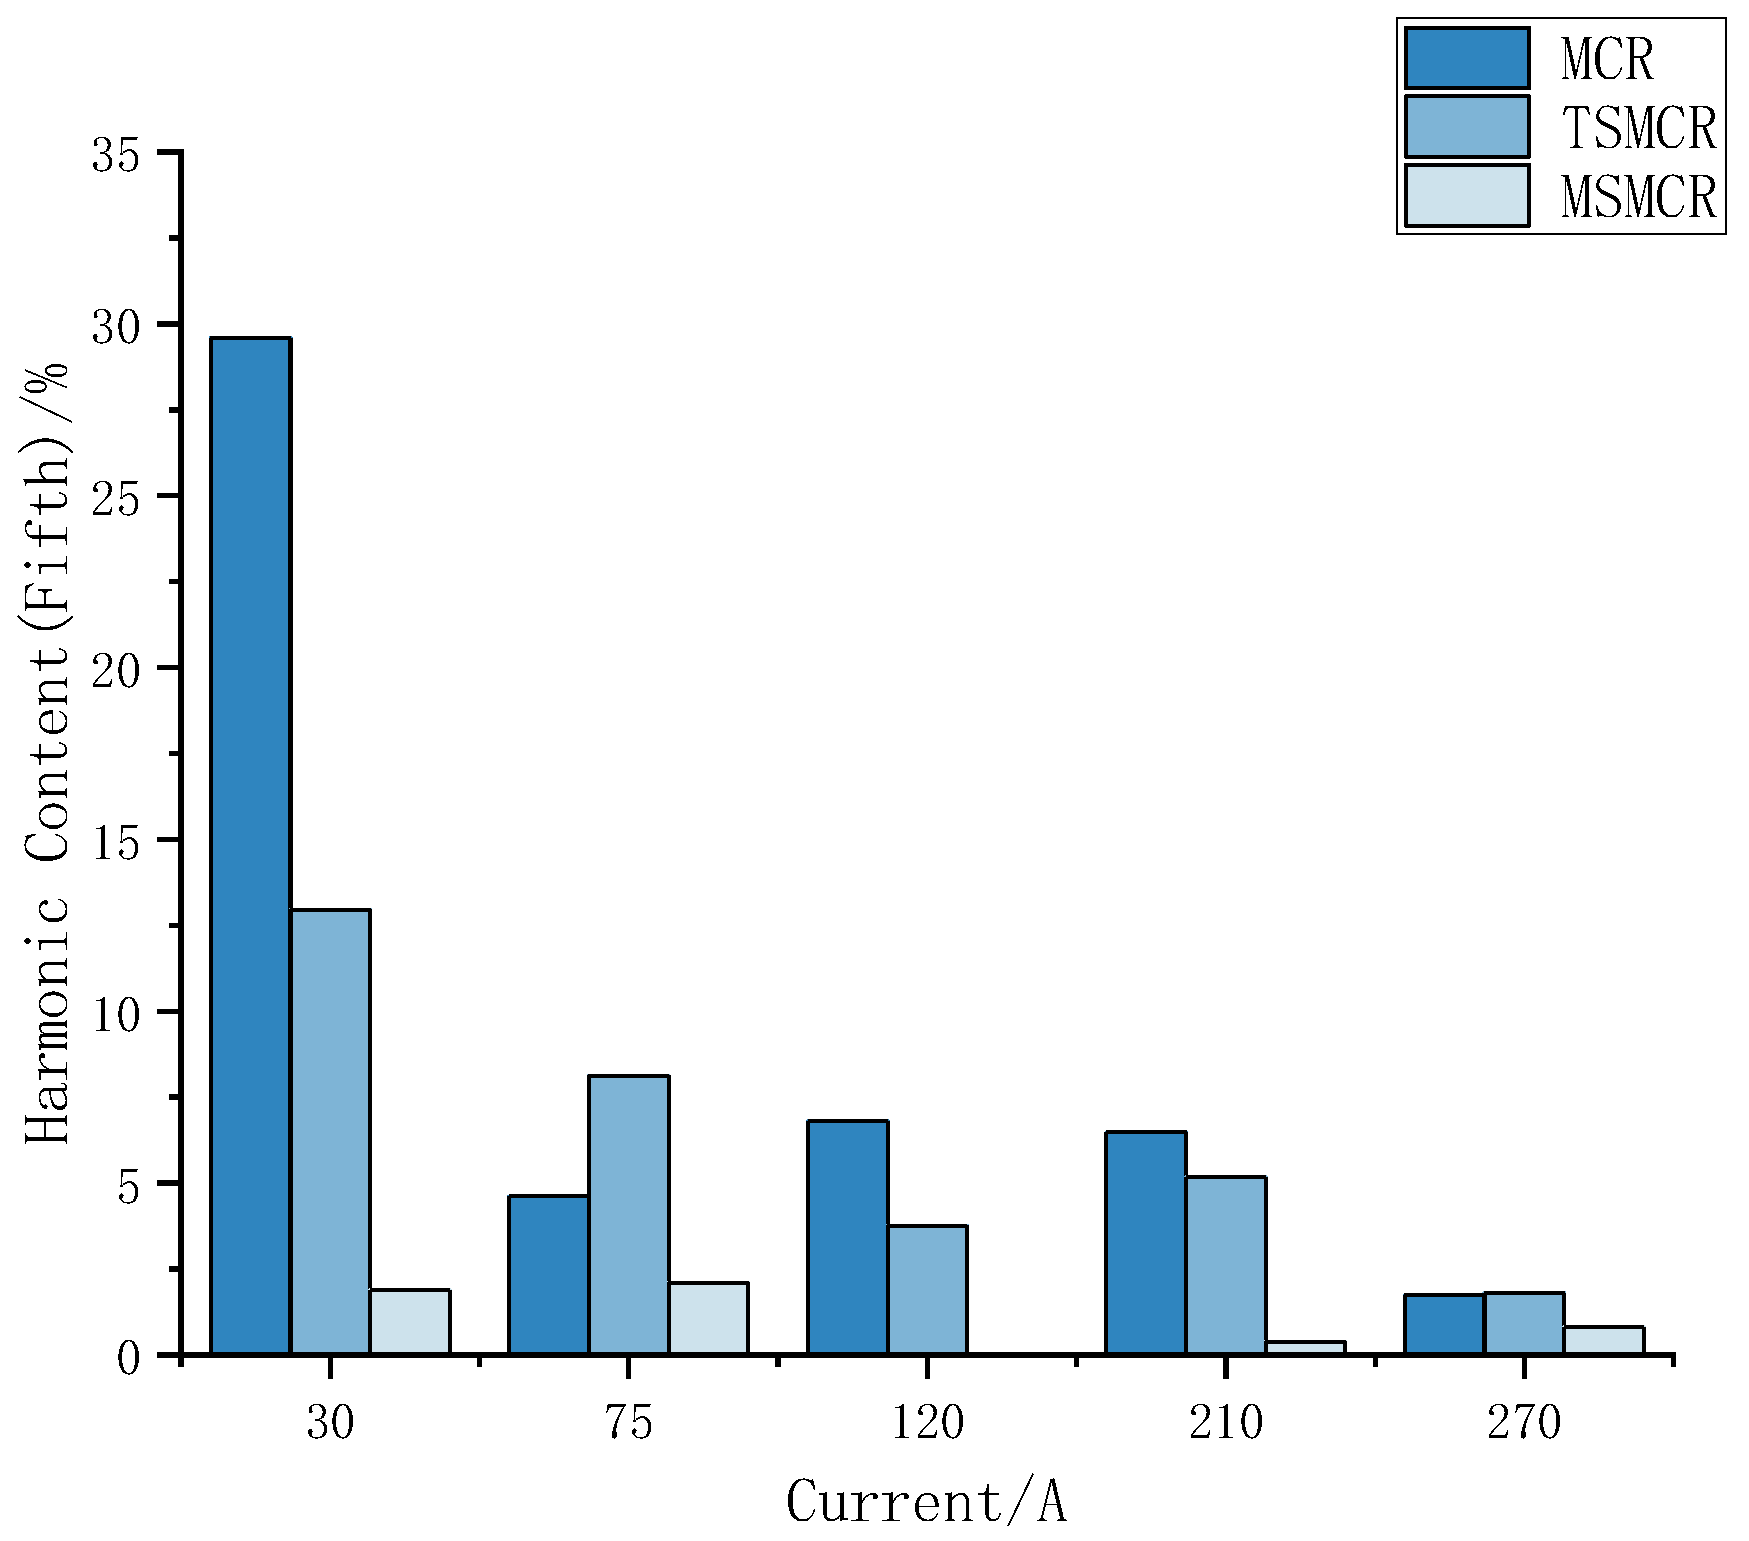
Figure 8 and Figure 9 show the 5th and 7th harmonic contents, respectively, of the working current of the magnetically controlled reactor with different core magnetic saturations under different output capacities. From Figure 8 and Figure 9, the optimized core magnetic saturation curve can effectively reduce the 5th and 7th harmonic content in the working current. However, the 5th and 7th harmonics in the working current do not show an absolute downward trend with the increase in the working current, but on the whole, when the working current is 30 A, the 5th and 7th harmonics content are the largest, indicating that the harmonic content is large when the magnetic saturation of the iron core is small.

Figure 8.
Fifth harmonic content in different magnetic saturation curves.
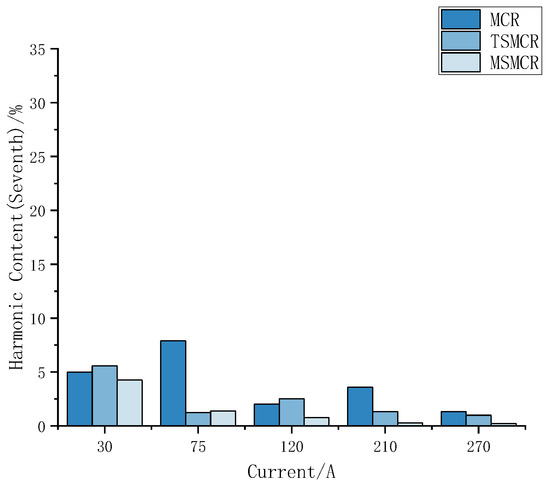
Figure 9.
Seventh harmonic content in different magnetic saturation curves.
4. Test Verification
4.1. Test Principle and Wiring
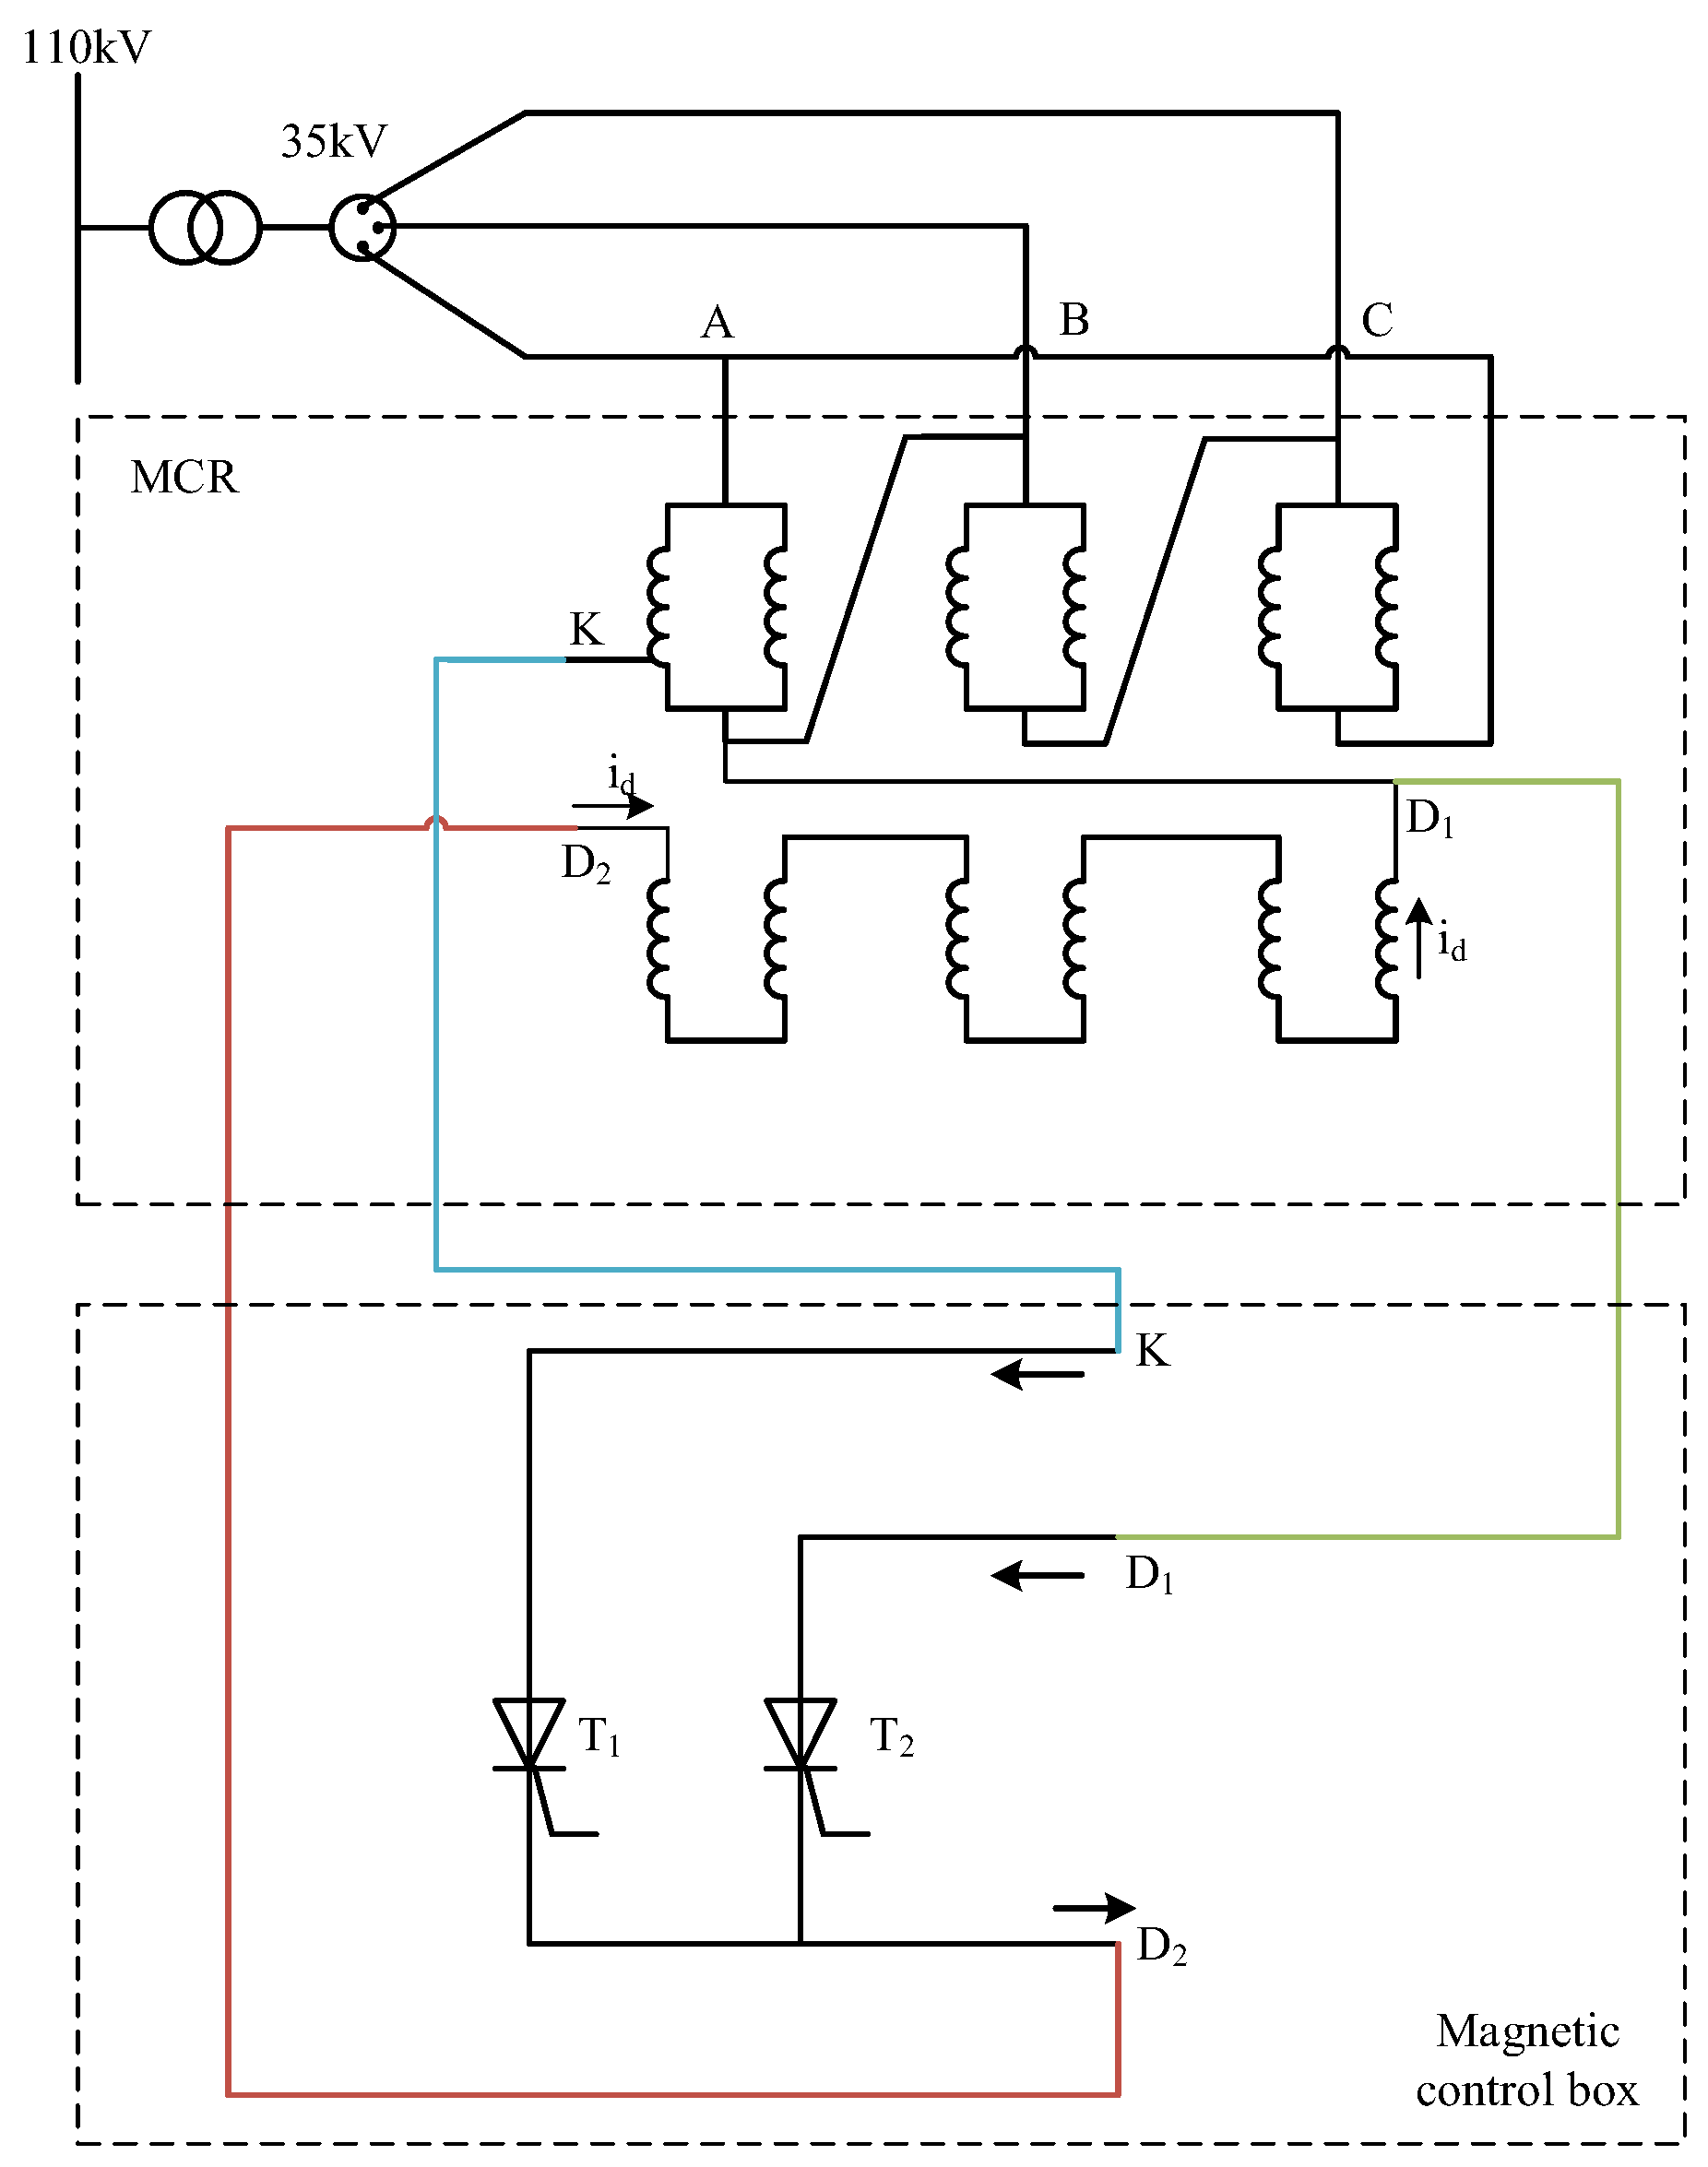
The test base uses a 110 kV line specially supplied by the power grid for the test, which can be connected to the high-voltage side of the MCR after the transformer is depressurized to 35 kV. The MCR dynamic response test wiring is divided into a body part (MCR) and a control part (magnetic control box), and its principle is shown in Figure 10. In the base, K is the additional tap drawn from phase A of the MCR working winding, the voltage drawn from the primary winding provides current for the magnetic control box, and D1 and D2 are the control winding contacts.
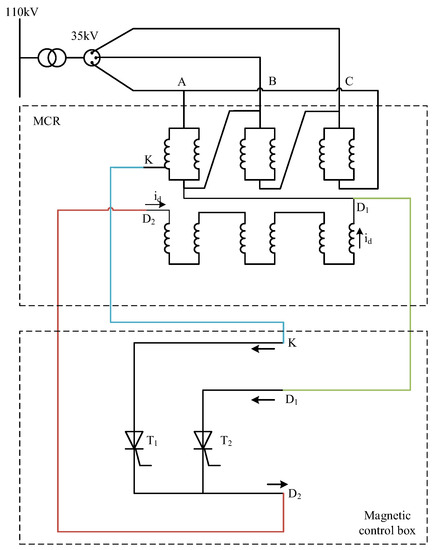
Figure 10.
MCR dynamic response test schematic.
When triggered, the thyristor T1 is conductive, and the current flows from K into the magnetic control box, then flows out from the D2 contact of the magnetic control box, flows into the control winding of the MCR body, flows through the three-phase control winding and returns to the K contact. When the control winding current reaches the set value, the thyristor T1 is turned off and the thyristor T2 is turned on. At this time, the control winding current flows out of the magnetic control box from the D2 contact and enters the MCR body. After flowing through the three-phase control winding, it flows out of the MCR body from the D1 contact and returns to the magnetic control box. When the thyristor T1 is turned on, the magnetic control box is in the trigger phase; when the thyristor T2 is turned on, the magnetic control box is in the freewheeling phase.
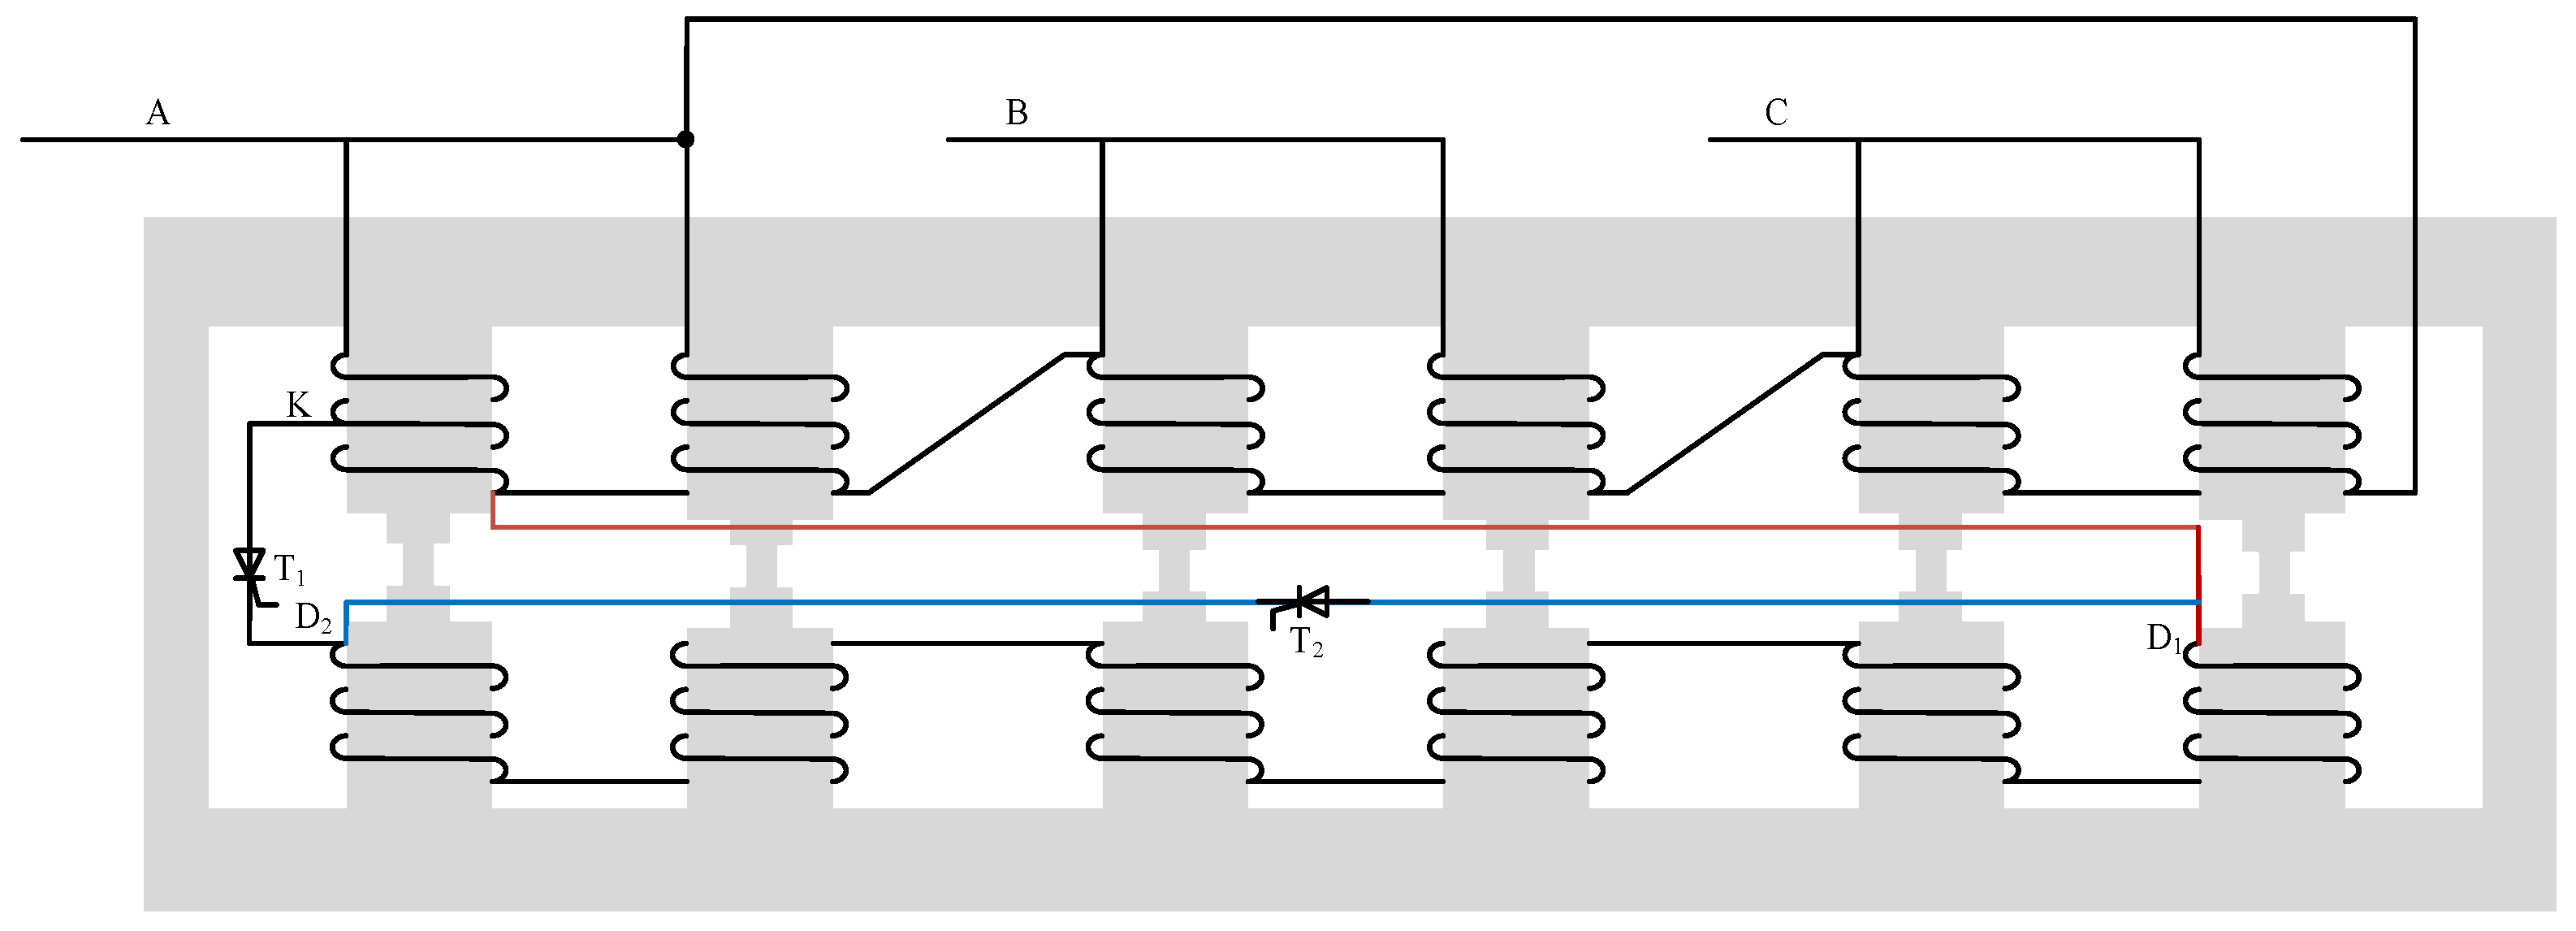
The internal iron core and winding wiring of the two-stage magnetic valve MCR is shown in Figure 11. Each phase consists of two iron cores. Each iron core is divided into upper and lower windings. The wiring is conducted according to the test schematic diagram. Tap K is extracted from the upper half winding of the left iron core of phase A, and connected with D2 contact of the lower half winding through thyristor T1. The D1 contact of the lower half winding of the right iron core of phase C is connected with the D2 contact through thyristor T2, while the D1 contact is connected with the end of the upper half winding of phase A.
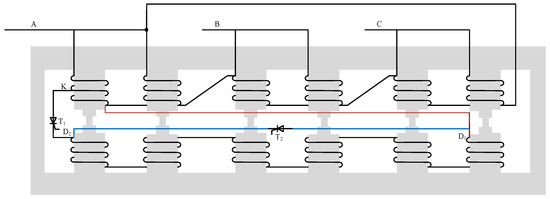
Figure 11.
MCR internal winding wiring diagram.
On the basis of the above principles and analysis, a three-phase magnetically controlled reactor with a rated voltage of 35 kV and a capacity of 18 Mvar and a two-stage magnetic valve structure was manufactured. The iron core was made using the technology of silicon steel lamination. We conducted dynamic response tests on this prototype to analyze the harmonic content during operation.
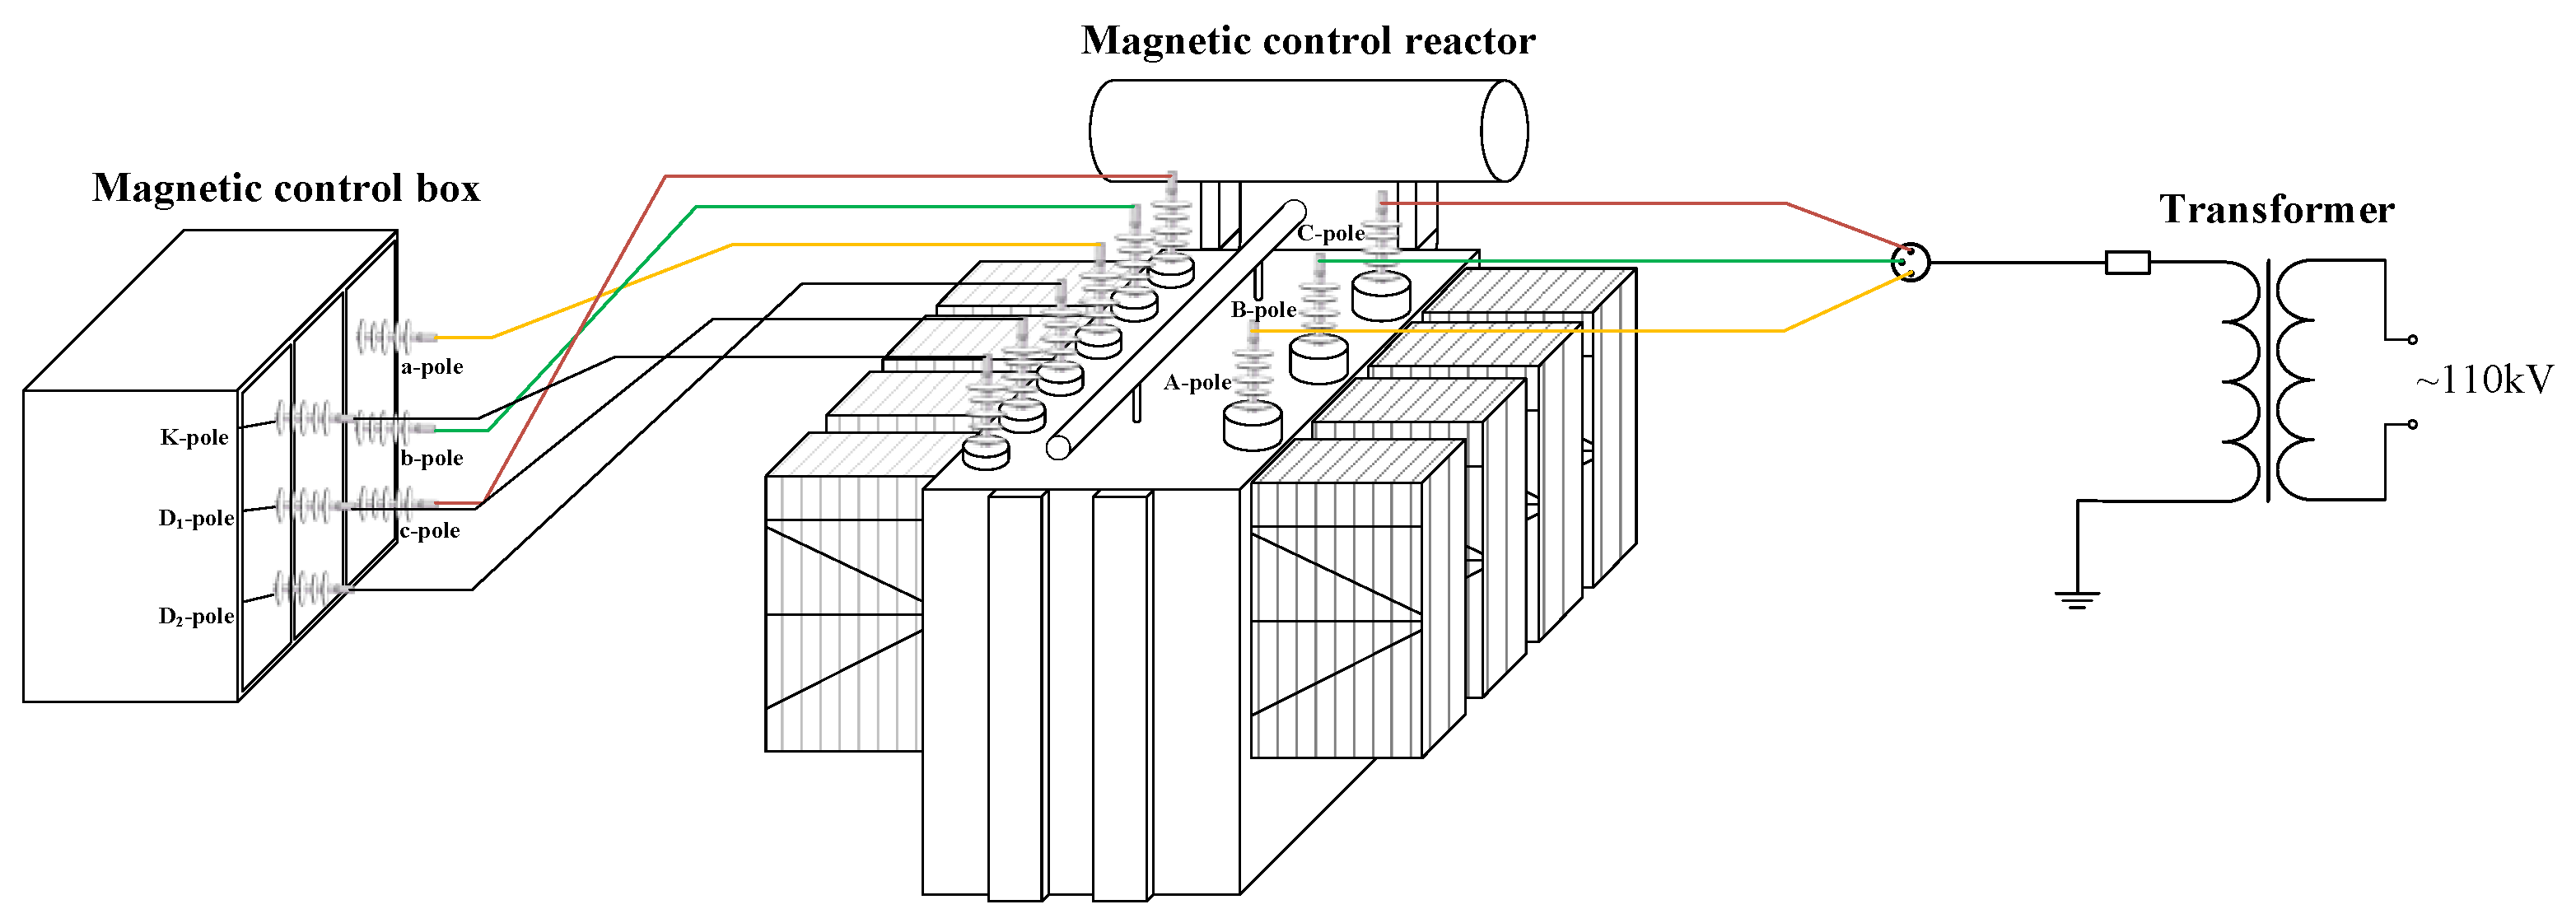
The 110 kV power supply of the test base was reduced to 35 kV through a transformer, and the high-voltage side of the magnetic reactor body was connected to the 35 kV side. The layout of the test site is shown in Figure 12, and the wiring was made according to the test layout. The test site is shown in Figure 13.
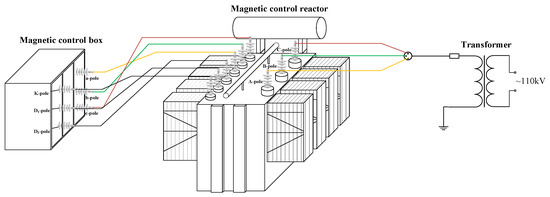
Figure 12.
Test site layout.
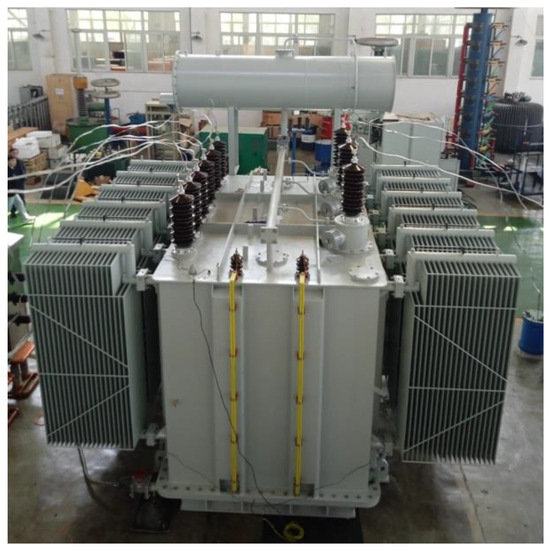
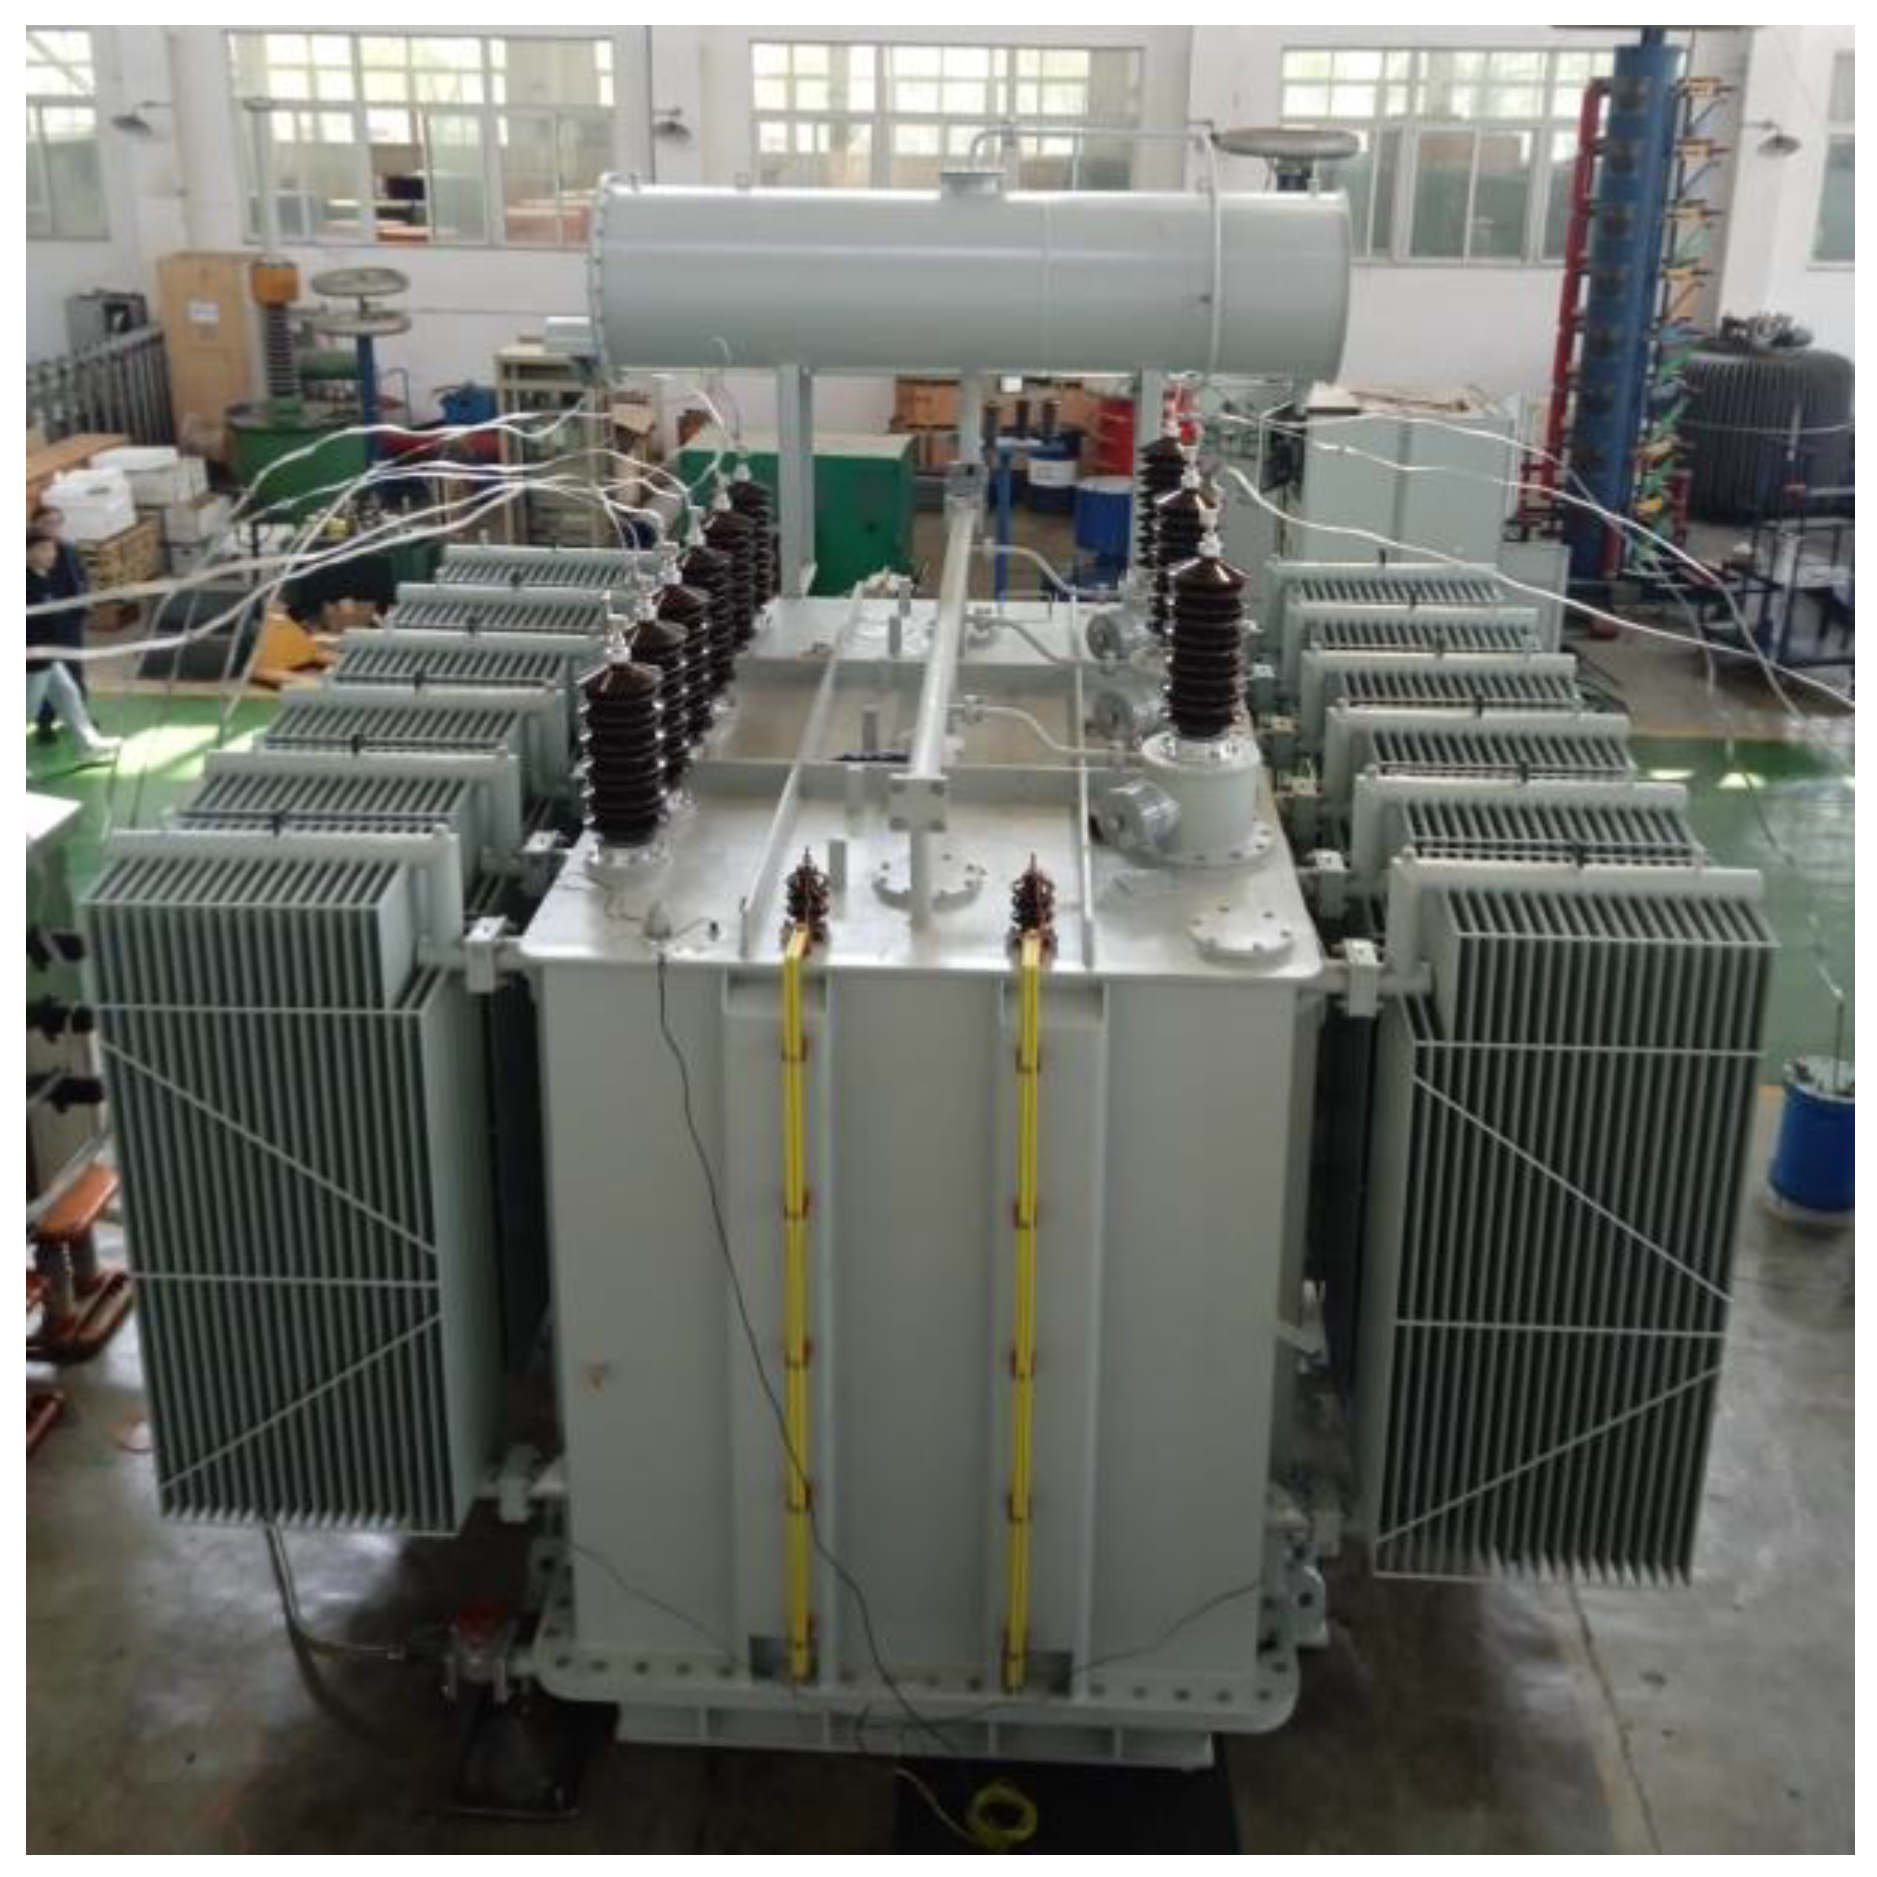
Figure 13.
MCR device and test site.
During the test, the rated voltage was momentarily applied to the magnetically controlled reactor. The triggering angle of the thyristor was adjusted to output the rated power of the magnetically controlled reactor. The working current waveform of the magnetically controlled reactor was observed, and the harmonic content was analyzed. When the multilevel magnetic valve structure was not used, the harmonic content of the magnetically controlled reactor under its rated operating state was about 5%. Through experimental verification, it was found that the multilevel magnetic valve structure could effectively reduce the harmonic content of the working current.
4.2. Analysis of Test Results
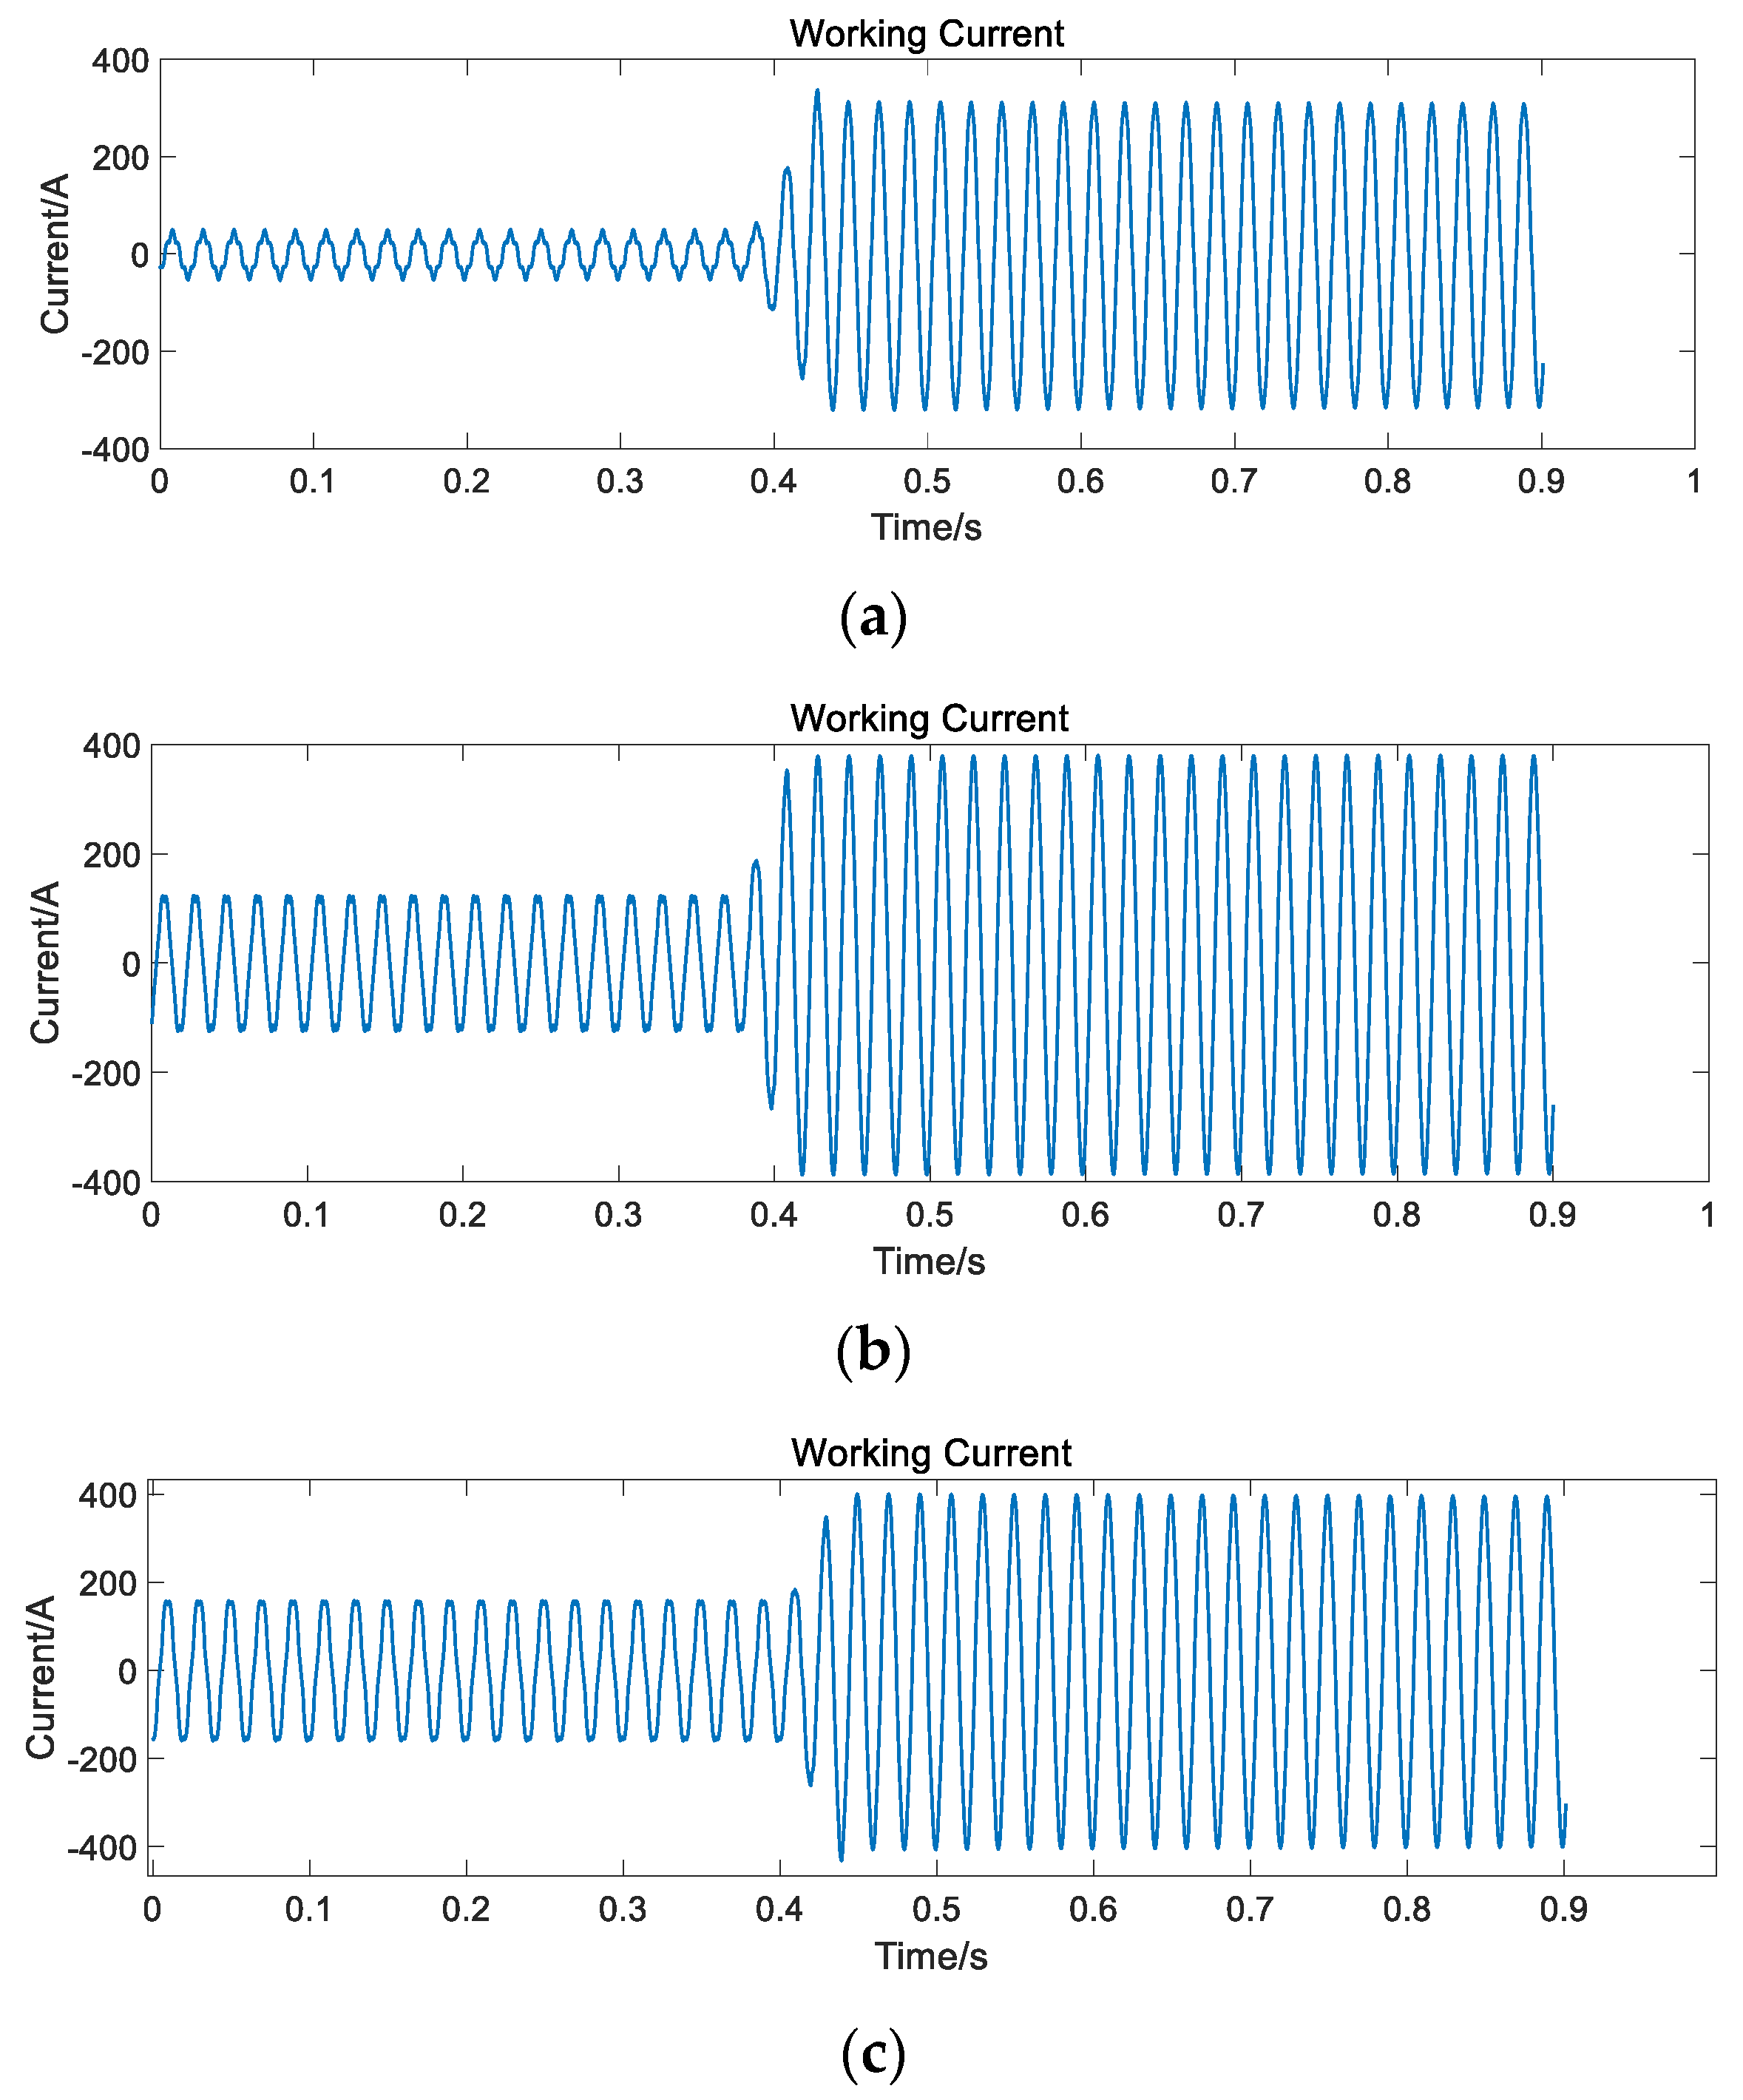
After wiring, the triggering angle and output capacity of the MCR were calibrated, and the dynamic response test was conducted. The output currents of the magnetic reactor were adjusted to 30 A, 75 A, 120 A, 210 A and 270 A. The current waveform recorded after the output current of the magnetic reactor was stable. The working current waveform is shown in Figure 14. The FFT spectrum of different working currents can be obtained by Fourier transformation of the working current waveform, and the harmonic content of each order under different working currents can be obtained, as shown in Figure 15.
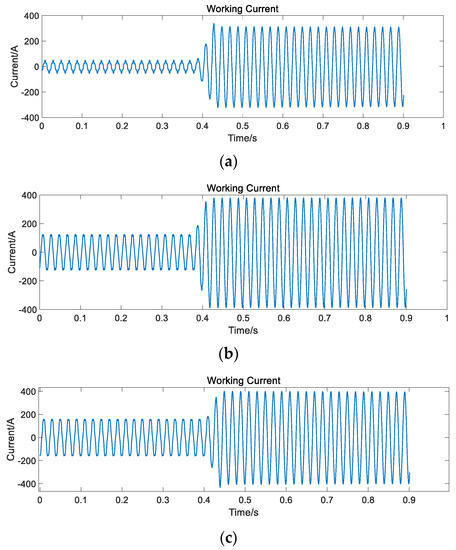
Figure 14.
Current waveforms under different working currents. (a) Current waveform when the working current is from 30 A to 210 A. (b) Current waveform when the working current is from 75 A to 270 A. (c) Current waveform when the working current is from 120 A to 270 A.
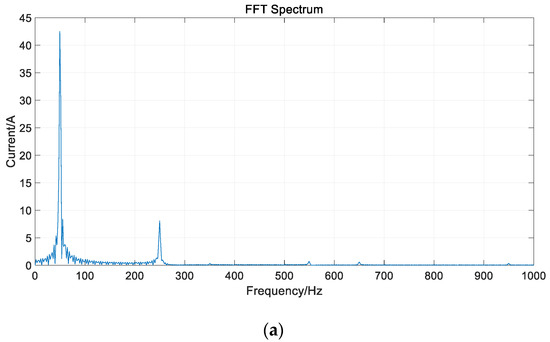
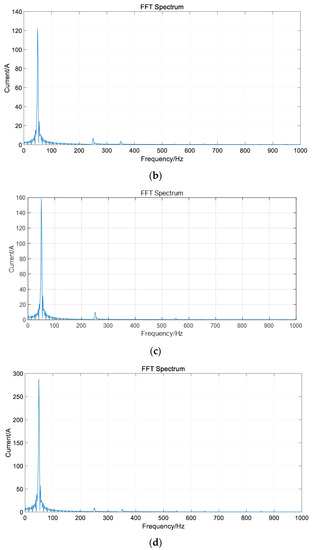
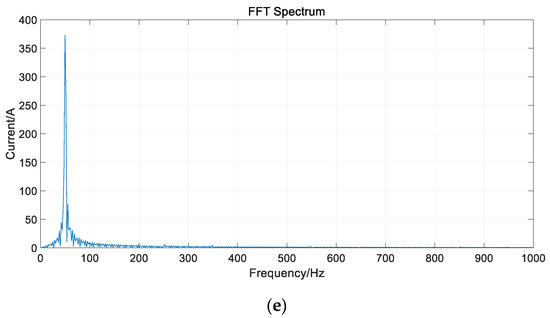
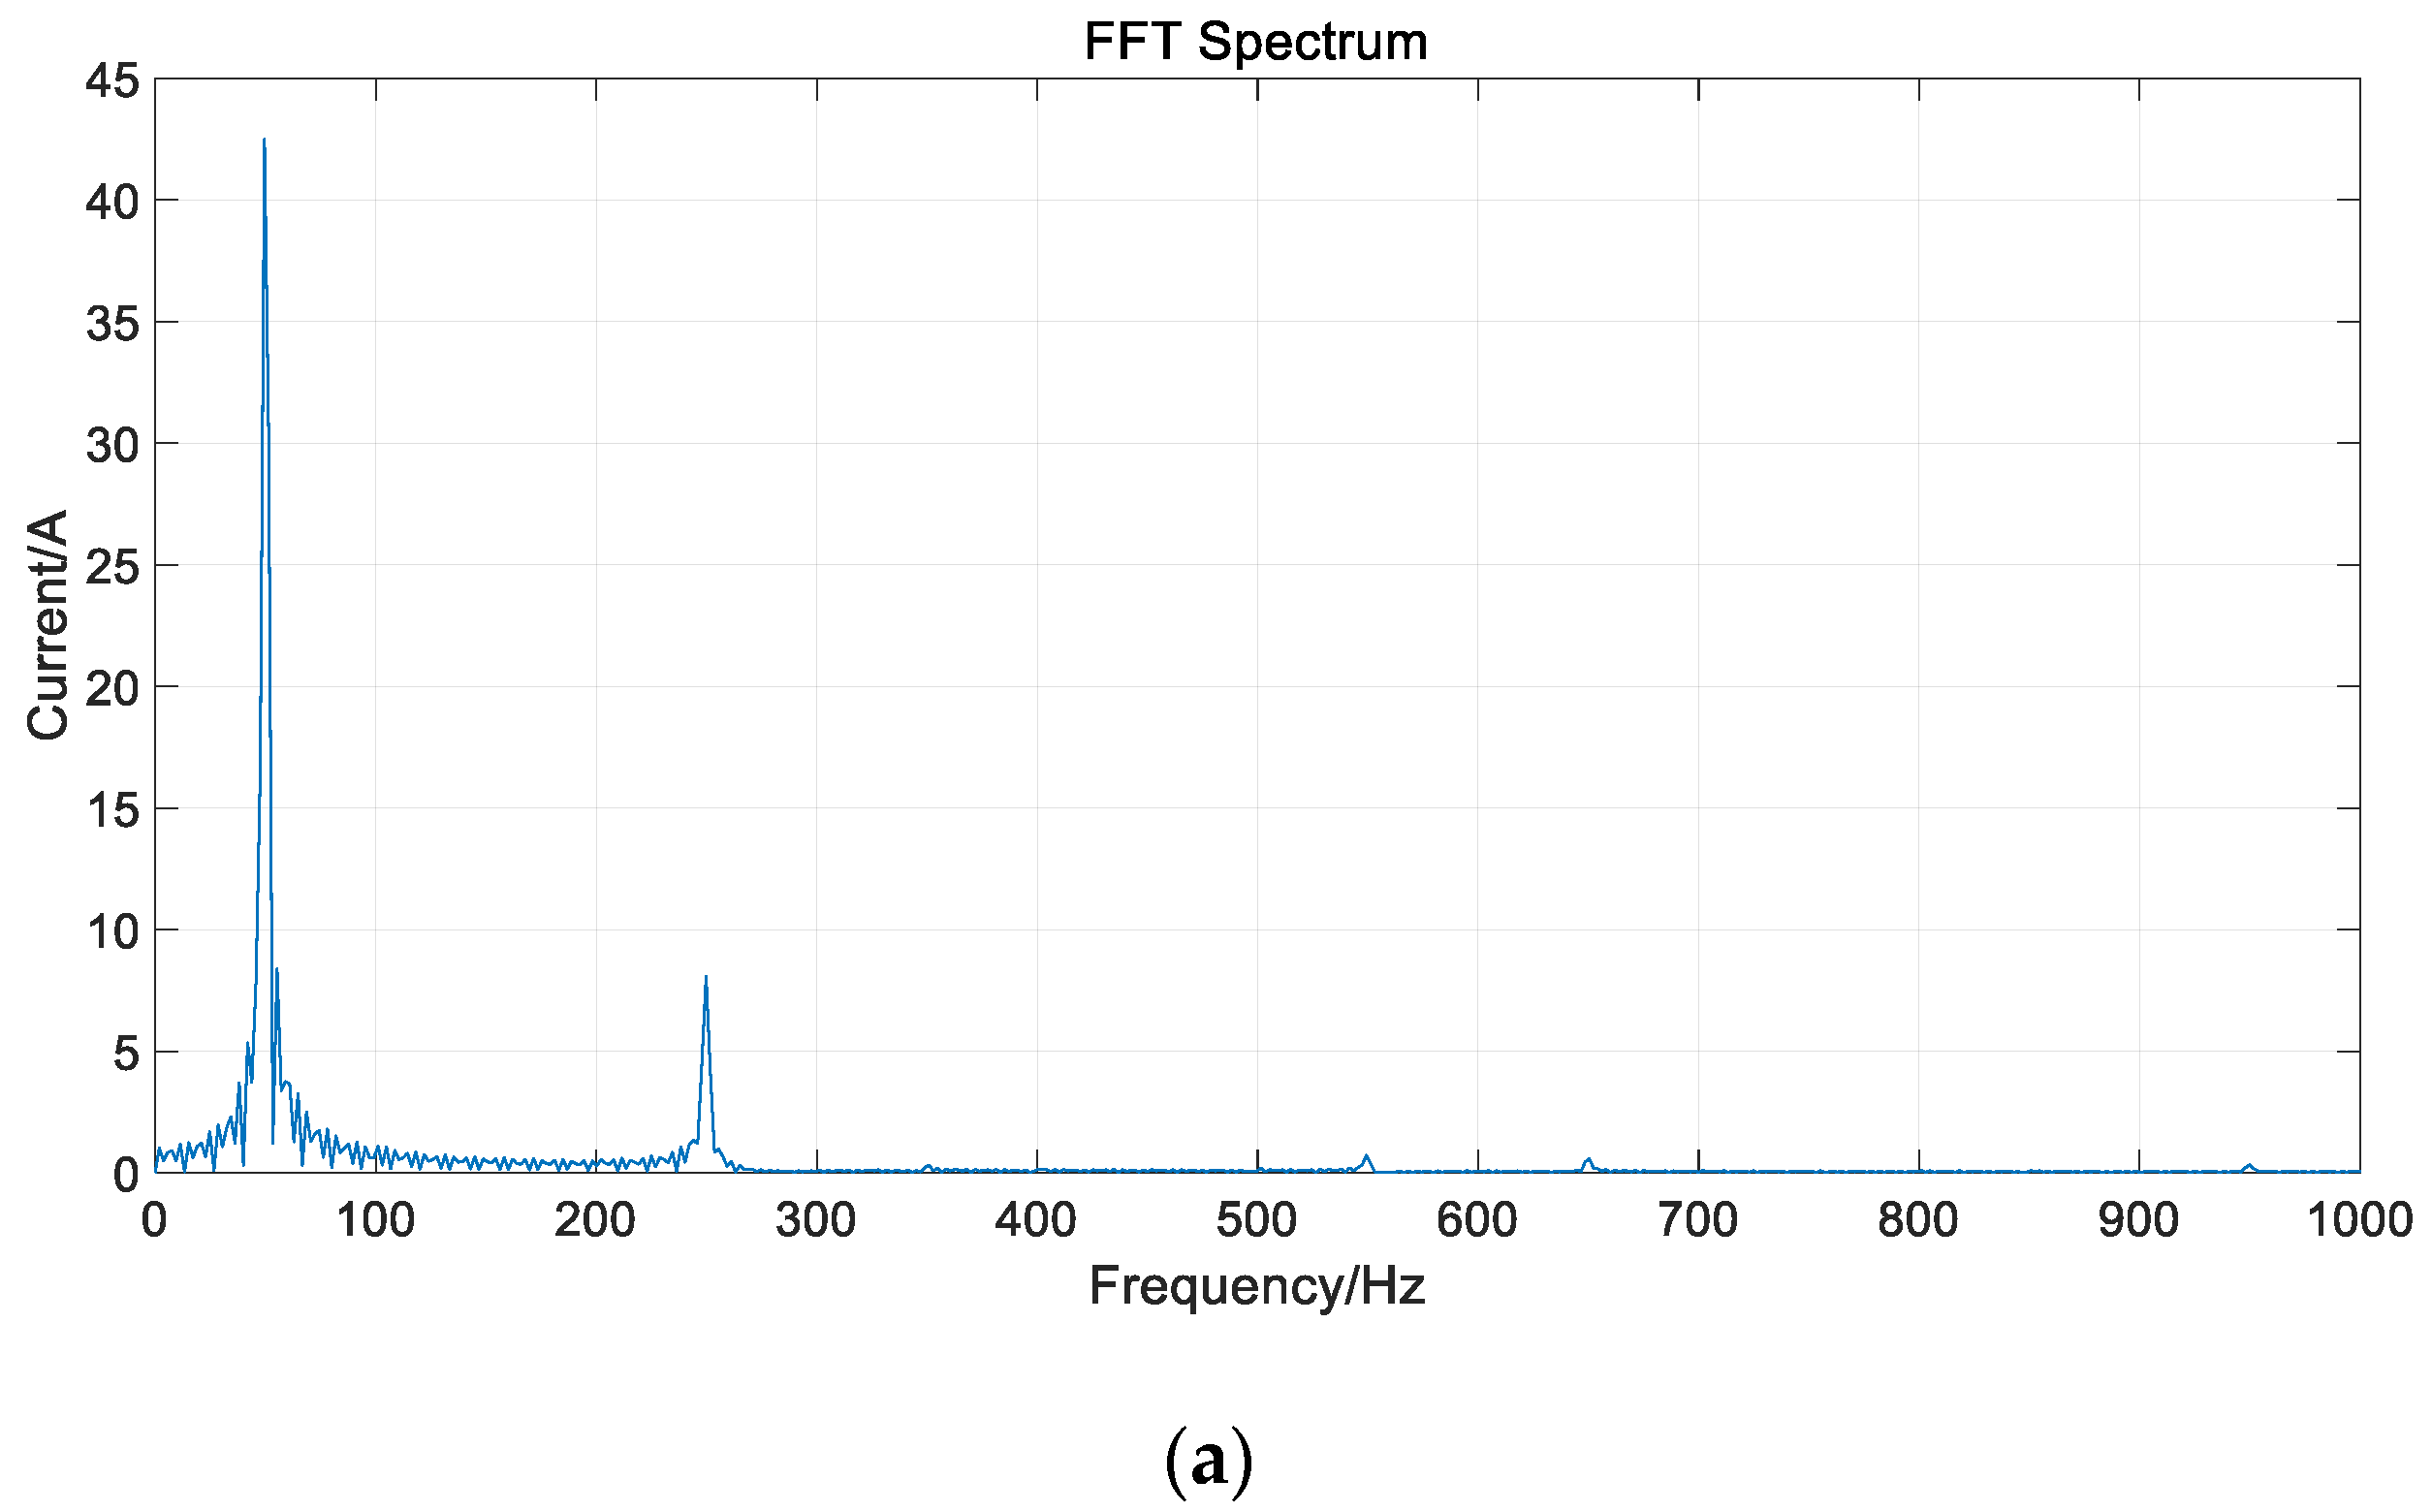
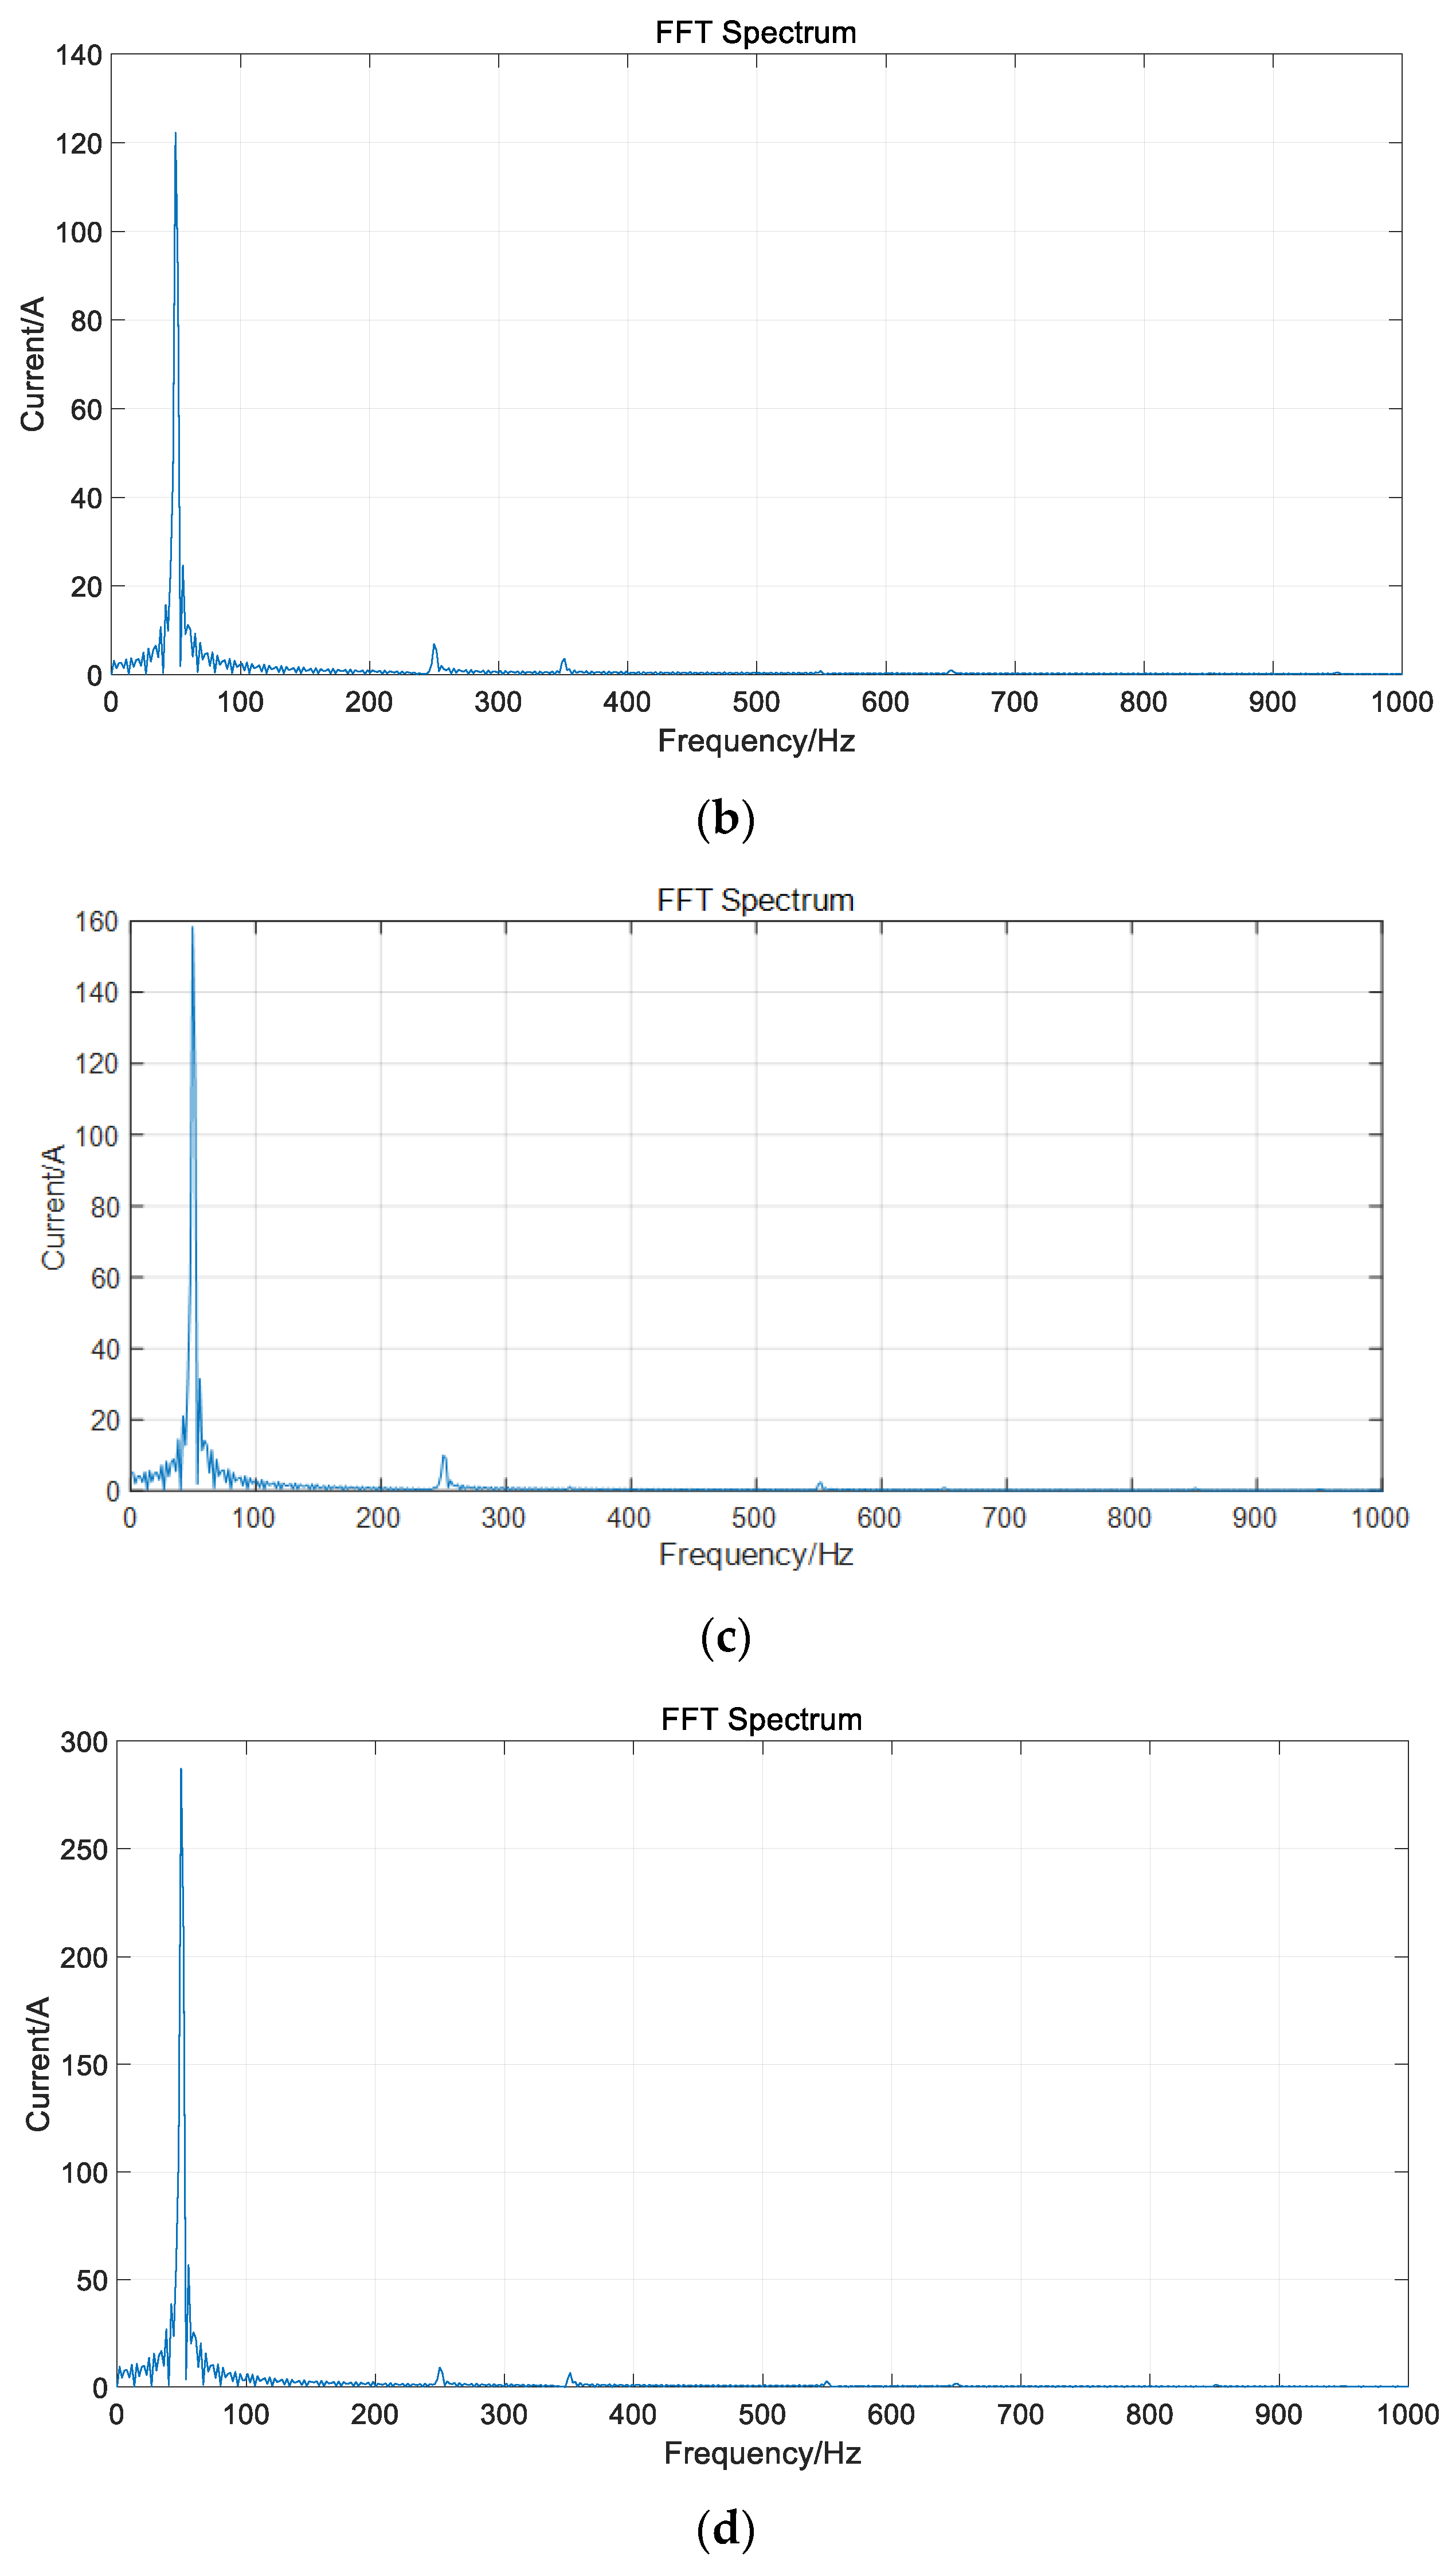
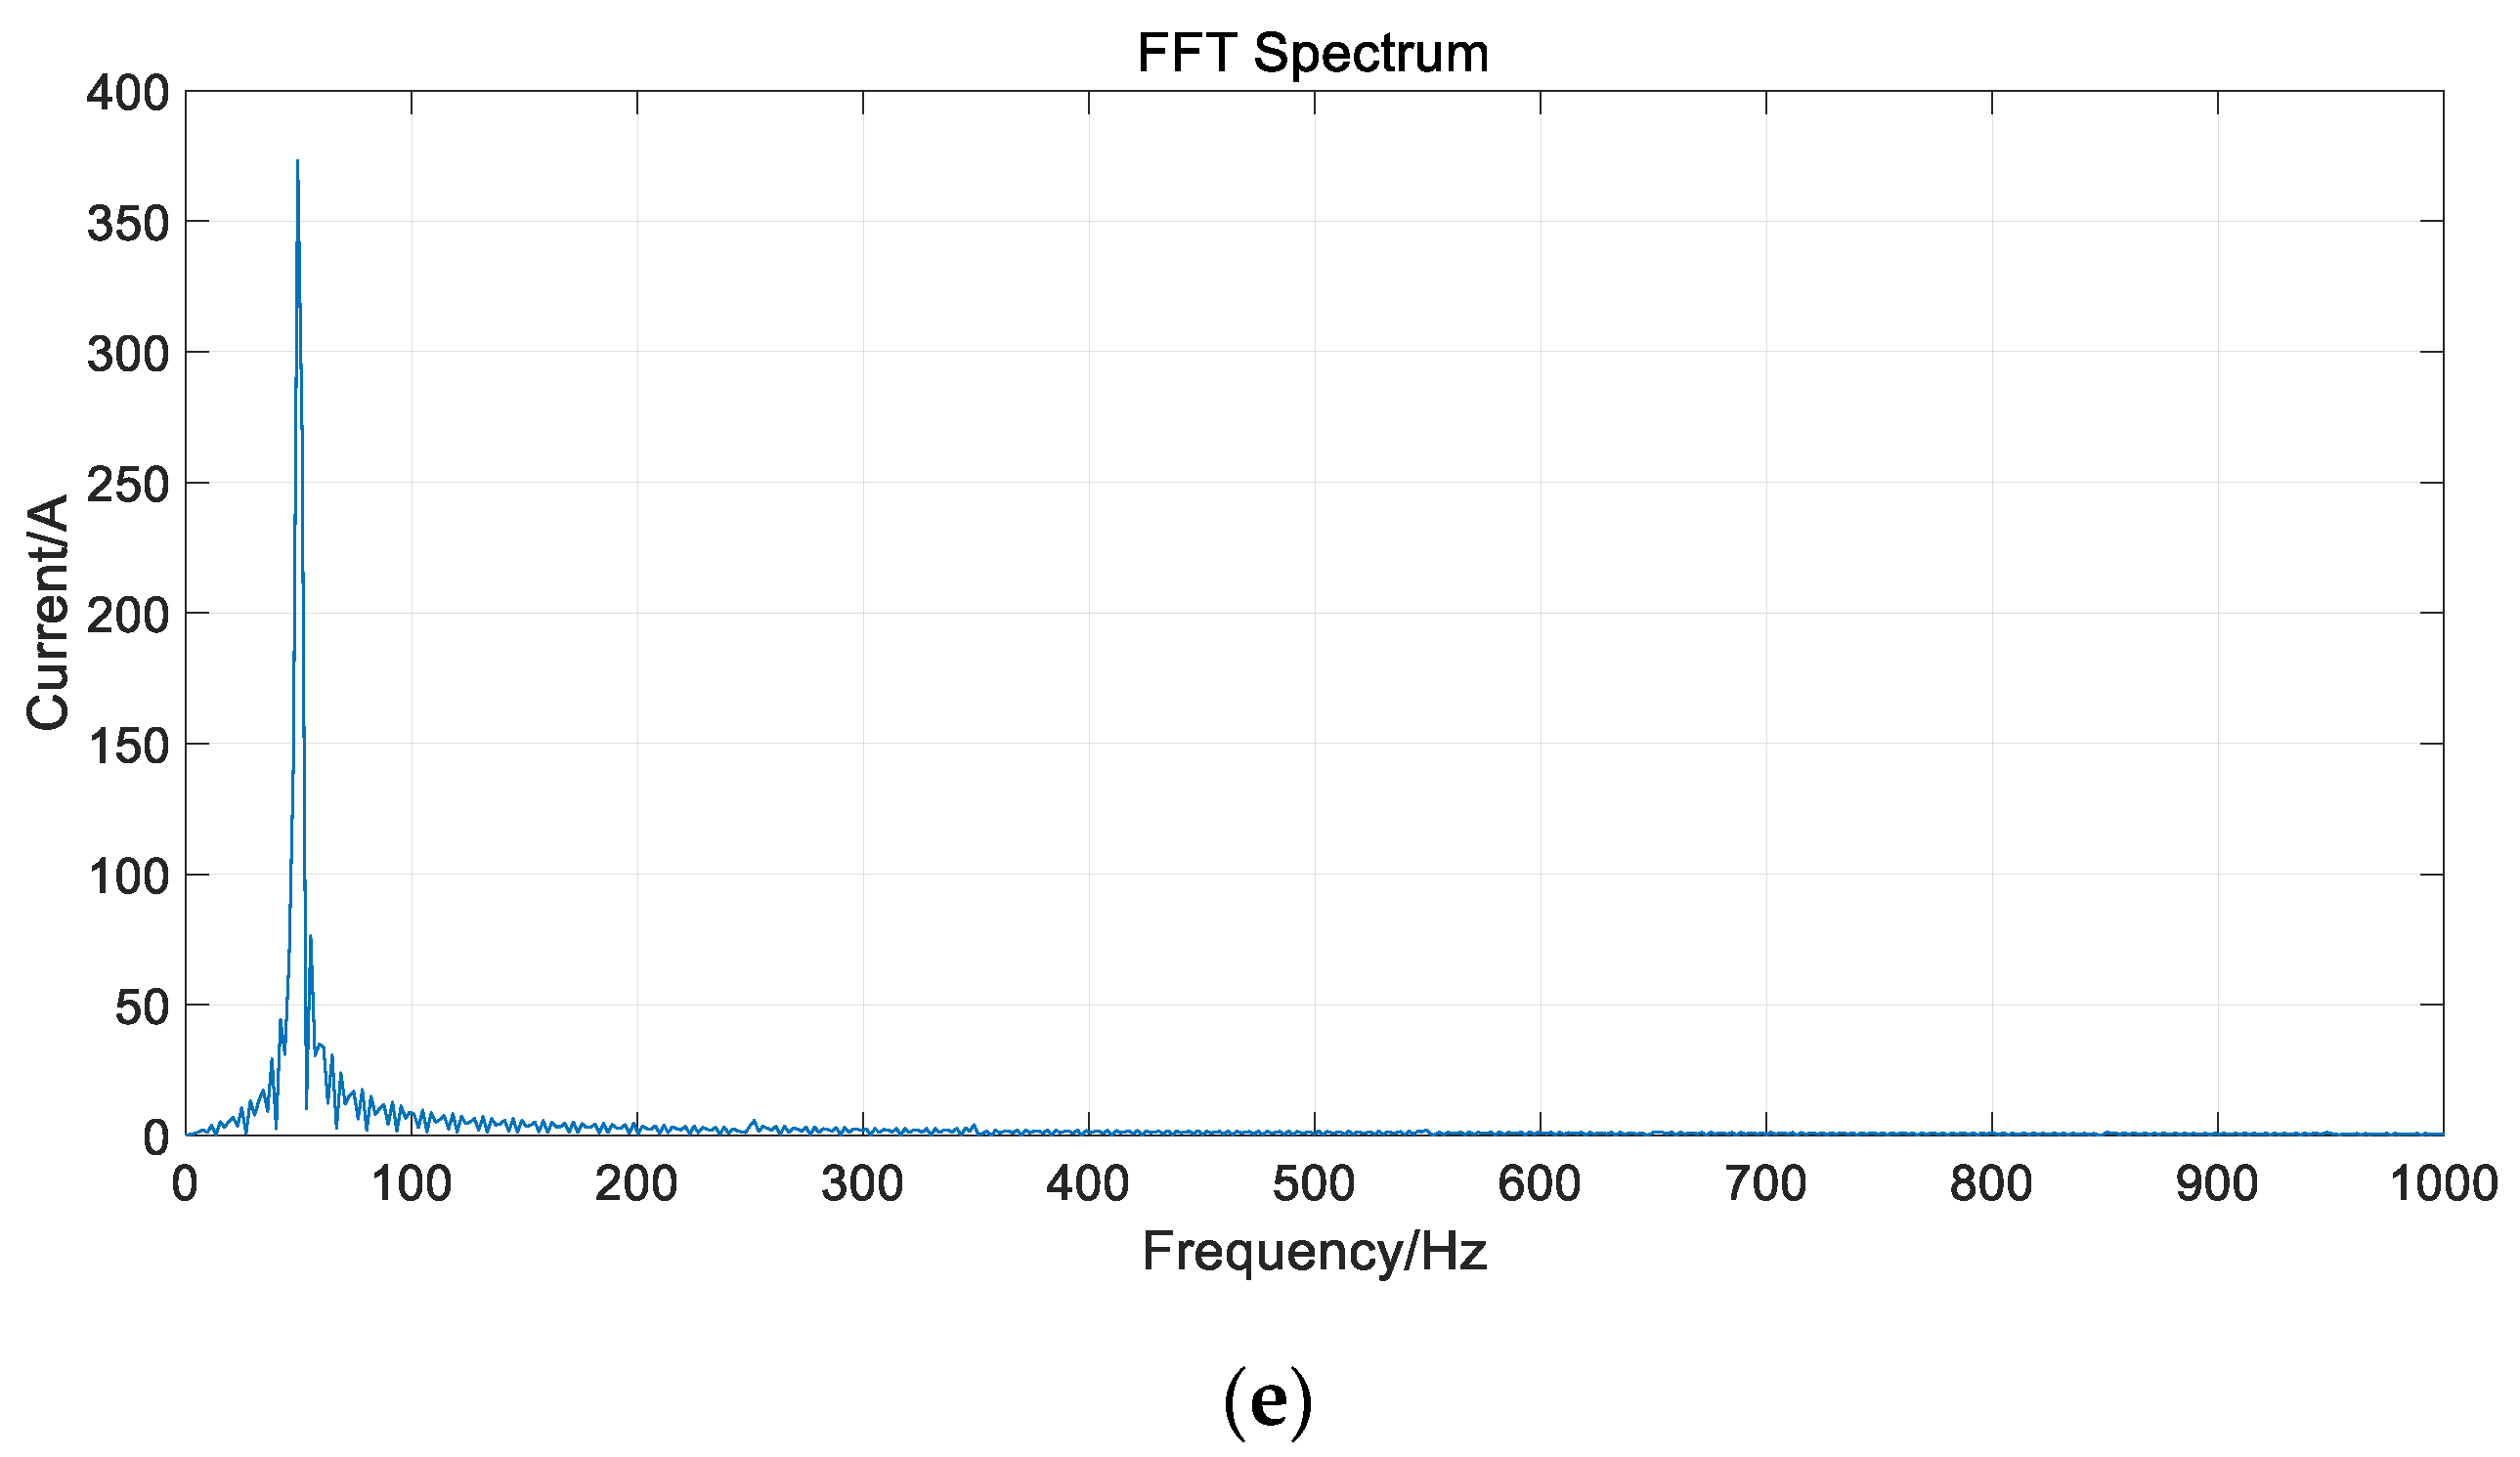
Figure 15.
Harmonic contents of each harmonic under different working currents. (a) Harmonic content of each harmonic when the working current is 30 A. (b) Harmonic content of each harmonic when the working current is 75 A. (c) Harmonic content of each harmonic when the working current is 120 A. (d) Harmonic content of each harmonic when the working current is 210 A. (e) Harmonic content of each harmonic when the working current is 270 A.
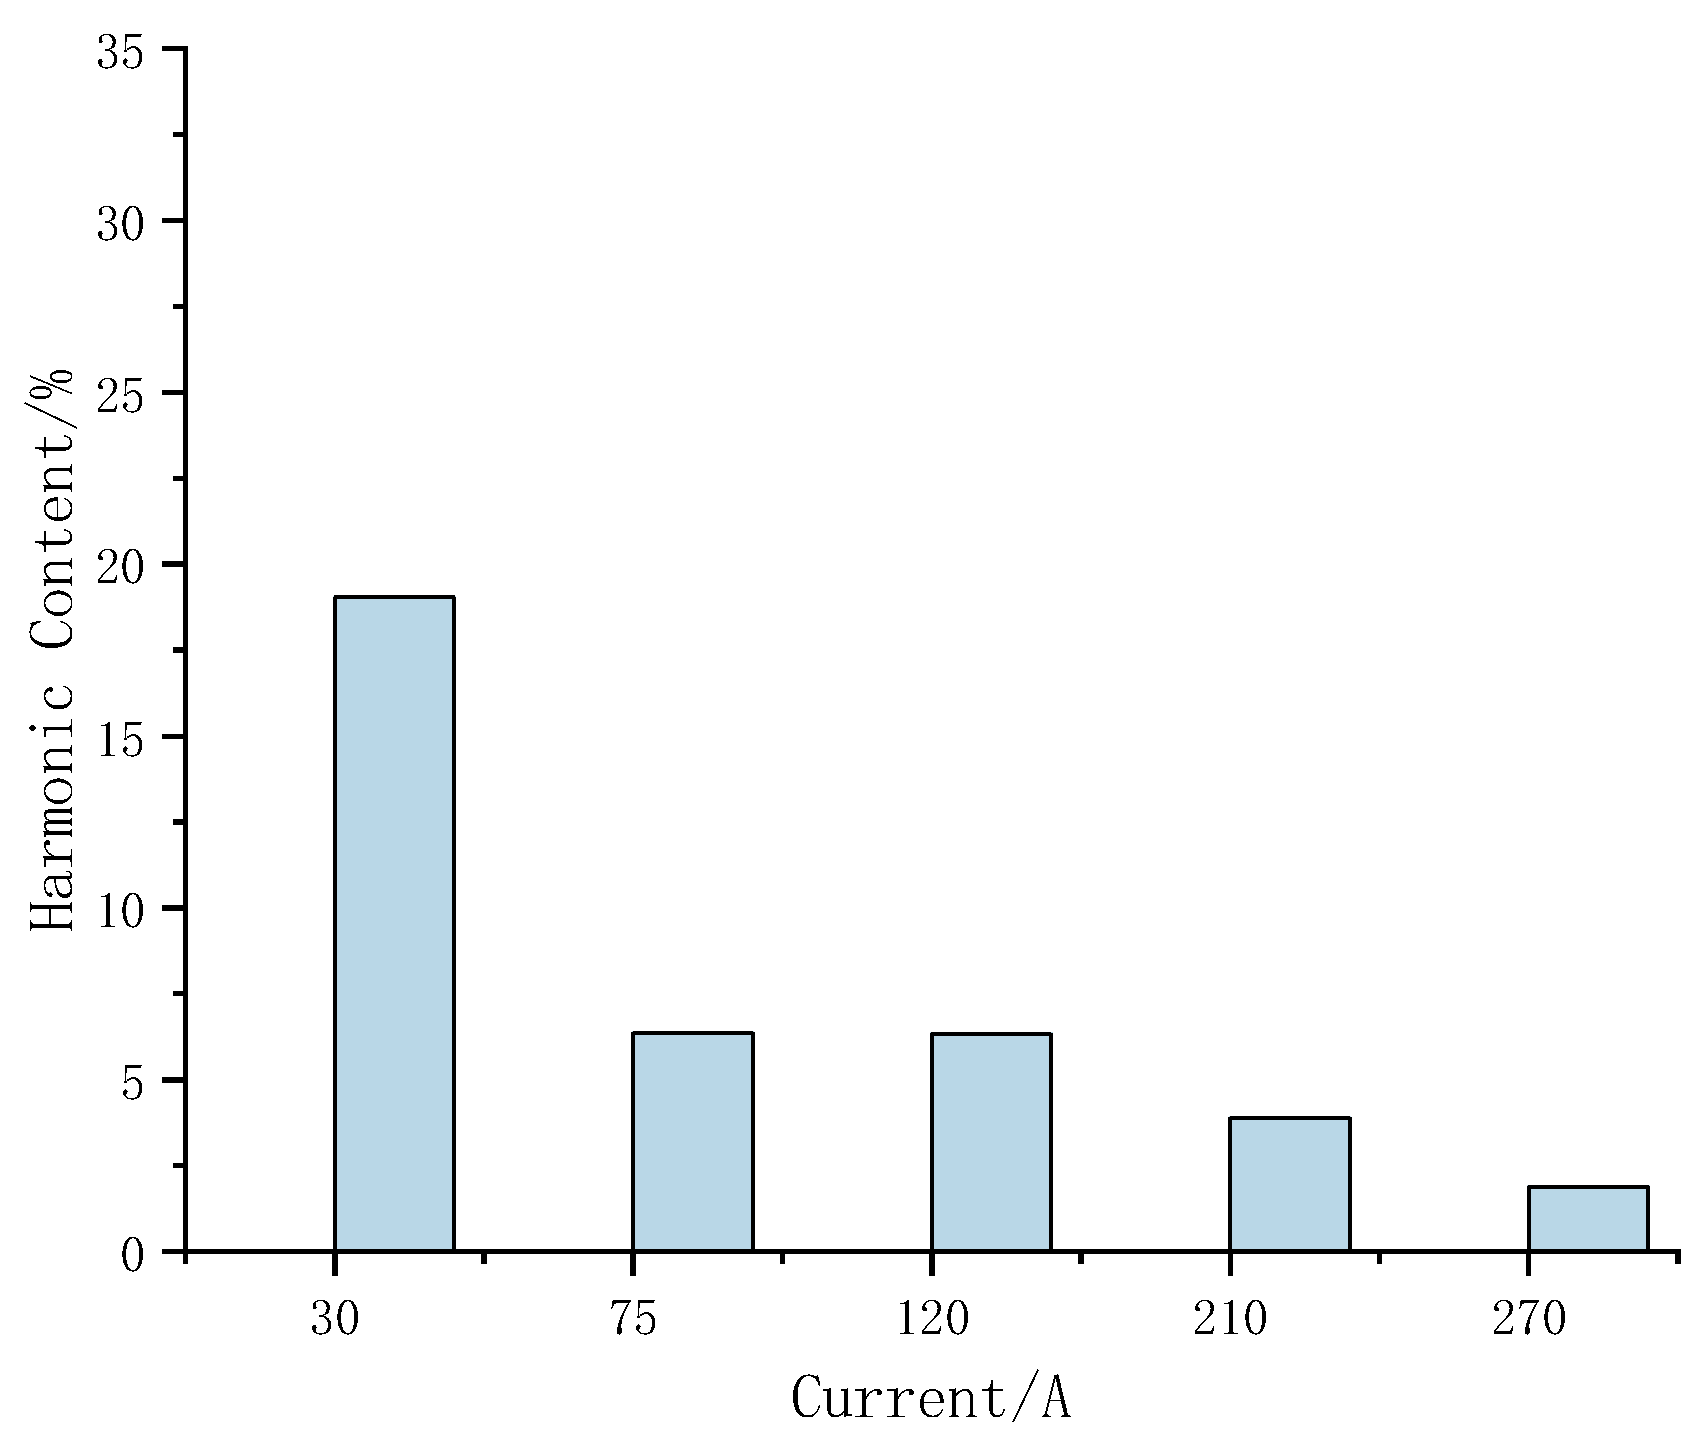
It can be seen from Figure 15 that with the increase in frequency, the harmonic content in the working current gradually decreases, of which the 5th and 7th harmonic content is relatively high, and the 9th and above harmonic contents are negligible. The percentages of the amplitudes of the 5th and 7th harmonic currents under different working currents relative to the amplitude of the fundamental current under this capacity were obtained, as shown in Figure 16. As the contents of other harmonics in the working current are very small, except for the 5th and 7th harmonics, they can be ignored. The calculation formula of the total harmonic distortion (THD) is as follows:
where G1 is the rms value of fundamental component, Gn is the rms value of harmonic component and H is the number of harmonics. The magnitude of THD in the working current can be obtained from Equation (11) at different output capacities, as shown in Figure 17.
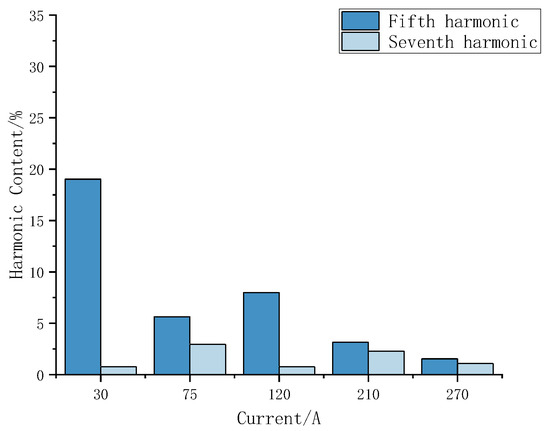
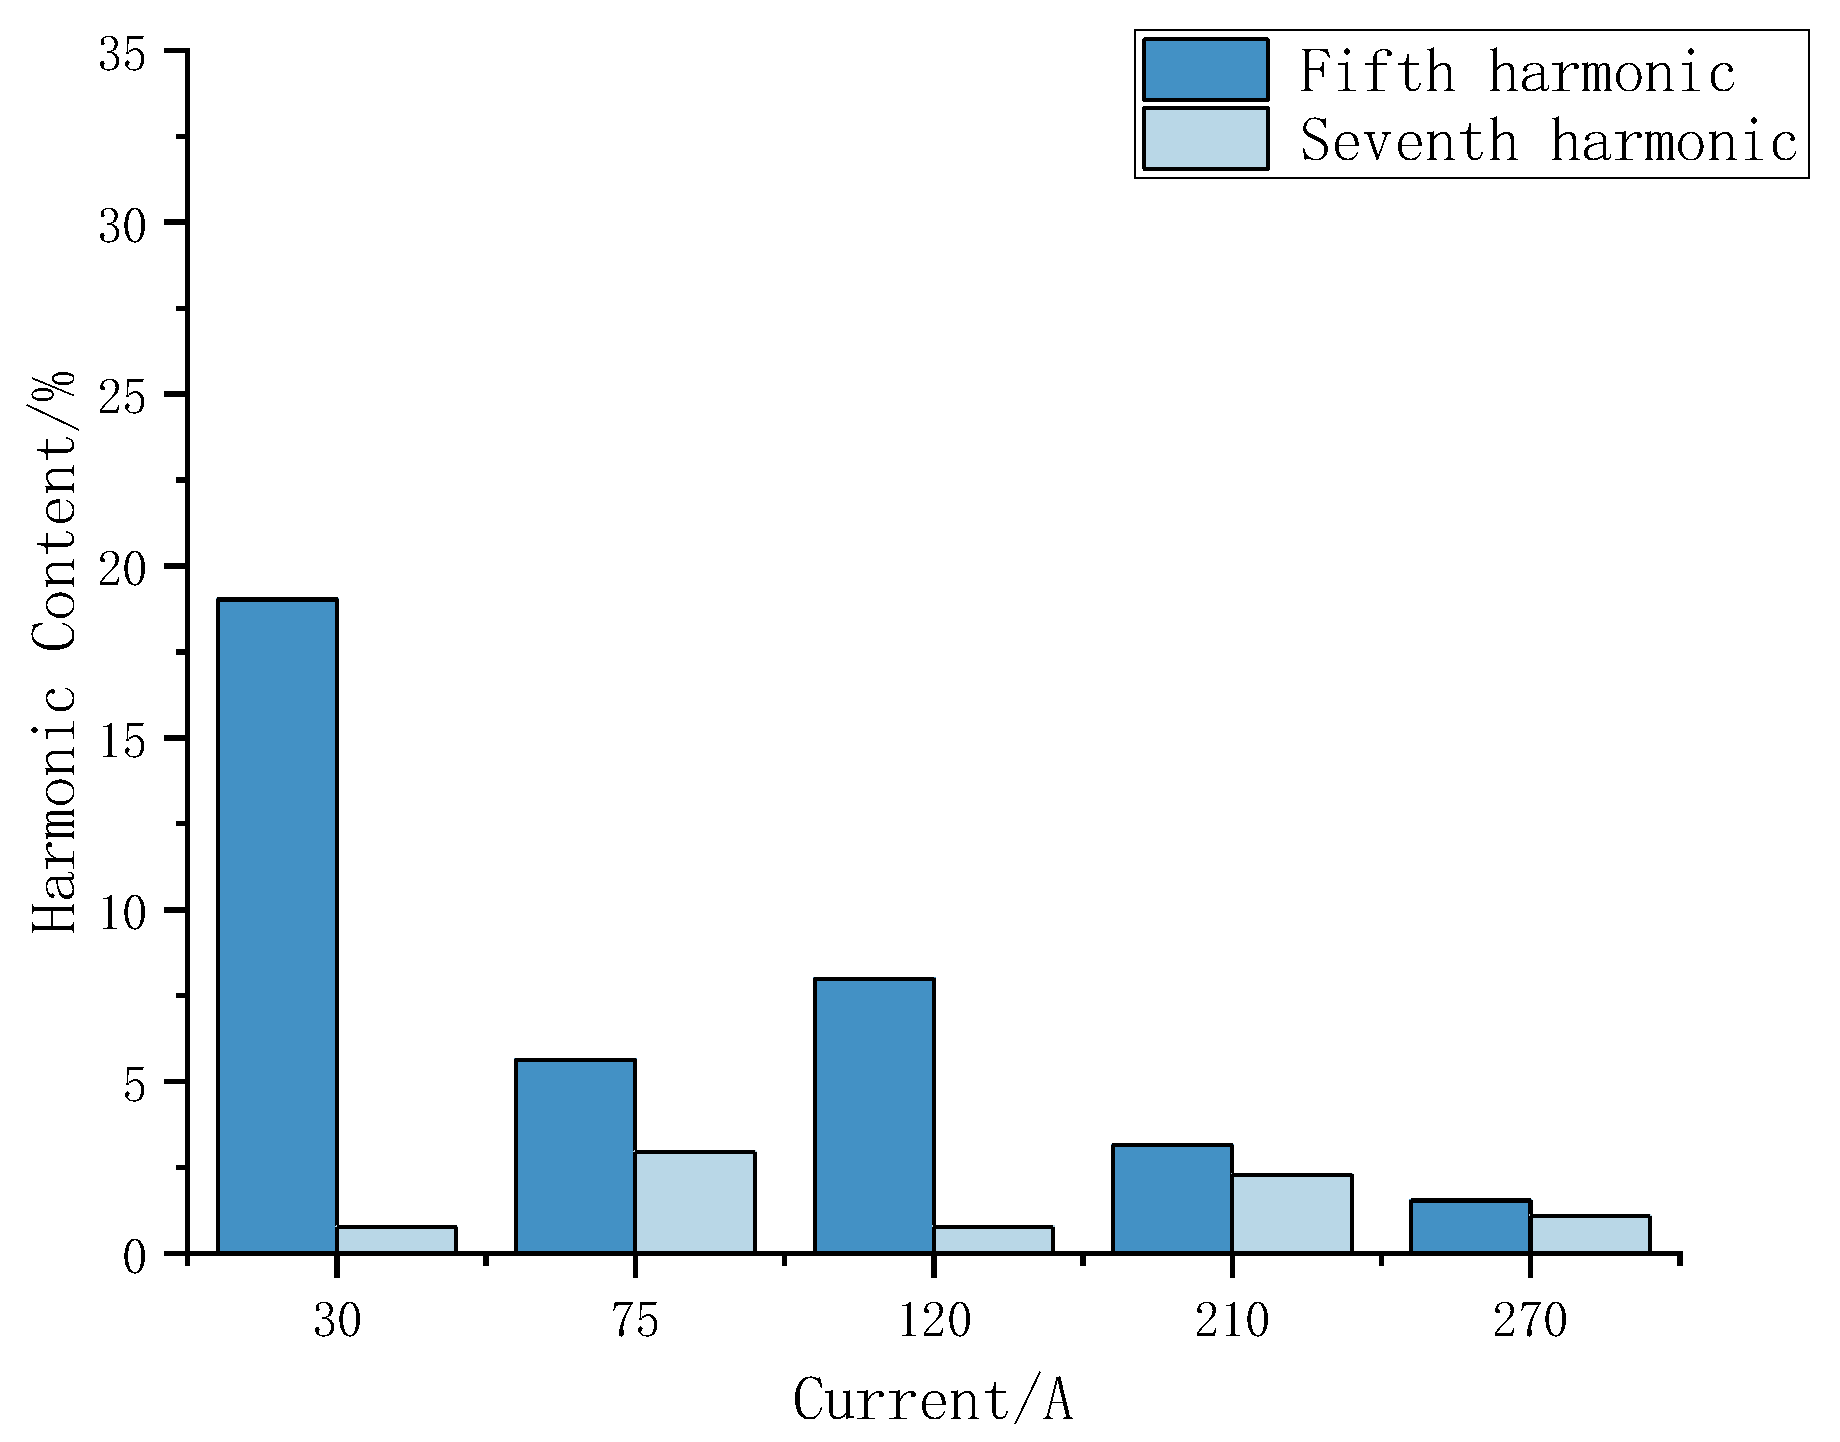
Figure 16.
Fifth and seventh harmonic contents under different working currents.
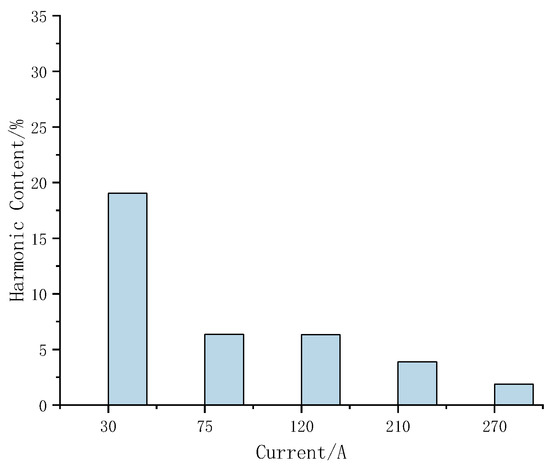
Figure 17.
THD value of working current under different output capacities.
It can be seen from Figure 16 that the seventh harmonic content is less than the fifth harmonic content under different working currents. It can be seen from Figure 17 that THD in the working current decreases gradually as the output capacity approaches the rated capacity, and the trend and value are close to and the simulation results, which verifies that changing the core magnetic valve structure can effectively reduce the harmonic content in the working current, and proves the accuracy of the simulation results. When the working current is 270 A, the total harmonic distortion is 1.89%. Compared to magnetically controlled reactors in the past, the harmonic content has been significantly reduced. It has been proven feasible to suppress harmonic content by changing the structure of the iron core at the experimental level.
5. Conclusions
In this study, based on the existing TSMCR and MSMCR magnetic valve structures, a simulation model of a three-phase magnetically controlled reactor was established. From the simulation analysis, it can be concluded that the optimized TSMCR and MSMCR structures can effectively reduce the 5th and 7th harmonic contents in the working current of the magnetically controlled reactor, and the effectiveness of the harmonic optimization scheme was verified on the harmonic suppression of the three-phase magnetically controlled reactor simulation model. We used a lamination process to produce the iron core of a two-stage magnetic valve structure, and made a prototype with a rated voltage of 35 kV and a name plate capacity of 18 Mvar. A dynamic response test was carried out on the prototype of the two-stage magnetic valve magnetically controlled reactor. The test results show that the THD gradually decreases as the output capacity approaches the name plate capacity until finally, it is less than 2%, which is consistent with the simulation results. The harmonic content is much lower than that of previous magnetically controlled reactors, verifying the correctness of the method of suppressing harmonic content by adjusting the iron core structure.
Author Contributions
Data curation, C.W.; investigation, C.L.; resources, C.L., Y.B. and Y.L.; writing—original draft, X.Y.; writing—review and editing, B.C., X.C. and Y.W. All authors have read and agreed to the published version of the manuscript.
Funding
This research was funded by the science and technology project “Research on Magnetic Controlled Intelligent Reactive Power Transformer” of the Electric Power Scientific Research Institute of State Grid Inner Mongolia East Power Co., project number SGMDDK00DJJS2200086.
Data Availability Statement
The datasets used and analyzed during the current study are available from the corresponding author on reasonable request.
Conflicts of Interest
The authors declare no conflict of interest.
References
- Chen, B.; Kokernak, J. Thyristor Controlled Two-Stage Magnetic-Valve Reactor for Dynamic Var-Compensation in Electric Railway Power Supply Systems. In Proceedings of the APEC 2000, New Orleans, LA, USA, 6–10 February 2000; pp. 1066–1072. [Google Scholar]
- Li, G.; Li, G.; Yan, S. Analysis of 4th harmonic amplification of 10 kV series reactor. Electrotech. Electr. 2021, 6, 33–37. [Google Scholar]
- GB/T 14549-1993; Quality of Electric Energy Supply-Harmonics in Public Supply. Standards Press of China: Beijing, China, 1993.
- Zhang, R.; Deng, G. Discussion on the problems in the Practical Application of GB/T 14549-93 Power Quality Power System Harmonics. China Electr. Power Educ. 2010, S1, 289–291. [Google Scholar]
- Wang, Z. Harmonic Suppression and Reactive Power Compensation; China Machine Press: Beijing, China, 2016. [Google Scholar]
- Zhan, Y.; Cheng, H.Z.; Ge, N.C.; Huang, G. Generalized growing and pruning RBF neural network based harmonic source modeling. Proceeding CSEE 2005, 25, 42–46. [Google Scholar]
- Wu, D.; Xu, Z. Harmonic modeling of electric loads. Power Syst. Technol. 2004, 28, 20–24. [Google Scholar]
- Zhao, C. Research on Multiphysical Fields of Power Capacitor and Its Series Reactor under the Influence of Harmonics. Master’s Thesis, South China University of Technology, Guangzhou, China, 2021. [Google Scholar]
- Tian, M.; An, X.; Gu, S. Voltage-controlling methods and simulation analysis of magnetically saturated and transformer-type controllable reactors. High Volt. Eng. 2013, 39, 791–796. [Google Scholar]
- Gao, G.; Chen, H.; Tian, M. Design and simulation of voltage control system for magnetic saturation type controllable reactor. Transformer 2013, 50, 39–42. [Google Scholar]
- Liu, H.; Yin, Z.; Dong, X.; Xu, J.; Li, H. A method of harmonic excitation based on magnetically controlled reactor. Autom. Electr. Power Syst. 2015, 39, 120–125+154. [Google Scholar]
- Zhou, L.; Yin, Z.; Xiao, X. Harmonic suppression in the electric propulsive shipping system based on phase-shifting reactor. Trans. China Electrotech. Soc. 2007, 22, 90–94. [Google Scholar]
- Chen, X.; Chen, B.; Tian, C.; Yuan, J. Optimization technique of harmonic suppression for TSMCR. Electr. Power Autom. Equip. 2011, 31, 71–75. [Google Scholar]
- Chen, X.; Tian, C.; Chen, B.; Liu, Y.; Yuan, J. Mathematical Model for Harmonics Analysis of the Multi-Stage Saturable Magnetic-Valve Controllable Reactor. Trans. China Electrotech. Soc. 2011, 26, 57–64. [Google Scholar] [CrossRef]
- Gao, D.; Yuan, H.; Zhang, Y. Novel three-phase multi-stage magnetically controlled reactor for harmonic suppression. High Volt. Appar. 2008, 44, 389–391. [Google Scholar]
- Zhang, G. Research and Analysis on the Characteristics of New Magnetic Control Reactor. Master’s Thesis, Zheng Zhou University, Zhengzhou, China, 2020. [Google Scholar]
- Jiang, P.; Li, Z.; Wei, L.; Li, F.; Li, F.; Liu, T. Research on fast response of magnetically controlled reactor based on IGBT full control bridge. Transformer 2021, 58, 27–32. [Google Scholar]
- Chen, B. Theory and Application of New Type Controllable Saturable Reactor; Wuhan University of Water Resources and Electric Power Press: Wuhan, China, 1999. [Google Scholar]
- Chen, B.; Tian, C.; Liang, B.; Wang, Q. Principle and implementation of a harmonic depression approach for single phase controlled saturable reacor. Proc. CSEE 2002, 22, 64–68. [Google Scholar]
- Karymov, R.R.; Ebadian, M. Comparison of Magnetically Controlled Reactor (MCR) and Thyristor Controlled Reactor (TCR) from harmonics point of view. Int. J. Electr. Power Energy Syst. 2007, 29, 191–198. [Google Scholar] [CrossRef]
- Chen, B.; Chen, W. Voltage restraining characteristic and harmonic analysis of high-voltage controller reactor. Proc. CSEE 1997, 17, 122–125. [Google Scholar]
- Tian, M.; Li, Q.; Wang, S. An equivalent physical model and a mathematical model of the controlled saturable reactor. Trans. China Electrotech. Soc. 2002, 17, 18–21. [Google Scholar]


Disclaimer/Publisher’s Note: The statements, opinions and data contained in all publications are solely those of the individual author(s) and contributor(s) and not of MDPI and/or the editor(s). MDPI and/or the editor(s) disclaim responsibility for any injury to people or property resulting from any ideas, methods, instructions or products referred to in the content. |
© 2023 by the authors. Licensee MDPI, Basel, Switzerland. This article is an open access article distributed under the terms and conditions of the Creative Commons Attribution (CC BY) license (https://creativecommons.org/licenses/by/4.0/).