Article

Comparison of Least-Cost Pathways towards Universal Electricity Access in Somalia over Different Timelines

1
Division of Energy Systems, Department of Energy Technology, KTH Royal Institute of Technology, 10044 Stockholm, Sweden
2
Project Implementation Unit, Ministry of Energy and Water Resources, Mogadishu, Somalia
3
KTH Climate Action Centre, KTH Royal Institute of Technology, 10044 Stockholm, Sweden
*
Author to whom correspondence should be addressed.
Energies 2023, 16(18), 6489; https://doi.org/10.3390/en16186489
Submission received: 8 August 2023 / Revised: 1 September 2023 / Accepted: 6 September 2023 / Published: 8 September 2023
(This article belongs to the Section F: Electrical Engineering)

Abstract

:
Access to electricity is a prerequisite for development, included in both the Agenda for Sustainable Development and the African Union’s Agenda 2063. Still, universal access to electricity is elusive to large parts of the global population. In Somalia, approximately one-third of the population has access to electricity. The country is unique among non-island countries as it has no centralized grid network. This paper applies a geospatial electrification model to examine paths towards universal access to electricity in Somalia under different timelines and with regard to different levels of myopia in the modeling process. This extends the previous scientific literature on geospatial electrification modeling by studying the effect of myopia for the first time and simultaneously presenting the first geospatial electrification analysis focused on Somalia. Using the Open Source Spatial Electrification Tool (OnSSET), the least-cost electrification options towards 2030 and 2040, respectively, are compared. We find that under the shorter timeline, a deployment of mini-grids and stand-alone PV technologies alone provides the least-cost option under all but one scenario. However, under the longer timeline, the construction of a national transmission backbone would lower overall costs if there is high demand growth and/or low cost of centralized grid electricity generation. We also compare different levels of myopia in the modeling process. Here, OnSSET is first run directly until 2040, then in five-year time-steps and annual time-steps. We find that running the model directly until 2040 leads to the lowest costs overall. Running the model myopically leads to a sub-optimal, more costly technology mix, with a lock-in effect towards stand-alone systems. On the other hand, the myopic approach does provide additional insights into the development of the system over time. We find that longer-term planning favors the centralized grid network, whereas short-sighted myopic planning can lead to higher costs in the long term and a technology mix with a higher share of stand-alone PV.

1. Introduction

In 2015, the 2030 Agenda for Sustainable Development was launched. The agenda outlines a plan of action for people, planet, and prosperity and encompasses 17 Sustainable Development Goals (SDGs). Of these goals, SDG7 aims to ensure access to affordable, reliable, sustainable and modern energy for all by 2030 [1]. As shown by Fuso Nerini et al., SDG7 is heavily interlinked with the other goals, displaying synergies or trade-offs with 85% of the targets of the SDGs [2]. Electricity plays an important role in the achievement of SDG7, with SDG indicator 7.1.1 focusing on achieving universal access to electricity [1]. Electricity can be used to power appliances in health facilities [3], enable the use of computers in school [2], reduce the time spent on collecting traditional biomass for cooking, improve health through a reduction of indoor air pollution stemming from the burning of biomass for cooking [4], provide better lighting, and enable productive uses in households, etc. The importance of electricity access for development is also reflected in regional and national strategies. The African Union includes electricity access as one of its Agenda 2063 targets [5] and recognizes that modern energy access is a prerequisite for key priorities such as industrialization, agricultural development, poverty alleviation, and job creation [6]. As of 2021, 675 million people worldwide were lacking access to electricity, the majority of which were in sub-Saharan Africa (SSA). However, progress towards achieving universal access to electricity has been made in recent years, as in 2010, this number stood at 1.2 billion. Still, a significant ramp-up is required in many countries in order to achieve SDG7; at the current rate of progress, it has been projected that an estimated 660 million people are to remain without access to electricity by 2030 [7].
Increased access to electricity can be achieved at the lowest cost through a combination of on- and off-grid energy supply technologies. To identify which of these technologies to use and where geospatial electrification models can be used. These models combine geospatial data on demand, energy resources, infrastructure, etc., with techno-economic information on the potential electricity supply technologies to identify the least-cost technology in each location [8]. In the scientific literature, such studies have been conducted both on a regional level for all of SSA (see [9,10,11]), as well as in more tailored analysis for individual countries, including Burkina Faso [12,13], Ghana [14], Ethiopia [15,16], Nigeria [17], Uganda [18], Kenya [19,20], and others.
One of the countries for which a country-specific geospatial electrification analysis has not yet been studied in the scientific literature is Somalia. As of 2018, the World Bank estimated that only 35% of the Somali population had access to electricity. A few challenges hamper electricity access increase in the country. First of all, there is no national power network in the country. This is a unique situation amongst non-island countries today. Those who have access to electricity in the country are supplied either by mini-grids or by stand-alone technologies [21]. These mini-grids are mostly diesel-powered, but some solar- and wind-power generation exists as well. Secondly, the sector has been suffering from the conflict in the country. Before the civil war, the Somali National Electric Corporation (Ente Nationale Energia Elettrica—ENEE) was the public utility, operating local networks in the larger cities in the country with a total generation capacity of 70 MW. However, much of the infrastructure was destroyed during the civil war that started at the end of the 20th century [22]. Today, mini-grids are operated by a multitude of private entities and Non-Governmental Organizations (NGOs) in many cities in the country. These mini-grids are operated in isolation, even in cases where there are multiple mini-grids in the same city [21]. This can lead to sub-optimal solutions, such as the duplication of distribution networks. Thirdly, electricity prices per kWh are among the highest in the world. The World Bank’s flagship report on Regulatory Indicators for Sustainable Energy found that Somalia has among the highest power costs in the world, both in absolute numbers and as a share of household income [23]. Finally, the existing mini-grid systems face high technical and commercial losses, as well as dependency on imported petroleum products for electricity generation [21].
Efforts are being undertaken to improve the power sector in Somalia. Increased access to electricity is recognized as a key development facilitator in the 9th Somalia National Development Plan (SNDP-9) from 2020 to 2024, as this has been linked to GDP growth and poverty reduction in the country [24]. A Power Master Plan (PMP) was produced in 2018 to produce power master plans for authorities and the sector that will guide the introduction and establishment of modern cost-effective reliable electricity supply systems over the next 20 years. This PMP outlined, among other things, the development of a High-Voltage (HV) transmission backbone [25]. The authors of this paper supported the government in developing a geospatial least-cost electrification analysis in 2021 to examine pathways towards universal access to electricity in the country by 2030. It found that a Business-As-Usual scenario, using only mini-grids and stand-alone systems, led to lower investments than a scenario that included the development of a transmission backbone [26]. The Ministry of Energy and Water Resources, in collaboration with the private sector and the public sector stakeholders, is to develop investment plans for the sector with the aim of developing adequate energy infrastructure based on the data developed under the least-cost geospatial electrification plan. Accomplishment of this plan is key for promoting and facilitating investments into the sector. Finally, the Somali Electricity Sector Recovery Project (SESRP), which was initiated in 2021, and the Objective is to increase access, lower the cost and cleaner electricity supply in the sector and to reestablish the electricity supply industry of the country.. In the first phase, the SESRP aims to improve existing mini-grids and increase renewable generation capacity in the sector, as well as to enhance and add more renewable energy generations to the sector. In the following phases, the SESRP considers laying the foundation for the establishment of a national grid, considering an HV backbone in line with the PMP. This includes potential interconnections for electricity imports from neighboring countries in the Horn of Africa [22].
Previous geospatial electrification studies have shown that there is a strong correlation between electricity demand and the choice of electrification technology. At lower demand levels, stand-alone technologies are often the least-cost option for providing access in currently unelectrified settlements, whereas mini-grids and extensions of the centralized grid become more favorable at higher demands [8,9]. Dalla Longa et al. [27] and Pappis et al. [16] also showed the importance of time in the choice of least-cost electrification technology. Drawing on geospatial data to study electrification options in Ethiopia until 2050 and 2070, respectively, they identified an increasing shift towards mini-grids and grid extension over time. This shift was largely driven by increasing electricity demands throughout the years.
Traditionally, most geospatial electrification models have considered a simple time aspect to electrification, providing only a single snapshot solution. That is, they identify the least-cost electrification technology mix either for the current population and demand or for a single future year (e.g., 2030, in line with SDG7) [28,29]. In 2019, Korkovelos et al. [30] improved the time representation in a geospatial electrification tool, the Open Source Spatial Electrification Tool (OnSSET), by developing a myopic modeling approach to analyze pathways towards universal access to electricity in Malawi. In their model, the least-cost electrification technology mix to increase the access rate in the country from 11% in 2018 to 50% by 2023 was identified first. The technology deployment identified by 2023 then acted as a starting point for increasing access to 100% by 2030. That is, the model provided two snapshots of least-cost electrification technologies rather than one. The aforementioned long-term electrification study by Pappis et al. [16] followed this myopic approach for the case of Ethiopia, extending the timeline to provide snapshots for 2025, 2030, 2040, 2050, 2060, and 2070, each building on the previous one.
The traditional geospatial electrification models without the (myopic) time-step function can be considered to operate similarly to perfect foresight optimization models. In perfect foresight models, all variables are known to the model until the end-year of the analysis, and the optimal strategy over the whole timeline is identified. This type of analysis can find the “best” strategy to achieve long-term objectives. However, decision-making is often more short-sighted, focusing on the immediate future or government cycles. Myopic optimization models can more closely reflect this type of behavior, where the model takes decisions for a limited number of years at a time until the end-year of the analysis [31]. Comparison of results and insights from perfect foresight models and myopic models have been made in several areas. For instance, Fuso Nerini et al. [32] compared myopic planning and perfect foresight optimization for energy system decarbonization, highlighting how the former leads to overall higher cost and delayed or cancelled strategic investment. Similarly, Heuberger et al. [33] studied disruptive technologies in decarbonization under perfect foresight and myopic optimization. They highlighted the risk of significantly higher investment under myopic decision-making. Poncelet et al. [34] also compared perfect foresight and myopic optimization for the power sector in Belgium, finding different power capacity mixes under different modeling approaches.
The objective of this paper is to study the effects of different timelines and levels of myopia on the least-cost technology mix and costs for the achievement of universal access to electricity in Somalia. Doing so, we expand on the literature on geospatial electrification modeling in two ways, namely:
(a)
developing the first geospatial electrification study in the literature focused on the country of Somalia;
(b)
examining for the first time how different levels of myopia affect technology choice, costs, and insights in geospatial electrification modeling.
Korkovelos et al. [30], Pappis et al. [16], and Sahlberg et al. [13] all applied a myopic approach to model multiple scenarios using a geospatial electrification model for Malawi, Ethiopia, and Burkina Faso, respectively. However, they kept their end-year and level of myopia (length of time-steps) constant throughout all of their scenarios. In this paper, we run the geospatial electrification model using different end-years and different levels of myopia and compare the results.
Section 2 presents the methodology, followed by results and discussion in Section 3. Finally, conclusions are presented in Section 4.

2. Methodology

In this paper, the least-cost pathways towards universal access to electricity in Somalia are studied using the OnSSET tool. OnSSET is a geospatial electrification tool that has been used to study least-cost electrification pathways in countries including Ethiopia [15], Nigeria [17], Malawi [30], Afghanistan [35], Cameroon [
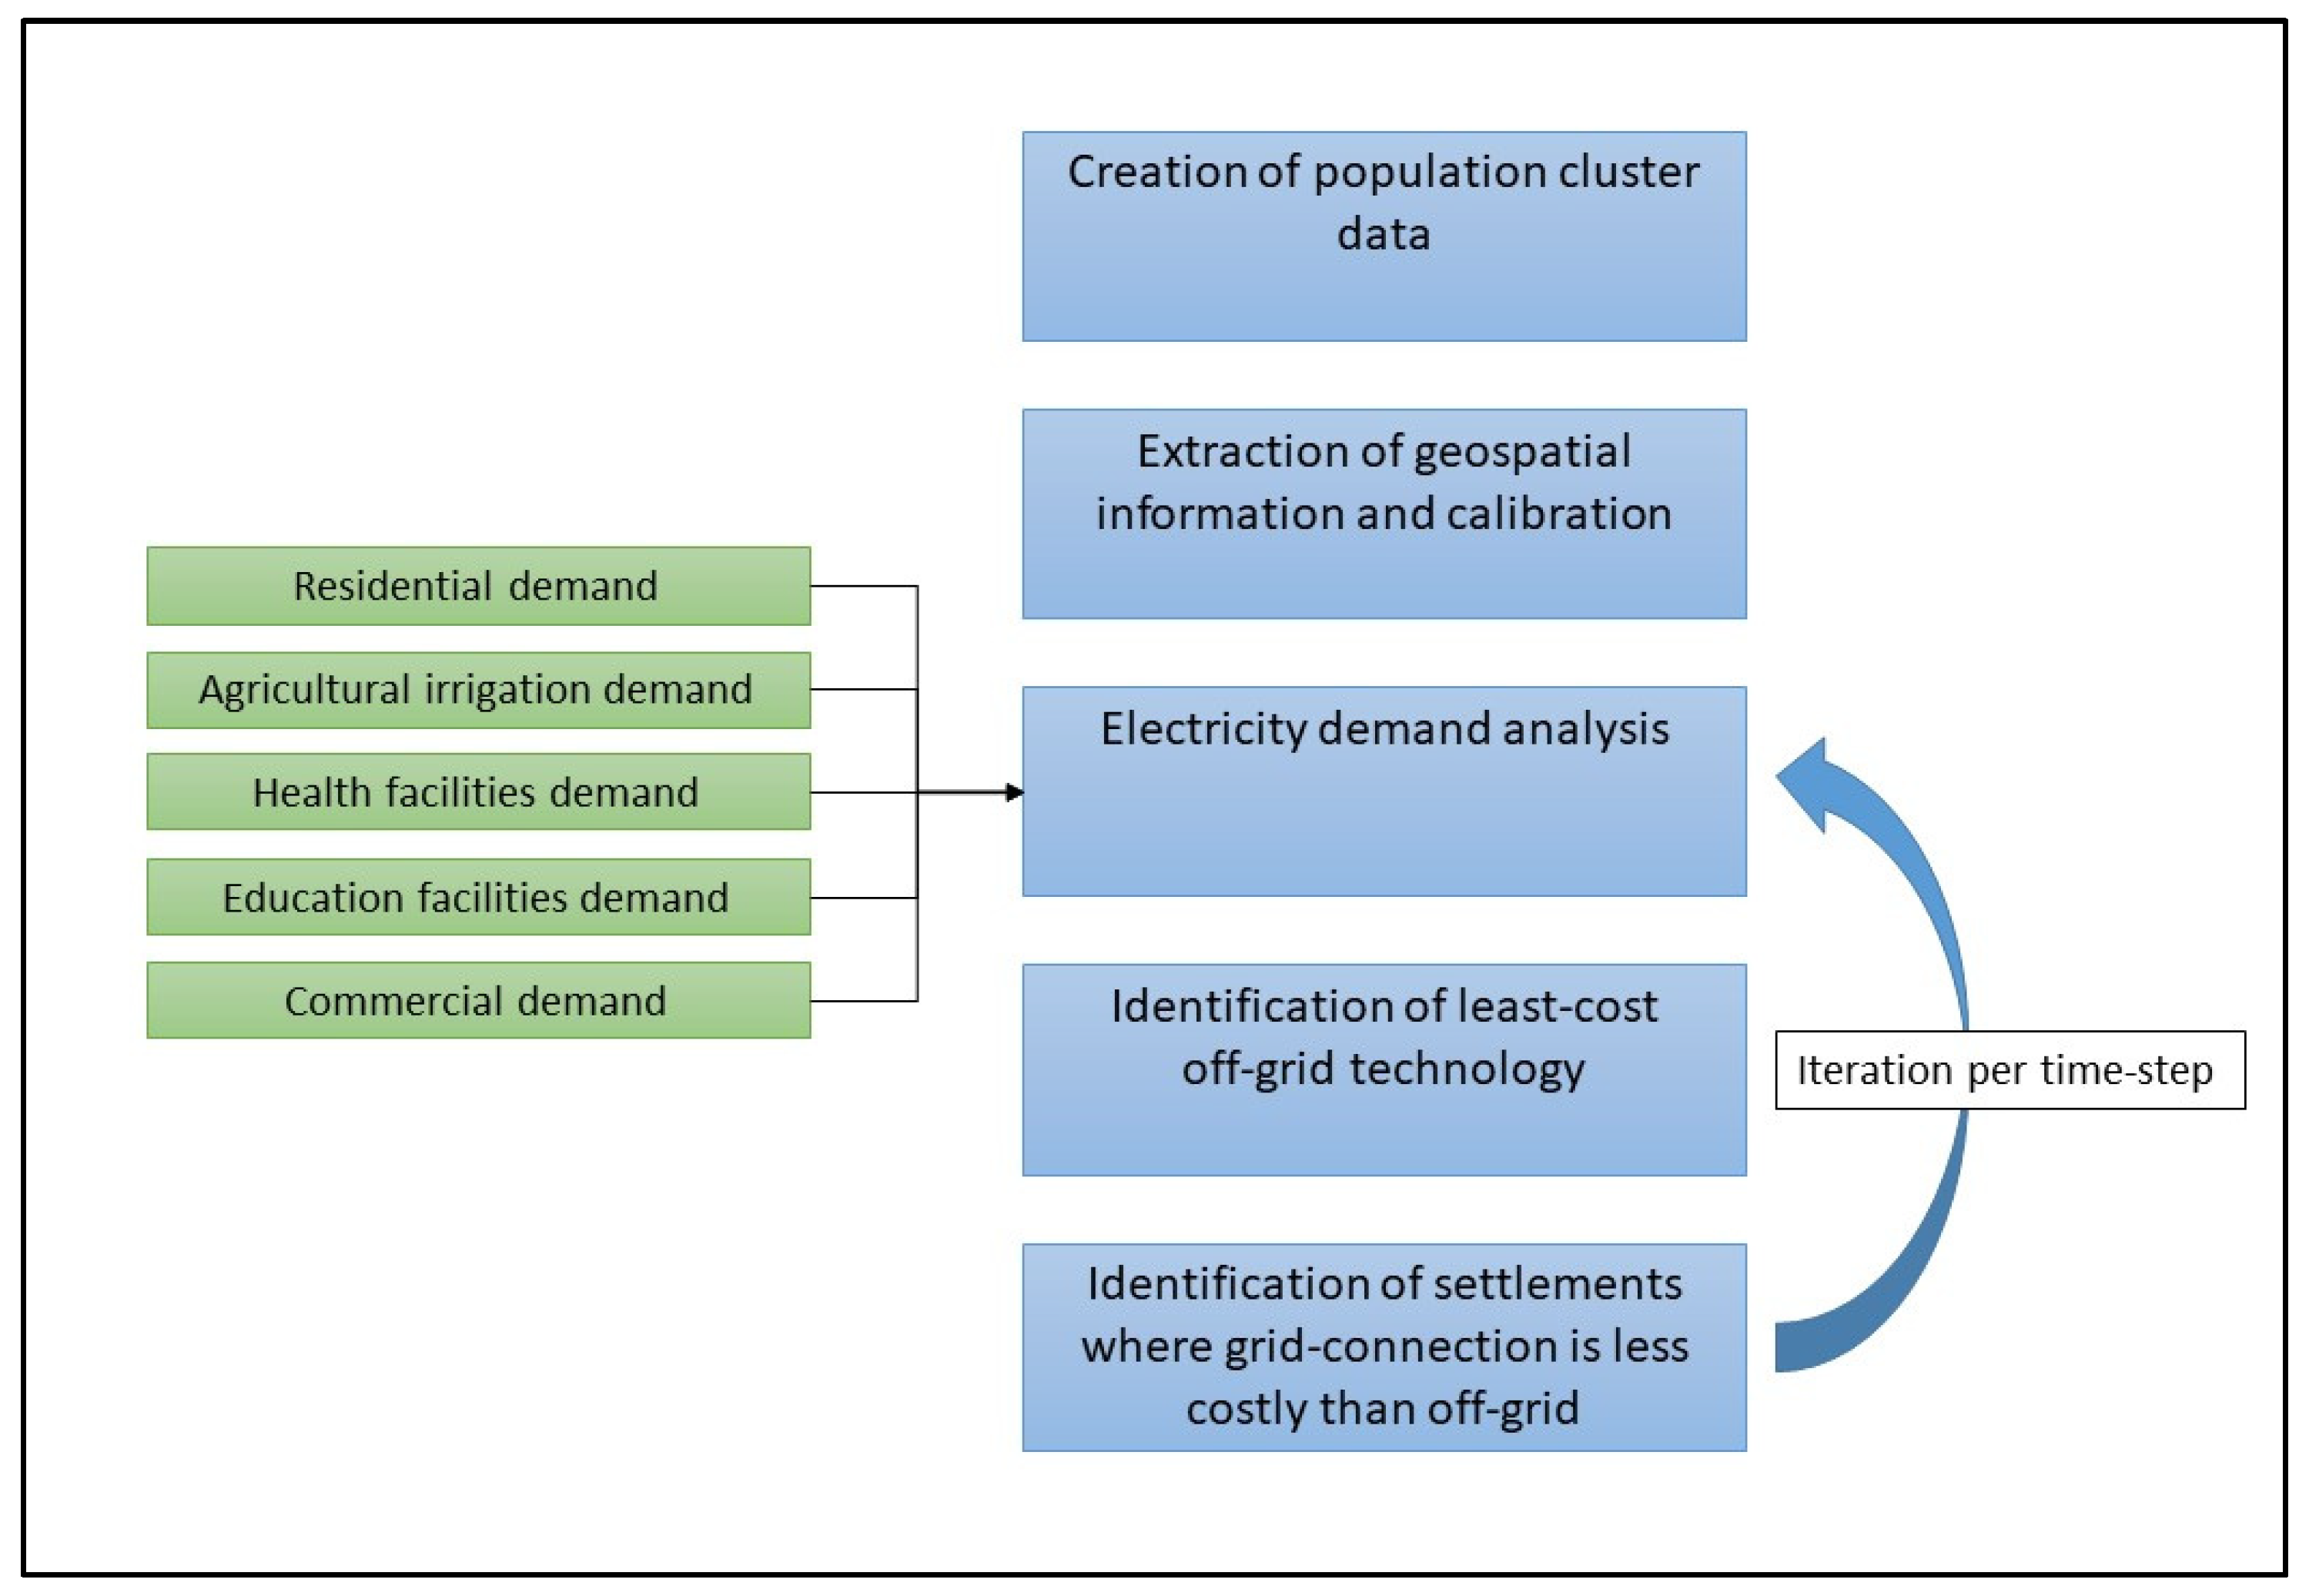
36], and others. The tool is open-source, facilitating replicability and reproducibility (the specific version of the tool used is found in the Data Availability Statement of this paper). OnSSET draws on geospatial data, socio-demographic, and techno-economic inputs to identify the least-cost mix of grid connection, mini-grids, and stand-alone technologies to provide access to electricity in a region. The tool compares the technologies based on the Levelized Cost of Electricity (LCOE) and selects the technology that can provide electricity at the lowest LCOE in each settlement [9]. The geospatial electrification analysis using the OnSSET tool in this study is outlined in Figure 1 and described in more detail below.
The model draws on data collected for the Somali Electricity Access Project in 2020–2021. These data were collected from federal and state ministries, as well as Energy Service Providers operating in Somalia. Where no local data could be identified, this was complemented by data from international sources. The geospatial datasets used in the model are described in Appendix A and the techno-economic parameters in Appendix B. The model starts in 2020 and runs until 2030 or 2040, depending on the scenario (see Section 2.5 for more details).

2.1. Creation of Population Cluster Data

In the first step of the analysis, population clusters representing every settlement in the country are created. In this study, we define a settlement as anything from just a few rural households up to entire cities. The underlying 100 m × 100 m raster data were retrieved from WorldPop (https://apps.worldpop.org/peanutButter/, accessed on 19 November 2020) based on building counts from satellite imagery [37]. The raster data were aggregated into polygon settlements using the clustering algorithm developed by Khavari et al. [38]. In the next step, clusters were classified as urban or rural based on population size and density. Finally, the population is projected to the end-year of each time-step. The key demographic parameters used in this step of the analysis for Somalia are presented in Table 1.

2.2. Extraction of Geospatial Information and Calibration

In the second step of the analysis, geospatial information is extracted for each settlement. This includes information about energy resource availability (solar, wind, and hydro), distance to existing infrastructure, terrain, etc. The existing mini-grid locations in the country were retrieved from the Somalia Electrification Platform (SEP). The SEP is available at https://somalielectrification.so/gep (accessed on 19 February 2021) and contains data collected during the Somali Electricity Access Project. to identify which settlements were already electrified in 2020. In total, existing mini-grids are operating in 103 locations across the country (Figure 2). The full list of geospatial datasets used is found in Appendix A.

2.3. Electricity Demand Analysis

In the third step of the analysis, the electricity demand was estimated for five sectors: health facilities, educational facilities, agricultural irrigation, and residential and commercial uses. The method for each of these sector follows below.

2.3.1. Electricity Demand for Health and Education Facilities

Electricity demand for health and education facilities was estimated based on the location of existing facilities (Figure 3), as well as the typical appliances used in each sub-category of health and education facilities and their associated electricity demand. If a health or education facility was not located directly within one of the settlement clusters, its demand was allocated to the closest settlement. The health facilities’ locations were retrieved from the Somali Service Availability and Readiness Assessment [40]. Five different types of health facilities were identified in Somalia, which were split into three categories. Each category has an estimated annual electricity demand, as detailed in Table 2. In total, 799 health facilities were identified.
The educational facilities are divided into two categories: primary and secondary schools. This dataset was created using data from the Federal Ministry of Education, Culture and Higher Education, the Puntland Ministry of Education website, UNICEF, and the World Bank and includes 2084 primary, 898 secondary schools, and 182 unclassified schools. The electricity demand was assumed to be 730 kWh/year for primary schools and 2810 kWh/year for secondary schools, based on [42]. For unclassified schools, the average value of primary and secondary facilities was used.

2.3.2. Electricity Demand for Agricultural Irrigation

In this study, electricity demand requirements for agricultural irrigation were estimated using the Agrodem model. Agrodem is a geospatial model that calculates the electricity requirements for groundwater pumping based on a combination of geospatial datasets (e.g., cultivated areas, rainfall, evapotranspiration) and crop-specific data (e.g., crop calendars, crop coefficients) [43]. Agriculture is a key sector in Somalia. The sector contributes to approximately 75% of the national GDP and is the highest priority for four out of five Federal Member States, according to SNDP-9. However, there are issues of water shortages in the country impacting this sector [24]. Four crops were included in the model: sorghum, maize, dry beans, and sesame. Combined, these make up 90% of the cultivated area in Somalia [44,45]. In total, the annual electricity requirements for irrigation of all cultivated areas in Somalia are estimated to be 47.3 GWh based on the Agrodem model.

2.3.3. Electricity Demand for Residential and Commercial Sectors

In a review of the existing mini-grids in Somalia, it was found that the average residential electricity consumption in 2020 was 320 kWh/household/year [26]. This is in the higher range of Tier 2 of the World Bank’s Multi-Tier Framework for Energy Access (Table 3) [46]. In the PMP, the projected annual electricity consumption by 2030 was 1740 kWh/household/year in urban areas (Tier 4) and 430 kWh/household/year in rural areas (Tier 3). In this paper, three demand pathways have been developed. In the high-demand pathway, it is assumed that the projections of the PMP are met, whereas in the medium- and low-demand pathways, lower consumption is seen. These demand pathways are outlined in Table 4. Demand for commercial activities was assumed to be 25% of the residential demand, assuming the same ratio between commercial and residential demand, as was found in the review of the existing mini-grids.

2.4. Electricity Supply Options

In the fourth step of the analysis, the various electricity supply options are compared. The electricity supply option that can meet the demand at the lowest LCOE is selected as the least-cost option in each settlement. The LCOE takes into account investment, operation, maintenance and fuel costs throughout the lifetime of the system and can be used to compare technologies with different cost structures [8]. In this study, five technologies have been considered:
(a)
Stand-alone PV systems
(b)
PV hybrid mini-grids
(c)
Wind hybrid mini-grids
(d)
Hydro mini-grids
(e)
Centralized grid connection.
For stand-alone systems, each customer has their own generation and storage system. The total cost in the settlement is the combined cost of all the individual systems. For mini-grids, there is a central source of generation within the settlement combined with the cost of the distribution network connecting the customers with the generation source. For the centralized grid, the cost for the settlement includes the cost of extending a line to connect the settlement to the HV transmission backbone, the cost of the distribution network within the settlement, and the cost of the electricity generation supplying electricity to the network. First, the LCOE for all off-grid technologies are calculated and compared. The least-cost off-grid technology and corresponding LCOE are identified. Next, it is identified where the centralized grid can be expanded to supply electricity at a lower LCOE compared to the least-cost off-grid technology. Note that this step is iterative, as an extension of the centralized grid may allow for a continued extension to another settlement and so on.

2.5. Scenarios

As mentioned, there is currently no centralized grid network in Somalia. Those that do have access are mainly supplied by mini-grids. However, for the future electrification of the country, two different electricity supply pathways have been considered in this study. The off-grid-only supply pathway builds on a continuation of the current supply options, where access to electricity can be provided by mini-grid and stand-alone technologies only. The centralized grid supply pathway considers also the construction of a High-Voltage (HV) network backbone in addition to the off-grid technologies. The layout of this HV backbone is derived from the SEP, seen in Figure 4. According to the PMP, the cost of constructing this HV backbone is estimated at 1.28 billion USD [25].
In the first analysis, two different target end-years are considered: 2030 and 2040, respectively. Both are run as a perfect foresight model, providing only a single snapshot solution for achieving universal access to electricity by the end-year. Nine scenarios are considered for each end-year. These nine scenarios are based on the three demand pathways presented in the Section 3 and variations of the two supply pathways presented in Section 2.4. For each demand level, three supply scenarios are considered: one with only off-grid supply (mini-grid and stand-alone technologies), one including an HV backbone with a cost of centralized grid electricity generation of 0.05 USD/kWh, and one including an HV transmission backbone with a cost of centralized grid electricity generation of 0.010 USD/kWh. The scenarios are summarized in Table 5.
In the second step of the analysis, the different modeling methods (level of myopia) are compared. The scenario with medium demand, a national transmission backbone with a cost of centralized grid electricity generation of 0.05 USD/kWh, and a modeling period until 2040 (scenario #17 in Table 5) is run three times. The first time, the model is run considering perfect foresight; only a single snapshot solution by 2040 is included. The second time, the model is run myopically in 5-year time-steps. The third and final time, the model is run myopically at an annual resolution (1-year time-steps). The mathematical equations in OnSSET are based on annual energy balances, so 1-year time-steps is the highest possible level of myopia using this tool. In all scenarios, it is assumed that the electrification rate will increase linearly towards universal access by 2030.

3. Results and Discussion

3.1. Effect of Modeling Period and Demand Levels

The results in terms of the average LCOE and total investment cost over the modeling period of the nine perfect foresight scenarios run until 2030 are seen in Figure 5. It can be seen that at the low and medium demand levels, a continuation of the current path in Somalia, using only off-grid technologies, leads to lower costs than the inclusion of a national HV transmission backbone. However, at the high demand levels, the development of a national transmission backbone could lower electrification costs if low-cost grid electricity were available. If grid electricity generation costs are at higher levels (0.10 USD/kWh), it would still be less costly to continue only with off-grid technologies, even at the high demand level. This link between demand levels and the economic feasibility of a national HV backbone is in line with the previous literature. That is, higher electricity demands better absorb the cost of transmission and distribution networks while benefitting from economies of scale for cheaper electricity generation.
When extending the modeling period to 2040, a different pattern emerges compared to the shorter timeline (Figure 6). Here, a national HV transmission backbone lowers overall costs compared to using only off-grid technologies at the low and medium demand levels, assuming grid electricity comes at a lower cost. This different pattern is explained by the population growth. Even when keeping the demand levels per household the same as in the 2030 scenarios, population growth means that there will be more households in the country demanding electricity in 2040 than in 2030, leading to a higher demand overall. Since a national electricity network benefits from economies of scale, this technology becomes an increasingly economically competitive option compared to off-grid technologies with longer timelines, given the resulting demand increase. Notably, at the high demand level, the national HV transmission backbone lowers costs even if grid electricity comes at a higher cost.
These findings are important for electrification planning and policies, both in Somalia and other countries. While many initiatives investigate least-cost electrification by 2030 in the pursuit of SDG 7 by 2030, it is also important to consider what the system should look like beyond that timeline. Aiming to ramp up electricity access rapidly in Somalia, our results suggest that a continued deployment of off-grid technologies is likely the least-cost option by 2030. However, in the longer term (2040 and beyond), it is likely that a centralized grid network would become economically beneficial.
Stakeholders may prioritize the roll-out of off-grid technologies to provide rapid and low-cost electricity access in the short term but should also plan ahead for the potential integration or replacement of these technologies with a centralized network. A first priority may be to ensure that policies and technical standards are in place to ensure that mini-grids can be interconnected to a centralized HV backbone, should such a network become available in the longer perspective. These findings seem to be in line with the current approach of the SESRP project, which focuses on mini-grids in the first phase and then the potential development of an HV transmission backbone in later stages [22].

3.2. Perfect Foresight vs. Myopic Optimization

Running the model with different levels of myopia, there is a notable effect on the split between least-cost electricity supply technologies. It can be seen that at higher myopia, there is a higher share of stand-alone systems and a lower share of mini-grids and centralized grid connections (Figure 7). This is caused by a lock-in effect in the stand-alone systems, as these are deployed early on in the myopic scenarios. In the case of perfect foresight, the demand by 2040 in a settlement, given the projected population, may lead to mini-grids or grid connections being the least-cost alternative. However, there are cases in the myopic approaches where the lower demand in earlier years leads to stand-alone PV being selected as the least-cost alternative in the same settlements. If stand-alone PV is deployed, then the additional demand added from population growth later in the analysis may not justify the switch from stand-alone to mini-grid or grid connection. Similarly, mini-grids may be selected rather than grid extensions following the same logic. These lock-in effects are also seen in the cost of the whole system. In the perfect foresight simulation, the country-weighted average LCOE is 0.393 USD/kWh. However, in the myopic simulations, the country-weighted average LCOE increases by 5% and 14% for the 5-year and annual time-step simulations, respectively.
Running the model myopically leads to a more costly system, as described in the previous paragraph. On the other hand, one can see the roll-out of the electricity supply technologies during each time-step. Figure 8 presents the geospatial roll-out for 2025 and 2030. In this map, it can be seen which settlements are electrified first (in 2025), based on the selected prioritization scheme In this study, the settlements are prioritized based on travel time to major cities as in [14]; i.e., those settlements that are located nearest to cities with more than 50,000 people are assumed to be electrified first, leaving more remote settlements to be electrified later. However, many different prioritization schemes could be considered based on stakeholder priorities. It can be seen that by 2030, when the national HV backbone is available, many of the mini-grids that were in place by 2025 will be connected to the centralized grid, highlighting some of the system dynamics. After 2030, a few settlements switch to another least-cost electrification technology. It is important to highlight that the demand levels per household are kept constant throughout the study period. If the demand levels also increase over time, as in Pappis et al. [16], there would likely be a larger transition from stand-alone PV to mini-grids and grid connections over time. Figure 9 presents the population split during each 5-year time-step until 2030. Again, it can be seen that a significant share of the population supplied by mini-grids in 2025 are connected to the national grid by 2030.
From a policy and planning perspective, the choice of modeling approach has important implications. Planning with shorter timelines in mind, e.g., 5 years as in the SNDPs, may lead to a system that, over time, is more costly and has a different technology split compared to what would be the “optimal” least-cost option in the longer term. This effect is stronger with higher levels of myopia (shorter time-steps). On the other hand, planning directly with perfect foresight over, e.g., a 20-year horizon using this model, does not give any information on how the system will need to develop to get there and may provide some unrealistic information, which does not take into account short-term issues and priorities. This is in line with the literature on myopic modeling, where shorter planning timeframes lead to delayed investments and higher overall costs. Particularly, in Somalia, the centralized grid network would not be able to provide electricity to anyone before 2030, given that it would take several years to construct such a backbone. There is an important trend where mini-grids are deployed early and then integrated into the national grid, which is only seen when running the model with time-steps. Furthermore, short-term issues, such as prioritizing which settlements should be electrified first, are not captured by this model if run with perfect foresight to reach a 100% access rate.

3.3. Limitations and Future Research

Several areas for future updates of the geospatial electrification model for Somalia can be identified. First of all, this study includes electricity demand for residential, commercial, health and educational facilities, and agricultural irrigation. Further analysis of potential electricity demand for industries, fisheries, etc., would further improve the accuracy of the results. However, such data were not available to the authors of this study. It is important to note that demand levels in this study were kept constant throughout the years within each scenario. Improved modeling of demand growth over time would likely also affect the mix of least-cost electricity supply options. Next, the study includes a potential HV transmission backbone. However, identifying the mix of power plants or imports that would supply the network is beyond the scope of this analysis. Such analysis could be undertaken, e.g., by soft-linking the geospatial electrification model with a capacity expansion model, as demonstrated by Moksnes et al. [20] and Pappis et al. [16]. Finally, Somalia has a large nomadic population as well as Internally Displaced Persons (IDPs). In this study, the population has been split between urban and rural populations only. As described in Section 2.1, population settlements are identified from raster data containing population count estimates. If available, geospatial datasets on building classification could potentially be used in future studies to identify which settlements are likely nomadic or IDPs. The nomadic population may then be pre-assigned stand-alone PV, as a fixed connection may not be suitable. Specific demand levels may also be assigned to IDP settlements, which may differ from urban or rural estimates.
In terms of the modeling approach, further studies could also investigate the effects of different timelines in countries with more developed centralized grid networks. Finally, these findings were developed using the OnSSET tool. Other geospatial electrification tools and frameworks may handle timelines and myopia differently and could be further studied to see if similar effects are found when using those.

4. Conclusions

In this paper, we present the first scientific study of electrification in Somalia, and we study for the first time the effects of different end-years and modeling approaches (with regard to myopia) in geospatial electrification modeling. We have identified important links between both the end-year selected and the level of myopia used to the least-cost technology mix as well as overall system costs.
We identify a correlation between longer modeling periods and the higher economic feasibility of a centralized national grid network in Somalia compared to off-grid technologies. We suggest that while many studies focus on the immediate need to provide increased access to electricity within the next few years or by 2030, additional modeling efforts with longer timelines could be undertaken to understand how the system should evolve after that point. This can help put policies and regulations in place to ensure the system can reach the best long-term electricity supply mix as well.
We also note that running the model myopically leads to a sub-optimal electricity supply rollout in the long term compared to running the model with perfect foresight until the end-year of the analysis and that this effect is stronger with higher levels of myopia. However, running the model with time-steps provides important insights into the system dynamics over time. Running the model myopically also gives some insights into the implications of decision-making strategies. Arguably, myopic models are closer to the reality of decision-making, where investments and decisions follow shorter-term election cycles [32]. Our analysis shows how longer-sighted decision-making would result in lower costs overall and less sunken costs to provide electricity access for all in Somalia. It also shows how the consistent investments in a grid backbone for the country would only be justified with a long-term perspective on Somalia’s population growth and assumptions on consistent growth in energy demand and living standards.
Somalia does provide a unique case on a country scale, given that there is no existing national grid network in the country. Still, the findings in this study may support the electrification planning process in other sub-national regions in SSA to help identify a system that performs well both in the short and long term. Large regions without access to a centralized grid network can be found in, e.g., the Democratic Republic of the Congo, the Central African Republic, and Madagascar.

Author Contributions

A.S.: Conceptualization, Methodology, Software, Formal analysis, Investigation, Visualization, Data curation, Writing—original draft, Writing—review and editing. B.K.: Data curation, Software, Investigation, Writing—review and editing. I.M.: Writing—review and editing. F.F.N.: Conceptualization, Writing—review and editing. All authors have read and agreed to the published version of the manuscript.

Funding

This research received no external funding.

Data Availability Statement

The OnSSET code used to run the scenarios and files required to re-run the OnSSET scenarios are openly available at https://github.com/OnSSET/onsset/tree/Somalia-1.0 (accessed on 7 September 2021). The geospatial datasets are listed in Appendix A, and the techno-economic parameters not presented in the main text of the manuscript are provided in Appendix B.

Acknowledgments

This paper uses important data and a background understanding of electrification in Somalia that was developed under contract no. SO-MOEWR-104123-CS-QCBS for the Ministry of Energy and Water Resources in Somalia. The authors acknowledge the importance of the data that was collected and shared by the MOEWR, local ministries at the federal and state level, as well as private sector energy suppliers and the World Bank for that project, some of which are available at the Somali Electrification Platform. The results and views expressed in this paper are solely those of the authors.

Conflicts of Interest

The authors declare no conflict of interest. The funders had no role in the design of the study; in the collection, analyses, or interpretation of data; in the writing of the manuscript; or in the decision to publish the results.

Appendix A. Geospatial Datasets Used in the Study

Table A1. Geospatial datasets used in the electrification model for Somalia.
DatasetUseSourceCreated Year
Building footprintsUsed as a basis for estimating the population distribution for the settlement clusters.Ecopia.AI and Maxar Technologies. Digitize Africa. Avilable through https://apps.worldpop.org/peanutButter/ (accessed on 19 November 2020)2020
Settlement clustersDelineated population clusters representing settlements, used as the basis for the analysis.KTH. 2021. Developed using data retrieved from https://apps.worldpop.org/peanutButter/ (accessed on 19 November 2020) using the https://github.com/OnSSET/Clustering%20%20plugin (accessed on 19 November 2020)2021
Administrative boundariesDelineates the geographical boundaries of the analysis.GADM version 4.1. Available at https://gadm.org/download_country.html (accessed on 19 November 2020)2018
Existing mini-grid locationsUsed to identify existing electricity infrastructure, to identify which settlements are fully or partly electrified in the start year of the analysis.The data have been collected from local private and public stakeholders, as well as the PMP, and is available through the Somali Electrification Platform (https://somalielectrification.so/gep) (accessed on 19 February 2021).2017–2020
Potential future HV backboneRepresents one of the layouts developed for the PMP, used as a starting point for grid connection/extension in scenarios including an HV backbone.The GIS data have been developed based on the PMP layout from 2018,and is available through the Somali Electrification Platform (https://somalielectrification.so/gep).2020
RoadsExisting roads, used to specify grid extension suitability.OpenStreetMap, available through https://www.openstreetmap.org/ (accessed on 27 February 2021).2020
ElevationThe elevation map is used in order to determine the terrain slope. Both the terrain slope and the elevation are used in order to specify the grid extension suitability.CGIAR Consortium for Spatial Information (CGIAR-CSI), available at http://srtm.csi.cgiar.org/srtmdata/ (accessed on 27 February 2021)2000
Land coverThe land cover map classifies the study area into 17 land cover classes. This affects the suitability for grid extension.U.S. Geological Survey, available at https://lpdaac.usgs.gov/products/mcd12q2v006/ (accessed on 27 February 2021)2019
Global Horizontal Irradiation (GHI)Annual GHI (kWh/m2/year), used to identify the availability and cost of PV systems.Global Solar Atlas, available at https://globalsolaratlas.info/ (accessed on 27 February 2021)2019
Wind speedAnnual average wind speed (m/s), used to identify the availability and cost of wind-powered hybrid mini-grids.Global Wind Atlas, available at https://globalwindatlas.info/ (accessed on 27 February 2021)2019
Hydropower potentialPoints showing potential mini/small hydropower potential for mini-grids.KTH, available at https://energydata.info/dataset/small-and-mini-hydropower-potential-in-sub-saharan-africa (accessed on 27 February 2021)2016
Travel timeVisualizes spatially the travel time required to reach from any individual cell to the closest town with a population of at least 50,000 people. Used to calculate the cost of diesel as well as for prioritization of which settlements to electrify first.Malaria Atlas Project, available at https://malariaatlas.org/explorer/#/ (accessed on 27 February 2021)Published 2018, source data from 2015.
Location of schoolsUsed for the electricity demand estimation in the educational sector.Collected from the Ministry of Education, Culture and Higher Education, the Puntland Ministry of Education website [47], the World Bank, and UNICEF, available through the Somali Electrification Platform (https://somalielectrification.so/gep) (accessed on 16 February 2021). [40]2020–2021
Locations of health care facilitiesUsed for the electricity demand estimation in the health sector.Data compiled from the Somali Service Availability and Readiness Assessment 2016 and
Ministry of Health 2020 through the Somali Electrification Platform (https://somalielectrification.so/gep) (accessed on 16 February 2021).
2016, 2020

Appendix B. Key Techno-Economic Parameters

Table A2. Transmission and distribution parameters based on information collected from local energy service providers during the Somali Electricity Access Project [26] as well as international sources [8,9,30,35,48,49,50,51,52,53].
ParameterValue
MV line—33 kV26,600 USD/km
LV line—0.24 kV16,000 USD/km
Service transformer—50 kVA3500 USD
Connection cost30 USD/customer
Table A3. Techno-economic parameters for off-grid technologies used in the OnSSET model. The cost for stand-alone PV and hybrid mini-grids are based on information collected from local energy service providers during the Somali Electricity Access Project [26]. Mini-grid hydro costs are based on [9].
TechnologyInvestment CostTechnology Life (Years)
Solar PV Stand Alone9200 USD/kW15
(<20 W)
Solar PV Stand Alone2200 USD/kW15
(20–50 W)
Solar PV Stand Alone2600 USD/kW15
(50–100 W)
Solar PV Stand Alone2600 USD/kW15
(100–1000 W)
Solar PV Stand Alone2600 USD/kW15
(>1 kW)
Hydro Mini-grid3000 USD/kW30
Hybrid Mini-grid components:
PV Panel (including BoS)150025
Diesel generator24010
Battery311Calculated based on cycle throughput
Discount rate, stand-alone PV
Table A4. Discount rates for the various technology types. The discount rates reflect the different risks and rates of returns per technology type, capturing the risks and investment climate in the country, taken from [54].
ParameterValue
Discount rate, stand-alone PV18.0%
Discount rate, mini-grids19.8%
Discount rate, centralized grid15.5%

References

  1. Sustainable Development Knowledge Platform. Transforming Our World: The 2030 Agenda for Sustainable Development. Available online: https://sustainabledevelopment.un.org/post2015/transformingourworld (accessed on 3 May 2020).
  2. Fuso Nerini, F.; Tomei, J.; To, L.S.; Bisaga, I.; Parikh, P.; Black, M.; Borrion, A.; Spataru, C.; Castán Broto, V.; Anandarajah, G.; et al. Mapping synergies and trade-offs between energy and the Sustainable Development Goals. Nat. Energy 2018, 3, 10–15. [Google Scholar] [CrossRef]
  3. World Health Organization; The World Bank; Sustainable Energy for All; International Renewable Energy Agency. Energizing Health: Accelerating Electricity Access in Health-Care Facilities; WHO: Geneva, Switzerland, 2023. Available online: https://www.seforall.org/system/files/2023-01/energizing_health.pdf (accessed on 9 February 2023).
  4. Energy Sector Management Assistance Program (ESMAP). Opening Opportunities, Closing Gaps: Advancing Gender-Equal Benefits in Clean Cooking Operations; World Bank: Washington, DC, USA, 2022; Available online: https://documents1.worldbank.org/curated/en/099215003152218466/pdf/P1742320beb6090670933705085ff1c047b.pdf (accessed on 7 June 2023).
  5. African Union Commission; African Union Development Agency—NEPAD. AUC & AUDA-NEPAD Second Continental Report on the Implementation of Agenda 2063; AUC & AUDA-NEPAD: Midrand, South Africa, 2022. Available online: https://au.int/sites/default/files/documents/41480-doc-2nd_Continental_Progress_Report_on_Agenda_2063_English.pdf (accessed on 31 August 2023).
  6. African Union; World Bank. Push for Universal Energy Access: Joining Hands to Accelerate the Pace of Electrification in Africa. 2023. Available online: https://au.int/sites/default/files/pressreleases/42624-pr-Final_PR-Energy_Event_180223.pdf (accessed on 31 August 2023).
  7. IEA; IRENA; UNSD; World Bank; WHO. Tracking SDG 7: The Energy Progress Report (2022); World Bank: Washington, DC, USA, 2022. Available online: https://trackingsdg7.esmap.org/data/files/download-documents/sdg7-report2022-full_report.pdf (accessed on 28 November 2022).
  8. Nerini, F.F.; Broad, O.; Mentis, D.; Welsch, M.; Bazilian, M.; Howells, M. A cost comparison of technology approaches for improving access to electricity services. Energy 2016, 95, 255–265. [Google Scholar] [CrossRef]
  9. Mentis, D.; Howells, M.; Rogner, H.; Korkovelos, A.; Arderne, C.; Zepeda, E.; Siyal, S.; Taliotis, C.; Bazilian, M.; de Roo, A.; et al. Lighting the World: The first application of an open source, spatial electrification tool (OnSSET) on Sub-Saharan Africa. Environ. Res. Lett. 2017, 12, 085003. [Google Scholar] [CrossRef]
  10. International Energy Agency (IEA). World Energy Outlook 2019; IEA: Paris, France, 2019.
  11. Szabó, S.; Bódis, K.; Huld, T.; Moner-Girona, M. Sustainable energy planning: Leapfrogging the energy poverty gap in Africa. Renew. Sustain. Energy Rev. 2013, 28, 500–509. [Google Scholar] [CrossRef]
  12. Moner-Girona, M.; Bódis, K.; Huld, T.; Kougias, I.; Szabó, S. Universal access to electricity in Burkina Faso: Scaling-up renewable energy technologies. Environ. Res. Lett. 2016, 11, 084010. [Google Scholar] [CrossRef]
  13. Sahlberg, A.; Khavari, B.; Korkovelos, A.; Fuso Nerini, F.; Howells, M. A scenario discovery approach to least-cost electrification modelling in Burkina Faso. Energy Strategy Rev. 2021, 38, 100714. [Google Scholar] [CrossRef]
  14. Kemausuor, F.; Adkins, E.; Adu-Poku, I.; Brew-Hammond, A.; Modi, V. Electrification planning using Network Planner tool: The case of Ghana. Energy Sustain. Dev. 2014, 19, 92–101. [Google Scholar] [CrossRef]
  15. Mentis, D.; Andersson, M.; Howells, M.; Rogner, H.; Siyal, S.; Broad, O.; Korkovelos, A.; Bazilian, M. The benefits of geospatial planning in energy access—A case study on Ethiopia. Appl. Geogr. 2016, 72, 1–13. [Google Scholar] [CrossRef]
  16. Pappis, I.; Sahlberg, A.; Walle, T.; Broad, O.; Eludoyin, E.; Howells, M.; Usher, W. Influence of Electrification Pathways in the Electricity Sector of Ethiopia—Policy Implications Linking Spatial Electrification Analysis and Medium to Long-Term Energy Planning. Energies 2021, 14, 1209. [Google Scholar] [CrossRef]
  17. Isihak, S.; Akpan, U.; Bhattacharyya, S. Evolution of GIS-based rural electrification planning models and an application of OnSSET in Nigeria. Renew. Sustain. Energy Transit. 2022, 2, 100019. [Google Scholar] [CrossRef]
  18. Kaijuka, E. GIS and rural electricity planning in Uganda. J. Clean. Prod. 2007, 15, 203–217. [Google Scholar] [CrossRef]
  19. Moner-Girona, M.; Bódis, K.; Morrissey, J.; Kougias, I.; Hankins, M.; Huld, T.; Szabó, S. Decentralized rural electrification in Kenya: Speeding up universal energy access. Energy Sustain. Dev. 2019, 52, 128–146. [Google Scholar] [CrossRef]
  20. Moksnes, N.; Korkovelos, A.; Mentis, D.; Howells, M. Electrification pathways for Kenya–linking spatial electrification analysis and medium to long term energy planning. Environ. Res. Lett. 2017, 12, 095008. [Google Scholar] [CrossRef]
  21. Balla, P.T. Project Information Document-Integrated Safeguards Data Sheet—Somali Electricity Access Project; World Bank Group: Washington, DC, USA, 2020; Available online: https://documents1.worldbank.org/curated/en/618741539178189639/pdf/Project-Information-Document-Integrated-Safeguards-Data-Sheet-Somali-Electricity-Access-Project-P165497.pdf (accessed on 4 January 2023).
  22. World Bank. Somali Electricity Sector Recovery Project—Project Appraisal Document; World Bank: Washington, DC, USA, 2021; Available online: https://documents1.worldbank.org/curated/en/989971641921723162/pdf/Somalia-Somali-Electricity-Sector-Recovery-Project.pdf (accessed on 19 January 2023).
  23. Banerjee, S.G.; Moreno, F.A.; Sinton, J.; Primiani, T.; Seong, J. Regulatory Indicators for Sustainable Energy: A Global Scorecard for Policy Makers; World Bank: Washington, DC, USA, 2017. [Google Scholar]
  24. The Ministry of Planning, Investment and Economic Development. Somalia National Development Plan 2020 to 2024. 2019. Available online: http://mop.gov.so/wp-content/uploads/2019/12/NDP-9-2020-2024.pdf (accessed on 27 November 2020).
  25. UNICON Ltd. Preparation and Development of a Power Master Plan for Somalia Project; Ministry of Energy and Water Resources: Mogadishu, Somalia, 2018. [Google Scholar]
  26. KTH Royal Institute of Technology, Kartoza, and Recon. Preparation of an Indicative Least Cost Geospatial Electrification Plan to Achieve Universal Access in Somalia; Ministry of Energy and Water Resources: Mogadishu, Somalia, 2021. [Google Scholar]
  27. Dalla Longa, F.; Strikkers, T.; Kober, T.; van der Zwaan, B. Advancing Energy Access Modelling with Geographic Information System Data. Environ. Model. Assess. 2018, 23, 627–637. [Google Scholar] [CrossRef]
  28. Sahlberg, A.; Usher, W.; Pappis, I.; Broad, O.; Kebede, F.S.; Walle, T. Exploring long-term electrification pathway dynamics: A case study of Ethiopia. Discov. Energy 2023, 3, 1. [Google Scholar] [CrossRef]
  29. Ciller, P.; Lumbreras, S. Electricity for all: The contribution of large-scale planning tools to the energy-access problem. Renew. Sustain. Energy Rev. 2020, 120, 109624. [Google Scholar] [CrossRef]
  30. Korkovelos, A.; Khavari, B.; Sahlberg, A.; Howells, M.; Arderne, C. The Role of Open Access Data in Geospatial Electrification Planning and the Achievement of SDG7. An OnSSET-Based Case Study for Malawi. Energies 2019, 12, 1395. [Google Scholar] [CrossRef]
  31. Keppo, I.; Strubegger, M. Short term decisions for long term problems—The effect of foresight on model based energy systems analysis. Energy 2010, 35, 2033–2042. [Google Scholar] [CrossRef]
  32. Fuso Nerini, F.; Keppo, I.; Strachan, N. Myopic decision making in energy system decarbonisation pathways. A UK case study. Energy Strategy Rev. 2017, 17, 19–26. [Google Scholar] [CrossRef]
  33. Heuberger, C.F.; Staffell, I.; Shah, N.; Mac Dowell, N. Impact of myopic decision-making and disruptive events in power systems planning. Nat. Energy 2018, 3, 634–640. [Google Scholar] [CrossRef]
  34. Poncelet, K.; Delarue, E.; Six, D.; D’haeseleer, W. Myopic optimization models for simulation of investment decisions in the electric power sector. In Proceedings of the 2016 13th International Conference on the European Energy Market (EEM), Porto, Portugal, 6–9 June 2016; pp. 1–9. [Google Scholar] [CrossRef]
  35. Korkovelos, A.; Mentis, D.; Bazilian, M.; Howells, M.; Saraj, A.; Fayez Hotaki, S.; Missfeldt-Ringius, F. Supporting Electrification Policy in Fragile States: A Conflict-Adjusted Geospatial Least Cost Approach for Afghanistan. Sustainability 2020, 12, 777. [Google Scholar] [CrossRef]
  36. Ouedraogo, N.S. A GIS approach to electrification planning in Cameroon. Energy Strategy Rev. 2023, 45, 101020. [Google Scholar] [CrossRef]
  37. Leasure, D.; Dooley, C.; Bondarenko, M.; Tatem, A. peanutButter: An R Package to Produce Rapid-Response Gridded Population Estimates from Building Footprints, version 1.0.0; University of Southampton: Southampton, UK, 2021. [Google Scholar] [CrossRef]
  38. Khavari, B.; Korkovelos, A.; Sahlberg, A.; Howells, M.; Fuso Nerini, F. Population cluster data to assess the urban-rural split and electrification in Sub-Saharan Africa. Sci. Data 2021, 8, 117. [Google Scholar] [CrossRef]
  39. Directorate of National Statistics, Federal Government of Somalia. The Somali Health and Demographic Survey 2020. Available online: https://somalia.unfpa.org/sites/default/files/pub-pdf/FINAL%20SHDS%20Report%202020_V7_0.pdf (accessed on 27 February 2021).
  40. Service Availability and Readiness Assessment (SARA). Available online: https://www.who.int/data/data-collection-tools/service-availability-and-readiness-assessment-(sara) (accessed on 4 January 2023).
  41. USAID. Powering Health: Electrification Options for Rural Health Centers; USAID: Washington, DC, USA, 2018.
  42. World Bank; ECREEE. Regional Off-Grid Electrification Project—Off-Grid Solar Market Assessment & Private Sector Support Facility Design—Regional Report. 2019. Available online: http://www.ecreee.org/sites/default/files/ecreee_rogep_regional_report.pdf (accessed on 4 January 2023).
  43. Korkovelos, A.; Koo, B.B.; Malik, K. Agrodem: An Open-Source Model That Quantifies the Electricity Requirements of Irrigation; World Bank: Washington, DC, USA, 2022; Available online: https://openknowledge.worldbank.org/handle/10986/37540 (accessed on 30 November 2022).
  44. FAOSTAT. Available online: http://www.fao.org/faostat/en/#data/QC (accessed on 27 February 2021).
  45. MapSPAM. Home of the Spatial Production Allocation Model! Available online: https://www.mapspam.info/ (accessed on 27 February 2021).
  46. Bhatia, M.; Angelou, N. Beyond Connections: Energy Access Redefined; ESMAP: Washington, DC, USA, 2015. [Google Scholar]
  47. Ministry of Education in Puntland, Federal Republic of Somalia—Putting Education First. Available online: http://www.moepuntland.com/ (accessed on 27 February 2021).
  48. van Ruijven, B.J.; Schers, J.; van Vuuren, D.P. Model-based scenarios for rural electrification in developing countries. Energy 2012, 38, 386–397. [Google Scholar] [CrossRef]
  49. Energy Sector Management Assistance Program (ESMAP). Model for Electricity Technology Assessment (META); World Bank: Washington, DC, USA, 2014. [Google Scholar]
  50. Karhammar, R.; Sanghvi, A.; Fernstrom, E.; Aissa, M.; Arthur, J.; Tulloch, J.; Davies, I.; Bergman, S.; Mathur, S. Sub-Saharan Africa: Introducing Low-Cost Methods in Electricity Distribution Networks; Energy Sector Management Assistance Program (ESMAP): Washington, DC, USA, 2006; p. 427. [Google Scholar]
  51. Energy Sector Management Assistance Program (ESMAP). Reducing the Cost of Grid Extension for Rural Electrification; ESMAP: Washington, DC, USA, 2000. [Google Scholar]
  52. International Energy Agency (IEA). Energy Access Outlook 2017: From Poverty to Prosperity; International Energy Agency: Paris, France, 2017. Available online: https://www-oecd-ilibrary-org.focus.lib.kth.se/docserver/9789264285569-en.pdf?expires=1611503833&id=id&accname=oid023441&checksum=058D3685FC70F07A6465A26F63C2A1E8 (accessed on 24 January 2021).
  53. World Bank. Project Information Document-Integrated Safeguards Data Sheet-Madagascar—Least-Cost Electricity Access Development Project-LEAD-P163870. 2019. Available online: http://documents1.worldbank.org/curated/en/281861547039951916/pdf/Project-Information-Document-Integrated-Safeguards-Data-Sheet-Madagascar-Least-Cost-Electricity-Access-Development-Project-LEAD-P163870.pdf (accessed on 19 January 2023).
  54. Agutu, C.; Egli, F.; Williams, N.J.; Schmidt, T.S.; Steffen, B. Accounting for finance in electrification models for sub-Saharan Africa. Nat. Energy 2022, 7, 631–641. [Google Scholar] [CrossRef]
Figure 1. Steps of the geospatial electrification analysis in this paper using the OnSSET tool.
Energies 16 06489 g001
Figure 2. Existing mini-grids in Somalia.
Energies 16 06489 g002
Figure 3. Health and education facilities in Somalia.
Energies 16 06489 g003
Figure 4. Layout of a potential HV backbone in Somalia. The HV backbone largely follows the main roads in Somalia, connecting the largest cities in the country.
Energies 16 06489 g004
Figure 5. Total system cost (blue bars) and country-weighted average LCOE (orange dots) for the nine scenarios run until 2030. At low and medium demand scenarios, it is less costly to continue using only mini-grids and stand-alone technologies. At higher demand levels, a national transmission backbone can leverage economies of scale and lower overall electrification costs compared to using only off-grid technologies, assuming electricity can be generated or imported at low costs.
Energies 16 06489 g005
Figure 6. Total system cost (blue bars) and country-weighted average LCOE (orange dots) for the nine scenarios run until 2040. In this longer timeline, the larger population means that the development of a national transmission backbone can lower overall electrification costs compared to using only off-grid technologies if grid electricity can be generated or imported at low costs or high demand levels also at a higher cost of grid electricity.
Energies 16 06489 g006
Figure 7. Number of people supplied by each technology option in 2040 when the model is run myopically using 5-year and 1-year time-steps compared to running the model using perfect foresight. In both cases, there is a shift towards more people using stand-alone PV technologies. Using a 5-year time-step, both mini-grids and grid connections decrease in favor of stand-alone PV. Using a 1-year time-step, the overall decrease is mainly attributed to grid connections, as mini-grids are replaced by stand-alone PV but also replace grid connections.
Energies 16 06489 g007
Figure 8. Least-cost electrification options in 2025 (left) and 2030 (right). The figure illustrates the roll-out of least-cost electrification options by 2025 and 2030. Notably, many settlements remain unelectrified in 2025, but by 2030, all settlements are connected.
Energies 16 06489 g008
Figure 9. Number of people supplied by each technology option by the end of each time-step in a scenario with medium demand, a national transmission backbone with a cost of centralized grid electricity generation of 0.05 USD/kWh, run in 5-year time-steps.
Energies 16 06489 g009
Table 1. Key demographic input parameters.
ParameterValue
Urban household size (people per household)6.6 [39]
Rural household size (people per household)5.7 [39]
Urban population (% of total population)51 [39]
Rural population (% of total population)49 [39]
Total population, 2020 (million)15.8
Population growth (% per year)2.9 [24]
Table 2. Electricity demand for different types of health facilities. The health facilities are classified into the three categories along with their respective average annual electricity demand according to [41].
Ground Data CategorizationCategorizationElectricity Demand (kWh/Year)
Health postsHealth post (Category I)2740
Health centerHealth center (Category II)5500
Referral health centers
TB facilities
HospitalHospital (Category III) 9130
Table 3. Tiers of the World Bank’s Multi-Tier Framework. At higher tiers, more electricity services can be provided, resulting in higher annual electricity demand. Adapted from [46].
TierTypical Energy ServicesAnnual Electricity Demand (kWh/Household/Year)
1Task lighting AND Phone charging>4.3
2General lighting AND Phone charging AND Television AND Fan (if needed)>73
3Tier 2 AND Any medium-power appliances>365
4Tier 3 AND Any high-power appliances>1241
5Tier 2 AND Any very high-power appliances>2993
Table 4. The three residential demand pathways examined in this paper. The Low and Medium demand pathways assume only a small increase in electricity demand compared to the average consumption in existing mini-grids. The High demand pathway assumes that the higher levels considered in the Power System Master Plan are achieved. In all pathways, rural areas are assumed to have a lower demand.
Demand PathwayUrban Residential DemandRural Residential Demand
LowTier 3Tier 1
MediumTier 3Tier 2
HighTier 4Tier 3
Table 5. Scenarios studied using the OnSSET model.
ScenarioEnd YearDemand LevelHV Backbone Included?Grid Electricity Generation Cost
12030LowNoN/A
22030LowYes0.05 USD/kWh
32030LowYes0.10 USD/kWh
42030MediumNoN/A
52030MediumYes0.05 USD/kWh
62030MediumYes0.10 USD/kWh
72030HighNoN/A
82030HighYes0.05 USD/kWh
92030HighYes0.10 USD/kWh
102040LowNoN/A
112040LowYes0.05 USD/kWh
122040LowYes0.10 USD/kWh
132040MediumNoN/A
142040MediumYes0.05 USD/kWh
152040MediumYes0.10 USD/kWh
162040HighNoN/A
172040HighYes0.05 USD/kWh
182040HighYes0.10 USD/kWh
Disclaimer/Publisher’s Note: The statements, opinions and data contained in all publications are solely those of the individual author(s) and contributor(s) and not of MDPI and/or the editor(s). MDPI and/or the editor(s) disclaim responsibility for any injury to people or property resulting from any ideas, methods, instructions or products referred to in the content.

