Abstract
Selecting a battery energy storage technology for application on offshore platforms or marine vessels can be a challenging task. Offshore oil and gas platforms (OOGPs) require battery energy storage systems (BESSs) with high volumetric density, high gravimetric density, high safety, a long life span, low maintenance, and good operational experience, amongst other BESS properties. No single battery chemistry can satisfy all these factors perfectly, which implies that there is a need for a method that determines the most suitable battery chemistry for a given application. To this end, this paper proposes an improved version of a 7-step procedure proposed in the literature to systematically and logically determine the most suitable BESS for high-energy applications on OOGPs. In order to implement the 7-step procedure, a review of the state-of-the-art of consolidated and emerging battery chemistry is done. As part of the 7-step procedure, the operational experience of the battery chemistry was also reviewed. The 7-step procedure was then applied to a case study (with two test cases) of a real OOGP in the North Sea. The first test case considers BESS for peak shaving, for which six battery chemistries were assessed in detail. A technology suitability assessment (TSA) weighted score is calculated, which is based on five attributes critical for the energy storage choice in the considered application, which are weight, space, safety, life cycle cost, and operational experience. Of the six battery chemistries assessed, lithium iron phosphate (LFP) has the highest technology suitability assessment (TSA) weighted score and is therefore deemed the most suitable battery chemistry for peak shaving. The second test case considers BESS for spinning reserve. Since this is a high C-rate application, only battery chemistry capable of high C-rate was evaluated. From the TSA evaluation, LFP and lithium nickel manganese cobalt have the joint highest TSA weighted score and are therefore deemed the most suitable battery chemistry for spinning reserve.
1. Introduction
Despite the gradual transition of the world from fossil fuels to renewables, it is expected that oil and gas will still be used for many decades, particularly in sectors that are difficult to decarbonize, such as the aviation sector [1]. A significant portion of oil and gas is produced on offshore platforms, particularly in countries like Norway. But most offshore oil and gas platforms (OOGPs), especially those more than 100 km from shore, are usually powered by single-cycle gas turbines (GT), which have low efficiency and contribute about 80–85% of the platforms’ carbon emissions [2,3]. These OOGPs are not electrified with power from shore either because it is technically or economically not feasible, which leads to high carbon emissions for OOGPs. Consequently, many economies in Europe have taken an approach to decarbonizing the operation of OOGPs by using the carbon emission tax or emission trading system to encourage fewer carbon emissions [4,5]. Thus, operators of OOGPs are considering various means to reduce their carbon emissions.
Battery energy storage systems (BESS) have inevitably a significant role to play in carbon emissions reduction. In particular, the decrease in the cost of batteries makes them an attractive choice for various grid services in an OOGP [6]. BESS can be sized to provide various grid services aimed at carbon emissions reduction, such as spinning reserve, which allows one GT to shut down permanently, leading to high carbon emissions reduction. BESS can also be sized to provide peak shaving and wind power capacity firming.
An OOGP usually has 3 to 4 GTs, and in most cases, 2 to 3 GTs are running while the last GT is for redundancy. The load on an OOGP can be in the range of 20–100 MW. Thus, the energy requirement for these services can easily enter the MWh range. However, before the BESS is sized, there is a need for a technology suitability assessment (TSA) of the available battery chemistries to be able to make the best choice of battery technology.
The OOGP presents unique challenges for the integration of BESS, and these need to be carefully considered in the TSA of the battery chemistries. The most critical factors that need to be considered include the volumetric energy density, the gravimetric energy density, and the safety of the battery chemistry. The OOGP has limited allowance for space and weight; thus, a battery chemistry with high energy densities is preferred. Also, the battery chemistry must be very safe, as the OOGP is a highly flammable environment. Other important factors include cost per kWh, lifespan, cycle life, and maintenance requirements. The OOGP is a difficult place to access as access depends on the availability of a favorable weather window, which does not occur often in offshore locations. Thus, a battery chemistry that requires little or no maintenance is ideal for this application. Also, a long cycle life and lifespan are desired in order to reduce recurrent replacements (again due to limited access) on the platform. All these factors need to be considered in a proper TSA procedure to determine the most suitable battery chemistry.
Chapaloglou et al. sized BESS for increasing wind power penetration levels and carbon emissions reduction in an OOGP but did not consider the choice of battery chemistry [7]. Ardal et al. sized BESS for spinning reserve but only considered three battery chemistries [8]. Also, only weight and maintenance requirements were considered. Farhadi et al. performed TSA, but this was done for high-power ES only, and energy-intensive energy storage (ES) was not considered [9]. Adeyemo et al. proposed a 7-step procedure for performing the TSA of ES for OOGP [10], but the TSA procedure was only applied to high-power ES. Similar to step 7 of the TSA procedure in [10], Oliveira et al. assessed the suitability of various ES technologies for application in a micro-grid by creating a table with scores for energy density, power density, life span, safety, and financial feasibility [11], but they did not specifically address the suitability of ES for offshore micro-grids, which have more stringent constraints on power and energy density and safety. Georgious et al. performed a review of ES systems and classified them based on physical form and also based on discharge duration [12]. They noted that the classification is an initial guide to selecting the appropriate ES system for a given application. They also provided updated data on various characteristics of an ES, which is needed for selecting the most suitable ES. However, they did not consider the critical constraints of offshore deployment, which require a holistic estimation of the weight and space that an ES will require, i.e., estimating the weight and space of the ES and all associated ES components. They also did not review the operational experience, safety, or cost of the ES. Mutarraf et al. reviewed ES systems for shipboard microgrids, which have similar issues with offshore platforms but failed to capture a broader list of ES technologies [13]. To the best of the authors’ knowledge, the review of the current state-of-the-art of high-energy BESS as it relates to the selection of the most suitable ES technology for OOGP applications has not yet been addressed in the literature. Thus, this work seeks to fill that gap and provide a comprehensive review of the current state-of-the-art of battery chemistry suitable for high-energy applications on OOGPs. The review in this paper provides relevant information that can be used to determine the most suitable battery chemistry for peak shaving and spinning reserve in OOGPs. This paper goes one step further by improving the 7-step procedure proposed by Adeyemo et al. in [10] and applying it to two case studies.
The battery chemistries that are considered in detail in this work include Li-ion (lithium iron phosphate (LFP), lithium titanate (LTO), lithium nickel manganese cobalt oxide (NMC)), nickel cadmium (NiCd), nickel metal-hydride (NiMH), sodium sulfur (NaS), sodium nickel chloride (ZEBRA), flow batteries (vanadium redox (VRB) and zinc bromine (ZnBr)), metal-air (zinc air), and lithium-ion capacitor.
The main contributions of this paper are:
- -
- Review of the current state-of-the-art of consolidated and emerging battery chemistries
- -
- Overview of the application of nine battery chemistries for grid-scale services in offshore and onshore locations
- -
- Improvement of the 7-step procedure proposed in [10] by including a coefficient of variation to make the computation of the TSA weighted score as objective as possible. More score points are also used to make the TSA-weighted score more accurate.
- -
- Application of the modified 7-step procedure to two case studies (peak shaving and spinning reserve) based on a real OOGP in the North Sea
The structure of this paper is as follows: before the review of the battery chemistries, the technology suitability assessment procedure proposed in [10] is briefly introduced in Section 2. Section 3 presents the typical energy-intensive grid services that BESS can provide. Section 4 reviews the state-of-the-art in battery chemistry. Section 5 reviews the operational experience in battery chemistry. Section 6 presents a case study where ES sizing, weight and space estimation, life cycle cost analysis, and the calculation of a weighted TSA score are done.
2. Technology Suitability Assessment Procedure
The technology suitability assessment procedure is a systematic way of selecting the most suitable ES technology (battery chemistry) based on some criteria. The considered TSA procedure was presented in [10] and is here recalled for the sake of completeness. It consists of seven steps.
2.1. Step 1: Identification of the Grid Service
The grid service to be offered by the ES is identified. This is used to determine the application requirements in step 2.
2.2. Step 2: Choose the Potential ES Technologies That Satisfy the Application Requirements Imposed by the Grid Service from a Preliminary List of ES Technologies
This step entails the identification of application requirements based on the grid service to be offered by the ES. A list of ES technologies that satisfy these application requirements is then defined.
2.2.1. Application Requirements
These are characteristics that the ES must possess to be able to deliver the grid service being considered. They could include:
- -
- Number of cycles per day: This is the average number of full cycles that the ES must deliver per day. This has huge significance for the choice of ES technology. If the application requires a high number of cycles per day, then an ES technology with a low life cycle is not suitable.
- -
- Safety: This is the safety requirement for the ES technology. Given that an OOGP is a highly flammable environment, safety is very important, as the risk of fire or thermal runaway in an ES cannot be tolerated. Thus, an ES technology of high safety must be chosen if the application environment is an OOGP.
- -
- C-rate: C-rate is a term used to define the maximum current a battery can deliver. For example, a 1 Ah battery rated at 30 C can deliver 30 A. The C-rate of the application determines the ES technologies that are suitable. For example, spinning reserve requires a high C-rate (greater than 1 C) battery, while peak shaving requires a low C-rate (less than or equal to 1 C) battery. Some battery chemistries can only deliver a low C-rate, while others can deliver a high C-rate.
- -
- Fast response: This refers to how quickly an ES can start delivering power when called upon. If the application demands fast response, an ES technology with fast response must be selected. For example, black start is a service that demands fast response [14], so an ES such as flow batteries with slow response will not be suitable for this kind of grid service.
- -
- Ramp rate: Ramp rate is how quickly an ES can increase or decrease power once it is operating. The ramp rate required by the grid service also determines which ES technologies are suitable.
- -
- Life span: The project life determines the life span that is required from the battery chemistry, as replacement operations are discouraged.
2.2.2. Identification of Potential ES Technologies
A broad preliminary list of ES technologies is defined. From this list, the ES technologies that satisfy the application requirements are selected as potential candidates.
2.3. Step 3: Selection of Potential ES Technologies Using Operational Experience
From the list of ES technologies that satisfy the application requirements in Step 2, potential ES technologies are further selected using proven operational experience. Operational experience with ES technologies in marine environments, proximal fields, and grid-scale applications demonstrates the techno-economic feasibility of their application. The ES technologies that satisfy the application requirements and have good operational experience are selected as potential candidate solutions.
After the ES technologies have been selected based on application requirements and operational experience, the required ES size is estimated.
2.4. Step 4: Techno-Economic Sizing of the ES
The nominal power and nominal energy of the ES are estimated in this step. This is needed to determine the ES’s weight, space, and life cycle cost.
2.5. Step 5: Estimation of ES Size Dependent Constraints
After the size of the ES has been determined, the two main criteria that must be satisfied (i.e. weight and space) are assessed.
- -
- Space: In an OOGP, there is limited space. Thus, the overall footprint of the ES and all associated components (balance of plant) must be less than a certain value. Thus, it is important to use an ES with a high volumetric energy density in energy-intensive applications such as peak shaving. For other grid services requiring high power and high energy, such as spinning reserve, an ES with a high volumetric power density (high C-rate) and a high volumetric energy density should be used to limit the space required.
- -
- Weight: Just as with space, there is limited weight that can be supported in an OOGP. The overall weight of the ES must not exceed a certain value. An ES with a high gravimetric energy density must be used for energy-intensive applications such as peak shaving. For other grid services requiring high power and high energy, such as spinning reserve, an ES with a high gravimetric power density (high C-rate) and a high gravimetric energy density needs to be used.
2.6. Step 6: ES Cost Assessment
After the potential ES technologies have been selected based on application requirements, operational experience, and weight and space constraints, the ES life cycle cost is estimated. The size of the ES determined in step 4 is used to estimate the life cycle cost.
2.7. Step 7: Decision Making on the Most Suitable ES Technology Using a Weighted TSA Score
After the ES life cycle cost has been estimated, a weighted TSA score is computed, and the ES with the highest weighted TSA score is selected. The criteria considered in the weighted TSA score for our use case are: weight, space, safety, performance, and life cycle cost. This weighted TSA score is calculated in Section 6.4.4 and Section 6.5.4. A coefficient of variation is introduced in this step different from the method in [10]. The coefficient of variation is used to assign weight to the ES attributes. The use of the coefficient of variation allows the assignment of scores to the ES to be as objective as possible. The coefficient of variation is explained in Section 6.4.4.
The flow chart for the TSA procedure is shown in Figure 1. N in Figure 1 means No and Y in Figure 1 means Yes.
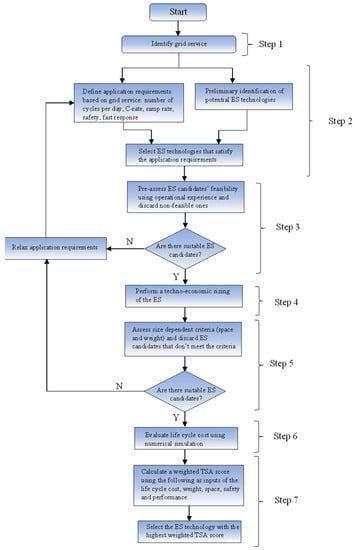
Figure 1.
Flow chart of the Technology suitability assessment procedure.
3. Grid Services That BESS Can Provide
3.1. Spinning Reserve
Spinning reserve is the available capacity in generators that are online that can be used to meet load increases. In an isolated system like OOGP, often 2 or 3 GTs are kept running to maintain a margin of spinning reserve in order to guarantee the security of the power supply. Also, the GTs used in OOGP usually need about 5 min to start up and then need to stay on for a minimum amount of time once they are started. If a GT is shut down, it also needs to stay off for a minimum amount of time before it can be restarted. These constraints: startup time, minimum downtime, and minimum uptime, lead to a situation where a high spinning reserve margin is provided. This leads to more GTs running. It is more economical to provide the required spinning reserve using BESS (as opposed to using GTs), which allows one GT to shut down. Additionally, by using BESS, there is a reduction in carbon emissions. Also, without BESS, the number of starts/stops in the GT may be high. BESS can help provide the needed spinning reserve margin and reduce the number of starts/stops of the GT. This not only reduces costs and carbon emissions but also leads to less wear on the GT.
3.2. Peak Shaving
The load in a power system usually has periods of high peak demand and periods of low demand. This is not an efficient way of operating. Peak shaving can thus be defined as the shifting of the load from high peaks to periods of low demand through ES. This helps to flatten the load demand curve and achieve a load profile that does not vary significantly. Through an energy management system (EMS) that uses load forecasting, the BESS power can be optimally scheduled so that the GTs operate at the maximum possible efficiency. This leads to carbon emissions reduction.
3.3. Wind Farm Energy Time Shift
When wind turbines (WTs) are integrated into the local grid, the power fluctuations of the WTs will affect the production of the GTs. The WTs can be seen as a negative load, and their variation also needs to be flattened, just as in peak shaving. Thus, the wind farm energy needs to be time-shifted using ES. As with peak shaving, an EMS can schedule the BESS power so that the GTs operate at maximum efficiency.
3.4. Secondary Frequency Control
Secondary frequency control is the provision of reserves for supplying the power that is needed to restore the grid frequency back to its rated value. Secondary frequency control can last for several minutes and is a high-energy service. BESS can be sized to provide this service. Alves et al. used ES for secondary frequency control in an OOGP, although using hydrogen fuel cells [15].
3.5. Uninterruptible Power Supply
BESS can serve as a backup power supply in the event of a power outage. This ensures that critical equipment on the platform keeps running at all times. The BESS must not be discharged below a particular depth of discharge to ensure there is enough energy at all times for the uninterruptible power supply service.
3.6. Black-Start
Black start can be regarded as the ability to start up the grid after a blackout without an external power source [16]. In isolated systems such as OOGP, there is no external power source because there is no grid connection. BESS can be used to energize the platform grid and start the GTs.
Figure 2 shows the classification of the different services. The services can be grouped into three categories: wind energy integration, ancillary services, and bulk energy. Wind energy time shift falls under wind energy integration. Ancillary services refer to grid services that help maintain a reliable power system. Secondary frequency control, spinning reserve, black start, and an uninterruptible power supply fall under ancillary services. Bulk energy refers to a grid service that does not necessarily improve the energy security of the platform grid but requires a large amount of energy transfer between the BESS and the grid. Peak shaving falls under bulk energy. A BESS can be deployed to deliver multiple services. These grid services have different power requirements and discharge durations. The power requirement vs. discharge duration for the considered grid services is presented in Figure 3. It can be seen from Figure 3 that black start has the least discharge time, while peak shaving requires the longest discharge time. For the power rating, all the services fall within a range of 100 kW to 30 MW. However, spinning reserve is more likely to have the highest power rating, while uninterruptible power supply is more likely to require the least power rating.
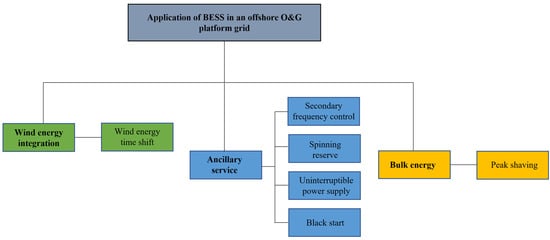
Figure 2.
Classification of grid services offered by BESS in an OOGP.
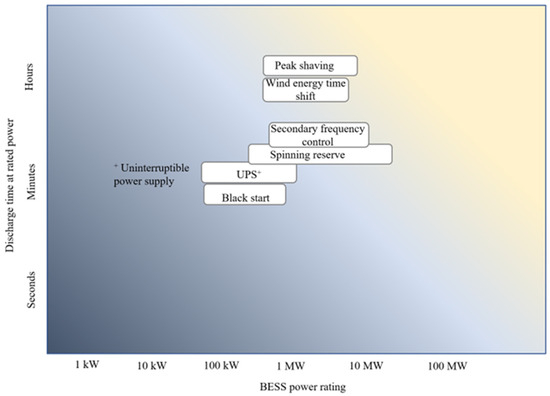
Figure 3.
Discharge time and power rating required for different grid services.
4. Battery Energy Storage Chemistries
4.1. Lithium-Ion
Lithium-ion batteries are widely used in portable electronic devices such as smartphones and laptops, and recently, they are increasingly being used in stationary applications (such as grid services) due to the dropping cost of lithium-ion technologies [6]. Lithium-ion batteries have higher power and energy densities compared to other available battery chemistries. Li-ion batteries have many chemistries. Li-ion battery chemistry is usually characterized by the cathode material except for LTO, which is characterized by the anode material. The anode of all Li-ion battery chemistries apart from LTO is made of graphitic carbon, which reduces the risk of excessive heating and melting of the electrode which is common with conventional electrodes. Lithiated carbon has a higher melting point (180 °C) compared to conventional electrodes [17]. Also, Li-ion batteries have no memory effect. There are six commercially available Li-ion battery chemistries, but only three of these are considered in this work, i.e., LFP, LTO, and NMC. The other three Li-ion battery chemistries (lithium manganese oxide (LMO), lithium cobalt oxide (LCO), and lithium nickel cobalt aluminium (NCA)) do not satisfy the application requirements for any of the grid services reviewed in Section 3 for application in an OOGP (precisely safety). Li-ion batteries use the reversible movement of Li-ions between the cathode and anode to store chemical energy. During charging, Li-ions are released from the Li-salt at the cathode (releasing an electron) and move through the electrolyte to the anode to form lithiated carbon (). The reverse reaction occurs when discharging. The charging reaction is called intercalation, and the discharging reaction is called de-intercalation [18]. The electrolyte can be an organic solvent with dissolved Li-salt or a solid polymer. Li-salt can be lithium hexafluorophosphate (LiPF6) or lithium perchlorate (LiClO4). The electrolyte does not participate in the chemical reaction but only facilitates the movement of the Li-ions from one electrode to another. The general reversible reaction of a Li-ion battery is shown in Equation (1) (cathode reaction) and Equation (2) (anode reaction). The charging reaction is rightward, and the discharging reaction is leftward.
where represents the metal, which can be iron, cobalt, manganese, or a combination of metals, in the equation refers to the number of moles.
The safety of Li-ion batteries is particularly important when they are to be used in an OOGP. Li-ion batteries combine high-energy materials with flammable electrolytes. Any damage to the electrolyte through high temperatures or mechanical stress can lead to a short circuit. This can further lead to evaporation of the electrolyte, which builds up internal pressure. This gas can be released through a relief valve or through damage to the cell. Thus, an explosive gas-air mixture can be created, which can lead to heat buildup and thermal runaway. Thermal runaway poses danger for any facility, but in an OOGP, the risk is even greater due to the presence of highly flammable fuel (gases). In an OOGP, the risk of fire cannot be tolerated as there is no place for the personnel to be evacuated to, and damage to the OOGP structure can also happen in the event of a fire. Thus, a robust battery management system (BMS) that monitors the individual cells to isolate those that are heating up is needed. A robust safety mechanism has already been applied to a Li-ion battery installed in an OOGP in the North Sea [19]. A duct is made to convey away any gases released as a result of a thermal event. A water-cooling system is also used to cool the batteries to ensure that any thermal runaway in any cell does not propagate to other cells and to ensure a stable operating temperature of the battery.
The main disadvantage of Li-ion batteries is their high cost, which is increased due to the need for a battery management system (BMS) that performs several functions such as overcharge and overdischarge protection, over-temperature protection, cell voltage balancing, and state of health monitoring. Over-temperature protection and, by extension, the prevention of large-scale thermal runaway are two of the most important functions of the BMS.
Figure 4 shows the schematic diagram of a Li-ion battery.

Figure 4.
Schematic diagram of Li-ion [20].
4.1.1. Lithium Iron Phosphate
As the name suggests, LFP batteries use as the cathode material. One of the features of the LFP battery is its low resistance. The main benefits of LFP batteries are their high discharge C-rate (up to 25 C) and long cycle life [21]. A further significant advantage of LFP battery compared to other Li-ion chemistries is that it is thermally stable with no risk of thermal runaway, thus it is very safe. It also has a high tolerance for physical abuse without any adverse effects. This good safety performance of LFP makes it a suitable candidate for application in OOGPs. Also, LFP batteries can tolerate full charge voltage and do not show significant degradation with full charge as they do with other Li-ion battery chemistries. However, LFP batteries have lower specific energy compared to Li-ion chemistries with cobalt. Also, LFP batteries have higher self-discharge than other Li-ion chemistries, and this can lead to balancing problems as the battery ages. This can be mitigated by using balancing equipment, which, however, increases the cost.
4.1.2. Lithium Nickel Manganese Cobalt
The NMC battery uses as the cathode material, where and represent the number of moles for Ni and Mn, respectively. One of the advantages of the NMC battery is that it has high specific energy due to the presence of nickel. Additionally, the specific energy of the NMC battery can be increased by adding silicon to the graphitic carbon in the anode, but this reduces the C-rate and cycle life of the battery. The presence of silicon in the anode leads to the expansion and contraction of the anode with every charge and discharge, which thereby makes the cell mechanically unstable. The NMC battery tries to complement the attributes of the different metals. Nickel and cobalt yield high specific energy, but nickel has poor thermal stability while cobalt is expensive. Manganese yields low internal resistance but has low specific energy. Combining these metals together in the cathode yields a battery chemistry with better overall performance than the individual metals. Cobalt helps stabilize nickel in an NMC battery. The common composition of the NMC battery is 1:1:1 for nickel, manganese, and cobalt, with each metal having an equal part. However, other compositions are possible. Other compositions include NMC532 (5 parts nickel, 3 parts manganese, and 2 parts cobalt), NMC622, and NMC811 [21]. The chemical composition of the NMC can be adjusted for either high power applications (high C-rate) or high energy applications (high specific energy). NMC batteries with high nickel content have higher specific energy and a lower cost than NMC batteries with high cobalt content.
4.1.3. Lithium Titanium Oxide
LTO (usually ), as opposed to other Li-ion battery chemistries, uses lithium titanium oxide nanocrystals in the anode instead of graphite. The cathode is made of lithium manganese oxide or lithium nickel manganese cobalt oxide. Due to the use of nanocrystals in the anode, the effective surface area is increased many times compared to the graphite anode, thereby allowing electrons to enter and leave the anode quickly. This allows for high charge and discharge rates. Also, the use of LTO is better than the graphite anode due to its zero-strain property, no solid electrolyte interface film formation, no lithium plating while fast charging and charging at low temperatures, and thermal stability at high temperatures. These characteristics lead to a high lifecycle for the LTO battery. Additionally, LTO batteries are very safe and have a wide operating temperature range. Particularly at low temperatures, LTO has excellent discharge characteristics. However, LTO batteries are expensive. Also, it has a low nominal voltage (2.3 V), which leads to a low energy density compared to other Li-ion battery chemistries. The LTO is usually used in applications that require fast charging, but it is also very applicable in high C-rate applications such as spinning reserve.
4.2. Nickel-Based Battery Chemistries
4.2.1. Nickel Cadmium
Nickel-cadmium batteries are one of the oldest battery chemistries, and, as a result, the technology is mature and fully commercial. NiCd batteries have been used in a range of applications, from uninterrupted power supply to telecommunication systems. They are rugged and can last a long time (up to 3500 cycles for 80% depth of discharge) if properly maintained [22]. NiCd batteries also have good low-temperature performance (up to −40 °C) and are available in sealed and vented models that are suitable for portable and industrial applications. The best performance is obtained when discharged to a depth of discharge between 20% and 50% [23]. However, a higher depth of discharge will be needed for applications in OOGP, where the weight and space required by the battery must be limited. The major drawbacks of NiCd batteries are their memory effect, high self-discharge rate, and toxic cadmium, which is not good for the environment and requires proper disposal. The cathode of this battery is nickel oxyhydroxide (NiO(OH)). and the anode is metallic cadmium. The electrolyte is usually aqueous potassium hydroxide (KOH∙H2O). During the discharging phase, the cadmium metal reacts with hydroxyl ions to form cadmium hydroxide. Likewise, the nickel oxyhydroxide reacts with water to form nickel hydroxide and releases the hydroxide ion during the discharging phase. The reverse reactions occur during the charging phase. The reversible reactions are given in Equation (3) (anode reaction) and Equation (4) (cathode reaction). The nominal cell voltage for NiCd is 1.2 V. Figure 5 shows the diagram of a typical NiCd battery.
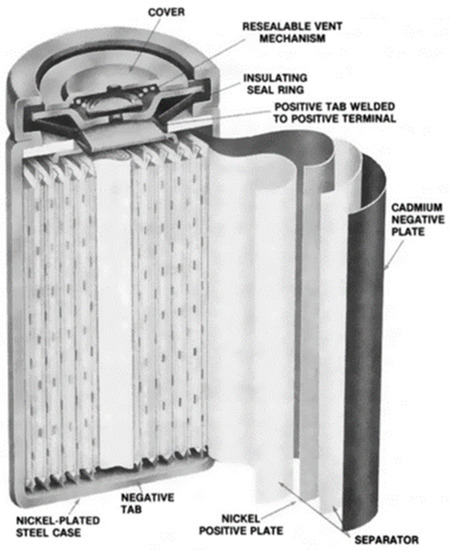
Figure 5.
Diagram of a Nickel Cadmium Battery [24].
4.2.2. Nickel Metal Hydride
NiMH is a battery chemistry that is mature and fully commercial. Similar to NiCd, the cathode of NiMH is made of nickel oxyhydroxide (NiO(OH)). However, the anode of NiMH is made of a hydrogen-absorbing alloy. The electrolyte in NiMH is potassium hydroxide. The reversible chemical reactions are shown in Equations (5) (anode reactions) and (6) (cathode reactions). The discharging reaction goes from left to right, while the charging reaction goes in the opposite direction.
The nominal voltage of NiMH is 1.2 V. The open-circuit voltage is between 1.25 V and 1.35 V. The discharge cut-off voltage is 1 V. NiMH batteries are usually made in valve-regulated models to allow for the release of gas during overcharging and short-circuit conditions. NiMH’s operating temperature range is between 0 °C and 40 °C. Operating NiMH at high temperatures reduces its performance due to increased internal resistance. NiMH batteries raise no environmental concerns, and their disposal is not difficult. They have up to 40% higher specific energy than NiCd [25]. NiMH batteries also have a long cycle life, a long calendar life, and high safety performance. The major drawbacks of NiMH are the memory effect, high self-discharge rate, high cost, inability to support a very high C-rate (greater than 5 C) for charging and discharging, and the need for a complex charging regime. However, the memory effect in NiMH is not as pronounced as in Ni-Cd. By altering the hydride alloy, the self-discharge rate can be reduced, which also reduces the corrosion of the alloy but also decreases the specific energy of the battery. Also, it is reported that there is little room for an increase in the power and energy densities of NiMH, and the high cost is not expected to drop significantly with increased production [26]. Sealed NiMH cells are manufactured in a cylindrical and prismatic way. The general schematic of a NiMH cell is shown in Figure 6.
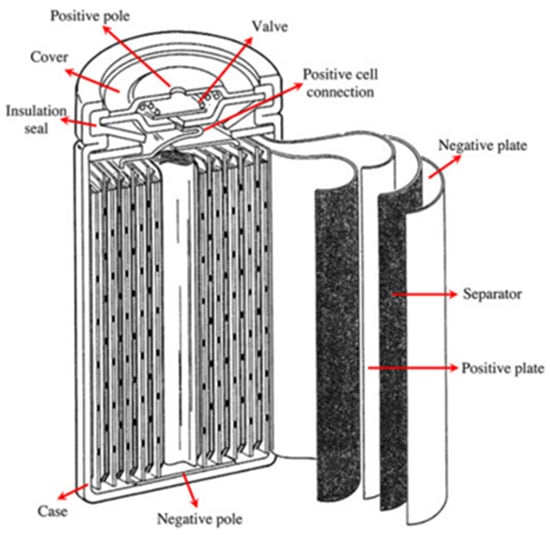
Figure 6.
Diagram of a Nickel Metal Hydride Battery [27].
4.3. Sodium Beta Batteries
Sodium beta batteries are a group of high-temperature batteries that use molten sodium as the anode, beta alumina as the electrolyte/separator, and different materials in the cathode. Sodium sulfur and sodium nickel chloride batteries are the major battery chemistries that belong to this category. The schematic of a sodium beta battery is shown in Figure 7.

Figure 7.
Diagram of Sodium beta battery (Cathode material depends on the battery chemistry).
4.3.1. Sodium Sulfur
Sodium sulfur batteries are emerging as a leading solution for grid-scale services due to their high cycle life and calendar life. They use molten sodium as the anode and molten sulfur as the cathode. Non-aqueous, solid beta alumina is used as an electrolyte. When discharging, sodium changes at the interface between the sodium electrode and the electrolyte, becoming a sodium ion (Na+) and releasing an electron. This sodium ion passes through the electrolyte to combine with sulfur at the cathode to form sodium polysulfide () and absorb an electron. The reverse reaction occurs during charging [28,29,30]. The reversible chemical reaction is given in Equation (7).
where belongs to a range of numbers.
The NaS battery needs to be operated at a high temperature (350 °C) in order to keep the sodium and sulfur electrodes in liquid form and facilitate the chemical reaction [31,32]. Beta alumina is a good conductor of sodium ions at this temperature (350 °C) but a poor conductor of electrons, which limits self-discharge. The battery must be pre-heated before use, but when in use, the heat produced by the charging/discharging cycles is enough to maintain the high temperature in the battery without an external heat source. However, this high-temperature operation is the major drawback of NaS, as it increases its complexity, leading to increased manufacturing costs [33]. Also, when not in use, the energy of the battery is used to maintain the high temperature. Research is ongoing on NaS batteries that can operate at room temperature, and these batteries theoretically have a higher energy density than high-temperature NaS [34]. Room temperature NaS not only reduces energy losses but also mitigates safety issues such as explosion risk due to the failure of the solid electrolyte during operation at high temperatures. However, there are challenges with room-temperature NaS batteries, which include: low reactivity between sodium and sulfur; shorter cycle life; formation of dendrites at the anode, which create short-circuits in the battery; poor conductivity of sulfur and sodium polysulfides; and volume expansion of sulfur, which creates mechanical stress in the battery. Another drawback with NaS is the loss of capacity due to the formation of insoluble polysulfides at the anode. Soluble polysulfides migrate from the cathode to the anode, where they react with sodium to form insoluble polysulfides. These insoluble polysulfides form dendrites at the anode, which hinder the movement of sodium ions into the electrolyte. Also, these insoluble polysulfides cannot be decomposed into sodium and sulfur during charging, and this leads to a loss of active materials in the battery, which in turn, leads to capacity loss. Another drawback of NaS is that it has safety concerns as sodium burns when in contact with air or moisture; thus, the battery must be shielded from water and air.
4.3.2. Sodium Nickel Chloride
A sodium nickel chloride battery, also known as a ZEBRA battery, is a high-temperature battery operated between 280 °C and 350 °C [16]. The anode is made of sodium, and the cathode consists of nickel and nickel chloride. A beta-alumina ceramic material serves as the electrolyte and separates the anode and cathode. The ceramic electrolyte ensures the transport of sodium ions. The electrolyte has higher ionic conductivity at higher temperatures, which is why the battery is operated at high temperatures [35]. Also, the anode needs to be kept in a molten state for the reactions to occur. To ensure contact between the cathode and the ceramic electrolyte, the cathode is flooded with molten sodium chloroaluminate (NaAlCl4), which serves as the secondary electrolyte and enables rapid transportation of sodium ions.
When discharging, metallic sodium is oxidized to sodium ions at the beta alumina-anode interface and migrates through the ceramic electrolyte and through the molten sodium chloroaluminate into the cathode, where it reacts with nickel chloride (NiCl) to produce metallic nickel and sodium chloride. The reverse reaction occurs during charging. The reversible chemical reactions are given in Equations (8) (anode reaction) and (9) (cathode reaction).
The major advantages of a ZEBRA battery are: relatively high energy density, long life cycle, fast response, long discharge time, and low maintenance [36]. Also, ZEBRA batteries are tolerant to overcharge and have a lower operating temperature compared to NaS. The major drawbacks are the high cost, the high self-discharge rate, and the need to operate the battery at high temperatures. The ZEBRA battery has safety concerns similar to those of NaS, as the sodium anode must be shielded from contact with air or moisture in order to avoid the risk of fire. However, based on safety tests performed in [35] and with proper safety-oriented manufacturing, this battery chemistry can be considered inherently safe.
4.4. Flow Batteries
A flow battery is a battery that uses two liquid electrolytes stored in separate tanks. These electrolytes are pumped through their respective spaces, which are separated by an ion-selective membrane. As these electrolytes circulate through their respective spaces, ion exchange occurs through the ion-selective membrane, which is accompanied by a flow of electric current through the external circuit. As the reactions are both reducing and oxidizing, they are called redox flow batteries. During the discharging process, a reduction reaction occurs at the anode and an oxidation reaction occurs at the cathode. The reverse reactions occur during charging. The energy capacity of the battery depends on the volume and concentration of the electrolytes stored in the tanks, while the power rating depends on the surface area of the electrode and the number of cells in the stack [37,38]. The main advantages of flow batteries are that they can be designed to match any power and energy ratings, have a long cycle life, and have a relatively high efficiency (up to 85%). Other advantages of flow batteries are their long discharge duration, negligible self-discharge due to the storage of the electrolytes in separate tanks, and suitability for grid-scale ES solutions [18,19,20,21,22,23,24,25,26,27,28,29,30,31,32,33,34,35,36,37,38,39,40,41]. The major drawback of flow batteries is that they have low power and energy density and a high initial cost when compared with Li-ion batteries [42,43]. Another drawback of flow batteries is their low performance due to non-uniform pressure drops and the reactant mass transfer limitation [44,45]. Figure 8 shows the diagram of a redox flow battery. The main flow batteries are vanadium redox flow batteries (VRB) and zinc bromine flow batteries (ZnBr).
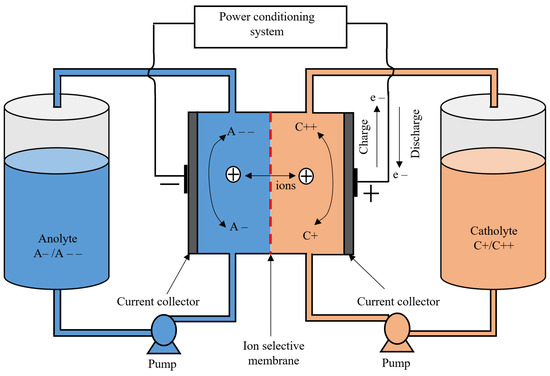
Figure 8.
Diagram of a redox flow battery.
4.4.1. Vanadium Redox Flow Battery
VRB uses vanadium redox couples ( and ) in two separate tanks to store energy. The ability of vanadium to exist in four oxidation states is exploited so that the same active material is used in both storage tanks. electrolyte is used as the catholyte, and electrolyte is used as the anolyte. During the discharge/charge cycles, ions are exchanged through the ion-selective membrane. The reversible redox reactions are given in Equation (10) (cathode reaction) and Equation (11) (anode reaction); the cell voltage is 1.4 V [37,44].
Advantages of VRB include the ability to operate in a wide operating temperature range, high safety, low maintenance costs, a long cycle life, and no environmental concerns (as they do not use toxic materials) [46]. VRBs are also tolerant to overcharge and deep discharges. The major drawback of VRBs is that they are expensive. Also, the operation of the pump causes losses that reduce the efficiency of the system. Also, the system of VRB is complex, and it is not ideal for small-scale ES solutions [47,48,49].
4.4.2. Zinc Bromine Flow Battery
Zinc bromine flow batteries (ZnBr) can be classified as hybrid flow batteries. ZnBr uses two aqueous electrolytes stored in separate tanks, which are based on zinc and bromine elements. During discharge/charge these electrolytes are pumped through two respective spaces (separated by a membrane) that contain carbon-plastic composite electrodes. During discharge, zinc and bromine react together to form zinc bromide. Consequently, this results in an increase in the concentration of zinc and bromine ions ( and ) in the electrolyte tanks. During charge, a thin layer of metallic zinc is deposited on the negative electrode, while bromine is produced at the positive electrode, which dissolves in the electrolyte and reacts with other agents to form bromine oil. The reversible chemical reactions are given in Equations (12) (positive electrode reaction) and (13) (negative electrode reaction) [43,50].
ZnBr has a cell voltage of 1.4 V [50]. ZnBr can tolerate deep discharges [44,51], has a life span of 10–20 years, and has a discharge duration of up to 10 h [50,52]. The main drawbacks of ZnBr are capacity loss through dendrite formation, low efficiency (75%), material corrosion, and a narrow temperature operating range [44,50,53,54,55].
4.5. Metal-Air Battery
Metal-air batteries have drawn much interest as they have a theoretical energy density that is higher than that of Li-ion battery chemistries [56]. A metal–air battery uses metal as the anode, air as the cathode, a separator, and an electrolyte that conducts metal-ion. The air cathode is what characterizes a metal-air battery. The air cathode is usually made of a porous carbon structure that is immersed in an electrolyte with access to ambient air. The electrolyte can be aqueous or non-aqueous, and this influences which reactions take place and the reaction products [56]. The electrolyte is often a good conductor of hydroxyl ions (), and the commonly used electrolyte is KOH. When the battery is discharging, the metal anode is oxidized (releasing free electrons), and oxygen is reduced at the cathode to form ions containing oxygen. The metal ions and the oxygen-containing ions move through the electrolyte and combine to form metal oxide. The reverse reaction takes place during charging as the metal oxide decomposes to release metal at the anode and oxygen at the cathode. The main drawback with metal-air batteries is the low utilization of the metal anode and the slow reaction rate at the cathode [57,58]. Often, a catalyst is used to aid the oxygen reduction at the cathode. Also, oxygen is not very soluble in the electrolyte, and this affects the rate of transport of oxygen in the electrolyte, which consequently impacts the reaction rate [59,60]. Also, the production of metal oxides, hydroxides, and other products at the anode covers the electrode and hinders the discharge process [57]. Metal-air batteries have a low cycle life (100–500), are difficult to recharge, and have a low efficiency (~50%) [50].
Zinc–Air
Zinc–air (Zn–air) batteries are the most investigated metal–air chemistry due to the abundance of zinc, its low cost, and its low environmental impact. In the Zn–air battery, zinc is used as the anode, and the air cathode consists of a carbon porous structure (for easy passage of air) and a catalyst. During discharge, oxygen is reduced to form hydroxyl ions (with the aid of the catalyst) in the alkaline electrolyte. The formed hydroxyl ions migrate to the anode, where they combine with an oxidized zinc ion to form zinc oxide. Further reaction leading to the release of hydrogen gas at the anode is possible, but this reaction is undesirable and needs to be limited to increase the capacity of the battery [61,62]. The overall reaction during discharge is given in Equations (14)–(19) [56].
Anode reactions
Cathode reaction
Overall reaction
Figure 9 shows the diagram of a Zn–air battery. The theoretical cell voltage is 1.65 V. But the practical cell voltage is lower (1.35–1.4 V) due to the internal polarization of the cell [63,64]. The theoretical energy density of zinc air is 1350 Wh/kg. Like other metal–air batteries, Zn–air batteries have several drawbacks, which include dendrite formation at the anode (leading to capacity loss), zinc reaction with water to produce hydrogen gas (also leading to capacity loss), low solubility of oxygen in the electrolyte (lowering the reaction rate and thereby limiting the power density), poor electrochemical stability of the cathode during charging, and a higher value of polarization when charging than discharging [65]. Another major drawback with Zn–air batteries is that their lifespan can be shortened depending on the difference in vapor pressure between the electrolyte and the ambient air [56]. In environments with low humidity and high temperatures, the electrolyte can lose water, which can cause the cell to fail. Likewise, because potassium hydroxide is deliquescent, in very humid atmospheres the cell can gain water, which dilutes the electrolyte concentration and floods the cathode, thereby destroying its active properties, which leads to cell failure. Also, Zn-air batteries operate in a narrow temperature range (0–50 °C) [56].
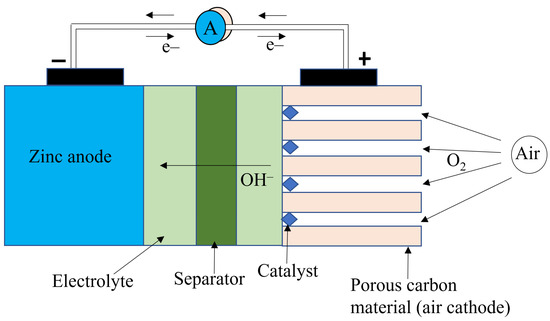
Figure 9.
Diagram of a Zn-air battery.
4.6. Lithium-Ion Capacitor
Lithium-ion capacitor (LiC) is a relatively new ES technology [66] and is a battery formed by combining a capacitor and a Li-ion cell together. LiC uses materials from a supercapacitor and a Li-ion battery to form an ES that has properties of both technologies. Thus, a hybrid battery technology is formed that has high energy (Li-ion property) and high power (supercapacitor property) capabilities. It uses lithium in the anode and activated carbon (made from sawdust) in the cathode. One major benefit of this battery technology is that it is very safe, with minimal risk of thermal runaway in comparison with Li-ion battery chemistry. Metal oxide is replaced by activated carbon, which eliminates the presence of oxygen internally which can aid the start of a fire. Also, LiC has low internal resistance, which leads to higher efficiency and a reduced need for cooling. LiC is rated to be capable of delivering 30 C, i.e., charge/discharge completely in 2 min. This high C-rate makes the LiC have a very high power density, which implies that less weight and space are needed. Note that the quoted C-rate for LiC is based on data obtained from one vendor (Beyonder) and cannot be considered general for all LiC cells. Also, LiC is not yet mature, and as such, there is no consolidated data on its actual performance.
4.7. Comparative Analysis of the Different Battery Chemistries
In this section, a comparative analysis of the properties of the different battery chemistries, grouped into high and low C-rate batteries, is presented. Batteries with C-rates (for charging and discharging) greater than 1 C are classified as high C-rate batteries, while batteries with C-rates (for charging and discharging) less than or equal to 1 C are classified as low C-rate batteries. LFP, LTO, NMC, NiCd, NiMH, and LiC are high C-rate batteries. These batteries are potential candidates for spinning reserves. NaS, ZEBRA, VRB, ZnBr, and Zn–air are low C-rate batteries and are more applicable for services such as peak shaving and renewable energy time shifts. The nominal voltage, charge/discharge rate, safety, and cost of the battery chemistry are furnished in Table 1. Other characteristics of the battery chemistries are furnished in Table 2.

Table 1.
Comparison of C-rates and other properties of the considered battery chemistries [21,25,48,67,68].
Table 2.
Characteristics of the various battery chemistries.
4.7.1. Technical Maturity
The battery chemistries are grouped into three categories according to their technical maturity: mature, developed, and research and development [13]. NiCd and NiMH are mature chemistries. NiCd batteries have been used for over 100 years. LFP, LTO, NMC, NaS, ZEBRA, VRB, and ZnBr all fall into the category of developed chemistries and are fully commercial. However, the use of these battery chemistries for large-scale grid applications is still limited, mostly due to their high cost. Zn–air and LiC are battery chemistries that are in the research and development stage, although there have been some demonstration projects for Zn–air batteries. The technical maturity chart is shown in Figure 10.
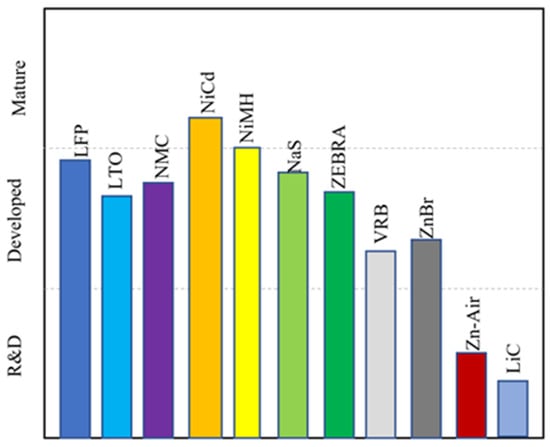
Figure 10.
Technical maturity of battery chemistries.
4.7.2. Discharge Time and Power Rating
The typical discharge time and the power rating vary with battery chemistry. The discharge time and power rating for the different battery chemistries are shown in Figure 11. It can be seen that Zn-air and flow batteries (VRB and ZnBr) are good for long discharge durations. VRB and ZnBr batteries are good for grid-scale applications demanding long discharge durations. On the other end of the scale, LiC is good for grid applications with a short discharge duration (about 2 min). The other battery chemistries (Li-ion, NaS, ZEBRA, NiCd, and NiMH) fall in between the discharge duration of flow batteries and LiC.
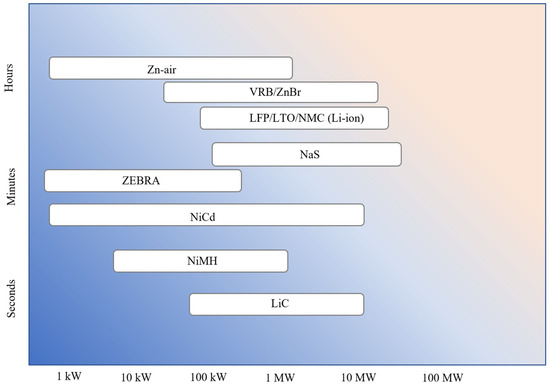
Figure 11.
Discharge time and power rating of different battery chemistries.
4.7.3. Power and Energy Density
The gravimetric power and energy density for the different battery chemistries are shown in Figure 12. LiC has the highest gravimetric power density, while Zn–air has the highest gravimetric energy density. The gravimetric power and energy densities are important properties, as there is a limit to the amount of weight that can be accommodated on an OOGP.
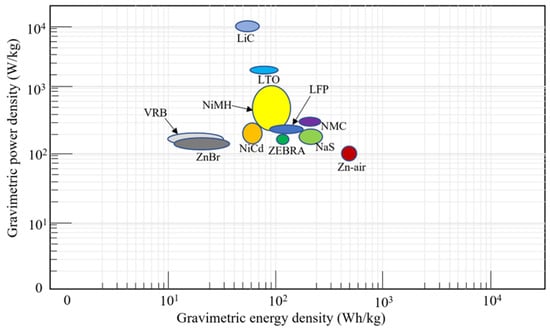
Figure 12.
Gravimetric energy and power density of different battery chemistries.
5. Operational Experiences and Practical Deployments in Offshore Environment and Proximal Fields
In this section, the operational experience and practical deployment of the various battery chemistries in offshore environments are specifically reviewed. However, due to the limited application of batteries in offshore isolated power systems, practical deployments in onshore grids are also considered. The technical feasibility of the battery chemistry can be assessed using operational experience.
BESS constitute less than 10% of global installed grid ES capacity in 2020, with pumped hydro storage taking up over 90% of global installed grid ES capacity [82]. However, in recent years, BESS installation for grid-scale applications has grown at a fast pace. As of 2020, the global installed grid-scale BESS was 17 GW [83]. 5 GW of BESS was added in 2020 alone, with lithium-ion taking a share of 93%. This shows that lithium-ion will continue to dominate the energy storage market for grid-connected BESS. Hence, Li-ion has plenty of operational experience. Table 3 shows the practical deployments of various battery chemistries for grid applications for both offshore and onshore.
Table 3.
Operational experience and practical deployments of BESS.
The largest lithium-ion grid-connected ES solution in the world is at Moss Landing, California, USA, with a 400 MW/1600 MWh rating [84]. The BESS’s primary functions are to perform peak shaving and renewable energy time shifts. This enormous deployment of lithium-ion batteries proves the technical and economic feasibility of their application for grid services. Another large BESS has also been brought online in Moss Landing, California, USA, with a capacity of 182.5 MW/730 MWh [85]. The unit is composed of 256 Tesla Megapacks on 33 concrete slabs. The grid services performed by this BESS are peak shaving and renewable energy time shift. More importantly, Li-ion batteries have been deployed offshore. 6 MW/166 MWh Li-ion BESS was deployed on the West Mira drilling rig in the North Sea in 2018 [19]. The Li-ion BESS helps to perform peak shaving, which leads to a 42% reduction in the diesel engine runtime. This corresponds to a 15% CO2 emissions reduction and a 12% NOx emissions reduction. A Li-ion battery was also deployed in Goodwyn A OOGP on the Australian North West Shelf in 2019 [86]. The Li-ion BESS is a 1 MW/1 MWh Powerstore battery that was deployed for spinning reserve. The platform has four gas turbines that are always running. The deployment of the battery allows the platform to run on three gas turbines, with the fourth gas turbine shut down. The integration of the Li-ion BESS yields a fuel gas consumption reduction of 3000 tonnes per year and a CO2 emission reduction of 4%.
NaS batteries have also been applied to large-scale grid services. NGK insulators is the sole manufacturer of NaS batteries and has successfully installed NaS batteries in several locations around the world, many of them in Japan. The largest NaS installation is a 108 MW/648 MWh installation in Abu Dhabi, UAE [94]. It is a virtual battery plant composed of 15 batteries located in 10 locations in the city. All the batteries are operated as a single ES unit using a communication link. The major grid service performed by this BESS unit is peak shaving. Similarly, NaS has been deployed in other large installations, which are given in Table 3. The major reason NaS is being used for large installations is the relative abundance of sodium and sulfur, which make them cheap raw materials unlike the rare and expensive lithium and cobalt used in Li-ion batteries. However, pure sodium burns spontaneously in the presence of air and moisture, and a robust protection layer must be used to house the molten sodium and sulfur. This leads to increased manufacturing costs.
ZEBRA batteries have also been used for several grid services, although at lower power ratings compared to those of NaS. The largest ZEBRA battery installation in the world is on Prince Edward Island, Canada, with a rating of 10 MW/20 MWh [87]. The BESS is based on the Durathon battery supplied by General Electric. The BESS is used for renewable energy time shifts, which help to use more renewable energy. The BESS has been operating since 2013. ZEBRA batteries have also been applied in OOGP as a backup power supply for critical equipment, but with low power ratings. Other ZEBRA applications are given in Table 3.
VRB is the most deployed flow battery for grid applications. VRB has been used in grid applications as low as 100 kW [105] and in multi-MW applications. The largest VRB installation is a 200 MW/800 MWh BESS in Dalian, China [98]. The major reason VRB is used is that it does not lose capacity after cycling thousands of times and is non-flammable. There are several other deployments of VRB, some of which are shown in Table 3. These practical deployments demonstrate the techno-economic suitability of VRB for grid-scale applications. The main challenge for the application of VRB in an OOGP is its low gravimetric and volumetric energy density, which requires large space and weight.
ZnBr is less used compared to VRB, and as such, there are few grid-scale applications of ZnBr. The most notable deployment of ZnBr is a 500 kW/2 MWh BESS at a microgrid at the Rialto bioenergy facility owned and operated by waste recovery company Anaergia in San Bernadino County, California [101]. The BESS is supplied by Australian ZnBr manufacturer Redflow. The BESS consists of 192 Redflow ZnBr batteries (each rated at 10 kWh). The primary function of the BESS is to reduce the peak load drawn by the microgrid. In general, ZnBr has much less operational experience and practical deployments compared to VRB, and as such, its techno-economic feasibility has not been robustly demonstrated.
Nickel-based batteries have the fewest grid-scale practical deployments among commercial battery chemistries. The only known grid-scale applications of NiCd are: a 27 MW/14.6 MWh BESS at Fairbanks, Alaska, USA [103] and a 3 MW/6 MWh BESS at Bonaire Island, Netherlands [104]. Both deployments are used for spinning reserves. The 3 MW/6 MWh BESS is also used for frequency regulation. The only known grid-scale application of NiMH is a 0.3 MW/0.08 MWh BESS at Okinawa, Japan [89]. The BESS is used for frequency regulation. NiMH is typically not used for grid applications, but it is more readily used in plug-in hybrid electric vehicles due to its high energy density and lower life cycle cost compared to Li-ion batteries. Thus, both NiCd and NiMH have limited operational experience, and their techno-economic feasibility has not been robustly demonstrated.
Zinc-air batteries are mostly in the research and development phase and have not been commercialized. Thus, there is no operational experience. Likewise, even though there are few LiC products on the market, LiC has not attained full commercial status, and thus there is no operational experience for it. Due to this, both zinc–air batteries and LiC are discarded and are not investigated further.
6. Case Study
6.1. Identification of Grid Service (Step 1)
Two case studies are considered based on the load data of a real OOGP in the North Sea. The first case study considers the TSA of BESS for peak shaving, the second for spinning reserve. The histogram of the platform load demand for one year is shown in Figure 13. The base power is 101 MVA. The platform has four gas turbines, each rated at 20.2 MW/25.25 MVA. It can be seen from Figure 10 that the load demand can vary a lot, and, as a result, the number of gas turbines running can vary between 2 and 4. By integrating ES as a spinning reserve, one more gas turbine can shut down, which increases system efficiency and reduces carbon emissions.
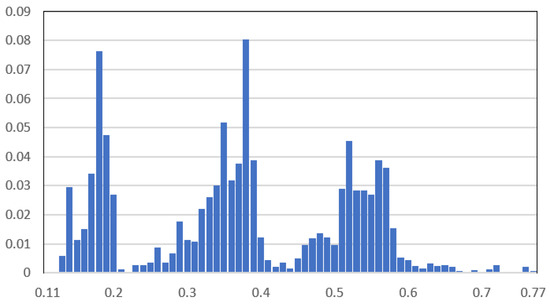
Figure 13.
Histogram of the selected platform load demand for a year.
The definition of the target grid service is the first step in the TSA procedure presented in Section 2.
Due to the starkly different C-rates required for the two applications (peak shaving and spinning reserve), they are treated separately, and it is assumed that the same ES does not serve both applications. However, it is possible to use the same BESS for both services. In order to do this, the BESS must be sized for both services. However, this is not considered in this work.
6.2. Selection of Potential Battery Chemistries from a Preliminary List (Step 2)
The preliminary list of battery chemistries for case study I includes LFP, LTO, NMC, LMO, LCO, NCA, NiCd, NiMH, NaS, ZEBRA, VRB, ZnBr, Zn–air, and LiC. The application requirements for case study I are listed in Table 4. For case study II (spinning reserve), the preliminary list of battery chemistries is the same as for case study I, i.e., 14 battery chemistries are considered. The application requirements for case study II are listed in Table 5.
Table 4.
Application requirements for case study I (Peak shaving).
Table 5.
Application requirements for case study II (Spinning reserve).
For both case studies, fast response is not considered, as a delay of a fraction of a second has a negligible impact on the operation of both grid services. The requirements for cycle life and life span are relaxed (the required life span for both services is 20 years, the required cycle life for peak shaving is 6935 cycles, and the required cycle life for spinning reserve is 1176 cycles—how the cycle life requirements are derived are explained in Section 6.4.3 and Section 6.5.3) so as to include a broader range of battery chemistries in the analysis. A minimum cycle life of 1000 cycles and a life span of 10 years are chosen for both case studies. For case study I, a high ramp rate is not required. Only eleven of the fourteen battery chemistries satisfy the application requirements for case study I, while only six of the fourteen battery chemistries satisfy the application requirements for case study II.
6.3. Operational Experience (Step 3)
For case study I (peak shaving), LiC and Zn-air are discarded based on the operational experience reviewed in Section 5. Thus, only nine of the eleven battery chemistries from step 2 are passed on for further assessment. For case study II (spinning reserve), LiC is discarded based on the operational experience reviewed in Section 5. Thus, only five of the six battery chemistries from step 2 are passed on for further assessment.
Step 4 to step 7 are treated separately for the two case studies.
6.4. Case Study I: Peak Shaving (Step 4–7)
6.4.1. ES Sizing (Step 4—Case Study I)
In peak shaving, one has to decide how much of the load peak is to be shaved. In this test case, the ES must be able to reduce the peak by a minimum of 5%, assuming the load average for a given day is less than the load peak of the day by up to 5% of the load peak. From the load data, the maximum load is 77 MW. 5% of 77 MW is 3.85 MW. The average load on the day of this peak is 67.45 MW. Thus, the full 3.85 MW can be utilized. Note that the ES will be able to reduce the peak by up to 10% in at least half of the time as the average load on the platform is 37.56 MW. Load peaks generally do not last long. Load peaks usually last for 3 to 6 h. Thus, the ES must be able to provide the maximum power for six hours. This implies a BESS rating of 3.85 MW/23.1 MWh. The power conditioning system used is an SMA 4 MVA inverter [106]. Now that the power and energy rating of the ES have been determined, the ES’s weight and space are estimated.
6.4.2. ES Weight and Space Estimation (Step 5—Case Study I)
Here, the weight and space for all nine battery chemistries from Step 3 are estimated. In this technology suitability assessment, 500,000 kg and 500 m2 are chosen as the maximum allowable weight and space, respectively. Given that the maximum C-rate in this application is 0.17 C, the energy rating is used to estimate the weight and space. The weight for the different battery chemistries is estimated using the median of the range of gravimetric energy density provided in Table 2. However, the weight of NaS, ZEBRA, and NMC is estimated based on practical products [107,108,109]. The estimated weight for the different battery chemistries is given in Table 6. The estimated weight includes the weight of the container. A 20-foot container is used, whose empty weight is 2300 kg [110]. The number of containers required for NaS, ZEBRA, NMC, and LFP is determined from practical container battery products [107,108,109,111]. UniEnergy Technologies deployed 10 containers of VRB in Pullman, Washington [112]. Eight of these containers house 4 MWh of ES while the other two containers house the power conditioning system (PCS). The required number of containers for VRB is derived from this practical deployment. The required number of containers for ZnBr is determined using Redflow’s ZnBr battery [113]. The dimensions of this product are used to determine how many of them can fit in one container. Thus, the required number of containers is determined based on the ES capacity of one container. The required number of containers for LTO, NiCd, and NiMH is derived by using the relative volumetric energy density of these chemistries with respect to the base product, which is LFP. For the heating, ventilation, and air-conditioning (HVAC) weight, this depends on the internal resistance of the battery and the amount of current drawn from the battery. Since all battery chemistries are to be used for the same purpose, what determines the size of HVAC required is the amount of battery capacity in a container and the battery’s internal resistance. Thus, battery chemistries with more containers require less HVAC space per container as the heat produced by the battery will be less compared to highly dense battery chemistries. An HVAC with a cooling capacity of 30 kW per container (350 kg in weight) is assumed for LFP, NMC, and NiMH [114]. An HVAC with a cooling capacity of 20 kW per container (250 kg in weight) is assumed for LTO. An HVAC with a cooling capacity of 15 kW per container (200 kg in weight) is assumed for NiCd, VRB, and ZnBr.
Table 6.
Estimated weight of different battery chemistries for an ES size of 23.1 MWh.
The estimated floor space for the battery chemistries is given in Table 7. The HVAC dimension for the battery chemistries is based on the HVAC for a SAFT NMC battery [114]. The dimensions of the 20-foot container and the HVAC are given in Appendix A.
Table 7.
Estimated floor space of different battery chemistries for an ES size of 23.1 MWh.
NiCd, VRB, and ZnBr do not satisfy the weight and/or space limits and are therefore discarded.
6.4.3. Life Cycle Cost Evaluation (Step 6—Case Study I)
Here, the life cycle cost of the different battery chemistries is evaluated. The life cycle cost is given by Equation (20).
where is life cycle cost, is the initial capital cost ($) which includes initial installation cost, is the present value cost of all replacements in the project life ($), is replacement installation cost, is the total O&M cost over the project life ($), is the actual replacement cost, is the capacity recovery factor, is the project life in years, is the number of replacements, is the number of years lasted before the replacement (years), is the annual interest rate, is the annual O&M cost, and is the annual inflation rate. Note that will be the same for all the replacements if the number of cycles used per year is assumed constant over the project life.
The cost parameters for the battery chemistry are provided in Table 8. The replacement cost depends on the number of replacements needed for a battery chemistry, which in turn, depends on the cycle life and life span of the battery chemistry. To determine the number of replacements, the required cycle life is specified. It is assumed that peak shaving requires an average of 0.95 cycles per day. This implies the project requires 6935 cycles over its 20 year design life. LTO has no replacement cost as it has a cycle life of 7000 and a life span of 20 years. Based on a cycle life of 3500 cycles, LFP is replaced once in the 11th year. Based on a cycle life of 2000 cycles, NMC is replaced three times in the 6th, 12th, and 18th years. The life cycle cost is given in Table 9. Based on a cycle life of 3000 cycles, NiMH is replaced in the 9th and 18th years. Based on a cycle life of 4500 cycles, NaS is replaced once in the 13th year. Based on a cycle life of 2500 cycles, ZEBRA is replaced in the 8th and 15th year. Note that the precise number of years before replacement is used. For example, ZEBRA is replaced after 7.21 and 14.42 years. The replacement year for the battery chemistries is shown in a Gantt chart in Figure 14.
Table 8.
Cost parameters of the different battery chemistries for peak shaving.
Table 9.
Life cycle cost of the battery chemistries.
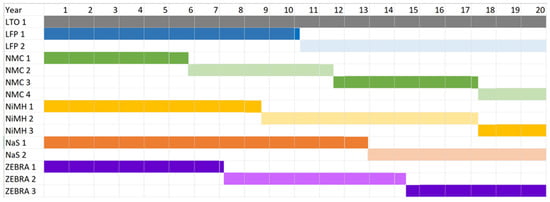
Figure 14.
A Gantt chart showing the year of replacement for the battery chemistries.
The life cycle cost for the battery chemistries is shown in Table 9.
6.4.4. Decision Making Using Technology Suitability Assessment Weighted Score (Step 7—Case Study I)
Here, a TSA-weighted score is calculated for all six considered battery chemistries. The TSA weighted score is given by Equation (24). Two sets of weights are assigned: one is based on the relevance of the attributes, and the other is based on the spread of the result. The following weights: 4, 4, 5, 5, and 3 are assigned subjectively (based on relevance) to weight, space, safety, life cycle cost, and operational experience, respectively.
where are the scores (which can be from 0.5 to 5) for weight, space, safety, life cycle cost, and operational experience, respectively. , , and are the weights assigned to weight, space, and life cycle cost, respectively, which are determined based on the spread of results from weight, space, and life cycle cost estimation. The higher the spread, the higher the weight assigned. The spread is a measure of how much an attribute varies. It is defined as the coefficient of variation, which is the ratio of the standard deviation to the mean. The coefficient of variation is given in Equation (25).
where is the standard deviation of , is the mean of and can be weight, space, or life cycle cost.
The coefficient of variation is used to assign weights to the TSA attribute in order to make the TSA analysis as objective as possible. This allows using the maximum and minimum scores of the attributes as the full range for assigning scores. The weights , and are assigned values according to the range defined for in Figure 15.

Figure 15.
Weight range for .
From the result of the weight, space, and life cycle cost estimations, , and . Thus, , and . The score range for weight, space, and life cycle cost are given in Figure 16, Figure 17 and Figure 18, respectively. The scores for operational experience and safety are determined subjectively.

Figure 16.
Score range for weight (peak shaving).

Figure 17.
Score range for space (peak shaving).

Figure 18.
Score range for life cycle cost (peak shaving).
The TSA weighted score is given in Table 10. A higher TSA-weighted score is better. From Table 10, ZEBRA has the lowest TSA-weighted score due to its poor performance in weight and space. It can be seen that LFP has the highest TSA weighted score due to its good performance in weight, space, safety, and operational experience. Thus, it can be concluded that LFP is the most suitable battery chemistry for peak shaving.
Table 10.
Technology suitability assessment weighted score for peak shaving (the higher TSA score, the better).
6.5. Case Study II: Spinning Reserve
Here, a technology suitability assessment is performed for spinning reserve on an OOGP in the North Sea.
6.5.1. ES Sizing (Step 4—Case Study II)
A BESS of 6 MW is proposed for the spinning reserve. A 30-min spinning reserve is proposed. Thus, the required ES capacity is 3 MWh. The C-rate of this application is 2, so only high C-rate battery chemistries listed in Table 1 are considered. With the BESS, the platform can run on 1–3 gas turbines most of the time. The platform only runs on four gas turbines when the load exceeds the capacity of three gas turbines. For the power conditioning system, two SMA 4 MVA inverters are used [106].
6.5.2. Weight and Space Estimation (Step 5—Case Study II)
Here, the weight and space of the BESS are estimated. The maximum allowable weight and space are 500,000 kg and 500 m2, respectively. As in case study I, the weight for the different battery chemistries is estimated using the median of the range of gravimetric energy density provided in Table 2. A 10-foot container is used here due to the small ES capacity. The HVAC weight is estimated based on the cooling capacity required in each 10-foot container. 15 kW, 15 kW, 12.5 kW, 10 kW, and 15 kW of cooling capacity per container are assumed for LFP, NMC, LTO, NiCd, and NiMH, respectively. The estimated weight for the battery chemistries is shown in Table 11.
Table 11.
Estimated weight of different battery chemistries for an ES size of 6 MW/3 MWh.
The estimated space for the battery chemistry is shown in Table 12. All five battery chemistries satisfy the weight and space limits and are therefore being investigated further.
Table 12.
Space of the different battery chemistries for an ES size of 6 MW/3 MWh.
6.5.3. Life Cycle Cost (Step 6—Case Study II)
The life cycle cost is already defined in Section 6.4.3. Table 13 shows the cost parameters of the battery chemistries for spinning reserve. The load data for the platform in this case study was used to determine the number of cycles that the BESS must perform. From the data, the spinning reserve service was used 223 times, which amounted to 176.46 MWh of energy throughput in a year. This gives 58.82 cycles per year, and over 20 years, it gives 1176 cycles. All five battery chemistries have a cycle life higher than 1176 cycles and a life span of 20 years, so there is no need for replacement for any of the battery chemistries. Table 14 shows the life cycle cost for the five battery chemistries.
Table 13.
Cost parameters of ES for spinning reserve.
Table 14.
Life cycle cost of the battery chemistries.
6.5.4. Decision Making Using Technology Suitability Assessment Weighted Score (Step 7—Case Study II)
The TSA-weighted score was presented in Equation (24). in Equation (25) is again used here. From the result of the weight, space and life cycle cost estimations, , and . Thus, , and . The score ranges for weight, space, and life cycle cost are given in Figure 19, Figure 20 and Figure 21, respectively. Table 15 shows the TSA weighted score for the five battery chemistries. It can be seen from Table 15 that LTO has the lowest TSA weighted score, which is due to its poor performance in weight, space, and life cycle cost. It can be seen from Table 15 that LFP and NMC have the highest TSA weighted score and are considered the most suitable ES for spinning reserve.

Figure 19.
Score range for weight (spinning reserve).

Figure 20.
Score range for space (spinning reserve).

Figure 21.
Score range for life cycle cost (spinning reserve).
Table 15.
Technology suitability assessment weighted score for spinning reserve (the higher TSA score, the better).
7. Conclusions
This paper performed a technology suitability assessment study of multiple battery chemistries for application in OOGPs. An improved 7-step procedure for determining the most suitable battery chemistry is proposed. In order to implement the 7-step procedure, the following battery chemistries were reviewed in detail: LFP, LTO, NMC, NiCd, NiMH, NaS, ZEBRA, VRB, ZnBr, Zn–air, and LiC. As part of the 7-step procedure, the operational experiences of these battery chemistries were also reviewed and used to evaluate the suitability of the battery chemistries for peak shaving and spinning reserve. Based on the lack of sufficient operational experience, Zn–air and LiC were discarded while the remaining battery chemistries were investigated further.
In general, this work highlights the need for proper TSA for selecting a battery chemistry due to the harsh and unique conditions the offshore environment presents. This is exemplified using the 7-step procedure on two case study applications (peak shaving and spinning reserve), which are based on a real OOGP in the North Sea. Although several grid services were reviewed, the case study only considers two grid services, which are peak shaving and spinning reserve.
A TSA-weighted score is calculated. For peak shaving, ZEBRA has the lowest TSA-weighted score. ZEBRA’s low TSA-weighted score is due to its poor performance in weight and space. LFP has the highest TSA-weighted score and is deemed the most suitable battery chemistry for peak shaving. For spinning reserve, LTO has the lowest TSA-weighted score due to its high life cycle cost and requirement for high weight and space. LFP and NMC have the highest TSA-weighted scores and are deemed the most suitable battery chemistries for spinning reserve.
Note that even though the two grid services have been treated separately, one BESS can be deployed to deliver both grid services. If one BESS serves both grid services, it is possible to use a BESS size that is less than the sum of the two capacities for the grid services.
Author Contributions
Conceptualization, A.A.A.; methodology, A.A.A. and E.T.; validation, A.A.A. and E.T.; formal analysis, A.A.A. and E.T.; writing—original draft preparation, A.A.A.; writing—review and editing, A.A.A. and E.T.; supervision, E.T.; project administration, E.T.; funding acquisition, E.T. All authors have read and agreed to the published version of the manuscript.
Funding
This work was supported under the program PETROMAKS2 of the Research Council of Norway within the project “Smart Platform” with grant number 308735.
Data Availability Statement
The data used in this work is confidential.
Conflicts of Interest
The authors declare no conflict of interest. The funders had no role in the design of the study; in the collection, analyses, or interpretation of data; in the writing of the manuscript, or in the decision to publish the results.
Appendix A
Dimension of 20-ft container: 6.1 × 2.9 × 2.4 m;
Dimension of HVAC: 0.6 × 2.9 × 2.4 m.
References and Note
- World Energy Outlook 2018. Available online: https://iea.blob.core.windows.net/assets/77ecf96c-5f4b-4d0d-9d93-d81b938217cb/World_Energy_Outlook_2018.pdf (accessed on 12 July 2023).
- Mazzetti, M.J.; Nekså, P.; Walnum, H.T.; Hemmingsen, A.K. Energy-efficiency technologies for reduction of offshore CO2 emissions. Oil Gas Facil. 2014, 3, 89–96. [Google Scholar] [CrossRef]
- Emissions to Air. Available online: https://www.norskpetroleum.no/en/environment-and-technology/emissions-to-air/ (accessed on 12 July 2023).
- Electrification of Platforms. Available online: https://www.equinor.com/energy/electrification-of-platforms (accessed on 12 July 2023).
- Benefits and Challenges of Offshore Platform Electrification. Available online: https://www.offshore-energy.biz/benefits-and-challenges-of-offshore-platform-electrification/ (accessed on 12 July 2023).
- Pellow, M.A.; Ambrose, H.; Mulvaney, D.; Betita, R.; Shaw, S. Research gaps in environmental life cycle assessments of lithium ion batteries for grid-scale stationary energy storage systems: End-of-life options and other issues. Sustain. Mater. Technol. 2020, 23, e00120. [Google Scholar] [CrossRef]
- Chapaloglou, S.; Varagnolo, D.; Tedeschi, E. Techno-Economic Evaluation of the Sizing and Operation of Battery Storage for Isolated Oil and Gas Platforms with High Wind Power Penetration. In Proceedings of the IECON 2019-45th Annual Conference of the IEEE Industrial Electronics Society, Lisbon, Portugal, 14–17 October 2019; Volume 1, pp. 4587–4592. [Google Scholar]
- Aardal, A.R.; Marvik, J.I.; Svendsen, H.; Tande, J.O. Study of offshore wind as power supply to oil and gas platforms. In Proceedings of the Offshore Technology Conference, Houston, TX, USA, 30 April–3 May 2012. [Google Scholar]
- Farhadi, M.; Mohammed, O. Energy storage technologies for high-power applications. IEEE Trans. Ind. Appl. 2015, 52, 1953–1961. [Google Scholar] [CrossRef]
- Adeyemo, A.A.; Alves, E.; Marra, F.; Brandao, D.; Tedeschi, E. Suitability assessment of high-power energy storage technologies for offshore oil and gas platforms: A life cycle cost perspective. J. Energy Storage 2023, 61, 106643. [Google Scholar] [CrossRef]
- Oliveira, D.Q.; Saavedra, O.R.; Santos-Pereira, K.; Pereira, J.D.; Cosme, D.S.; Veras, L.S.; Bento, R.G.; Riboldi, V.B. A critical review of energy storage technologies for microgrids. Energy Syst. 2021, 1–30. [Google Scholar] [CrossRef]
- Georgious, R.; Refaat, R.; Garcia, J.; Daoud, A.A. Review on energy storage systems in microgrids. Electronics 2021, 10, 2134. [Google Scholar] [CrossRef]
- Mutarraf, M.U.; Terriche, Y.; Niazi, K.A.; Vasquez, J.C.; Guerrero, J.M. Energy storage systems for shipboard microgrids—A review. Energies 2018, 11, 3492. [Google Scholar] [CrossRef]
- Argyrou, M.C.; Christodoulides, P.; Kalogirou, S.A. Energy storage for electricity generation and related processes: Technologies appraisal and grid scale applications. Renew. Sustain. Energy Rev. 2018, 94, 804–821. [Google Scholar] [CrossRef]
- Alves, E.F.; Mota, D.D.; Tedeschi, E. Sizing of Hybrid Energy Storage Systems for Inertial and Primary Frequency Control. Front. Energy Res. 2021, 9, 206. [Google Scholar]
- Mexis, I.; Todeschini, G. Battery energy storage systems in the United Kingdom: A review of current state-of-the-art and future applications. Energies 2020, 13, 3616. [Google Scholar] [CrossRef]
- Abada, S.; Marlair, G.; Lecocq, A.; Petit, M.; Sauvant-Moynot, V.; Huet, F. Safety focused modeling of lithium-ion batteries: A review. J. Power Sources 2016, 306, 178–192. [Google Scholar] [CrossRef]
- Luo, X.; Wang, J.; Dooner, M.; Clarke, J. Overview of current development in electrical energy storage technologies and the application potential in power system operation. Appl. Energy 2015, 137, 511–536. [Google Scholar] [CrossRef]
- Leveraging Lithium-ion Energy Storage to Create Low-Emissions Offshore Drilling Rig. Available online: https://www.tdworld.com/distributed-energy-resources/energy-storage/article/21148768/siemens-energy-inc-leveraging-lithiumion-energy-storage-to-create-lowemissions-offshore-drilling-rig (accessed on 12 July 2023).
- Basic Research Needs for Electrical Energy Storage; Office of Basic Energy Sciences, U.S. Department of Energy: Washington, DC, USA, 2007.
- BU-205: Types of Lithium-Ion. Available online: https://batteryuniversity.com/article/bu-205-types-of-lithium-ion (accessed on 12 July 2023).
- McDowall, J. Integrating energy storage with wind power in weak electricity grids. J. Power Sources 2006, 162, 959–964. [Google Scholar] [CrossRef]
- Wehrey, M.C. What’s new with hybrid electric vehicles. IEEE Power Energy Mag. 2004, 2, 34–39. [Google Scholar] [CrossRef]
- Nickel–Cadmium Battery Clinic. Midland R/C; 2013.
- BU-203: Nickel-Based Batteries. Available online: https://batteryuniversity.com/article/bu-203-nickel-based-batteries (accessed on 12 July 2023).
- Axsen, J.; Burke, A.F.; Kurani, K.S. Batteries for PHEVs: Comparing goals and state of Technology. In Electric and Hybrid Vehicles: Power Sources, Models, Sustainability, Infrastructure and the Market; Elsevier: Amsterdam, The Netherlands, 2010; Volume 405. [Google Scholar]
- Aktas, A.; Kircicek, Y. Solar Hybrid Systems: Design and Application; Academic Press: Cambridge, MA, USA, 2021; pp. 87–125. ISBN 9780323884990. [Google Scholar] [CrossRef]
- Vazquez, S.; Lukic, S.M.; Galvan, E.; Franquelo, L.G.; Carrasco, J.M. Energy storage systems for transport and grid applications. IEEE Trans. Ind. Electron. 2010, 57, 3881–3895. [Google Scholar] [CrossRef]
- Zhang, G.; Wen, Z.; Wu, X.; Zhang, J.; Ma, G.; Jin, J. Sol–gel synthesis of Mg2C stabilized Na-β00/β-Al2O3 solid electrolyte for sodium anode battery. J. Alloys Compd. 2014, 613, 80–86. [Google Scholar] [CrossRef]
- Akhil, A.A.; Huff, G.; Currier, A.B.; Kaun, B.C.; Rastler, D.M.; Chen, S.B.; Cotter, A.L.; Bradshaw, D.T.; Gauntlett, W.D. DOE/EPRI 2013 Electricity Storage Handbook in Collaboration with NRECA; SANDIA Rep. SAND2013-5131; Sandia National Laboratories: Albuquerque, NM, USA, 2013; p. 340.
- Díaz-González, F.; Sumper, A.; Gomis-Bellmunt, O.; Villafáfila-Robles, R. A review of energy storage technologies for wind power applications. Renew. Sustain. Energy Rev. 2012, 16, 2154–2171. [Google Scholar] [CrossRef]
- Hadjipaschalis, I.; Poullikkas, A.; Efthimiou, V. Overview of current and future energy storage technologies for electric power applications. Renew. Sustain. Energy Rev. 2009, 13, 1513–1522. [Google Scholar] [CrossRef]
- Baker, J. New technology and possible advances in energy storage. Energy Policy 2008, 36, 4368–4373. [Google Scholar] [CrossRef]
- Wang, Y.; Zhang, Y.; Cheng, H.; Ni, Z.; Wang, Y.; Xia, G.; Li, X.; Zeng, X. Research progress toward room temperature sodium sulfur batteries: A review. Molecules 2021, 26, 1535. [Google Scholar] [CrossRef]
- Benato, R.; Sessa, S.D.; Crugnola, G.; Todeschini, M.; Turconi, A.; Zanon, N.; Zin, S. Sodium-nickel chloride (Na-NiCl2) battery safety tests for stationary electrochemical energy storage. In Proceedings of the 2016 AEIT International Annual Conference (AEIT), Capri, Italy, 5–7 October 2016; pp. 1–5. [Google Scholar]
- Telaretti, E.; Dusonchet, L. Stationary battery systems in the main world markets: Part 1: Overview of the state-of-the-art. In Proceedings of the 2017 IEEE International Conference on Environment and Electrical Engineering and 2017 IEEE Industrial and Commercial Power Systems Europe (EEEIC/I&CPS Europe), Milan, Italy, 6–9 June 2017; pp. 1–5. [Google Scholar]
- Yang, Z.; Zhang, J.; Kintner-Meyer, M.C.W.; Lu, X.; Choi, D.; Lemmon, J.P.; Liu, J. Electrochemical energy storage for green grid. Chem. Rev. 2011, 111, 3577–3613. [Google Scholar] [CrossRef] [PubMed]
- Eyer, J.; Iannucci, J.; Butler, P.C. Estimating Electricity Storage Power Rating and Discharge Duration for Utility Transmission and Distribution Deferral: A Study for the DOE Energy Storage Program; Technical Report; Sandia National Laboratories: Albuquerque, NM, USA; Livermore, CA, USA, 2005.
- Zhao, G.; Shi, L.; Feng, B.; Sun, Y.; Su, Y. Development status and comprehensive evaluation method of battery energy storage technology in power system. In Proceedings of the 2019 IEEE 3rd Information Technology, Networking, Electronic and Automation Control Conference (ITNEC), Chengdu, China, 15–17 March 2019; pp. 2080–2083. [Google Scholar]
- Ferreira, H.L.; Garde, R.; Fulli, G.; Kling, W.; Lopes, J.P. Characterisation of electrical energy storage technologies. Energy 2013, 53, 288–298. [Google Scholar] [CrossRef]
- Medina, P.; Bizuayehu, A.W.; Catalão, J.P.; Rodrigues, E.M.; Contreras, J. Electrical energy storage systems: Technologies’ state-of-the-art, techno-economic benefits and applications analysis. In Proceedings of the 2014 47th Hawaii International Conference on System Sciences, Waikoloa, HI, USA, 6–9 January 2014; pp. 2295–2304. [Google Scholar]
- Vanýsek, P.; Novák, V. Redox flow batteries as the means for energy storage. J. Energy Storage 2017, 13, 435–441. [Google Scholar] [CrossRef]
- Evans, A.; Strezov, V.; Evans, T.J. Assessment of utility energy storage options for increased renewable energy penetration. Renew. Sustain. Energy Rev. 2012, 16, 4141–4147. [Google Scholar] [CrossRef]
- Nguyen, T.; Savinell, R.F. Flow batteries. Electrochem. Soc. Interface 2010, 19, 54–56. [Google Scholar] [CrossRef]
- Taylor, E.J. Flow battery structures to improve performance and reduce manufacturing cost. In Proceedings of the 2012 DOE Energy Storage Program Peer Review and Update Meeting, Washington, DC, USA, 26–28 September 2012. [Google Scholar]
- Amrouche, S.O.; Rekioua, D.; Rekioua, T.; Bacha, S. Overview of energy storage in renewable energy systems. Int. J. Hydrogen Energy 2016, 41, 20914–20927. [Google Scholar] [CrossRef]
- Mahlia, T.M.; Saktisahdan, T.J.; Jannifar, A.; Hasan, M.H.; Matseelar, H.S. A review of available methods and development on energy storage; technology update. Renew. Sustain. Energy Rev. 2014, 33, 532–545. [Google Scholar] [CrossRef]
- Aneke, M.; Wang, M. Energy storage technologies and real life applications—A state of the art review. Appl. Energy 2016, 179, 350–377. [Google Scholar] [CrossRef]
- Poullikkas, A. A comparative overview of large-scale battery systems for electricity storage. Renew. Sustain. Energy Rev. 2013, 27, 778–788. [Google Scholar] [CrossRef]
- Chen, H.; Cong, T.N.; Yang, W.; Tan, C.; Li, Y.; Ding, Y. Progress in electrical energy storage system: A critical review. Prog. Nat. Sci. 2009, 19, 291–312. [Google Scholar] [CrossRef]
- Weber, A.Z.; Mench, M.M.; Meyers, J.P.; Ross, P.N.; Gostick, J.T.; Liu, Q. Redox flow batteries: A review. J. Appl. Electrochem. 2011, 41, 1137–1164. [Google Scholar] [CrossRef]
- Brekken, T.K.A.; Yokochi, A.; von Jouanne, A.; Yen, Z.Z.; Hapke, H.M.; Halamay, D.A. Optimal energy storage sizing and control for wind power applications. IEEE Trans. Sust. Energy 2010, 2, 69–77. [Google Scholar] [CrossRef]
- Shoenung, S.M. Characteristics and Technologies for Long- vs. Short-Term Energy Storage: A Study by the DOE Energy Storage Systems Program; Technical report, SAND2001-0765; Sandia National Laboratories, United States Department of Energy: Albuquerque, NM, USA, 2001.
- Arai, J.; Iba, K.; Funabashi, T.; Nakanishi, Y.; Koyanagi, K.; Yokoyama, R. Power electronics and its applications to renewable energy in Japan. IEEE Circ. Syst. Mag. 2008, 8, 52–66. [Google Scholar] [CrossRef]
- Tong, W. Wind Power Generation and Wind Turbine Design; WIT Press: Billerica, MA, USA, 2010; pp. 678–682. [Google Scholar]
- Cho, J.; Jeong, S.; Kim, Y. Commercial and research battery technologies for electrical energy storage applications. Progress Energy Combust. Sci. 2015, 48, 84–101. [Google Scholar] [CrossRef]
- Linden, D.; Reddy, T.B. Handbook of Batteries, 3rd ed.; McGraw-Hill: New York, NY, USA, 2002. [Google Scholar]
- Kinoshita, K. Electrochemical Oxygen Technology; Wiley: New York, NY, USA, 1992. [Google Scholar]
- Kowalczk, I.; Read, J.; Salomon, M. Li-air batteries: A classic example of limitations owing to solubilities. Pure Appl. Chem. 2007, 79, 851–860. [Google Scholar] [CrossRef]
- McCloskey, B.D.; Bethune, D.S.; Shelby, R.M.; Girishkumar, G.; Luntz, A.C. Solvents’ critical role in nonaqueous lithium-oxygen battery electrochemistry. J. Phys. Chem. Lett. 2011, 2, 1161–1166. [Google Scholar] [CrossRef] [PubMed]
- Chakkaravarthy, C.; Waheed, A.K.A.; Udupa, H.V.K. Zinc-air alkaline batteries—A review. J. Power Sources 1981, 6, 203–228. [Google Scholar] [CrossRef]
- Lee, C.W.; Sathiyanarayanan, K.; Eom, S.W.; Kim, H.S.; Yun, M.S. Novel electrochemical behavior of zinc anodes in zinc/air batteries in the presence of additives. J. Power Sources 2006, 159, 1474–1477. [Google Scholar] [CrossRef]
- Goldstein, J.; Brown, I.; Koretz, B. New developments in the Electric Fuel Ltd. zinc/air system. J. Power Sources 1999, 80, 171–179. [Google Scholar] [CrossRef]
- Sapkota, P.; Kim, H. Zinc-air fuel cell, a potential candidate for alternative energy. J. Ind. Eng. Chem. 2009, 15, 445–450. [Google Scholar] [CrossRef]
- Drillet, J.-F.; Adam, M.; Barg, S.; Herter, A.; Koch, D.; Schmidt, V.; Wilhelm, M. Development of a novel Zinc/air fuel cell with a Zn foam anode, a PVA/KOH membrane and a MnO2/SiOC-based air cathode. ECS Trans. 2010, 28, 13–24. [Google Scholar] [CrossRef]
- Available online: www.beyonder.no/technology (accessed on 27 April 2022).
- Sabihuddin, S.; Kiprakis, A.E.; Mueller, M. A numerical and graphical review of energy storage technologies. Energies 2015, 8, 172–216. [Google Scholar] [CrossRef]
- KOKAM Li-ion/Polymer Cell. Available online: https://www.west-l.com/uploads/tdpdf/sf_kokam_cell_brochure_v.1.pdf (accessed on 12 July 2023).
- Lithium Battery Technologies. Available online: https://www.epectec.com/batteries/lithium-battery-technologies.html (accessed on 12 July 2023).
- Preger, Y.; Barkholtz, H.M.; Fresquez, A.; Campbell, D.L.; Juba, B.W.; Romàn-Kustas, J.; Ferreira, S.R.; Chalamala, B. Degradation of commercial lithium-ion cells as a function of chemistry and cycling conditions. J. Electrochem. Soc. 2020, 167, 120532. [Google Scholar] [CrossRef]
- All about Batteries, Part 12: Lithium Titanate (LTO). Available online: https://www.eetimes.com/all-about-batteries-part-12-lithium-titanate-lto/ (accessed on 27 April 2022).
- Bragard, M.; Soltau, N.; Thomas, S.; De Doncker, R.W. The balance of renewable sources and user demands in grids: Power electronics for modular battery energy storage systems. IEEE Trans. Power Electron. 2010, 25, 3049–3056. [Google Scholar] [CrossRef]
- Revankar, S.T. Chapter Six—Chemical energy storage. In Storage and Hybridization of Nuclear Energy; Academic Press: Cambridge, MA, USA, 2019; pp. 177–227. [Google Scholar] [CrossRef]
- Fetcenko, M.; Koch, J.; Zelinsky, M. Nickel–metal hydride and nickel–zinc batteries for hybrid electric vehicles and battery electric vehicles. In Advances in Battery Technologies for Electric Vehicles; Woodhead Publishing: Sawston, UK, 2015; pp. 103–126. [Google Scholar]
- Gallo, A.B.; Simões-Moreira, J.R.; Costa, H.K.M.; Santos, M.M.; Moutinho dos Santos, E. Energy storage in the energy transition context: A technology review. Renew. Sustain. Energy Rev. 2016, 65, 800–822. [Google Scholar] [CrossRef]
- Nickel Metal Hydride Batteries. Available online: https://www.mpoweruk.com/nimh.htm (accessed on 12 July 2023).
- Li, P. Energy storage is the core of renewable technologies. IEEE Nanotechnol. Mag. 2008, 2, 13–18. [Google Scholar] [CrossRef]
- Beaudin, M.; Zareipour, H.; Schellenberglabe, A.; Rosehart, W. Energy storage for mitigating the variability of renewable electricity sources: An updated review. Energy Sustain. Dev. 2010, 14, 302–314. [Google Scholar] [CrossRef]
- Kang, H.; Jung, S.; Lee, M.; Hong, T. How to better share energy towards a carbon-neutral city? A review on application strategies of battery energy storage system in city. Renew. Sustain. Energy Rev. 2022, 157, 112113. [Google Scholar] [CrossRef]
- Chaudhary, G.; Lamb, J.J.; Burheim, O.S.; Austbø, B. Review of Energy Storage and Energy Management System Control Strategies in Microgrids. Energies 2021, 14, 4929. [Google Scholar] [CrossRef]
- Lai, C.S.; Jia, Y.; Lai, L.L.; Xu, Z.; McCulloch, M.D.; Wong, K.P. A comprehensive review on large-scale photovoltaic system with applications of electrical energy storage. Renew. Sustain. Energy Rev. 2017, 78, 439–451. [Google Scholar] [CrossRef]
- Grid-Scale Storage. Available online: https://www.iea.org/reports/grid-scale-storage (accessed on 6 July 2023).
- Energy Storage. Available online: https://www.iea.org/reports/energy-storage (accessed on 2 May 2022).
- Vistra Completes Expansion of Battery Energy Storage System at Its Flagship California Facility. Available online: https://investor.vistracorp.com/2021-08-19-Vistra-Completes-Expansion-of-Battery-Energy-Storage-System-at-its-Flagship-California-Facility (accessed on 12 July 2023).
- PG&E Commissions 182.5MW Elkhorn Battery Project in California, US. Available online: https://www.nsenergybusiness.com/news/pge-commissions-182-5mw-elkhorn-battery-project-in-california-us/ (accessed on 12 July 2023).
- World-First Offshore Battery. Available online: https://www.woodside.com.au/media-centre/news-stories/story/world-first-offshore-battery (accessed on 12 July 2023).
- Shamim, N.; Subburaj, A.S.; Bayne, S.B. Renewable energy based grid connected battery projects around the world—An overview. J. Energy Power Eng. 2019, 13, 27. [Google Scholar]
- BYD Utility Scale ESS Brochure. Available online: https://en.byd.com/wp-content/uploads/2017/06/byd-utility-scale-ess-brochure-v20160520.pdf (accessed on 12 July 2023).
- Electric Energy Storage. Available online: https://studylib.net/doc/18355264/electric-energy-storage (accessed on 12 July 2023).
- Willenhall: 2MW Battery Energy Storage Demonstrator. Available online: https://www.sheffield.ac.uk/creesa/facilities/willenhall (accessed on 12 July 2023).
- Mukai, D.; Kobayashi, K.; Kurahashi, T.; Matsueda, N.; Hashizaki, K.; Kogure, M. Development of large high-performance lithium-ion batteries for power storage and industrial use. Mitsubishi Heavy Ind. Tech. Rev. 2012, 49, 6–11. [Google Scholar]
- Faisal, M.; Hannan, M.A.; Ker, P.J.; Hussain, A.; Mansor, M.B.; Blaabjerg, F. Review of energy storage system technologies in microgrid applications: Issues and challenges. IEEE Access 2018, 6, 35143–35164. [Google Scholar] [CrossRef]
- DOE ESHB Chapter 4: Sodium-Based Battery Technologies. Available online: https://www.sandia.gov/ess-ssl/wp-content/uploads/2021/02/ESHB_Ch4_Sodium_Spoerke.pdf (accessed on 12 July 2023).
- Brochure NAS Batteries—BASF. Available online: https://www.basf.com/global/de/documents/about-us/Companies/new-business-gmbh/publications/e-power-management/BASF_NAS-Brochure_NGK.pdf (accessed on 12 July 2023).
- ADWEA—Sodium Sulphur Battery Energy Storage System, United Arab Emirates. Available online: https://www.power-technology.com/marketdata/adwea-sodium-sulphur-battery-energy-storage-system-united-arab-emirates/ (accessed on 12 July 2023).
- A Good Practice Guide on Electrical Energy Storage: Executive Summary. Available online: https://eatechnology.com/media/sashsbjd/a-good-practice-guide-on-electrical-energy-storage-executive-summary-issue.pdf (accessed on 12 July 2023).
- Energy Storage in Grids with High Penetration of Variable Generation. Available online: https://www.adb.org/sites/default/files/publication/225731/energy-storage-grids.pdf (accessed on 12 July 2023).
- Batteries and Energy Storage: Present and Technology Directions. Available online: https://www.osti.gov/servlets/purl/1575177 (accessed on 12 July 2023).
- Sumitomo Electric Brings 51MWh Flow Battery Online in Northern Japan. Available online: https://www.energy-storage.news/sumitomo-electric-brings-51mwh-flow-battery-online-in-northern-japan/ (accessed on 12 July 2023).
- Yano, K.; Hayashi, S.; Kumamoto, T.; Shibata, T.; Yamanishi, K.; Fujikawa, K. Development and demonstration of redox flow battery system. SEI Tech. Rev. 2017, 84, 22–28. [Google Scholar]
- Redflow Completes 2 MWh Installation in California. Available online: https://redflow.com/project/redflow-completes-2-mwh-installation-in-california (accessed on 12 July 2023).
- 120 kWh Redflow Zinc-Bromine Flow Battery Goes into Operation at Swansea University. Available online: https://www.solarpowerportal.co.uk/news/120kwh_redflow_zinc_bromine_flow_battery_goes_into_operation_at_swansea_uni (accessed on 12 July 2023).
- Battery Storage—IMIA. Available online: https://www.imia.com/wp-content/uploads/2020/01/IMIA-WGP-112-19-Battery-Storage.pdf (accessed on 1 May 2022).
- Electricity Storage and Renewables for Island Power. Available online: https://www.irena.org/-/media/Files/IRENA/Agency/Publication/2012/Electricity-Storage-and-RE-for-Island-Power.pdf (accessed on 12 July 2023).
- Energy Storage in the UK—An Overview. Available online: https://www.r-e-a.net/wp-content/uploads/2019/10/Energy-Storage-FINAL6.pdf (accessed on 12 July 2023).
- SUNNY CENTRAL UP Datasheet. Available online: https://files.sma.de/downloads/SC4xxxUP-DS-en-27.pdf (accessed on 12 July 2023).
- Structure of NAS Energy Storage System. Available online: https://www.ngk-insulators.com/en/product/nas-configurations.html (accessed on 12 July 2023).
- Sodium Nickel Technology for Energy Storage Application: FZSoNick Energy Spring 164 620 V 1.4 MWh 400 kW. Available online: https://drive.google.com/open?id=1pQBlscmjZxYn9GVHX0EHQcZZq0PyaJSO (accessed on 12 July 2023).
- Intensium® Max 20 High Energy: Very High Energy Lithium-ion Container 2.5 MWh. Available online: https://www.norwatt.es/classeur/produits/pdf/Intensium%E2%94%AC-Max-20-High-Energy_unlocked.pdf (accessed on 12 July 2023).
- 20-Foot Container—Dimensions, Measurements and Weight. Available online: https://www.icontainers.com/help/20-foot-container/ (accessed on 12 July 2023).
- Intensium® Max 20 High Energy (LFP). Available online: https://www.saftbatteries.com/products-solutions/products/intensium%C2%AE-max-20-high-energy-lfp (accessed on 12 July 2023).
- 1 MW 4 MWh Turner Energy Storage Project in Pullman, WA. Available online: https://commons.wikimedia.org/wiki/File:1_MW_4_MWh_Turner_Energy_Storage_Project_in_Pullman,_WA.jpg (accessed on 12 July 2023).
- ZBM3 Flow Battery. Available online: https://redflow.com/wp-content/uploads/2022/04/RDF0941-Redflow-ZBM3-FAWEB.pdf (accessed on 12 July 2023).
- Corvus BOB Datasheet. Available online: https://corvusenergy.com/wp-content/uploads/2021/01/Corvus-BOB-Datasheet.pdf (accessed on 12 July 2023).
- Govindarajan, U.; Ramachandaramurthy, V.K. Multiple Criteria Decision Making (MCDM) Based Economic Analysis of Solar PV System with Respect to Performance Investigation for Indian Market. Sustainability 2017, 9, 820. [Google Scholar] [CrossRef]
- How Much Does a Shipping Container Weigh? Available online: https://www.containeraddict.com/how-much-do-shipping-containers-weigh/#:~:text=10ft.,A%2010%20ft (accessed on 12 July 2023).
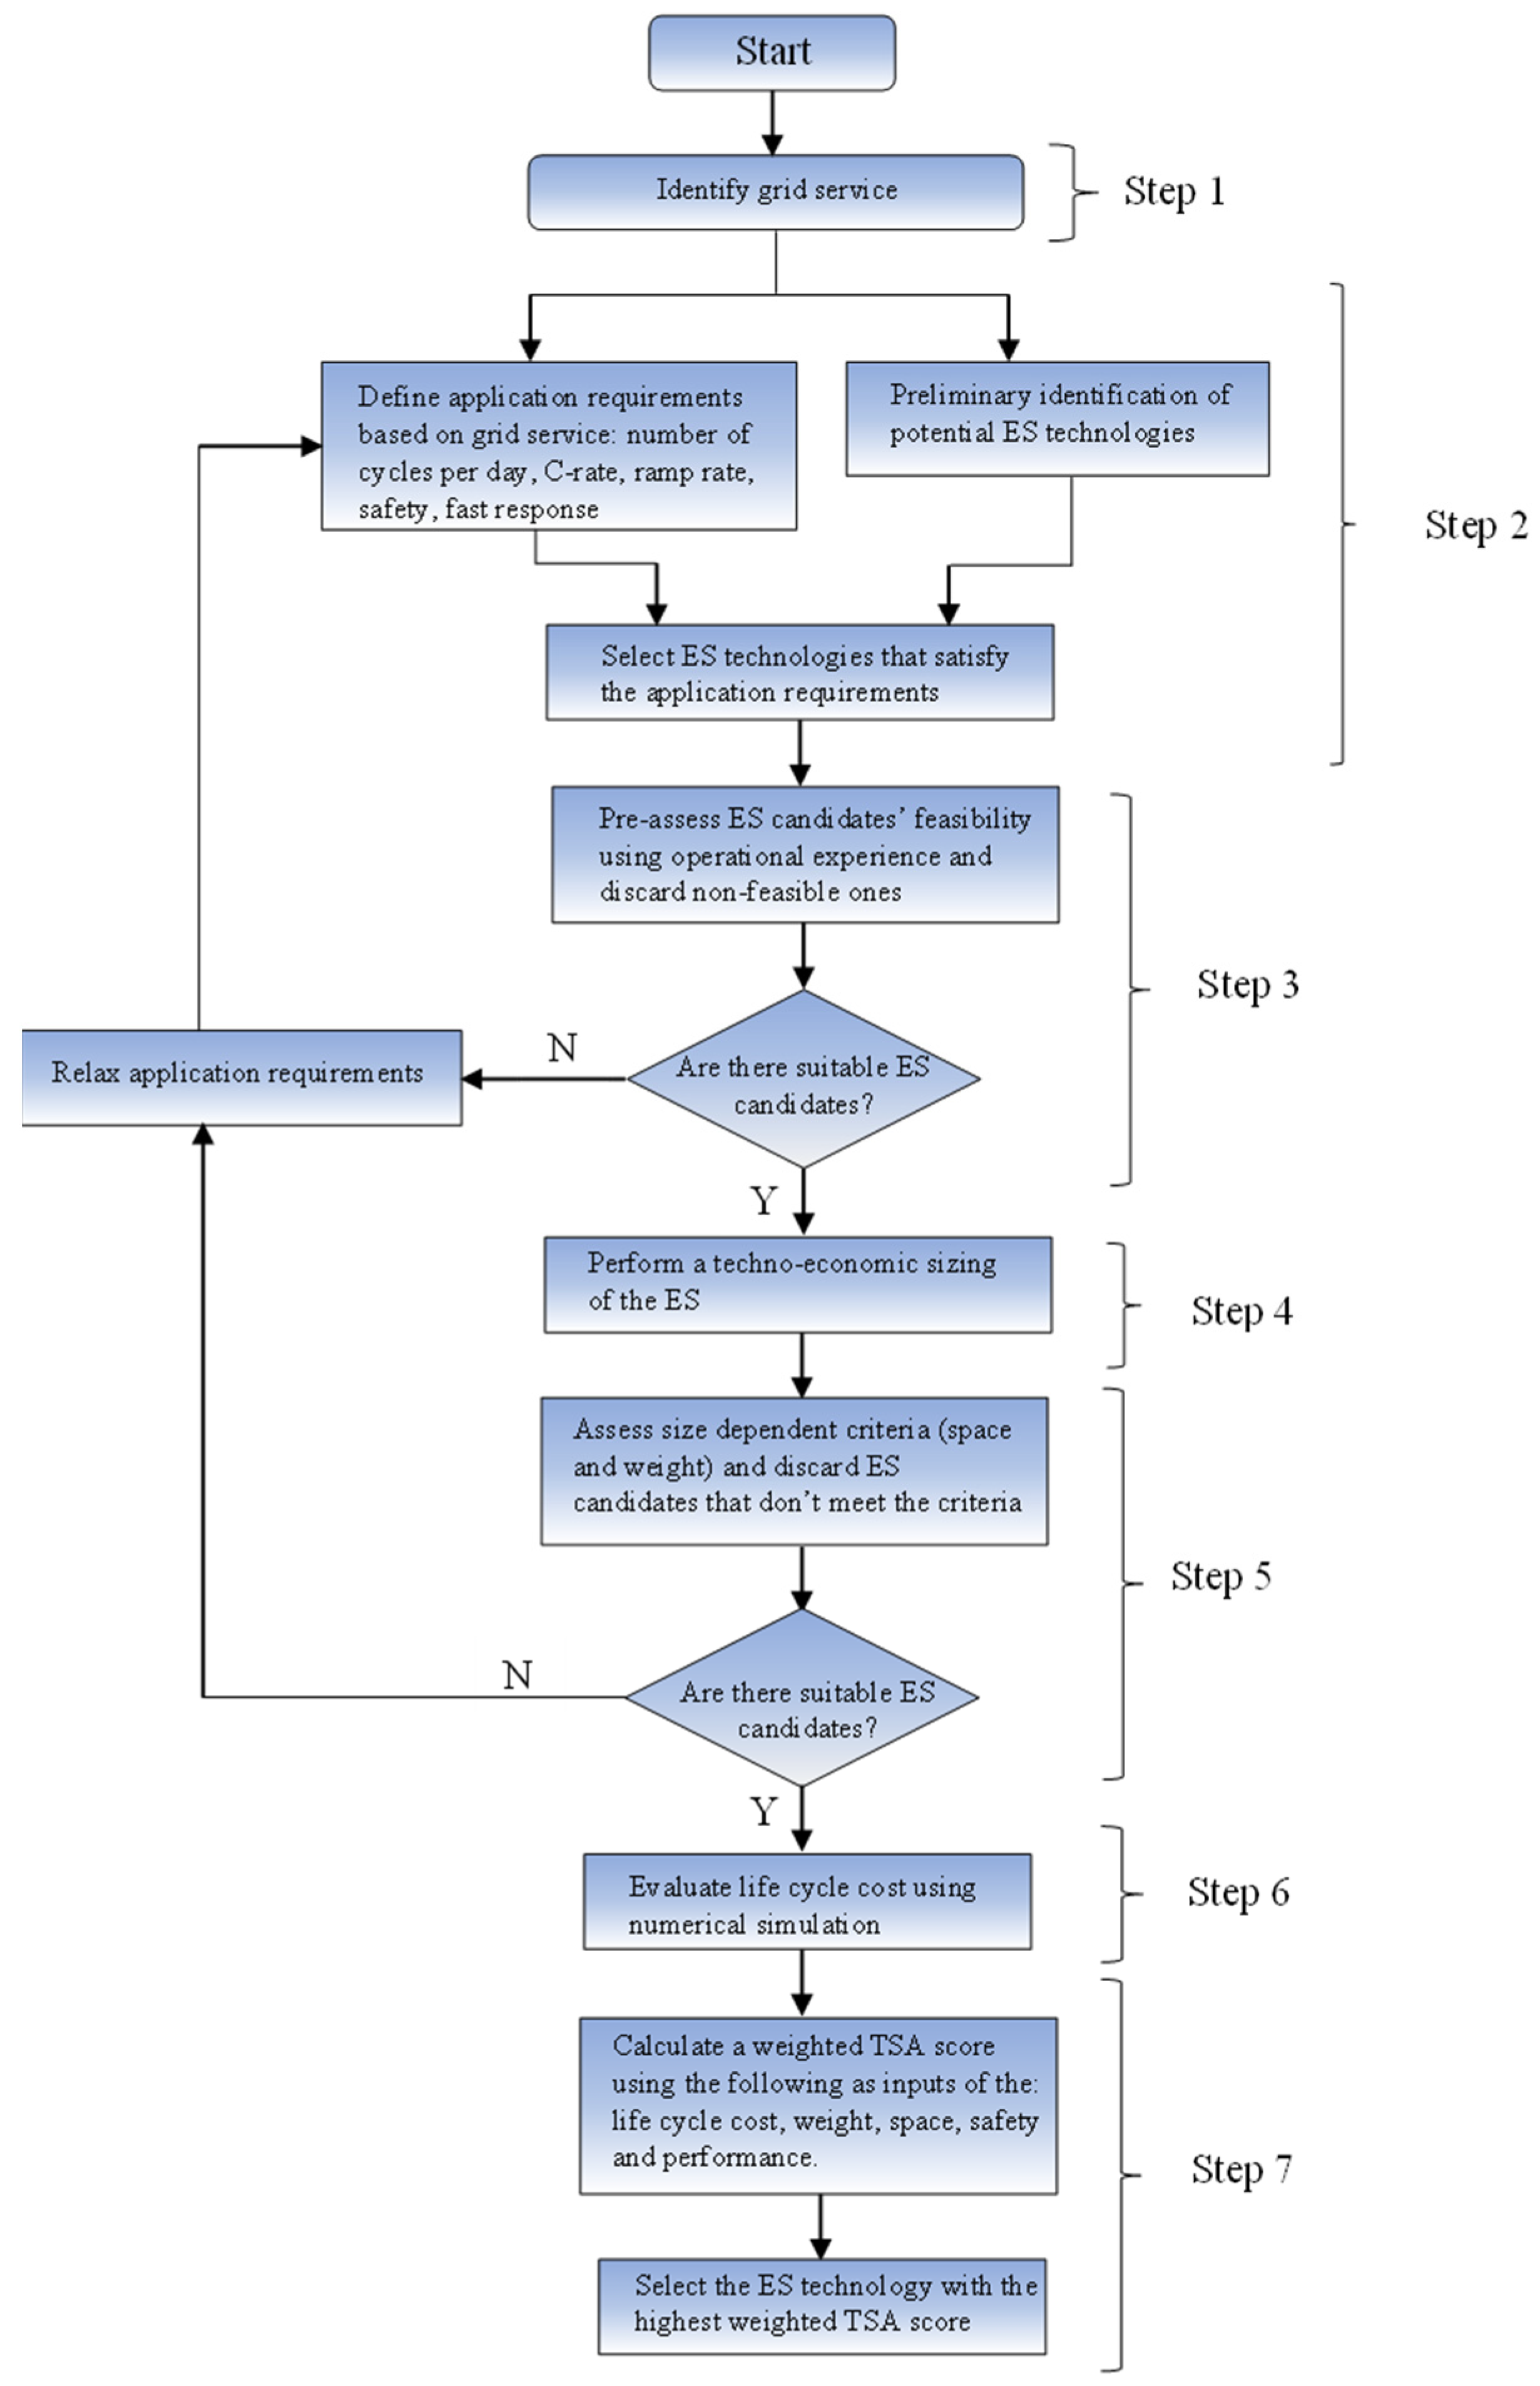
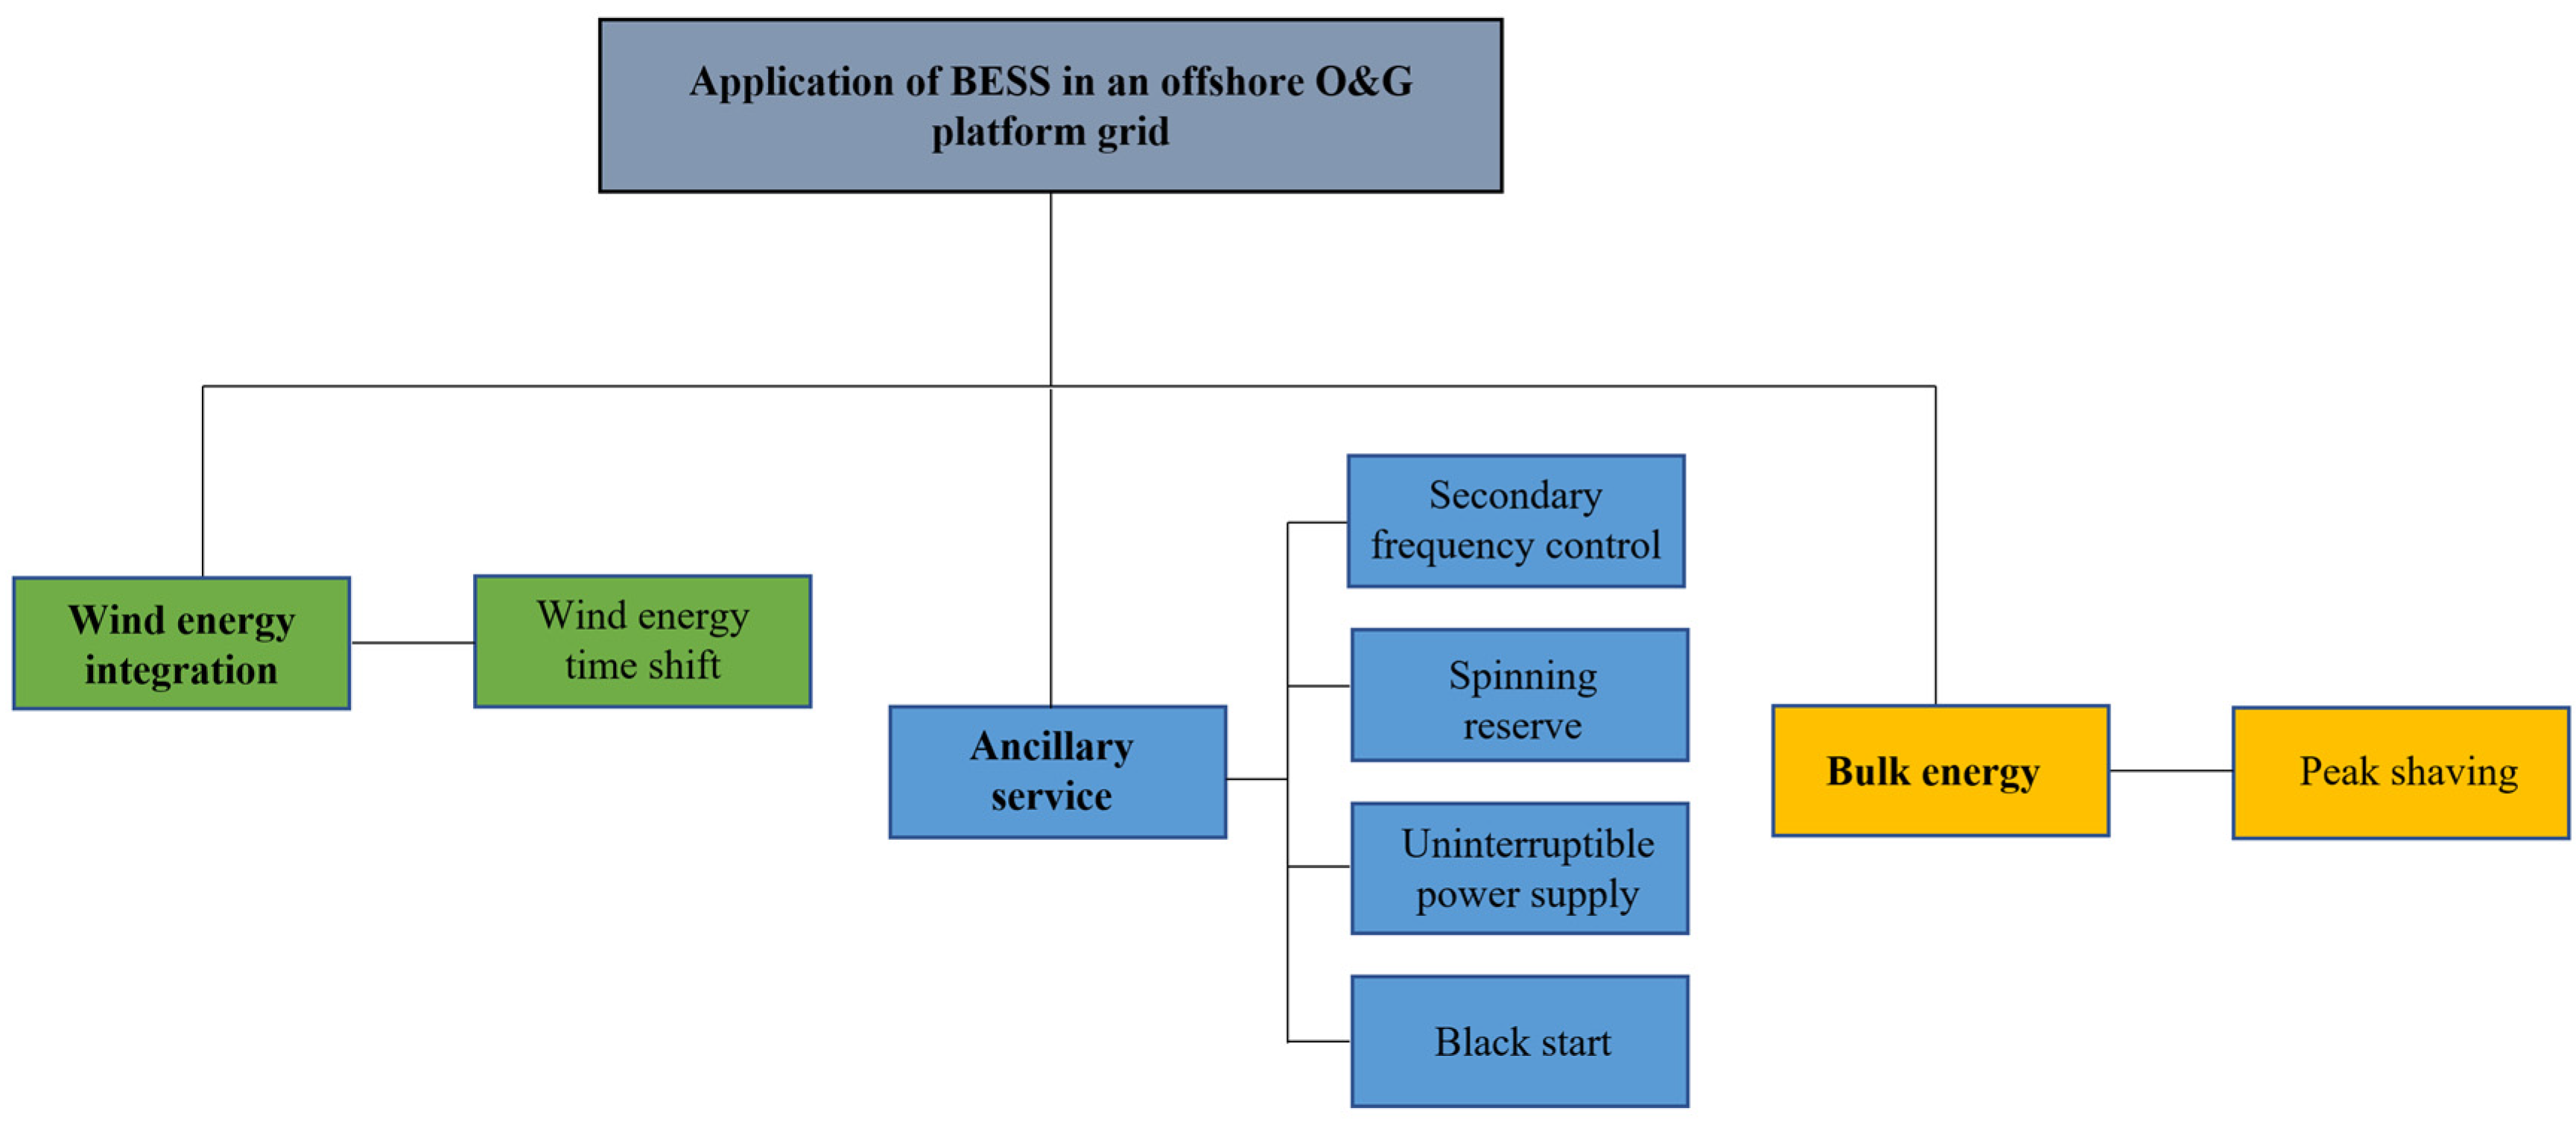

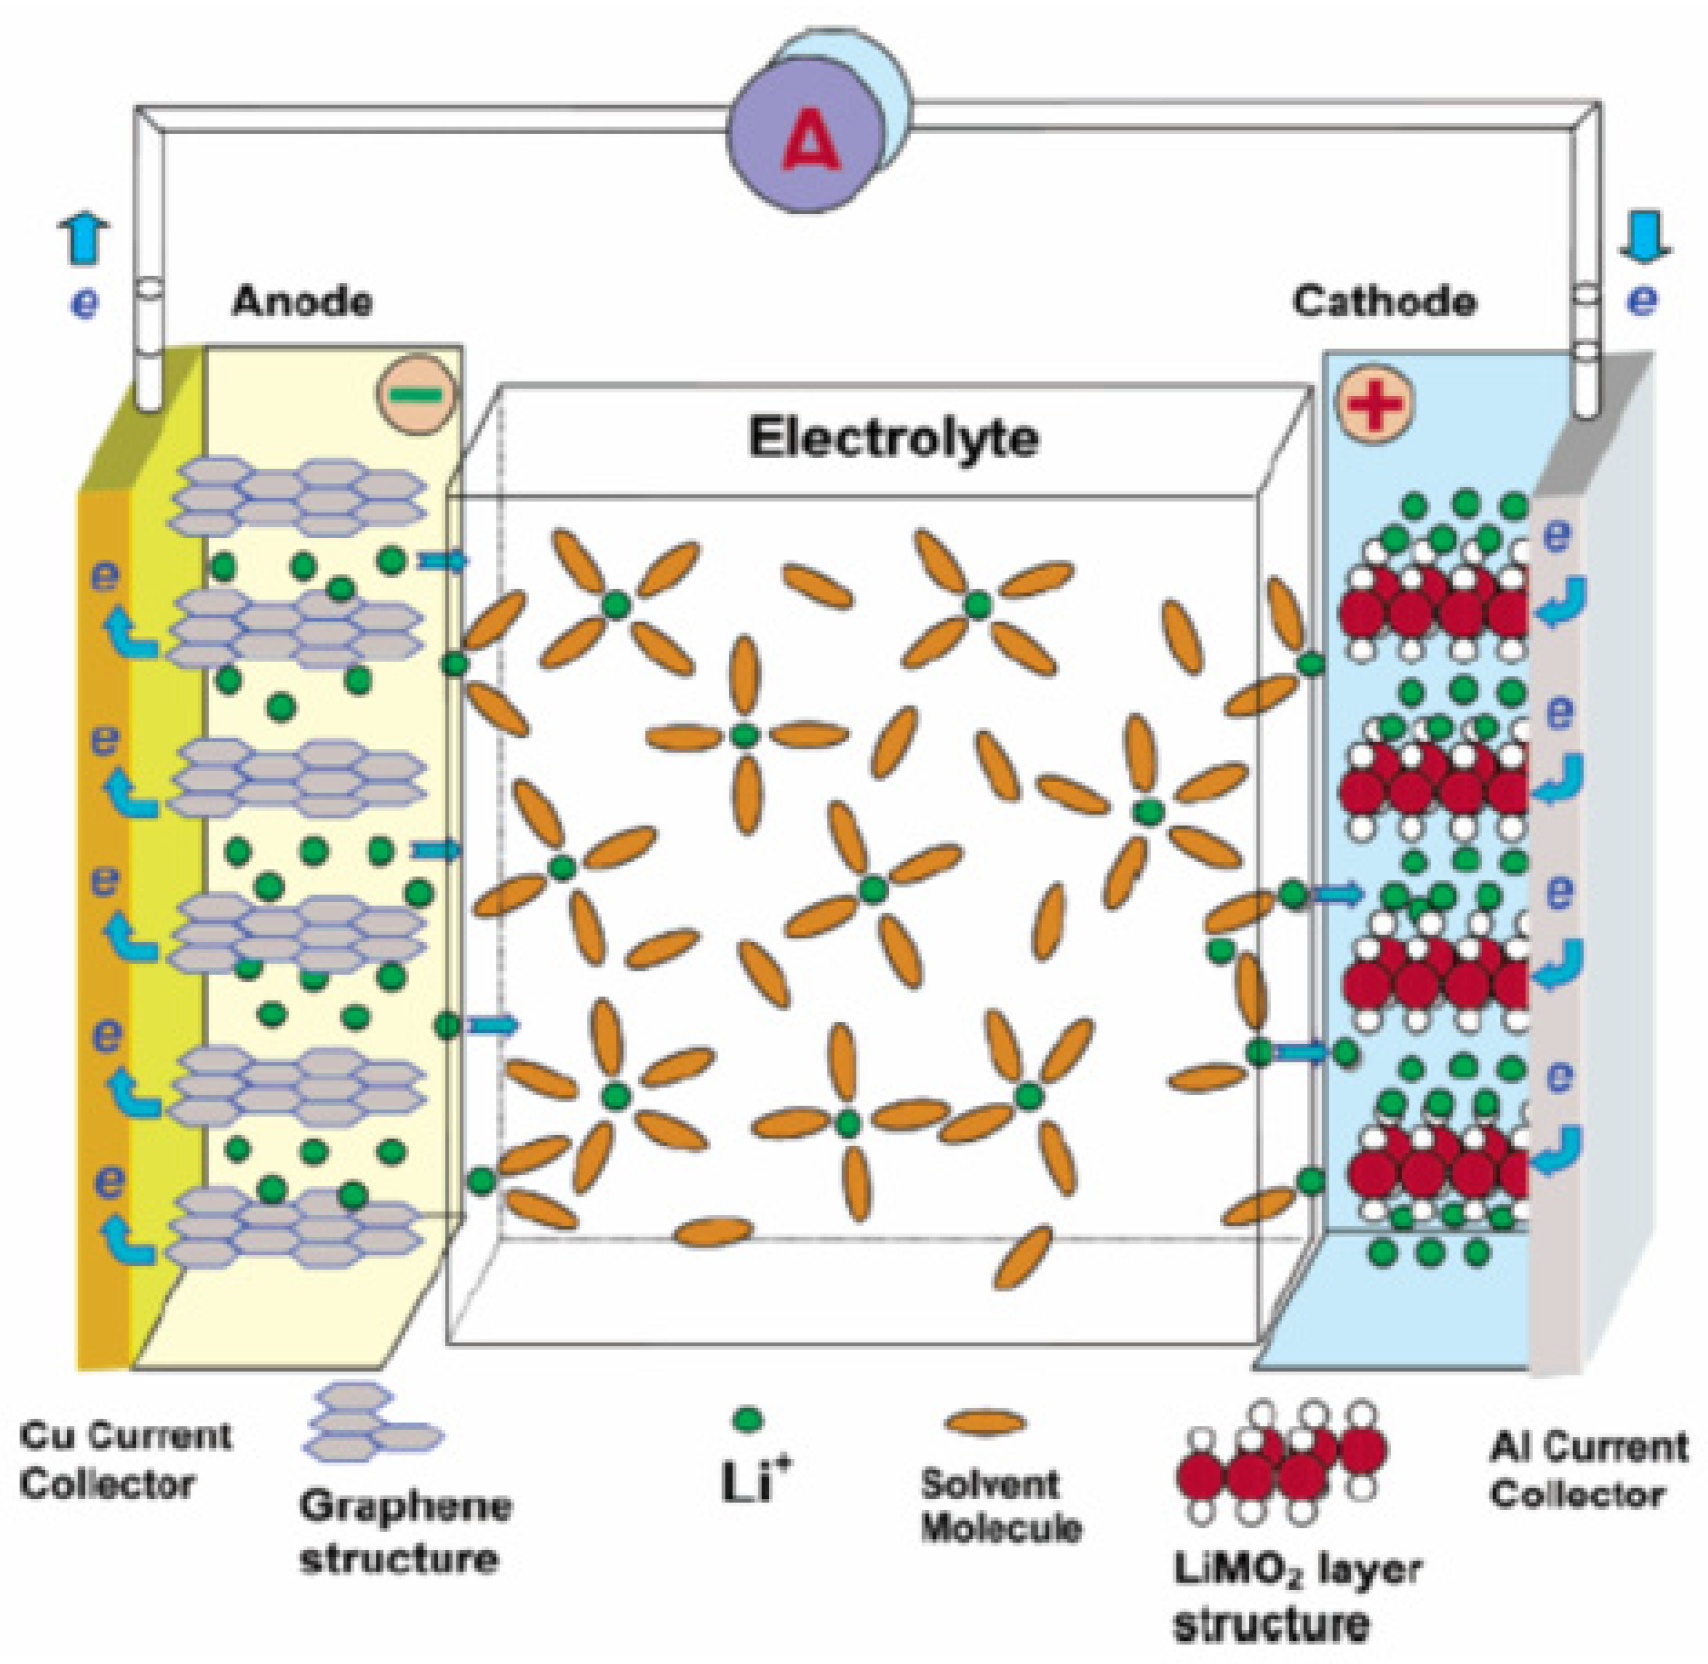
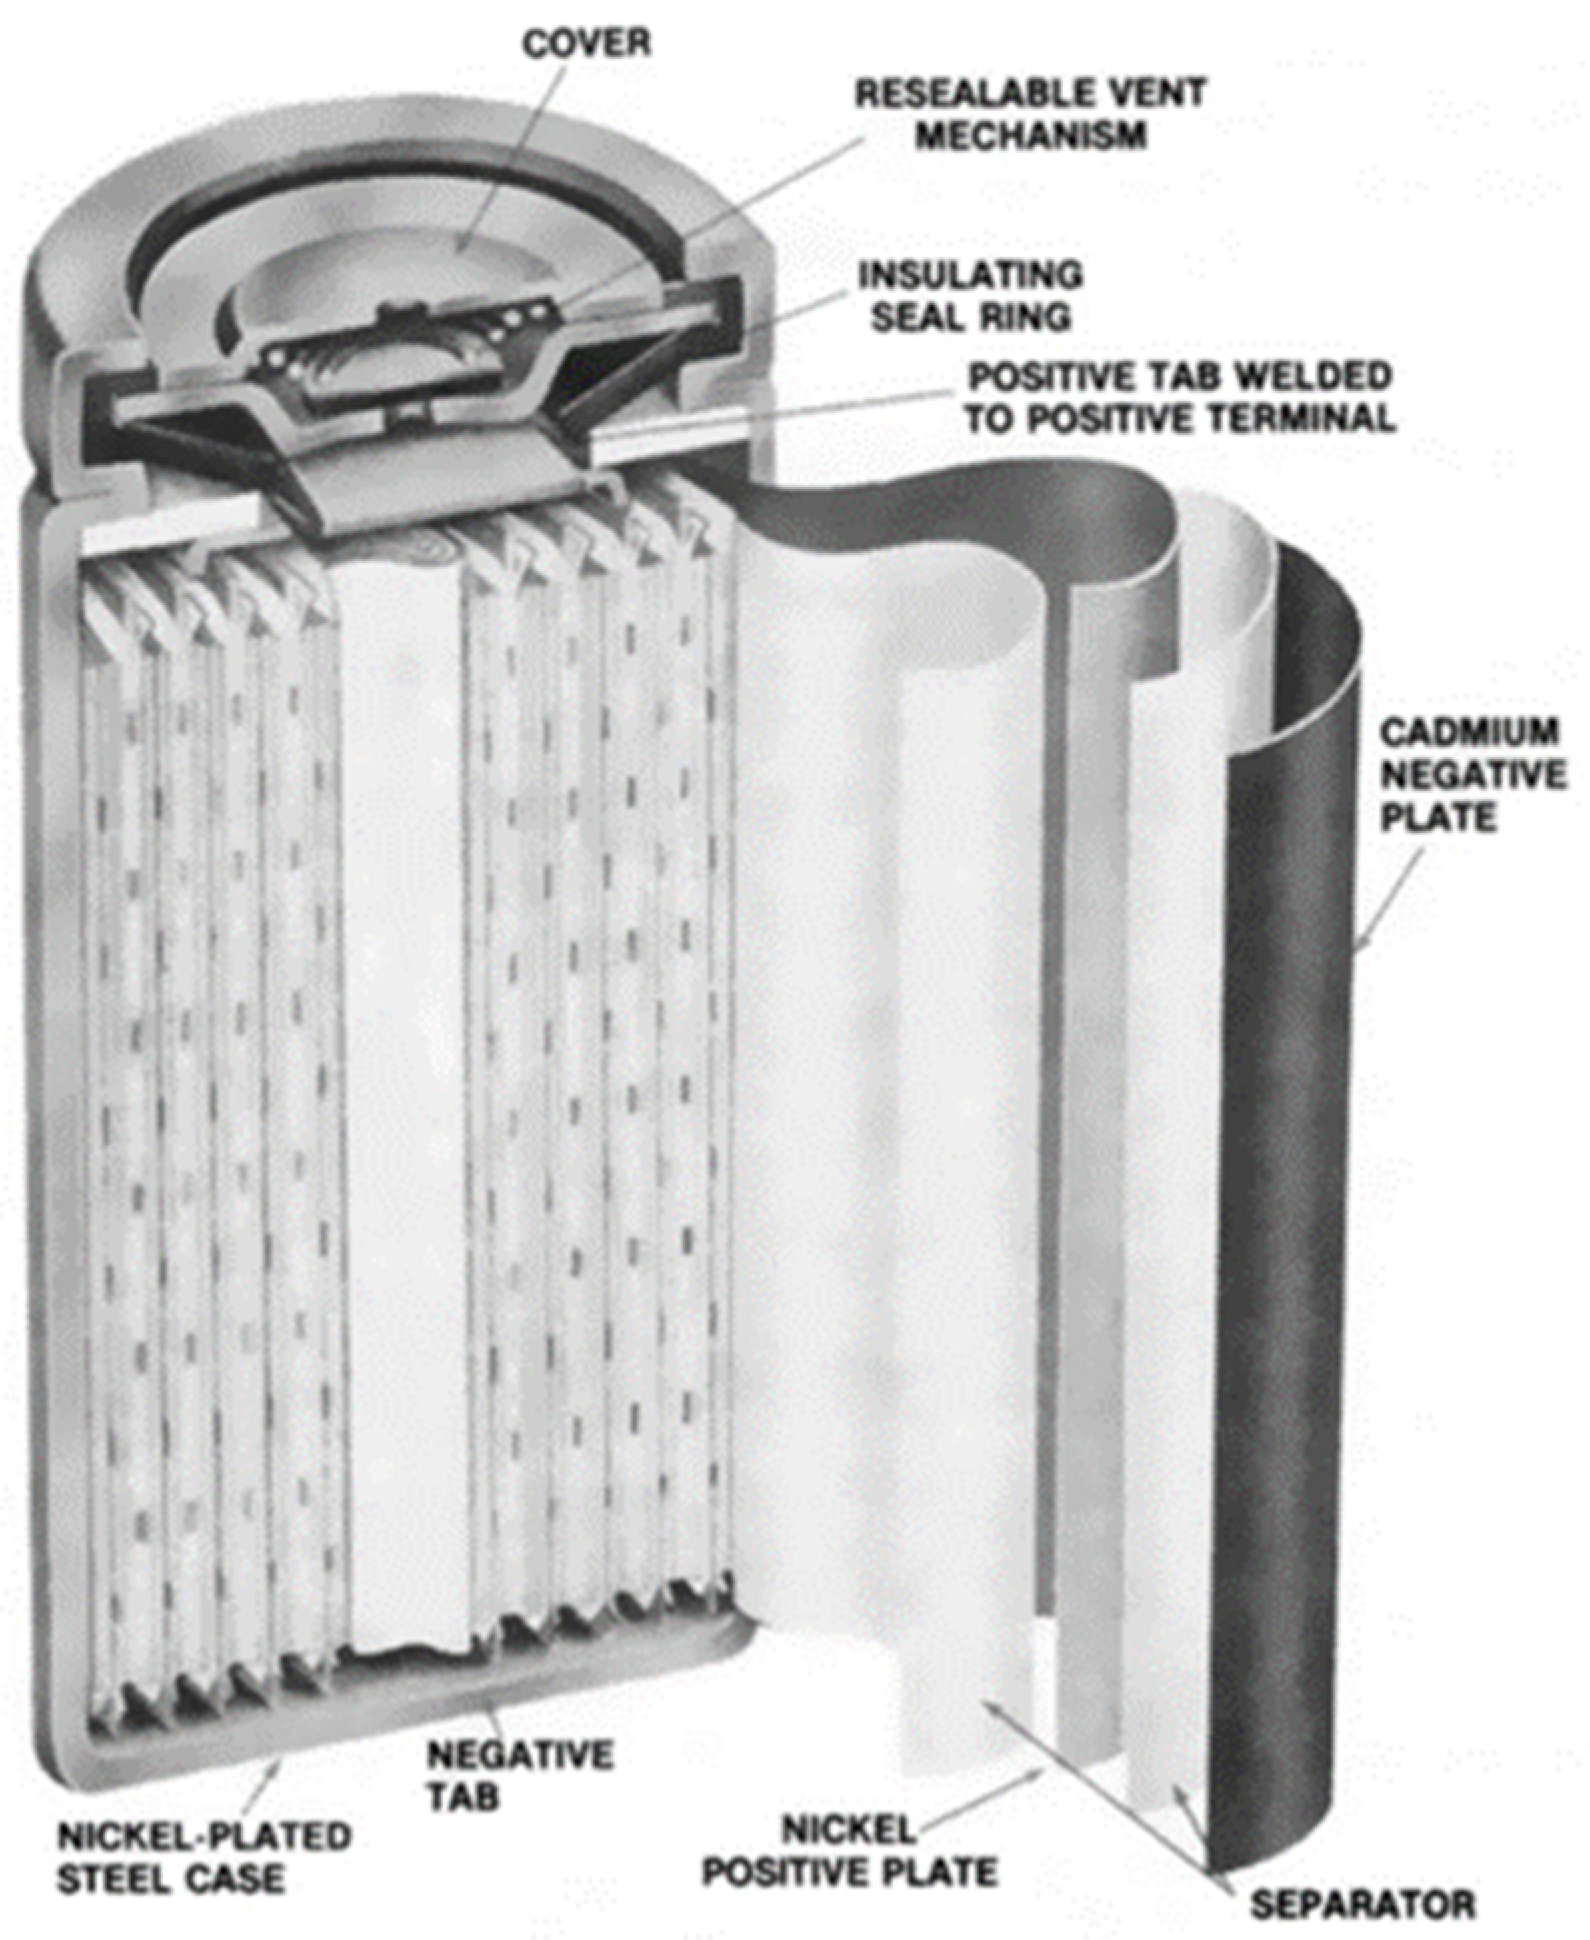
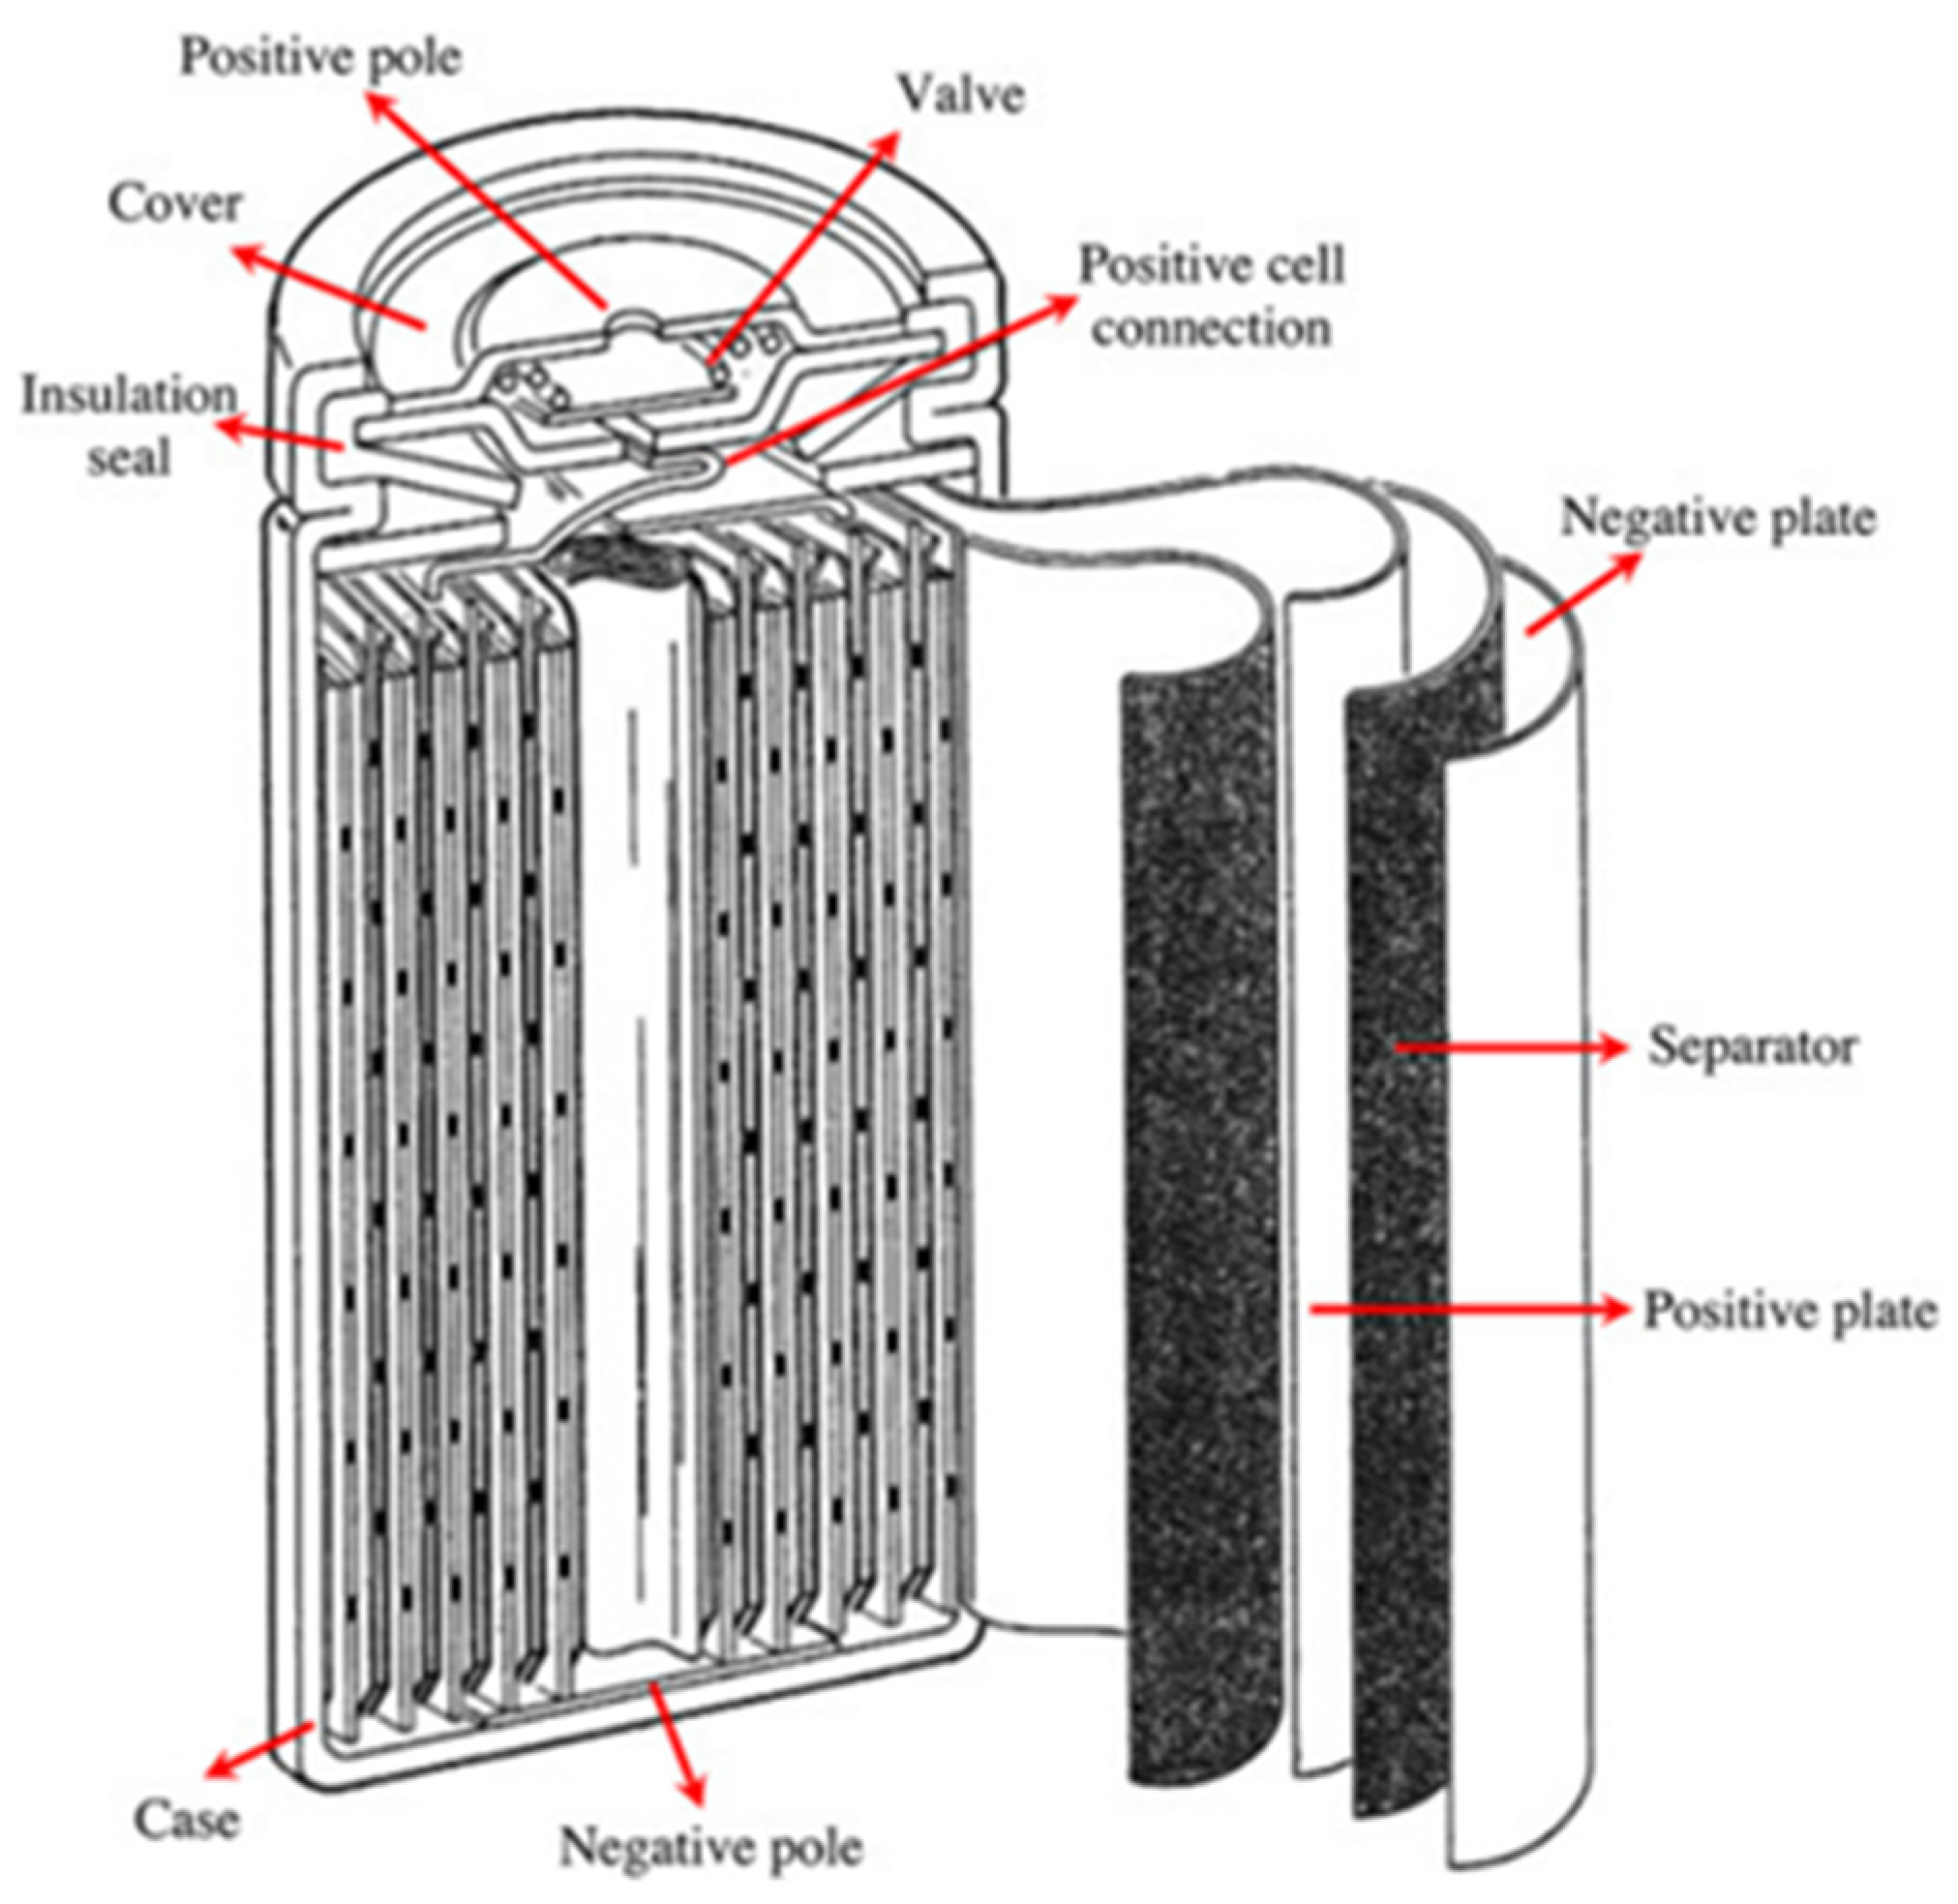
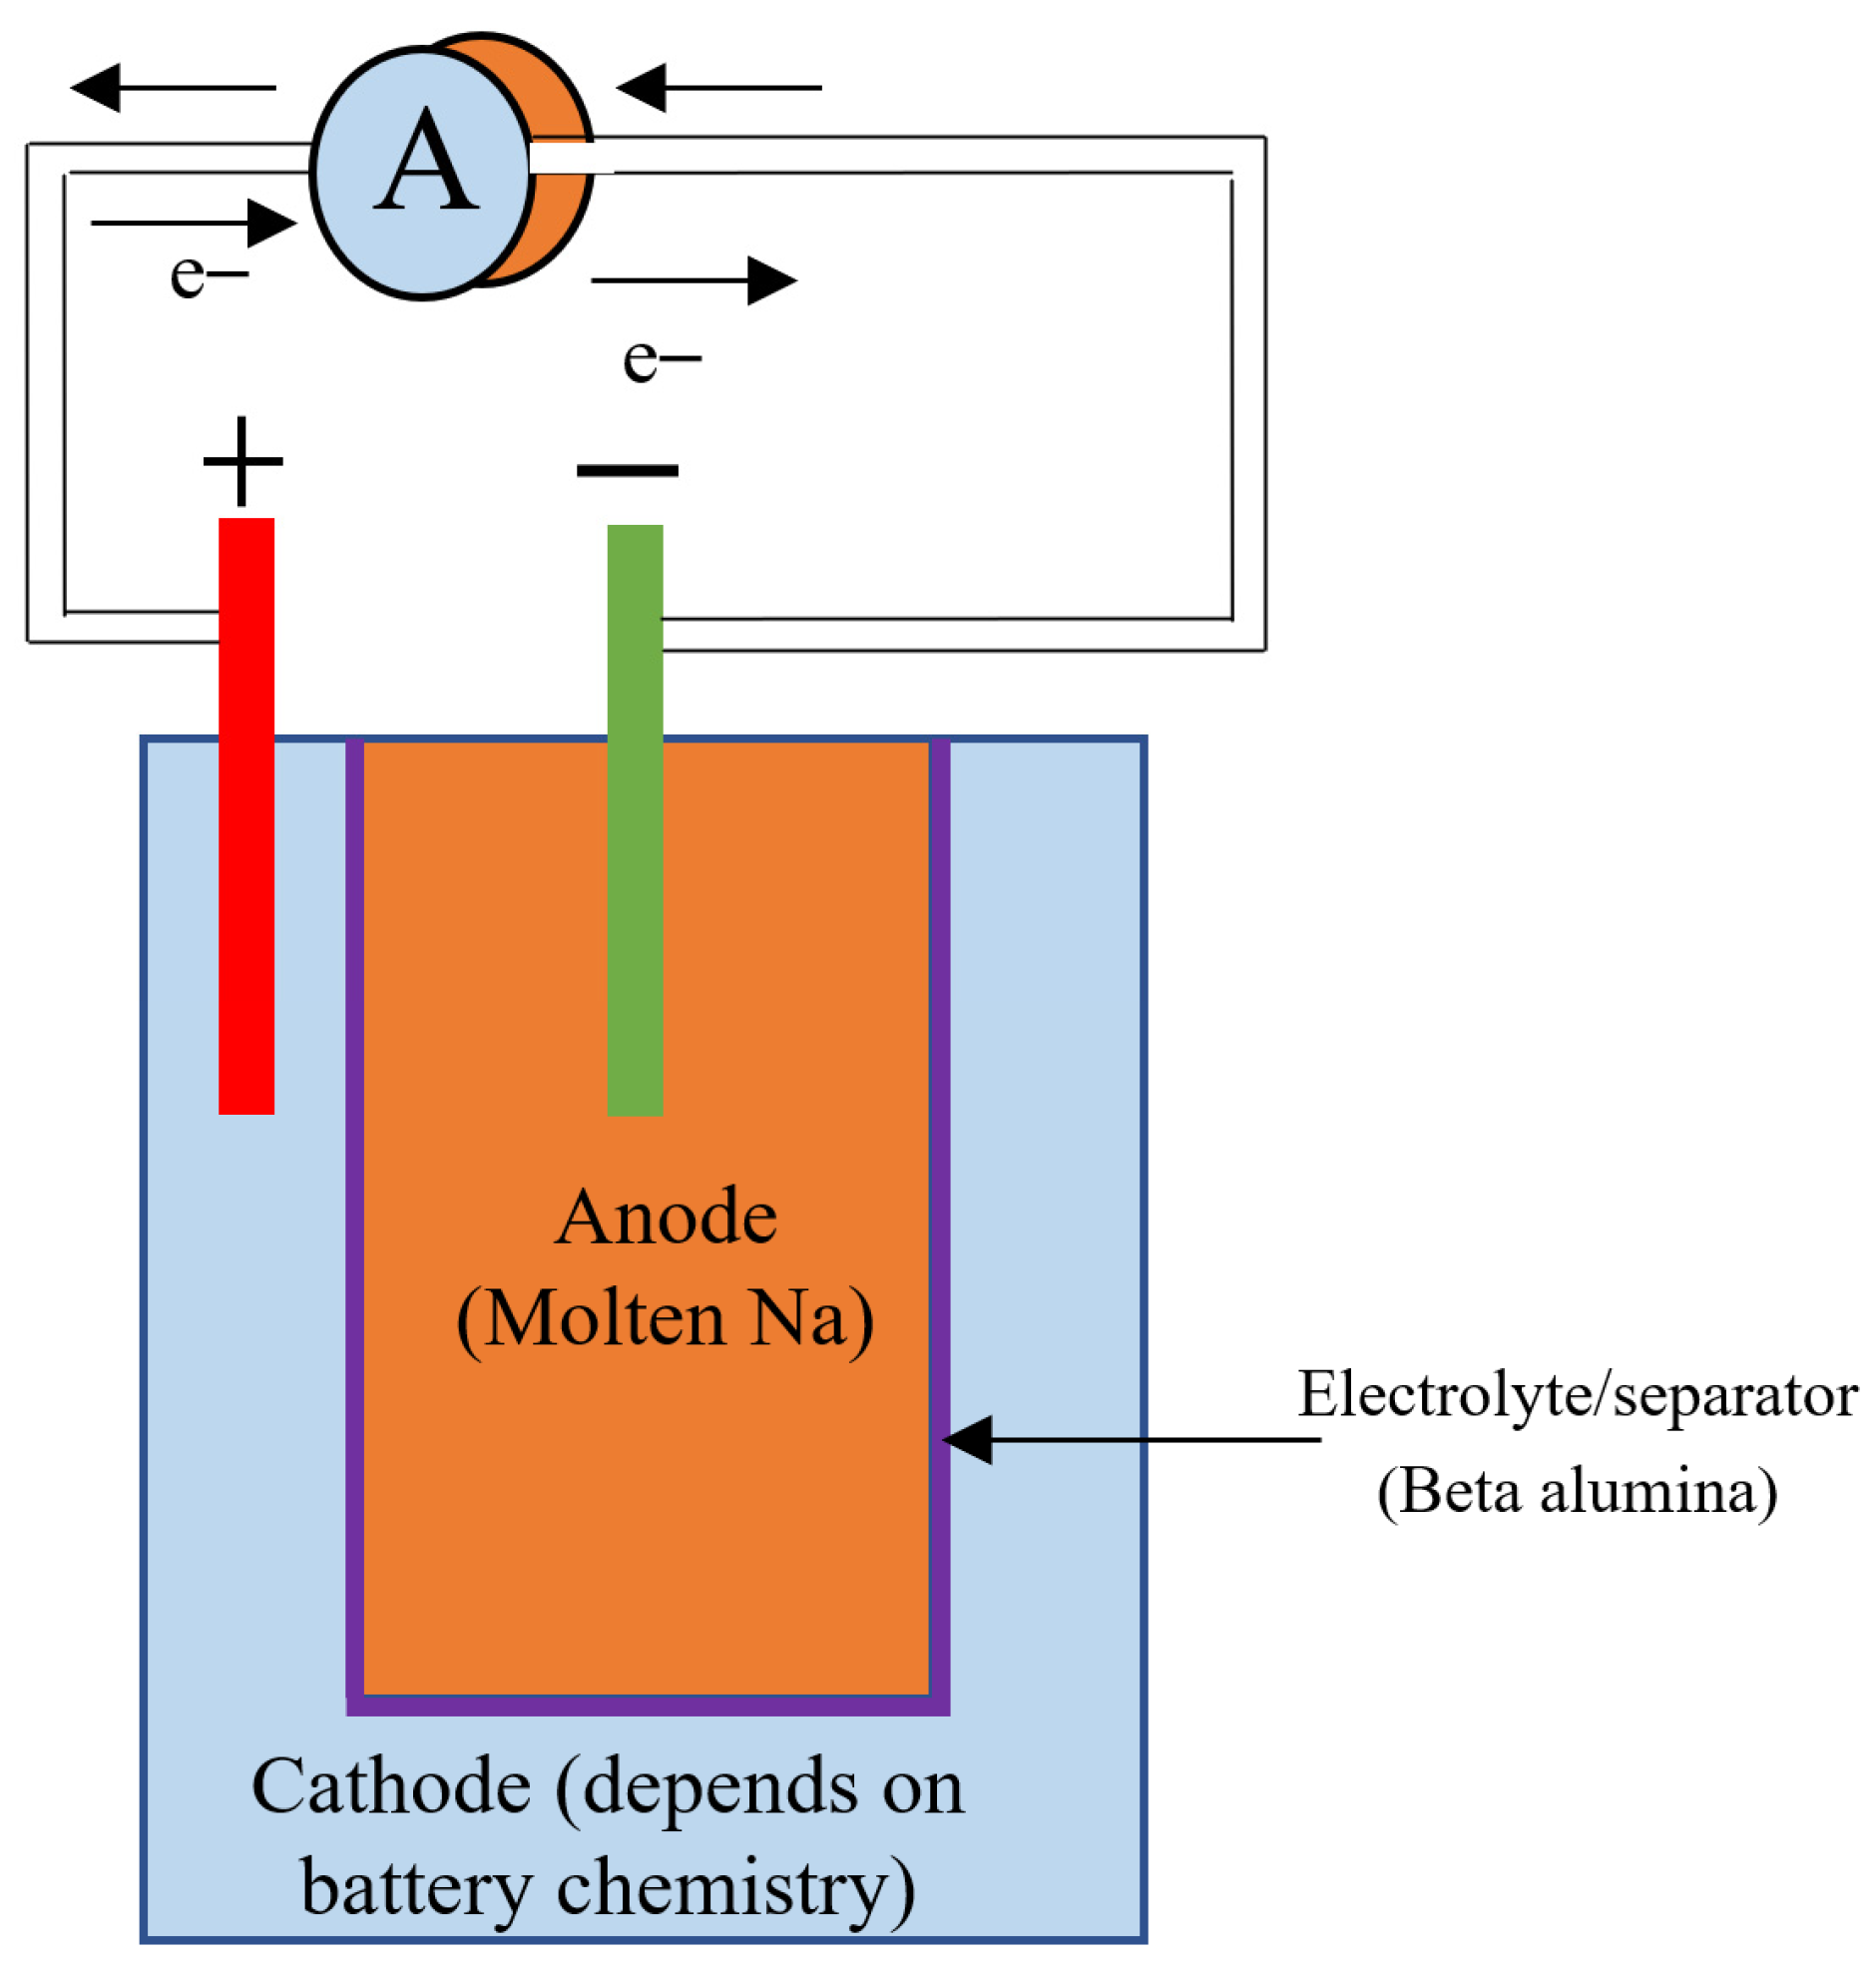
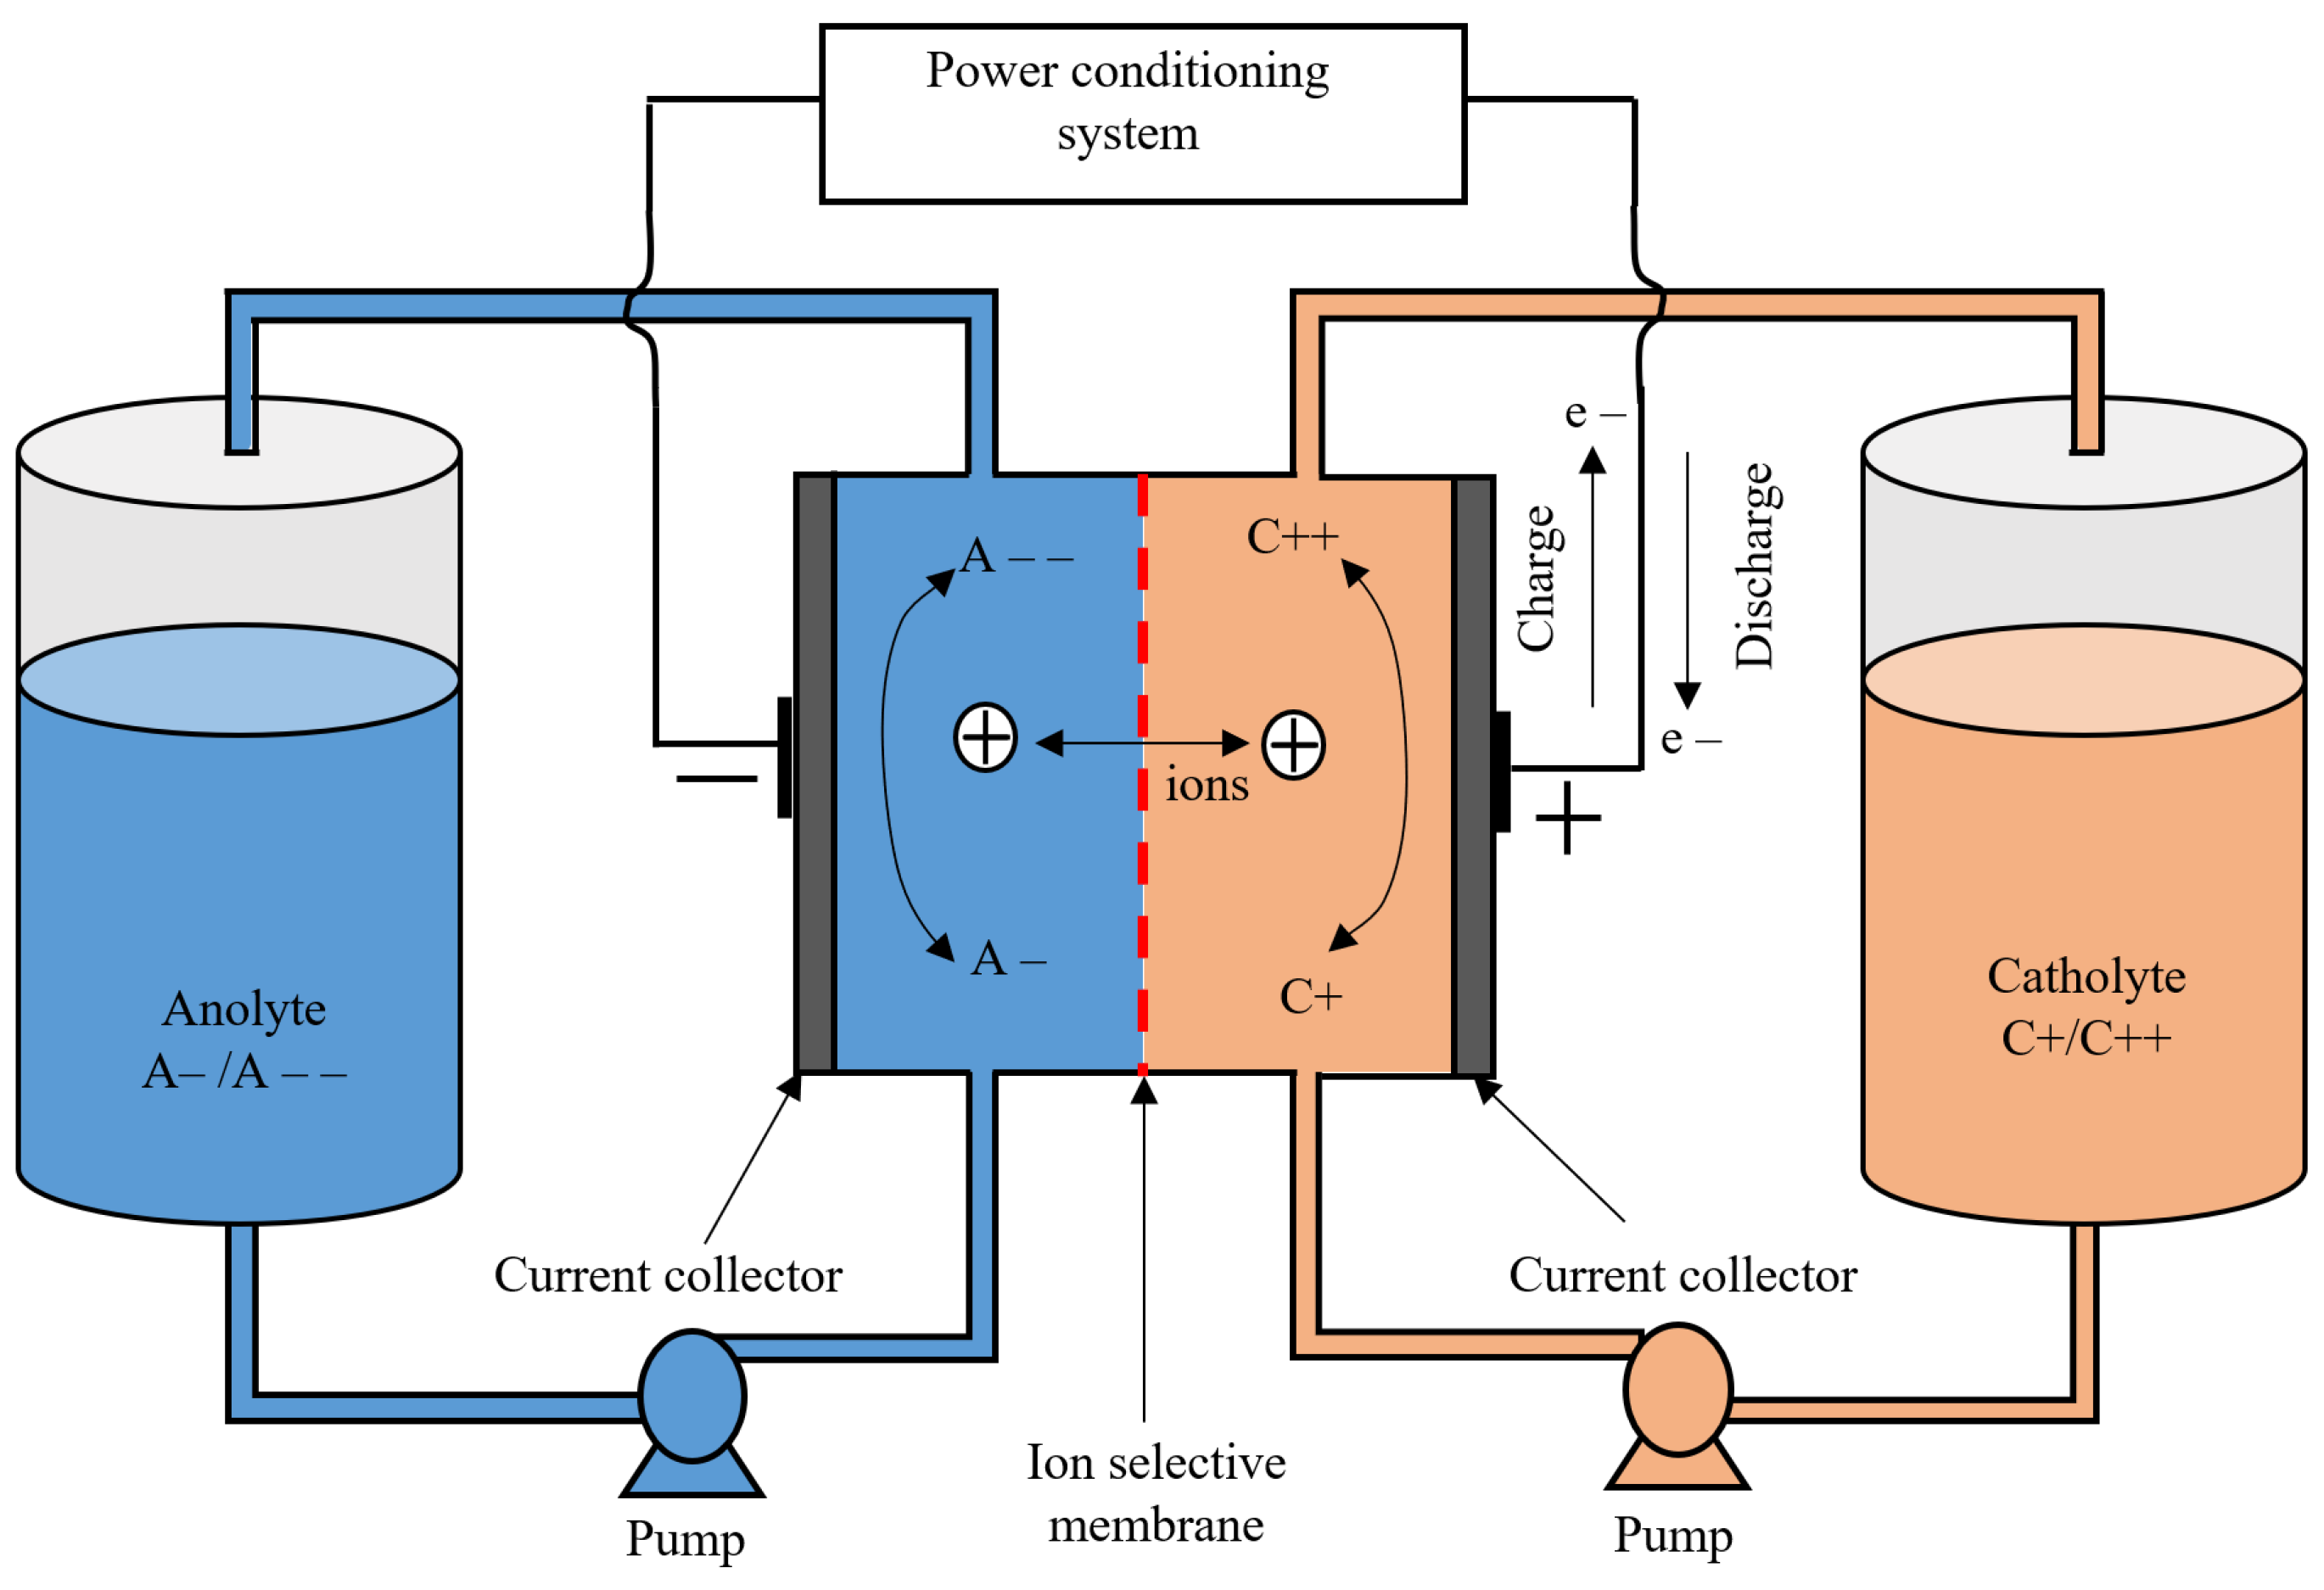
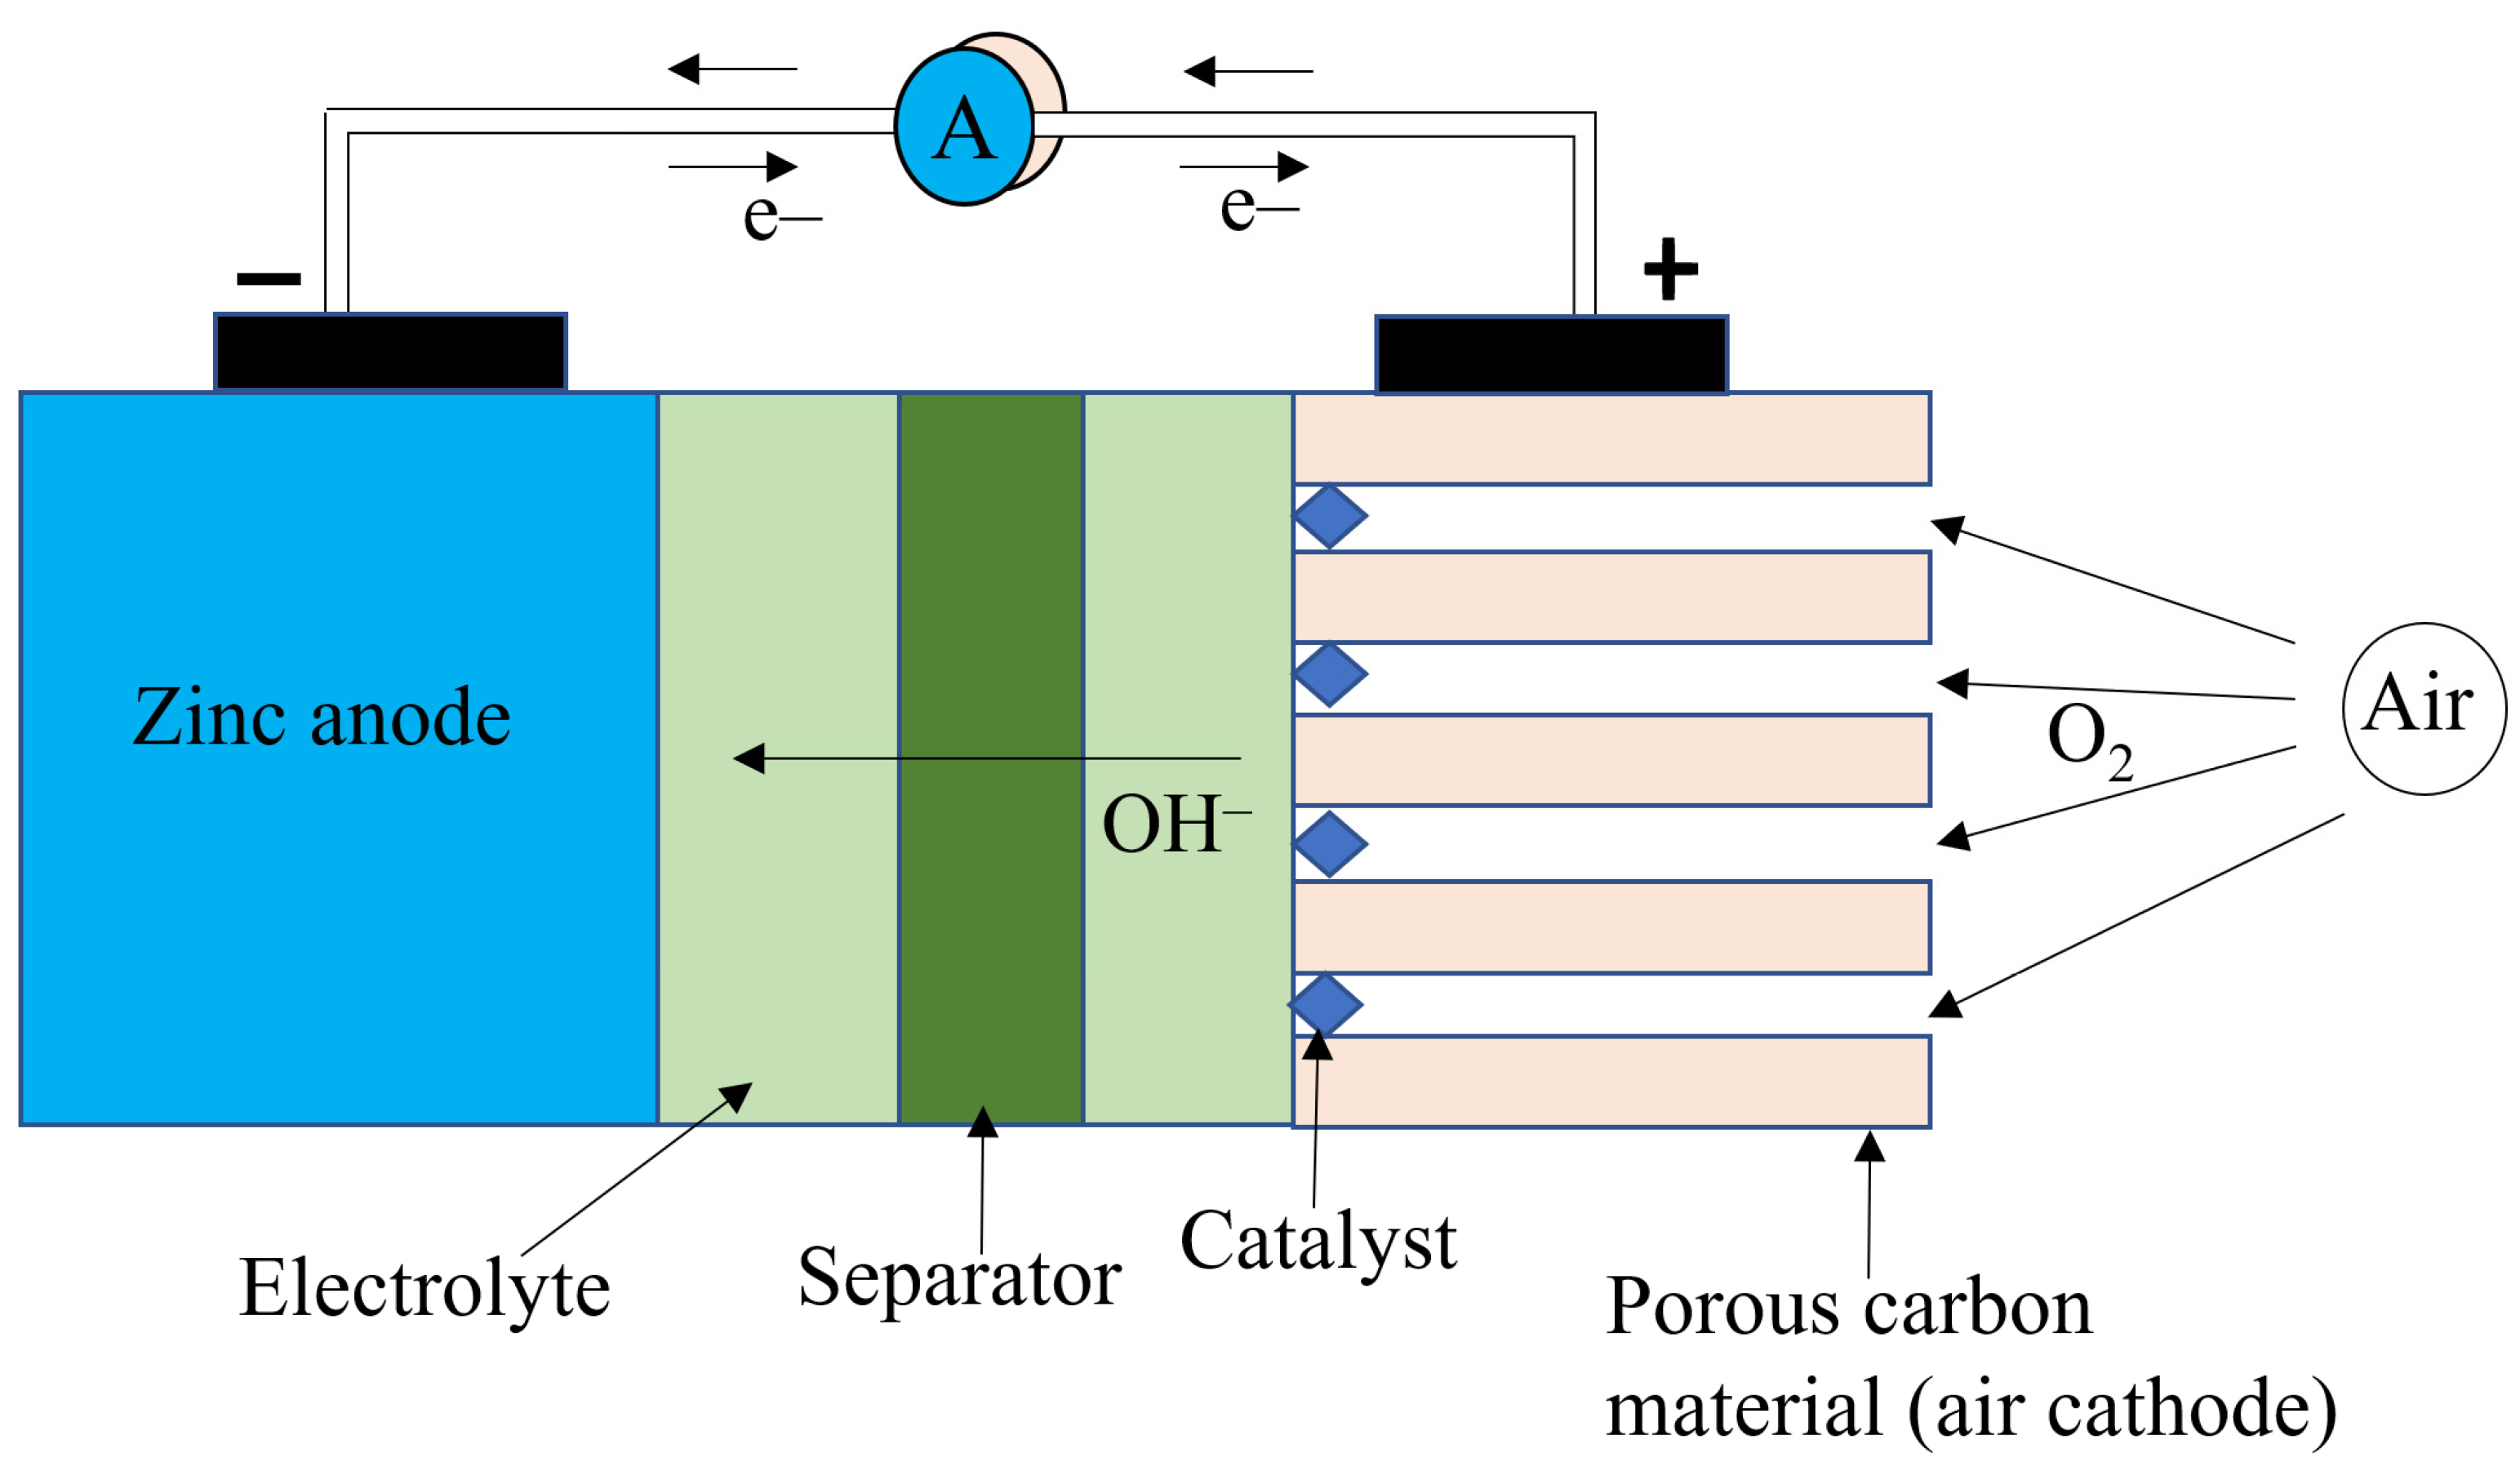
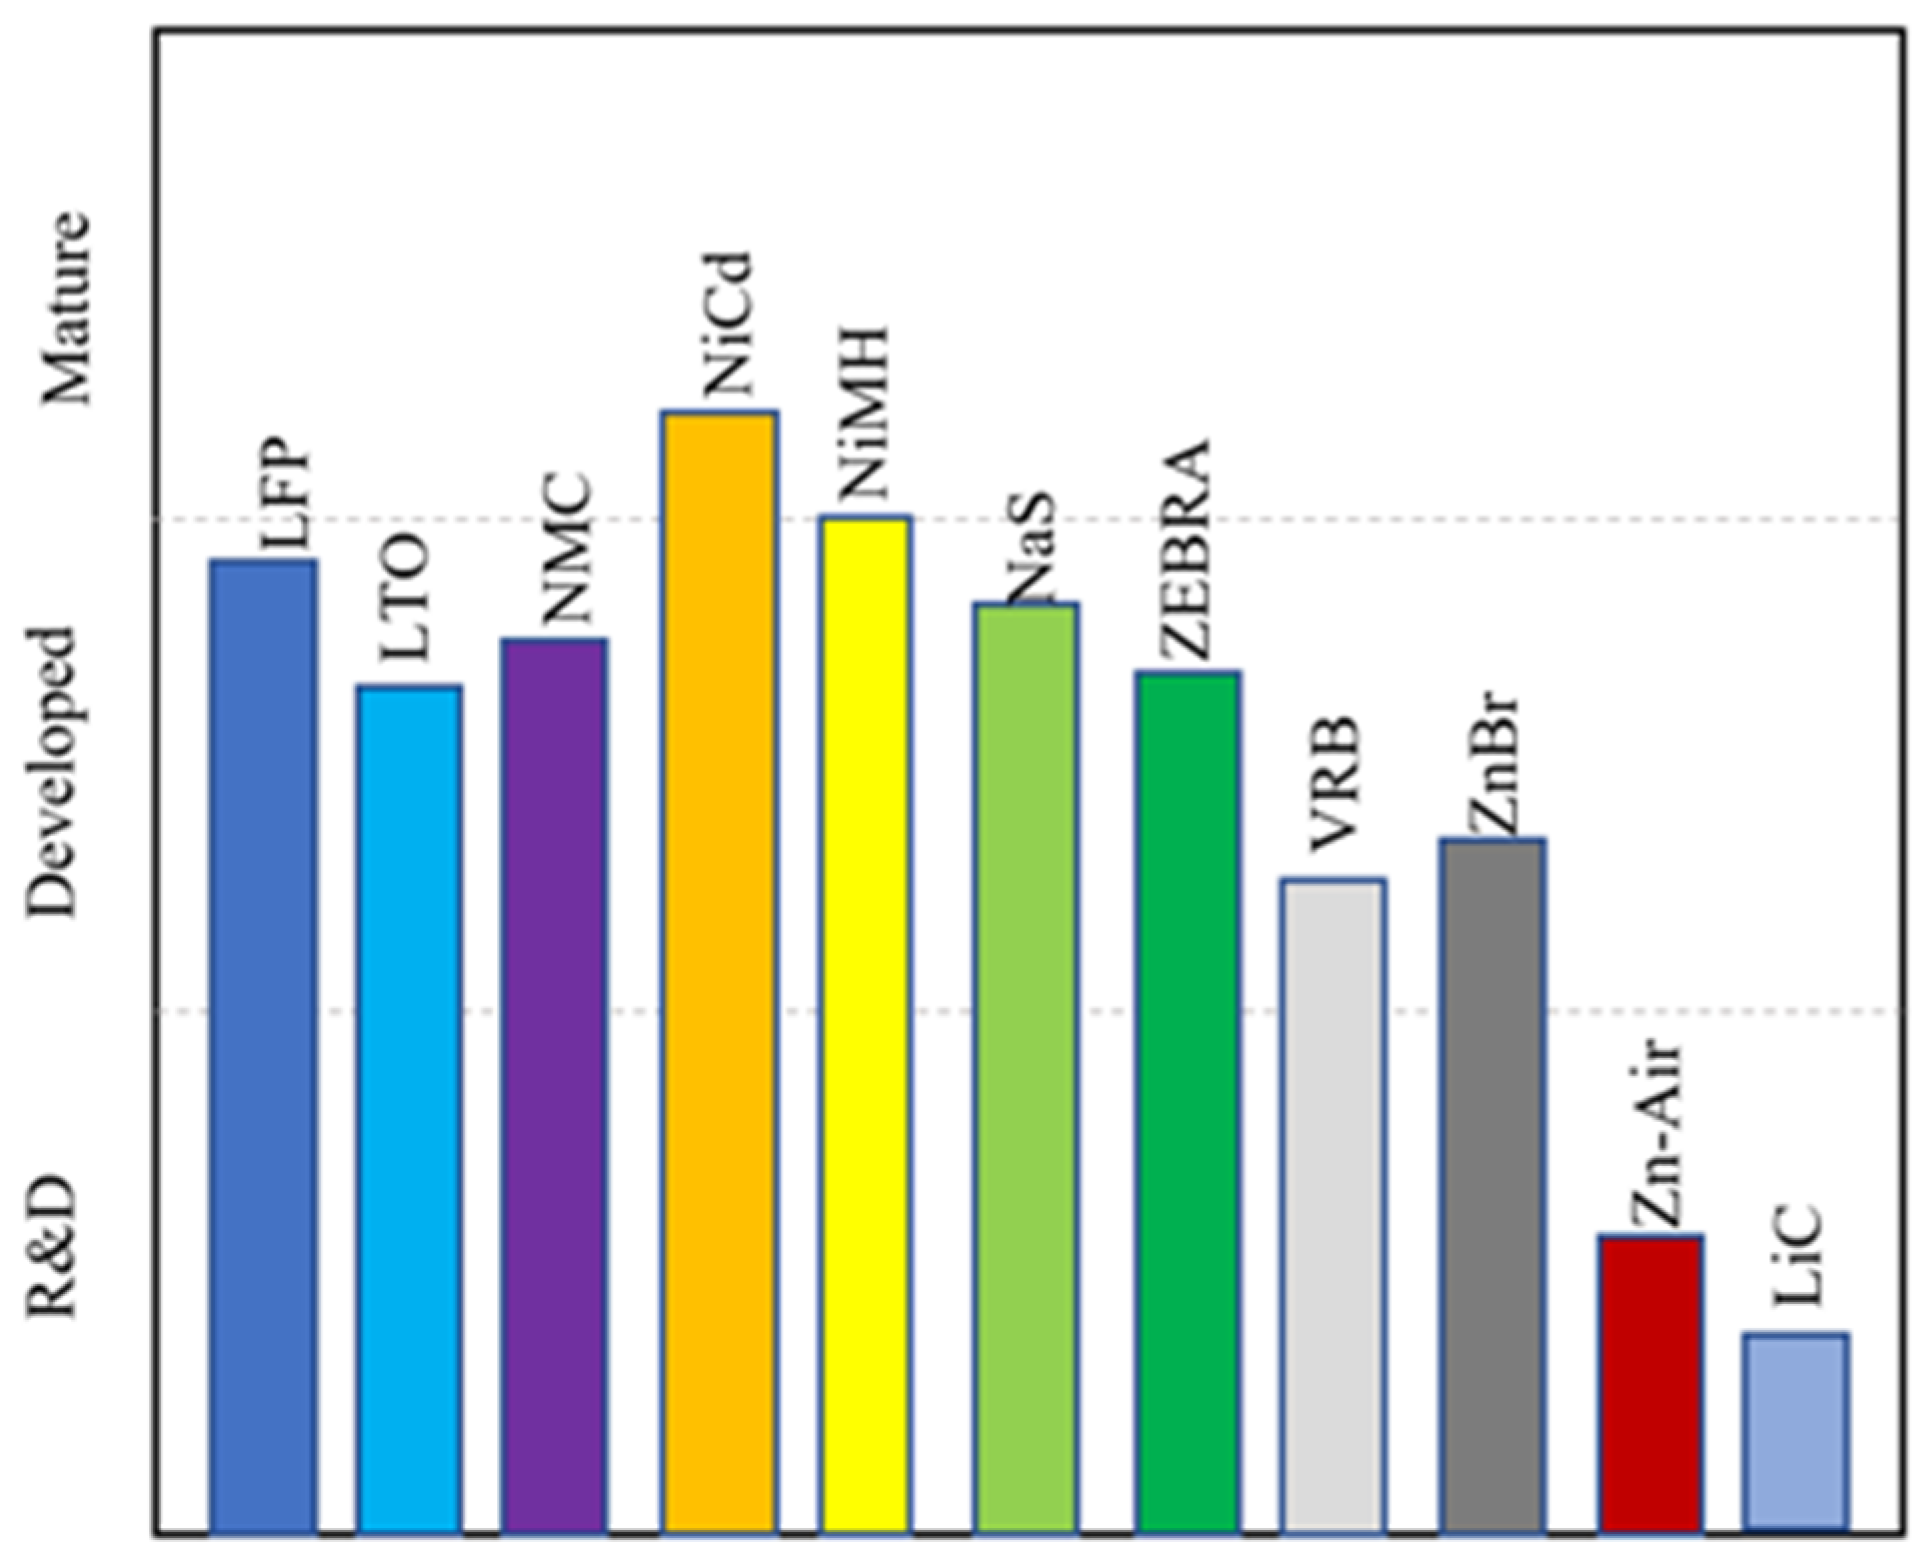
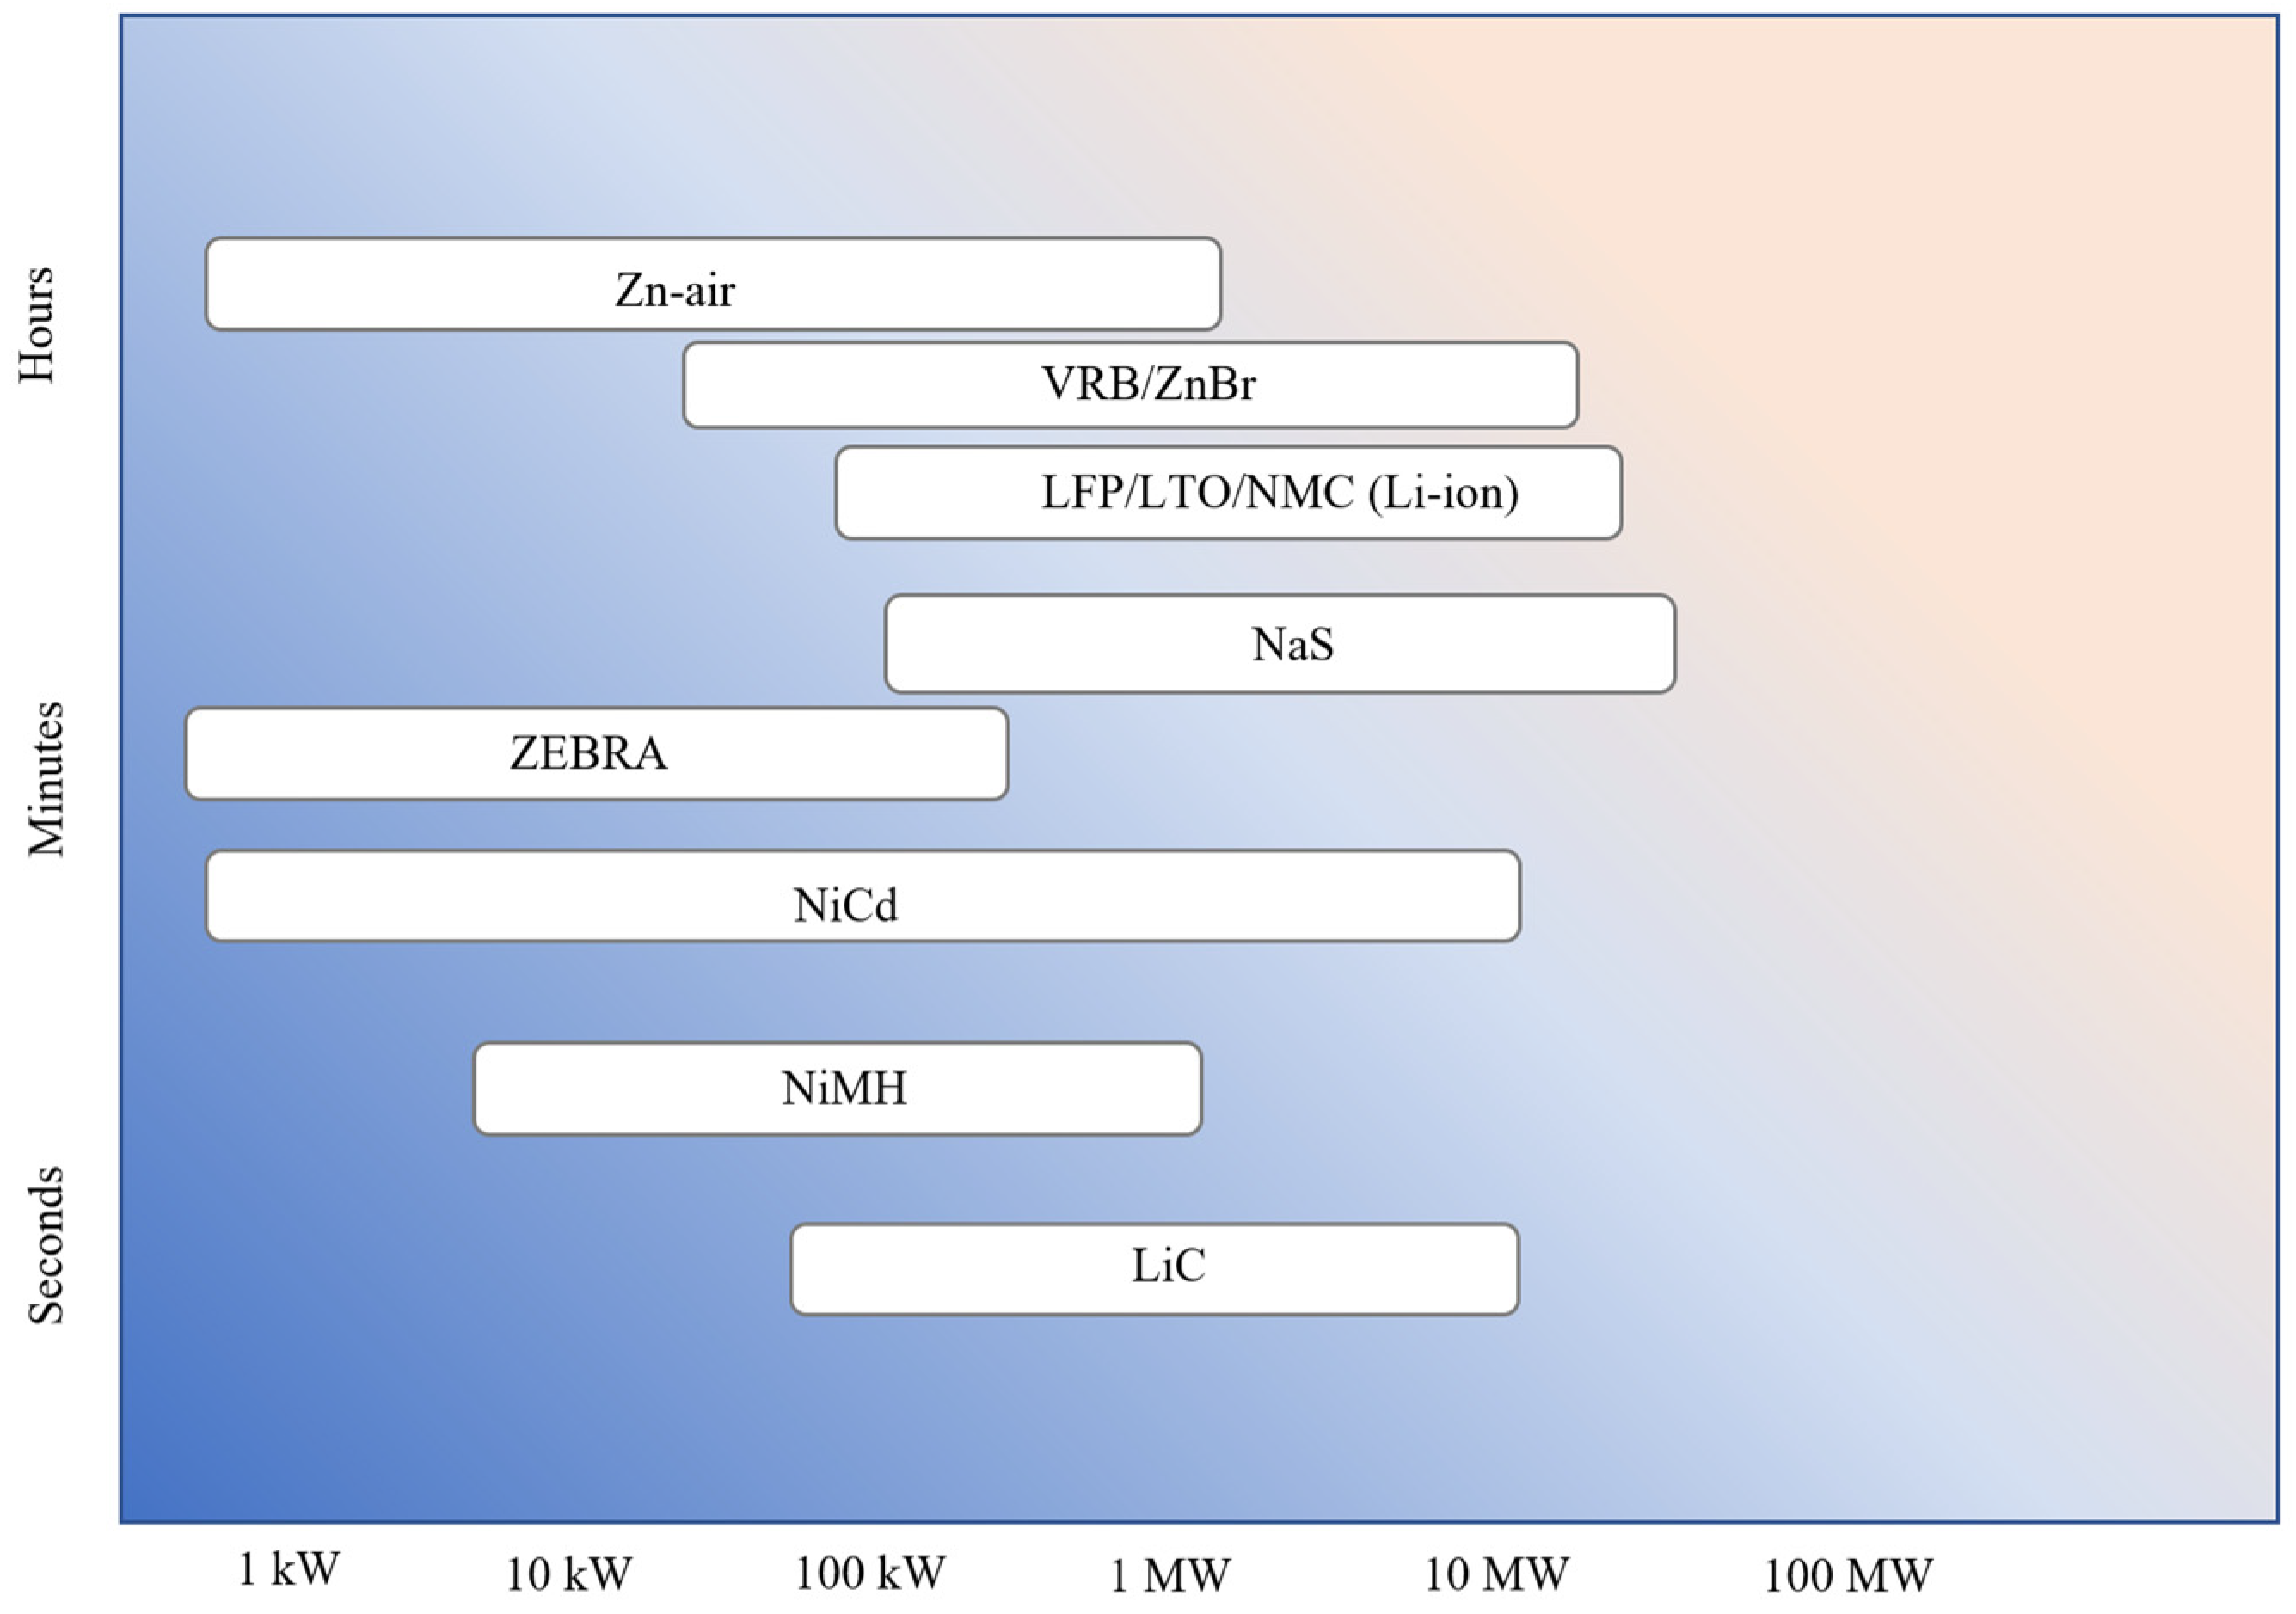
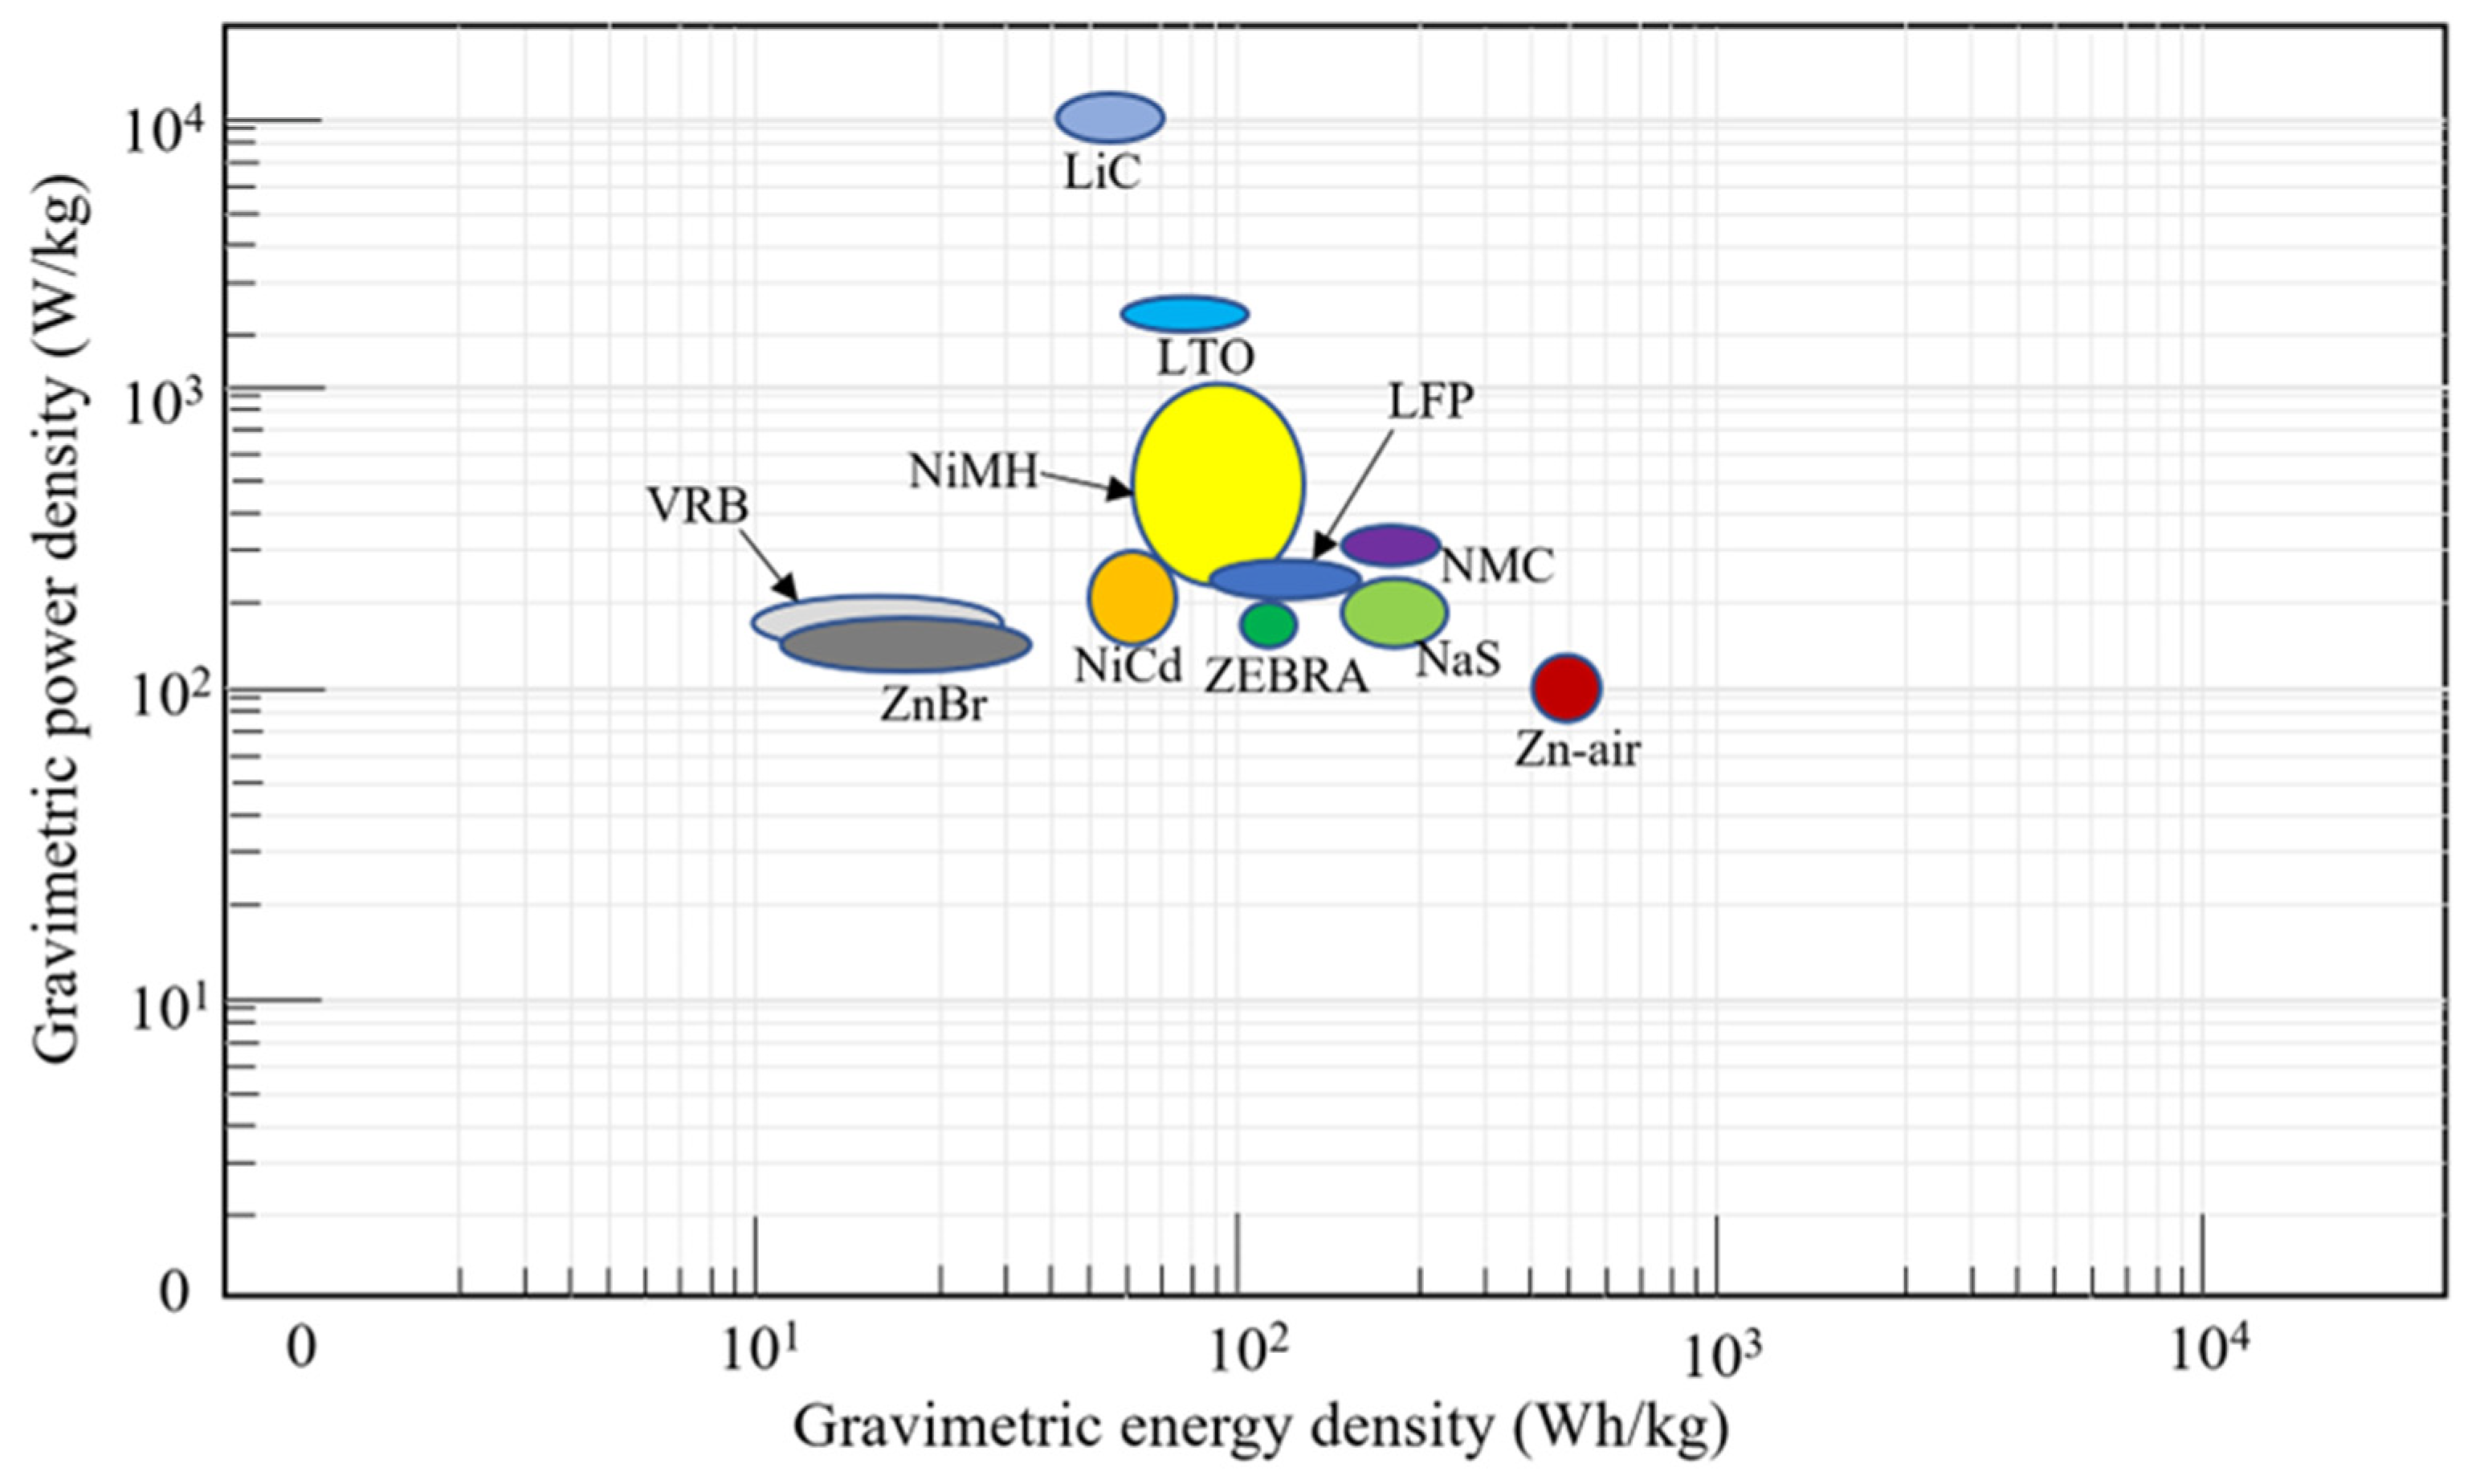

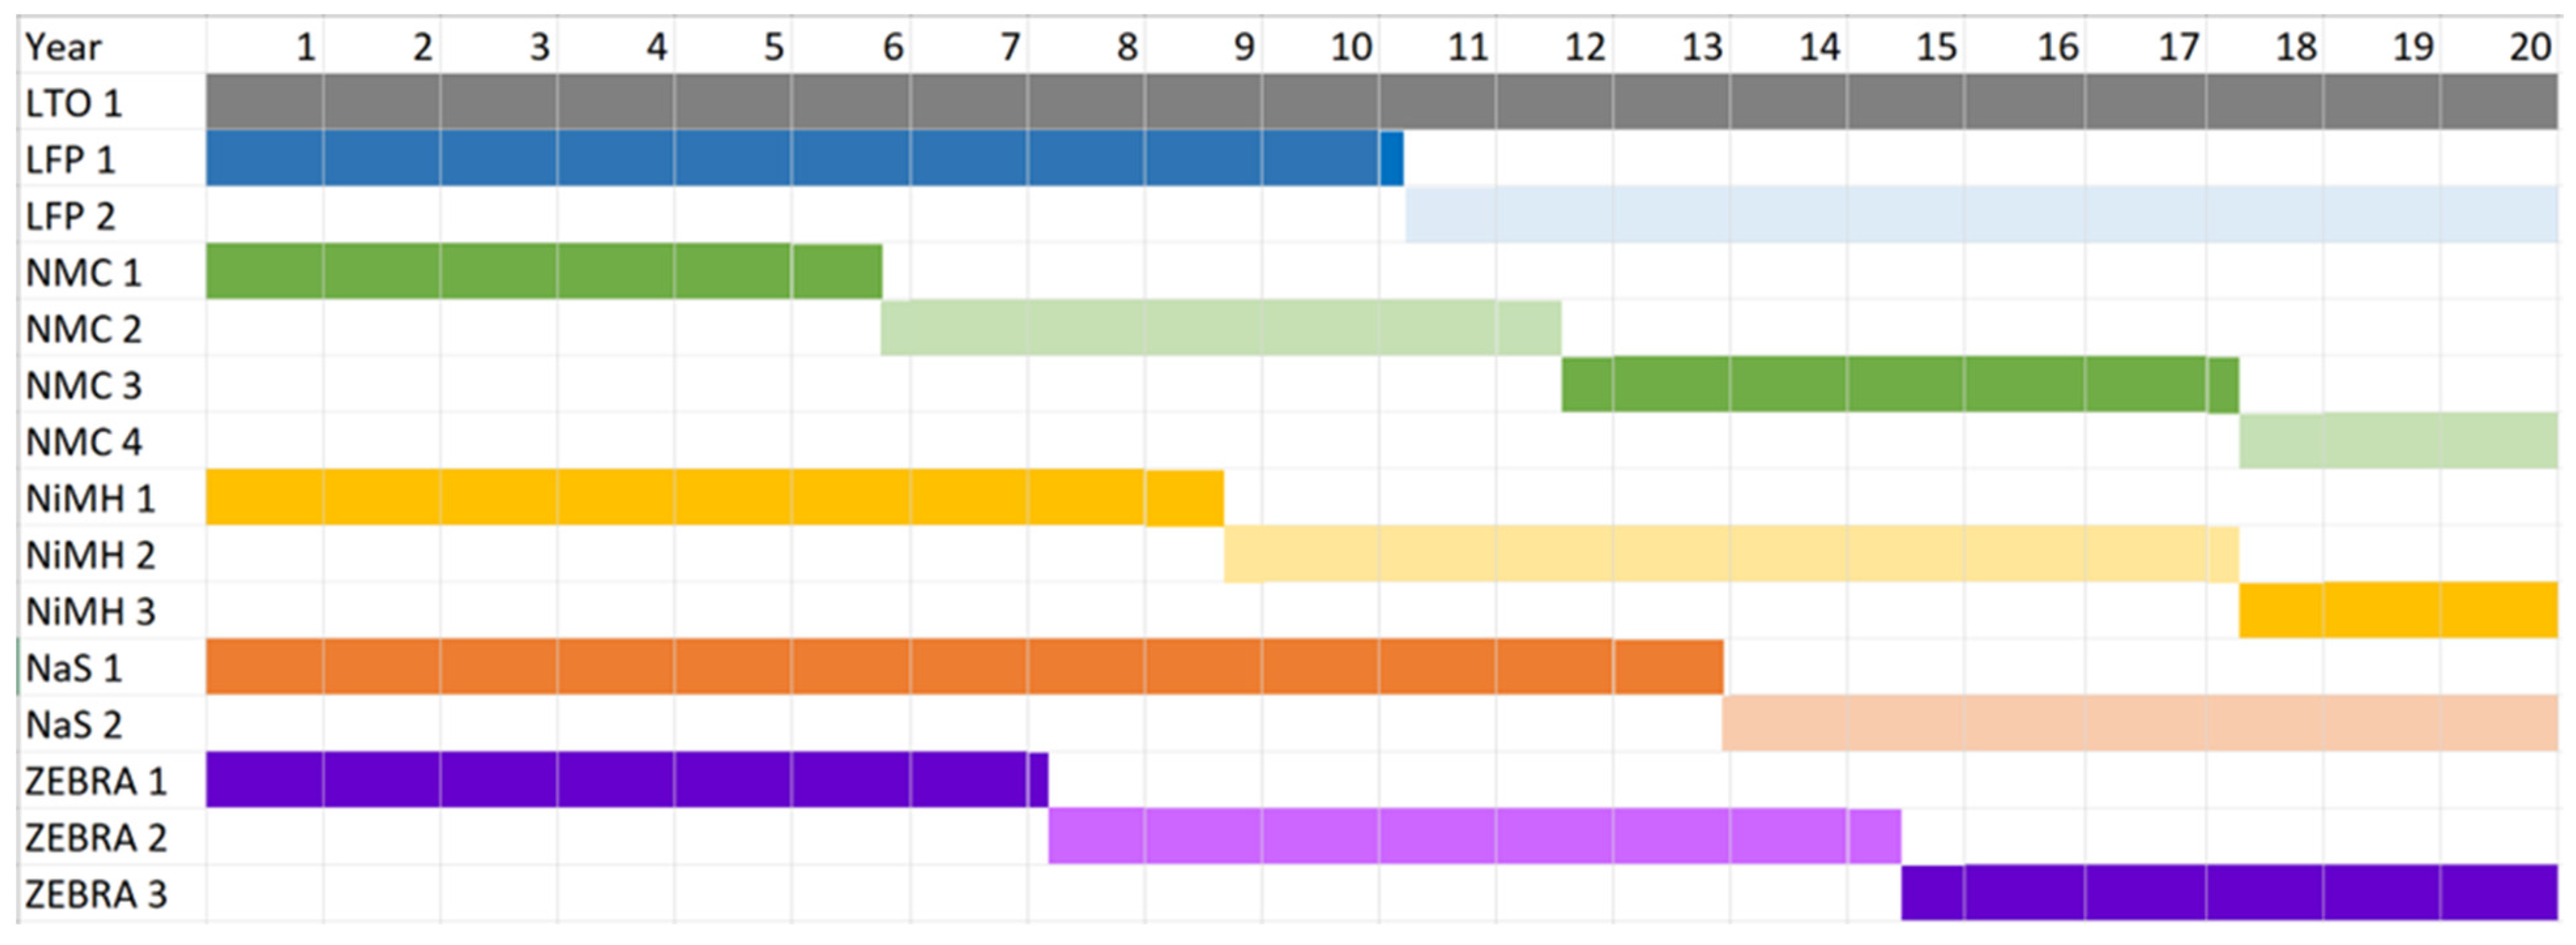


Disclaimer/Publisher’s Note: The statements, opinions and data contained in all publications are solely those of the individual author(s) and contributor(s) and not of MDPI and/or the editor(s). MDPI and/or the editor(s) disclaim responsibility for any injury to people or property resulting from any ideas, methods, instructions or products referred to in the content. |
© 2023 by the authors. Licensee MDPI, Basel, Switzerland. This article is an open access article distributed under the terms and conditions of the Creative Commons Attribution (CC BY) license (https://creativecommons.org/licenses/by/4.0/).