
Impact Analysis of Metallization Design and Recombination Losses on Performance of Crystalline Silicon Solar Cells

 , , ,
, , ,  and
and
Abstract
:1. Introduction
2. Simulation Methods
Parameters of the Simulation Design
3. Results
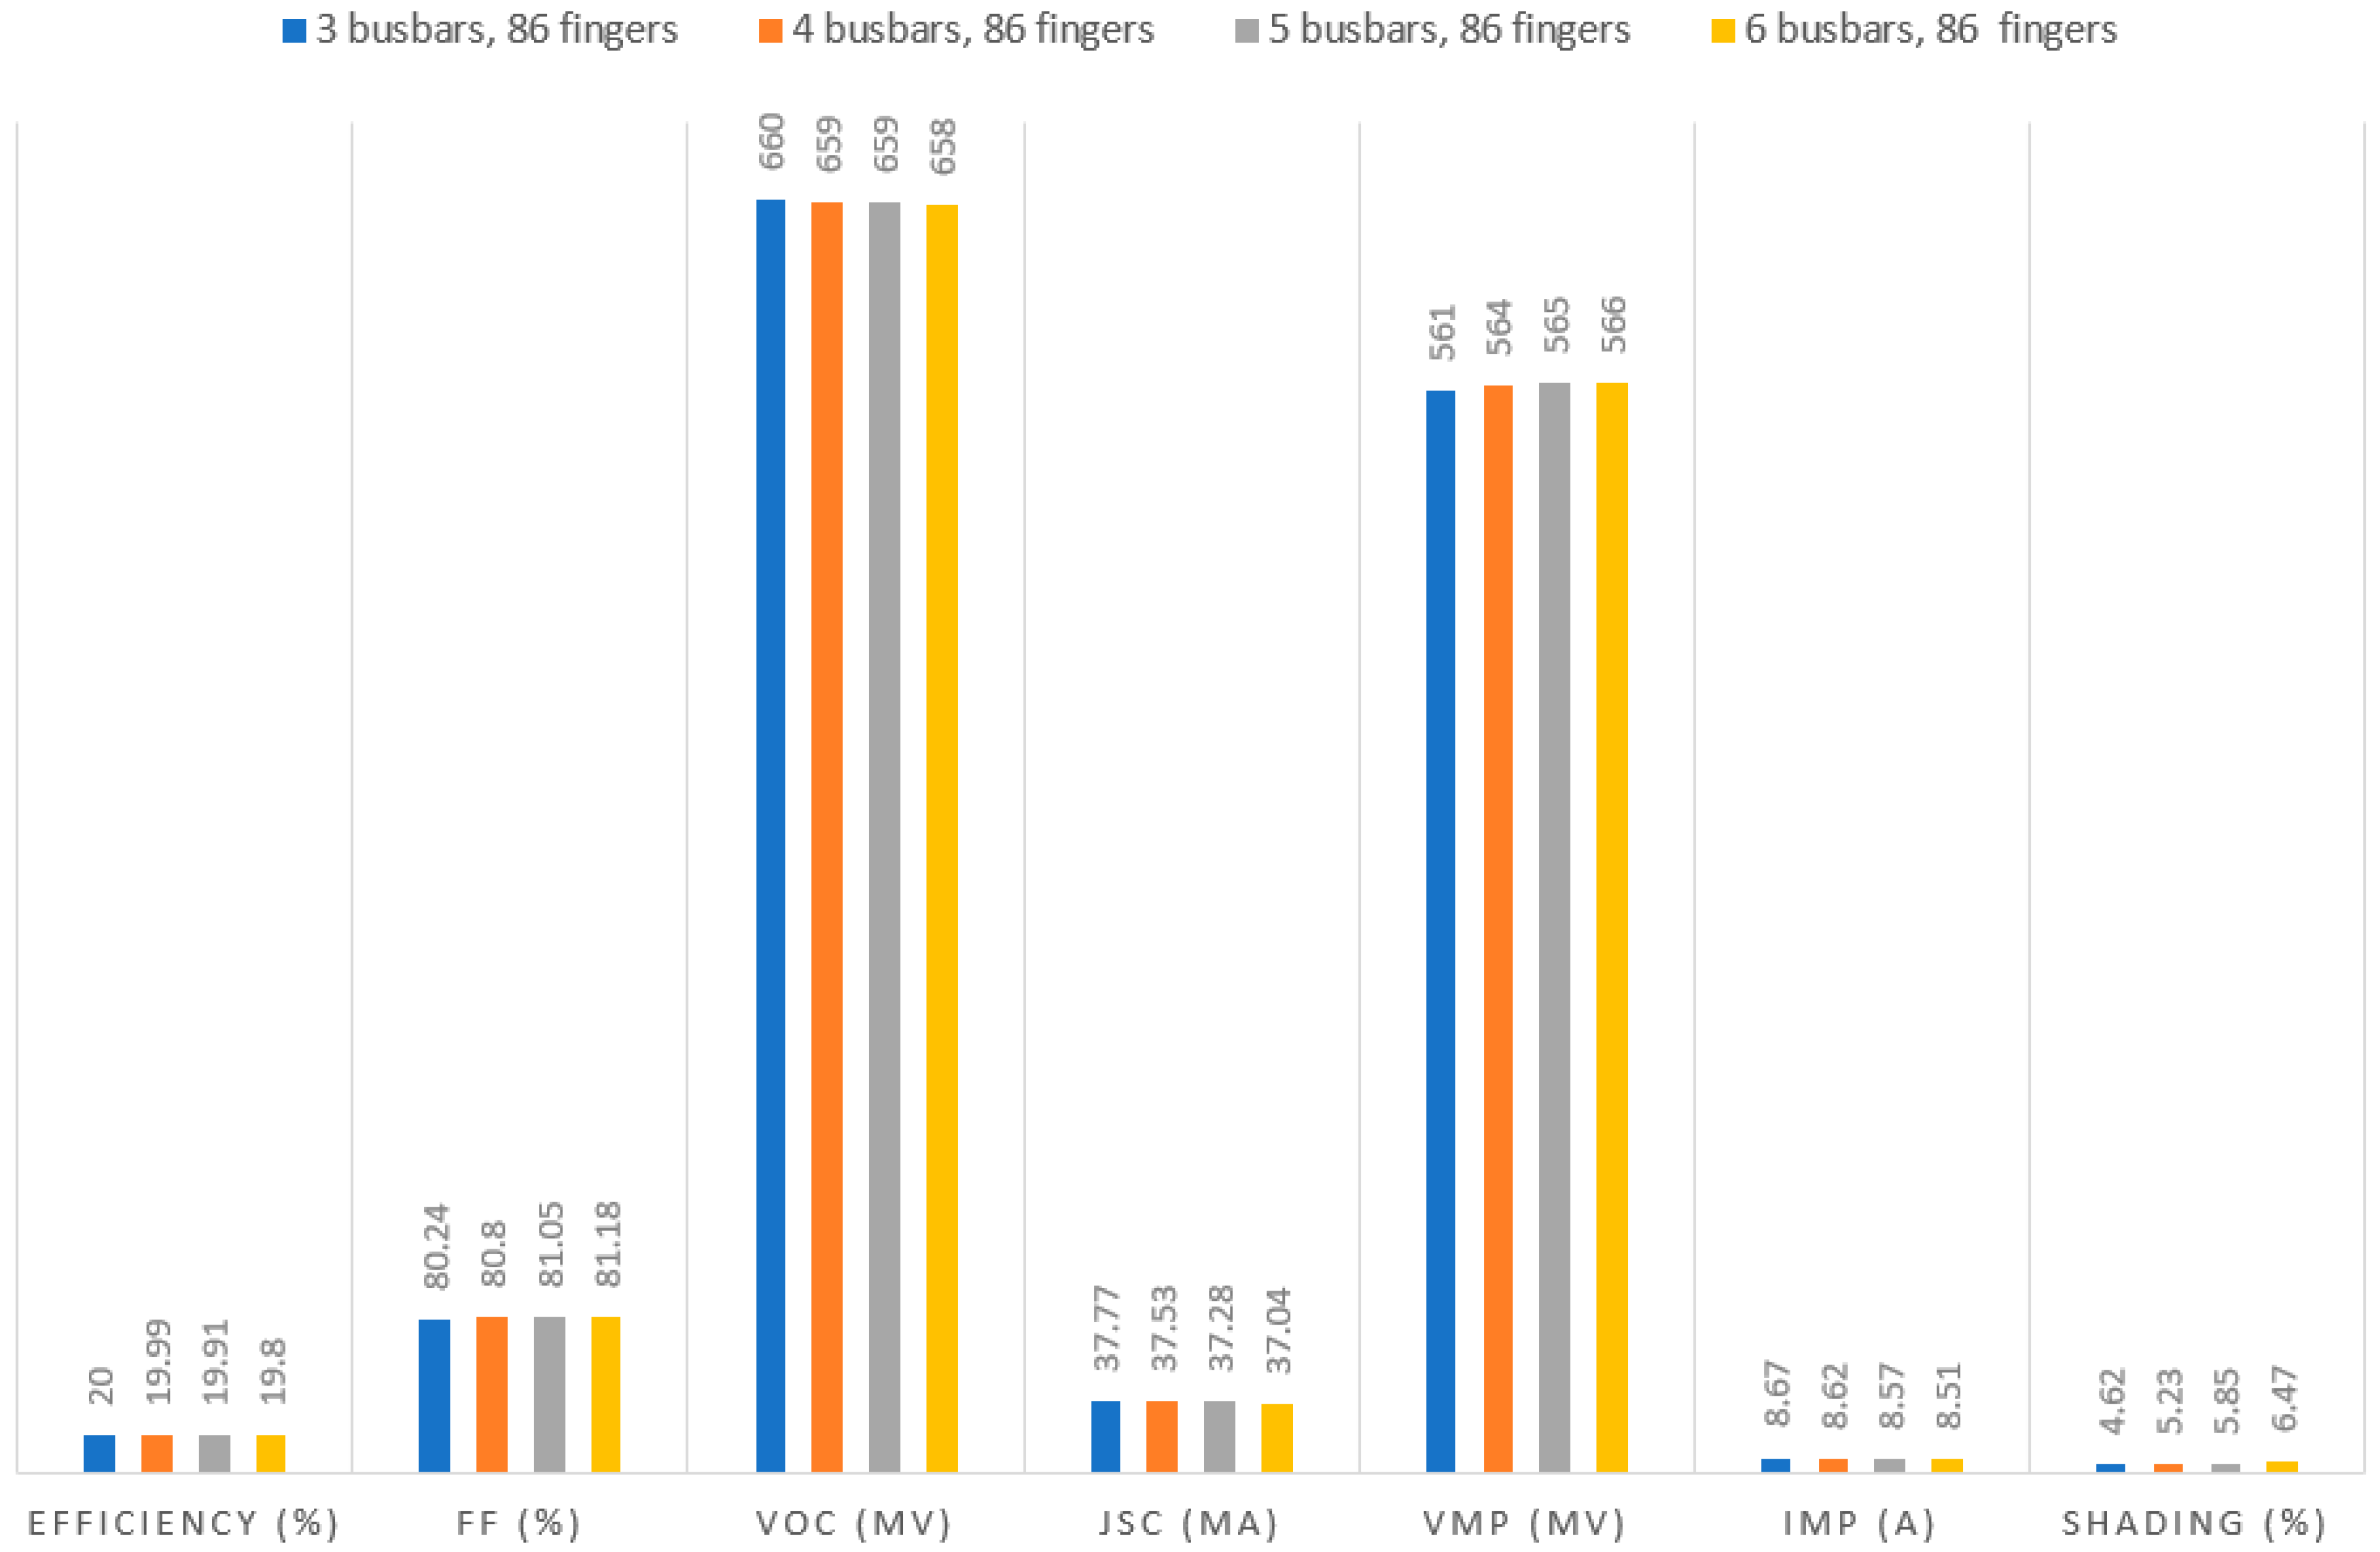
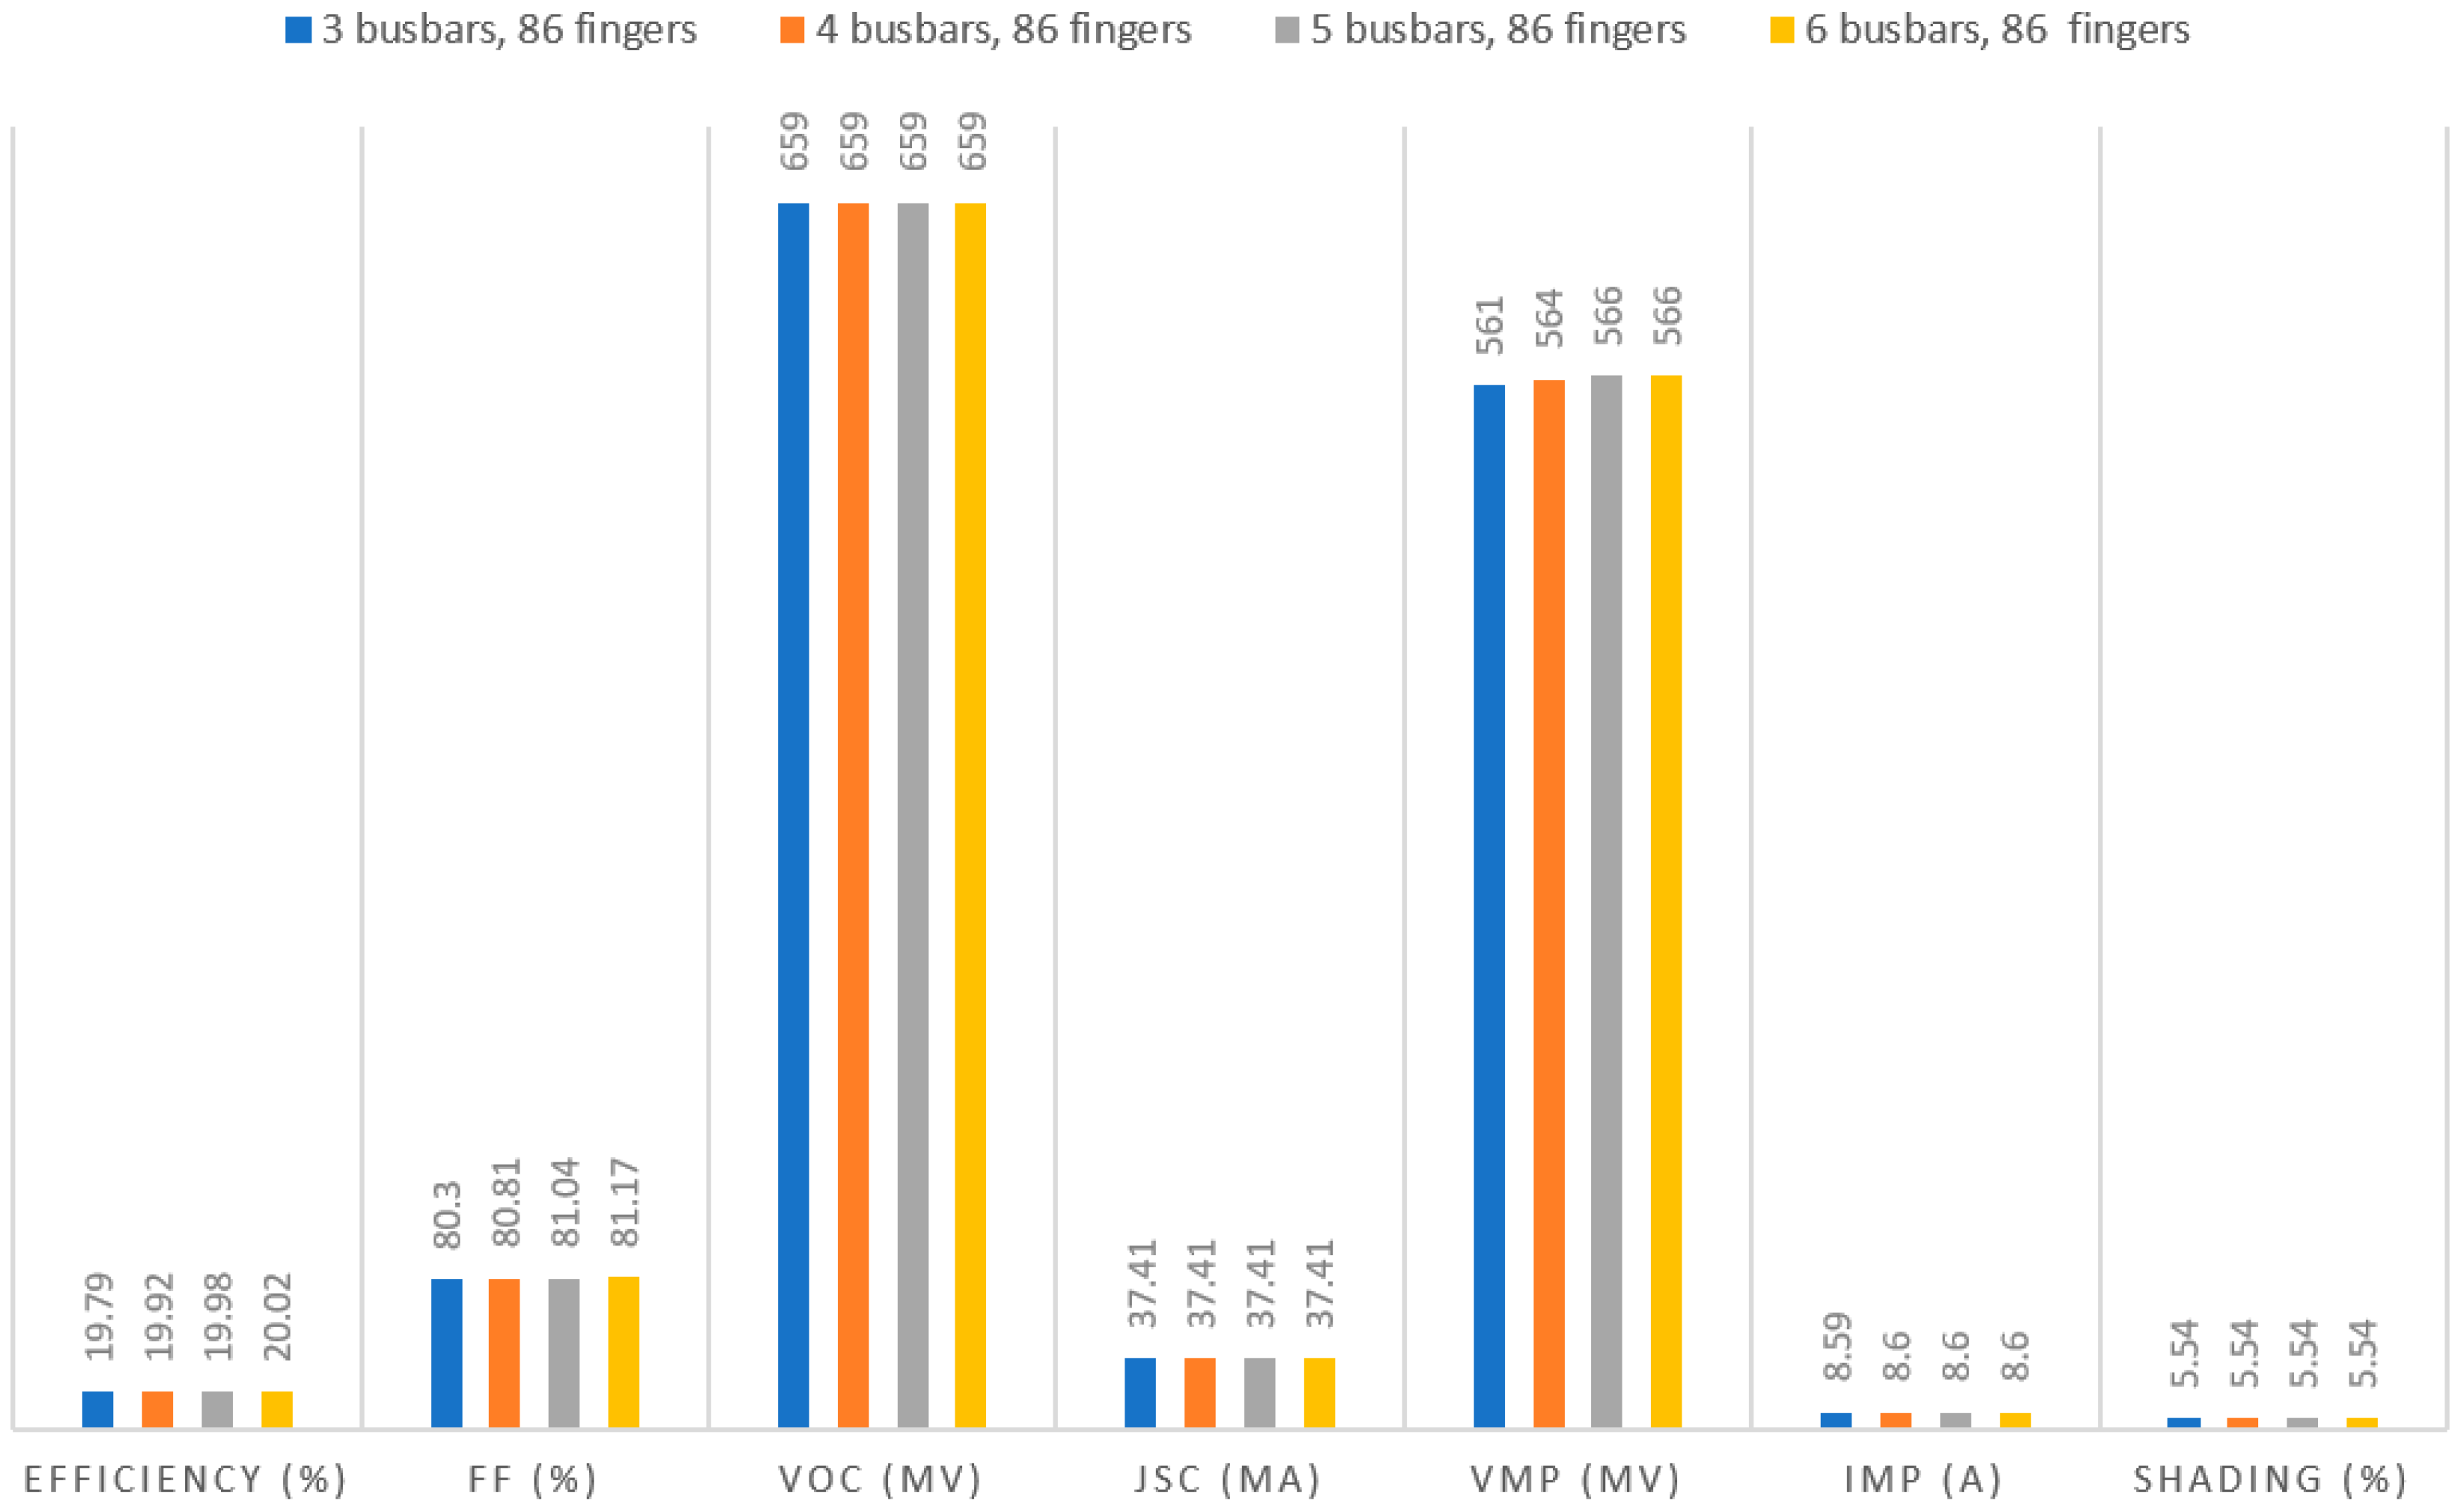
3.1. Impact of Busbars’ Geometry on Solar Cell Performance
3.2. Impact of Finger Pitch on Solar Cells Performance
3.3. Optimization of Solar Cell’s Metal Fingers
4. Conclusions
- A total of 86 fingers constitute the optimal choice for a c-Si solar cell, since they provide minimal shading losses and keep the finger spacing to less than 2 mm.
- Furthermore, increasing the number of busbars will help in reducing the transport distance of carriers, hence lowering the layer sheet resistance to 60 ohm/sq for solar cells.
- Reducing recombination at the emitter and front metal contact is also considered to ensure a high performance.
Author Contributions
Funding
Institutional Review Board Statement
Informed Consent Statement
Data Availability Statement
Acknowledgments
Conflicts of Interest
References
- Wang, M.; Jiang, C.; Zhang, S.; Song, X.; Tang, Y.; Cheng, H.-M. Reversible calcium alloying enables a practical room-temperature rechargeable calcium-ion battery with a high discharge voltage. Nat. Chem. 2018, 10, 667–672. [Google Scholar] [CrossRef] [PubMed]
- Lu, S.; Yin, Z.; Liao, S.; Yang, B.; Liu, S.; Liu, M.; Yin, L.; Zheng, W. An asymmetric encoder–decoder model for Zn-ion battery lifetime prediction. Energy Rep. 2022, 8, 33–50. [Google Scholar] [CrossRef]
- Dang, W.; Liao, S.; Yang, B.; Yin, Z.; Liu, M.; Yin, L.; Zheng, W. An encoder-decoder fusion battery life prediction method based on Gaussian process regression and improvement. J. Energy Storage 2023, 59, 106469. [Google Scholar] [CrossRef]
- Murdock, H.E.; Gibb, D.; André, T.; Sawin, J.L.; Brown, A.; Ranalder, L.; Collier, U.; Dent, C.; Epp, B.; Hareesh Kumar, C.; et al. Renewables 2021-Global Status Report. 2022. Available online: https://inis.iaea.org/search/search.aspx?orig_q=RN:52059346 (accessed on 26 January 2023).
- Philipps, S.; Warmuth, W. Fraunhofer Institute for Solar Energy Systems ISE. Photovoltaics Report. 6 December 2022. Available online: https://www.ise.fraunhofer.de/en/publications/studies/photovoltaics-report.html (accessed on 26 January 2023).
- Yu, J.; Li, J.; Zhao, Y.; Lambertz, A.; Chen, T.; Duan, W.; Liu, W.; Yang, X.; Huang, Y.; Ding, K. Copper metallization of electrodes for silicon heterojunction solar cells: Process, reliability and challenges. Sol. Energy Mater. Sol. Cells 2021, 224, 110993. [Google Scholar] [CrossRef]
- Zhang, Y.; Wang, L.; Chen, D.; Kim, M.; Hallam, B. Pathway towards 24% efficiency for fully screen-printed passivated emitter and rear contact solar cells. J. Phys. D Appl. Phys. 2021, 54, 214003. [Google Scholar] [CrossRef]
- Beaucarne, G.; Schubert, G.; Tous, L.; Hoornstra, J. Summary of the 8th Workshop on Metallization and Interconnection for Crystalline Silicon Solar Cells. AIP Conf. Proc. 2019, 2156, 020001. [Google Scholar] [CrossRef]
- Erath, D.; Pospischil, M.; Keding, R.; Jahn, M.; Lontchi, I.L.; Lorenz, A.; Clement, F. Comparison of innovative metallization approaches for silicon heterojunction solar cells. Energy Procedia 2017, 124, 869–874. [Google Scholar] [CrossRef]
- Bozzola, A.; Kowalczewski, P.; Andreani, L.C. Towards high efficiency thin-film crystalline silicon solar cells: The roles of light trapping and non-radiative recombinations. J. Appl. Phys. 2014, 115, 094501. [Google Scholar] [CrossRef]
- Siraj, S.; Tahir, S.; Ali, A.; Amin, N.; Mahmood, K.; Manzoor, A. Assessing the Impact of Front Grid Metallization Pattern on the Performance of BSF Silicon Solar Cells. Silicon 2021, 13, 4237–4245. [Google Scholar] [CrossRef]
- Kumar, S.; Meena, R.; Gupta, R. Finger and interconnect degradations in crystalline silicon photovoltaic modules: A review. Sol. Energy Mater. Sol. Cells 2021, 230, 111296. [Google Scholar] [CrossRef]
- Balaji, N.; Raval, M.C.; Saravanan, S. Review on Metallization in Crystalline Silicon Solar Cells. In Solar Cell; IntechOpen: London, UK, 2020. [Google Scholar] [CrossRef]
- Oh, W.; Jee, H.; Bae, J.; Lee, J. Busbar-free electrode patterns of crystalline silicon solar cells for high density shingled photovoltaic module. Sol. Energy Mater. Sol. Cells 2022, 243, 111802. [Google Scholar] [CrossRef]
- Ebong, A.; Chen, N. Metallization of crystalline silicon solar cells: A review. In Proceedings of the High Capacity Optical Networks and Emerging/Enabling Technologies, Istanbul, Turkey, 12–14 December 2012; pp. 102–109. [Google Scholar] [CrossRef]
- Raval, M.C.; Reddy, S.M. Industrial Silicon Solar Cells; IntechOpen: London, UK, 2019. [Google Scholar]
- Hoenig, R.; Kalio, A.; Sigwarth, J.; Clement, F.; Glatthaar, M.; Wilde, J.; Biro, D. Impact of screen printing silver paste components on the space charge region recombination losses of industrial silicon solar cells. Sol. Energy Mater. Sol. Cells 2012, 106, 7–10. [Google Scholar] [CrossRef]
- Dullweber, T.; Stöhr, M.; Kruse, C.; Haase, F.; Rudolph, M.; Beier, B.; Jäger, P.; Mertens, V.; Peibst, R.; Brendel, R. Evolutionary PERC+ solar cell efficiency projection towards 24% evaluating shadow-mask-deposited poly-Si fingers below the Ag front contact as next improvement step. Sol. Energy Mater. Sol. Cells 2020, 212, 110586. [Google Scholar] [CrossRef]
- Edwards, M.B. Screen and Stencil Print Technologies for Industrial n-Type Silicon Solar Cells. Ph.D. Thesis, University of New South Wales, Sydney, NSW, Australia, 2008. [Google Scholar]
- Hasan, A.; Alkahtani, A.A.; Shahahmadi, S.; Alam, M.N.E.; Islam, M.; Amin, N. Delamination-and Electromigration-Related Failures in Solar Panels—A Review. Sustainability 2021, 13, 6882. [Google Scholar] [CrossRef]
- Sangi, A.R.; Qayoom, A.; Qadir, A.; Abdalla, A.N.; Ali, R. Improving the performance of silicon solar cell by optimizing metallization. Meas. Control. 2020, 53, 742–747. [Google Scholar] [CrossRef]
- Wong, J. Griddler: Intelligent computer aided design of complex solar cell metallization patterns. In Proceedings of the 2013 IEEE 39th Photovoltaic Specialists Conference (PVSC), Tampa, FL, USA, 16–21 June 2013; pp. 0933–0938. [Google Scholar] [CrossRef]
- Grempels, S.J. Fundamentals of Solar Cells and Advancements in Copper Contacts. Ph.D. Thesis, The University of North Carolina at Charlotte, Charlotte, NC, USA, 2021. [Google Scholar]
- Inns, D. Understanding Metal Induced Recombination Losses in Silicon Solar Cells with Screen Printed Silver Contacts. Energy Procedia 2016, 98, 23–29. [Google Scholar] [CrossRef]
- Tahir, S.; Ali, A.; Amin, N.; Arshad, M.I. The Effect of Non-Uniform Front Contact Resistance on Perc Solar Cell Performance. J. Ovonic Res. 2018, 14, 177–184. [Google Scholar]
- Chen, N.; Ebong, A. Towards 20% efficient industrial Al-BSF silicon solar cell with multiple busbars and fine gridlines. Sol. Energy Mater. Sol. Cells 2016, 146, 107–113. [Google Scholar] [CrossRef]
- Mette, A. New Concepts for Front Side Metallization of Industrial Silicon Solar Cells. Ph.D. Thesis, Freiburg (Breisgau) University, Freiburg, Germany, 2007. [Google Scholar]


| Parameter | Value |
|---|---|
| Cell size | 15.6 cm2 |
| Ingot diameter | 20 cm |
| Number of busbars | 3–6 |
| Busbar width | 1 mm front |
| 1.7 mm rear | |
| Busbar style | Straight |
| Number of fingers | 86–116 |
| Finger width | 50 μm |
| Finger sheet resistance | 3 |
| Front finger contact resistance | 0 |
| Front layer sheet resistance | 80 |
| Rear finger sheet resistance | 3 |
| Rear finger contact resistance | 0 |
| Rear layer sheet resistance | 80 |
| Front | 200 |
| Front | 600 |
| Front | 10 |
| Front | 50 |
| Rear | 0 |
| Rear | 0 |
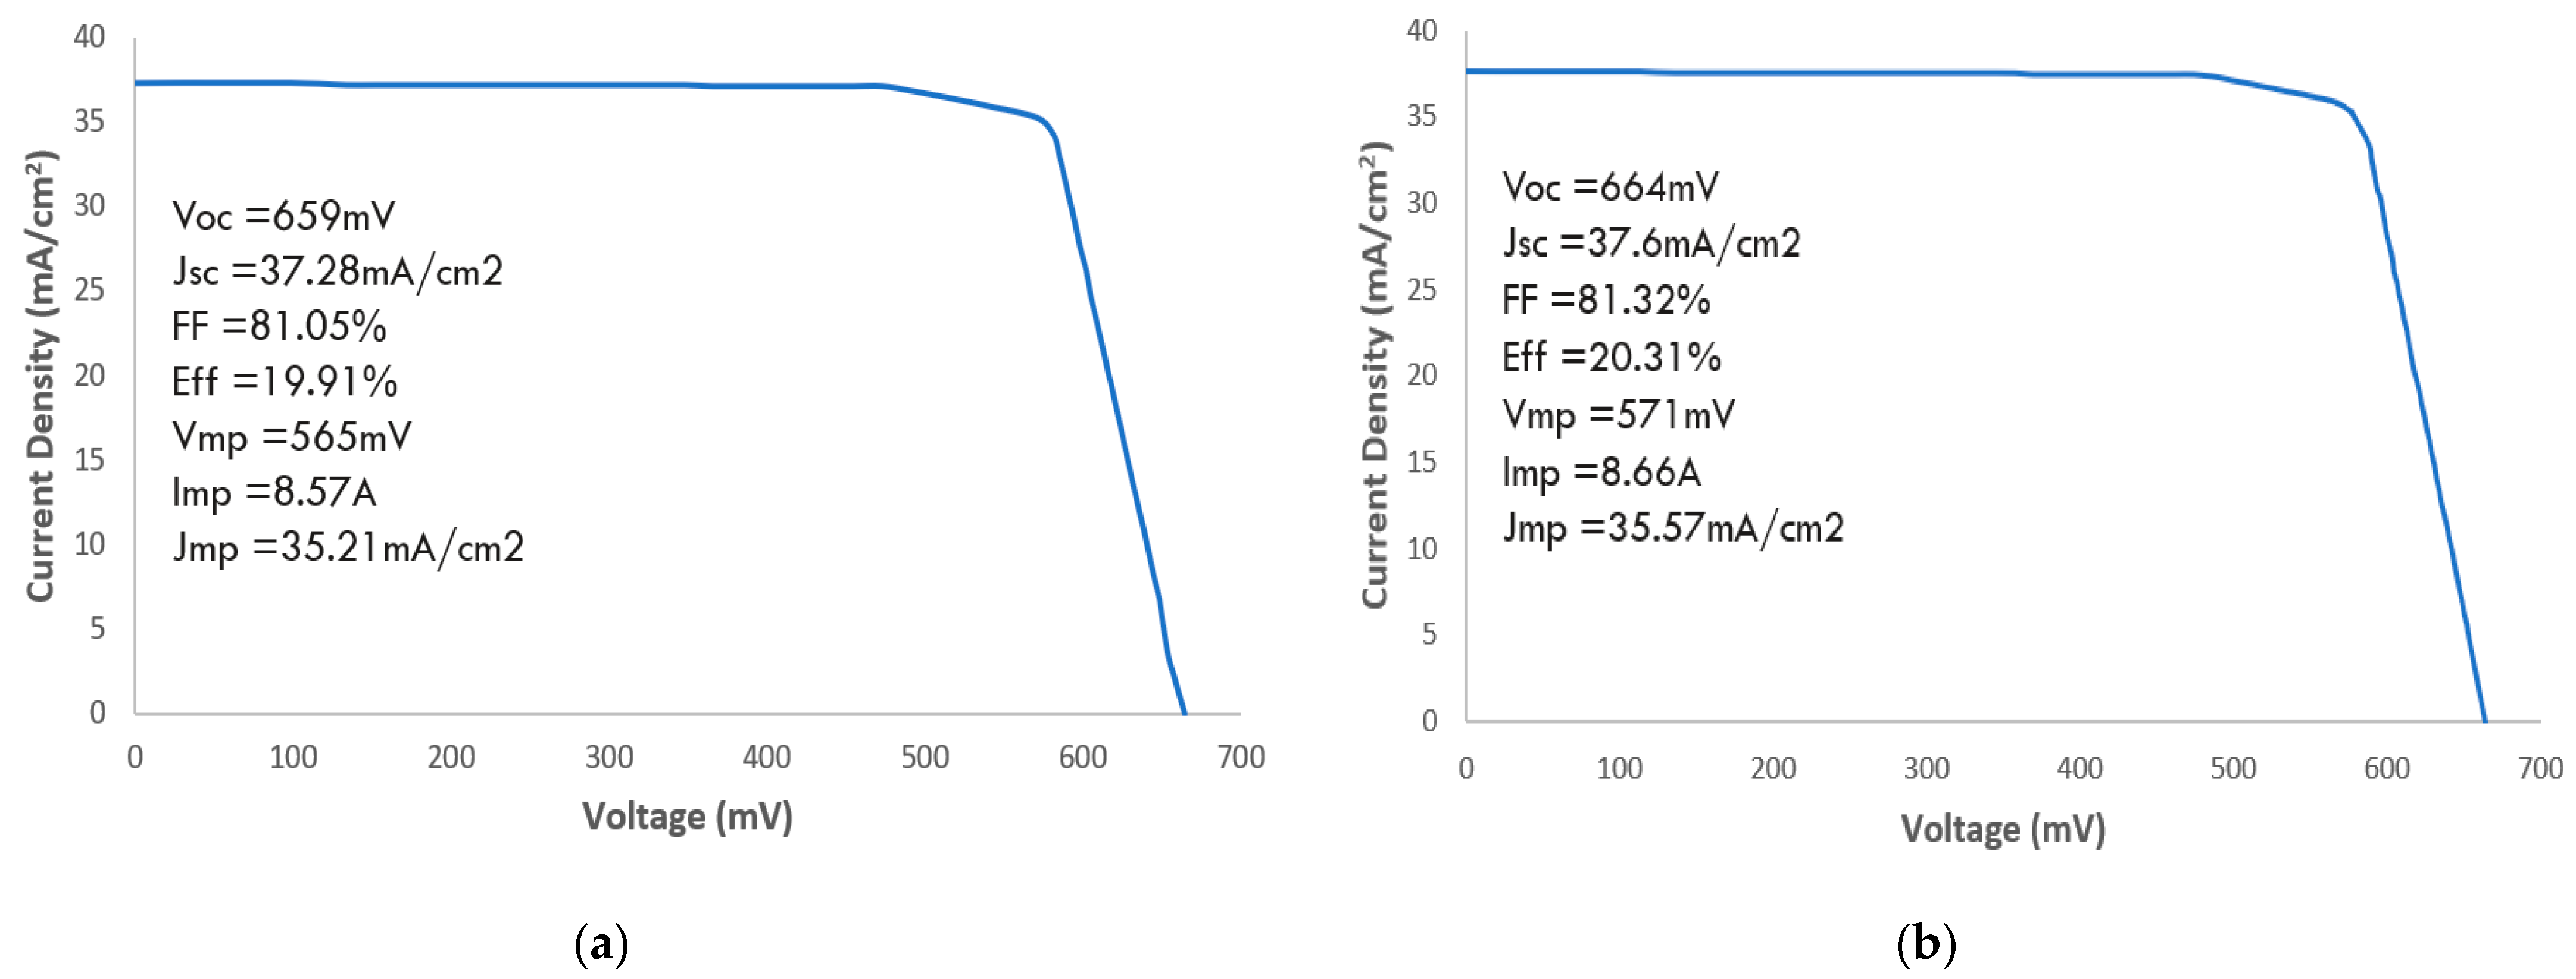
| Parameter | Non-Optimized Solar Cell | Optimized Solar Cell |
|---|---|---|
| Efficiency (%) | 19.91 | 20.31 |
| FF (%) | 81.05 | 81.32 |
| Voc (mV) | 659 | 664 |
| Jsc (mA) | 37.28 | 37.6 |
| Vmp (mV) | 565 | 571 |
| Imp (A) | 8.57 | 8.66 |
Disclaimer/Publisher’s Note: The statements, opinions and data contained in all publications are solely those of the individual author(s) and contributor(s) and not of MDPI and/or the editor(s). MDPI and/or the editor(s) disclaim responsibility for any injury to people or property resulting from any ideas, methods, instructions or products referred to in the content. |
© 2023 by the authors. Licensee MDPI, Basel, Switzerland. This article is an open access article distributed under the terms and conditions of the Creative Commons Attribution (CC BY) license (https://creativecommons.org/licenses/by/4.0/).
Share and Cite
Amin, N.; Santhiran, S.; Kassim, N.M.; Alkahtani, A.A.; Islam, M.A.; Mohd Yusof, M.Y. Impact Analysis of Metallization Design and Recombination Losses on Performance of Crystalline Silicon Solar Cells. Energies 2023, 16, 6505. https://doi.org/10.3390/en16186505
Amin N, Santhiran S, Kassim NM, Alkahtani AA, Islam MA, Mohd Yusof MY. Impact Analysis of Metallization Design and Recombination Losses on Performance of Crystalline Silicon Solar Cells. Energies. 2023; 16(18):6505. https://doi.org/10.3390/en16186505
Chicago/Turabian StyleAmin, Nowshad, Sathiswary Santhiran, Nabilah Mat Kassim, Ammar Ahmed Alkahtani, Mohammad Aminul Islam, and Mohd Yusrizal Mohd Yusof. 2023. "Impact Analysis of Metallization Design and Recombination Losses on Performance of Crystalline Silicon Solar Cells" Energies 16, no. 18: 6505. https://doi.org/10.3390/en16186505