Article

Evaluation of Rooftop Photovoltaic Power Generation Potential Based on Deep Learning and High-Definition Map Image

School of Automation, Guangdong University of Technology, Guangzhou 510006, China
*
Authors to whom correspondence should be addressed.
Energies 2023, 16(18), 6563; https://doi.org/10.3390/en16186563
Submission received: 17 August 2023 / Revised: 8 September 2023 / Accepted: 8 September 2023 / Published: 12 September 2023

Abstract

:
Photovoltaic (PV) power generation is booming in rural areas, not only to meet the energy needs of local farmers but also to provide additional power to urban areas. Existing methods for estimating the spatial distribution of PV power generation potential either have low accuracy and rely on manual experience or are too costly to be applied in rural areas. In this paper, we discuss three aspects, namely, geographic potential, physical potential, and technical potential, and propose a large-scale and efficient PV potential estimation system applicable to rural rooftops in China. Combined with high-definition map images, we proposed an improved SegNeXt deep learning network to extract roof images. Using the national standard Design Code for Photovoltaic Power Plants (GB50797-2012) and the Bass model, computational results were derived. The average pixel accuracy of the improved SegNeXt was about 96%, which well solved the original problems of insufficient finely extracted edges, poor adhesion, and poor generalization ability and can cope with different types of buildings. Leizhou City has a geographic potential of 1500 kWh/m2, a physical potential of 25,186,181.7 m2, and a technological potential of 442.4 MW. For this paper, we innovatively used the Bass Demand Diffusion Model to estimate the installed capacity over the next 35 years and combined the Commodity Diffusion Model with the installed capacity, which achieved a good result and conformed to the dual-carbon “3060” plan for the future of China.

1. Introduction

Rooftop photovoltaic power generation is installed on the roofs of buildings and directly connected to a low-voltage distribution network; it has the advantages of proximity to the user side, local consumption, and reduction in transmission costs. China’s existing residential building area is more than 700 billion m2. China is currently in a period of the rapid development of new urban and rural construction. Each year, the new urban and rural housing construction area is nearly 20 billion m2, offering a huge potential for the use of these roofs. In 2022, China’s new grid-connected PV installed capacity was 87.41 GW. By 2042, the cumulative grid-connected PV installed capacity will be 20.43 GW. As of the end of December, the national cumulatively installed power generation capacity was about 25.6 billion kilowatts, an increase of 7.8% year-over-year, while the installed solar power generation capacity was about 390 million kilowatts, an increase of 28.1% year-over-year. However, its development speed was much lower than expected, especially the lack of rooftop PV power generation resource evaluation methods, tools, and related technologies; there is an urgent need to carry out technical research and demonstration applications in the fields of resource identification, potential evaluation, rooftop resource system evaluation, and PV power generation applications. The research and development of a scientific and feasible system for evaluating the potential of rooftop solar distributed photovoltaic utilization will help to better utilize solar energy, solve the urban energy crisis, and reduce the dependence of buildings on mineral energy.
Existing methods for estimating rooftop solar potential are categorized into the following three main types: fixed-value methods, radar methods, and high-definition map-based methods [1].

1.1. Fixed-Value Methods

The roof area was calculated using the sampling statistics method. This method uses a sample of urban constituencies to calculate the population and roof area of urban areas to obtain the roof area per capita, and then the total urban population is used to estimate the total roof area of the city. In these studies, the PV roof available area was used as the only PV installation parameter to assess the solar potential [2,3,4]. Izquierdo et al. used a stratified sampling method to classify the city into 16 types based on urban planning data, such as land use, population, and building density, and to calculate the roof available area for the region based on the per capita available area and population of different city types. L.K. Wiginton took 10 samples from 109 surveyed areas, calculated the relationship between the population and roof area, and used that to estimate the potential energy and power generation of rooftop PV [5].
This method [6,7,8,9] is suitable for large areas but has low accuracy. In addition, the method requires better statistics and similar styles of buildings in the study area. These methods are usually rarely tested and do not take into account the nuances of individual buildings.

1.2. Radar Method

The method of evaluating solar energy use potential based on radar technology is the most commonly used method for estimating the solar energy use potential at the urban neighborhood scale. This method enables 3D or 2D modeling of urban neighborhoods by installing radar on vehicles or aircraft and then measures the solar energy use potential of urban neighborhoods through solar radiation simulation methods. Jakubiec et al. proposed a method to predict citywide electricity revenues from photovoltaic panels in Cambridge, Massachusetts, based on a detailed 3D urban mass model [10]. Romero et al. used a high-precision 3D city model to calculate the total roof area and solar irradiance in Ludwigsburg, Germany [11]. Agugiaro used the Delaunay algorithm to build a 3D city model based on radar data. Jaroslav Hofierka et al. used digital orthophotographs, DEMs, and vectored and combined building attributes to obtain a 3D building and used the RUN model to evaluate the photovoltaic potential in urban areas [12].
Radar methods [13,14,15,16,17,18] are highly accurate but time-consuming and not easily replicated on a large scale. In large-scale studies, the cost of acquiring 3D spatial data is prohibitive. Meanwhile, the processing of 3D spatial data is labor-intensive and time-consuming.

1.3. Deep Learning Method Based on HD Map

With the development of computer vision methods, semantic segmentation models and deep learning techniques have received increasing attention; these can automatically detect constructed contours in satellite images [19,20].
Deep learning methods are widely used in the fields of urban map updating, urban planning, and building change detection. Qin et al. [21] used deep CNN to achieve semantic segmentation of buildings in high-resolution remote sensing images of China. Li et al. [22] proposed a multi-feature reuse network, which overcame the problem of the absence of contextual information and had a better accuracy of building extraction. Mou et al. [23] introduced a self-attention mechanism in FCN to obtain long-distance dependencies. Xu et al. [24] proposed a Res-U-Net semantic segmentation network based on ResNet and UNet, which effectively mitigated the problems of building misjudgment and missing judgments. Guo et al. [25] improved FCN by replacing the standard convolution with the null convolution for the segmentation of remote sensing images. Badrinarayanan et al. [26] designed a more efficient semantic segmentation model, SegNet, which uses a codec structure to mark the maximum position during pooling to compensate for the loss of position information during up-sampling and to reduce the training time. Audebert et al. [27] applied the SegNet codec network to segment high-resolution remotely sensed imagery and compared the two fusion methods: the feature level and the decision level. Chen et al. [28] improved the hollow space pyramid pool based on Deeplabv3 and applied it to the semantic segmentation of remote sensing images. Pan et al. [29] utilized the UNet network and introduced the channel attention mechanism and adversarial network for the extraction of buildings in remote sensing images.
However, deep learning methods have been less applied in the analysis of rooftop solar PV potential. Huang et al. [30] used a UNet network to detect buildings in Wuhan, China, from satellite maps and calculated PV potential by setting empirical coefficients without considering the building type and PV panel layout. Krapf et al. [31] used public, open, street map data and Google aerial imagery using two CNN networks to study building roofs in a small area of Munich, Germany. The orientation of each building was considered in the partition and the calculated PV potential results were compared with the 3D model results to verify the accuracy. Zhong et al. [32] proposed a city-scale PV potential estimation method for detecting building roofs in Nanjing (China) from Google images using Deeplabv3. The roof extraction model was improved. Xu Fuyuan proposed a method based on the combination of region segmentation and edge segmentation analysis to extract buildings in remote sensing images by using high-resolution images of Hangzhou University of Electronic Science and Technology obtained from Google Earth, preprocessed the target buildings using threshold segmentation and a Canny edge algorithm, and obtained good experimental results [33].
Urban buildings are dense. The building types are diverse and irregular. Roofs are usually accompanied by a large amount of equipment occupancy and a large number of elevator shafts. The shadow phenomenon caused by mutual shading between buildings is serious. However, the rural area is vast and the buildings are standardized, so photovoltaic power generation is booming in the countryside. The development of rooftop photovoltaic in the countryside can not only satisfy the energy needs of local farmers but also provide supplemental power for the city, promote the construction of clean energy in the countryside, and improve the living conditions of farmers.
Although scholars have conducted relevant research and achieved good results, there is a lack of a systematic, efficient, and suitable method for estimating the potential of rural rooftop PV for large-scale application in rural China. Therefore, for this paper, a deep learning method based on high-definition maps was chosen to evaluate the geographic potential, physical potential, and technical potential, and a set of PV potential estimation methods suitable for rural China was proposed.
The main contributions of this study are as follows:
  • This paper presents a system for estimating the potential of large-scale photovoltaics in rural China.
  • Based on high-definition map images, the technical potential was obtained through the “photovoltaic Power Station Design Code” (GB50797-2012).
  • The improved SegNeXt model was used for roof identification with high accuracy.
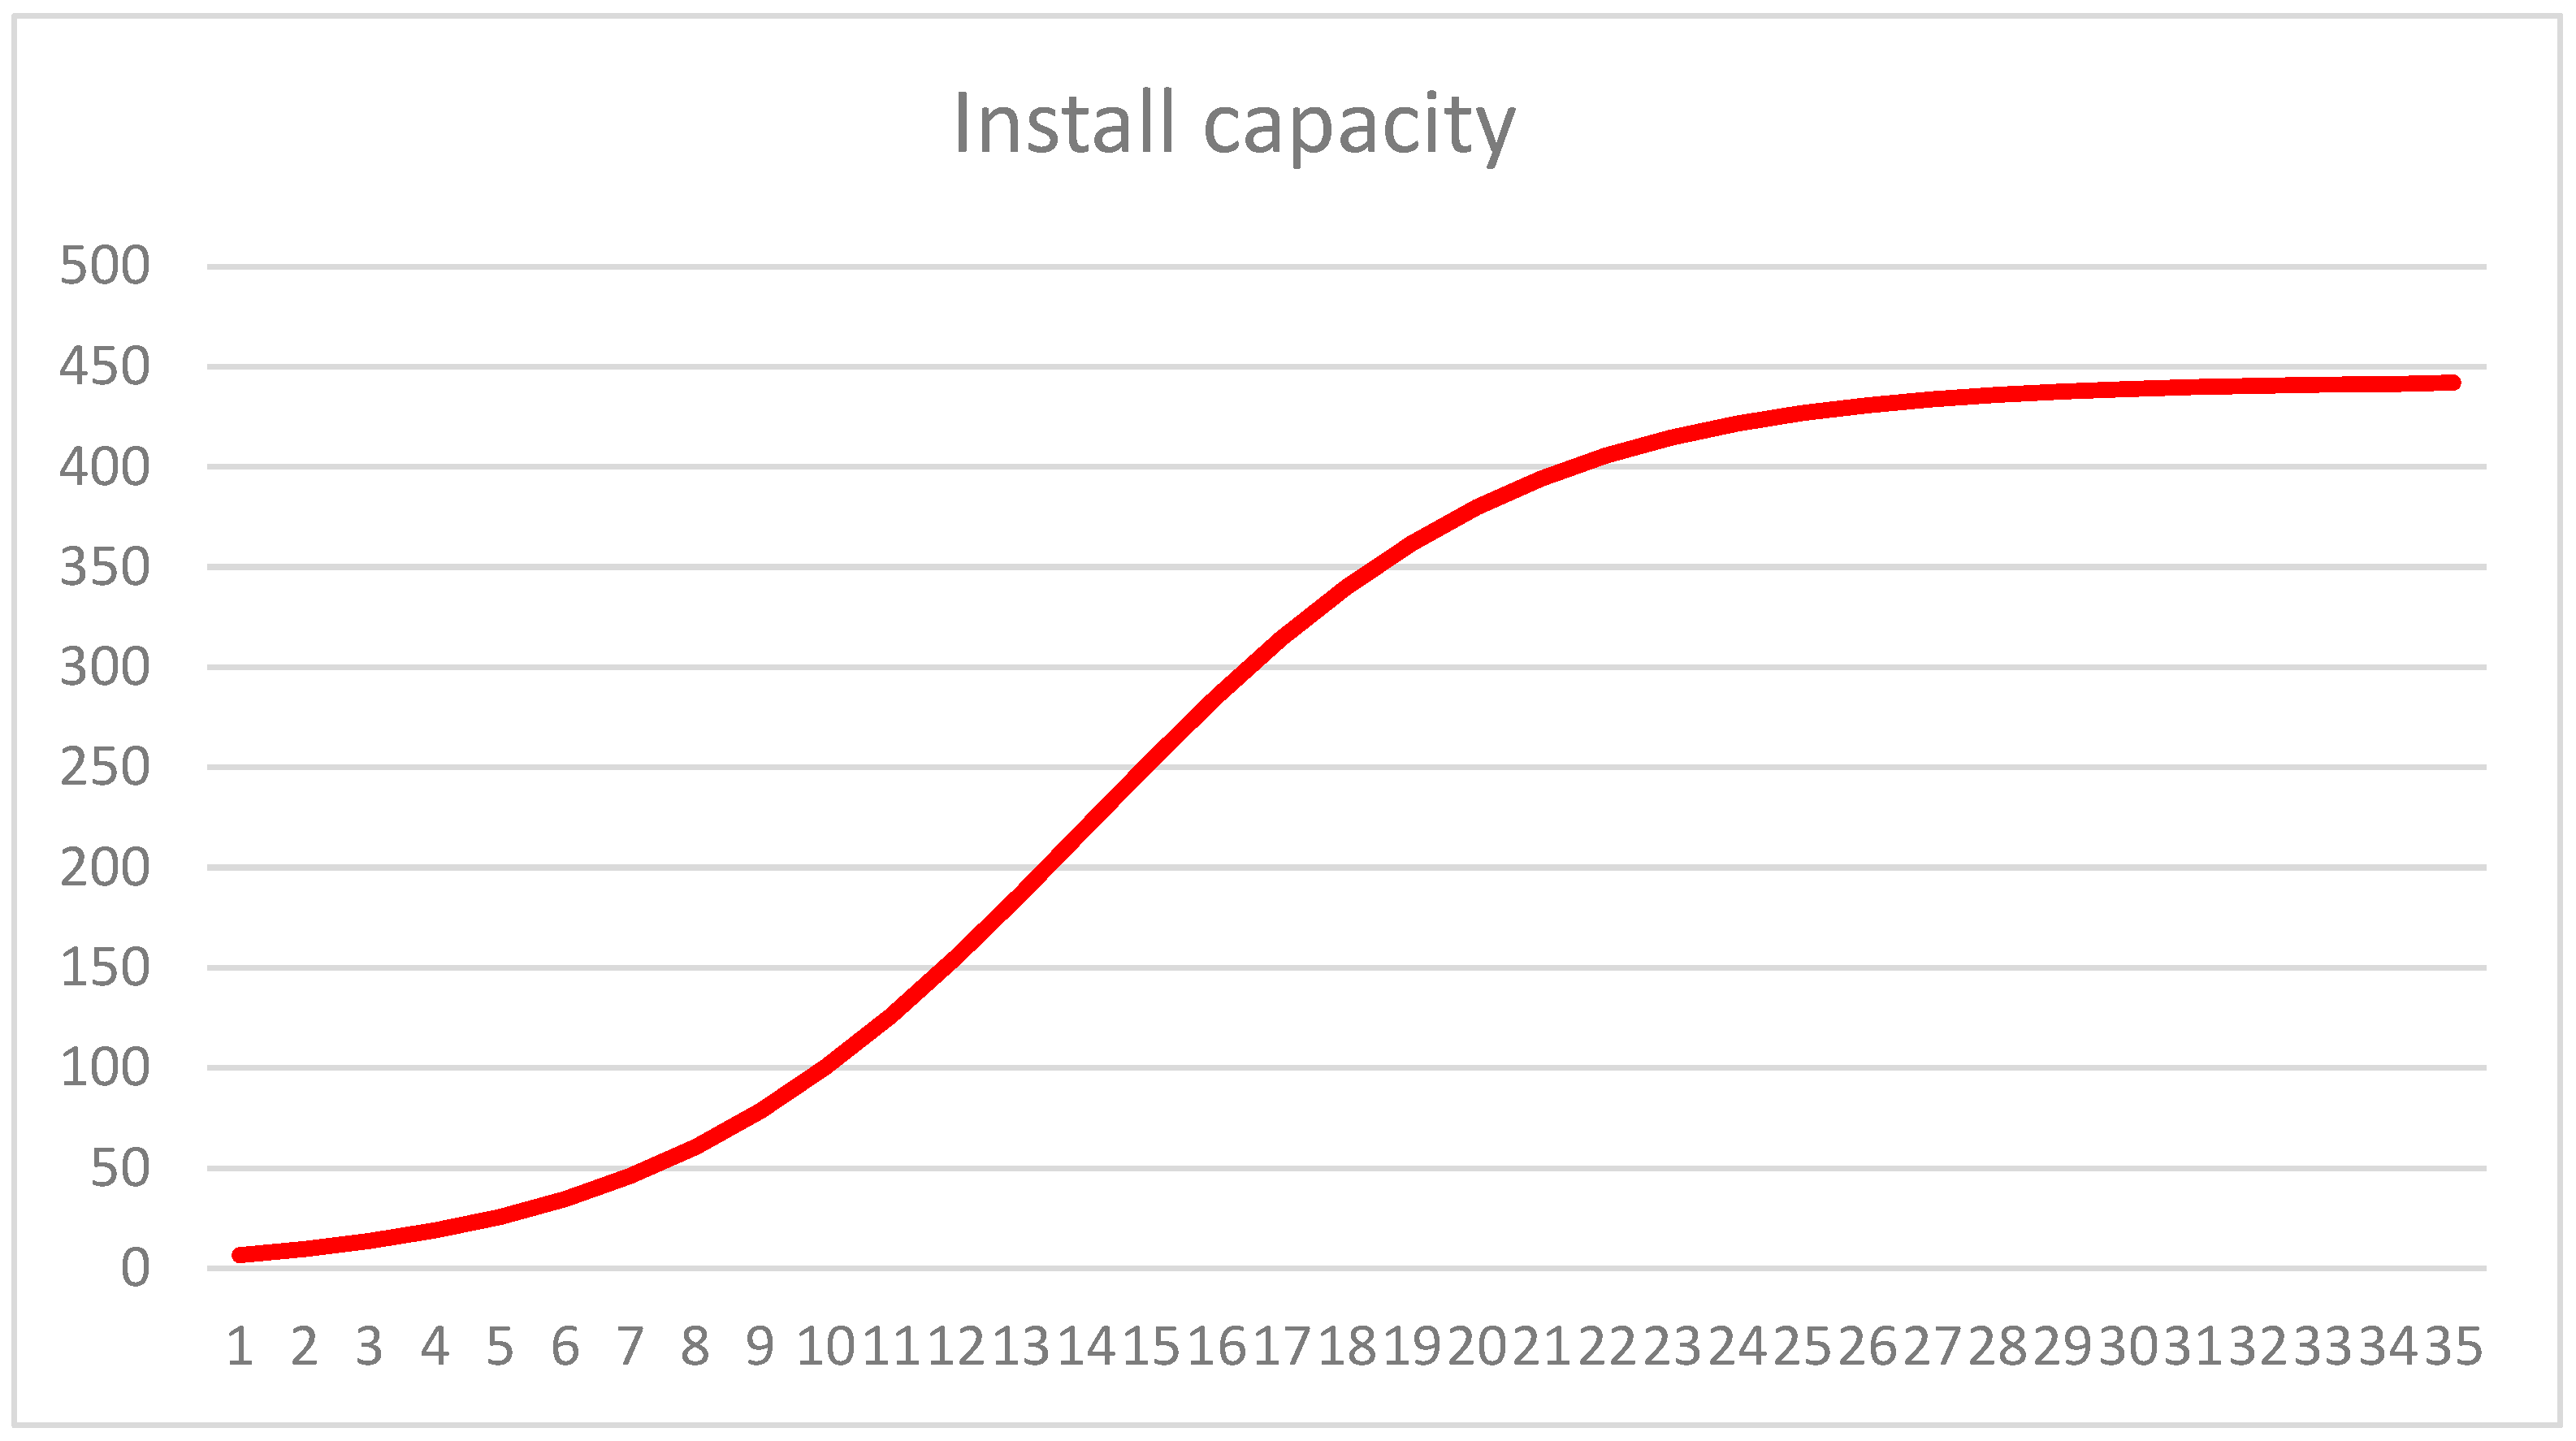
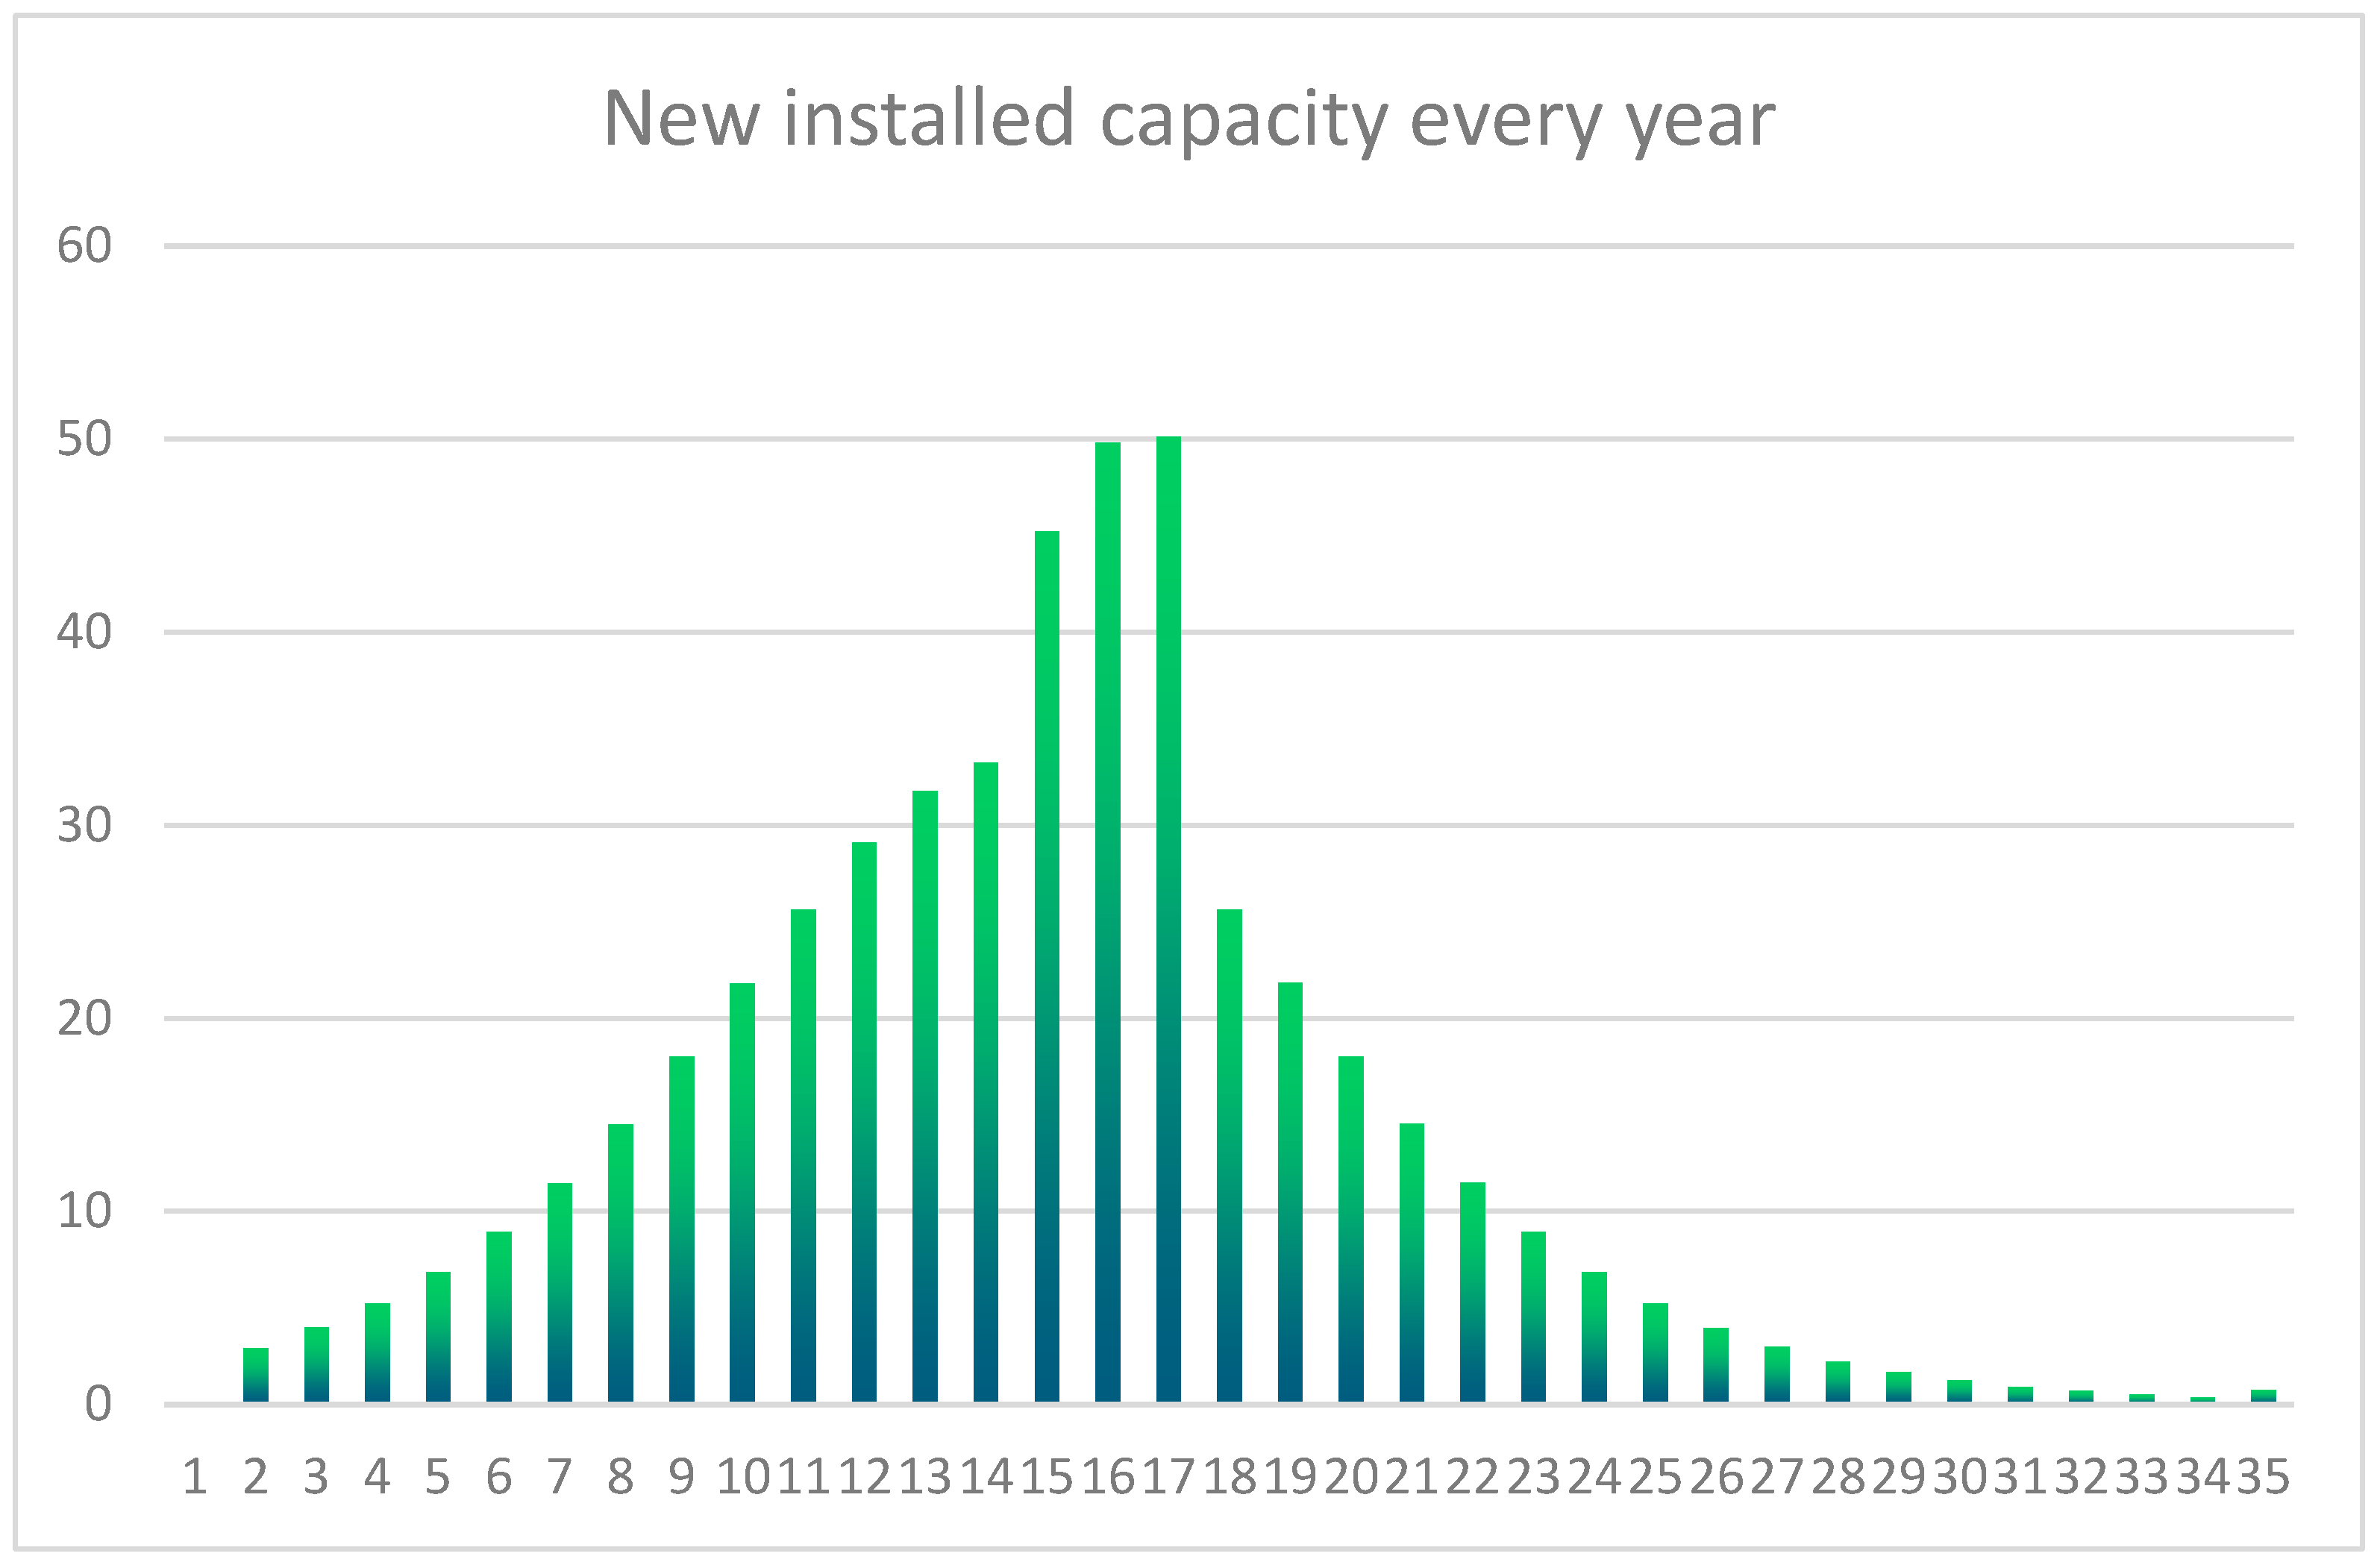
  • We used the Bass Diffusion Model to forecast installed capacity and derive the trend of installed capacity over the next 35 years, which is in line with China’s trend of “peak carbon and carbon neutrality”.
The rest of this paper is organized as follows: Section 2 presents the framework of the proposed method. Section 3 is devoted to the methodology. The case study and comparative analysis are provided and discussed in Section 4. The conclusion is given in Section 5.

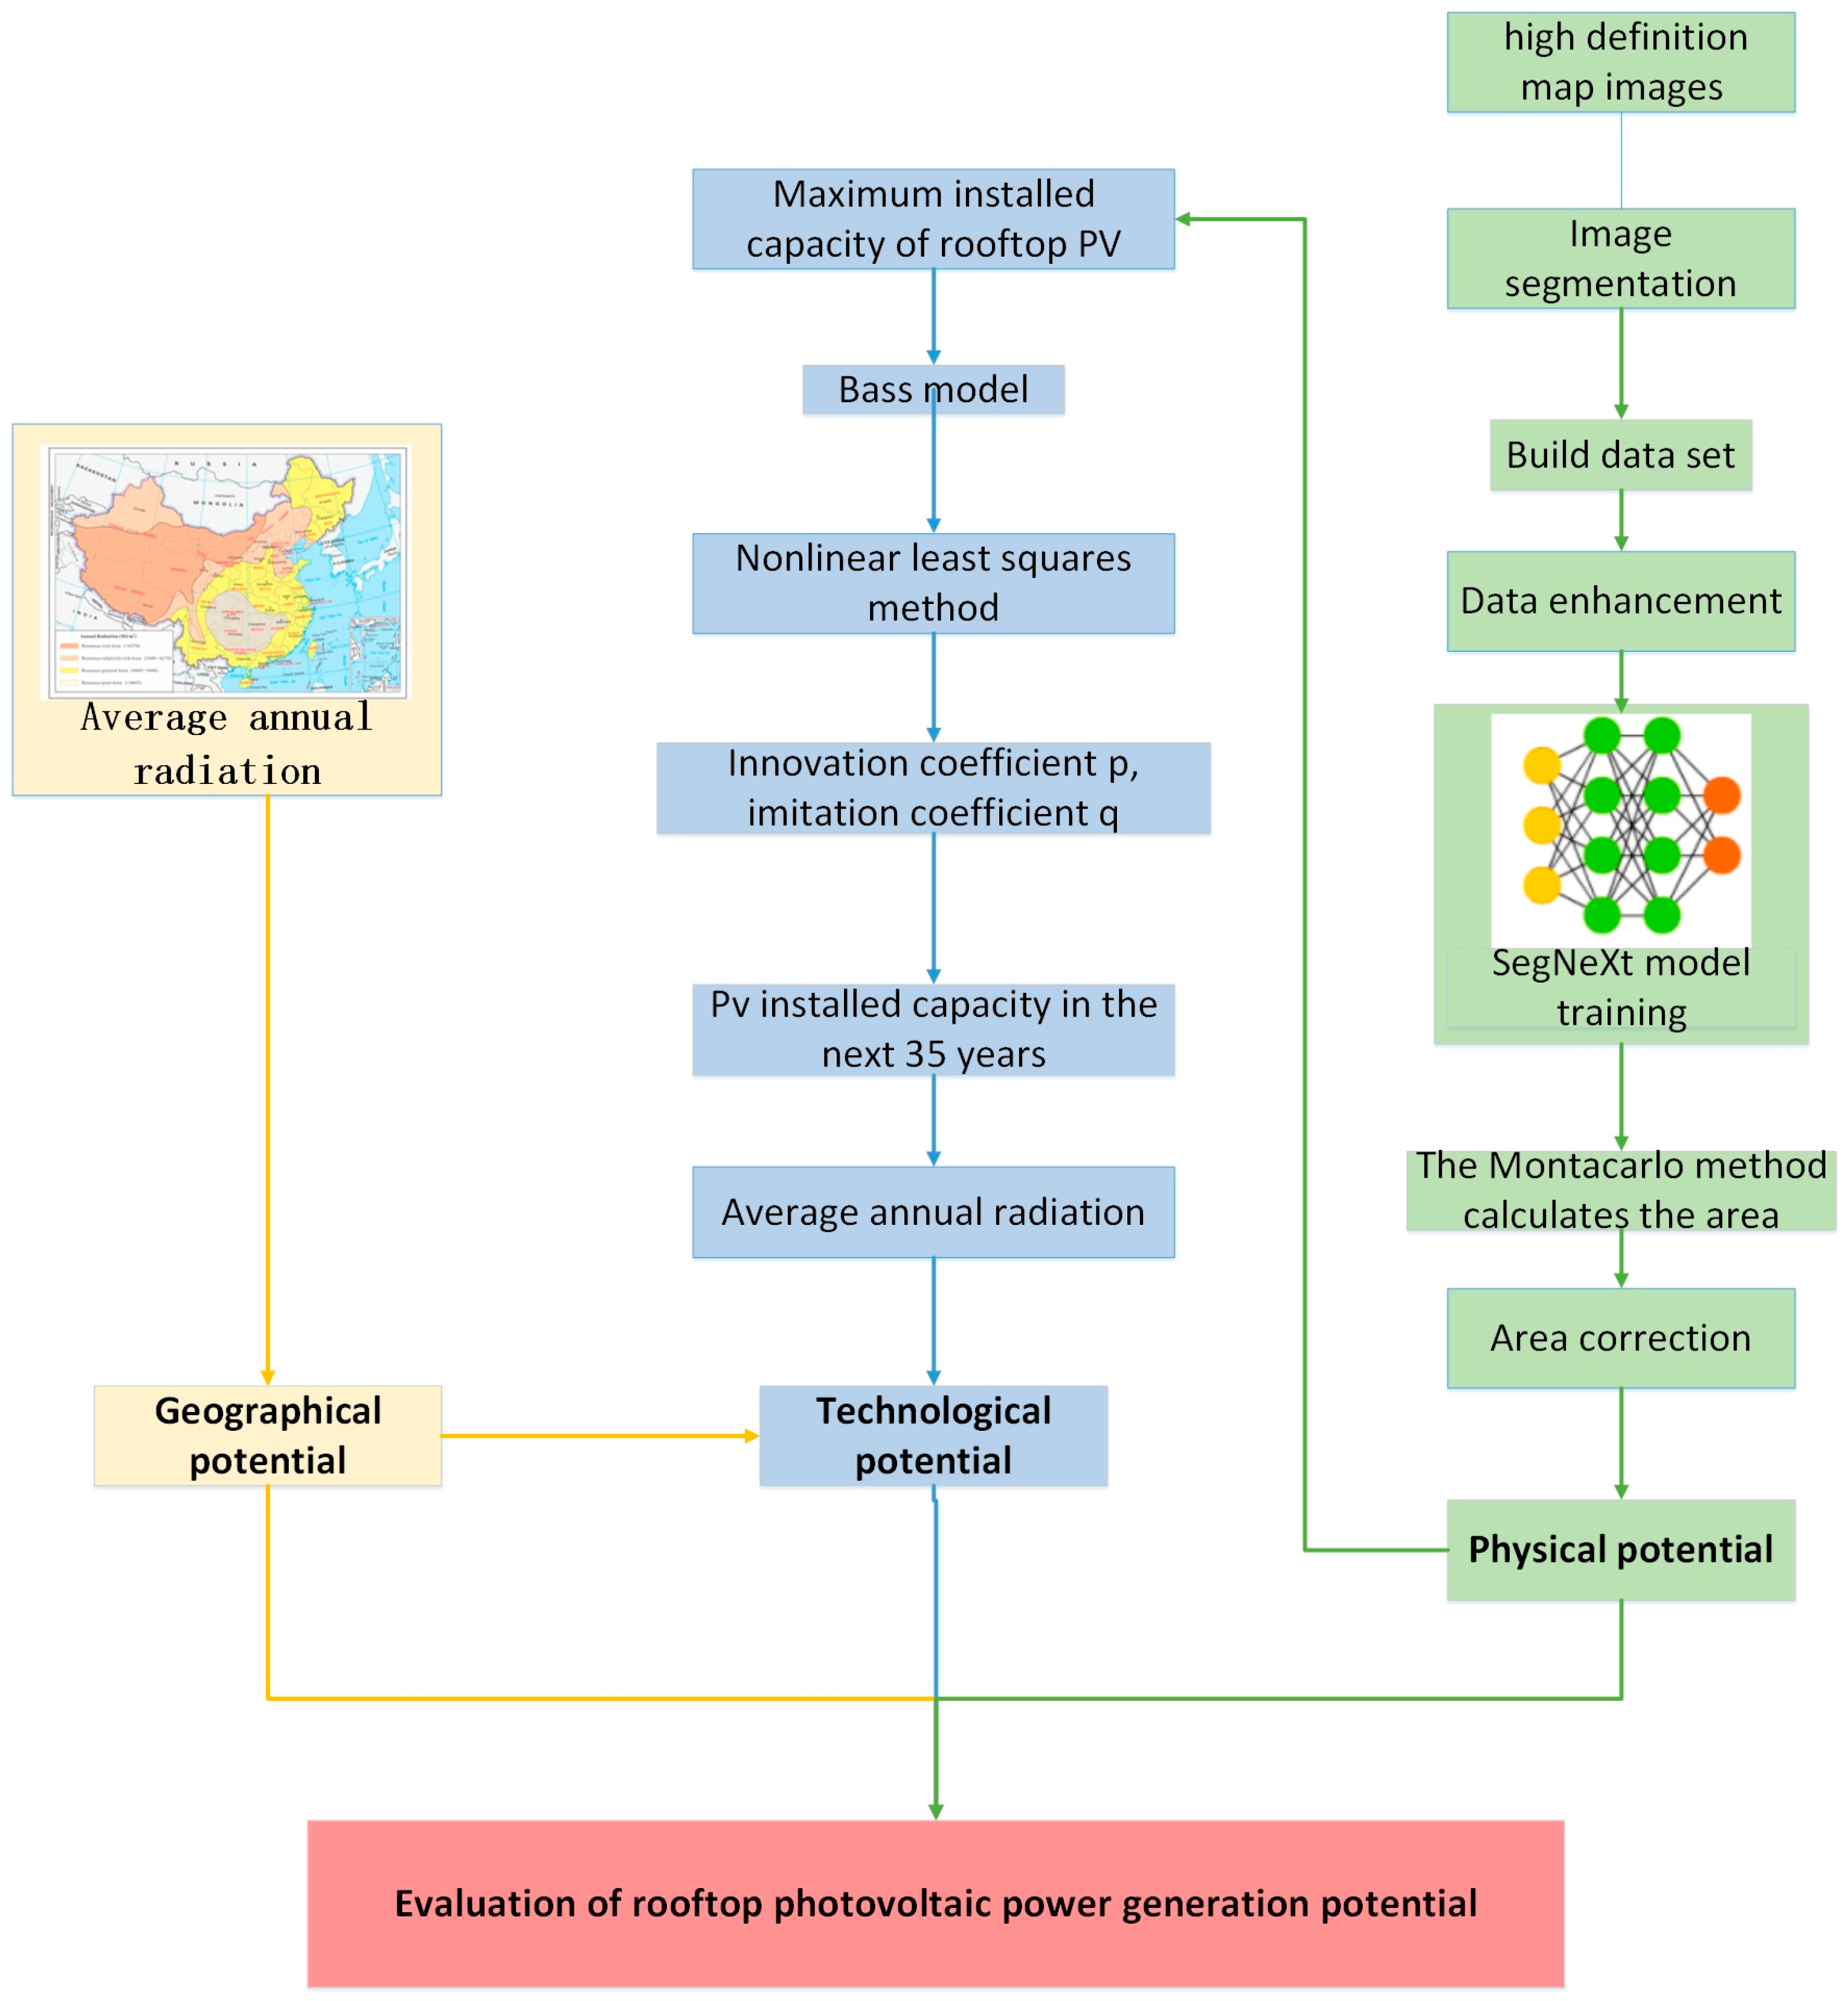
2. The Framework of the Proposed Methodology

The evaluation of rooftop PV utilization potential is mainly divided into three parts: geographical potential, physical potential, and technical potential. Figure 1 illustrates the framework of the proposed method.

3. Methodology

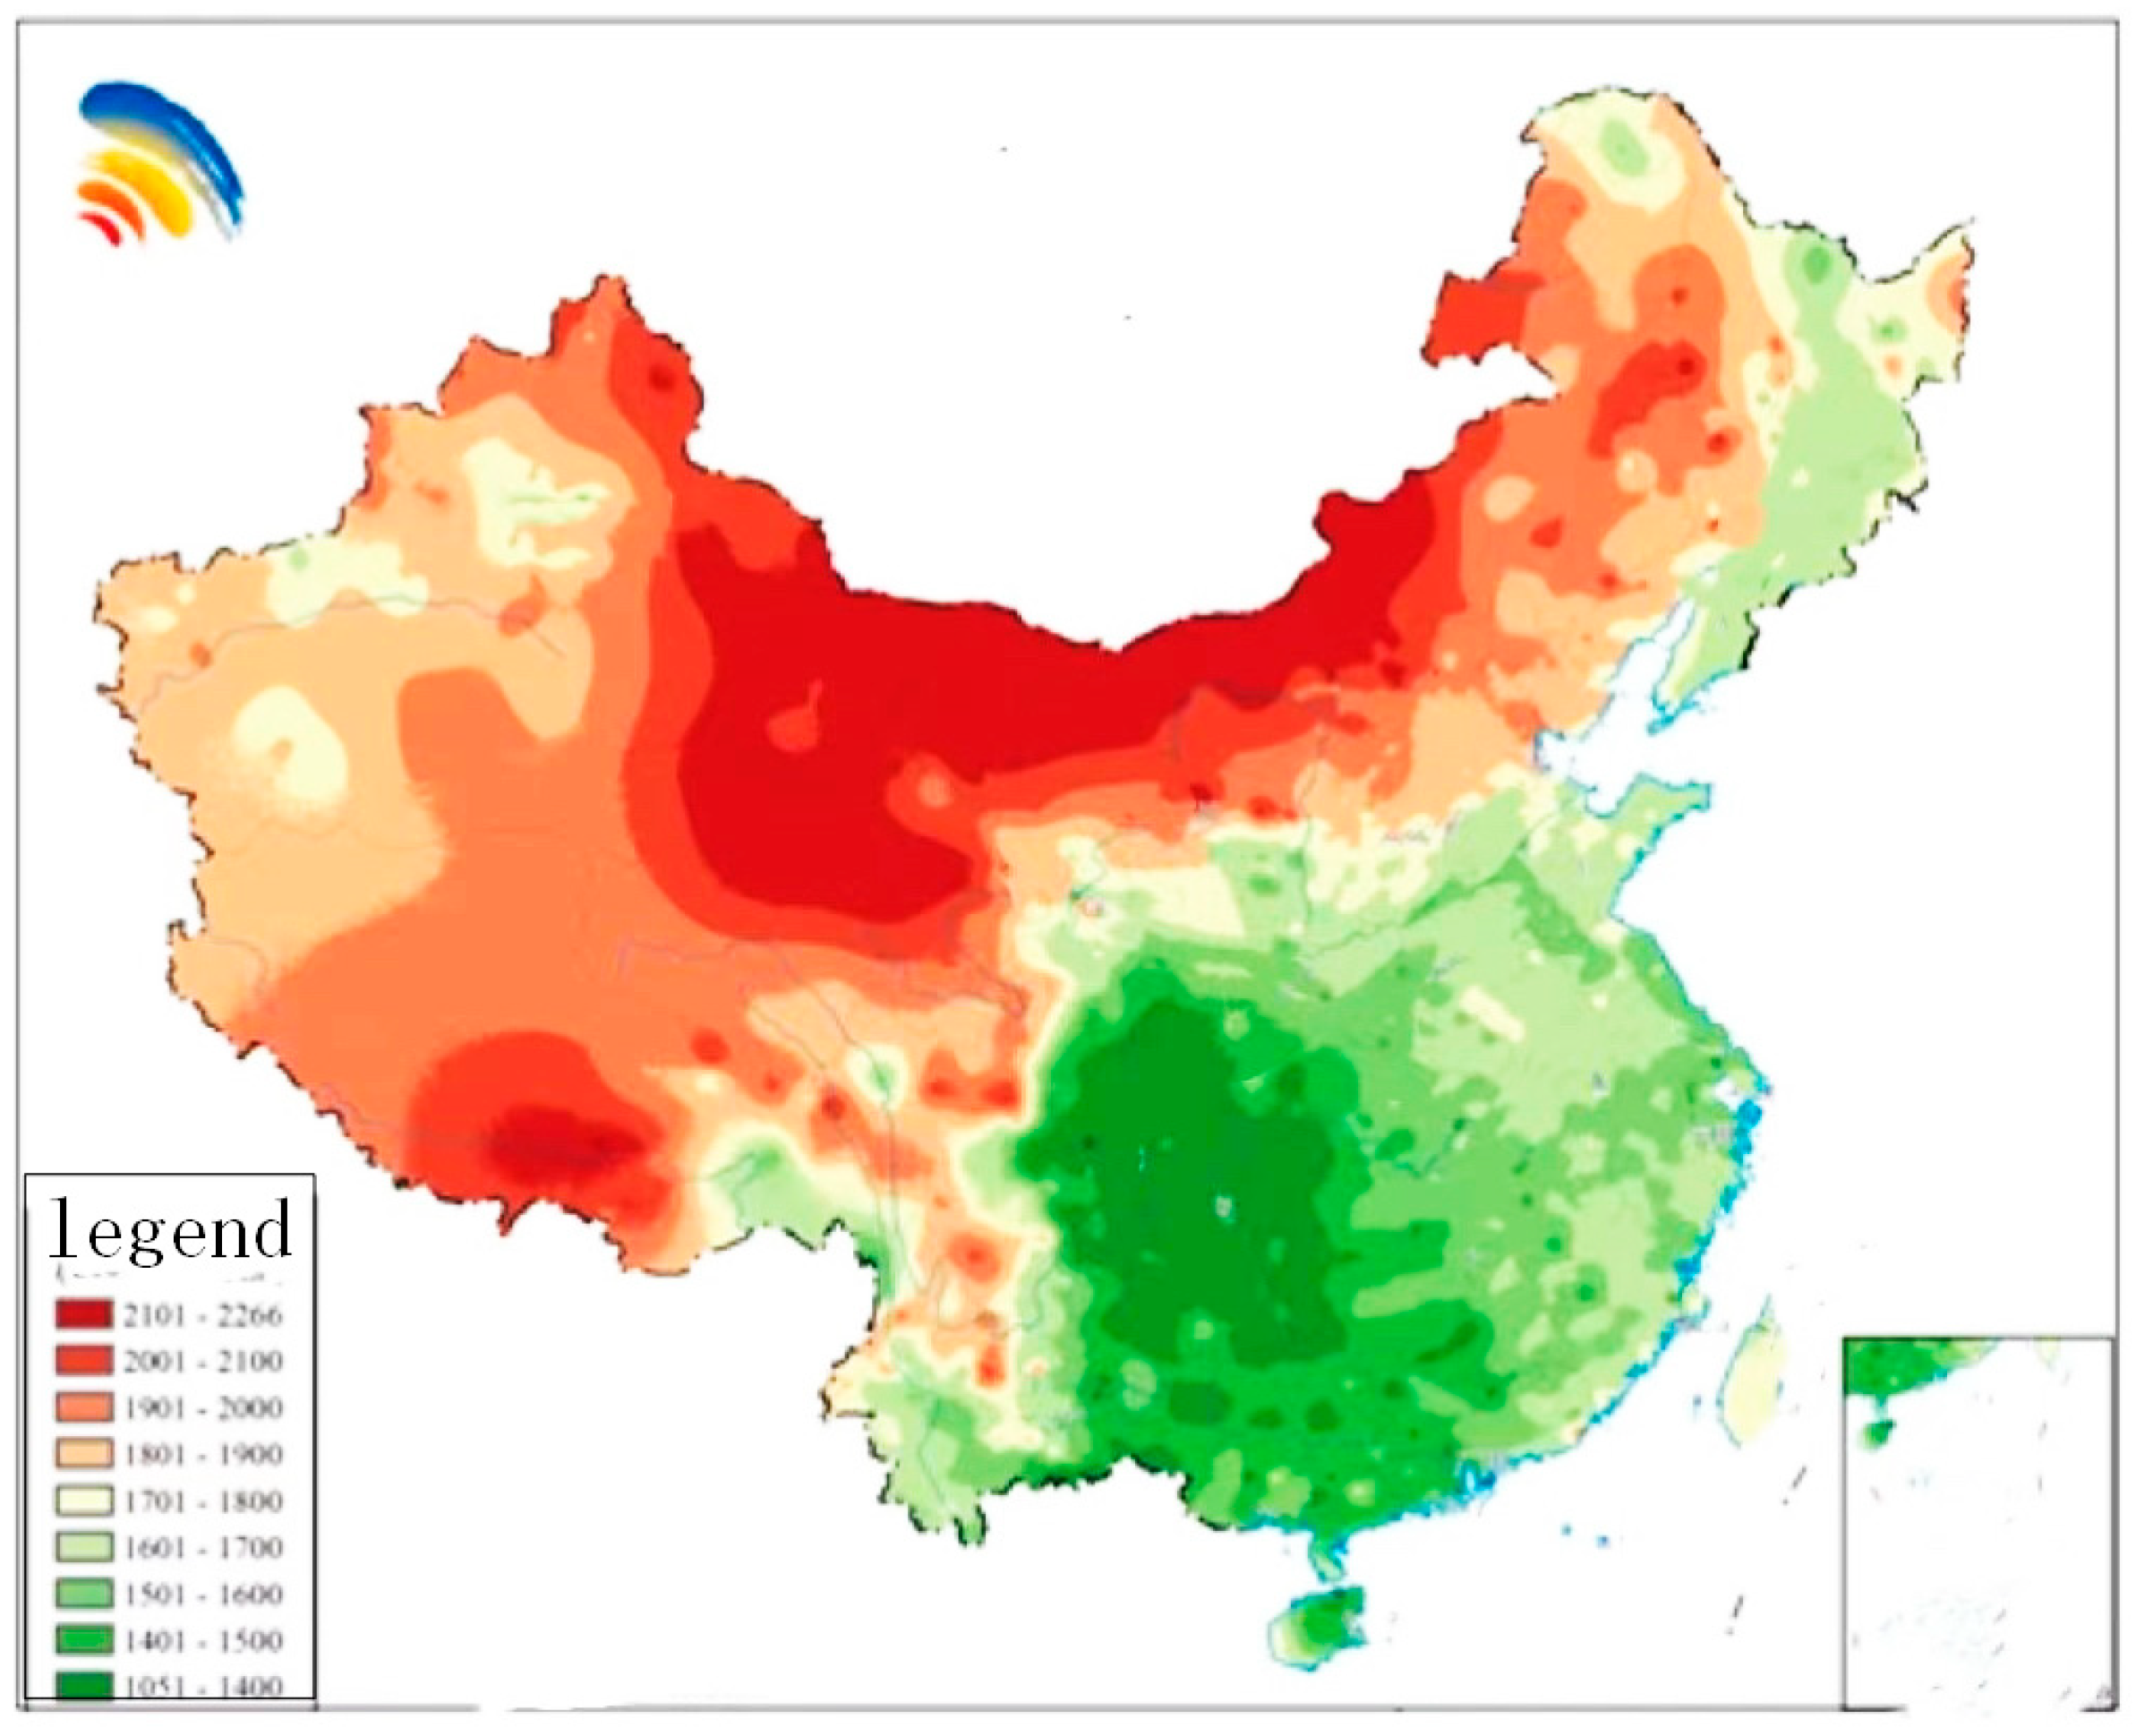
3.1. Assessment of the Geographical Potential of Rooftop Photovoltaics

The terrain of rooftop PV was the solar radiation potential of the study area. The study area was rural and the PV potential of the whole region was taken on a large scale. Therefore, the global average annual radiation for the region was used, which also provided theoretical support for the subsequent calculation of the technical potential.
The study area of this paper was Leizhou City, which is located south of the Tropic of Cancer and in the subtropics near the South China Sea. South of the Tropic of Cancer the latitude is low and the climate is subtropical humid monsoon. There is sufficient light and heat, with average annual sunshine of 2003.6 h. Figure 2 shows the distribution of the total annual horizontal radiation exposure in the country in 2022, as published by the National Energy Administration [34]. The country can be categorized by total annual horizontal radiation exposure into the following four categories:
  • Areas with the richest solar resources: average solar radiation greater than 1750 kWh/m2.
  • Areas with very rich solar resources: solar radiation between 1400 kWh/m2 and approximately 1750 kWh/m2.
  • Areas with abundant solar resources: the radiation ranges from 1050 kWh/m2 to approximately 1400 kWh/m2.
  • Areas with average solar energy resources, with radiation values less than 1050 kWh/m2.
The east of Guangdong is an area rich in solar energy resources, and an average annual radiation of 1500 kWh/m2 was selected for this paper.

3.2. Evaluation of the Physical Potential

The physical potential refers to the roof area that was used for installation in the study area.
In recent years, SegNeXt and improved SegNeXt networks have been widely used in the fields of healthcare, speech recognition, translation, autonomous driving, and precision marketing with good results. Compared with other semantic segmentation networks, SegNeXt has fewer training parameters, thus using more efficient inference storage and computation time to obtain good segmentation results.
For this paper, the improved SegNeXt semantic segmentation method was used to evaluate the physical potential.

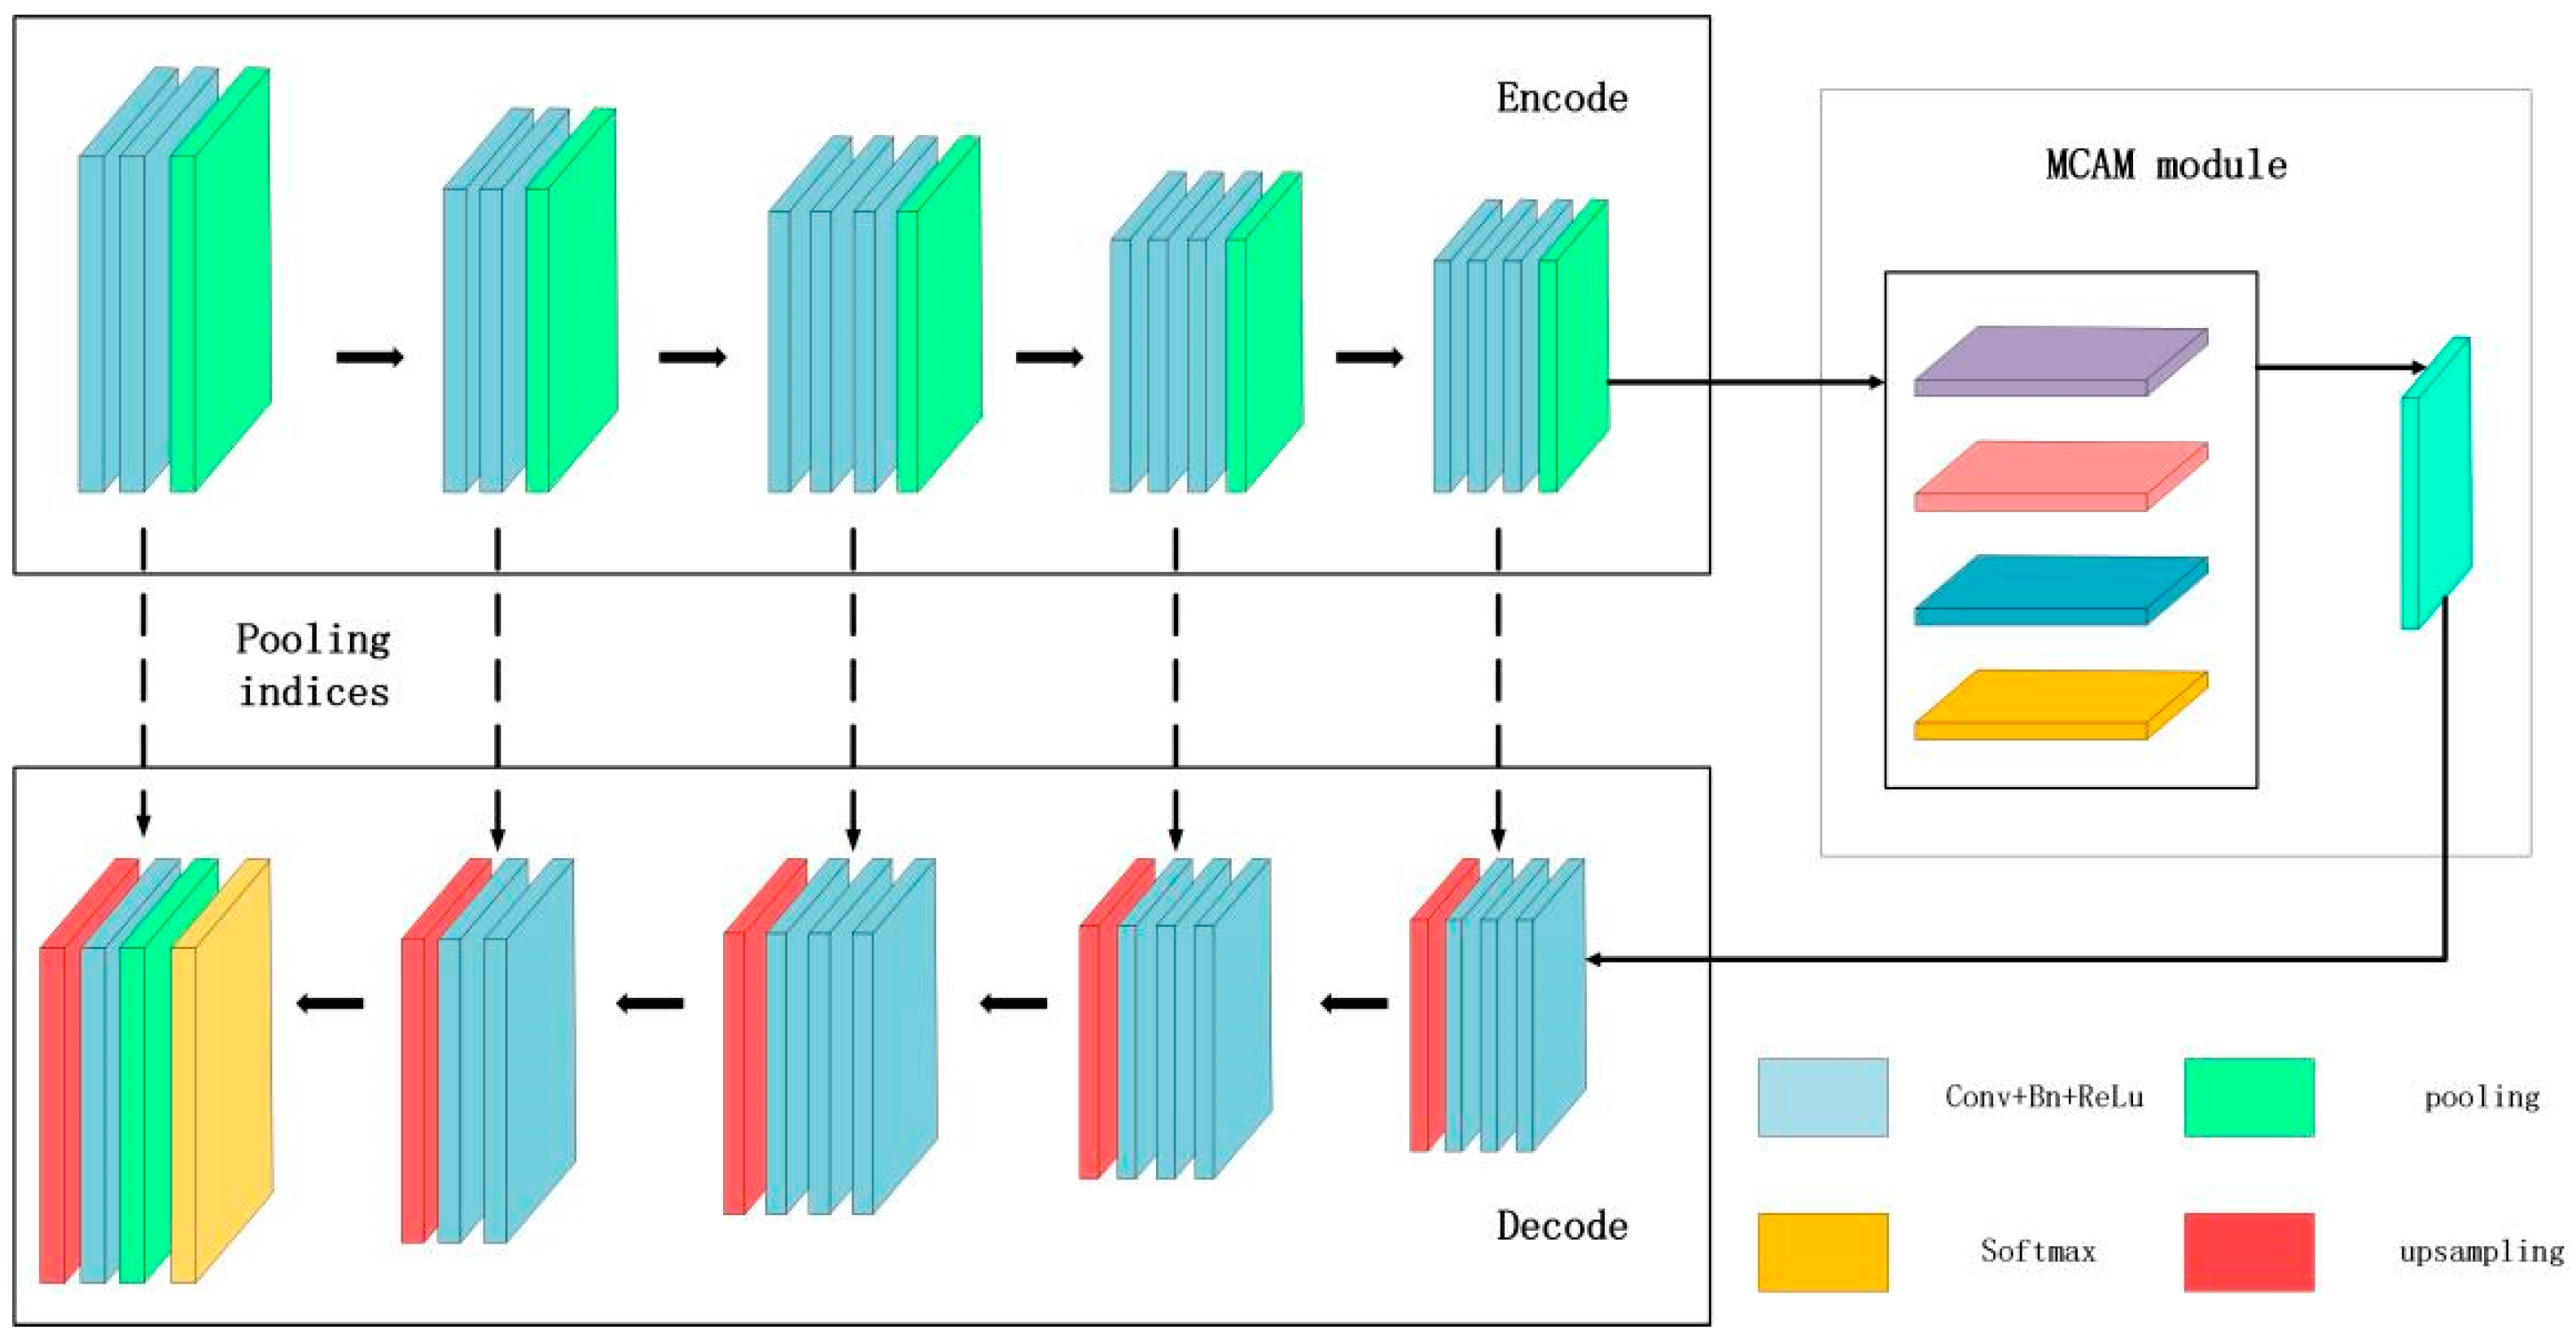
3.2.1. Improved SegNeXt

The SegNeXt network is a fully convolutional neural network structure for multi-class semantic segmentation; it has been widely used in the field of computer vision. The network architecture is shown in Figure 3. The core components of the network consist of an encoder network, a decoder network, and a pixel-level classification layer. The whole network contains 10 layers, where Level 1–Level 5 are the encoder layers and Level 6–Level 10 are the decoder layers. SegNeXt uses maximum pooling for down-sampling and up-sampling to recover the image size, which helps to reduce the training parameters of the network and greatly improves the network’s operation speed.
The classical SegNeXt network model uses a large number of convolutional kernels; this slows down the training of the whole network and even disappears the gradient, greatly affecting its performance. In high-resolution remote sensing images, the scale of buildings varies greatly and the background interference is complex and diverse. The traditional SegNeXt algorithm is often prone to problems such as buildings with holes, imprecise edges, and attachments and poor generalization ability when dealing with different types of buildings when completing the building extraction task. For this reason, this work added a multi-scale contextual attention module (MCAM) in which the null convolution and self-attention mechanism were introduced to enhance the extraction of features at different scales and the dependence between distant pixels.
The self-attention mechanism was proposed by the Google machine translation team [35]; it was initially used mainly in natural language processing and has also been widely used in computer vision direction due to its ability to integrate contextual information. Self-attention can establish global dependencies through all feature information so as to capture the most important information needed for the task in the global information. Figure 4 shows the multi-scale contextual attention module.
In conv representation convolution, R stands for expansion rate. In reshape representation remolding, the feature graph F0 output by the network is passed through three cavity convolutions with expansion coefficients of 2, 4, and 6 in parallel. The convolution kernel sizes are all 3 × 3, to obtain three feature graphs of different scales, and the feature graph F is obtained by concatenation and fusion. The feature graph F of multi-scale fusion is obtained by using a 1 × 1 convolution operation to obtain new feature graphs F1, F2, F3, and  F 1 , F 2 R C / 8 × H × W . The dimensions are then converted to two dimensions,  R C / 8 × N  and N = H × W, to facilitate subsequent matrix multiplication. The transposed matrix F1 is multiplied by the matrix F2, and a spatial weight graph is obtained through the softmax function,  η = R N × N . The calculation formula is as follows:
η j i = e x p F 1 i , F 2 j i = 1 N e x p F 1 i , F 2 j
where  η j i  represents the influence of position i on position j on the feature map. The closer the features of the two locations are, the greater the correlation is. This degree of correlation forms a dependency between any two elements of the global context.
At the same time, the feature map F3 is reshaped into two-dimensional data, C × N, matrix multiplication is performed for  η  and F3, and the size is transformed to  R C × H × W . Finally, the result is multiplied by parameters and summed with F and F0 to obtain the output result Fout.
F o u t = β i = 1 N η j i , F 3 j + F j + F 0 j
where the feature plot Fout is the weighted sum of the original plot F0 with every other position. Therefore, MCAM can aggregate multi-scale contextual information in a targeted manner according to the spatial attention graph, so that similar semantic features promote each other, which effectively enhances the intra-class closeness and semantic consistency and efficiently reduces the construction-deficiency error detection in the segmentation task due to the insufficient comprehension of semantic information. The improved SegNeXt network structure is shown in Figure 5.

3.2.2. Monte Carlo Algorithm

Since the boundaries of the roof targets detected by the depth network are not necessarily regular maps, the area cannot be calculated using common formulas such as the length × width of a rectangle. Therefore, the Monte Carlo method was used to calculate the area; this is a calculation method based on mathematical proofs of probabilistic statistics and is suitable for calculating the area of complex shapes. The calculation formula is as follows:
S t = P r P a l l × S a l l
where Pr represents the number of pixels belonging to the roof part of the image, Pall represents the total number of pixels of the image, Sall represents the real area corresponding to the image, and St represents the real area belonging to the roof part of the image.

3.2.3. Area Correction

The actual floor area of a roof can be affected by many factors, including (1) shading from other parts of the roof or neighboring buildings and trees; (2) occupancy of roofing equipment, such as ventilation equipment, heating, air conditioning, etc.; (3) the slope and orientation of the roof; and (4) the mounting and tilting of the PV panels themselves.
According to the national code for Design of Photovoltaic Power Stations (GB50797-2012) [36]:
  • Equipment coefficient (B1): excluding the area proportion of HVAC equipment, water tank, chimney;
  • Solar thermal energy coefficient (B2): the area proportion of the surface occupied by the solar hot water system is excluded;
  • The effective area coefficient of the photovoltaic module (B3): the ratio of the surface area of the photovoltaic module to the surface area of the roof, taking into account the gap between the photovoltaic modules to avoid mutual occlusion and reflection.
According to the previous domestic installation design experience in China, the values of B1, B2, and B3 are 0.7, 0.9, and 0.53, respectively. The area correction formula obtained is as follows:
S r = S t × B 1 × B 2 × B 3

3.3. Evaluation of the Technological Potential

3.3.1. Power Generation Potential of Photovoltaic System

The technical potential of a PV system refers to the installed power generation potential of the available area of PV modules within a certain period of time. According to the national standard Design Code for Photovoltaic Power Plants (GB50797-2012), the following calculation model for the power generation of PV systems can be obtained:
E p = H A × S r × r × K × 1 R a N 1
where HA is the global horizontal annual cumulative solar radiation value of the building area, Sr is the installable area of the photovoltaic module, and N is the life cycle of the photovoltaic system; the life of photovoltaic systems is generally 25 years. The r, K, and Ra are, respectively, the photoelectric conversion efficiency of the photovoltaic system, the comprehensive efficiency coefficient, and the attenuation rate of the photovoltaic system, which were set as 19.1%, 86%, and 1.4% for this paper. From this, the power generation potential of the photovoltaic system can be calculated.

3.3.2. Bass Diffusion Model

In order to predict the installation trend of rooftop PV in the coming years, a demand model was chosen for forecasting. Among many demand models, the Bass curve model [37] is the most widely used of the group; it has the advantages of simple concepts and parameter settings, a strong explanatory power, and the non-repeated purchasing of rooftop PV, which can eliminate the interference of repeated purchasing behavior. The specific model is shown in Equation (6). The curve shapes of the Bass accumulation curve and density curve are shown in Figure 6.
n t = d N t d t = p m N t + q N t m m N t = p + q N t m m N t
f t = n t m , F t = N t m
N(t) represents the installed rooftop PV users at time t, n(t) represents the rooftop PV users at time t, F(t) represents the probability of installed rooftop PV users in the total potential users at time t, f(t) represents the probability density function of installed rooftop PV users in the total potential users at time t, m is the installed potential of rooftop PV, p represents the innovation coefficient (the coefficient of installation influenced by mass media), and q represents the imitation coefficient (the coefficient of purchase influenced by word of mouth or by those who have installed the system).

3.4. Error Analysis

The confusion matrix was used to evaluate the extraction effect of the buildings with the following specific metrics: Overall Accuracy (OA), Precision Rate (PR), Recall Rate (RE), F1 Score (F1), and Mean Intersection Ratio (mIoU). The confusion matrix adopts a tabular structure: the first row indicates the prediction result Positive, and the second row indicates the prediction result Negative; the first column indicates that the judgment made is True, and the second column indicates that the judgment is False, resulting in the four results: TP, FP, TN, and FN, as shown in Table 1.
  • True Positive (TP): instances of the positive class are predicted to be positive; the roof of the building is correctly identified as the roof of the building;
  • False Negative (FN): instances of the positive class are predicted to be negative; the roof of the building is incorrectly identified as the background;
  • False Positive (FP): instances of the negative class are predicted to be positive; the background is incorrectly identified as the roof of a building;
  • True Negative (TN): an instance of a negative class is predicted to be a negative class; the background is correctly identified as the background.
Overall accuracy is the proportion of the total observations judged to be true in the classification model:
O A = T P + T N T P + T N + F P + F N
Accuracy is a measure of the probability that all Positive results agree with the state of fact, that is, True. The calculation formula is as follows:
P R = T P T P + F P
The recall rate measures how many instances of True status are successfully judged Positive. The calculation formula is as follows:
R E = T P T P + F N
The aim of the F1 score is to find a balance between accuracy and recall, calculated as follows:
F 1 = 2 × P R × R E P R + R E
The calculation method of mIoU is as follows:
m I o U = T P T P + F N + F P

4. Results and Discussion

4.1. Physical Potential of Rooftop Photovoltaics

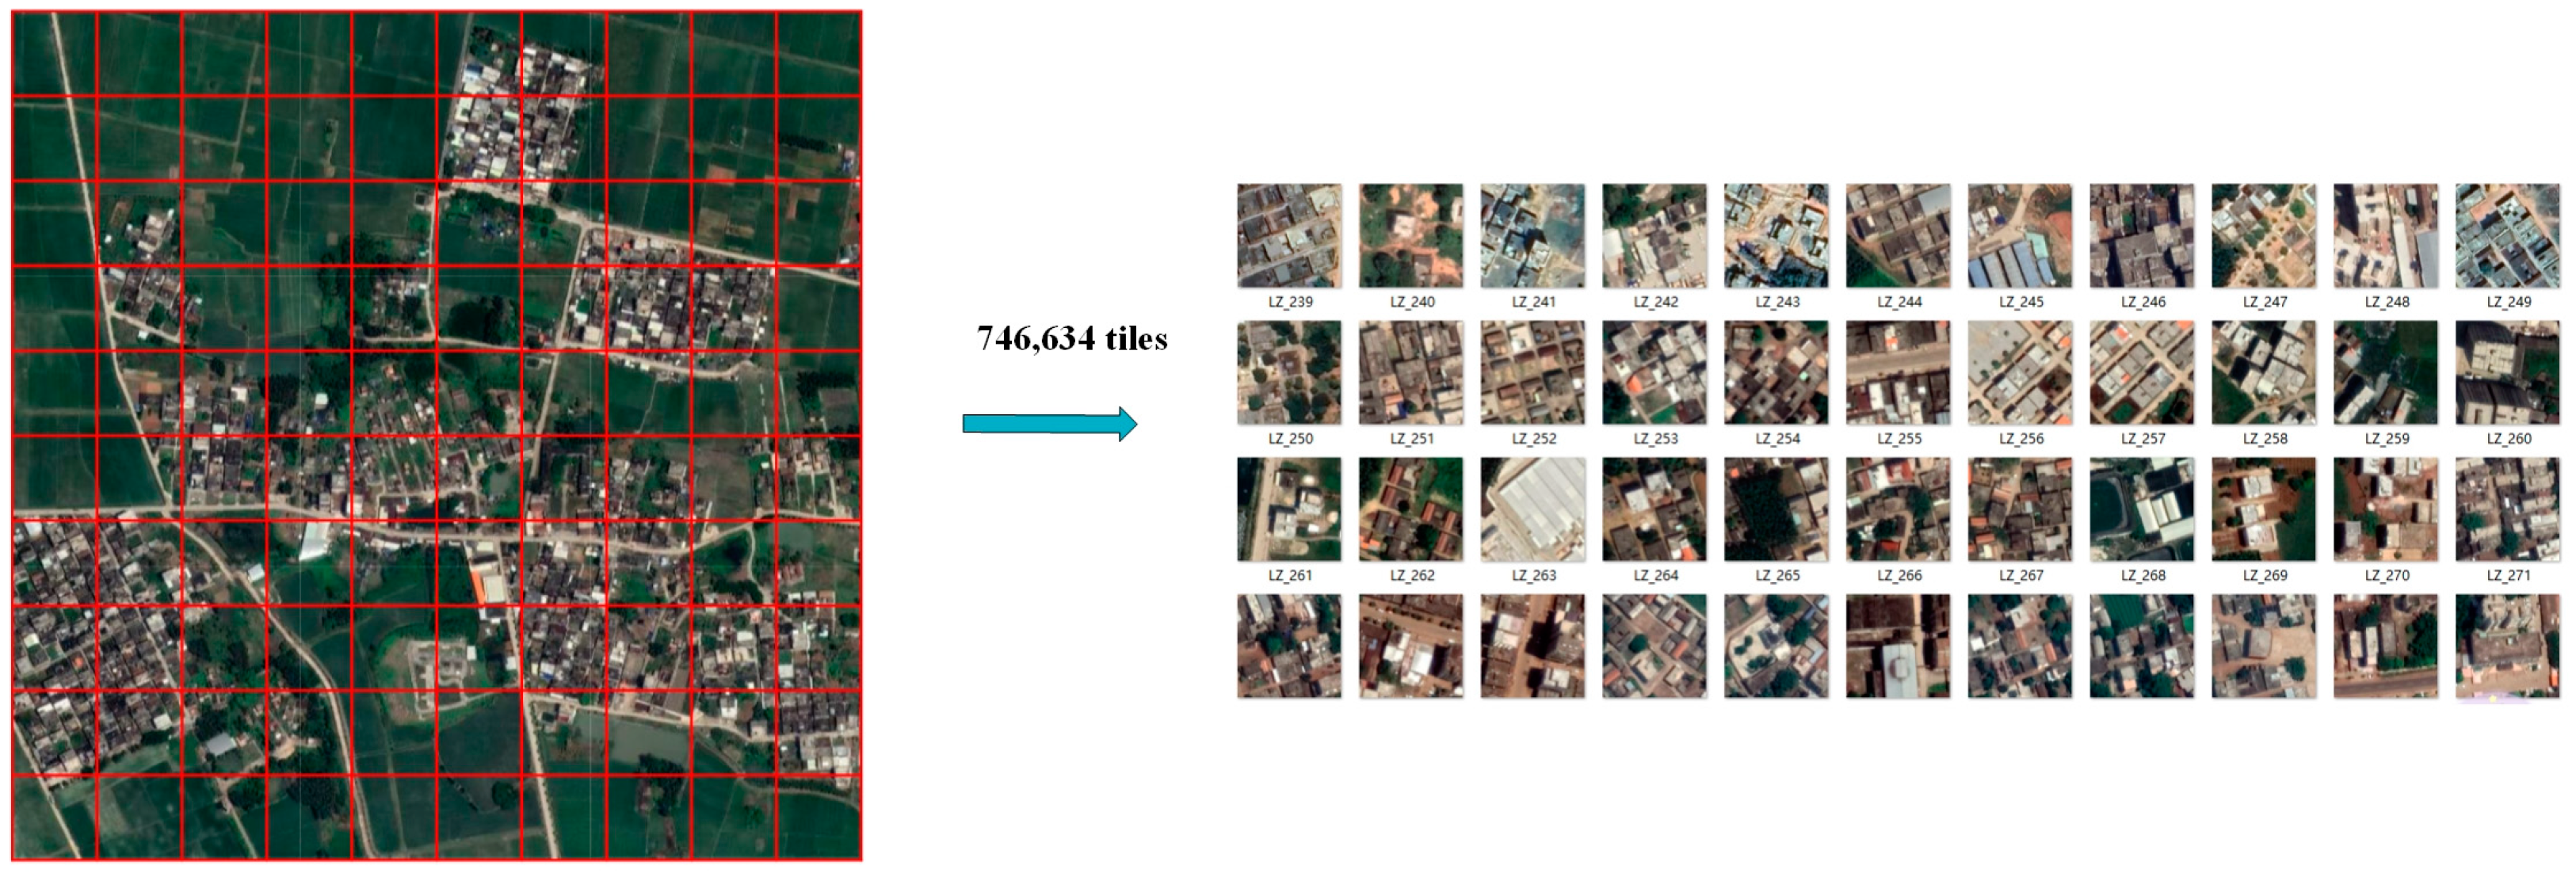
4.1.1. Data Acquisition

For this paper, Leizhou City was selected as the study object, and the 19-layer high-definition map image was downloaded through the BigeMap map downloader. Due to the large size of the entire 19-layer satellite image of the study area, if the entire image was directly input without processing, it may have resulted in insufficient memory for successful prediction. To solve this problem, this project cut the HD satellite map image of the study area into small tiles of the same size, from north to south and then from west to east, using a fixed sliding step. For this paper, the tiles were cut into 256 × 256 tiles. If the size of the image was not a multiple of 256, the edges were filled with 0 and filled with black. A total of 746,634 tiles with a 256 × 256 resolution were cut for Leizhou City. The pixel resolution of the 19-layer map was 0.031 m2. Figure 7 shows the image cropping of the Leizhou HD map.

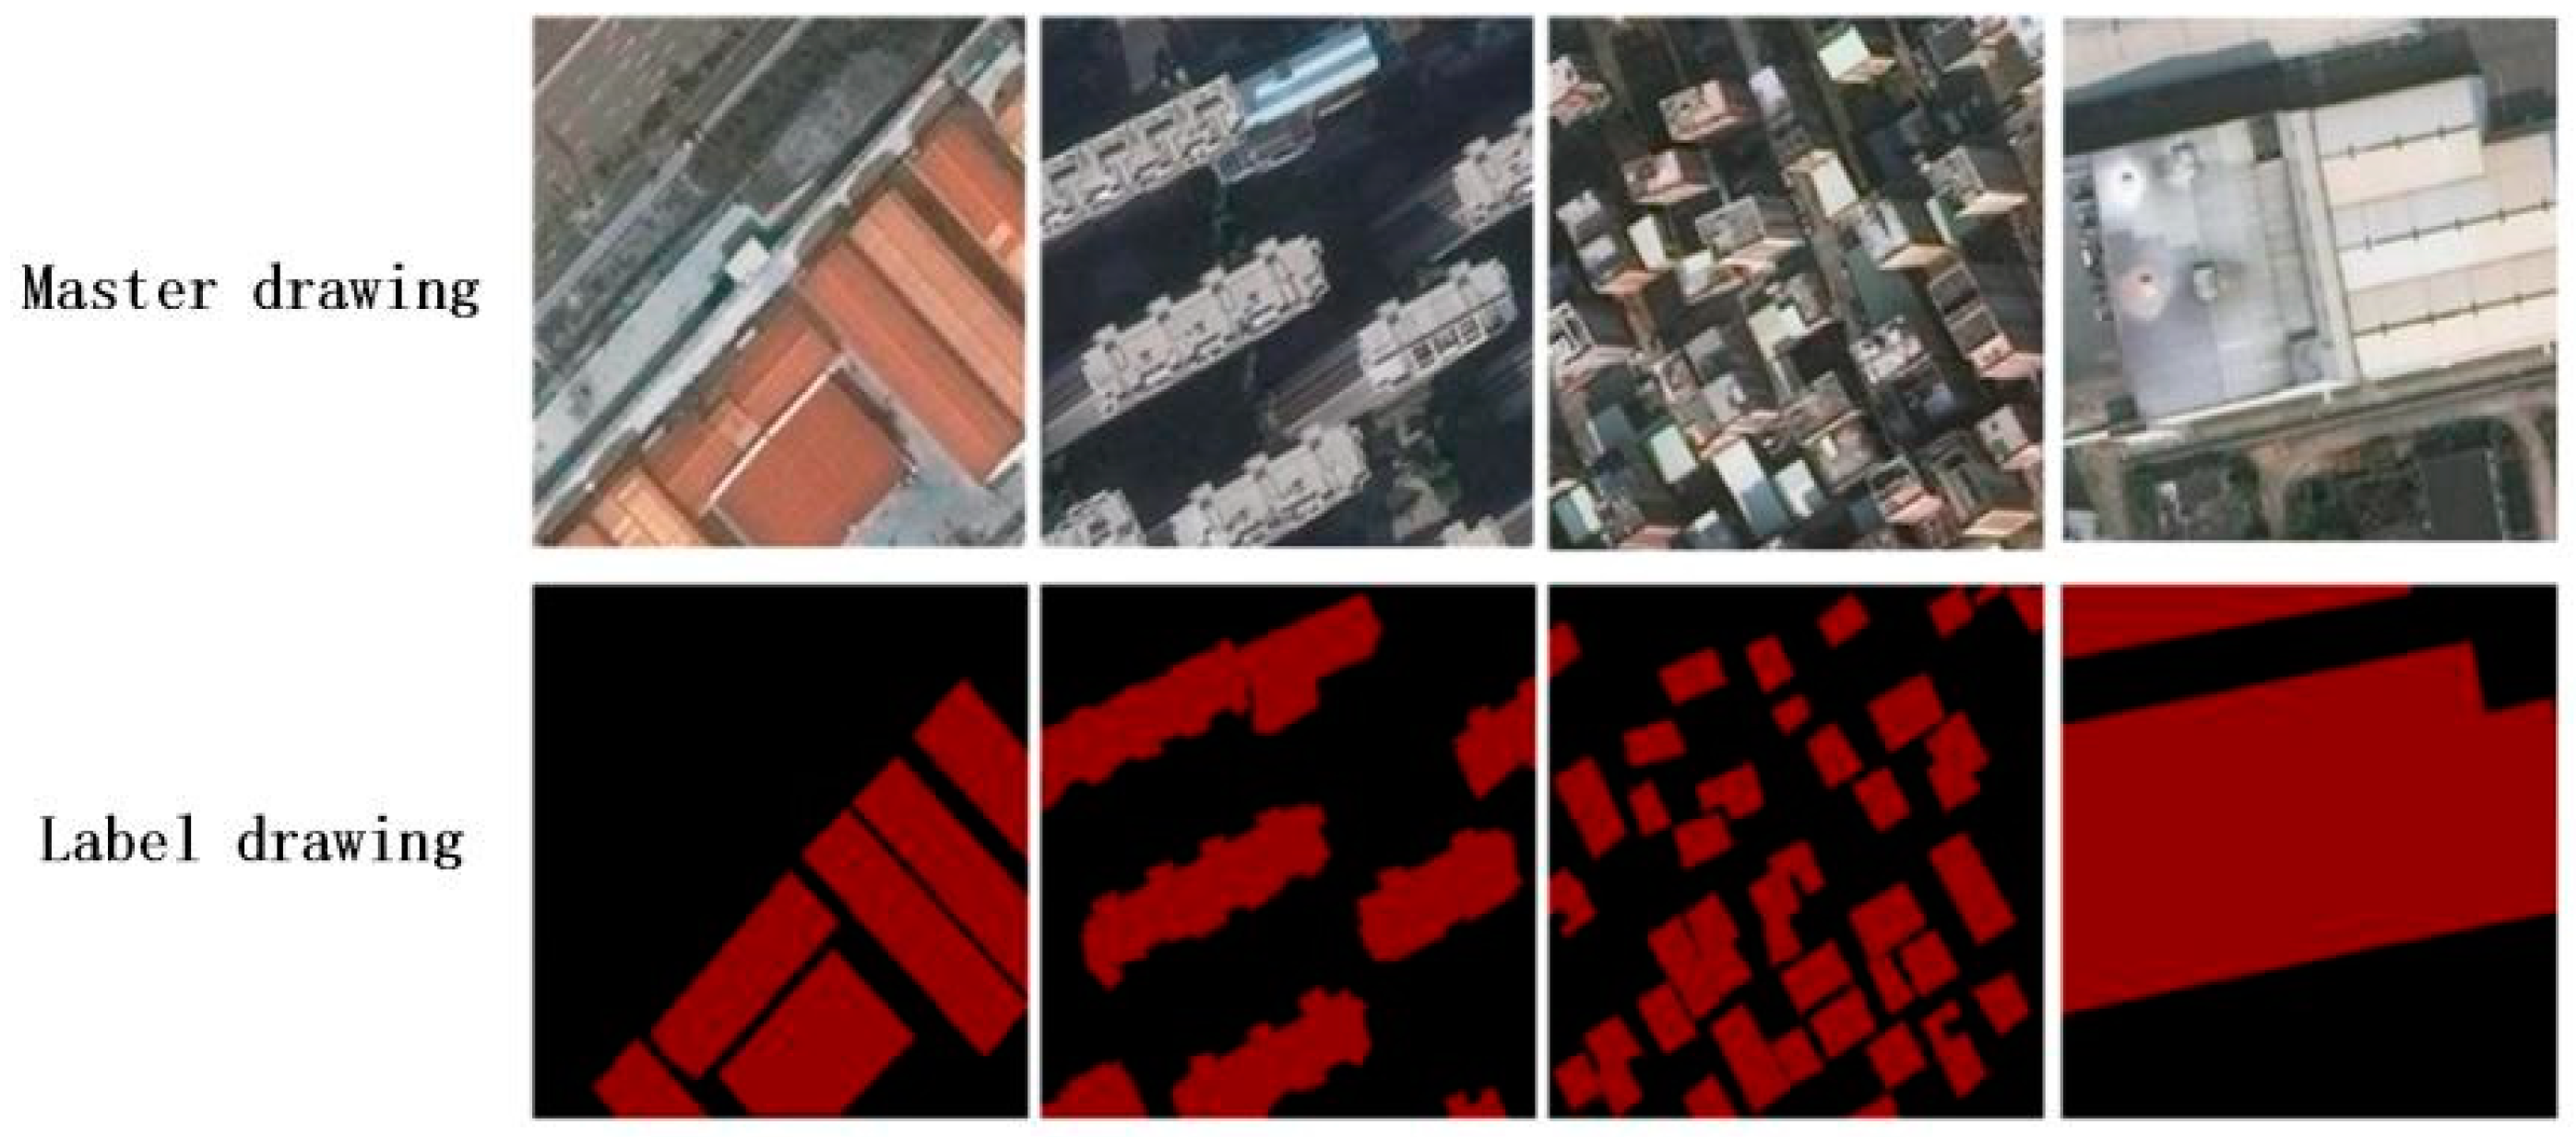
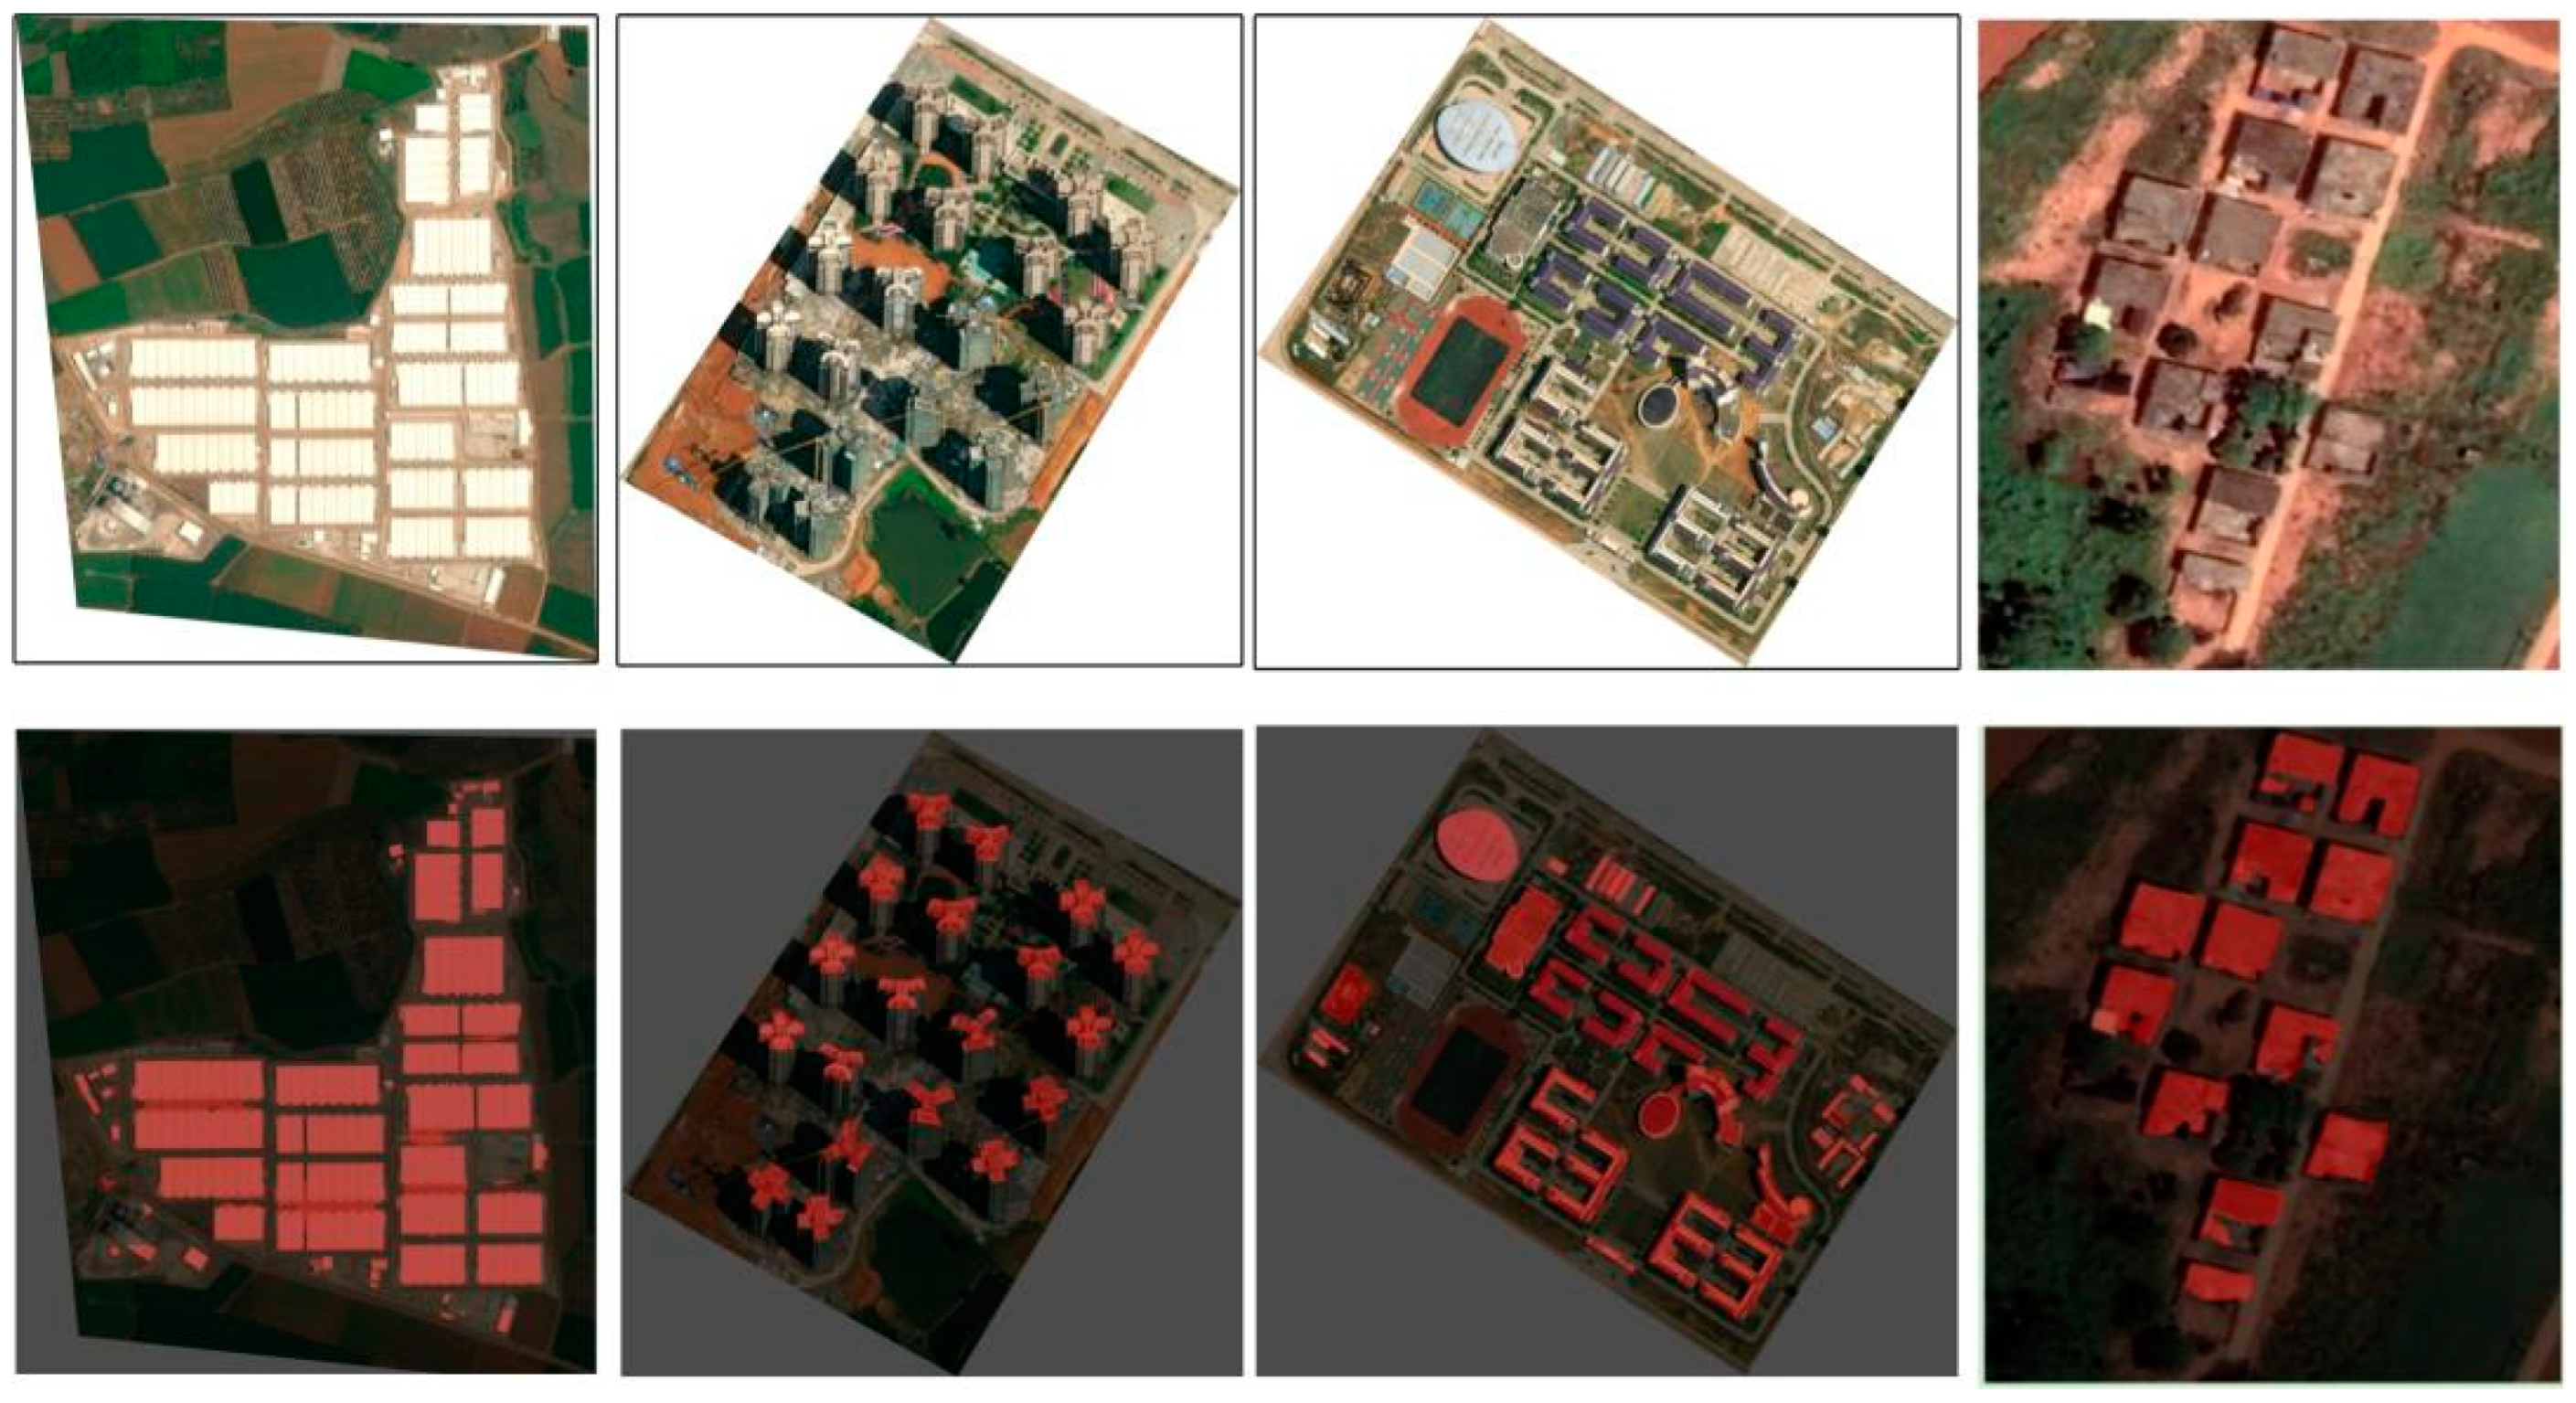
4.1.2. Training Dataset Construction and Data Enhancement

In order to make the model more generalized and adaptable, 1200 typical roofs (residential, industrial buildings, etc.) were selected as the dataset required for model training. The Labelme tool was used to manually label the dataset, as shown in Figure 8. Together with the public dataset WHU Building Dataset, it formed the training sample label set, and the dataset was further divided into the training set and validation set in a ratio of 8:2.
Since the acquired high-resolution remote sensing images covered the entire urban and rural areas, there was a high density of buildings in urban areas with varying heights and occlusion. Buildings in rural areas were generally more standardized, but the architectural styles varied greatly. In order to alleviate these problems so that the model could better extract image features, improve the generalization ability and robustness of the model, and reduce the risk of overfitting of the model, data enhancement was generally carried out according to the features of the dataset before the dataset training. The data enhancement is shown in Figure 9.

4.1.3. Model Verification

The semantic segmentation model was validated based on the SegNeXt model and the improved SegNeXt model. Pytorch version 1.8 and CUDA version 10.2 were used for training. The detailed configuration of the hardware devices used for model training is shown in Table 2. The hyperparameters used for training the model were set as shown in Table 3; the parameters were optimized to select the gradient descent algorithm, and the final recognition comparison graph is shown in Figure 10.
In order to verify the accuracy of the map tile-based building roof area assessment, 240 map tiles were randomly selected as the model validation set without participating in model training. The improved model was compared with the original model, and the error validation results are shown in Table 4, as follows.
From Table 4, it can be seen that although the network structure of the improved model was more complex, its accuracy, average cross ratio, and F1 parameter were improved. The improved model solved the problems of inconspicuous edges, boundary sticking, and holes in the detection, which proved that the improved network was effective and practical.
The image of the region to be predicted was fed into the trained model for validation. Some typical buildings in Leizhou City were selected for the example image, and the roof segmentation results are shown in Figure 11. As can be seen from the results, the model recognized the roofs of the buildings in the study area very well; most of the roofs could be recognized effectively, including the large roofs of factories and the small roofs of residences. There were fewer missed targets, and the segmentation results were relatively accurate and basically matched the roof contours.

4.1.4. Calculation Results of Leizhou City

According to the calculation method in Section 3, the calculation results of Leizhou City are shown in Table 5.
As can be seen in Table 5, the roof area of Leizhou City was 75,430,313.60 m2. The correction area was 25,186,181.7 m2. The overall recognition results are shown in Figure 12.

4.2. Potential Calculation of Rooftop PV Installed Capacity

According to the calculation Formula (5):
E p = H A × S r × r × K × 1 R a N 1 = 1500 × 25186181.7 × 19.1 % × 86 % × 1 1.4 % 25 1 = 442.4   M W
Table 6 shows data on installed PV capacity in China over the last decade. The nonlinear least squares method was used for fitting parameter estimation. The innovation coefficient p was obtained as 0.00129 and the imitation coefficient q was 0.29978.
Based on the p and q parameter values derived above, the maximum installed potential of 442.4 MW was used as the m-value for Bass modeling to derive the installed PV potential of Leizhou City in the next 35 years, as shown in Figure 13. The data visualization of newly added installed capacity each year is shown in Figure 14. It can be seen that there was an explosive growth in the 15th year, which gradually flattened out after the 20th year. Starting from 2023, the installed capacity in Lehigh is expected to be completed in 35 years with an s-shaped fitting curve. According to the model prediction, there will be explosive growth in 2030, and the growth rate will gradually slow down after 2050, which is basically consistent with the time set by China to achieve the “double carbon” target.

5. Conclusions

The bottlenecks in realizing large-scale rural solar photovoltaic utilization potential research are large-scale computational calculations that are computationally intensive and are missing data and the quantitative value of building factor shielding for urban rooftop solar energy utilization varies widely, making it difficult to carry out the calculations. In this paper, an efficient and suitable system for estimating the potential of Chinese rural rooftop PV for large-scale rural assessment is proposed from the three aspects of geographic potential, physical potential, and technical potential.
The improved SegNeXt semantic segmentation method has an average crossover rate of about 87% and an average pixel accuracy of about 96%. Leizhou City has a geographic potential of 1500 kWh/m2, a physical potential of 25,186,181.7 m2, and a technological potential of 442.4 MW. Leizhou City is expected to complete its installation in 35 years; the installed capacity of PV over the next 35 years shows an s-curve, with explosive growth in 2030 and a gradual slowing of the growth rate after 2060. This is consistent with China’s “peak carbon neutral” trend.
The method does not overly rely on manual experience and can quickly and accurately calculate the installed capacity of large-scale rural rooftop PV. The improved SegNeXt deep learning network can well solve the problems of the original extraction of edges that are not fine enough, high adhesion, and poor generalization ability to deal with different types of buildings. The innovative use of the Bass model to estimate the installed capacity in the next 35 years and the combination of the Commodity Diffusion Model with the installed capacity have achieved good results, which are in line with China’s future “3060” plan.
However, while the solar energy utilization potential considered in this paper is its maximum possibility of generating electricity, there are still many factors that need to be taken into account in practical applications, such as the economics of solar panel installation, the type of buildings and the direct shielding between them, and the weather, among other factors. Therefore, subsequent studies need to further consider application-level factors for accurate calculations.

Author Contributions

Conceptualization, W.C. and X.P.; methodology, W.C. and H.Y.; software, W.C.; experiment, validation, and analysis, J.Y.; investigation, W.C. and X.P.; resources, W.C. and J.Y.; data curation, W.C. and J.Y.; writing—original draft preparation, W.C. and X.P.; writing—review and editing, W.C., H.Y. and L.L.L. All authors have read and agreed to the published version of the manuscript.

Funding

This research was supported by the National Natural Science Foundation of China (62273104) and the Science & Technology Program of Guangdong Power Grid Co., Ltd. (030800KK52220016).

Data Availability Statement

No new data is created.

Acknowledgments

This research was supported by the National Natural Science Foundation of China (62273104) and the Science & Technology Program of Guangdong Power Grid Co., Ltd. (030800KK52220016).

Conflicts of Interest

The authors declare no conflict of interest.

References

  1. Melius, J.; Margolis, R.; Ong, S. A Review of Methods, Patents, and Validation Techniques; National Renewable Energy Laboratory: Golden, CO, USA, 2013.
  2. Izquierdo, S.; Rodrigues, M.; Fueyo, N. A method for estimating the geographical distribution of the available roof surface area for large-scale photovoltaic energy-potential evaluations. Sol. Energy 2008, 82, 929–939. [Google Scholar] [CrossRef]
  3. Lehmann, H.; Peter, S. Assessment of Roof and Facade Potentials for Solar Use in Europe; Institute for Sustainable Solutions and Innovations (ISUSI): Aachen, Germany, 2003. [Google Scholar]
  4. Guo, X.L. Evaluation of Rooftop Solar Photovoltaic Utilization Potential Based on Roof Area in Xuzhou City. Master’s Thesis, China University of Mining and Technology, Beijing, China, 2015. [Google Scholar]
  5. Wiginton, L.K.; Nguyen, H.T.; Pearce, J.M. Quantifying rooftop solar photovoltaic potential for regional renewable energy policy. Comput. Environ. Urban Syst. 2010, 34, 345–357. [Google Scholar] [CrossRef]
  6. Ladner-Garcia, H.P.; O’Neill-Carrillo, E. Determining realistic photovoltaic generation targets in an isolated power system. In Proceedings of the 2009 IEEE Power & Energy Society General Meeting, Calgary, AB, Canada, 26–30 July 2009; pp. 1–5. [Google Scholar] [CrossRef]
  7. Guangxu, L.; Wenxiang, W.; Xujiao, Z.; Yang, Z. Evaluation of rooftop available solar energy resources: A case study of the data of Jiangsu Province in 2000. Resour. Environ. Yangtze Basin 2010, 19, 1242–1248. [Google Scholar]
  8. Schallenberg-Rodríguez, J. Photovoltaic techno-economical potential on roofs in regions and islands: The case of the Canary Islands. Methodological review and methodology proposal. Renew. Sustain. Energy Rev. 2013, 20, 219–239. [Google Scholar] [CrossRef]
  9. Levinson, R.; Akbari, H.; Pomerantz, M.; Gupta, S. Solar access of residential rooftops in four California cities. Sol. Energy 2009, 83, 2120–2135. [Google Scholar] [CrossRef]
  10. Jakubiec, J.A.; Reinhart, C.F. A method for predicting city-wide electricity gains from photovoltaic panels based on LiDAR and GIS data combined with hourly Daysim simulations. Sol. Energy 2013, 93, 127–143. [Google Scholar] [CrossRef]
  11. Romero Rodríguez, L.; Duminil, E.; Ramos, S.; Eicker, U. Assessment of the photovoltaic potential at urban level based on 3D city models: A case study and new methodological approach. Sol. Energy 2017, 146, 264–275. [Google Scholar] [CrossRef]
  12. Hofierka, J.; Kaňuk, J. Assessment of photovoltaic potential in urban areas using open-source solar radiation tools. Renew. Energy 2009, 34, 2206–2214. [Google Scholar] [CrossRef]
  13. Leitelt, L.; Bendor, T. Developing a Solar Energy Potential Map. Planning Advisory Service Memo; 2010. Available online: https://www.cma.gov.cn/2011xwzx/2011xqxxw/2011xqxyw/202304/t20230404_5421074.html?from=singlemessage (accessed on 21 April 2023).
  14. Schwarz, H.; Ying, S. Urban photovoltaic potential. In Proceedings of the 9th International Conference on Environment and Electrical Engineering, Prague, Czech Republic, 16–19 May 2010; pp. 26–28. [Google Scholar]
  15. Li, Z.; Zhang, Z.; Davey, K. Estimating Geographical PV Potential Using LiDAR Data for Buildings in Downtown San Francisco. Trans. GIS 2015, 19, 930–963. [Google Scholar] [CrossRef]
  16. Hofierka, J.; Zlocha, M. A New 3-D Solar Radiation Model for 3-D City Models. Trans. GIS 2012, 16, 681–690. [Google Scholar] [CrossRef]
  17. Verso, A.; Martin, A.; Amador, J.; Dominguez, J. GIS-based method to evaluate the photovoltaic potential in the urban environments: The particular case of Miraflores de la Sierra. Sol. Energy 2015, 117, 236–245. [Google Scholar] [CrossRef]
  18. Matsumoto, T.; Hayashi, K.; Huang, Y.; Tomino, Y.; Nakamura, M. Study on the estimation of solar power potential of each individual roof using airborne LiDAR data—Case study in the western part of Nagoya city. J. Hum. Environ. Symbiosis 2021, 37, 141–152. [Google Scholar]
  19. Sezer, A.; Altan, A. Detection of solder paste defects with an optimization-based deep learning model using image processing techniques. Solder. Surf. Mt. Technol. 2021, 33, 291–298. [Google Scholar] [CrossRef]
  20. Altan, A.; Karasu, S.; Zio, E. A new hybrid model for wind speed forecasting combining long short-term memory neural network, decomposition methods and grey wolf optimizer. Appl. Soft Comput. 2020, 100, 106996. [Google Scholar] [CrossRef]
  21. Qin, Y.; Wu, Y.; Li, B.; Gao, S.; Liu, M.; Zhan, Y. Semantic segmentation of building roof in dense urban environment with deep convolutional neural network: A case study using GF2 VHR imagery in China. Sensors 2019, 19, 1164. [Google Scholar] [CrossRef]
  22. Li, L.; Liang, J.; Weng, M.; Zhu, H. A Multiple-Feature Reuse Network to Extract Buildings from Remote Sensing Imagery. Remote Sens. 2018, 10, 1350. [Google Scholar] [CrossRef]
  23. Mou, L.; Hua, Y.; Zhu, X.X. A Relation-Augmented Fully Convolutional Network for Semantic Segmentation in Aerial Scenes. In Proceedings of the IEEE/CVF Conference on Computer Vision and Pattern Recognition 2019, New Orleans, LA, USA, 18–24 June 2022; pp. 12408–12417. [Google Scholar] [CrossRef]
  24. Xu, Y.Y.; Wu, L.; Xie, Z.; Chen, Z. Building extraction in very high resolution remote sensing imagery using deep learning and guided filters. Remote Sens. 2018, 10, 144. [Google Scholar] [CrossRef]
  25. Guo, R.; Liu, J.; Li, N.; Liu, S.; Chen, F.; Cheng, B.; Duan, J.; Li, X.; Ma, C. Pixel-wise classification method for high resolution remote sensing imagery using deep neural net-works. ISPRS Int. J. Geo-Inf. 2018, 7, 110. [Google Scholar] [CrossRef]
  26. Badrinarayanan, V.; Kendall, A.; Cipolla, R. Segnet: A deep convolutional encoder-decoder architecture for image segmentation. IEEE Trans. Pattern Anal. Mach. Intell. 2017, 39, 2481–2495. [Google Scholar] [CrossRef]
  27. Audebert, N.; Le Saux, B.; Lefèvre, S. Semantic segmentation of earth observation data using multimodal and multi-scale deep networks. In Proceedings of the Asian Conference on Computer Vision 2016, Taipei, Taiwan, 20–24 November 2016; pp. 180–196. [Google Scholar] [CrossRef]
  28. Chen, G.; Li, C.; Wei, W.; Jing, W.; Woźniak, M. Fully convolutional neural network with augmented atrous spatial pyramid pool and fully con-nected fusion path for high resolution remote sensing image segmentation. Appl. Sci. 2019, 9, 1816. [Google Scholar] [CrossRef]
  29. Pan, X.; Yang, F.; Gao, L.; Chen, Z.; Zhang, B.; Fan, H.; Ren, J. Building Extraction from High-Resolution Aerial Imagery Using a Generative Adversarial Network with Spatial and Channel Attention Mechanisms. Remote Sens. 2019, 11, 917. [Google Scholar] [CrossRef]
  30. Huang, Z.; Mendis, T.; Xu, S. Urban solar utilization potential mapping via deep learning technology: A case study of Wuhan, China. Appl. Energy 2019, 250, 283–291. [Google Scholar] [CrossRef]
  31. Krapf, S.; Kemmerzell, N.; Khawaja Haseeb Uddin, S.; Hack V’azquez, M.; Netzler, F.; Lienkamp, M. Towards scalable economic photovoltaic potential analysis using aerial images and deep learning. Energies 2021, 14, 3800. [Google Scholar] [CrossRef]
  32. Zhong, T.; Zhang, Z.; Chen, M.; Zhang, K.; Zhou, Z.; Zhu, R.; Wang, Y.; Lü, G.; Yan, J. A city-scale estimation of rooftop solar photovoltaic potential based on deep learning. Appl. Energy 2021, 298, 117132. [Google Scholar] [CrossRef]
  33. Xu, F.Y. Roof Area Recognition and Roof PV Capacity Estimation Based on Remote Sensing Images. Master’s Thesis, Hangzhou Dianzi University, Hangzhou, China, 2016. [Google Scholar]
  34. China Wind and Solar Energy Annual Outlook Communique. Available online: https://www.cma.gov.cn/zfxxgk/gknr/qxbg/202304/t20230421_5454513.html (accessed on 21 April 2023).
  35. Zhao, H.; Jia, J.; Koltun, V. Exploring self-attention for image recognition. In Proceedings of the IEEE/CVF Conference on Computer Vision and Pattern Recognition, Seattle, WA, USA, 13–19 June 2020; pp. 10076–10085. [Google Scholar]
  36. GB50797-2012; Code for Design of Photovoltaic Power Stations. Ministry of Housing and Urban-Rural Development: Beijing, China, 2012.
  37. Tang, Z.; Liu, L.; Yu, H.; Cui, J. Research on demand diffusion for sequels based on Bass Model and three-stage process Model. Oper. Res. Manag. 2019, 28, 166–175. [Google Scholar]
Figure 1. Potential evaluation flow chart of rooftop PV.
Energies 16 06563 g001
Figure 2. Annual horizontal radiation distribution map of China in 2022 (kWh/m2) [34].
Energies 16 06563 g002
Figure 3. SegNeXt network structure.
Energies 16 06563 g003
Figure 4. Multi-scale contextual attention module.
Energies 16 06563 g004
Figure 5. Improved SegNeXt network structure.
Energies 16 06563 g005
Figure 6. Bass model accumulation curve and density curve.
Energies 16 06563 g006
Figure 7. Leizhou image segmentation diagram.
Energies 16 06563 g007
Figure 8. Hand-marked label.
Energies 16 06563 g008
Figure 9. Data enhancement.
Energies 16 06563 g009
Figure 10. Recognition contrast chart.
Energies 16 06563 g010
Figure 11. Result of roof division.
Energies 16 06563 g011
Figure 12. Overall recognition results.
Energies 16 06563 g012
Figure 13. Fitting curve based on Bass model (MW).
Energies 16 06563 g013
Figure 14. Distributed PV installed capacity data for the next 35 years (MW).
Energies 16 06563 g014
Table 1. Confusion matrix.
Predicted ValueTrueNegative
True Value
TrueTPFN
NegativeFPTN
Table 2. Specific configuration of hardware equipment.
EquipmentDisposition
GPUNVIDIA GeForce RTX 3080×8
CPUIntel(R) Core(TM) i7-7700HQ 2.80 GHz
Internal memory32 G
Hard disk500 G
Table 3. Hyperparameter setting of training model.
Hyperparameter TypeParameter Value
Batch_size64
Learning rate0.0005
Optimizer_typeadam
Epoch100
Momentum0.9
Minimum image size256 × 256
Loss functionCross Entropy Loss
Table 4. Error verification table.
OAPRREF1mIoU
ImprovedSegNeXt96.21%88.33%90.68%91.6%87.03%
SegNeXt95.4%87.03%89.14%89.91%85.95%
Table 5. Calculation result.
PixelArea
backdrop48,931,405,8243,733,466,264.37
roof988,601,75175,430,313.60
Table 6. China’s photovoltaic installed capacity data in the past ten years.
Year2013201420152016201720182019202020212022
t12345678910
Installed capacity (GW)3.14.676.0610.3229.6650.6262.6378.23107.51158.61
Disclaimer/Publisher’s Note: The statements, opinions and data contained in all publications are solely those of the individual author(s) and contributor(s) and not of MDPI and/or the editor(s). MDPI and/or the editor(s) disclaim responsibility for any injury to people or property resulting from any ideas, methods, instructions or products referred to in the content.

