Article

Evaluation Method for Hosting Capacity of Rooftop Photovoltaic Considering Photovoltaic Potential in Distribution System

1
Department of Electrical Engineering, School of Automation, Guangdong University of Technology, Guangzhou 510006, China
2
Shantou Power Supply Bureau of Guangdong Power Grid Corporation, Shantou 515041, China
*
Author to whom correspondence should be addressed.
Energies 2023, 16(22), 7677; https://doi.org/10.3390/en16227677
Submission received: 12 October 2023 / Revised: 3 November 2023 / Accepted: 17 November 2023 / Published: 20 November 2023

Abstract

:
Regarding the existing evaluation methods for photovoltaic (PV) hosting capacity in the distribution system that do not consider the spatial distribution of rooftop photovoltaic potential and are difficult to apply on the actual large-scale distribution systems, this paper proposes a PV hosting capacity evaluation method based on the improved PSPNet, grid multi-source data, and the CRITIC method. Firstly, an improved PSPNet is used to efficiently abstract the rooftop in satellite map images and then estimate the rooftop PV potential of each distribution substation supply area. Considering the safety, economy, and flexibility of distribution system operation, we establish a multi-level PV hosting capacity evaluation system. Finally, based on the rooftop PV potential estimation of each distribution substation supply area, we combine the multi-source data of the grid digitalization system to carry out security verification and indicator calculation and convert the indicator calculation results of each scenario into a comprehensive score through the CRITIC method. We estimate the rooftop photovoltaic potential and evaluate the PV hosting capacity of an actual 10 kV distribution system in Shantou, China. The results show that the improved PSPNet solves the hole problem of the original model and obtains a close-to-realistic rooftop photovoltaic potential estimation value. In addition, the proposed method considering the photovoltaic potential in this paper can more accurately evaluate the rooftop PV hosting capacity of the distribution system compared with the traditional method, which provides data support for the power grid corporation to formulate a reasonable PV development and hosting capacity enhancement program.

1. Introduction

In recent years, with the implementation of county-wide photovoltaic policies and price subsidies for photovoltaic products in China, the rooftop photovoltaic has attracted more and more attention [1]. The large-scale grid-connected rooftop photovoltaic has changed the characteristics of traditional distribution networks, and the power flow of the distribution network has shifted from “one-way” to “two-way”. High penetration photovoltaic access will have adverse effects on the safe and stable operation of existing distribution systems, such as voltage exceeding limits, increased risk of equipment thermal stability, and relay protection failure [2,3,4]. The evaluation of the PV hosting capacity in distribution systems is currently a rising technological hotspot that is widely used in the planning tasks of distribution networks with a high proportion of photovoltaic access. Rooftop photovoltaics are generally installed on the roof of buildings. Since the area of buildings varies in different power supply areas, considering the potential estimation of roof photovoltaics can provide more accurate evaluation results of the PV hosting capacity, which helps analyze the potential operational risks of the distribution system after large-scale rooftop photovoltaic grid connection [5].
Existing methods for evaluating PV hosting capacity are categorized into the following four main types: (i) methods based on dynamic iteration and simulation [6,7,8]; (ii) methods based on mathematical optimization [9,10,11]; (iii) methods based on random scenarios simulation [12,13,14]; and (iv) methods based on comprehensive evaluation [15,16,17,18].
For method (i), El-Shimy et al. [6] used MATLAB, PSAT, and ETAP software to perform dynamic simulation for the assessment of power system stability and maximum penetration level. Tan et al. [7] used two calculation processes, reverse and forward, to segment and analyze the maximum hosting capacity of a radial distribution network under multiple constraints and different types of DGs based on different initial values of the DG. Tao et al. [8] adjusted the installed capacity of photovoltaic power generation systems based on the voltage deviation and voltage fluctuation rate required by national standards until the maximum photovoltaic hosting capacity that meets the requirements is obtained. However, if such methods are to calculate the PV hosting capacity of the distribution network within the scope of local or provincial power grids, they require a large number of workload and simulation calculations.
Method (ii) aims to maximize the hosting capacity of power sources, taking into account various safety operation constraints, and using different optimization algorithms to obtain the optimal solution. Alghamdi et al. [9] adopted a decoupled linear power flow model (DLPF) to ensure fast calculation and used the particle swarm optimization algorithm (PSO) to solve the maximum photovoltaic access capacity of a radial distribution system. Yuan et al. [10] established a renewable energy hosting capacity calculation model for distribution networks with consideration of power quality, relay protection, and thermal stability and proposed a multi-strategy improved adaptive manta ray foraging optimization algorithm (MSAMRFO) to solve the PV hosting capacity. Gomes et al. [11] constructed a model of the maximum hosting capacity of a distributed generation system in a distribution network, used a genetic algorithm (GA) to obtain the maximum hosting capacity, and proved its validity in a modified IEEE 33-bus radial distribution system. Such methods are relatively simple in modeling ideas, but the analysis results often correspond to the optimal PV allocation method, which cannot effectively reflect the real hosting capacity of the distribution network.
The basic principle of method (iii) is to generate a sequence of photovoltaic access scenarios with certain probability distribution characteristics based on the Monte Carlo simulation method and to calculate the PV hosting capacity considering different safety operation constraints. Ding et al. [12] used a Monte Carlo simulation-based stochastic analysis method to estimate the distributed PV hosting capacity of 17 distribution feeders and analyzed their sensitivity to the characteristics of the feeder. Liu et al. [13] proposed an improved stochastic analysis method that introduces a repeatability checking mechanism and a fast-sorting algorithm to overcome the shortcomings of the traditional method and avoid the duplication problem in the selection process of PV deployment options. Torquato et al. [14] used a simplified Monte Carlo method to analyze rooftop photovoltaic hosting capacity on a low-voltage distribution system and used a logarithmic distribution for risk analysis of hosting capacity. Such methods do not model the actual load and PV scenarios and focus on considering the uncertainty of the PV grid-connected capacity, quantity, and location, but the information about the rooftop PV connecting to the MV distribution network through distribution transformers is generally determined in actual projects.
Compared to the maximum photovoltaic capacity that can be connected to the distribution network in specific situations, grid corporations often pay more attention to the impact of potential rooftop PV connections on the reliability, security, and economy of the grid, and thus method (iv) is widely used in engineering practice. Zhang et al. [15] proposed a comprehensive evaluation system that includes reliability, economy, and adaptability based on the differences in the structure of AC and DC distribution networks and the AHP-TOPSIS method. Liu et al. [16] proposed a comprehensive evaluation method for distribution networks based on the AHP entropy weight method, which evaluates and scores actual data from the distribution network. Xiao et al. [17] proposed a comprehensive evaluation index system for distributed photovoltaic access to distribution networks based on the joint probability density function of multi-node voltages, providing an auxiliary decision-making basis for distribution network construction and renovation. Wang et al. [18] constructed a distributed PV hosting capacity evaluation system based on actual grid operation data and calculated and evaluated the hosting capacity of regional distributed PV grid-connected power generation in Hunan, China.
In addition, the methods mentioned above did not utilize building roof data when modeling the photovoltaic capacity of distribution systems. The essence of photovoltaic capacity evaluation is to serve scientific and economic distribution network planning. Mastering the spatial distribution of rooftop photovoltaic potential can generate more realistic typical operating scenarios and improve the accuracy of photovoltaic capacity evaluation [19]. Scholars have already carried out studies related to the estimation of rooftop PV potential [20,21,22,23,24]. Izquierdo et al. [20] used population, building density, and land use data from each city to estimate roof area and photovoltaic potential by determining availability coefficients for 16 representative building types. Wiginton et al. [21] estimated the potential peak photovoltaic power of the region by analyzing the relationship between roof area and population after assuming that the appropriate roofs are fitted with solar cells. Krapf et al. [22] used convolutional neural networks to abstract the rooftops of buildings in an area and thus estimate their photovoltaic potential. Walch et al. [23] combined machine learning algorithms, geographic information systems, and physical models to estimate the technical photovoltaic potential of individual roof surfaces. Yu [24] used U-Net to estimate the photovoltaic potential of building areas detected from satellite map images by setting empirical coefficients.
In summary, the existing methods for evaluating the PV hosting capacity have two problems: firstly, they do not consider the spatial distribution of rooftop photovoltaic potential and fail to reflect the actual operating conditions of the distribution system; secondly, they lack a universal and efficient evaluation method, which makes it difficult to carry out large-scale measurement and application in the actual distribution system. Based on this, this paper proposes a hosting capacity evaluation method for a distribution system that considers the estimation of rooftop photovoltaic potential. Firstly, the Deep Aggregation Pyramid Pooling Module (DAPPM) is introduced into the Pyramid Scene Parsing Network (PSPNet) to achieve efficient extraction of the rooftop in satellite map images and estimation of the rooftop photovoltaic potential in the distribution substation supply area. Then, a multi-level evaluation system of the PV hosting capacity is established by considering the security, economy, and flexibility of distribution system operation. Finally, based on the rooftop photovoltaic potential of each distribution substation supply area, safety verification and indicator calculation are carried out by combining the multi-source data from the actual grid digitization system, and the indicator calculation results of each scenario are converted into comprehensive scores through the CRITIC method.
The main contributions of this study are as follows:
  • We propose an evaluation method for the hosting capacity of rooftop PV considering photovoltaic potential in the distribution system. Simulation experiments demonstrate that the proposed method can more accurately reflect the operation of the distribution system and the rooftop PV hosting capacity than the traditional evaluation method that assigns the same installed PV capacity to each distribution substation supply area.
  • Because the existing methods make it difficult to carry out large-scale PV hosting capacity evaluation in the actual distribution system, we constructed a multi-level evaluation system for PV hosting capacity by combining multi-source data such as geographic information system data, metering system data, and satellite image data of the power grid corporation.
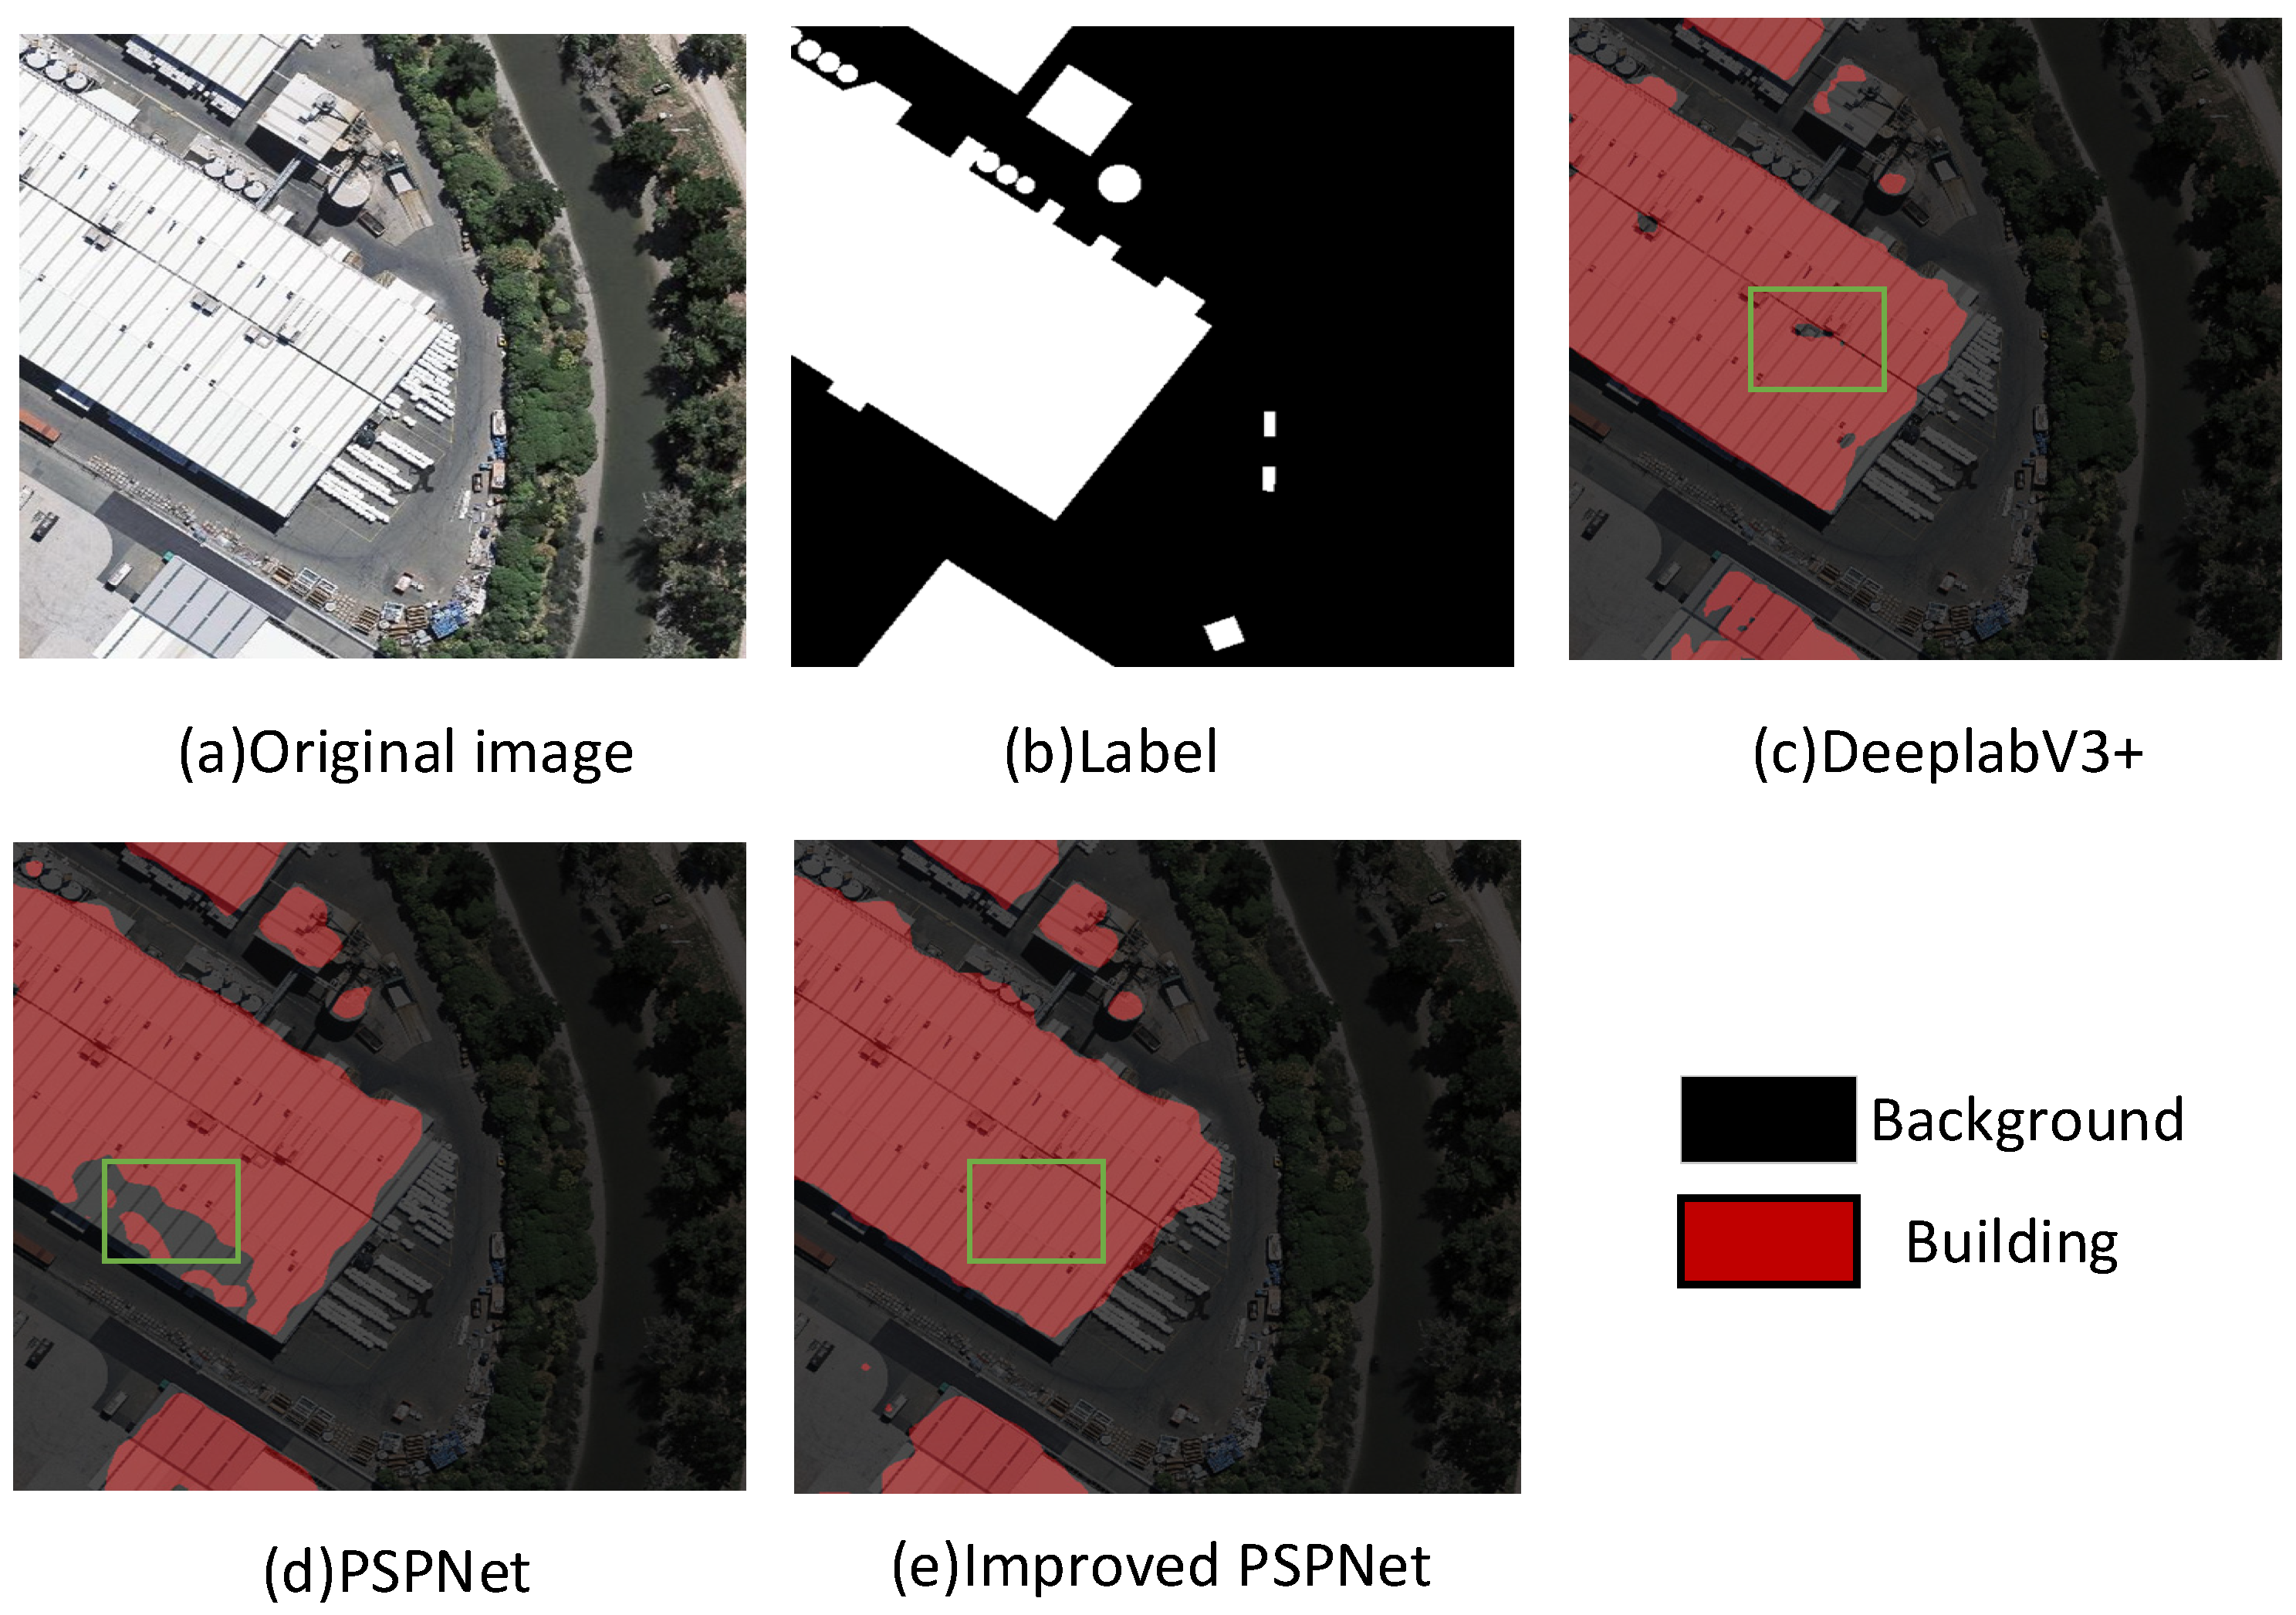
  • An improved PSPNet is adopted to efficiently extract roof contours from satellite map images with high accuracy and implement the estimation of rooftop photovoltaic potential for each distribution substation supply area, which can meet the requirements of a large-scale evaluation of the PV hosting capacity in the distribution system.
The rest of this paper is organized as follows. Section 2 introduces the framework of the proposed method and describes it. In Section 3, the proposed method was demonstrated, analyzed, and discussed on an actual 10 kV medium-voltage feeder using satellite map images of rooftop photovoltaic planning areas, as well as multi-source data from geographic information systems and metering systems. Finally, the conclusion is given in Section 4.

2. Methodology

The evaluation process for the PV hosting capacity of the distribution system considering the estimation of rooftop photovoltaic potential is shown in Figure 1.

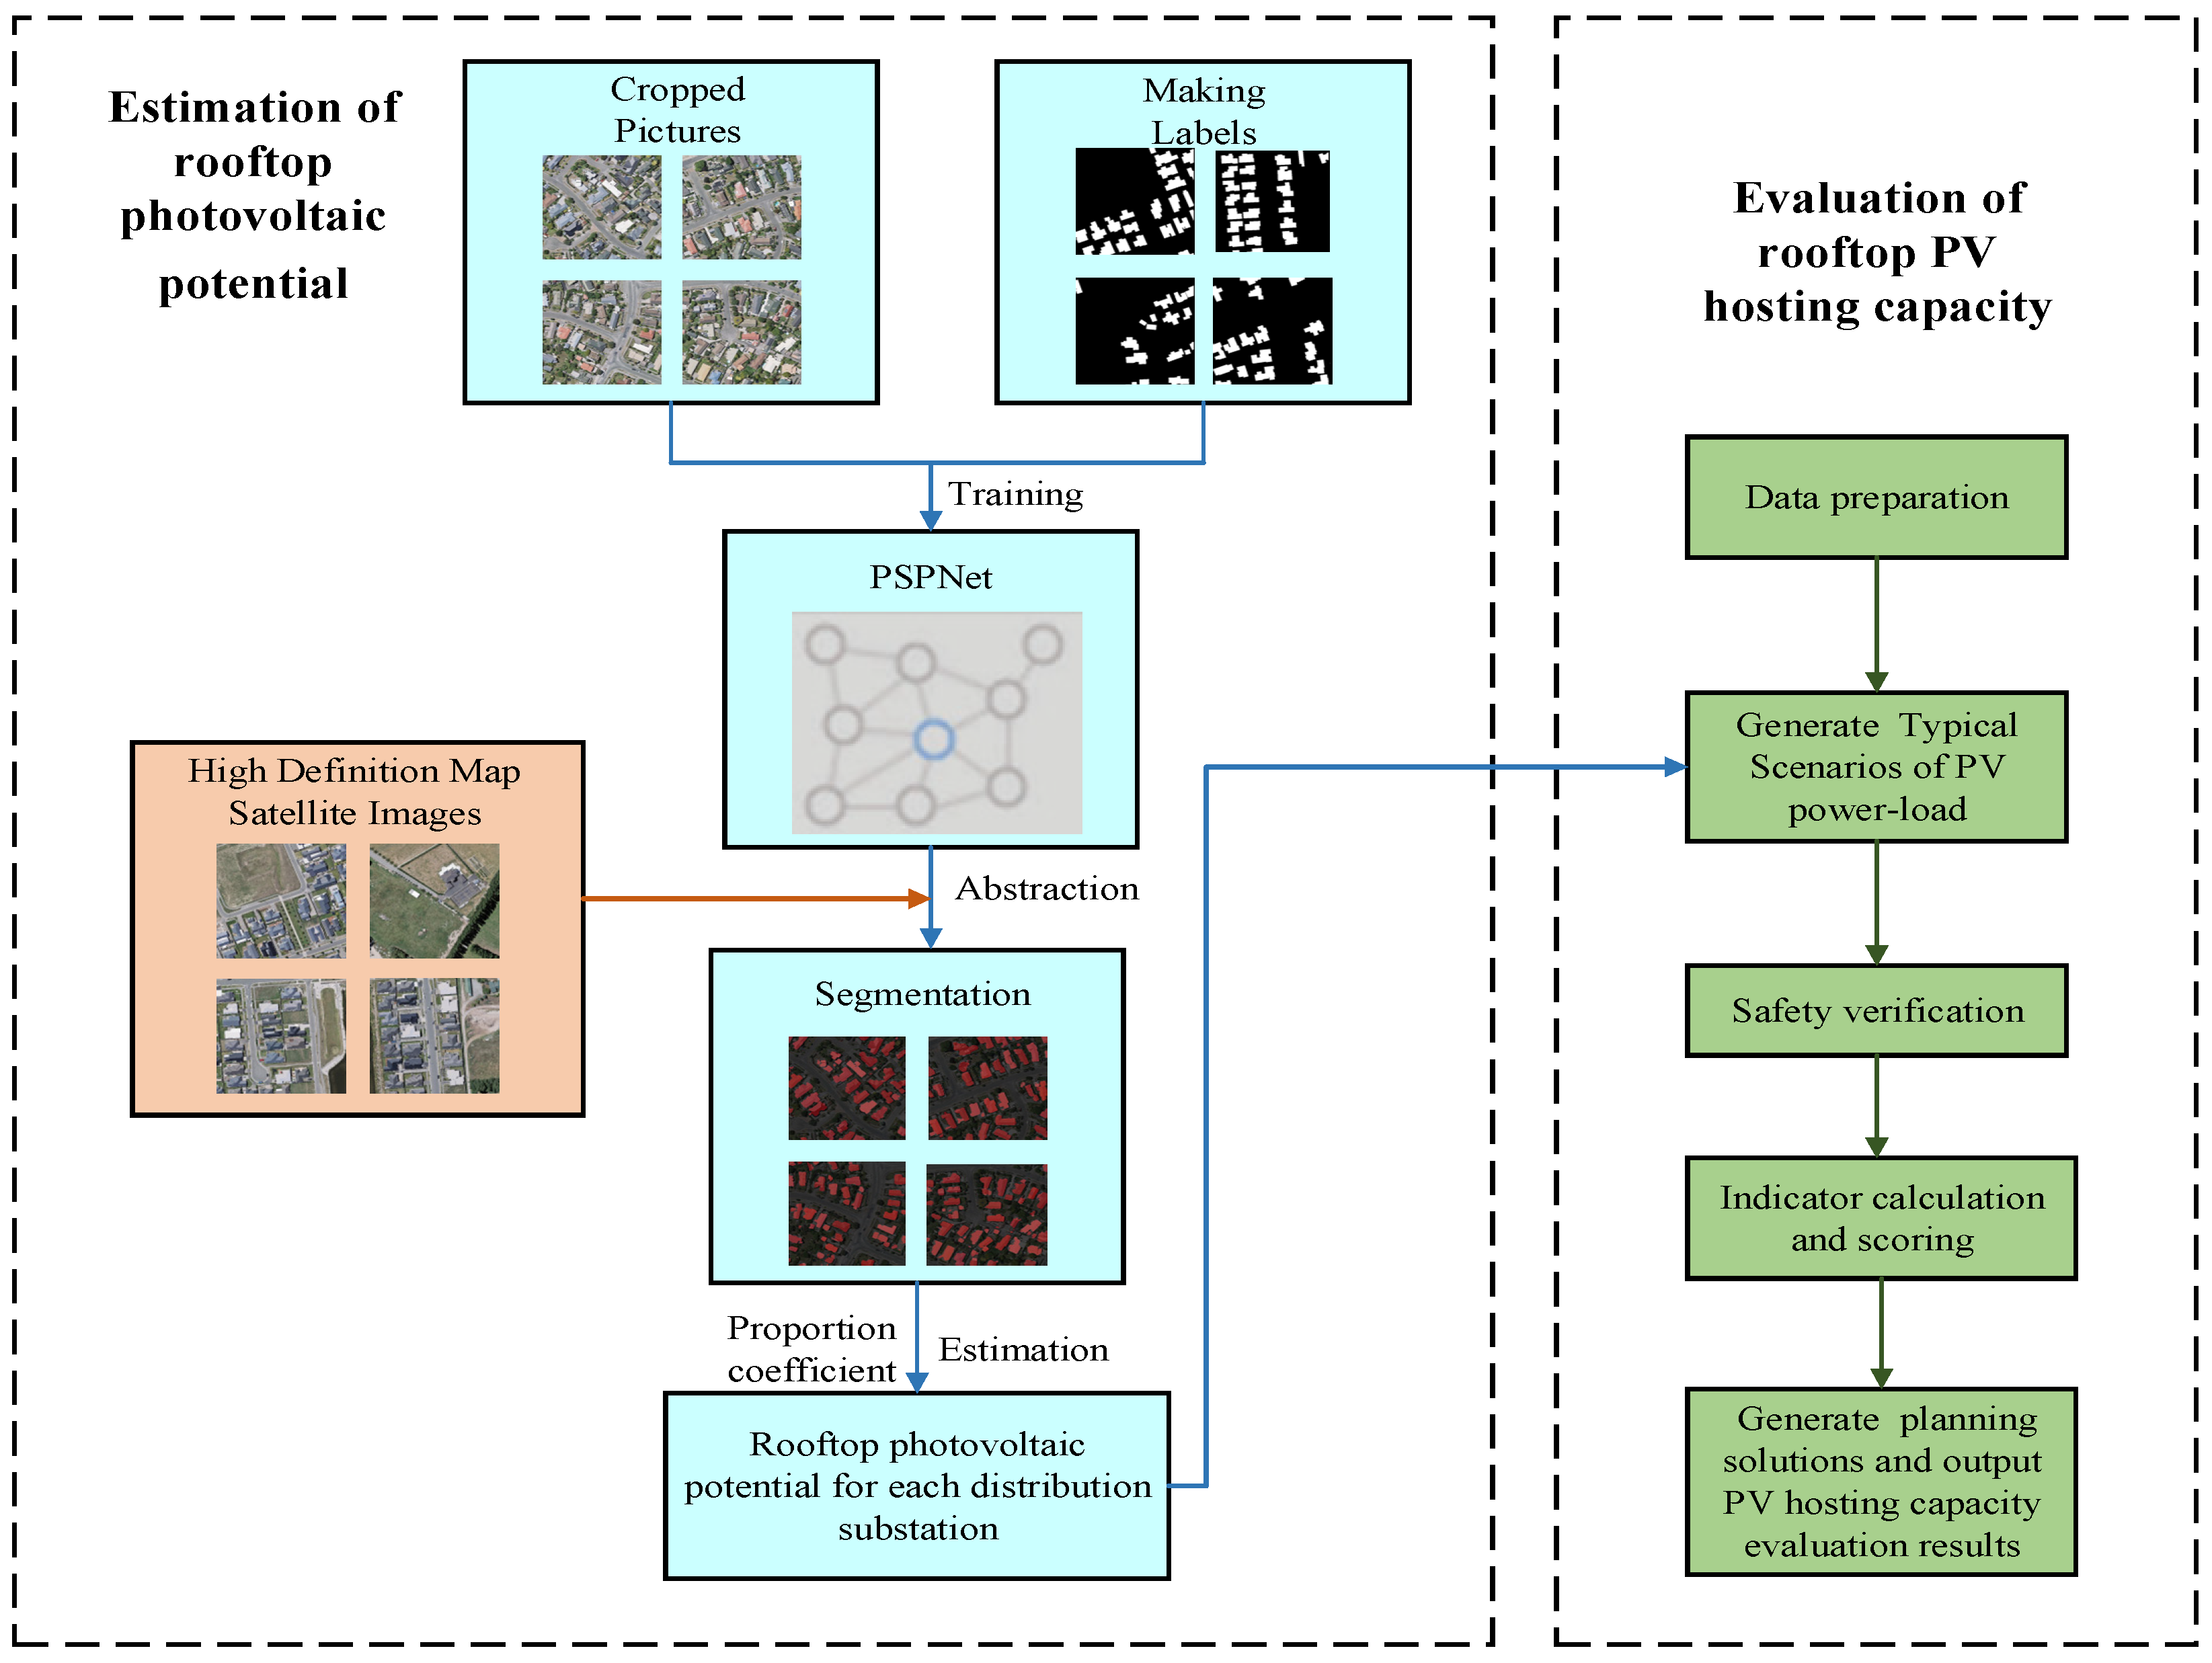
2.1. Estimation of Rooftop Photovoltaic Potential Based on Improved PSPNet

The estimation of rooftop photovoltaic potential mainly relies on calculating the rooftop area of the planning area combined with the available area for photovoltaic panel installation and the maximum installed capacity of rooftop photovoltaic cells per unit land area. This section uses image segmentation technology to abstract building roofs and calculates their area. The flowchart for estimating the potential of rooftop photovoltaic is shown in Figure 2:
In the figure, (x,y) represents the geographical coordinates of the roof in the planning area; G(x,y) represents the nature and building characteristics of the planning area; S(x,y) is the available area for PV panel installation; P(x,y) is the rooftop photovoltaic potential; f1 is the mapping of G(x,y) to S(x,y); and f2 is the mapping of S(x,y) to P(x,y).

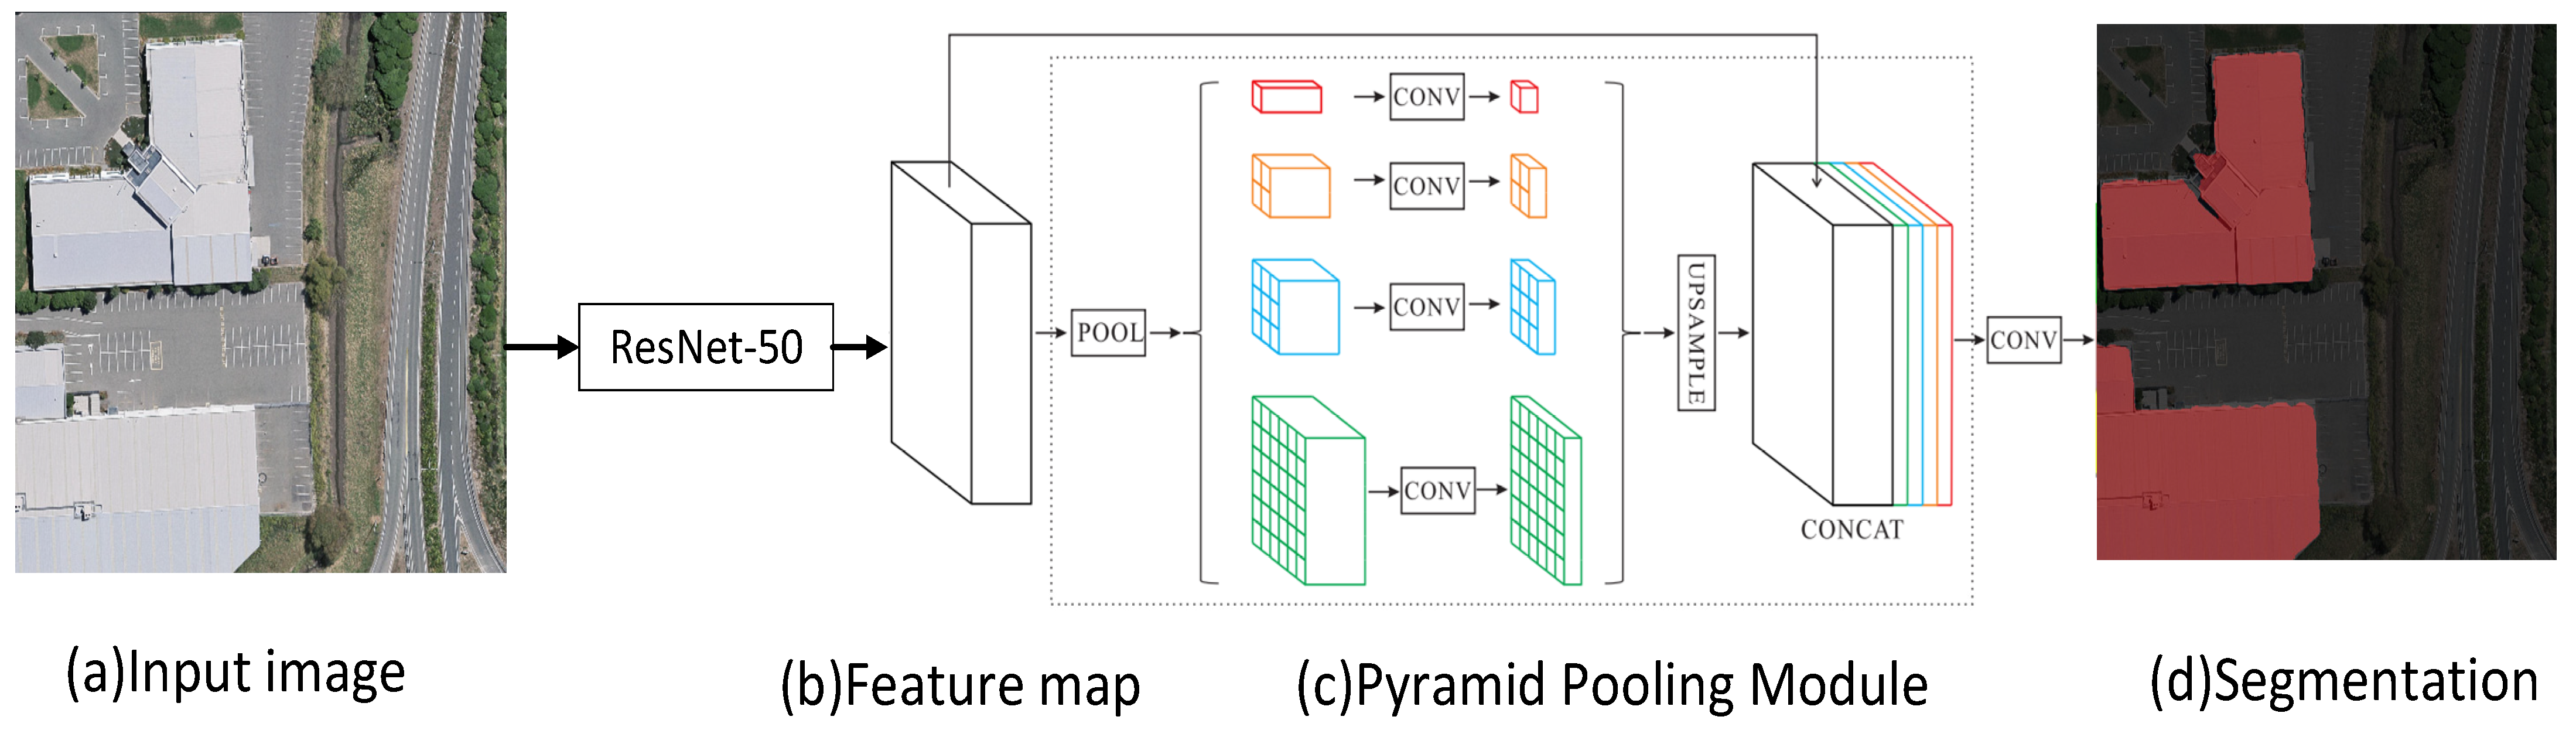
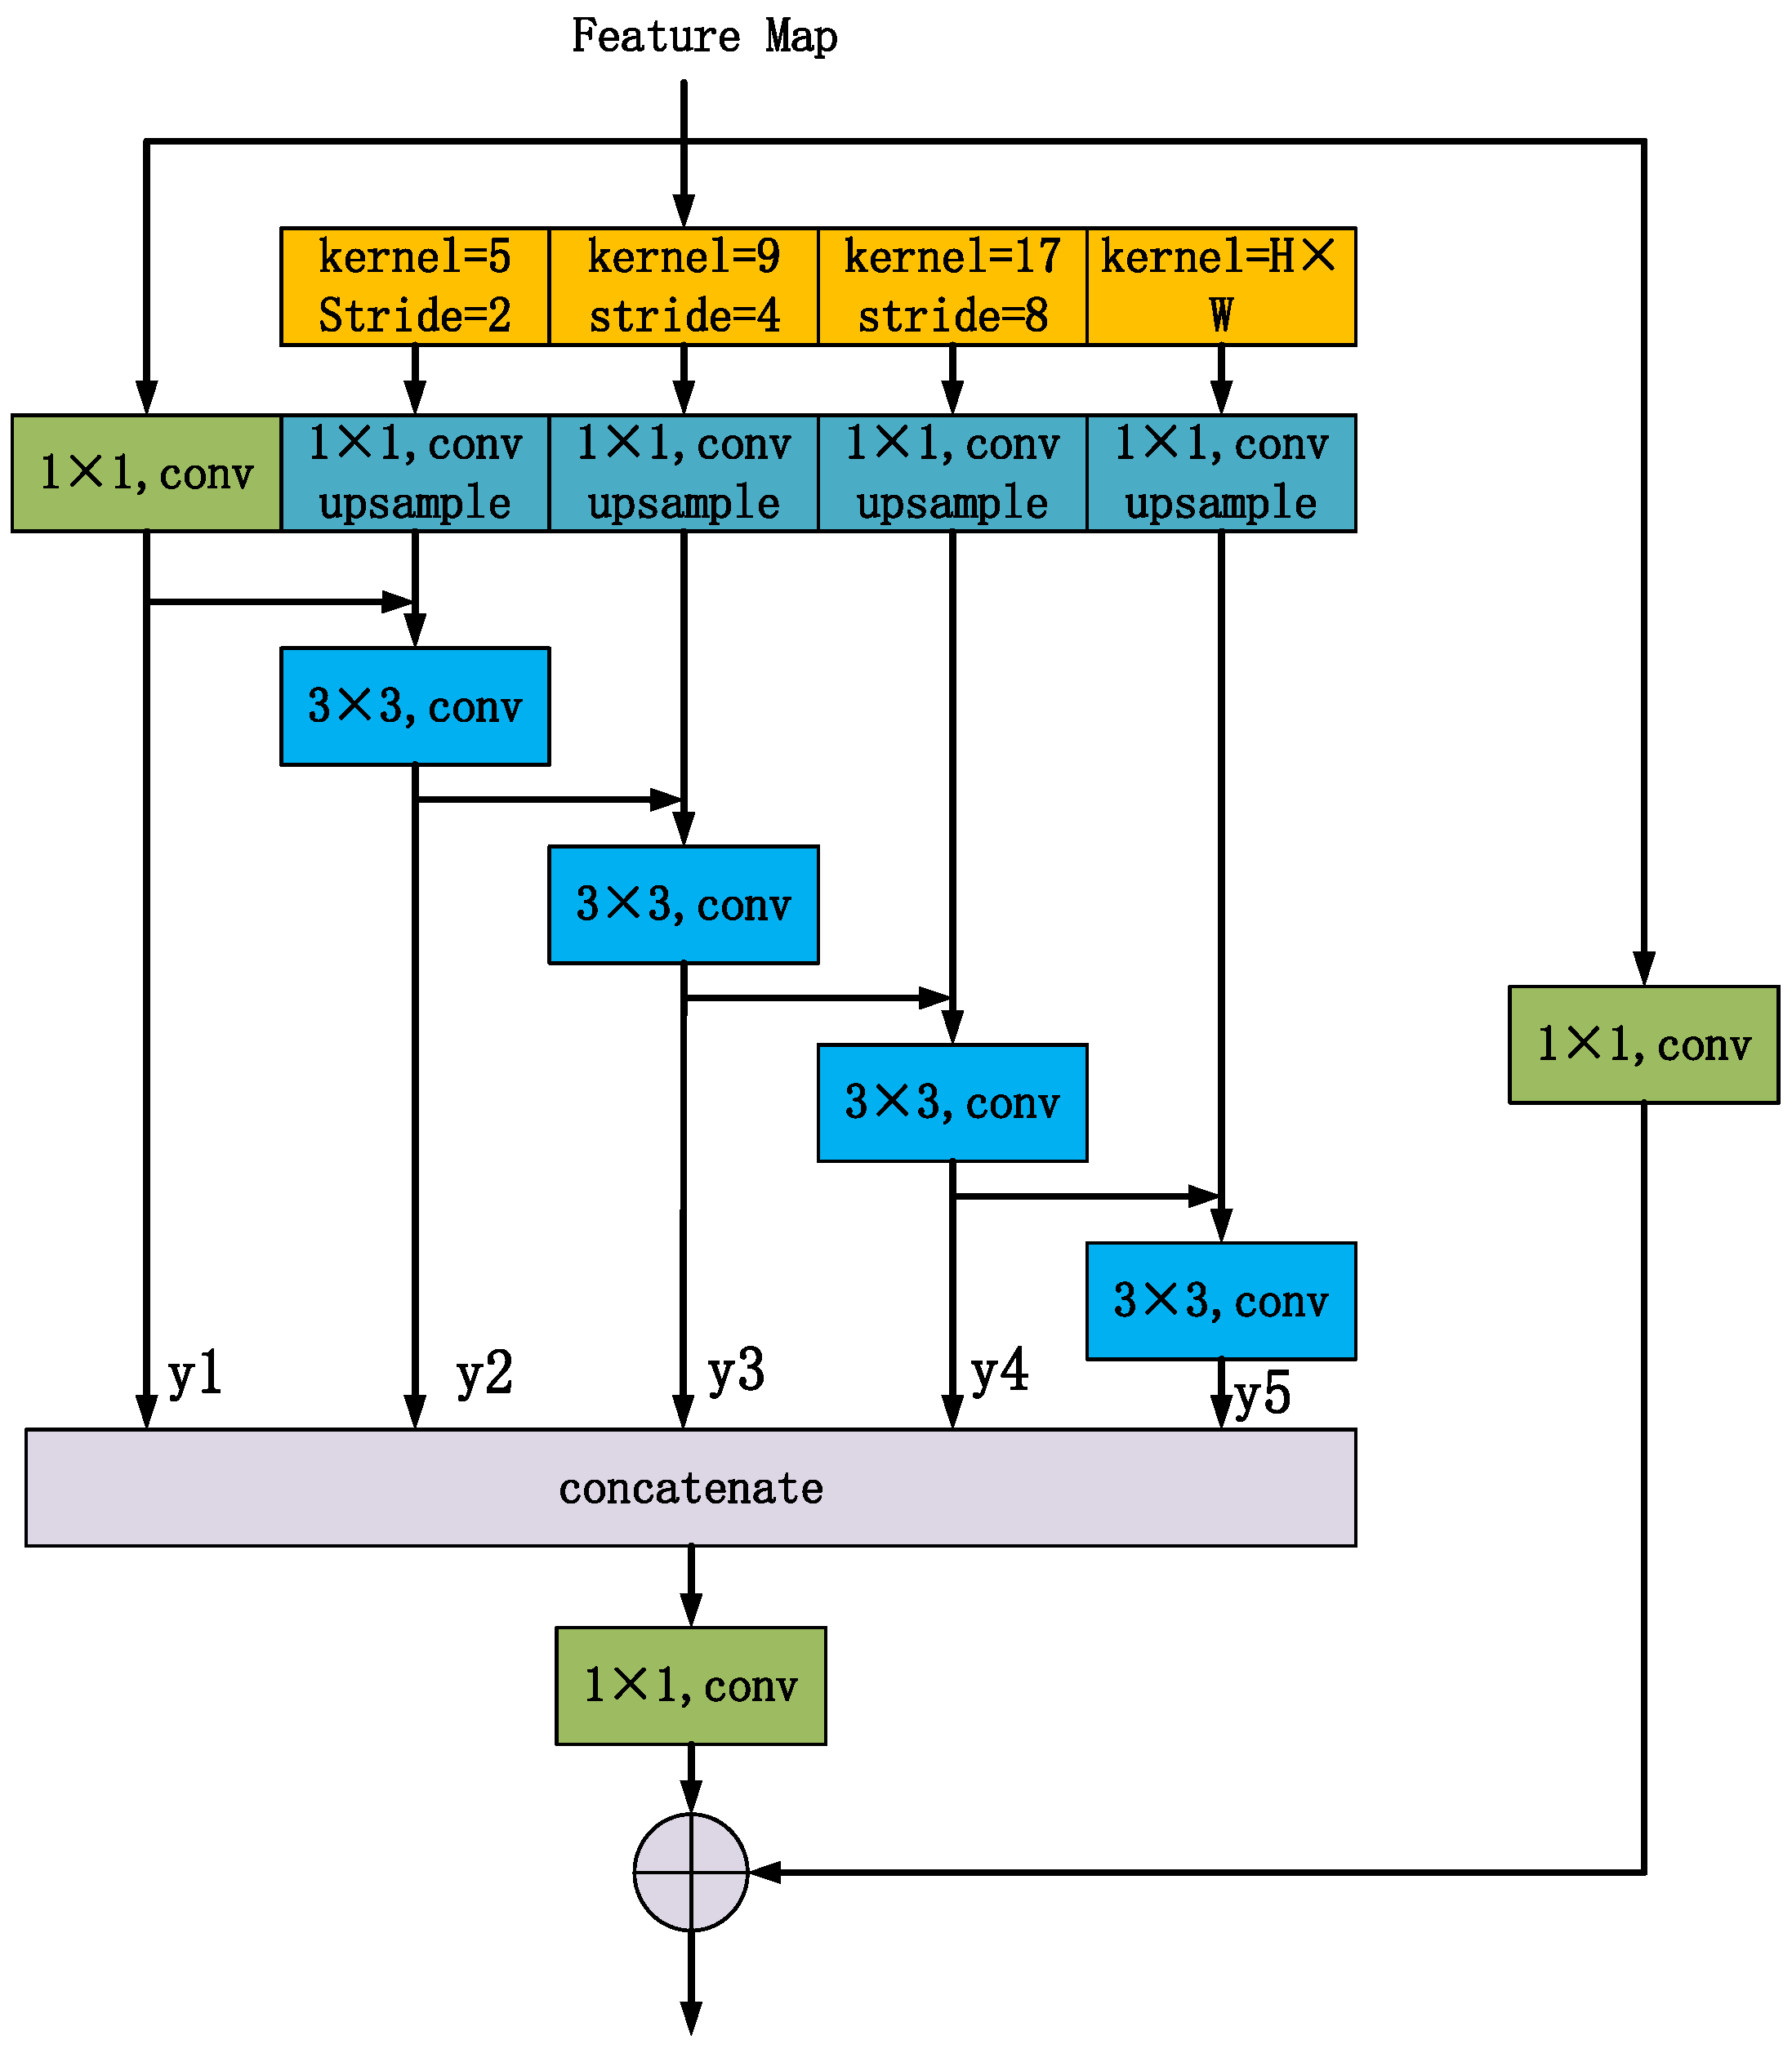
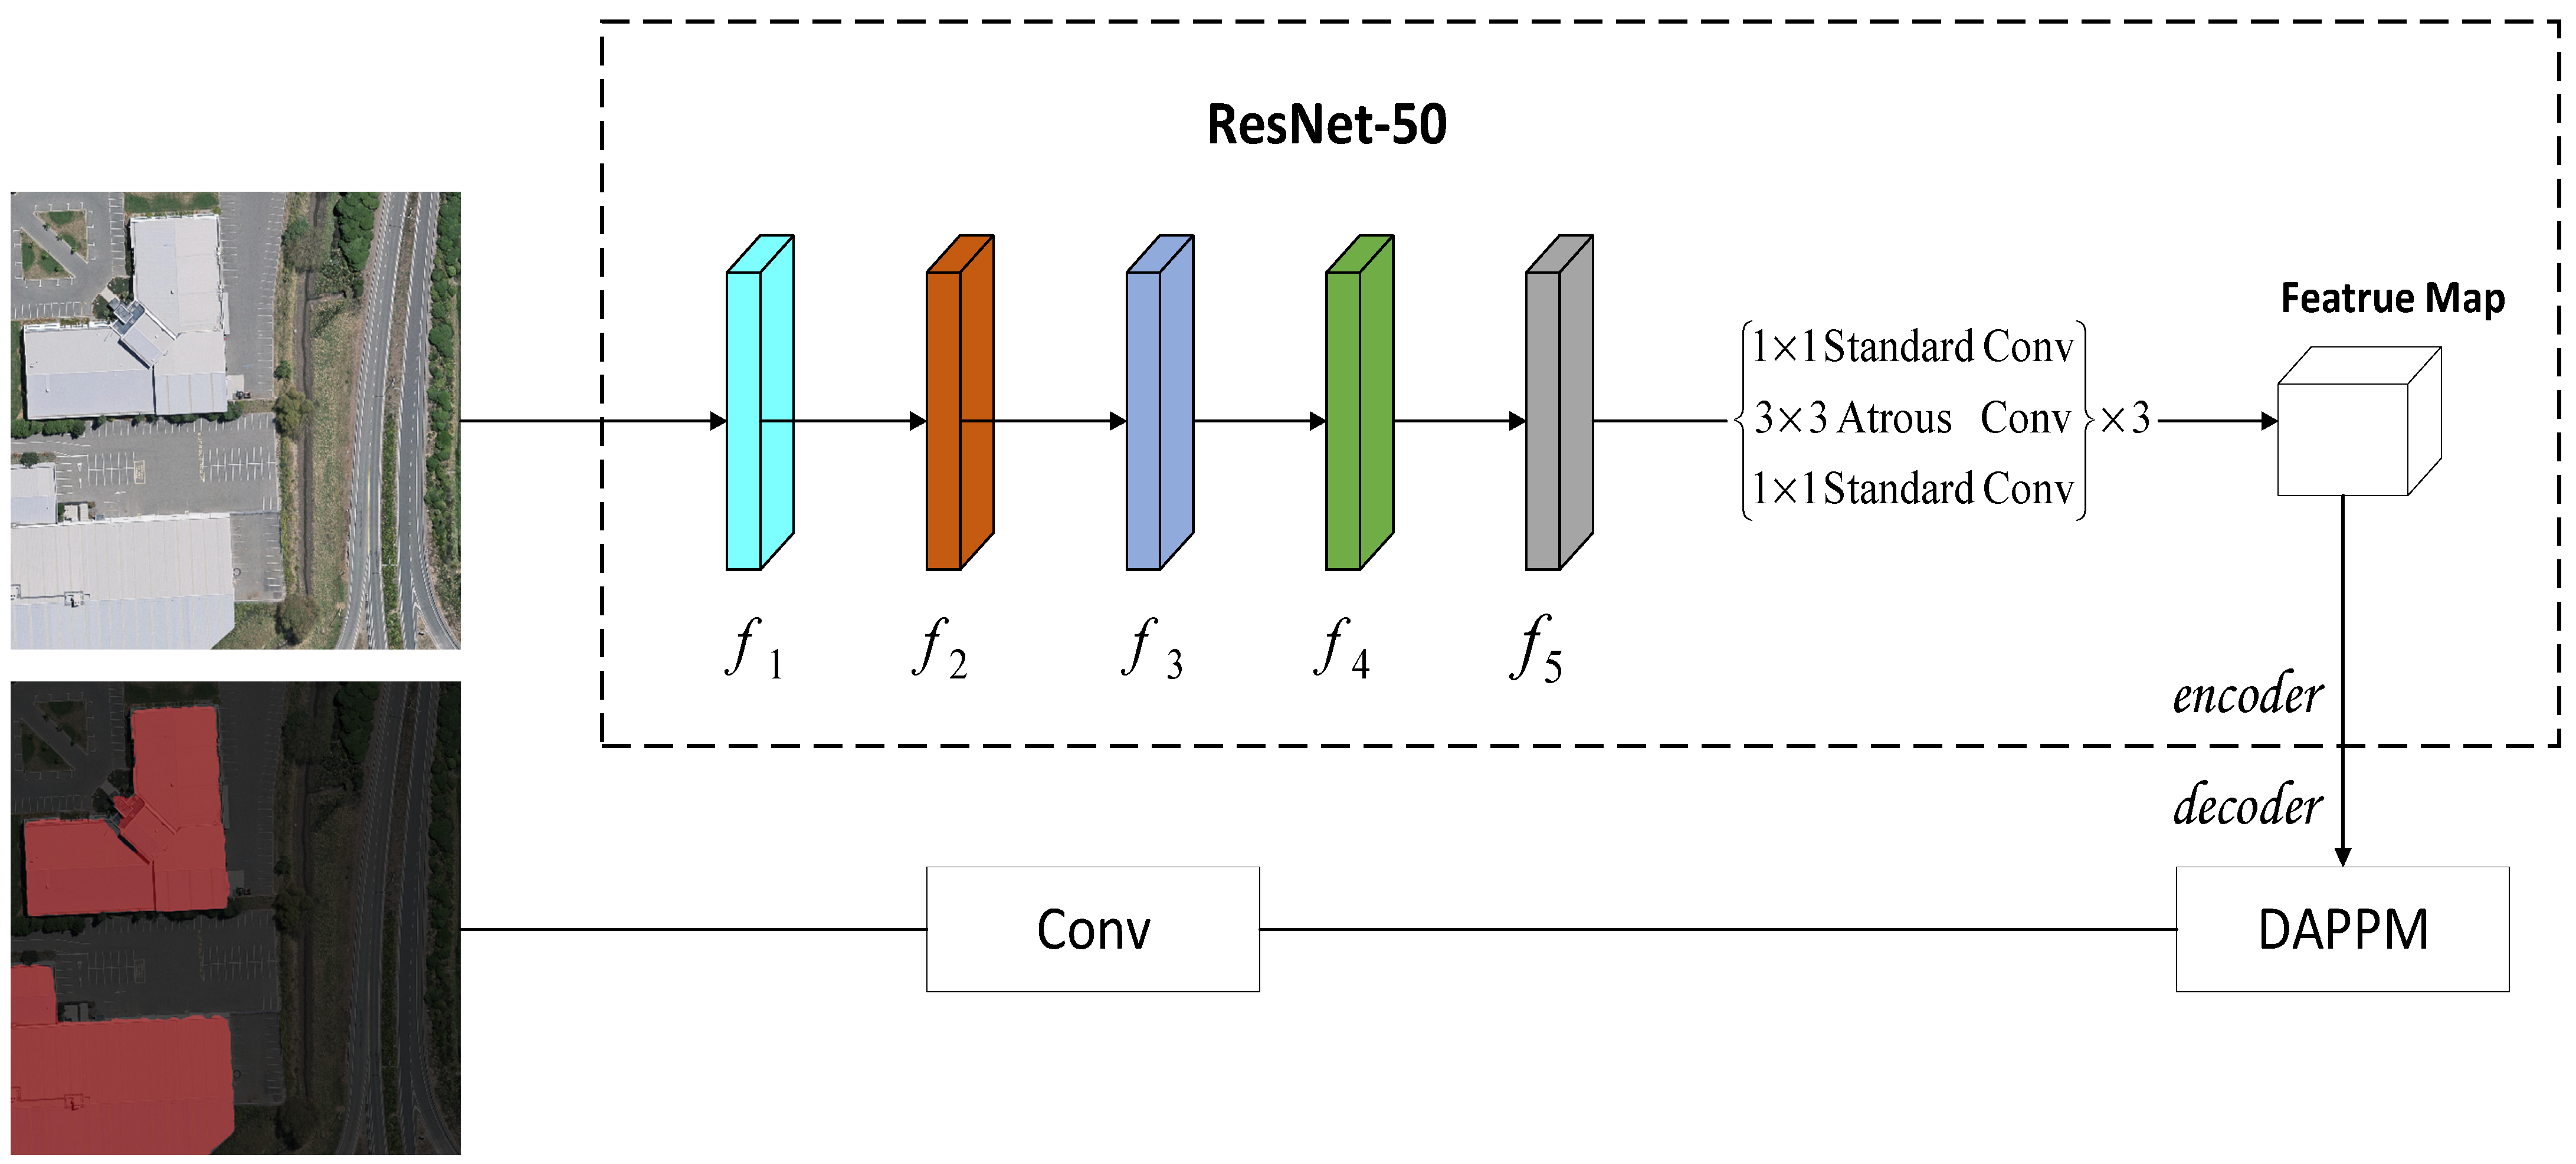
2.1.1. Improved PSPNet

When encountering more complex architectural scenes, the full convolutional neural network does not have enough access to the global category information in the image scene and cannot obtain the global information of the image scene [25]. In order to obtain multi-scale features, Zhao et al. [26] proposed a Pyramid Scene Parsing Network (PSPNet) in 2017. PSPNet is mainly composed of a feature extraction module and a Pyramid Pooling Module (PPM). The Pyramid Pooling Module can extract multi-scale features and aggregate contextual information from different regions, which is a good solution to the problem of not being able to fully access the category information. PSPNet firstly extracts the feature maps with downsampling through the ResNet-50 backbone, then extracts the features at the four pyramid scales of 1, 2, 3, and 6 through the Pyramid Pooling Module, and then uses the bilinear interpolation to upsample the input feature map size and splice it with the input feature map to obtain the global features. Finally, the segmentation map is generated by the convolutional layer to extract the accurate building roof contour. The structure of the original PSPNet is shown in Figure 3.
Although the PPM in the original PSPNet can capture multi-scale contextual information, it only aggregates features at the last layer of the pyramid and cannot achieve deeper feature fusion. This results in PSPNet are unable to accurately capture detailed information, such as edges and textures of building roofs, when extracting roof contours from map images, resulting in the phenomenon of “holes” in segmentation results [27]. Therefore, in this paper, the DAPPM is introduced into PSPNet, which connects feature maps of different levels in the series so that each pooling level can make use of feature information from deeper levels, thus further improving the contextual embedding ability of PPM and showing superior feature expression performance [28].
The internal structure of the DAPPM and the schematic structure of the improved PSPNet are shown in Figure 4 and Figure 5, respectively. The DAPPM, proposed by Hong et al. [29], can be viewed as a combination of deep feature aggregation and pyramid pooling, which takes as input feature on maps with a 1/64 image resolution and generates feature maps of 1/128, 1/256, and 1/512 input image resolutions. Using the input feature maps of 1/64 resolution and the image information generated by global average pooling, the feature maps are first upsampled using a 1 × 1 convolution, and then the context information of different scales is fused in a hierarchical–residual way using 3 × 3 convolution. For the input feature x, the calculation formula for different scale sizes is:
y i = { C 1 × 1 ( x ) , i = 1 C 3 × 3 ( U ( C 1 × 1 ( P 2 i + 1 , 2 i + 1 ( x ) ) ) + y i 1 ) ,   1 < i < n C 3 × 3 ( U ( C 1 × 1 ( P g l o b a l ( x ) ) ) + y i 1 ) ,   i = n
where C 1 × 1 is a 1 × 1 convolution, C 3 × 3 is a 3 × 3 convolution, U denotes upsampling operation, P j , k is a pooling layer with a kernel size of j and stride of k, and P g l o b a l denotes the global average pooling.

2.1.2. Building Roof Extraction Based on the Improved PSPNet

The extraction of building roofs using the improved PSPNet can be decomposed into the following steps:
(1)
Collection of the dataset: select some representative building images from the satellite map image of the planning area for labeling and appropriately add the WHU building dataset to prepare data for subsequent model training;
(2)
Construction of the segmentation model: build the model based on the improved PSPNet described above;
(3)
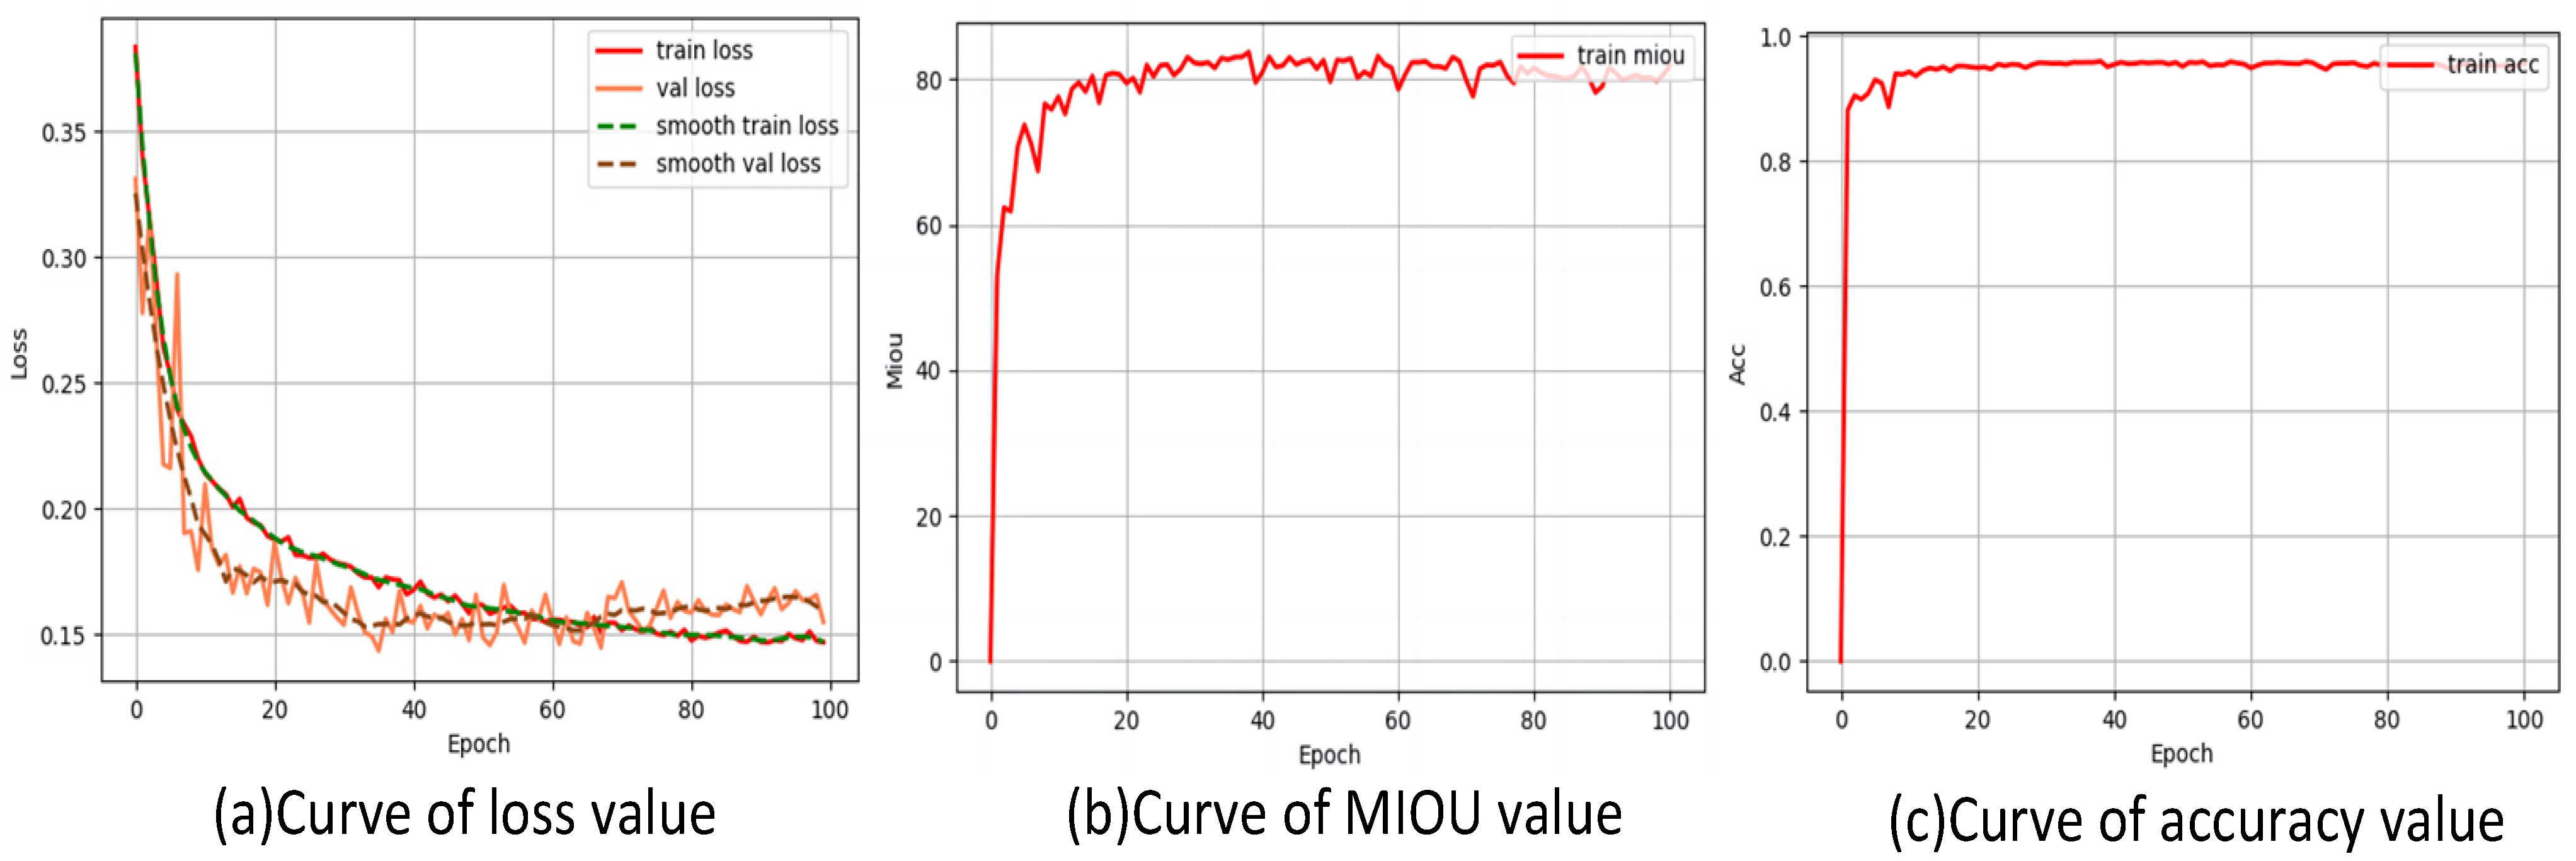
Training the PSPNet model: set reasonable initial training hyperparameters and continuously optimize and iterate its parameters during the training process to save the model parameters with the best performance;
(4)
Extraction of building roofs: based on the satellite map images of the planning area, segment and extract the building roofs associated with each distribution substation using the trained PSPNet model and analyze the experimental results.

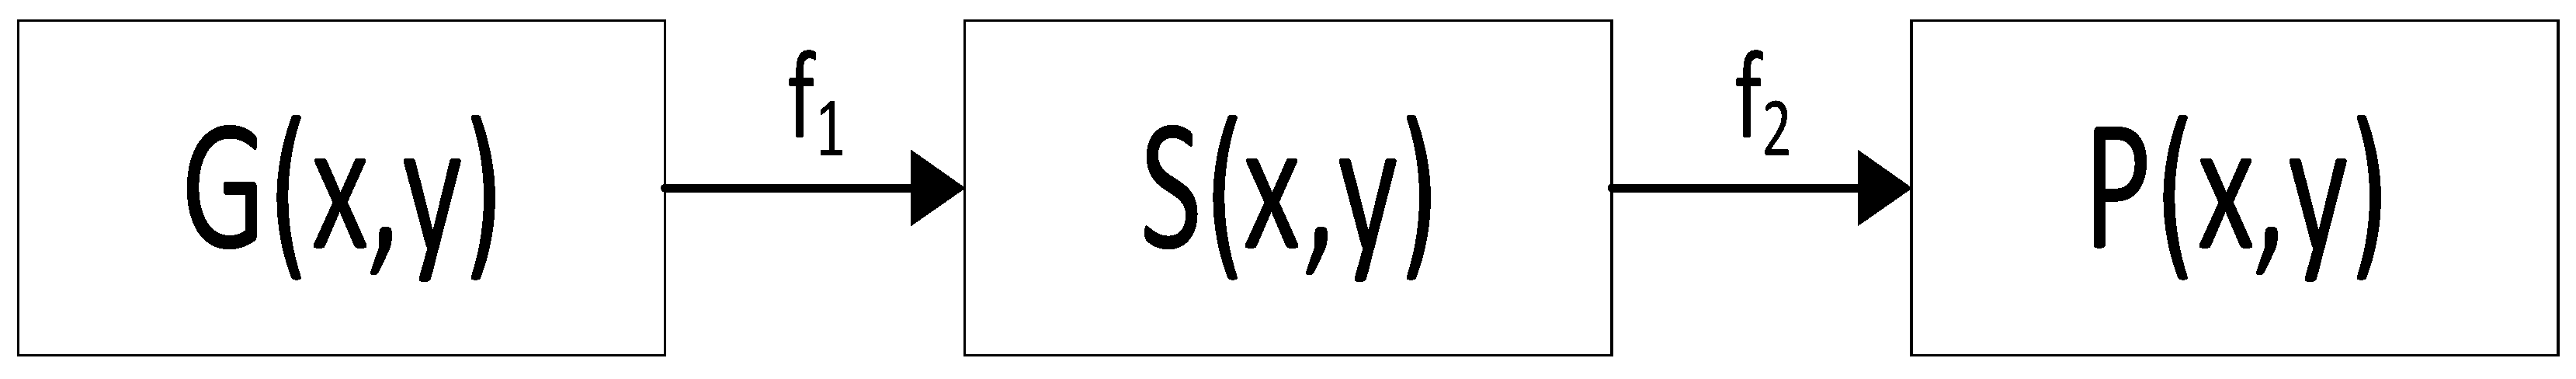
2.1.3. Estimation of Rooftop Photovoltaic Potential

Based on the number of pixels extracted from the roofs and the actual area represented by each pixel in Section 2.1.2, combined with the geographic location information of the distribution transformer and the roof, the Euclidean distance between each other is used to determine the distribution transformer to which the roof belongs and achieve the calculation of the rooftop area associated with each distribution substation.
In this paper, the proportion coefficient estimation method is used for the estimation of rooftop photovoltaic potential. The proportion coefficient includes the PV orientation coefficient and shade coefficient, of which the orientation coefficient mainly takes into account the orientation and flatness of the roof, and the shade coefficient mainly takes into account the occupancy of various types of equipment on the roof, so the specific value needs to be derived through the actual situation of the specific area [30]. We select common 245 W solar photovoltaic cell modules, which can install 150 W solar photovoltaic cells per square meter. Based on the above analysis, the rooftop photovoltaic potential of each distribution substation supply area can be calculated using Equation (2).
P k = S k × f 1 × f 2 × C
where S k is the rooftop area associated with the distribution substation, f 1 denotes the PV orientation coefficient, f 2 denotes the shading coefficient, C denotes the capacity of solar PV cells that can be installed per square, and k denotes the distribution substation number.

2.2. Multi-Level PV Hosting Capacity Evaluation System for the Distribution System

The rooftop photovoltaic potential is relatively fixed due to resource constraints, such as solar irradiance and building rooftop area. For grid corporations, it is more practical to evaluate the PV hosting capacity of distribution networks in typical operating scenarios based on understanding the spatial distribution of rooftop photovoltaic potential. Therefore, based on Section 2.1, this section constructs an evaluation system for PV hosting capacity, which is used to evaluate the hosting capacity and weaknesses of the distribution system after large-scale rooftop PV access.

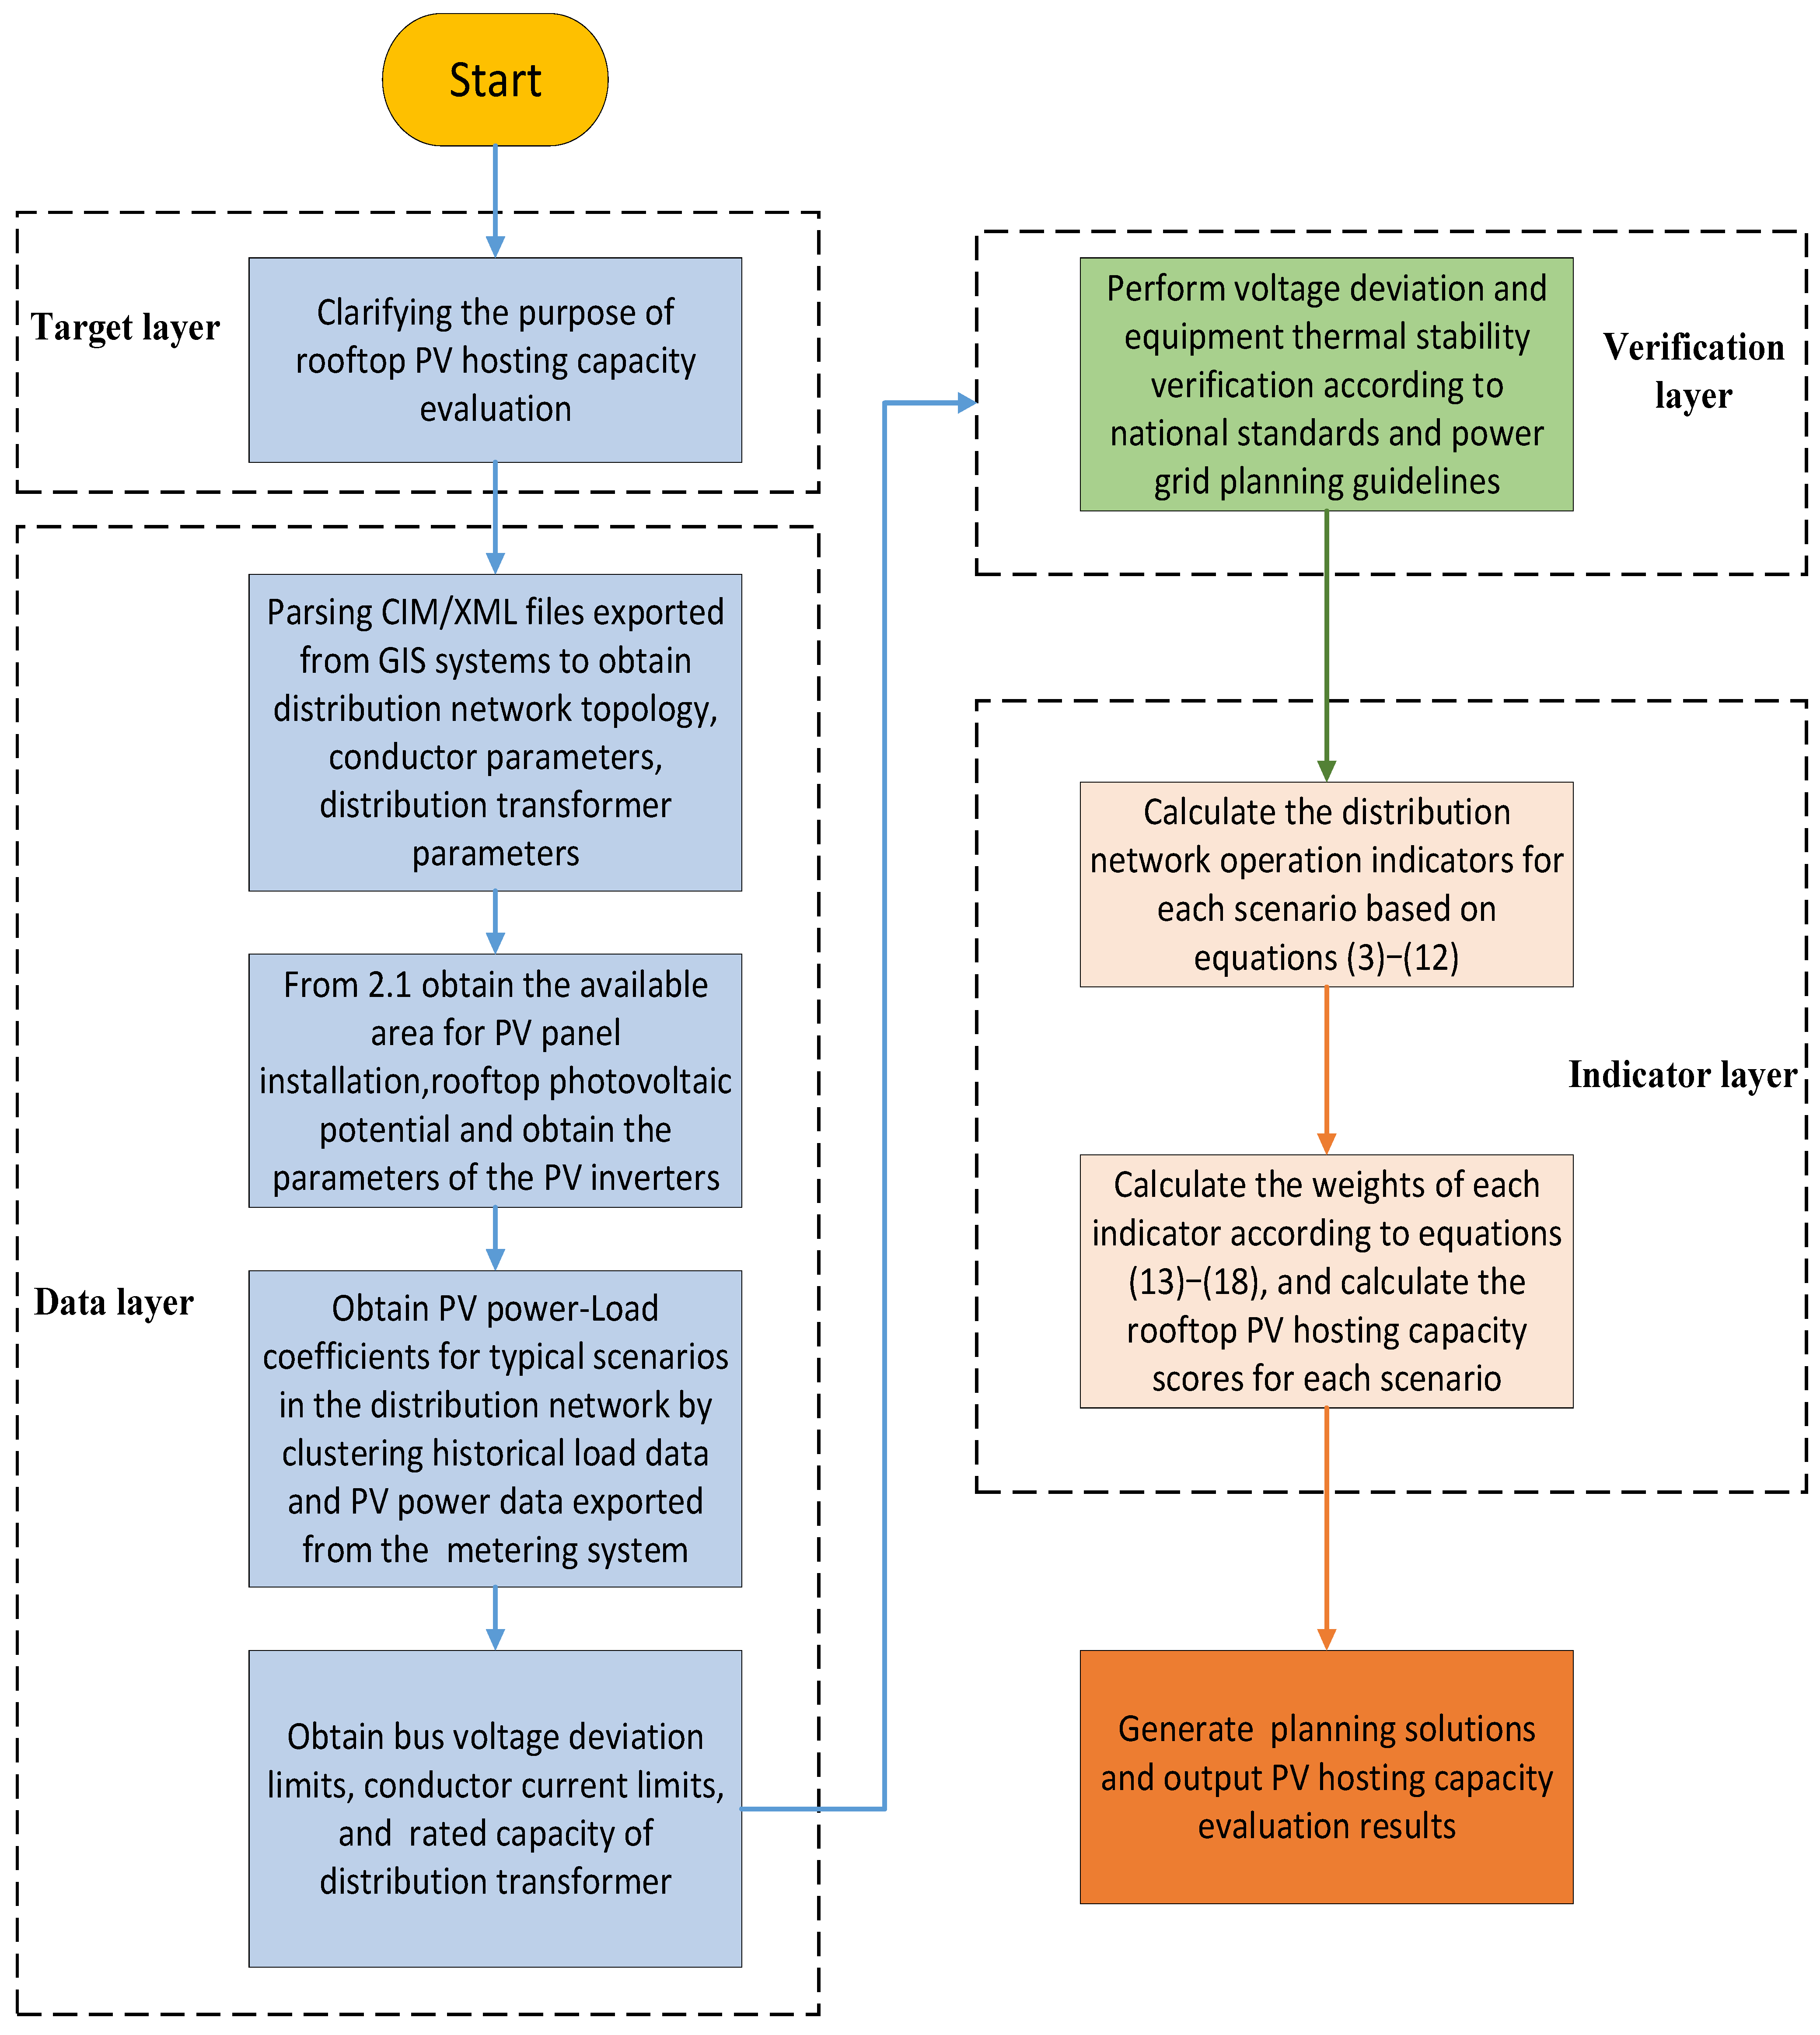
2.2.1. Data Preparation

The hosting capacity of rooftop PV access to the distribution system is evaluated on the basis of data such as installed rooftop PV capacity information, grid equipment parameters, geographic location information, grid topology, grid operation data, and grid security constraints in the planning area. According to the “Technical guideline for evaluating power grid bearing capability of distributed resources connected to network” [31], the data requirements can be categorized into four categories: grid equipment data, photovoltaic installation data, typical operation scenarios data, and security constraint data, as follows:
(1)
Grid equipment data. These include the CIM/XML file of the distribution system to be evaluated and the Scalable Vector Graphics (SVGs) of the primary wiring diagram based on it, the conductor models, lengths, and unit equivalent impedances of each branch of the distribution system, and the distribution transformer models;
(2)
Photovoltaic installation data. The available area for PV panel installation, rooftop photovoltaic potential, and power factor adjustment range of photovoltaic inverters;
(3)
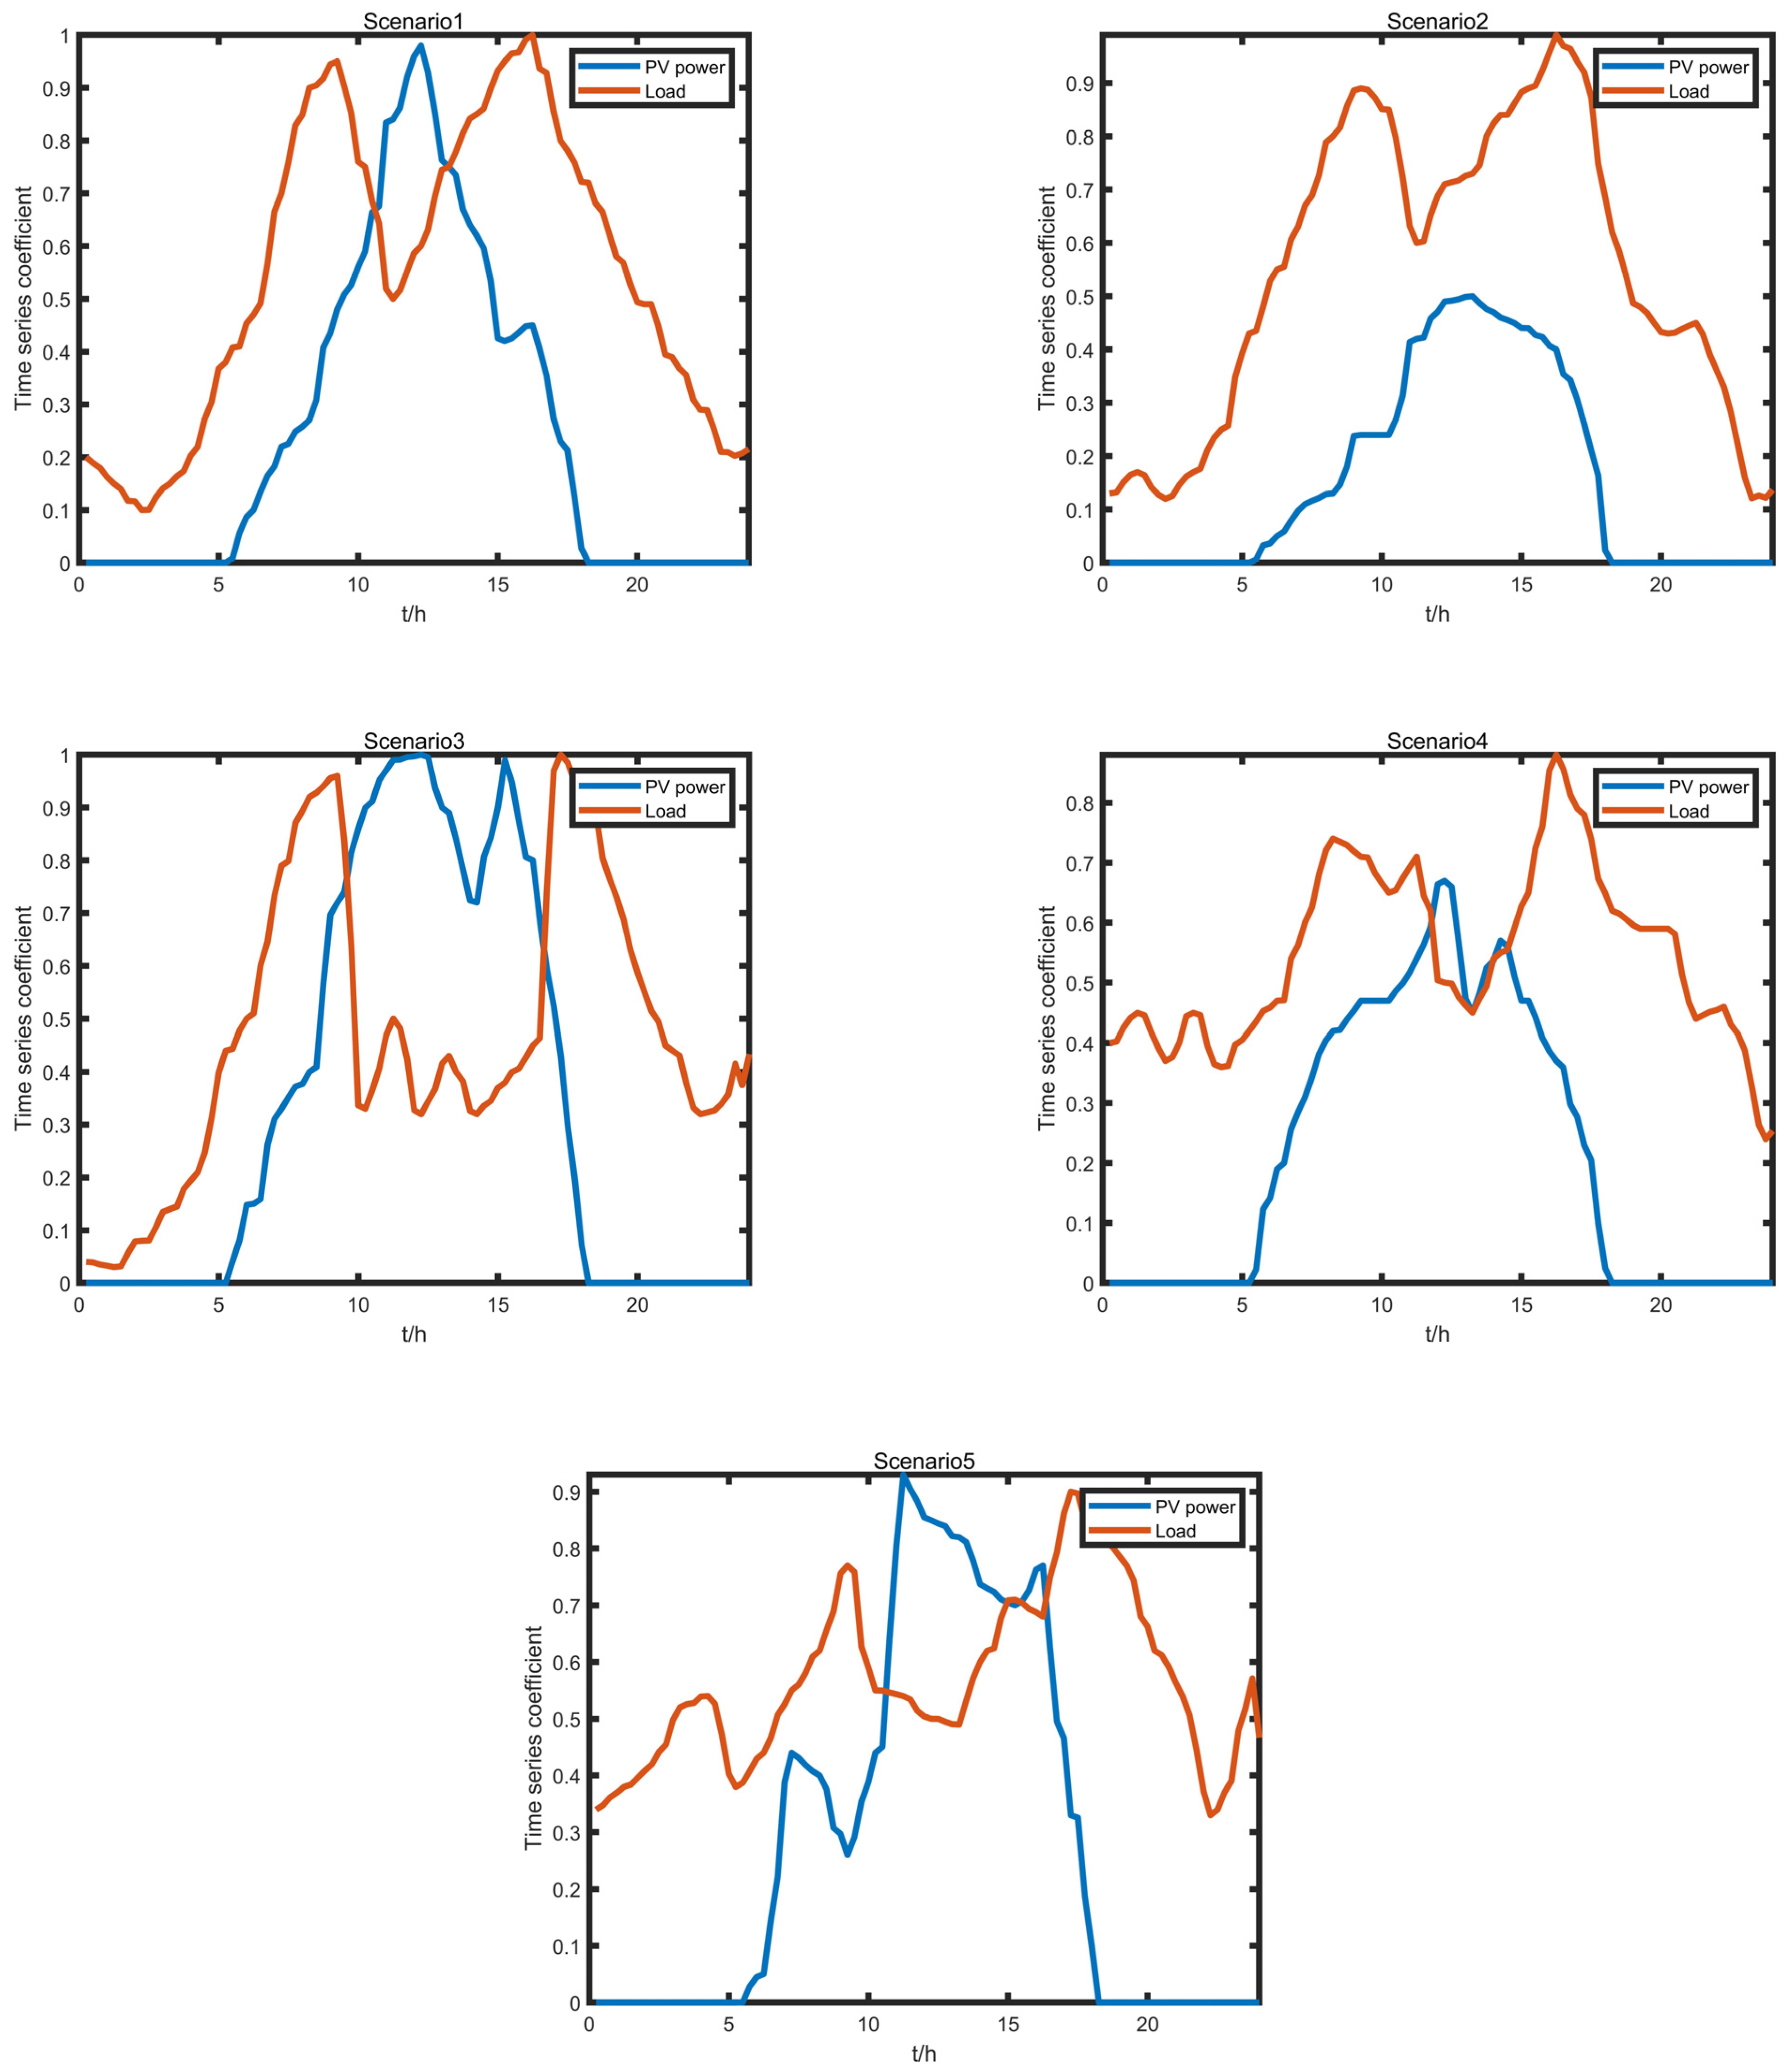
Typical operation scenario data. These include typical time-series data of rooftop photovoltaic power and load in each distribution substation supply area;
(4)
Security constraint data. These include bus voltage deviation limits, conductor current limits, and rated capacity of distribution transformers.

2.2.2. Construction of a Multi-Level PV Hosting Capacity Evaluation System

The evaluation system consists of four layers, as shown in Figure 6. The first layer is the target layer, the second layer is the data layer, the third layer is the verification layer, and the fourth layer is the indicator layer. The target level indicates the purpose of the entire evaluation system. In the data layer, we prepare data for the evaluation of the PV hosting capacity of the distribution system. The data sources mainly include the GIS system, the metering system of the distribution network, and the rooftop PV potential estimation model. In the validation layer, we determine whether the safety indicators of the distribution system exceed the limit through power flow calculation. The PV hosting capacity is evaluated to ensure safe and stable operation of the current grid, mainly including voltage deviation verification and thermal stability verification of conductors and distribution transformers. According to relevant Chinese standards [31,32], the evaluation basis for feeder failure to meet voltage deviation verification is that the voltage deviation exceeds ±7% of the rated value for five consecutive moments, the evaluation basis for feeder failure to meet conductor thermal stability verification is that the conductor current exceeds the current limit for five consecutive moments, and the evaluation basis for the failure of the distribution transformer to meet the thermal stability verification is that the load rate (or reverse load rate) of the distribution transformer exceeds 80% for five consecutive moments. In the indicator layer, we calculate the operation indicators of the distribution system and visually quantify the comprehensive score for each typical scenario. Among them, safety indicators include the average voltage excursion index (AVEI) and the average voltage qualification rate (AVQR), economic indicators include the average line loss rate (ALLR), and flexibility indicators include the average net load fluctuation rate (ALFR) and the average photovoltaic penetration rate (APPR).

2.2.3. Indicator Calculation Model

(1)
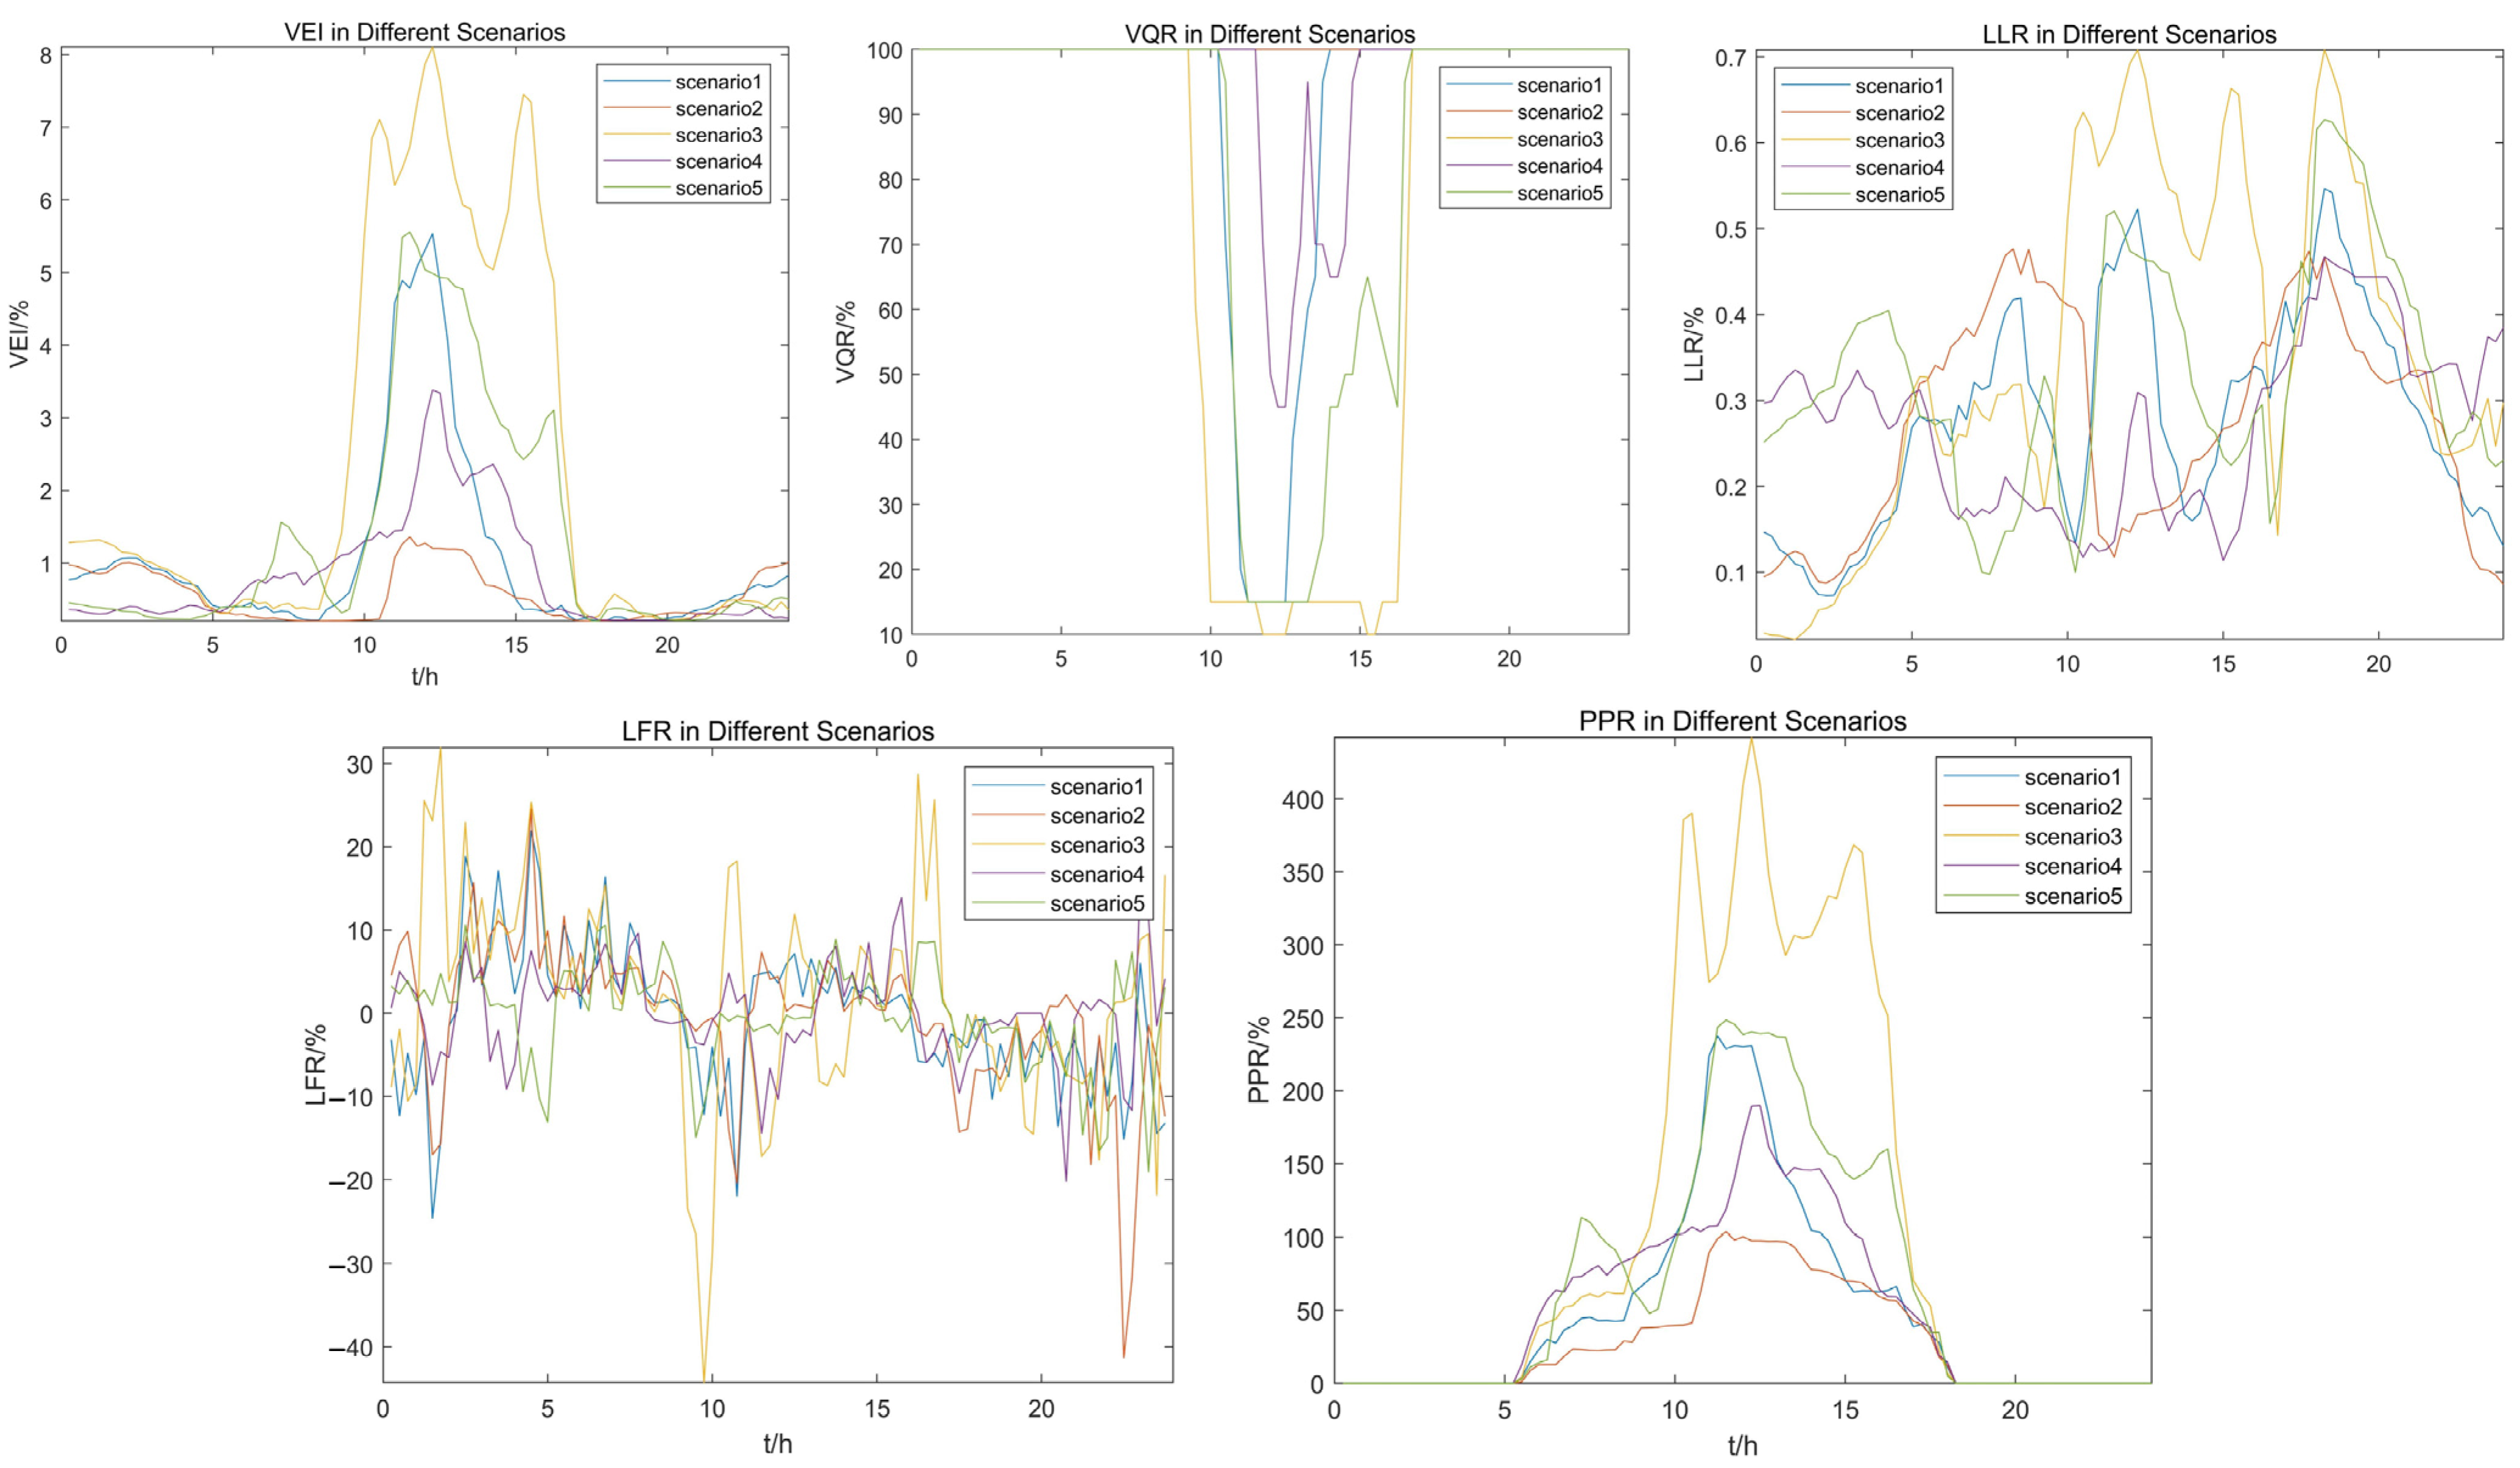
The average voltage excursion index (AVEI) reflects the degree of deviation of the node voltage value from the rated value in the distribution system after accessing rooftop PV in a certain operation cycle, and the smaller its value, the better:
V E I = i N ( U i , t U i , r a t e d ) 2 U i , r a t e d 2 × 100 %
A V E I = 1 96 t = 1 96 i N ( U i , t U i , r a t e d ) 2 U i , r a t e d 2 × 100 %
where U i , t denotes the actual value of the node voltage at node i at the moment; U i , r a t e d denotes the rated value of the node voltage; and N denotes the total number of nodes in the distribution system.
(2)
The average voltage qualification rate (AVQR) reflects the ratio of the number of qualified voltage nodes to the total number of nodes in the distribution system after accessing rooftop PV in a certain operation cycle, and the larger the value, the better.
V Q R = N V , t N × 100 %
A V Q R = 1 96 t = 1 96 N V , t N × 100 %
where N V , t denotes the number of nodes with qualified voltage in the distribution system at moment t.
(3)
The average line loss rate (ALLR) reflects the overall network losses in the distribution system after accessing rooftop PV in a certain operation cycle, and the smaller its value, the better:
L L R = P l o s s , t P c , t × 1 00 %
A L L R = 1 96 t = 1 96 P l o s s , t P c , t × 100 %
where P l o s s , t and P c , t denote the total loss and the total power transmitted at moment t of the distribution system, respectively.
(4)
The average net Load fluctuation rate (ALFR) reflects the intensity of net load fluctuation per unit of time in the distribution system after accessing rooftop PV in a certain operation cycle, and the smaller its value, the better:
L F R = | P t P t 1 | P t × 100 %
A L F R = 1 96 t = 1 96 | P t P t 1 | | P t | × 100 %
where P t and P t 1 denote the net load of the distribution system at moments t and t − 1, respectively.
(5)
The average photovoltaic penetration rate (APPR) reflects the ratio of PV power to total load in the distribution system after accessing rooftop PV during a certain operation cycle, and the larger its value, the better:
P P R = i D P i , t D G P t × 100
A P P R = 1 96 t = 1 96 i D P i , t D G P t × 100 %
where P i , t D G denotes the PV power of node i at moment t in the distribution system.

2.2.4. CRITIC Method

In the CRITIC method, the objective weight of each indicator is calculated by the amount of information contained in the indicator data, which is expressed by the standard deviation and correlation coefficient between indicators. As an improvement of the entropy weight method, it fully expresses the volatility and conflict between indicators and has strong engineering practical value [33]. Therefore, in this paper, the CRITIC method is adopted to further quantify the above indicators to derive the evaluation scores of the PV hosting capacity of the distribution system under typical operating scenarios, and its specific calculation steps are described below:
(1)
Indicator Normalization
Due to the different scales of the indicators, it is necessary to standardize the indicators, so the normalization matrix is obtained from the indicator matrix (dimension is m × n, where m is the number of scenarios, n is the number of indicators). Indicators are generally divided into positive and negative indicators, of which positive indicators are also known as benefit-based indicators, and larger indicators are better; negative indicators are also known as cost-based indicators, and smaller indicators are better. The normalization formula for positive indicators is:
S i j = S i j min ( S j ) max ( S j ) min ( S j )
The normalization formula for the negative indicator is:
S i j = max ( S j ) S i j max ( S j ) min ( S j )
(2)
Calculation of Information Carrying Capacity
The CRITIC method reflects the volatility and conflict between indicators by standard deviation and correlation coefficient. The larger the standard deviation of the data, indicating greater volatility, the higher the weighting. If the value of the correlation coefficient between the indicators is larger, indicating less conflict, the lower its weight. The formulas for the calculation of the two are as follows:
ζ j = 1 m i = 1 m ( S i j S j ¯ ) 2
r i j = cov ( S i , S j ) ( ζ i , ζ j )
where ζ j is the standard deviation of the jth indicator; r i j is the correlation coefficient between the ith indicator and the jth indicator; and S i and S j are the ith and jth columns of the normalized matrix S′, respectively.
The information carrying capacity of the jth indicator is calculated as follows:
C j = ζ j i = 1 n ( 1 r i j )
The larger C j is, the greater the weight of the indicator in the evaluation system.
(3)
Calculation of Indicator Weights
W j = C j j = 1 n C j

3. Results and Discussion

This section verifies the effectiveness of the proposed method using the actual 10 kV distribution system shown in Figure 7. By parsing the CIM/XML file exported from the GIS system [34], the grid equipment data and safety constraint data of the distribution system are obtained, as shown in Appendix A, Table A1. The reference voltage of the distribution system is 10 kV. The system consists of 20 nodes, among which node 1 is the superior 35 kV substation node. All nodes are planned to be connected to rooftop photovoltaics, and the rooftop photovoltaics are collected and connected to the 0.4 kV low-voltage side of the distribution transformer [35]. By clustering the analysis of the load and photovoltaic power data exported from the distribution network metering system in this area, the PV power load time-series coefficients for five typical scenarios are obtained, as shown in Figure 8. Based on the above multi-source data, the PV hosting capacity of the distribution network in the example is evaluated. The load of each distribution substation at each moment is the basic load multiplied by the corresponding time-series coefficient value, in which the base values of active loads of each node are shown in Appendix A, Table A1. The PV power of each distribution substation at each moment is the rooftop photovoltaic potential multiplied by the corresponding time-series coefficient value, the rooftop photovoltaic potential of each substation is derived from the estimation model in the methodology, and the power factor of the inverter is set to 0.98.

3.1. Estimation Results of Roof Photovoltaic Potential

3.1.1. Dataset

In order to ensure the high accuracy of the improved PSPNet model in roof segmentation while maintaining good generalization ability, we select representative housing types in the research area, such as residential buildings, factory buildings, etc., and use the labelme tool to make labels. If the size of the image is not a multiple of 256, fill the edges with zero. A total of 1369 images of a resolution size of 256 × 256 were cut, while 6438 images similar to the roof types of the planning area were selected from the WHU Building Dataset [36], which forms the dataset of this paper. Of these, 70% are used for model training and 30% are used for model validation.

3.1.2. Parameter Settings

The model training is implemented through Pytorch. The detailed configuration of the hardware devices for model training is an NVIDIA GeForce RTX 2080 Ti with 11 GB of memory, and the versions of Python, Pytorch, and CUDA are 3.7.13, 1.12, and 10.2, respectively. Through several experiments, we select the Cross Entropy Function as the loss function and select the SGD algorithm for network parameter update. In order to accelerate the training speed of the model, the training stage of the improved PSPNet model is divided into freezing and unfreezing. Dropout is used to prevent overfitting, with an iteration number of 100, and the hyperparameter settings are shown in Table 1.

3.1.3. Evaluation Metrics

In order to evaluate the accuracy of the model, we select MIOU, MPA, accuracy, and F1 score, as well as times, parameters, and FLOPs as the evaluation metrics for segmentation, as shown in Table 2. Among them, TP is the number of positive classes predicted as positive classes; FN is the number of positive classes predicted as negative classes; FP is the number of negative classes predicted as positive classes; and TN is the number of negative classes predicted as negative classes.

3.1.4. Rooftop Photovoltaic Potential Estimation of Each Distribution Substation Supply Area and Precision Analysis

The improved PSPNet completes training after 100 iterations, and the variation curves of the loss function, MIOU, and accuracy obtained during the iteration process are shown in Figure 9. In the figure, it can be seen that the training loss rapidly decreases in the first 10 iteration rounds, gradually decreases in the 10 to 80 iteration rounds, and stabilizes around 0.150 after 80 iteration rounds. Validation loss rapidly decreases in the first 10 iteration rounds; then, it slowly decreases and gradually converges around 0.160. There is a difference between the training loss and the validation loss in the process of decline. The former shows a roughly monotonic decrease, while the latter has fluctuations, but both show a downward trend, which means that the loss function can effectively converge. MIOU and accuracy decrease and increase rapidly in the first 10 iteration rounds, respectively, and finally converge around 0.83 and 0.96, respectively, indicating that the accuracy of the model is improving and the model is effective in the building roof segmentation.
Table 3 shows the evaluation metrics of different models. The MIOU of the improved PSPNet on the validation set is 83.77%, which indicates that the predicted target of the model has a high degree of coincidence with the actual target. MPA and accuracy are 89.93% and 95.89%, respectively, which means that the model has high segmentation accuracy, and most pixel categories can be accurately predicted. F1 score is 0.9073, which shows that the model has high extraction accuracy and correctly abstracts most roofs; that is, it maintains a good balance between precision and recall. The model in this paper maintains a small number of parameters, calculation, and reasoning time while ensuring segmentation accuracy. Compared with the original PSPNet and deeplabv3+, MIOU increased by 1.53% and 3.32%, respectively, maintaining a good balance between accuracy and operation speed. The rooftop extraction of each model is shown in Figure 10. It can be seen that due to the introduction of the DAPPM, the improved PSPNet effectively solves the problem of “holes” in the segmentation results, and the extracted building edges are more complete.
The images used in this case are from a 19-level satellite image map, and the actual area of each pixel is 0.031 m2. Since the planning area in this paper is mainly rural, the vast majority of roofs are flat roofs and the house density is low, which are less used for other purposes, so the orientation coefficient f 1 and shading coefficient f 2 are taken as 0.9 and 0.8, respectively. According to the extraction results of the improved PSPNet model and Formula (2), the rooftop PV potential of each distribution substation supply area is shown in Table 4. It can be seen that the estimation of rooftop PV potential derived from the model in this paper is close to the actual value.

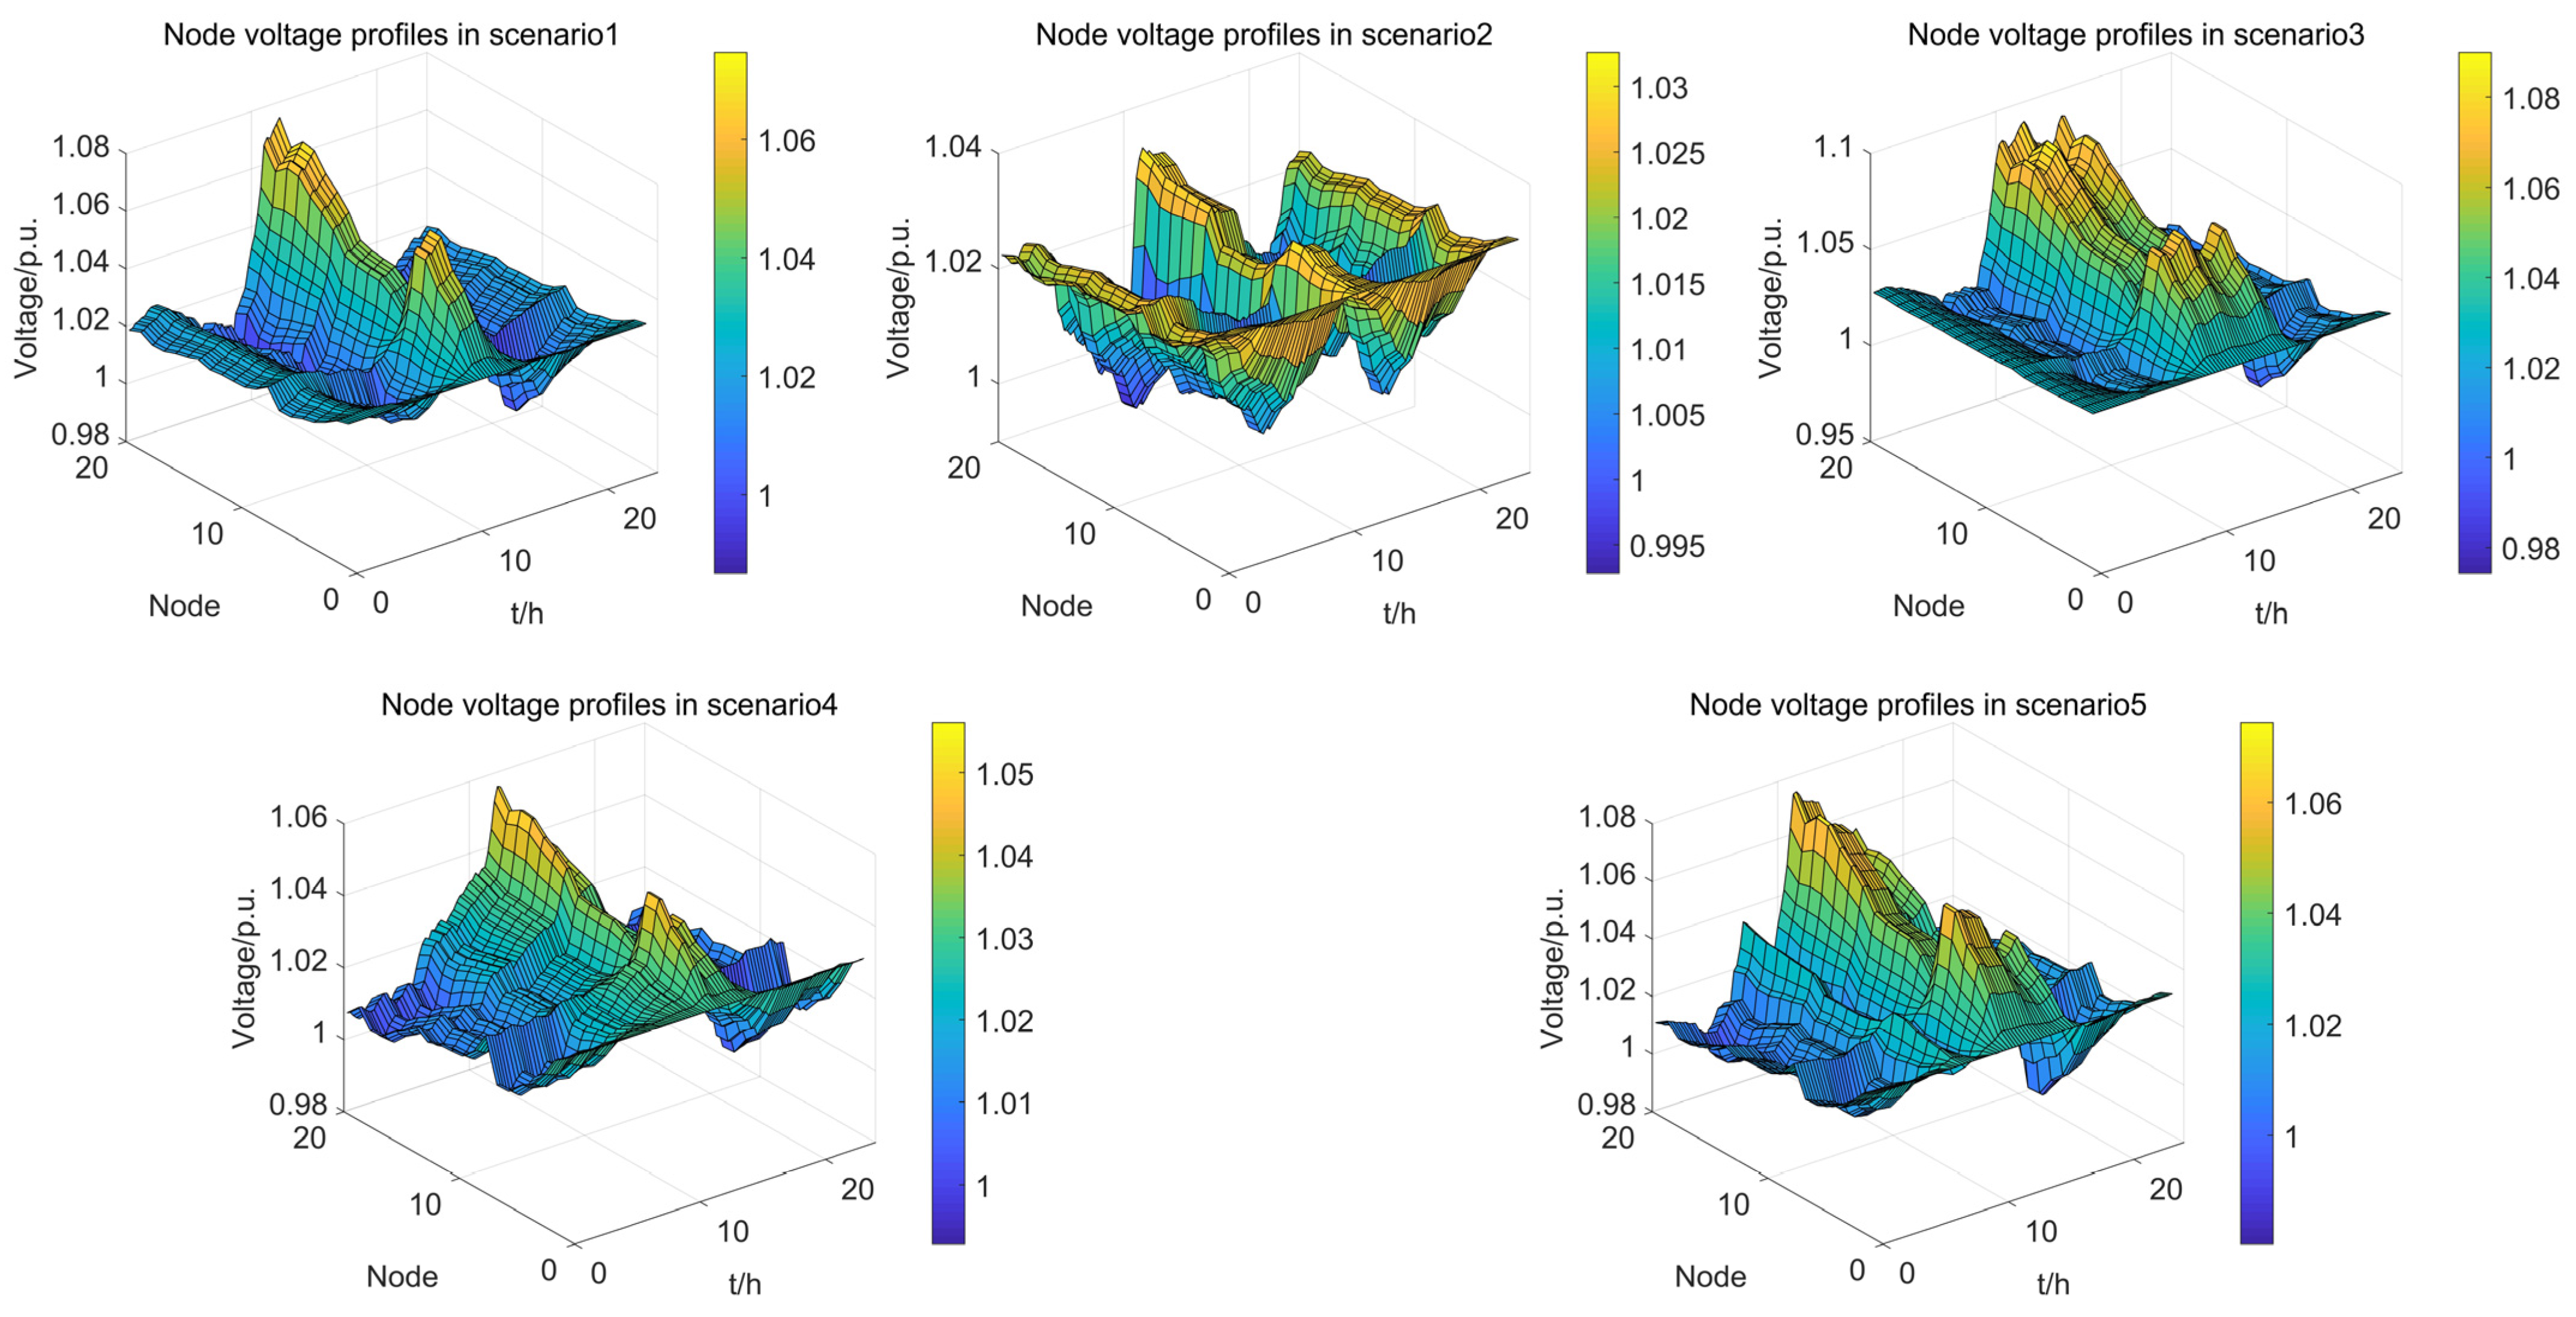
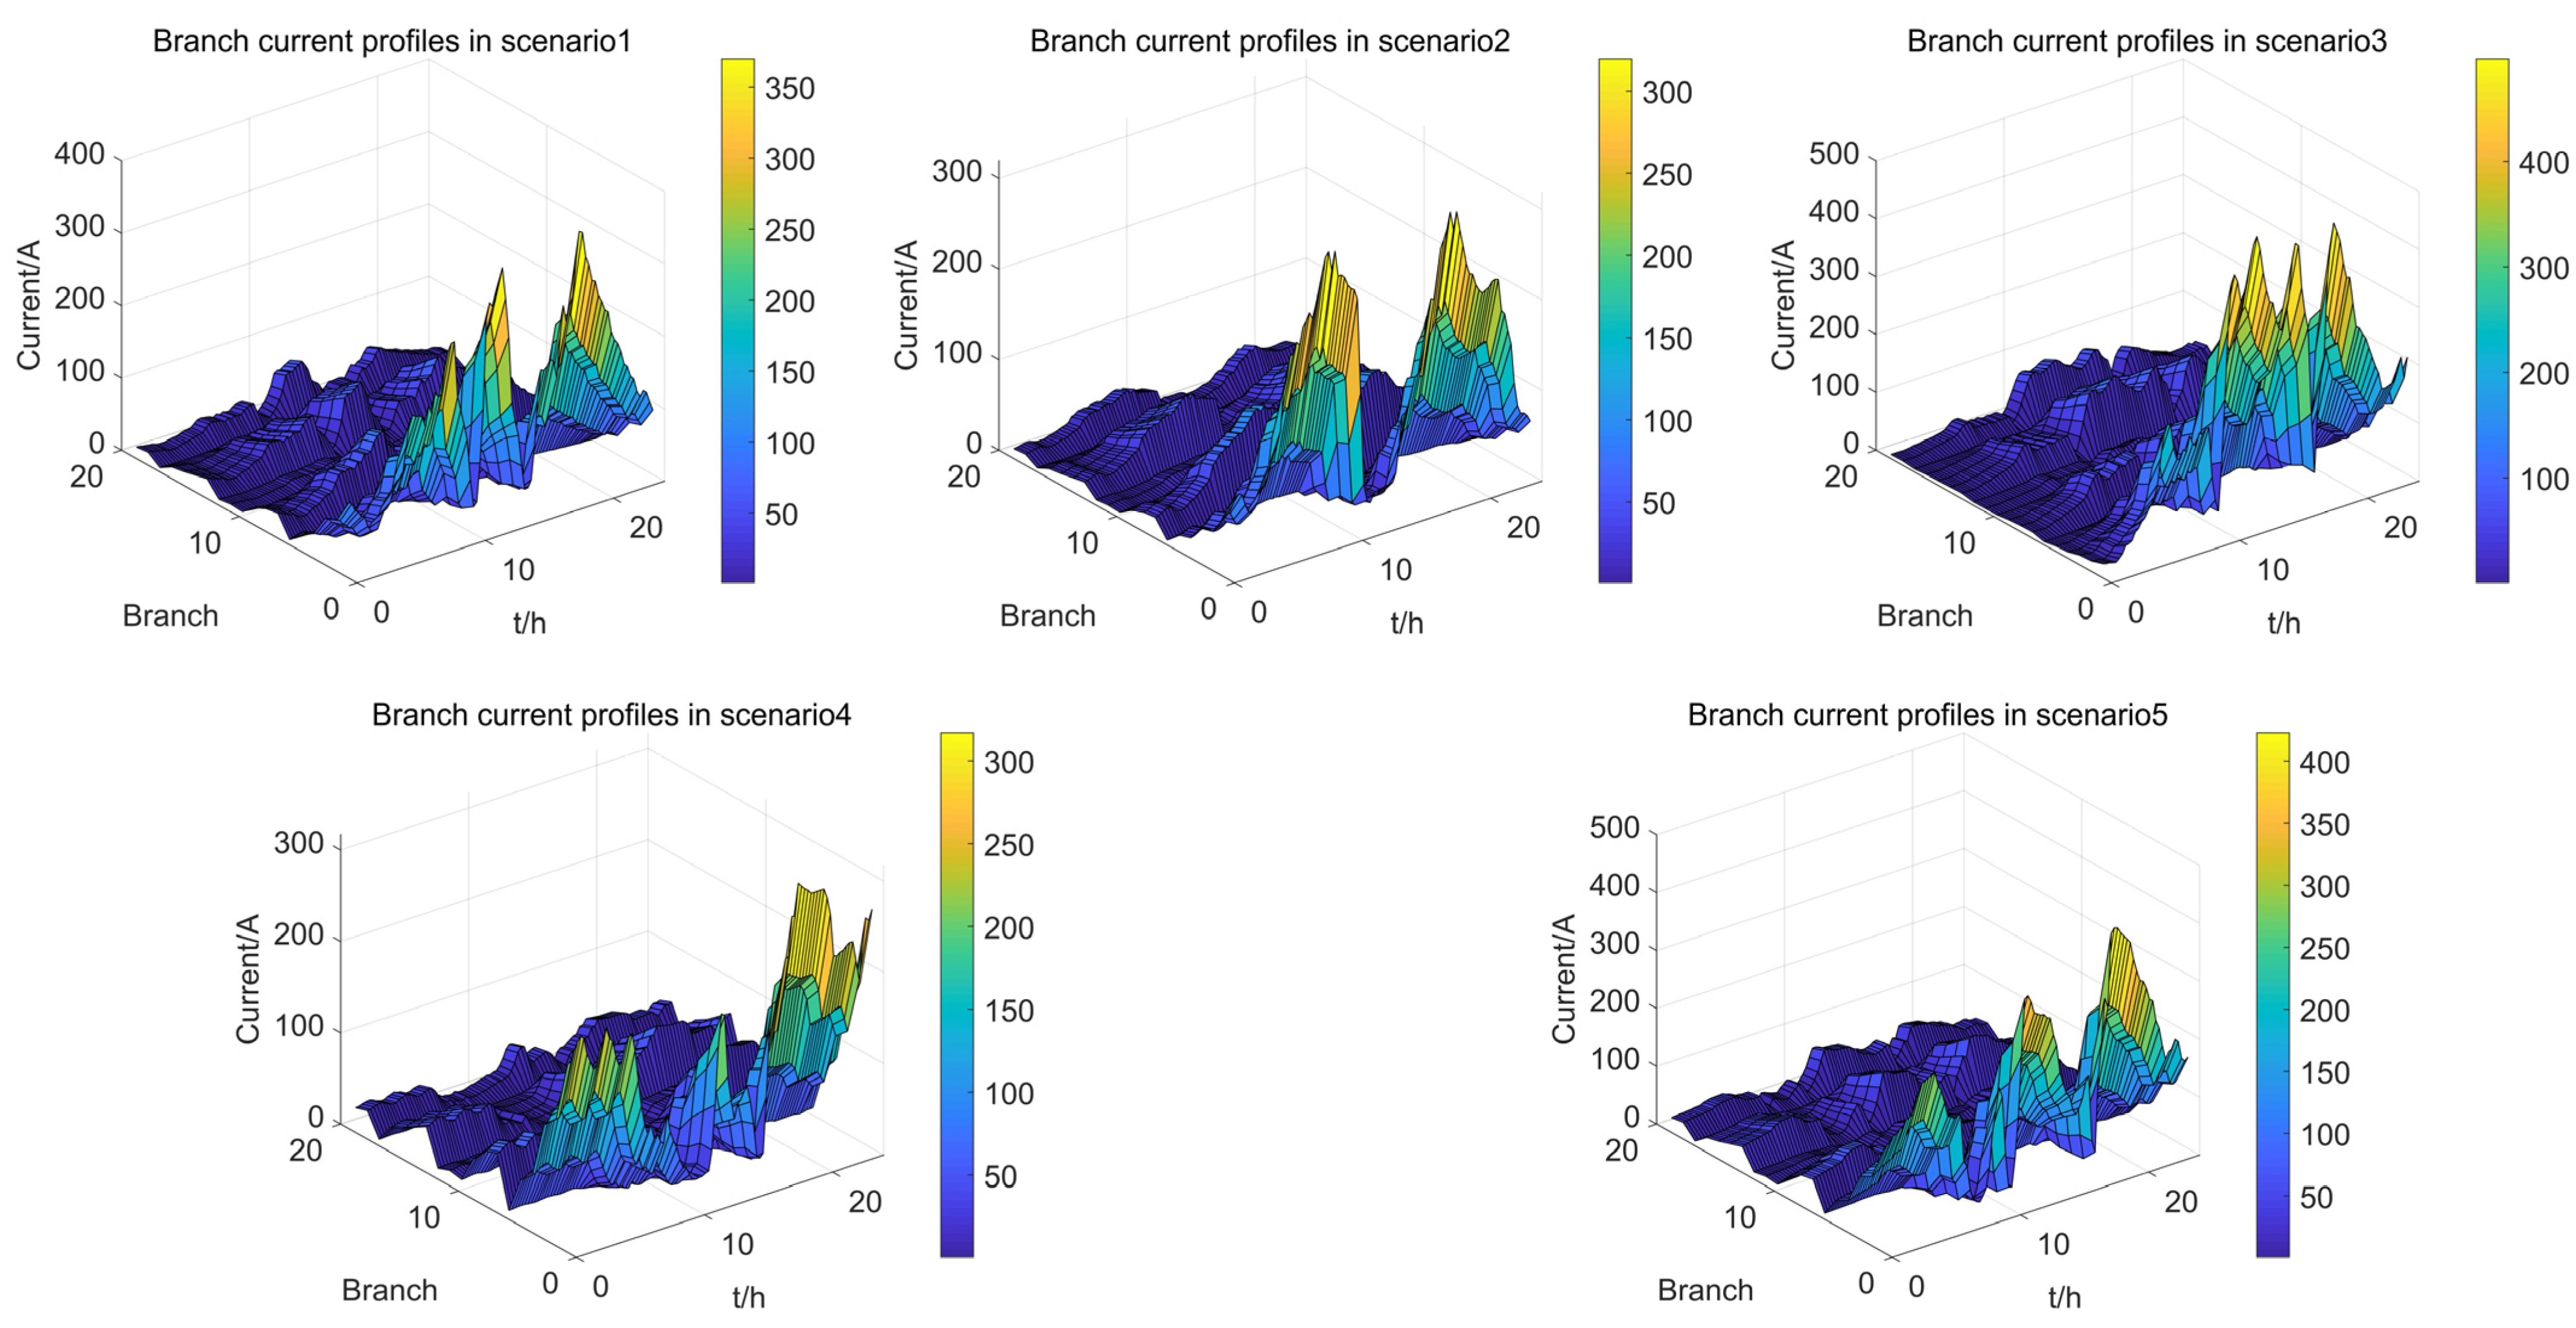
3.2. Result Analysis of Roof Photovoltaic Hosting Capacity Evaluation

Based on the estimation results of roof photovoltaic potential obtained in Section 3.1, the roof photovoltaic hosting capacity of each typical scenario is evaluated and compared. Firstly, in the verification layer, Figure 11 shows the voltage profiles of the distribution system in five scenarios, which shows that the access of rooftop PV has a lifting effect on the node voltage. In Scenario 3, the voltage of nodes 6, 7, 17, 18, 19, and 20 exceeds 1.07 pu for five consecutive moments, which does not meet the voltage deviation verification of hosting capacity evaluation. The reason is that the photovoltaic power of this scenario corresponds to sunny days, and the photovoltaic power at noon is significantly larger than the load of this period. In addition, the nodes where continuous voltage exceeds the limit are all located at the end of the feeder, which indicates that the voltage lifting effect is greater when PV is connected to the end of the distribution system. Other scenarios meet the voltage deviation verification.
Figure 12 shows the branch current profile of the distribution system in five scenarios. According to the conductor model and current limit value of each branch in Appendix A, Table A1, the current of branches 2 and 3 in Scenario 3 exceeded the maximum limit of 275 A for five consecutive moments or more, up to 364.98 A, which does not meet the conductor thermal stability verification. In Scenario 3, the reverse load rate of the distribution transformer in substation 2 continued to be greater than 80% for five moments, and the maximum reverse load rate reached 144%, which does not meet the thermal stability verification of the distribution transformer.
In the indicator layer, the security, economy, and flexibility indicators are calculated for each scenario of the distribution system, and the results are shown in Table 5 and Appendix A, Figure A1. It can be seen that the VEI of Scenario 3 is greater than the other four scenarios, and the VQR is the opposite, which is consistent with the simulation results of the verification layer. In Scenario 4, the appropriate PV power can improve the power flow distribution of the system and effectively reduce grid loss. Except for the low APPR, all the other indicators are at the top of the list, so Scenario 4 can achieve a good performance in both security and economic dimensions. Then, considering the security, economy, and flexibility of grid operation comprehensively, the CRITIC method is used to obtain the weights of each indicator and the comprehensive score of each scenario. It can be seen that Scenario 4 has a higher score than the other scenarios, and Scenario 3 has the lowest score, which can illustrate the validity and scientificity of the evaluation system proposed in this paper and reflect the consumption level of rooftop PV in the distribution system.
To demonstrate the advantages of the proposed method, we compare the proposed method with the traditional evaluation method for the hosting capacity of rooftop PV. The traditional method does not utilize building roof data from satellite map images and deep learning techniques to estimate the rooftop photovoltaic potential, and, therefore, when evaluating the PV hosting capacity of the actual large-scale distribution system, the traditional method assigns the same installed rooftop PV capacity to each distribution substation supply area [19]. We design the traditional method ( P k = 400 ), the traditional method ( P k = 800 ), and the real value as the control group, respectively, where the real value is the power flow profiles of the test distribution system under the real rooftop photovoltaic potential. Based on the above simulation results, we select node 20 and branch 2, the weak links of the system, as the evaluation objects. Under typical Scenario 3, the node voltage profiles and branch current profiles derived from each evaluation method are shown in Figure 13 and Figure 14. The orange curve shows the voltage profiles of node 20 and the current profiles of branch 2 under typical Scenario 3 after estimating the photovoltaic potential of each distribution substation supply area. The red curve and the blue curve are the results of the traditional evaluation method, which set the rooftop PV potential of the distribution substation supply area to 400 kW and 600 kW, respectively. The black curve is the power flow profiles under the real roof photovoltaic potential. As can be seen from the results, the evaluation results derived from the proposed method have the smallest error with the real value. Therefore, in the context of China’s whole-county PV policy promotion, the proposed method can enable grid corporations to quickly and accurately understand the photovoltaic potential and resources in the planning area, and thus evaluate the PV hosting capacity of the actual distribution system.
Since the National Energy Administration of China requires grid corporations to ensure large-scale access to rooftop PV so as to “connect as much as possible”, it is necessary to take corresponding measures to improve the hosting capacity according to the above evaluation results so that the rooftop PV hosting capacity of the distribution system can reach rooftop PV potential with a value of 8548 kW. Reactive power compensation can be installed on the bus with the risk of exceeding the limit to quickly reduce the voltage level, or energy storage devices can be installed in the distribution substation with high voltage to reduce the power penetration during the peak period of PV generation. From the perspective of equipment transformation, the conductor of branches 2 and 3 can be replaced with LGJ-150 (which has a cross-sectional area of 150 mm2 and a current limit of 445 A), which will cost approximately USD 3315(USD 1800 per kilometer). The distribution transformer of substation 2 can be replaced with S11-630 (which has a rated capacity of 630 kVA), which will cost approximately USD 8130.

4. Conclusions

Because the existing PV hosting capacity evaluation methods do not consider the spatial distribution of rooftop photovoltaic potential and it is difficult to carry out large-scale calculation in the actual distribution system, this paper proposes a PV hosting capacity evaluation method considering the estimation of rooftop photovoltaic potential, which is realized by combining multi-source data such as geographic information system data, metering system data, and satellite image data. The proposed method has been fully described and verified in a practical case.
The main contributions and conclusions of this paper are as follows:
(1)
Based on the improved PSPNet model, the rooftop contour in the satellite map image is extracted, and then the rooftop photovoltaic potential of each distribution substation supply area is estimated. The experimental results show that the DAPPM can effectively solve the problem of roof holes in the original PSPNet model. Compared with other models, improved PSPNet can ensure segmentation accuracy while maintaining a small number of parameters and reasoning time, which can effectively achieve the rooftop photovoltaic potential estimation of distribution substation supply area and meet the requirements of large-scale evaluation of the PV hosting capacity in the distribution system.
(2)
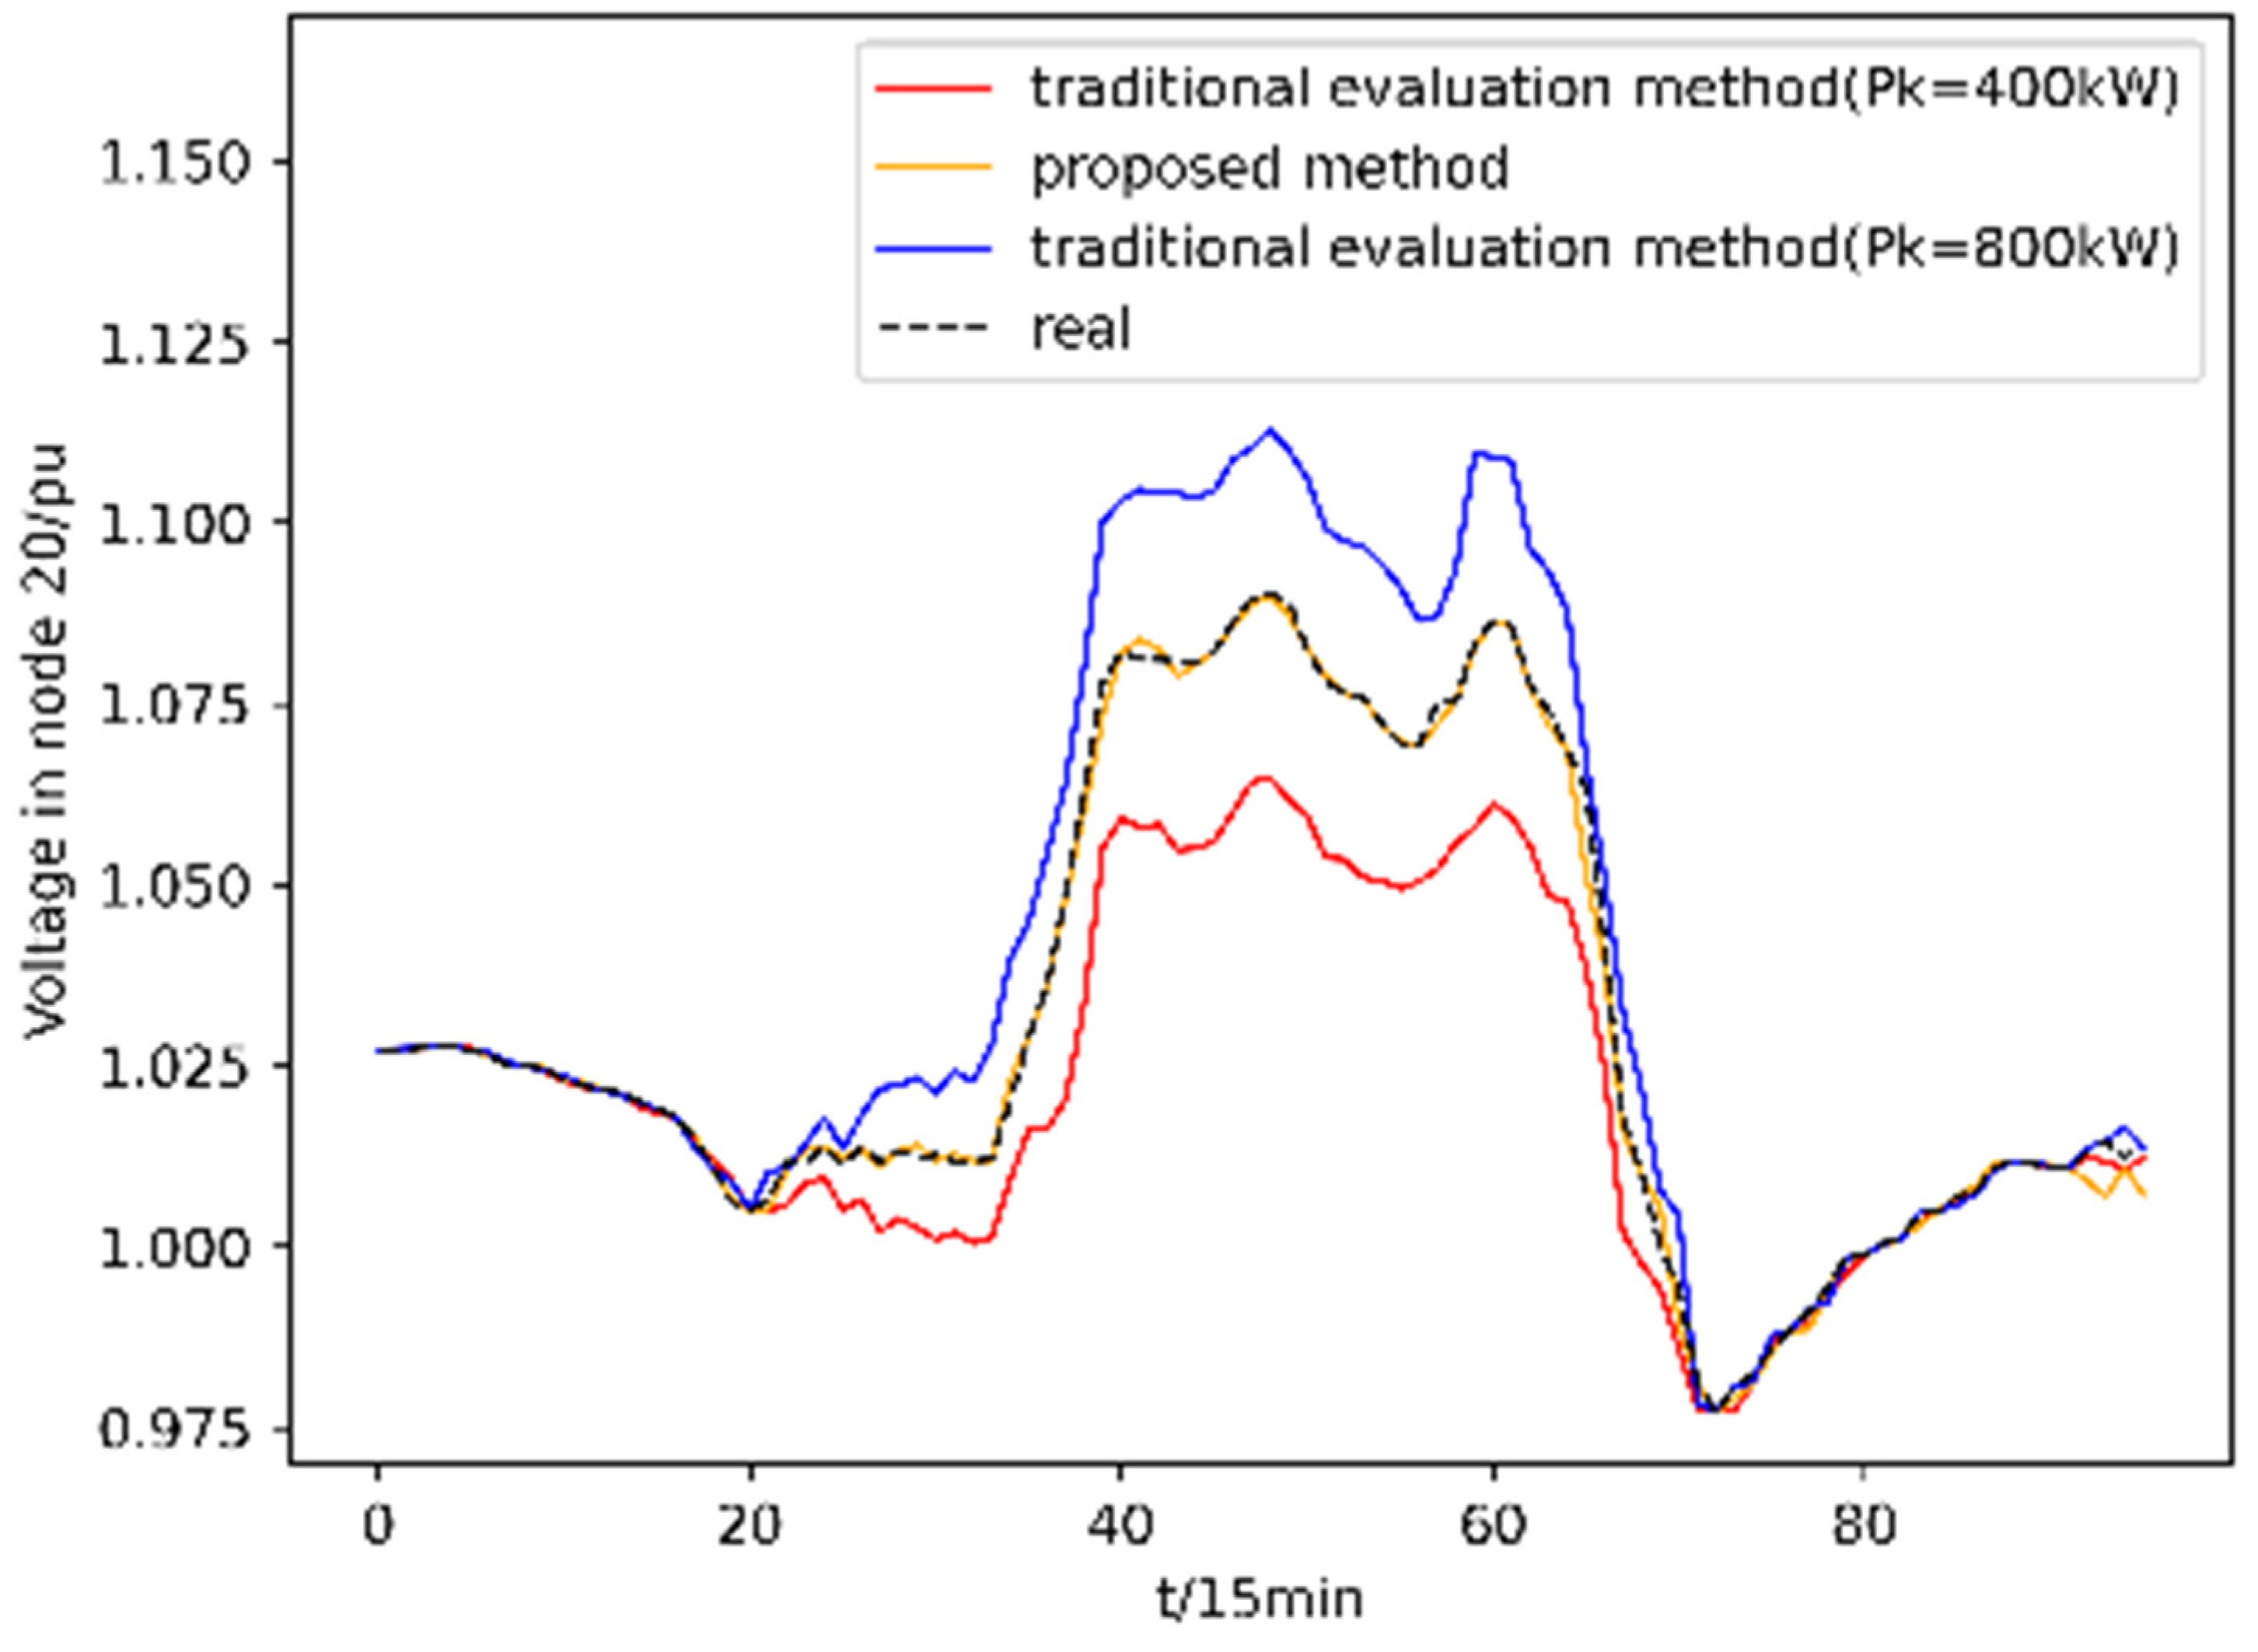
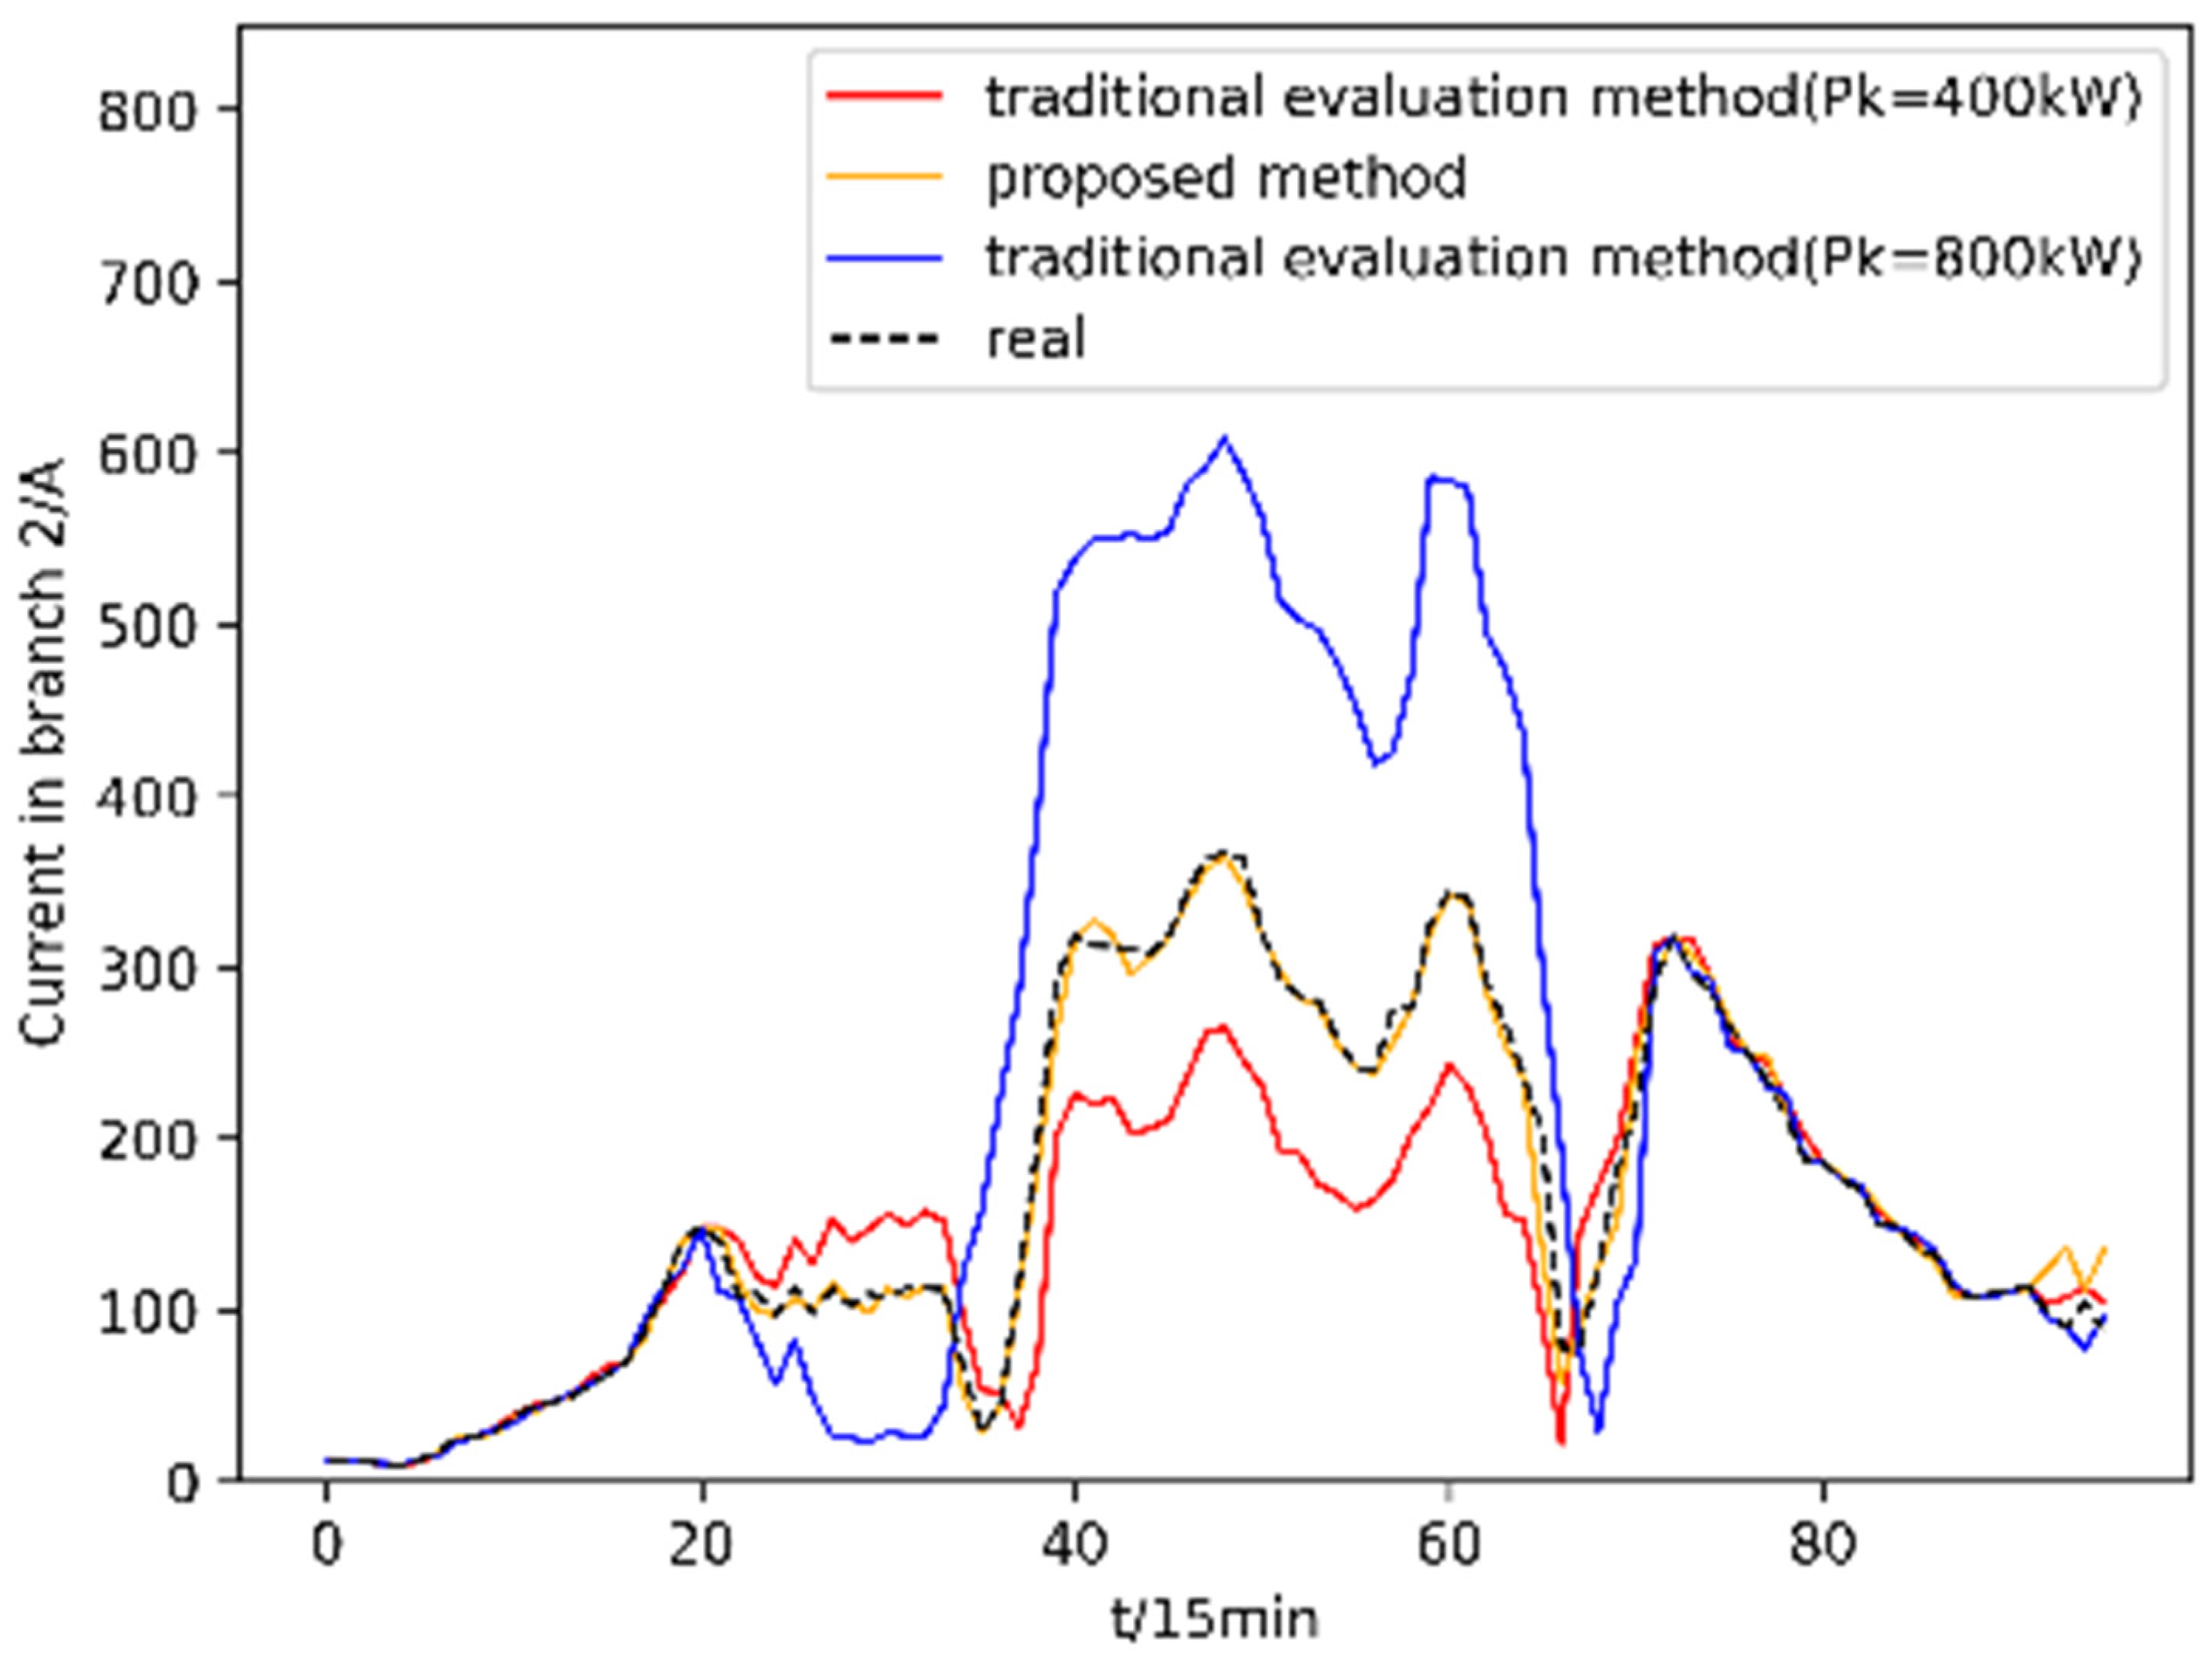
The proposed method considering photovoltaic potential can more accurately reflect the operation of the distribution system and the rooftop PV hosting capacity than the traditional evaluation method that assigns the same installed PV capacity to each distribution substation supply area.
(3)
Based on the rooftop photovoltaic potential estimation of the distribution substation supply area, combined with the multi-source data of the grid digitization system, and considering the safety, economy, and flexibility of the distribution system operation, a multi-level evaluation system of the PV hosting capacity is constructed. The experimental results show that the actual distribution system in the case has the lowest comprehensive score of hosting capacity in typical Scenario 3. In this scenario, the distribution system cannot fully accommodate the new rooftop photovoltaic, the voltage of nodes 6, 7, 17, 18, 19, and 20 will continuously exceed the limit, branch ② will have continuous current overload, and the distribution transformer in substation 2 will have continuous reverse overload. It is necessary to consider adding flexible resource control equipment, such as energy storage and SVC, or transforming the distribution network to make the PV hosting capacity of the distribution system reach 8548 kw so as to fully consume the new rooftop photovoltaic in the future.
This study can be integrated into the planning software as a functional module to help grid corporations formulate reasonable rooftop photovoltaic development and enhance programs under the background of large-scale roof photovoltaic grid connection, but the following factors still need to be further considered in practical application:
(1)
The influence of the rooftop type of the building, the minimum installation area of photovoltaic panels, the rooftop association mode, and the environmental factors on the rooftop photovoltaic potential estimation of distribution substation supply area;
(2)
How to efficiently obtain the data required for hosting capacity evaluation from the digitization system of the distribution network;
(3)
The estimation of rooftop PV potential in this paper is mainly applied to a rural area in Shantou, China, and we aim to extend the methodology to urban areas with higher housing densities and more complex distribution systems in the future.

Author Contributions

Conceptualization, Y.X. and X.P.; methodology, Y.X. and J.H.; software, Y.X. and W.C.; validation, Y.X. and Y.L.; formal analysis, Y.X. and Z.L.; investigation, Y.X. and X.P.; resources, Y.X. and W.C.; data curation, Y.X. and J.H.; visualization, Y.L.; writing—original draft preparation, Y.X. and X.P.; writing—review and editing, Y.X., J.H. and X.P. All authors have read and agreed to the published version of the manuscript.

Funding

This research was supported by the National Natural Science Foundation of China (62273104) and the Science and Technology Program of Guangdong Power Grid Co., Ltd. (030500KK52220014).

Institutional Review Board Statement

Not applicable.

Informed Consent Statement

Not applicable.

Data Availability Statement

No new data were created.

Conflicts of Interest

The authors declare no conflict of interest.

Appendix A

This section provides the electrical data and evaluation indicator variation curves for the tested systems in this paper.
Table A1. CIM/XML file parsing results for the tested distribution system.
BranchFromToUnit
Resistance (Ω/km)
Unit
Reactance (Ω/km)
Basic Load (kW)Power FactorConductor Cross-Sectional Area
(mm2)
Length
(km)
Current Limit
(A)
Distribution Transformer
Capacity at To_Node (kVA)
1120.210.361900.9671500.493445250
2230.450.384000.961700.984275800
3340.450.384400.959700.858275500
4450.450.383900.956700.822275500
5560.850.403500.958350.964170500
6670.210.362000.9581500.877445250
7280.850.401500.949350.888170250
8891.010.424700.958251.217130630
99100.850.404800.954351.045170630
1010110.450.383300.957700.726275500
1110120.450.381450.945700.833275250
1212131.010.422600.956251.453130315
134140.450.382400.949701.204275315
1414150.850.402500.963350.865170315
1515160.850.401900.997350.921170250
1616171.010.426000.946251.401130800
1717180.850.401200.960350.908170200
186190.210.361200.9471500.781445200
1919201.010.427200.956251.5541301250
Figure A1. Evaluation indicator variation curves for different scenarios of the tested distribution system.
Energies 16 07677 g0a1

References

  1. National Energy Administration Comprehensive Department on the Announcement of the Whole County (City, District) Rooftop Distributed Photovoltaic Development Pilot List of Notice. Available online: https://www.gov.cn/zhengce/zhengceku/2021-09/15/content_5637323.htm (accessed on 9 October 2023).
  2. Long, C.; Ochoa, L.F. Voltage control of PV-rich LV networks: OLTC-fitted transformer and capacitor banks. IEEE Trans. Power Syst. 2016, 31, 4016–4025. [Google Scholar] [CrossRef]
  3. Zhan, H.; Wang, C.; Wang, Y.; Yang, X.; Zhang, X.; Wu, C.; Chen, Y. Relay protection coordination integrated optimal placement and sizing of distributed generation sources in distribution networks. IEEE Trans. Smart Grid 2016, 7, 55–65. [Google Scholar] [CrossRef]
  4. Andresen, M.; Buticchi, G.; Liserre, M. Thermal stress analysis and MPPT optimization of photovoltaic systems. IEEE Trans. Ind. Electron. 2016, 63, 4889–4898. [Google Scholar] [CrossRef]
  5. Zhong, T.; Zhang, Z.; Chen, M.; Zhang, K.; Zhou, Z.; Zhu, R.; Wang, Y.; Lü, G.; Yan, J. A city-scale estimation of rooftop solar photovoltaic potential based on deep learning. Appl. Energy 2021, 298, 117132. [Google Scholar] [CrossRef]
  6. El-Shimy, M.; Sharaf, A.; Khairy, H.; Hashem, G. Reduced-order modelling of solar-PV generators for small-signal stability assessment of power systems and estimation of maximum penetration levels. IET Gener. Transm. Distrib. 2018, 12, 1838–1847. [Google Scholar] [CrossRef]
  7. Tan, X.; Wang, Z.; Li, Q.; Pang, Q. Maximum access capacity calculation of distributed PY grid connected based on stochastic programming. Autom. Electr. Power Syst. 2020, 44, 72–80. (In Chinese) [Google Scholar]
  8. Tao, Q.; Wang, D.; Ye, J.; Xue, J.; Zhang, H. Capacity Analysis of Distributed Photovoltaic Generation Integrated into Power Grid Con-sidering Energy Storage Configuration Mode Based on Fusion of Multiple Data Sources. High Volt. Eng. 2018, 44, 1093–1098. (In Chinese) [Google Scholar]
  9. Alghamdi, Y.; Al-Mehizia, A.; Al-Ismail, F. PV Hosting Capacity Calculation Using Particle Swarm Optimization. In Proceedings of the 2021 North American Power Symposium (NAPS), College Station, TX, USA, 14–16 November 2021; pp. 1–6. [Google Scholar]
  10. Yuan, Z.; Xu, M.; Tao, Y.; Li, M.; Guo, Z.; Zhang, J. Calculation of renewable energy hosting capacity of distribution network based on multi strategy improved adaptive manta ray foraging optimization. Front. Energy Res. 2023, 10, 985623. [Google Scholar] [CrossRef]
  11. Gomes, C.; Ferreira, H. Hosting capacity evaluation of distributed generation systems with genetic algorithm. In Proceedings of the 2018 Simposio Brasileiro de Sistemas Eletricos (SBSE), Niteroi, Brazil, 12–16 May 2018; pp. 1–6. [Google Scholar]
  12. Ding, F.; Mather, B. On distributed PV hosting capacity estimation, sensitivity study and improvement. IEEE Trans. Sustain. Energy 2017, 8, 1010–1020. [Google Scholar] [CrossRef]
  13. Liu, Y.; Tai, Y.; Lee, Y.; Jiang, J.; Lin, C. Assessment of PV Hosting Capacity in a Small Distribution System by an Improved Stochastic Analysis Method. Energies 2020, 13, 5942. [Google Scholar] [CrossRef]
  14. Torquato, R.; Salles, D.; Pereira, C.; Meira, P.; Freitas, W. A Comprehensive Assessment of PV Hosting Capacity on Low-Voltage Distribution Systems. IEEE Trans. Power Deliv. 2018, 33, 1002–1012. [Google Scholar] [CrossRef]
  15. Zhang, X.; Li, H.; Wang, L.; Liu, Y.; Wang, F. Comprehensive Evaluation of AC-DC Distribution Network in Photovoltaic-Energy Storage Charging Station Based on AHP-TOPSIS Method. In Proceedings of the 2021 IEEE 5th Conference on Energy Internet and Energy System Integration (EI2), Taiyuan, China, 22–24 October 2021; pp. 83–88. [Google Scholar]
  16. Liu, Z.; Xie, Q.; Dai, L.; Wang, H.; Deng, L.; Wang, C.; Zhang, Y.; Zhou, X.; Yang, C.; Xiang, C.; et al. Research on comprehensive evaluation method of distribution network based on AHP-entropy weighting method. Front. Energy Res. 2022, 10, 975462. [Google Scholar] [CrossRef]
  17. Xiao, J.; Ye, Y.; Wang, F.; Shen, J.; Gao, F. Comprehensive Evaluation Index System of Distribution Network for Distributed Photovoltaic Access. Front. Energy Res. 2022, 10, 892579. [Google Scholar] [CrossRef]
  18. Wang, D.; Xu, M.; Gao, W.; Hao, L.; Chen, L.; Ning, Z. Analysis and Evaluation of Bearing Capacity of Distributed Photovoltaic Connected to Hunan Power Grid. In Proceedings of the 2023 2nd International Conference on Power System and Power Engineering, Nanchang, China, 17–19 March 2023; p. 012036. [Google Scholar]
  19. Grabner, M.; Souvent, A.; Suljanović, N.; Košir, A.; Blažič, B. Probabilistic methodology for calculating PV hosting capacity in LV networks using actual building roof data. Energies 2019, 12, 4086. [Google Scholar] [CrossRef]
  20. Izquierdo, S.; Rodrigues, M.; Fueyo, N. A method for estimating the geographical distribution of the available roof surface area for large-scale photovoltaic energy-potential evaluations. Sol. Energy 2008, 82, 929–939. [Google Scholar] [CrossRef]
  21. Wiginton, L.; Nguyen, H.; Pearce, J. Quantifying rooftop solar photovoltaic potential for regional renewable energy policy. Comput. Environ. Urban Syst. 2010, 34, 345–357. [Google Scholar] [CrossRef]
  22. Krapf, S.; Kemmerzell, N.; Khawaja Haseeb Uddin, S.; Hack Vázquez, M.; Netzler, F.; Lienkamp, M. Towards scalable economic photovoltaic potential analysis using aerial images and deep learning. Energies 2021, 14, 3800. [Google Scholar] [CrossRef]
  23. Walch, A.; Castello, R.; Mohajeri, N.; Scartezzini, J. Big data mining for the estimation of hourly rooftop photovoltaic potential and its uncertainty. Appl. Energy 2020, 262, 114404. [Google Scholar] [CrossRef]
  24. Yu, H.W. Buiding Roof Extraction and Solar Energy Potential Assessment Based on High Resolution Remote Sensing Image. Master’s Thesis, Wuhan University, Wuhan, China, 2019. [Google Scholar]
  25. Shelhamer, E.; Long, J.; Darrell, T. Fully Convolutional Networks for Semantic Segmentation. IEEE Trans. Pattern Anal. Mach. Intell. 2015, 39, 640–651. [Google Scholar] [CrossRef]
  26. Zhao, H.; Shi, J.; Qi, X.; Wang, X.; Jia, J. Pyramid Scene Parsing Network. In Proceedings of the 2017 IEEE Conference on Computer Vision and Pattern Recognition (CVPR), Honolulu, HI, USA, 21–26 July 2017; pp. 6230–6239. [Google Scholar] [CrossRef]
  27. Yuan, W.; Wang, J.; Xu, W. Shift pooling PSPNet: Rethinking pspnet for building extraction in remote sensing images from entire local feature pooling. Remote Sens. 2022, 14, 4889. [Google Scholar] [CrossRef]
  28. Xu, J.; Xiong, Z.; Bhattacharyya, S.P. PIDNet:A Real-Time Semantic Segmentation Network Inspired by PID Controllers. In Proceedings of the 2023 IEEE/CVF Conference on Computer Vision and Pattern Recognition (CVPR), Vancouver, BC, Canada, 17–24 June 2023; pp. 19529–19539. [Google Scholar]
  29. Hong, Y.; Pan, H.; Sun, W.; Jia, Y. Deep Dual-resolution Networks for Real-time and Accurate Semantic Segmentation of Road Scenes. arXiv 2021, arXiv:2101.06085. [Google Scholar]
  30. Xu, F.Y. Roof Area Recognition and Roof PV Capacity Estimation Based on Remote Sensing Images. Master’s Thesis, Hangzhou Dianzi University, Hangzhou, China, 2016. [Google Scholar]
  31. DL/T 2041-2019; Technical Guideline for Evaluating Power Grid Bearing Capability of Distributed Resources Connected to Network. National Energy Administration: Beijing, China, 2019.
  32. DL/T 1198-2013; Regulations on Power Quality Technical Management for Power System. National Energy Administration: Beijing, China, 2013.
  33. Liu, Y.; Hu, T.; Zhuang, J.; Sheng, J. Optimal design of variable suspension parameters for variable-gauge trains based on the improved CRITIC method. J. Chin. Inst. Eng. 2023, 46, 638–648. [Google Scholar] [CrossRef]
  34. Shahid, K.; Schiavone, E.; Drenjanac, D.; Pedersen Bæklund, R.; Olsen, R.L.; Schwefel, H. Extraction of CIM-based distribution grid topology information for observability. In Proceedings of the 2019 15th European Dependable Computing Conference (EDCC), Naples, Italy, 17–20 September 2019; pp. 165–170. [Google Scholar]
  35. Arshad, A.; Lindner, M.; Lehtonen, M. An analysis of photo-voltaic hosting capacity in finnish low voltage distribution networks. Energies 2017, 10, 1702. [Google Scholar] [CrossRef]
  36. Ji, S.; Wei, S.; Lu, M. Fully convolutional networks for multisource building extraction from an open aerial and satellite imagery data set. IEEE Trans. Geosci. Remote Sens. 2018, 57, 574–586. [Google Scholar] [CrossRef]
Figure 1. Flowchart for evaluating the PV hosting capacity of the distribution system considering the estimation of rooftop photovoltaic potential.
Energies 16 07677 g001
Figure 2. Flowchart for the estimation of rooftop photovoltaic potential.
Energies 16 07677 g002
Figure 3. Structural schematic diagram of the original PSPNet. (a) Input image. (b) Feature map. (c) Pyramid Pooling Module. (d) Segmentation.
Energies 16 07677 g003
Figure 4. Schematic structure of the DAPPM.
Energies 16 07677 g004
Figure 5. Schematic structure of the improved PSPNet.
Energies 16 07677 g005
Figure 6. Evaluation system of the rooftop PV hosting capacity of the distribution system.
Energies 16 07677 g006
Figure 7. Topology of an actual 10 kV distribution feeder.
Energies 16 07677 g007
Figure 8. Time-series coefficients of PV power load for each typical scenario.
Energies 16 07677 g008
Figure 9. Variation curves for loss function, MIOU, and accuracy. (a) Curve of loss value. (b) Curve of MIOU value. (c) Curve of accuracy value.
Energies 16 07677 g009
Figure 10. Contrast chart of the extraction for each model. (a) Original image. (b) Label. (c) DeeplabV3+. (d) PSPNet. (e) Improved PSPNet.
Energies 16 07677 g010
Figure 11. Voltage profiles of the distribution system for each typical scenario.
Energies 16 07677 g011
Figure 12. Branch current profiles of the distribution system for each typical scenario.
Energies 16 07677 g012
Figure 13. Comparison of voltage in node 20 generated by different methods for Scenario 3.
Energies 16 07677 g013
Figure 14. Comparison of current in branch 2 generated by different methods for Scenario 3.
Energies 16 07677 g014
Table 1. Hyperparameter setting of the training model.
StageHyperparameter TypeParameter Value
Downsample factor 8
Freezing stage Batch_size8
Init learning rate1 × 10−2
Unfreezing stage Batch_size4
Init learning rate1 × 10−2
Learning rate decay type CosineAnnealing
Momentum 0.9
Weight_decay 1 × 10⁻⁴
Minimum image size 256 × 256
Table 2. Table of the evaluation metrics.
MetricsCalculation FormulaExplanation
MIOU M I O U = 1 k + 1 i = 0 k T P F N + F P + T P The mean of the intersection over union values
MPA M P A = 1 k + 1 i = 0 k p i i j = 0 k p i j The mean accuracy of pixel-wise classification
Accuracy A c c u r a c y = T P + T N T P + T N + F P + F N The proportion of correctly classified samples in a classification task
F1 score F 1 s c o r e = 2 T P ( T P + F N ) ( T P + F P ) The harmonic mean of precision and recall
Times Execution time, typically representing the time consumption of model inference
Parameters Total number of parameters included in the model
FLOPs The number of floating point operations performed by a model
Table 3. Table of the evaluation metrics for each model.
MethodMIOU (%)MPA (%)Accuracy (%)F1 ScoreTime (ms)Param (M)FLOPs (G)
DeeplabV3+81.0887.3295.210.889250.985.81313.22
PSPNet82.5189.1095.540.899049.9646.7129.69
Improved PSPNet83.7789.9395.890.907349.6823.7019.93
Table 4. Estimated rooftop PV potential results for each distribution substation supply area.
Distribution
Substation No.
Extracted Rooftop Area (m2)Available Area for PV Panel Installation (m2)Estimated Rooftop PV Potential (kW)Real Rooftop PV
Potential (kW)
230092166325309
368704947742782
426571913287245
540742933440410
679815746862895
728702067310336
824911794269284
938892800420447
1040282900435470
1131942300345326
1225741853278295
1328702066310322
1430562200330315
1533242393359383
1624071733260246
1781485867880924
1820831500225198
1916671200180205
2011,954860712911255
Total79,14656,98585488644
Table 5. Indicators for each scenario, corresponding weights, and PV hosting capacity scores.
IndicatorAVEIAVQRALLRALFRAPPRComprehensive Score
Scenario 11.0491.040.27906.4548.6564.13
Scenario 20.5610.27456.1528.1352.92
Scenario 32.2675.160.35809.43107.6241.76
Scenario 40.8195.520.27414.3050.0276.94
Scenario 51.3384.060.33024.3666.4872.55
Weights0.12850.14200.16660.14530.41761
Disclaimer/Publisher’s Note: The statements, opinions and data contained in all publications are solely those of the individual author(s) and contributor(s) and not of MDPI and/or the editor(s). MDPI and/or the editor(s) disclaim responsibility for any injury to people or property resulting from any ideas, methods, instructions or products referred to in the content.

