Article

Evolution of a Summer Peak Intelligent Controller (SPIC) for Residential Distribution Networks

1
Department of Electrical and Electronics Engineering, Dr. M.G.R Educational and Research Institute, Chennai 600095, India
2
Faculty of Electrical Engineering and Computer Science, VSB-Technical University of Ostrava, 708 00 Ostrava, Czech Republic
*
Authors to whom correspondence should be addressed.
Energies 2023, 16(18), 6681; https://doi.org/10.3390/en16186681
Submission received: 17 August 2023 / Revised: 7 September 2023 / Accepted: 15 September 2023 / Published: 18 September 2023
(This article belongs to the Special Issue Distributed Energy Resources in Transactive Energy Systems)

Abstract

:
Electricity demand has increased tremendously in recent years, due to the fact that all sectors require energy for their operation. Due to the increased amount of modern home appliances on the market, residential areas consume a significant amount of energy. This article focuses on the residential community to reduce peak load on residential distribution networks. Mostly, the residential consumer’s power demand increases more during the summer season due to many air conditioners (AC) operating in residential homes. This paper proposes a novel summer peak intelligent controller (SPIC) algorithm to reduce summer peak load in residential distribution transformers (RDT). This proposed SPIC algorithm is implemented in a multi-home energy management system (MHEMS) with a four-home hardware prototype and a real-time TNEB system. This hardware prototype is divided into two different cases, one with and one without taking user comfort into account. When considering consumer comfort, all residential homes reduce their peak load almost equally. The maximum and minimum contribution percentages in Case 2 are 29.82% and 19.30%, respectively. Additionally, the real-time TNEB system is addressed in two different cases: with and without incentive-based programs. In the real-time TNEB system during peak hours, the novel SPIC algorithm reduces peak demand in Case 1 by 113.70 kW, and Case 2 further reduces it to 118.80 kW. The peak load decrease in Case 2 during peak hours is 4.5% greater than in Case 1. In addition, we conducted a residential consumer opinion survey to validate the acceptance rate of the proposed design and algorithm.

1. Introduction

In day-to-day life, required power demand has increased more than power generation. Due to this increment in power demand, many rural distribution stations are shutting down their loads to balance the generated power. Sometimes, undervoltage occurs during excess power demand, which leads to damage to the electrical components. This situation occurs during the peak time when more loads are connected in the operation. At present, in India, the annual growth of power generation in the year 2022–2023 has increased by 8.89% when compared with power generation in the year 2021–2022. The installed capacity of India is 421.902 GW as of 30th June 2023; the contribution of fossil fuels is 56.4%, that of renewable energy sources (including Hydro) is 41.8%, and the remaining 1.8% is nuclear energy [1]. The year 2022–2023 has 4% surplus power than 2021–2022, which demonstrates that India’s peak demand is likewise rising year over year. Almost 8.657 GW of surplus power is needed during peak hours [2]. These surplus power demands are compensated by rural load shedding.
Due to this peak demand, many distribution transformers are overloaded, and the most affected are the residential distribution transformers. This overloading reduces the transformer’s life expectancy and deteriorates its operation [3]. To balance this peak demand, there is a need to implement a demand response scheme on all residential consumers to avoid rural load shedding. In most places, residential transformers were installed much earlier, when fewer loads were connected. However, due to the increase in the number of residential buildings and their increased energy consumption, many residential distribution transformers are currently overloaded, which causes frequent tripping [4].
Ryan S. Tulabing et al. developed a localized demand control (LDC) system in a five-house microgrid network to handle peak demand by adopting EVs [5]. The proposed LDC system only controlled heat pumps, water heaters, electric heaters, clothes dryers, and EVs. To carry out the simulation work, three decades of winter season predicted load curves (2020, 2030, and 2040) were taken into account. A simulation study revealed that the LDC system alone was insufficient to manage peak demand effectively. The peak load could be managed within existing capacity by 2040 by integrating the LDC system with a time of use tariff (TOU) and increasing the adoption of electric vehicles (EVs). Maytham S. Ahmed et al. proposed optimal scheduling of home appliances using a binary backtracking search algorithm (BBSA) for home energy management systems (HEMS) to maintain customer comfort [6]. Experimental results showed that BBSA outperformed the binary particle swarm optimization algorithm (BPSO) in terms of energy savings and reduced electricity bills during peak hours. BBSA schedule controllers achieved energy savings of 4.87 kWh per day (21.07%) during the week and 6.6 kWh per day (26.1%) during weekends, while BPSO schedule controllers achieved savings of 4.52 kWh per day (20.55%) during weekdays and 6.3 kWh per day (25%) during demand response periods.
Babak Jeddi et al. proposed a coordinated framework for multiple home energy management systems (HEMS) in a residential neighborhood to handle operational issues at the grid level by increasing customer participation and optimizing energy use [7]. An alternating direction multiplier method (ADMM) is used in the proposed framework in order to assure both computational efficiency as well as privacy for customers. Based on simulation results, both customers and grid operators benefited from the framework in terms of grid stability and reduced electricity bills. Haider Tarish Haider et al. provided an efficient load scheduling model for smart home energy management using the Henry gas solubility optimization approach and VIKOR multi-criteria decision-making [8]. The proposed approach overtook existing approaches by effectively reducing peak loads while retaining consumer comfort and achieving over 80% and 76% energy cost reductions for the time of use and adaptive consumption level pricing schemes, respectively. The approach evaluated the impact of various pricing structures on energy prices, peak demand, and consumer inconvenience when combined with AHP-VIKOR.
Hamid Reza Gholinejad et al. demonstrated a power-electronics-based home energy management system (HEMS) that integrated distributed generation (DG) and renewable energy resources (RER) into neighborhood networks [9]. The success of the proposed control technique was shown in simulations, where home-scale electricity generators (HSEGs) provided 98% more resources to the network, reduced energy prices for conventional buildings (CBs), and alleviated grid load by 98%. The study examined methods for energy management and the function of power electronics in local networks, demonstrating greater power sales, decreased grid reliance, and peak shaving. Future studies will focus on thermal loads, uncertainty, and optimizing the capacity of HEHs for optimal benefits. Vivek Dharmarajan et al. demonstrated a hardware prototype of a home energy management system (EMS) that integrates demand response (DR) to enable efficient load control in smart homes [10]. The Spartan 6 FPGA-based EMS efficiently transferred loads between the battery and the electric grid according to load priority, utility control signals, and customer preferences. In a smart grid environment, this strategy reduced power consumption, lowered household electricity prices, and made peak and off-peak power distribution more efficient.
Olawale Popoola et al. provided an adaptive peak load control strategy for residential energy management that minimized peak demand and energy consumption [11]. In addition to addressing uncertainties in energy usage patterns, it resulted in significant reductions in peak demand (3% to 20%) and energy consumption (at least 14.05%) during time of use (ToU). The method outperformed other methods in terms of usefulness, efficiency, and safety, making it an effective instrument for peak load management. It supported demand-side management, offered cost-saving advantages, and enhanced efficiency and lifestyle. Fengji Luo et al. offered a three-stage home energy management system for optimizing home energy resources in high rooftop solar situations, which included forecasting, day-ahead scheduling, and real operating stages [12]. The proposed system used coordinated scheduling to keep costs to a minimum, short-term forecasting to estimate solar power and load profiles, model predictive control to regulate net power consumption, and coordinated forecasting to minimize costs. Future work includes constructing an HEMS based on stochastic programming that takes into account vehicle-to-home technologies and the probabilistic properties of renewable energy sources.
Hooman Farzaneh et al. examined in-depth recent studies on the use of artificial intelligence (AI) technology in smart buildings through the idea of a building management system (BMS) and demand response programs (DRPs) [13]. Smart buildings are a concept that improves urban energy efficiency by integrating sensors, big data, and artificial intelligence (AI). By examining demand response programs and building management systems, this comprehensive review examines AI’s application in smart buildings. A framework for evaluating AI models across major AI domains is presented in this article, which explores AI-based modelling principles for energy use prediction. Finding a balance between energy sources for security and user comfort is a challenge on the road to zero-emission buildings. AI manages computational overloads and facilitates data exchange to optimize complex building systems for effectiveness, comfort, health, and productivity. Due to limitations in AI-based energy efficiency models, training and retraining are necessary, with occupancy data offering potential improvements.
Carlo Corinaldesi et al. investigated the impact of market-driven automated flexibility management in smart grids through various European case studies [14]. The capacity of the distribution system must be increased to accommodate the development of distributed generation and consumption. To manage flexibility, enhance grid performance, and boost the integration of renewable energy sources, automated demand response (ADR) is recommended. European case studies were used to investigate the impact of ADR, emphasizing benefits, such as improved grid stability and operation. In spite of this, ADR requires a lot of coordination and computational power. Distribution system operators (DSOs) can implement ADR with battery integration or consumer flexibilities to offer lower tariffs or monetary incentives. The Leafs and PVP4Grid projects prove the effectiveness of power tariffs and the benefits they provide to energy communities. Future studies can concentrate on stochastic models to enhance the adaptability of various energy communities for effective power quality control. Carlo Corinaldesi et al. also offered a detailed technique for examining the economic feasibility of residential on-site e-car-sharing systems [15]. An optimization framework is presented that aims to make the switch from private cars to shared cars, taking into account battery storage, photovoltaics, electric vehicles, and charging stations. The technique is investigated under several scenarios in order to demonstrate cost savings and space efficiency. As a result of integrating e-car sharing, tenants use fewer cars, have better charging stations, and save up to 29% annually. In addition, when managed by an external e-car-sharing company, optimal PV capacity decreases and battery storage increases. The study demonstrates the potential of e-car sharing in cities and offers future options for market research and tariff planning.
Jader F.B. Sousa et al. proposed a method for assessing photovoltaic (PV) generating hosting capacity (HC) in low-voltage distribution networks [16]. The approach takes into account randomness in connection points by using smart inverter control strategies and battery storage systems. The simulation findings show that implementing smart controls can boost HC and postpone costly network extensions. The estimated HC provides a margin of safety for PV penetration. Notably, Volt-VAr and Volt-Watt control greatly improve HC, with the latter proving more effective in mitigating the negative consequences of high PV penetration. Battery energy storage systems (BESS) contribute to HC expansion, although their cost remains a barrier to widespread adoption. In simulations, different HC levels are demonstrated based on consumer scenarios and control strategies. Syed Rahman et al., delivered a thorough study on the impact of the evaluation of EV integration on the component and system levels [17]. In comparison with internal combustion engines, electric vehicles (EVs) have raised concerns about power quality and grid stability. Due to their mobile nature, EV charging loads can cause grid congestion if they are not managed properly. Opportunities to address these issues are provided by high renewable energy penetration. The effects of incorporating EV charging loads into low-voltage distribution networks are thoroughly examined in this paper. Through case studies and simulations, it explores peak demand, voltage profiles, load distribution, and power quality issues. The findings highlight the importance of smart and coordinated charging strategies in effectively managing EV penetration. To enhance grid integration, the review also discusses modelling improvements, incentive-based coordination, and the use of distributed EVs for ancillary services.
This article focuses on reducing peak demand in residential distribution networks in order to achieve UN SDG 7. The HVAC loads in residential homes are controlled to reduce peak demand. The HVAC system regulates the AC loads during the summer and the heating loads during the winter. The author proposes the SPIC algorithm to reduce the peak demand of RDTs during the summer by controlling AC loads in residential homes. The main contributions are as follows:
(1)
Reviewing literature on peak load management in residential areas on a national and international scale.
(2)
Surveying Indian residential consumers regarding summer peak demand statistics.
(3)
Implementing the proposed SPIC algorithm in four residential MHEMS prototypes.
(4)
Implementing the proposed SPIC algorithm in a real-time TNEB system.
The rest of the paper is organized as follows: Section 2 describes the PAN INDIA Summer Peak Survey. The proposed architecture and algorithm of residential peak demand management is provided in Section 3. Section 4 addresses the MHEMS with hardware prototype and real-time TNEB system. The paper is concluded in Section 5.

2. PAN INDIA Summer Peak Survey

This section addresses many literature studies on peak load control in India, as well as a consumer opinion poll on residential users’ summer peak electrical usage figures. Several DSM-based peak load reduction projects have been implemented in India recently [18]. Residential consumer feedback is gathered in order to better understand summer peak electricity demand and reliability. An innovative strategy will be proposed later in this article to regulate peak demand throughout the summer based on this feedback.

2.1. Literature Review on Peak Load Management in India

There are several projects in India that aim to address peak load management challenges. On 5 November 2015, the Union Cabinet approved the Ujwal DISCOM Assurance Yojana (UDAY), which was introduced by the Ministry of Power, Government of India [19]. It plans on turning around the nation’s power distribution utilities (DISCOMs) financially and operationally. Smart grid pilot projects are being created in several cities to test innovative technology for peak load optimization [20]. The NTPC’s DSM initiatives in India promote energy efficiency and peak load optimization through a variety of consumer engagement and demand response programs. A demand response program offered by Indian DISCOMs incentivizes consumers to reduce their electricity consumption during peak hours, which contributes to grid stability and efficient energy usage [21].
Jose Adrian Rama Curiel et al. presented a unique direct load control (DLC) mechanism for air conditioners (ACs) in developing countries to optimize energy consumption and manage peak loads [22]. Even though just 5% of households had AC units, the case study in Karnataka revealed the approach’s potential, with 0.88% energy savings and a nearly 2% reduction in regional peak loads. With the implementation of AC DLC in developing regions, energy, water, and climate challenges were addressed, promoting sustainable energy systems and grid flexibility in spite of the low AC penetration rate. Senthil Prabu Ramalingam et al. suggested an RMSSO algorithm with better global searching capabilities than the SSO and SSA algorithms for optimizing energy consumption expenses in a home energy management system (HEM) [23]. RMSSO effectively scheduled residential appliances, demonstrating superior load scheduling and computation time while not taking renewable energy sources into account. Future research may add rule-based renewable energy algorithms and broaden their applicability to more loads in Indian residential settings.
Naga Devi Chinnathambi et al. proposed a comprehensive strategy for smart residential building energy management through the use of IoT-based multifunction-compliant relaying [24]. The proposed system provided an 18% reduction in losses and uninterrupted power supply when installed in a DC residential building with a 1.5 kW PV system. Demand-side management showed cost savings and increased efficiency by reducing losses by an additional 5%. To achieve widespread adoption, issues such as uniform standards, safety, and IoT security must be resolved. Additionally, strategies for utilizing extra solar energy and interoperability with appliances and electric vehicles must be investigated. Anjana M S et al. developed a fractal IoT architecture for smart communities to effectively control energy constraints and generate self-sustaining neighborhoods [25]. The system handled energy shortages and was tested in smart building, smart grid, and microgrid scenarios while combining numerous features. According to experimental findings from a solar microgrid setup in a Kerala hamlet, both hostel buildings (with 800 inhabitants) and residences in tribal villages (with 126 occupants) showed consistent performance and IoT features.
P. Sanjeev et al. suggested a small-scale grid interaction DC microgrid with a thorough power flow control technique that was built and validated through real-time simulation and prototype development to handle peak power deficit and grid failures [26]. In low-voltage DCMGs, the simplified strategy improved renewable energy utilization. The simulations revealed dependable and stable grid operation, reduced peak demand, and reduced stress on the conventional grid. The suggested scheme included perfect mode transition, unity factor supply and absorption, independence from the macrogrid, and greater reliability during grid disruptions. Jagruti Thakur et al. examined the DSM technique’s potential for load balancing and cost savings by examining the usage patterns of residential consumers in India [27]. Simulations showed potential for load balancing and cost savings with price-based and incentive-based approaches, positively affecting consumer behavior and power consumption. The research results highlighted the importance of implementing DSM specifically for residential consumers to improve grid stability and optimize energy usage, calling for a strategic policy, specific tools, flexible loads, and consumer awareness to ensure sustainable energy development.
Sampathraja Natarajan et al. investigated energy management options for a grid-connected home PV-wind system in India, where TOU pricing was utilized to reduce peak power demand [28]. A self-made SFC and RFS controller was put up against a whale optimization algorithm-based controller in a comparison that resulted in a 10.95% boost in revenue growth. A fuzzy logic approach was employed to track PV system maximum power points and was compared to incremental conductance MPPT in terms of power, tracking time, and voltage quality. The proposed energy management controller delivered better daily advantages and maximized consumer benefits in energy utilization and cost, with the potential for long-term projections and further optimization algorithms. Kothalanka Kameswara Pavan Kumar et al. introduced a unique hybrid power management algorithm (PMA) that integrated DSM to optimize economic and emission load dispatch while taking losses into account [29]. The technique decreased thermal energy consumption and emissions on an IEEE 30-bus system with renewables and storage by using a hybrid firefly particle swarm optimization (HFPSO) approach. A flexible day-ahead pricing-based approach for managing renewable electricity effectively controlled both load demand and generation. In terms of fuel cost, emissions, and reducing peak load, comparative analysis revealed that HFPSO performed better than PSO and FA. A future study will compare the algorithm with contemporary strategies and incorporate various renewable energy sources and storage alternatives for improved power system reliability.
This article examines the reduction of peak load using the proposed algorithm on the TNEB’s RDT in Chennai. This algorithm has been found to achieve less than 75% of the RDT’s loading, which has a significant effect on power generation at peak periods. During this successful peak load reduction, the utility reduces its power generation costs as well as its CO2 emissions. According to these findings, implementing the proposed algorithm could lead to a more sustainable and efficient power management system.

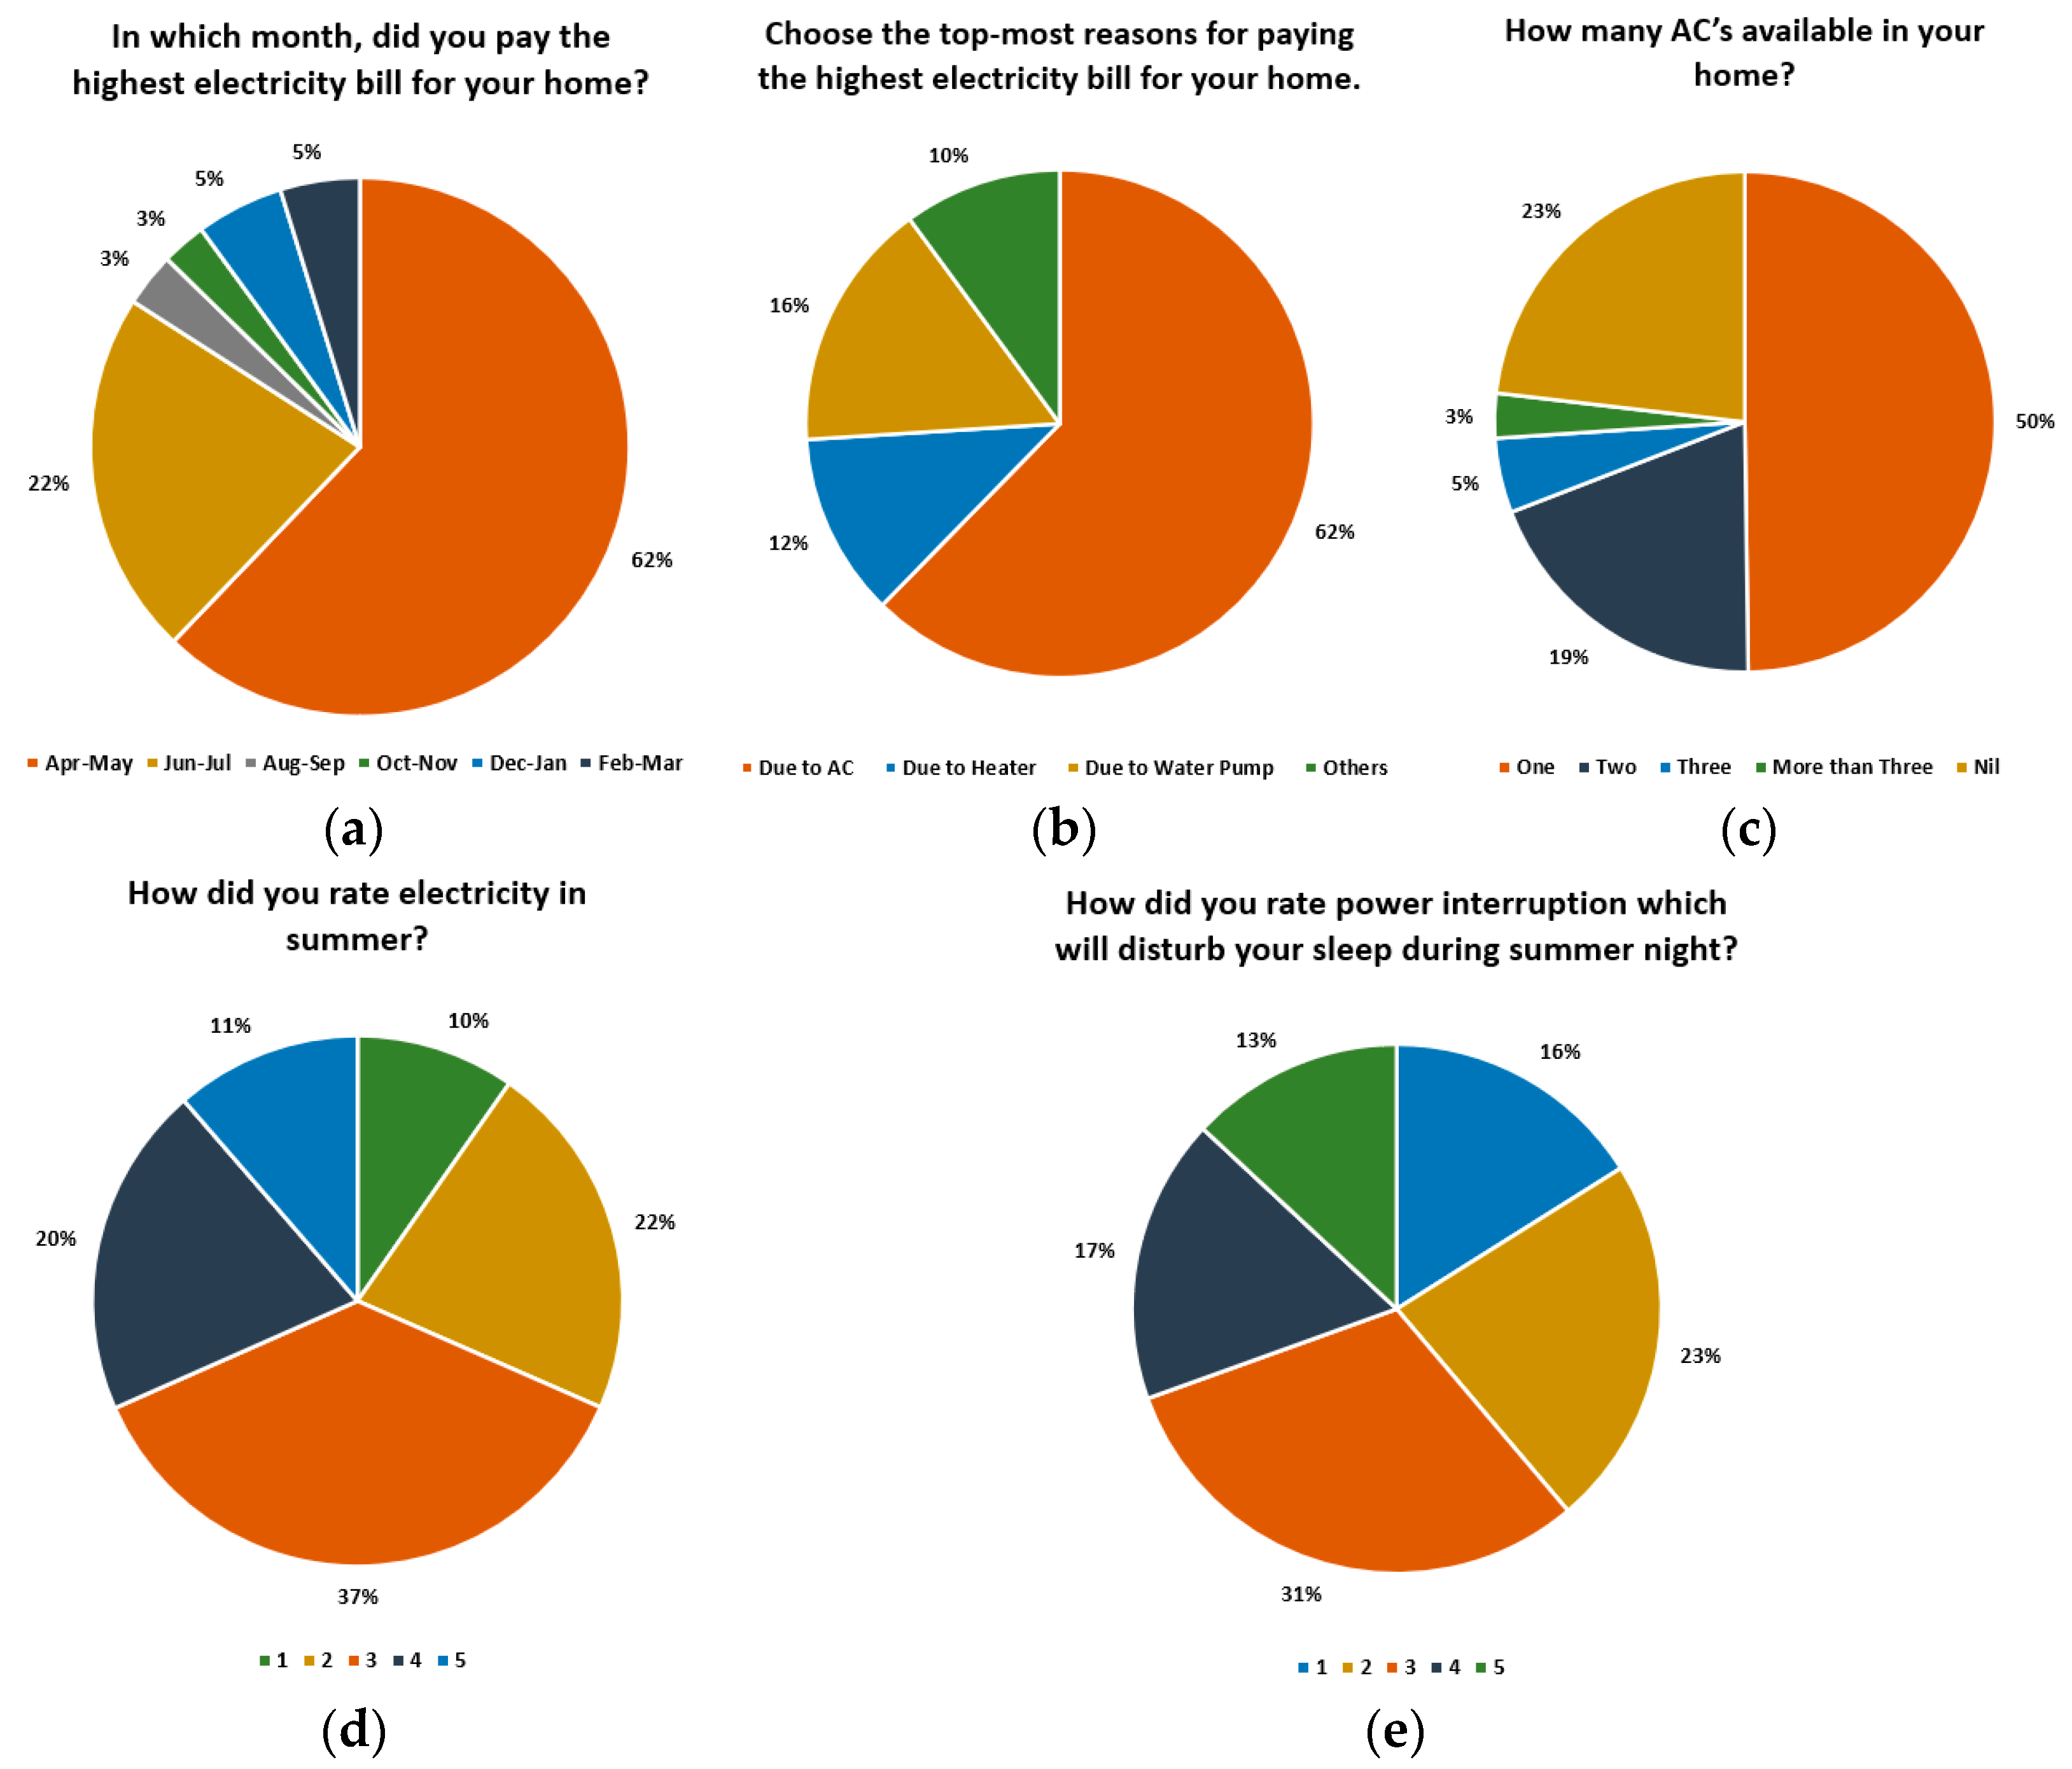
2.2. Consumer Opinion Survey

This study mainly focuses on residential houses to reduce demand during peak time, because many residential houses’ electricity have been interrupted at peak times due to an increase in power demand exceeding power generation, and some components have been unable to function due to undervoltage. This situation has happened mainly during the summer season. Based on the above issue, the survey questions are framed for residential consumers. An evaluation of the survey questions was conducted in a small pilot study with 10 participants in order to determine how well they understood the questions. It was modified according to their suggestions, and then it was conducted online (using Google Forms) and offline among 2500 participants. As per Indian household electrification statistics, Tamil Nadu has 10,285,848 electrified households [30]. Therefore, the population size is 10,285,848 with a 95% confidence level and 2% margin of error, resulting in 2401 samples. A confidence level of 95% is considered appropriate since the number of respondents is higher than the sample size.
Almost 88% of consumers described their electricity bill as high during the summer season, as shown in Figure 1a. It seems that residential consumers consume the most electricity during the summer season. According to Figure 1b, 62% of consumers paid a higher electricity bill as a result of air conditioning. This illustrates how air conditioners significantly impact summer electricity costs.
In the residential community, approximately 77% of consumers have air conditioners in their homes, as illustrated in Figure 1c. During the summer, the quality of the electricity supply is affected by increased demand. Consequently, 69% of residential consumers rated the quality of their electricity supply as three or less, as shown in Figure 1d.
As seen in Figure 1e, 70% of residential consumers rated power outages during summer nights as three stars or lower. Residential consumers reported this feedback because summer peak demand is increased due to significant increases in AC demand. In order to manage summer peak demand, these air conditioning loads must be controlled. Therefore, a SPIC is introduced in this article to control the peak demand of the RDT.

3. Proposed Architecture and Algorithm

This section introduces the MHEMS that is designed to reduce the peak demand for the RDT during peak periods. According to the previous section, consumers spent more on electricity during the summer due to high AC loads. As residential consumers use AC throughout the summer, the RDT is frequently overloaded. A novel SPIC algorithm is presented in this section to control individual residential air conditioners and fans.

3.1. Multi-Home Energy Management System’s Architecture

Residential consumers’ peak energy demand can be reduced greatly with the help of the MHEMS. The architecture of the MHEMS with four home users is depicted in Figure 2. The centralized SPIC is situated close to the RDT, and a microcontroller is installed in each home, to control the peak demand in the RDT. The SPIC gathers data on electricity use and temperature from individual homes, as well as actual power loads from RDT. The AC and FAN are controlled by the individual home microcontroller via smart switches. The individual residence’s AC and fans will be adjusted during peak hours to keep the RDT’s loading below 75% without compromising the comfort of the consumer.
The total power delivered by the RDT is equal to the sum of power consumed in all households, as indicated in Equation (1) below:
P R D T = i = 1 n P H i
P R D T = P H 1 + P H 2 + P H 3 + P H 4 + + P H n
where,
  • PRDT—power supplied by the residential distribution transformer;
  • PH1—power consumed by Home-1;
  • PH2—power consumed by Home-2;
  • PH3—power consumed by Home-3;
  • PH4—power consumed by Home-4;
  • PHn—power consumed by Home-n.

3.2. Summer Peak Intelligent Controller (SPIC) Algorithm

The flow chart for the proposed SPIC algorithm is shown in Figure 3. The SPIC Algorithm begins by determining the number of homes involved and collecting real power consumption and room temperature data for each home, as well as the transformer’s real power loading. If the transformer’s real power loading reaches 75% or greater, the algorithm places the households in ascending order based on how much electricity they use. It then monitors each home’s room temperature, and if it is less than 24 °C, that particular home’s air conditioner is shut off and the fan is turned on.
This practice is repeated until all homes have been checked. If the real power loading of the RDT is less than 70%, the algorithm organizes the houses in descending order based on their power usage. The room temperature in each home is then checked, and if it is higher than 24 °C, the matching home’s AC is turned on and the fan is turned off. This process is repeated for all residences by the algorithm.
The algorithm’s final phase involves concurrently checking each home’s room temperature and the transformer’s actual power loading. The AC and fan are turned on or off with a 10 min delay if the transformer’s real power loading is above 75% and the temperature inside the home is above 24 °C, or if the transformer’s real power loading is below 70% and the temperature inside the home is below 24 °C. The algorithm then increases the home index and repeats the process until the stated requirements are reached. The proposed SPIC algorithm implements decentralized data processing and distributed control across connected households. The primary SPIC controller autonomously manages data processing, decision-making, and control signal execution in a distributed manner. This design enhances system efficiency and minimizes central dependency associated with centralized data processing and single-point failure.

4. Experimental Results and Discussion

The proposed MHEMS hardware prototype is implemented with the proposed SPIC algorithm, and the results are discussed in two different cases in this section. Additionally, the proposed SPIC algorithm is implemented in real-time TNEB systems. Both distribution networks reduce their peak demand to less than 75% of the RDT’s loading using the proposed SPIC algorithm.

4.1. Hardware Description

In the MHEMS, four individual homes and a residential distribution transformer are considered as a small hardware prototype, which is shown in Figure 4. Here, two junction boxes are used, in which one junction box is used for giving a supply to the Arduino board of each individual home and another junction box is used for supplying power to loads of each individual home. The current transformer (CT) is connected with a load supply junction box to measure the incoming current of all the homes, which is converted into real power, which is considered as a RDT’s loading data. Each individual home consist of four loads, out of which three loads are incandescent lamps with different power ratings and the fourth is a dc fan. The various loads considered for each individual home are represented in Table 1. The AC load considers a 100 W incandescent lamp, while 60 W and 40 W incandescent lamps are considered as other loads in the home.
These loads are either controlled automatically by a smart switch through a relay mechanism or manually through a push switch. This smart switch is powered by an individual household’s microcontrollers (slave). These microcontrollers collect energy consumption from a smart energy meter, as well as room temperature from a temperature sensor, and send this data to a centralized SPIC (master) via Zigbee transceiver. The communication network between master and slave follows an LAN network with star topology. The Arduino UNO is opted as controller, which has a sufficient number of I/O pins for the proposed SPIC. The control vector, representing the peak load value of the RDT, is extracted from the RDT’s smart meter and subsequently utilized within the SPIC to establish the global constant. We implemented security measures, including AES encryption and SHA-256 hashing, in our communication network between microcontrollers and the SPIC, ensuring data confidentiality and integrity. Our system is protected against unauthorized access and data tampering by incorporating these security protocols.

4.2. Analysis of Hardware Prototype

The test bed results of the proposed prototype with SPIC algorithm reveal that few consumers usually experience discomfort during peak reduction. Additionally, consumers’ comfort is considered a constraint in order to avoid such a situation. Therefore, two alternative situations are used to test the hardware prototype that was produced, both with and without taking user comfort into account. The ideal room temperature is considered while assessing the consumer’s comfort [31]. Each home’s energy usage is assumed to be measured once every 15 min for prototype validation. The RDT’s real-time power loading data is acquired from TNEB’s DT meters. According to the data collected, the residential area consumes peak load between 8:00 PM and 4:00 AM. Due to this, the peak load in the residential homes is typically met during the nighttime, so the data for the four individual homes are assumed between 6:00 PM and 6:00 AM. Generally, these data are gathered from the microcontroller of each home through smart meters. A proposed prototype is then tested in the above-mentioned cases on the collected data for four individual homes.

4.2.1. Case 1: Not Considering the Consumer’s Comfort

In this case, the four individual homes’ ideal room temperature is not considered for the SPIC algorithm testing in the proposed prototype. The experimental results are presented as a load curve (power vs. time graph), illustrating how each household contributes to the RDT’s load reduction efforts. Figure 5 shows the load curve of each home’s contribution together with the RDT before and after the implementation of the SPIC algorithm.
In each home, the smart switch controls the AC and fans using the SPIC algorithm to maintain RDT peak demand below 75%. Figure 6 shows the percentage of peak load reduction contributed by each individual residence in the RDT’s peak load reduction. In this case, Home-4 is the largest contributor to the peak load reduction of RDT in Case 1, with a contribution percentage of 36.84%. This substantial contribution during the peak period impacts Home-4 more from the perspective of the consumer’s comfort. In the next case, the consumer’s comfort is also taken into account in terms of temperature restrictions.

4.2.2. Case 2: Considering the Consumer’s Comfort

In this case, consumers’ comfort temperature during the summer is considered to be 24 °C as the ideal room temperature. Additionally, the room temperature is measured using temperature sensors and shared with the SPIC using the microcontroller and Zigbee module in each individual home. The proposed prototype is tested using the SPIC algorithm on the assumed data set, and it manages the peak demand of RDT at less than 75% of its loading. Figure 7 illustrates the results of Case 2 as a load curve of RDT and an individual home with its peak reductions.
Figure 8 illustrates the peak load reduction contribution of each individual home to the RDT’s actual load in Case 2. According to this contribution percentage, home 3 contributes 29.82% and home 4 contributes around 26.32%. All other homes contribute equally. As a result of considering the consumer’s comfort, all individual homes contribute equally to the peak load reduction of the RDT in Case 2.

4.3. Analysis of Real-Time TNEB System

In the present study, a 100 kVA RDT is identified with DT meter data in Chennai, in order to validate the proposed SPIC algorithm. In the real-time TNEB system, 20 of the 30 houses have AC and participate in the SPIC algorithm, which helps to reduce peak demand in the 100 kVA real-time TNEB system. Figure 9 illustrates a single-line diagram of a real-time 100 kVA distribution transformer. Here, 10 homes have 1.5 t of cooling capacity and a 1500 W power rating for their ACs, while the other 10 homes have the same cooling capacity but an 1800 W power rating.

4.3.1. Case 1: Without Consideration of the Incentive Program

In Case 1, there are a few residential consumers not participating in this proposed SPIC algorithm, since it mainly only reduces energy consumption costs, without providing any additional benefits. We inform participants about the challenges that arise during summer peak demand, but we do not compel any residential consumers to participate in the suggested SPIC algorithm. Participation is entirely voluntary, and it depends on their willingness. Based on the responses received for the aforementioned queries, we found that participants are not willing to compromise their comfort. The residential homes participating in the proposed algorithm are listed in Table 2. As per the gathered load data, power consumption and room temperature values are assumed for 30 homes. These data are simulated by the SPIC algorithm using Python code, and the results are presented as an actual load curve for RDT and a reduced load curve for RDT, which are shown in Figure 10. There is a reduction in the peak load of 113.70 kW during peak periods in the RDT’s loading. This load curve shows that the peak load will not decrease by less than 75% in a few time periods. This is due to the few residents not participating in the proposed SPIC algorithm.
It is necessary to attract residential consumers to participate in our proposed SPIC algorithm. For this reason, a new incentive-based tariff program is introduced for consumers who voluntarily reduce their energy consumption during peak hours. The residential consumer’s priority level for participating in the SPIC algorithm is collected in all residential houses with AC. These conditions will be considered as Case 2.

4.3.2. Case:2 with Consideration of the Incentive Program

In this case, the consumer’s priority is taken into consideration when the SPIC algorithm reduces real-time TNEB distribution system peak load demand. The incentive program here is designed to reward residential consumers who voluntarily reduce peak loads on distribution networks. In Table 3, the consumer’s priority is shown in four levels: 100%, 75%, 50%, and 25%. The order of “n” homes in the flowchart is now organized according to the consumer’s priority level. Following the participation of the higher-priority customers in the proposed SPIC algorithm, the subsequent lower-priority consumers will participate. Similarly, the ordering of “n” households is done with the consumer’s priority in mind when the power demand is less than 70% of the RDT’s loading. The reduction of each kWh of energy during peak hours will be associated with an incentive of INR 3 per kWh for the participating residential consumer. The incentive is calculated for those who participate in the proposed SPIC algorithm and distributed to the corresponding participating consumers.
During peak hours, lower-priority customers H15 and H30 helped to reduce the peak load of RDT by less than 75%. In Case 1, these consumers do not participate in the proposed SPIC algorithm, while in Case 2, due to an incentive-based program, these consumers are joined at a lower priority level. Figure 11 depicts the actual and reduced RDT load curves of the Case 2 real-time TNEB system. Almost 118.80 kW of peak load is reduced at the peak periods, which is 4.5% more than the reduction in Case 1.

5. Conclusions

In this article, an MHEMS hardware prototype is tested with a novel SPIC algorithm to reduce RDT peak demand. This novel SPIC algorithm is validated with a real-time TNEB system. Real-time data are collected from the 100 kVA RDT at TNEB Chennai. The MHEMS hardware prototype is discussed in two cases: Case 1 and Case 2, with and without consideration of consumer comfort. The maximum and minimum peak load reduction percentages in Case 1 are 36.84% and 10.53% in homes 4 and 2, respectively. Similarly, in Case 2, the maximum and minimum peak load reduction percentages are 29.82% and 19.30% in homes 3 and 2, respectively. Finally, in Case 2, all residential homes share electrical power reduction equally during peak periods. Furthermore, the real-time TNEB system is addressed in two cases: with and without incentive-based programs. A novel SPIC algorithm without an incentive program reduces the peak demand by 113.70 kW in the real-time TNEB system during peak hours. Case 2 reduces the peak load to 118.80 kW, which is 4.5% higher than Case 1. These findings and conclusions suggest that the proposed approach is appropriate for mitigating peak load management issues under UN-SDG 7.3.

Author Contributions

Conceptualization, K.P. and R.L.; methodology, K.P. and R.L.; software, K.P.; validation, K.P., R.L. and T.G.; formal analysis, K.P. and R.G.; investigation, K.P.; resources, K.P. and R.L.; data curation, K.P.; writing—original draft preparation, K.P.; writing—review and editing, K.P., R.L. and T.G.; visualization, K.P. and R.L.; supervision, R.L. and R.G.; project administration, R.L. and T.G.; funding acquisition, R.G. All authors have read and agreed to the published version of the manuscript.

Funding

This research was supported by the SGS grant from VSB—Technical University of Ostrava, under grant number SP2023/005.

Data Availability Statement

The data presented in this study are available on request from the corresponding author.

Conflicts of Interest

The authors declare no conflict of interest.

Nomenclature

MHEMSMulti-home energy management system
RDTResidential distribution transformer
SPICSummer peak intelligent controller
DSMDemand side management
TNEBTamil Nadu Electricity Board
ACAir conditioner
HVACHeating, ventilation, and air conditioning
LANLocal area network

References

  1. Central Electricity Authority. All India Installed Capacity (in MW) of Power Stations Installed Capacity (in MW). 2023, p. 7. Available online: https://cea.nic.in/installed-capacity-report/?lang=en (accessed on 13 July 2023).
  2. CEA INDIA. Central Electricity Authority Executive Summary on Power Sector Government of India Ministry of Power. 2022. Available online: https://cea.nic.in/wp-content/uploads/executive/2023/04/Executive_Summary_Apr_2023-1.pdf (accessed on 30 April 2023).
  3. Dong, M.; Nassif, A.B.; Li, B. A Data-Driven Residential Transformer Overloading Risk Assessment Method. IEEE Trans. Power Deliv. 2019, 34, 387–396. [Google Scholar] [CrossRef]
  4. Gomez, R.H.; Dizon, J.L.M.; Teodoro, C.A.S.; Demegillo, J.C.; Florencondia, N.T. Electrical Percent Loading Assessment for the Distribution Transformers Residential-Used of a Barangay. Int. J. Eng. Adv. Technol. 2020, 9, 3020–3024. [Google Scholar] [CrossRef]
  5. Tulabing, R.S.; Mitchell, B.C.; Covic, G.A.; Boys, J.T. Localized Demand Control of Flexible Devices for Peak Load Management. IEEE Trans. Smart Grid 2023, 14, 217–227. [Google Scholar] [CrossRef]
  6. Ahmed, M.S.; Mohamed, A.; Khatib, T.; Shareef, H.; Homod, R.Z.; Ali, J.A. Real time optimal schedule controller for home energy management system using new binary backtracking search algorithm. Energy Build. 2017, 138, 215–227. [Google Scholar] [CrossRef]
  7. Jeddi, B.; Mishra, Y.; Ledwich, G. Distributed load scheduling in residential neighborhoods for coordinated operation of multiple home energy management systems. Appl. Energy 2021, 300, 117353. [Google Scholar] [CrossRef]
  8. Haider, H.T.; Muhsen, D.H.; Al-Nidawi, Y.M.; Khatib, T.; See, O.H. A novel approach for multi-objective cost-peak optimization for demand response of a residential area in smart grids. Energy 2022, 254, 124360. [Google Scholar] [CrossRef]
  9. Gholinejad, H.R.; Adabi, J.; Marzband, M. An energy management system structure for Neighborhood Networks. J. Build. Eng. 2021, 41, 102376. [Google Scholar] [CrossRef]
  10. Dharmarajan, V.; Prakash, N.K. FPGA based Smart Home Energy Management System for Demand Response Applications. Int. J. Innov. Technol. Explor. Eng. IJITEE 2019, 8, 2278–3075. [Google Scholar]
  11. Popoola, O.; Chipango, M.B. Improved peak load management control technique for nonlinear and dynamic residential energy consumption pattern. Build. Simul. 2021, 14, 195–208. [Google Scholar] [CrossRef]
  12. Luo, F.; Ranzi, G.; Wan, C.; Xu, Z.; Dong, Z.Y. A Multistage Home Energy Management System with Residential Photovoltaic Penetration. IEEE Trans. Ind. Inform. 2019, 15, 116–126. [Google Scholar] [CrossRef]
  13. Farzaneh, H.; Malehmirchegini, L.; Bejan, A.; Afolabi, T.; Mulumba, A.; Daka, P.P. Artificial intelligence evolution in smart buildings for energy efficiency. Appl. Sci. 2021, 11, 763. [Google Scholar] [CrossRef]
  14. Corinaldesi, C.; Fleischhacker, A.; Lang, L.; Radl, J.; Schwabeneder, D.; Lettner, G. European case studies for impact of market-driven flexibility management in distribution systems. In Proceedings of the 2019 IEEE International Conference on Communications, Control, and Computing Technologies for Smart Grids (SmartGridComm), Beijing, China, 21–23 October 2019. [Google Scholar] [CrossRef]
  15. Corinaldesi, C.; Lettner, G.; Auer, H. On the characterization and evaluation of residential on-site E-car-sharing. Energy 2022, 246, 123400. [Google Scholar] [CrossRef]
  16. Sousa, J.F.B.; Borges, C.L.T.; Mitra, J. PV hosting capacity of LV distribution networks using smart inverters and storage systems: A practical margin. IET Renew. Power Gener. 2020, 14, 1332–1339. [Google Scholar] [CrossRef]
  17. Rahman, S.; Khan, I.A.; Khan, A.A.; Mallik, A.; Nadeem, M.F. Comprehensive review & impact analysis of integrating projected electric vehicle charging load to the existing low voltage distribution system. Renew. Sustain. Energy Rev. 2022, 153, 111756. [Google Scholar] [CrossRef]
  18. Singh, A.; Doolla, S.; Banerjee, R. Case Studies of DSM Projects Implemented in India. Available online: https://shaktifoundation.in/wp-content/uploads/2021/12/CaseStudies_DSM_2016.pdf (accessed on 30 April 2023).
  19. Fanda, R.B. Policy Brief Policy Brief. Pancanaka 2019, 1, 14. Available online: https://kebijakankesehatanindonesia.net/images/2019/policy_brief_wujudkan_keadilan_sosial_dalam_jkn.pdf (accessed on 1 November 2019).
  20. Jha, I.S.; Sen, S.; Kumar, R. Smart grid development in India—A case study. In Proceedings of the 2014 18th National Power Systems Conference (NPSC), Guwahati, India, 18–20 December 2014. [Google Scholar] [CrossRef]
  21. Chunekar, A.; Kelkar, M.; Dixit, S.; Prayas, S.D.; Lane, J.M. Demand Side Management in India: An Overview of State Level Initiatives. 2014. Available online: http://www.prayaspune.org/peg (accessed on 1 September 2014).
  22. Curiel, J.A.R.; Thakur, J. A novel approach for Direct Load Control of residential air conditioners for Demand Side Management in developing regions. Energy 2022, 258, 124763. [Google Scholar] [CrossRef]
  23. Ramalingam, S.P.; Shanmugam, P.K. Hardware Implementation of a Home Energy Management System Using Remodeled Sperm Swarm Optimization (RMSSO) Algorithm. Energies 2022, 15, 5008. [Google Scholar] [CrossRef]
  24. Chinnathambi, N.D.; Nagappan, K.; Samuel, C.R.; Tamilarasu, K. Internet of things-based smart residential building energy management system for a grid-connected solar photovoltaic-powered DC residential building. Int. J. Energy Res. 2022, 46, 1497–1517. [Google Scholar] [CrossRef]
  25. Anjana, M.S.; Ramesh, M.V.; Devidas, A.R.; Athira, K. Fractal IoT. In Proceedings of the 1st ACM International Workshop on Technology Enablers and Innovative Applications for Smart Cities and Communities, New York, NY, USA, 13–14 November 2019; pp. 10–17. [Google Scholar] [CrossRef]
  26. Sanjeev, P.; Padhy, N.P.; Agarwal, P. Peak energy management using renewable integrated DC microgrid. IEEE Trans. Smart Grid 2018, 9, 4906–4917. [Google Scholar] [CrossRef]
  27. Thakur, J.; Chakraborty, B. Demand side management in developing nations: A mitigating tool for energy imbalance and peak load management. Energy 2016, 114, 895–912. [Google Scholar] [CrossRef]
  28. Natarajan, S.; Loganathan, A.K. Analysis of Energy Management Controller in Grid-Connected PV Wind Power System Coupled with Battery Using Whale Optimisation Algorithm. Iran. J. Sci. Technol. Trans. Electr. Eng. 2022, 46, 77–90. [Google Scholar] [CrossRef]
  29. Kumar, K.K.P.; Soren, N.; Latif, A.; Das, D.C.; Hussain, S.M.S.; Al-Durra, A.; Ustun, T.S. Day-Ahead DSM-Integrated Hybrid-Power-Management-Incorporated CEED of Solar Thermal/Wind/Wave/BESS System Using HFPSO. Sustainability 2022, 14, 1169. [Google Scholar] [CrossRef]
  30. Power, M.O. Household Electrification Status. 2019. Available online: https://saubhagya.gov.in/ (accessed on 11 October 2017).
  31. Bhalla, A.K.; Abhay, B. Energy Conservation in Building Space Cooling through Optimum Temperature Setting; Bureau of Energy Efficiency, Ministry of Power, Government of India: New Delhi, India, 2018.
Figure 1. Consumer’s opinion survey: (a) statistics of electricity bills; (b) reason for higher electricity bills; (c) statistics of air conditioning in homes; (d) consumer rating of summer electricity quality; (e) consumer satisfaction ratings of power interruptions during summer nights.
Energies 16 06681 g001
Figure 2. Block diagram for multi-home energy management architecture.
Energies 16 06681 g002
Figure 3. Flow chart of proposed SPIC algorithm: (a) main process; (b) loop process.
Energies 16 06681 g003
Figure 4. Experimental hardware setup of MHEMS.
Energies 16 06681 g004
Figure 5. Actual and reduced (after SPIC) load curve of RDT with each home’s contribution for Case 1.
Energies 16 06681 g005aEnergies 16 06681 g005b
Figure 6. RDT’s peak load reduction percentage of each home’s contribution for Case 1.
Energies 16 06681 g006
Figure 7. Actual and reduced (after SPIC) load curve of RDT with each home’s contribution for Case 2.
Energies 16 06681 g007
Figure 8. RDT’s peak load reduction percentage of each home’s contribution for Case 2.
Energies 16 06681 g008
Figure 9. Real-Time TNEB system with 30 homes.
Energies 16 06681 g009
Figure 10. Actual and reduced (after SPIC) load curve of RDT with Case 1 real-time TNEB system.
Energies 16 06681 g010
Figure 11. Actual and reduced (after SPIC) load curve of RDT with Case 2 real-time TNEB system.
Energies 16 06681 g011
Table 1. Load size assumptions in hardware implementation.
Home LoadsActual Loads in PrototypeType of Load
FAN Load—72 WDC Fan—3 WSmall Load—Fan Load
AC Load—1800 W Incandescent Lamp—100 WHeavy Load—AC Load
Other Loads-1—300 to 400 WIncandescent Lamp—60 WMedium Loads—WM/VC/RF/RO
Other Loads-2—200 to 300 WIncandescent Lamp—40 WSmall Loads—Light/FAN/TV
Table 2. List of homes participating in SPIC algorithm for Case 1 real-time TNEB system.
List of
Homes
AC Power
Rating (kW)
List of
Homes
AC Power
Rating (kW)
List of
Homes
AC Power
Rating (kW)
H11.8H111.8H221.8
H21.8H121.5H241.5
H41.5H131.8H251.8
H61.5H161.5H281.5
H71.5H171.5
H91.8H191.8
Table 3. List of homes participating in SPIC algorithm for Case 2 with priority level in real-time TNEB system.
List of
Homes
Level of PriorityAC Power
Rating (kW)
List of
Homes
Level of PriorityAC Power
Rating (kW)
H175%1.8H1650%1.5
H250%1.8H1775%1.5
H450%1.5H19100%1.8
H675%1.5H2125%1.5
H7100%1.5H2250%1.8
H950%1.8H23100%1.5
H11100%1.8H24100%1.8
H1275%1.5H2625%1.8
H13100%1.8H2875%1.5
H1525%1.8H3025%1.5
Disclaimer/Publisher’s Note: The statements, opinions and data contained in all publications are solely those of the individual author(s) and contributor(s) and not of MDPI and/or the editor(s). MDPI and/or the editor(s) disclaim responsibility for any injury to people or property resulting from any ideas, methods, instructions or products referred to in the content.

