Abstract
Aiming at the evaluation of the shielding effectiveness (SE) of materials against high-intensity electromagnetic pulse (EMP), the shielding mechanism in the frequency domain is investigated, and the factors that determine SE such as conductivity, thickness of material, and test frequency are analyzed. The attenuated waves of solid and perforated plate materials irradiated by EMP are simulated in CST. The results show that the two materials exhibit low-pass and high-pass filtering characteristics, respectively, which lead to a big difference in the transmitted waves (rise time and pulse width). Based on this, a time domain SE test method using coaxial flange is proposed which can obtain the incident and the transmitted and reflected waves, and the time domain SE of graphenes with different thicknesses (80, 100, 200, and 300 μm) are measured. The characteristics of the reflected and transmitted waves are analyzed in detail, and the change regulations comply with the theoretical shielding model well. The peak value SE and energy density SE, respectively, are calculated. Furthermore, the frequency domain SE can be obtained through the Fourier transform, so the method has a wide application in material SE performance evaluation against high-intensity EMP.
1. Introduction
As a transient electromagnetic phenomenon, electromagnetic pulse (EMP) generally has a steep leading edge and an extremely high peak field strength in the time domain [1,2]. It also covers a wide frequency range [3]. A typical EMP includes electrostatic discharge (ESD), lightning electromagnetic pulse (LEMP), high altitude electromagnetic pulse (HEMP), and ultra-wideband (UWB), which pose serious threats to various electrical equipment and systems [4,5,6].
Electromagnetic shielding, as an effective way of weakening electromagnetic interference and protecting electronic equipment, has a wide application in electromagnetic compatibility (EMC), electromagnetic protection, and other fields [7,8]. It is of great significance to reasonably and accurately evaluate the shielding performance of different materials [9]. At present, standard specifications for the measurement of shielding effectiveness (SE) mainly specify the method in the frequency domain of the amplitude–frequency curve [10], while the SE test method in the time domain is rare. Facing the increasingly serious threat of EMP, it is urgent to evaluate the shielding material performance against EMP [11,12].
Generally, the response of a shield to EMP can be obtained by the SE curve in the frequency domain, but the amplitude–frequency response usually lacks the phase information. One reason is that people are accustomed to this representation; moreover, amplitude–frequency information is enough for most occasions. On the other hand, it is difficult and costly to obtain the phase information in the frequency domain [13]. When the minimum phase method is used to recover the phase information, the noise would influence the computing results [14]. In addition, the frequency domain results are generally measured in conditions of low voltage and weak field strength. The macro parameters (dielectric constant, conductivity, etc.) of some composites and anisotropic materials may be related to the frequency and field strength [15]. So, using frequency domain results to estimate time domain responses may bring large errors.
To realize time domain SE measurements of shielding materials against EMP, scholars improved devices and methods according to the frequency domain SE test and proposed the “dark box window method”, “coaxial flange method”, and others [16,17,18]. In the dark box window method, due to the cut-off waveguide effect, the low-frequency energy is severely attenuated by the window. When the wavelength is comparable to the window size, the reliability and repeatability of tested results are not satisfactory. A coaxial transmission line, which can transmit signals from DC to high frequency, would improve these disadvantages. In [19], a test method for time domain SE with a continuous conductor coaxial fixture is given, and the transmitted waves under different amplitudes and a pulse width of rectangular pulse were measured. This method cannot monitor the injected pulse signal, and the ignored pulse jitter will cause some measurement errors; therefore, it still has a certain optimization space.
This paper is organized as follows. In Section 2, the electromagnetic shielding mechanism is reviewed, and the effect of parameters (such as material thickness, conductivity, and test frequency) is analyzed. In Section 3, the transmitted waves of solid and perforated materials against EMP are simulated using the coaxial flange method, and the SE expression based on peak value and energy is given. In Section 4, a modified time domain SE test method using a coaxial flange is presented, and graphene materials with different thicknesses are tested in the coaxial flange (the upper limit of cut-off frequency is 10 GHz). The measured results are analyzed in detail and some significant conclusions are obtained.
2. Basic Shielding Theory
Shielding can be specified in terms of a reduction in electric (magnetic) field strength and/or power, and the effectiveness of the shield can be expressed in dB [8]:
where E, H, and P represent the electric field strength, magnetic field strength, and power, respectively. Subscripts ‘i’ and ‘t’ indicate the incident radiation and transmitted radiation, respectively.
When an electromagnetic wave strikes a material, the total SE of this material is equal to the sum of the absorption loss (A) plus the reflection loss (R) plus a correction factor (B) to account for multiple reflections in thin shields [20]. Total SE, therefore, can be written as:
As shown in Figure 1, to explicate these three mechanisms, a plane conducting material is presented [21,22,23].
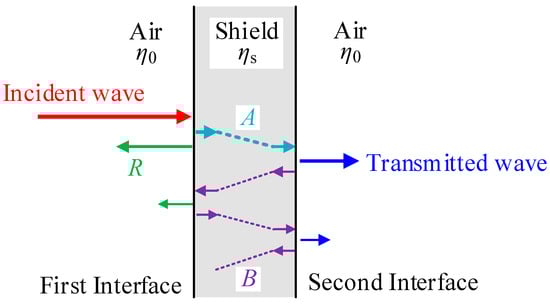
Figure 1.
Electromagnetic shielding mechanism of materials.
When an electromagnetic wave passes through the material, the electric and magnetic fields decrease exponentially. This decay occurs because currents induced in the shielding material produce ohmic losses and heating of the material. Therefore, we can write [24]:
where l is the thickness of the shielding material and 𝛿 is the skin depth. Skin depth can be defined for high-loss materials as:
where ω is the angular frequency, μ and σ are the magnetic permeability and electrical conductivity of the shield material.
Reflection loss at the interface between two media is related to the difference in the characteristic impedances. The intensities of the transmitted electric and magnetic fields at the first interface are [8,24]:
where η0 is the characteristic impedance of free space (η0 = 377 Ω), while the intrinsic impedance of a good conductor is:
If the absorption loss is ignored, the intensity of the transmitted electric and magnetic fields at the second interface are:
Therefore, the reflection loss, neglecting multiple reflections, for either E or H field can be written as:
Multiple reflections occur in the material; considering that η0 >> ηs, Equations (5) and (6) indicate that the largest reflection of electricity occurs at the first boundary, but the largest reflection of the magnetic field at the second boundary and the magnitude of the transmitted wave is double that of the incident wave. Because of multiple reflections, the magnetic energy is absorbed in the material, and this mechanism can be expressed as [8]:
Note that B is a negative number, indicating that less shielding is obtained from the shield as a result of multiple reflections. When the absorption loss is large enough (the thickness of the shield is greater than the skin depth), B can be neglected because the magnitude of the magnetic field is already very weak when the wave reaches the second boundary.
According to Equations (1), (10), and (11), the SE can be summarized as follows:
The material is defined with a thickness of 1 mm; conductivity is 1000 S/m and relative permeability is 1. Figure 2 shows three kinds of loss and the total loss of the material varying with frequency. As can be observed, at a low frequency, the primary shielding mechanism is reflection loss. Moreover, due to shield impedance ηs increasing with frequency, reflection loss decreases with increasing frequency. The absorption loss increases with frequency because of decreasing skin depth, and it becomes the primary shielding mechanism at high frequencies. The multiple reflection correction factor decreases with increasing frequency, when A is equal to 15 dB or more and B is close to 0 and can be neglected. For the total loss, SE has a turning frequency (f0), and it is about 1 GHz. When the frequency is less than f0, SE is approximately a constant; when the frequency is more than f0, SE increases rapidly.
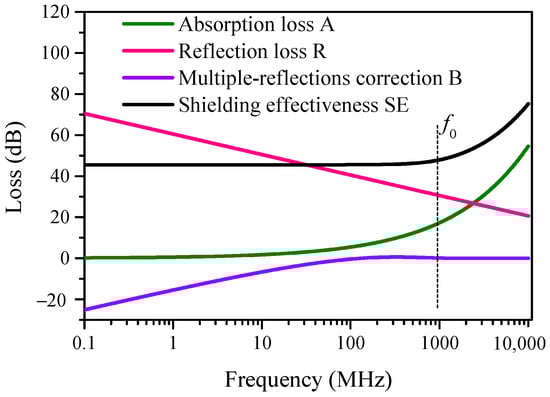
Figure 2.
Three kinds of attenuation modes of planar materials.
Figure 3 shows the SE of the materials with thicknesses of 1, 3, and 5 mm, respectively. As we can see, the thicker the material, the higher the SE. Turning frequency is related to the thickness of the material and f0 decreases with thickness. Generally, the SE of plane materials can be predicted accurately under turning frequency.
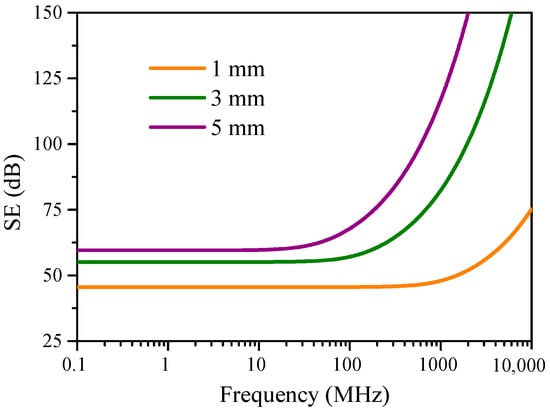
Figure 3.
SE of materials with thicknesses of 1, 3, and 5 mm.
The SE of the shielding material is related to its own characteristics and test frequency. In practice, the characteristics of materials are not as they are theoretically. In particular, some new shielding materials, such as multilayer composites and filled composites, are affected by electromagnetic parameters, internal structure, and surface characteristics. The variation of SE with frequency may be more complex [25]. Some materials have good shielding performance in a low-frequency band, which is characterized by a high pass filter. Some materials have good shielding performance in a high-frequency band, which is characterized by a low-pass filter. Some materials have weak shielding performance in a certain frequency range, which is characterized by a band-pass filter.
3. Time Domain SE Simulation
As the spectrum range of EMP is wide, the attenuated wave of a shield would be distorted with the incident EMP. Therefore, accurate measurement of the incident and the transmitted waves is the key point in the time domain SE test.
In CST Studio Suite, a coaxial flange model as shown in Figure 4a is constructed, and the model of ideal infinite material irradiated by the plane wave is also constructed, as shown in Figure 4b. The thickness of the tested material is defined as 1 mm and the conductivity as 1000 S/m. The excitation signal is a rectangular pulse with a rise time of 0.5 ns, a fall time of 1 ns, and a flat top of 2 ns.
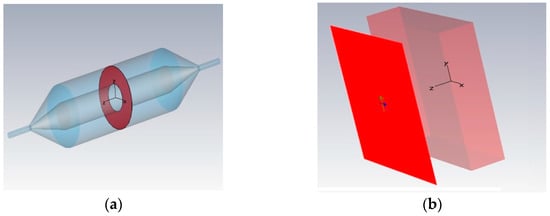
Figure 4.
Simulation models: (a) The coaxial flange model; (b) Infinite material irradiated by plane wave.
The normalized transmitted waveforms of the two simulation models are shown in Figure 5. Compared with the incident and reflected wave, the material has a delay in the rise time, which is mainly due to the better shielding performance at the higher frequency band. According to Equation (1), the SE (amplitude ratio) of the simulated material in the coaxial flange and in free space is 45.4 and 45.7 dB, respectively, and the theoretical calculation of SE is 45.6 dB (orange curve in Figure 3), which keeps a good consistency. There is a slight difference at the rising edge between the two transmitted waves (the mesh size of the coaxial flange may affect the calculation accuracy), but it is acceptable in engineering tests.
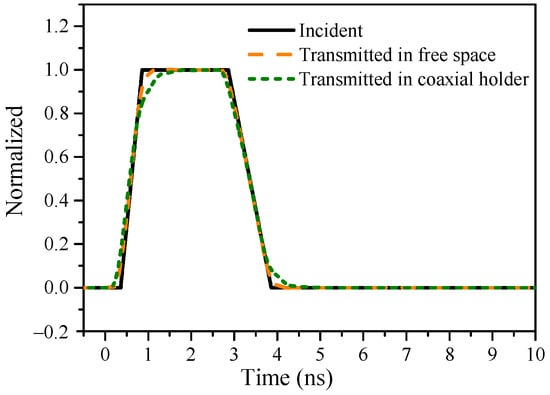
Figure 5.
Incident and transmitted waves in different simulation models.
Furthermore, three shielding material models (solid and perforated plates) are constructed as shown in Figure 6. The thickness of the three materials is 1 mm, the conductivity is 1000, 5000, and 60,000 S/m, and the perforated plates (diameter of the hole is 1 mm) can be approximated to the braided shielding material. The attenuation characteristics of the materials against EMP are simulated in the coaxial flange model.
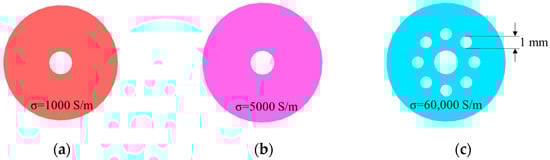
Figure 6.
Shielding material models: (a) Solid plate with a conductivity of 1000 S/m; (b) Solid plate with a conductivity of 5000 S/m; (c) Perforated plate with a conductivity of 60,000 S/m.
The excitation signal is unchanged in the simulation, and the normalized transmitted waves of the three materials are shown in Figure 7. The solid plate presents a low-pass filter, and with the increase in conductivity, the rise time of the transmitted wave becomes slower and the pulse width widens. Although the conductivity of the perforated plate is the largest, more high-frequency energy is leaked through the holes; the material finally presents high-pass filter characteristics. The rise time of the transmitted wave is almost unchanged, but the flat top decreases obviously, and the signal is reversed at the end of the pulse.
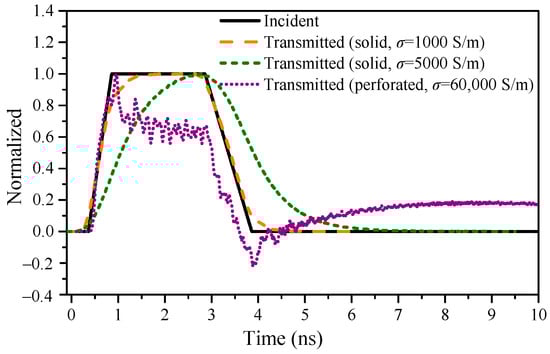
Figure 7.
Incident and transmitted waves of different shielding materials.
To evaluate the shielding performance reasonably and accurately, the time domain SE can be defined as follows [26].
- Peak value reduction SE
- Energy density reduction SE
4. Time Domain SE Test
4.1. Test Method
When a coaxial flange is used in the frequency domain, a vector network analyzer (VNA) can be connected to the coaxial flange to constitute a convenient testing system [27,28]. After an electro-thin material (l << δ) is loaded, the SE can be given by the measured |S21| or |S12| exactly, and the reflection loss can be expressed by the measured |S11| or |S22|.
In the referenced frequency domain SE test method, for the time domain SE test, the excitation port of the coaxial flange can inject a transient pulse signal, and the receive port connects the oscilloscope to record the transmitted wave. To obtain the incident wave accurately, a modified test system is proposed as shown in Figure 8, and it is composed of a pulse source, attenuator, power divider, coaxial fixture, oscilloscope, and cables.
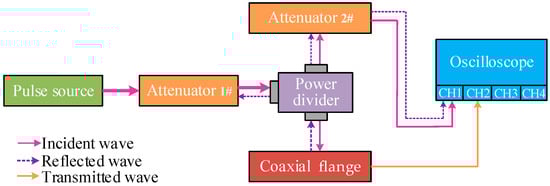
Figure 8.
Schematic of the time domain SE test system.
The incident wave generated by the pulse source is divided into two channels by the power divider after passing through attenuator 1# (ensuring 50 Ω impedance matching the measurement link). One of the divided signals passes through attenuator 2# and is recorded by the oscilloscope, and it is identical to the incident wave. The other signal passes through the coaxial flange which is loaded with the shielding material, and it is recorded by the oscilloscope; then the transmitted wave is obtained.
The incident pulse will be reflected when it encounters the material in the coaxial flange. The reflected wave passes through the power divider, and half of the reflected waves will reach the oscilloscope, so they can also be recorded. The incident and reflected waves have the same path; to avoid the superposition of the reflected wave to the incident wave, the cable length d between the power divider and the coaxial fixture should follow:
where VCOAX is the speed of the electromagnetic wave in the coaxial cable, generally 77% of the light velocity; τ is the duration of the incident pulse. Considering the influence of the power divider, the reflected waveform can be multiplied by 2 to restore the real reflected wave, so reflection loss of the material can also be evaluated.
4.2. Experimental Test
To verify the proposed test method, four specimens of graphene material with thicknesses of 80, 100, 200, and 300 μm were tested. The coaxial flange is self-developed, and its upper limit frequency is 10 GHz to ensure only the TEM mode was transmitted in the test frequency band [29]. The outer conductor of the two-part coaxial flange is connected through a thread, while the inner conductor is connected by a bolt tongue and a groove of the same depth. When loading the material, a part of the material will be embedded into the inner and outer conductor of the coaxial flange to reduce the impact of contact resistance. Figure 9 shows the coaxial flange and the four tested specimens.
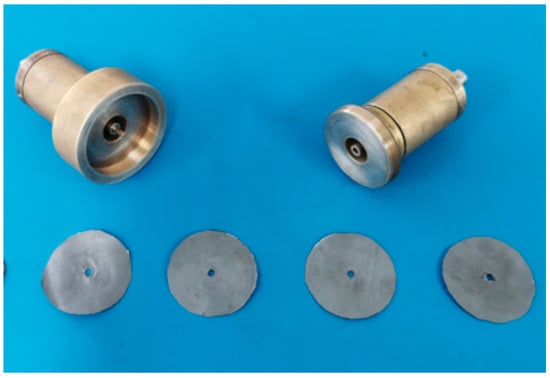
Figure 9.
Specimens and coaxial fixture.
The pulse source can generate a double exponential pulse when the rise time is 260 ps, the half-width is 650 ps, and the output voltage is approximately 2.2 kV [30]. Attenuators 1# and 2# are 10 dB and 60 dB, respectively. The tested waves of four specimens are shown in Figure 10.
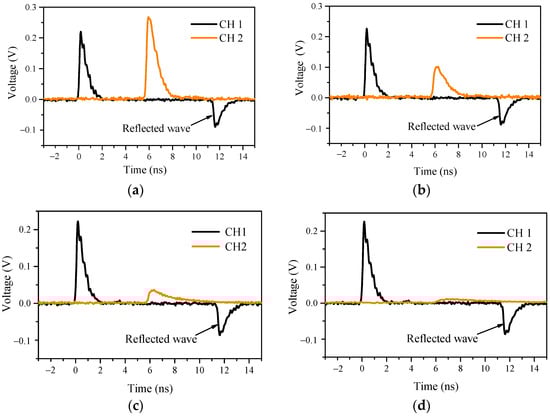
Figure 10.
Tested results of the four thickness specimens: (a) Thickness is 80 μm; (b) Thickness is 100 μm; (c) Thickness is 200 μm; (d) Thickness is 300 μm.
4.3. Result Analysis
4.3.1. Waveform Characteristics
Figure 11 shows the comparison results of the transmitted and reflected waves. The amplitude of the transmitted waves is normalized in Figure 11a. It can be observed that, with the increase in thickness, the rise time of the transmitted wave gradually slows down, and the pulse width gradually widens. Table 1 gives specific statistical results. This demonstrates that the specimen shows a characteristic of low-pass filtering, and the turning frequency gradually decreases with the increase in thickness, which is consistent with Figure 3.
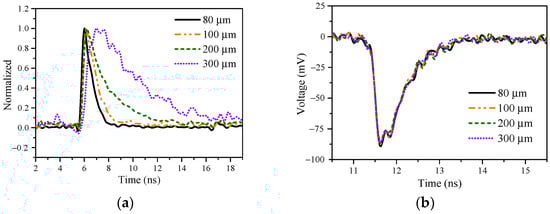
Figure 11.
Comparison of the transmitted and reflected waves: (a) The normalized transmitted waves, (b) The reflected waves.

Table 1.
The time domain parameter statistical results of the transmitted waveform.
In Figure 11b, we can see that the reflected waves are almost identical. This is because the reflection loss is independent of the material’s thickness, and it is only affected by the characteristic impedance of the material, which can be proved in Equations (7) and (10).
Figure 12 shows the contrast between the incident and reflected waves of the 80 μm specimen (the reflected wave is reversed). The half-width of the reflected wave is slightly larger than that of the incident wave. This is because reflection loss decreases with frequency, so the proportion of low-frequency energy in reflected waves is more than that in incident waves.
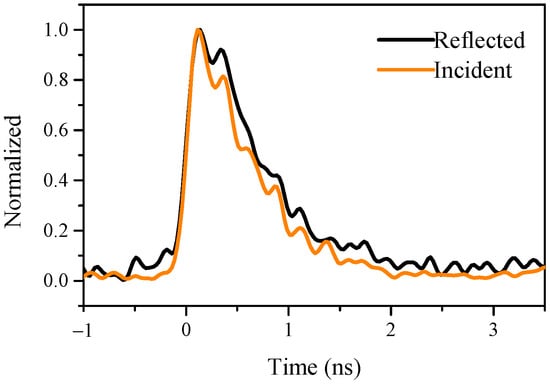
Figure 12.
Comparison of reflected and incident waves of 80 μm specimen.
4.3.2. SE Calculation
According to Formulas (13) and (14), Table 2 shows the calculated results of the peak value SE, energy density SE, and the difference between them (Δp-e). The SEpeak is greater than SEenergy, and Δp-e shows an increasing trend with the thickness. This is because the turning frequency of low-pass filtering decreases with the increase in thickness, thus the rise time of the transmitted wave slows down, the peak value decreases rapidly, the width of the transmitted wave broadens, and the energy is dispersed in a wider time range. So, the increase in the speed of the peak value SE is greater than that of the energy density SE with the increase in the material’s thickness.
Table 2.
Calculated SE in the time domain.
The damage of electromagnetic energy acting on equipment for a short time is greater than for a longer time, thus slowing down the rise time is more important for the protection of electronic equipment. It may be feasible to use SEpeak to evaluate the shielding performance for EMP in engineering applications.
The Fourier transform is used to obtain the amplitude–frequency curves of the incident and transmitted waves, and the SE curve in the frequency domain can be calculated. By using a VNA, the SE in the frequency domain is also tested. Figure 13 shows that there is good consistency between the two methods.
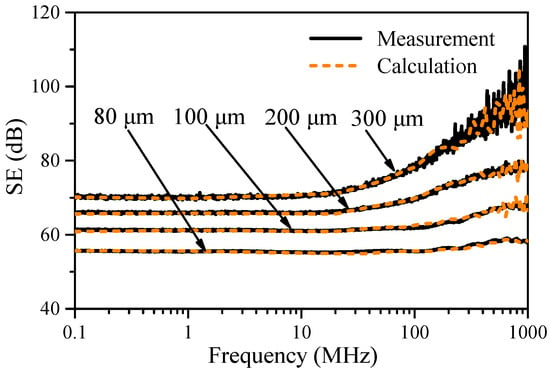
Figure 13.
Comparison of the SE in the frequency domain by calculation and measurement.
The SE curves are flat in the low-frequency range, and it has an increasing trend in the high-frequency band. This fits the theoretical model, which verifies the feasibility of the proposed method in the time domain SE test.
Considering that the radiation field strength in the time domain is much higher than in the frequency domain, the shielding performance of the specimens does not change significantly with the radiation field.
5. Conclusions
The information described in this paper is focused on the SE measurement of materials against EMP. The shielding mechanism in the frequency domain is reviewed to analyze the characteristics of attenuated pulse for EMP; three kinds of shielding materials against a rectangle pulse in a coaxial flange are simulated in CST. The transmitted waveforms show that the solid plane material presents low-pass filtering characteristics, and the perforated plate material presents high-pass filtering characteristics, thus the time domain characteristics (rise time, pulse with) of transmitted waves are extremely different. For evaluating the time domain shielding performance of materials comprehensively, the expressions for calculating peak value SE and energy density SE are given.
A modified test method based on the coaxial flange is proposed, and it realizes the measurement of the incident, transmitted, and reflected waves of the tested shielding material. Based on this, the SE of graphene with different thicknesses is tested. The results show that the material presents low-pass filter characteristics, and its turning frequency decreases with the increase in the thickness, which leads to a rise time of the transmitted wave and a pulse width. The reflected waves are not affected by the thickness of the material, because it is only related to the intrinsic impedance. The peak value SE and the energy density SE increase with the thickness, but the peak value SE is bigger and its increased speed is faster than the energy density SE. These changes in regulation comply with the theoretical shielding model well. Through the Fourier transform of the tested waves, the SE curve in the frequency domain is given, and it is consistent with the measurement results of the VNA; this verifies the feasibility of the proposed test method indirectly.
This method has the advantages of high measurement accuracy and comprehensive information acquisition and has wide application in EMC, electromagnetic protection design, and other fields.
Author Contributions
Conceptualization, Y.L. and W.W.; methodology, Y.L. and X.C.; validation, X.N., M.Z. and J.L.; formal analysis, Y.L. and X.C.; data curation, J.L. and R.J.; writing—original draft preparation, Y.L. and X.C.; writing—review and editing, R.J. All authors have read and agreed to the published version of the manuscript.
Funding
This research received no external funding.
Data Availability Statement
Not applicable.
Conflicts of Interest
The authors declare no conflict of interest.
References
- Zhou, B.H.; Shi, L.H.; Wang, J.B. Electromagnetic Pulse and Its Engineering Protection, 2nd ed.; National Defense Industry Press: Beijing, China, 2019; pp. 1–7. [Google Scholar]
- Du, C.; Cui, Z.; Mao, C. Risk Analysis of HPEM threats for linear RF channel with pyramid horn antenna based on system-Level SPICE modelling. Energies 2022, 15, 6142. [Google Scholar] [CrossRef]
- Du, C.; Liu, Z.; Mao, C.; Cui, Z.; Sun, D.; Qin, F. Statistical snalysis comparison of HEMP transient response of monopole antenna from facility and burst views. J. Electromagn. Waves Appl. 2021, 35, 1663–1677. [Google Scholar] [CrossRef]
- Ryu, J.; Lee, J. An integrated antenna-source system of very high ultra wide-band gain for radiating high-power wide-band pulses. IEEE Trans. Plasma Sci. 2012, 4, 1019–1026. [Google Scholar] [CrossRef]
- Kim, K.; Min, K.; Park, Y. A Pilot Experiment to develop a lightweight non-nuclear EMP shelter applying civil-military cooperation in a sustainability policy. Sustainability 2020, 24, 10669. [Google Scholar] [CrossRef]
- Deng, J.Q.; Hao, C. Research on powerful electromagnetic pulse coupling and power source protection. J. Microw. 2017, 33, 85–89. [Google Scholar]
- Jiang, L.J.; Hao, J.H.; Gong, Y.F. Electromagnetic coupling to an apertured enclosure via a penetrated transmission line based on electromagnetic topology. J. Electromagn. Waves Appl. 2017, 32, 606–623. [Google Scholar] [CrossRef]
- Henry, W. Electromagnetic Compatibility Engineering; John Wiley & Sons: Hoboken, NJ, USA, 2009; pp. 238–260. [Google Scholar]
- Geetha, S.; Satheesh, K.; Rao, C. EMI shielding: Methods and materials-a review. J. Appl. Polym. Sci. 2009, 4, 2073–2086. [Google Scholar] [CrossRef]
- Munalli, D.; Dimitrakis, G.; Chronopoulos, D. Electromagnetic shielding effectiveness of carbon fibre reinforced composites. Compos. B 2019, 173, 106906. [Google Scholar] [CrossRef]
- Zhou, B.H.; Gao, C. The definition of EMP shielding effectiveness. In Proceedings of the Asia-Pacific Conference on Environmental Electromagnetics, Hangzhou, China, 4–7 November 2003. [Google Scholar]
- Wang, J.; Cui, Z.; Chen, Z. Machine learning based prediction for the response of gas discharge tube to damped sinusoid signal. Energies 2022, 15, 2622. [Google Scholar] [CrossRef]
- Singh, A.S. A review of porous lightweight composite materials for electromagnetic interference shielding. Compos. B 2018, 149, 188–197. [Google Scholar] [CrossRef]
- Tesche, F. On the use of the Hilbert transform for processing measured CW data. IEEE Trans. Electromagn. Compat. 1992, 3, 259–266. [Google Scholar] [CrossRef]
- Lu, Y.; Yan, M.; Gao, Y. Mechanism and development of electromagnetic shielding materials. Value Eng. 2019, 1, 159–162. [Google Scholar]
- Zhang, L.; Wei, G.; Hu, X. Shielding effectiveness testing method of pulse electric field based on GTEM cell. J. Phys. Conf. Ser. 2013, 418, 012080. [Google Scholar] [CrossRef]
- Herlemann, H.; Koch, M. Measurement of the transient shielding effectiveness of enclosures using UWB pulses inside an open TEM waveguide. Adv. Radio Sci. 2007, 5, 75–79. [Google Scholar] [CrossRef][Green Version]
- Cui, M.; Wei, M.; Chen, X. Testing of materials shielding effectiveness against electromagnetic pulse. In Proceedings of the Cross Strait Quad-Regional Radio Science and Wireless Technology Conference, Chengdu, China, 21–25 July 2013. [Google Scholar]
- Chen, X.; Chen, Y.; Wei, M. Time domain testing methods of material’s shielding effectiveness of electromagnetic pulse using flange coaxial. High Volt. Eng. 2012, 3, 594–660. [Google Scholar]
- Liu, Z.; Bai, G.; Huang, Y. Reflection and absorption contributions to the electromagnetic interference shielding of single-walled carbon nanotube/polyurethane composites. Carbon 2007, 45, 821. [Google Scholar] [CrossRef]
- Lameirinhas, R.A.M.; Torres, J.P.N.; Baptista, A. A new method to analyse the role of surface plasmon polaritons on dielectric-metal interfaces. IEEE Photonics J. 2022, 4, 2236409. [Google Scholar] [CrossRef]
- Lameirinhas, R.A.M.; Torres, J.P.N.; Baptista, A. A new method to determine the response of Kretschmann’s structure-based biosensors. IEEE Sens. J. 2022, 21, 20421–20429. [Google Scholar] [CrossRef]
- Weber, H. The Fresnel equations for lossy dielectrics and conservation of energy. J. Mod. Opt. 2014, 15, 1219–1224. [Google Scholar] [CrossRef]
- Schulz, R.B.; Plantz, V.C.; Brush, D.R. Shielding theory and practice. IEEE Trans. Electromagn. Compat. 1988, 3, 187–201. [Google Scholar] [CrossRef]
- Jia, X.; Li, Y.; Shen, B. Evaluation, fabrication and dynamic performance regulation of green EMI-shielding materials with low reflectivity: A review. Compos. B 2022, 233, 109652. [Google Scholar] [CrossRef]
- Jia, Z.L.; Zhang, H.H.; Ding, D.Z. Time-domain shielding effectiveness analysis based on DGTD method accelerated by local time-stepping and parallel techniques. IEEE Trans. Electromagn. Compat. 2023, 3, 900–911. [Google Scholar] [CrossRef]
- ASTM D4935-10; Standard Test Method for Measuring the Electromagnetic Shielding Effectiveness of Planar Materials. ASTM International: West Conshohocken, PA, USA, 2010.
- Sarto, M.S.; Tamburrano, A. Innovative test method for the shielding effectiveness measurement of conductive thin films in a wide frequency range. IEEE Trans. Electromagn. Compat. 2006, 48, 331–341. [Google Scholar] [CrossRef]
- Chen, X.; Chen, Y.; Wei, M. Broadband coaxial holder with continuous-conductor used for shielding effectiveness of materials against electromagnetic pulse. Electron. Lett. 2013, 8, 532–534. [Google Scholar] [CrossRef]
- Guo, J.; Ma, L.; Cheng, Y. Design of a sub-nanosecond solid-state pulse generator. Mod. Appl. Phys. 2019, 4, 040402. [Google Scholar]


Disclaimer/Publisher’s Note: The statements, opinions and data contained in all publications are solely those of the individual author(s) and contributor(s) and not of MDPI and/or the editor(s). MDPI and/or the editor(s) disclaim responsibility for any injury to people or property resulting from any ideas, methods, instructions or products referred to in the content. |
© 2023 by the authors. Licensee MDPI, Basel, Switzerland. This article is an open access article distributed under the terms and conditions of the Creative Commons Attribution (CC BY) license (https://creativecommons.org/licenses/by/4.0/).