Article

The Design, Analysis, and Optimization of a New Pitch Mechanism for Small Wind Turbines

1
School of Energy and Power Engineering, Inner Mongolia University of Technology, Hohhot 010010, China
2
Inner Mongolia Electric Power Survey & Design Institute Co., Ltd., Hohhot 010010, China
3
Inner Mongolia Energy Power Generation Zhunda Power Generation Co., Ltd., Ordos 017000, China
*
Author to whom correspondence should be addressed.
Energies 2023, 16(18), 6708; https://doi.org/10.3390/en16186708
Submission received: 30 June 2023 / Revised: 26 August 2023 / Accepted: 14 September 2023 / Published: 19 September 2023
(This article belongs to the Special Issue Advances in Wind Turbines)

Abstract

:
This article proposes and designs a novel variable pitch adjustment device for small wind turbines. The generator spindle is designed to be hollow so that the drive rod passes through it and connects the pitch drive mechanism to the pitch actuator. The article introduces the basic structure and working principle of the pitch mechanism and verifies the feasibility of the pitch device by using 3D printing technology to produce a small-scale model. The stress analysis of the wind turbine was carried out using the unidirectional fluid–structure coupling method. The results show that the maximum equivalent stress of the pitch mechanism is 27.42 MPa, the maximum tooth surface contact stress of the gear is 38.40 MPa, and the maximum tooth root bending stress is 18.13 MPa. The rack synchronous disk, blade handle, and gear rack mechanism were designed with light weight using various optimization schemes. The results of the optimization showed that the overall mass of the pitch mechanism was reduced by 33.2%, improving the applicability of the new pitch mechanism.

1. Introduction

Remote areas such as marine islands, rural farms, grassland pastures, etc., have vast land space and a certain demand for electricity. However, due to the distance from the mainland, scattered users, and other reasons, grid power supply is difficult and costly to establish [1]. Therefore, distributed energy systems are increasingly installed on site in these areas, mainly based on wind and solar energy, combined with energy storage batteries, to meet the electricity demand. This poses a certain demand for small wind turbines [2,3,4,5].
The stability and smoothness of the power output of small wind turbines are crucial for the stability of distributed energy systems. However, most current small wind turbines adopt a fixed pitch mode, relying on blade stall control in strong wind conditions, and resulting in a poor power regulation effect, which cannot meet the requirements for timely, accurate, and coordinated control of distributed energy systems [6,7]. Therefore, it is scientifically significant to develop a power control method and technology suitable for small wind turbines.
In recent years, power control technology for small wind turbines has been studied in two main categories: electromagnetic control and aerodynamic control. Electromagnetic control mainly adopts complex electrical control schemes and regulates power by controlling the generator torque. Calabrese, et al. proposed a novel soft-stall control scheme for wind turbines, which used a ring-shaped brushless permanent magnet synchronous generator and controlled the generator torque through a double-sided symmetrical power converter, thereby reducing the output power [8]. Çelik et al. proposed a novel method to control the wind turbine speed, which used a small low-inertia DC generator and connected the generator terminals to a resistor, generating a braking torque opposite to the wind wheel rotation direction. Therefore, the wind wheel speed was regulated, and the generator power was controlled [9]. Aerodynamic control regulates power by changing the aerodynamic performance of wind turbines in ways such as blade stall, variable pitch, wind wheel yawing, etc. For instance, Mohammadi et al. designed a stall-regulated wind turbine blade and simulated the operating characteristics of a 5.5 kW stall-regulated wind turbine under static and dynamic conditions using numerical simulation, proving that the stall phenomenon at high speed can effectively control the output performance of wind turbines [10]. Meng et al. proposed a novel horizontal axis wind turbine, which controlled the power output by changing the swept area and aerodynamic characteristics of blades through blade pre-folding, which caused changes in the pitch and cone angles, thereby maintaining a constant power output of wind turbines [11]. Akhter et al. addressed the deformed trailing edge (MTE) technology for small-to-medium-sized wind turbine blades by installing microsensors on the blade surface in conjunction with a local actuator, which in turn enhances the energy harvesting of the blade at low-to-medium wind speeds [12]. As shown in Figure 1, some researchers have based their work on the gyroscopic characteristics of wind turbines to deflect the tail of the wind turbine, which in turn regulates the pitching motion of the wind turbine, or the active yawing, to control the power of the wind turbine [13,14]. Mihai Chirca et al. designed two-rudder deflection actuation systems with the aim of reducing the wear and tear of the actuating machinery for a longer service life [15].
In addition, different pitch mechanisms have also been proposed by researchers for small- and medium-sized wind turbines.
As shown in Figure 2, Chen et al. proposed a passive variable pitch system for small wind turbines, which used a disc pulley as an actuator, driven by centrifugal force to move the disc pulley outward, driving the bearing combination system to adjust the blade pitch angle [16]. Compared with the passive variable pitch, the power regulation of the variable pitch and speed units using active variable pitch is more accurate and reliable [17], and it can be integrated better into distributed energy systems. Sung et al. designed an active pitch mechanism based on a hinge structure, using a crank-slider device connected to the pitch bearing and blade to change the pitch angle [18].
In the introduction, this study describes several power control methods for small wind turbines. For example, the wind turbine relying on the blade stall and the blade deformation trailing edge (MTE) control will have a lower manufacturing cost, but it cannot achieve active control of the output power. The control performance depends on the unique wing structure of the blade, and the aerodynamic load on the blade during the operation of the wind turbine is larger. The wind turbine will rely on the rudder for power control, the regulation performance will be affected by the actuator, and the balance between the actuator and gyroscopic torque will be more difficult to accurately measure. Under some working conditions, there will be frequent oscillation of the nose, and the safety is poor; if relying on the centrifugal force for the passive pitch wind turbine, there is a hysteresis in the pitch, the wind turbine speed requirements are higher, the blade pitch control performance is affected by the spring mechanism, and it is difficult to accurately estimate the balance between the spring and the pitch torque.
In summary, this paper designed a novel variable pitch (horizontal axis) wind turbine with an active variable pitch mechanism and verified the reliability of the variable pitch mechanism based on model verification and stress simulation analysis. The stress simulation results are used to optimize the key components of the variable pitch mechanism by various lightweight design methods, which further enhance the potential applications of the novel variable pitch wind turbine.

2. Structural Design and Stress Analysis

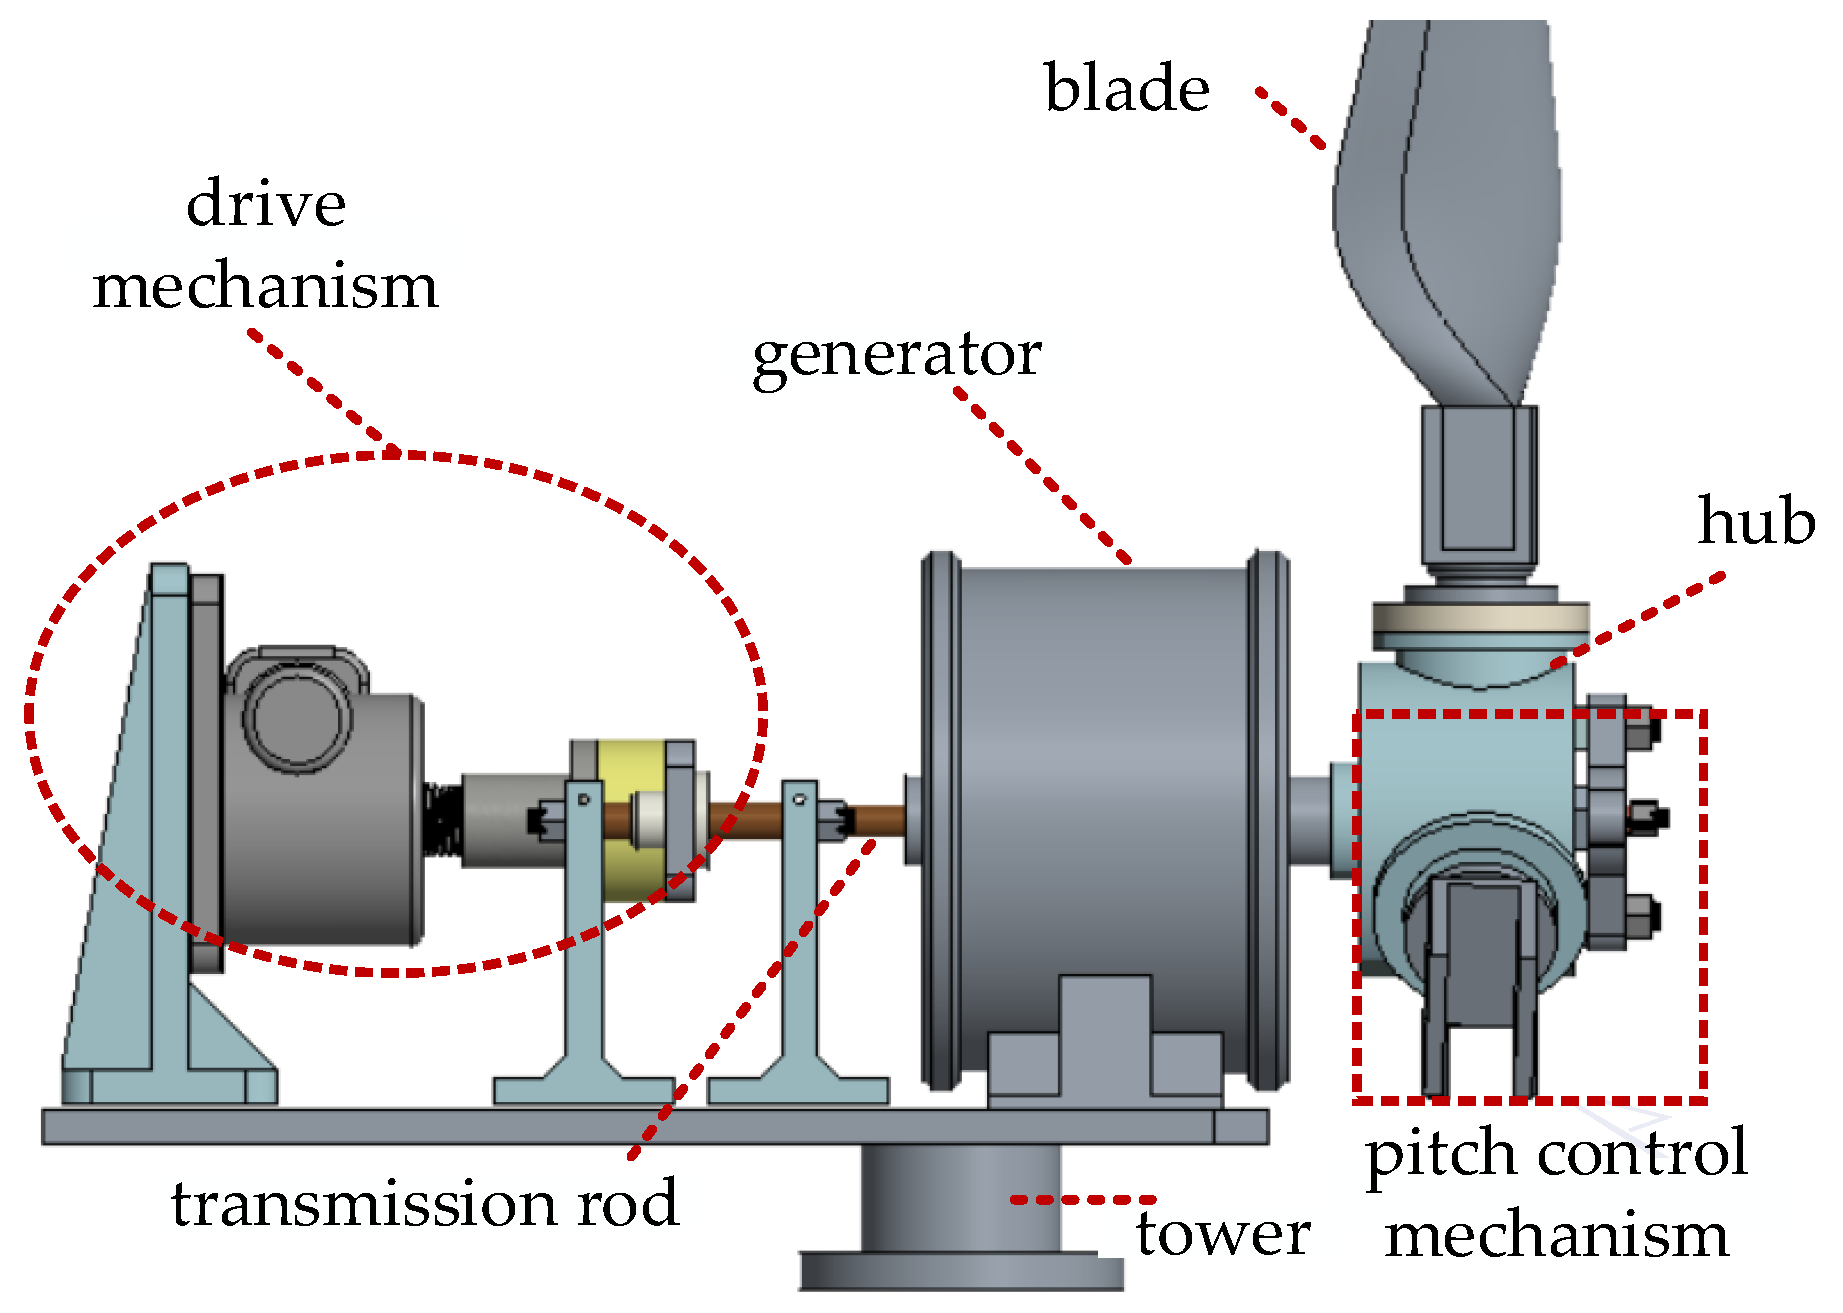
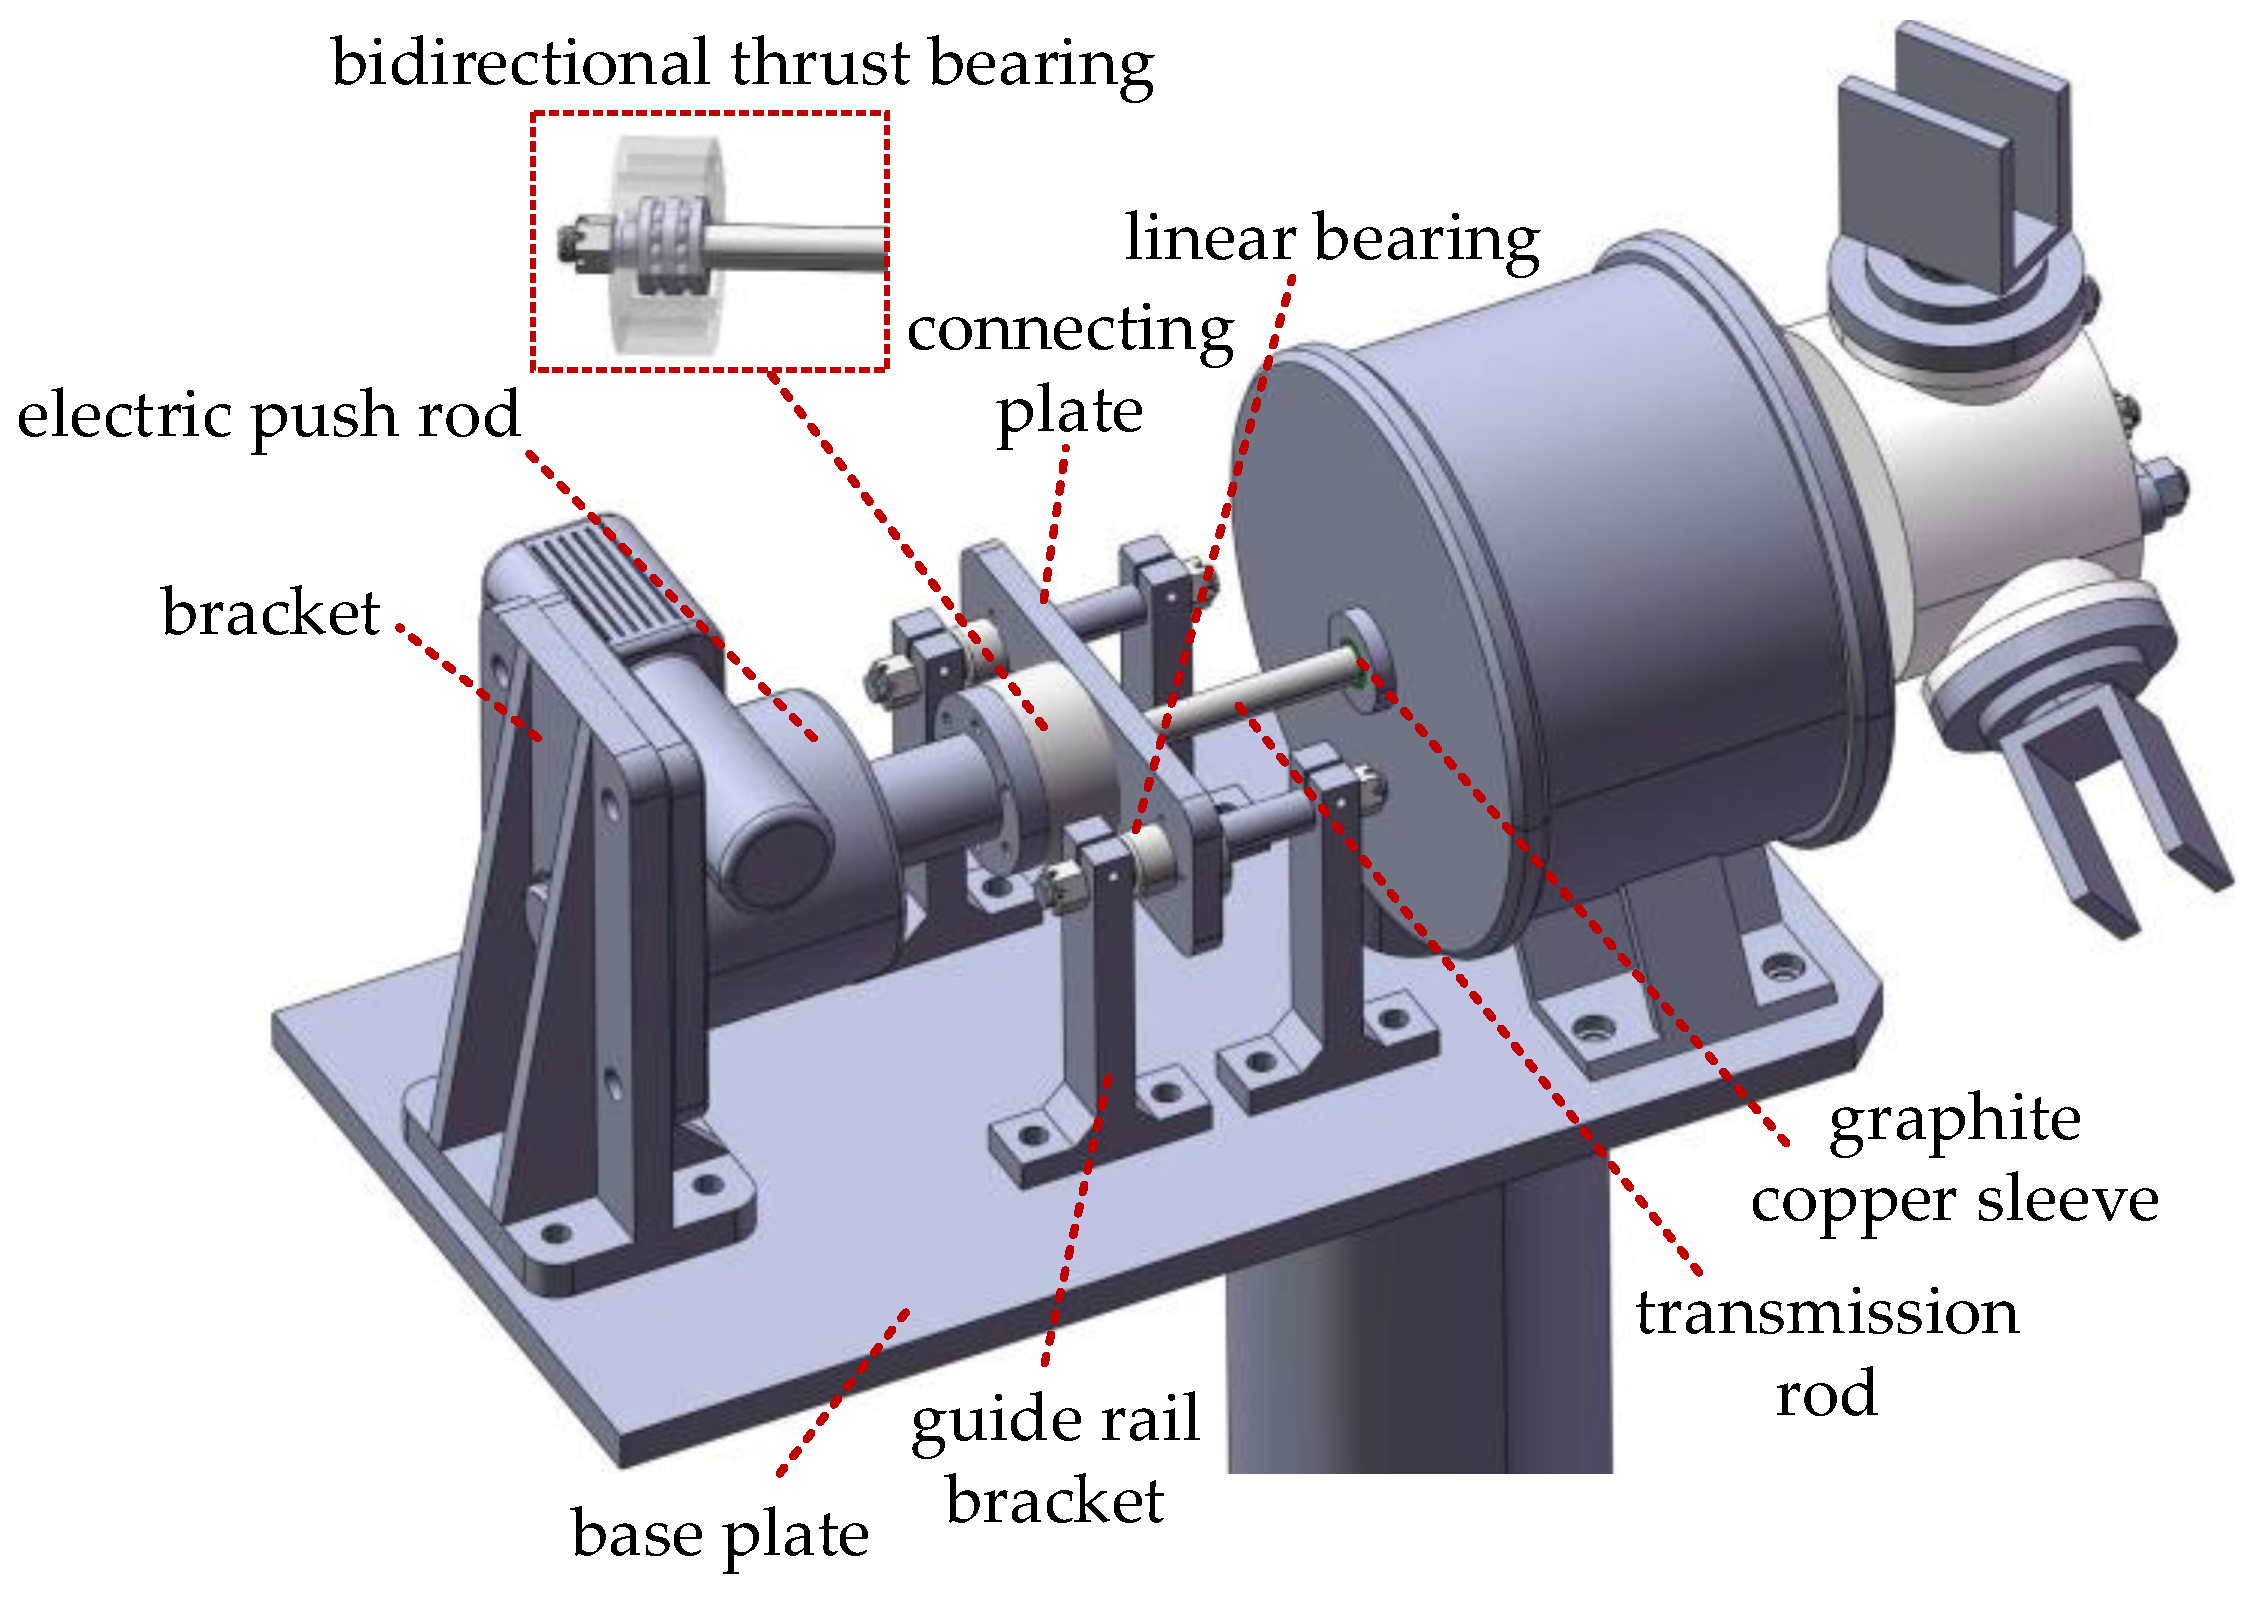
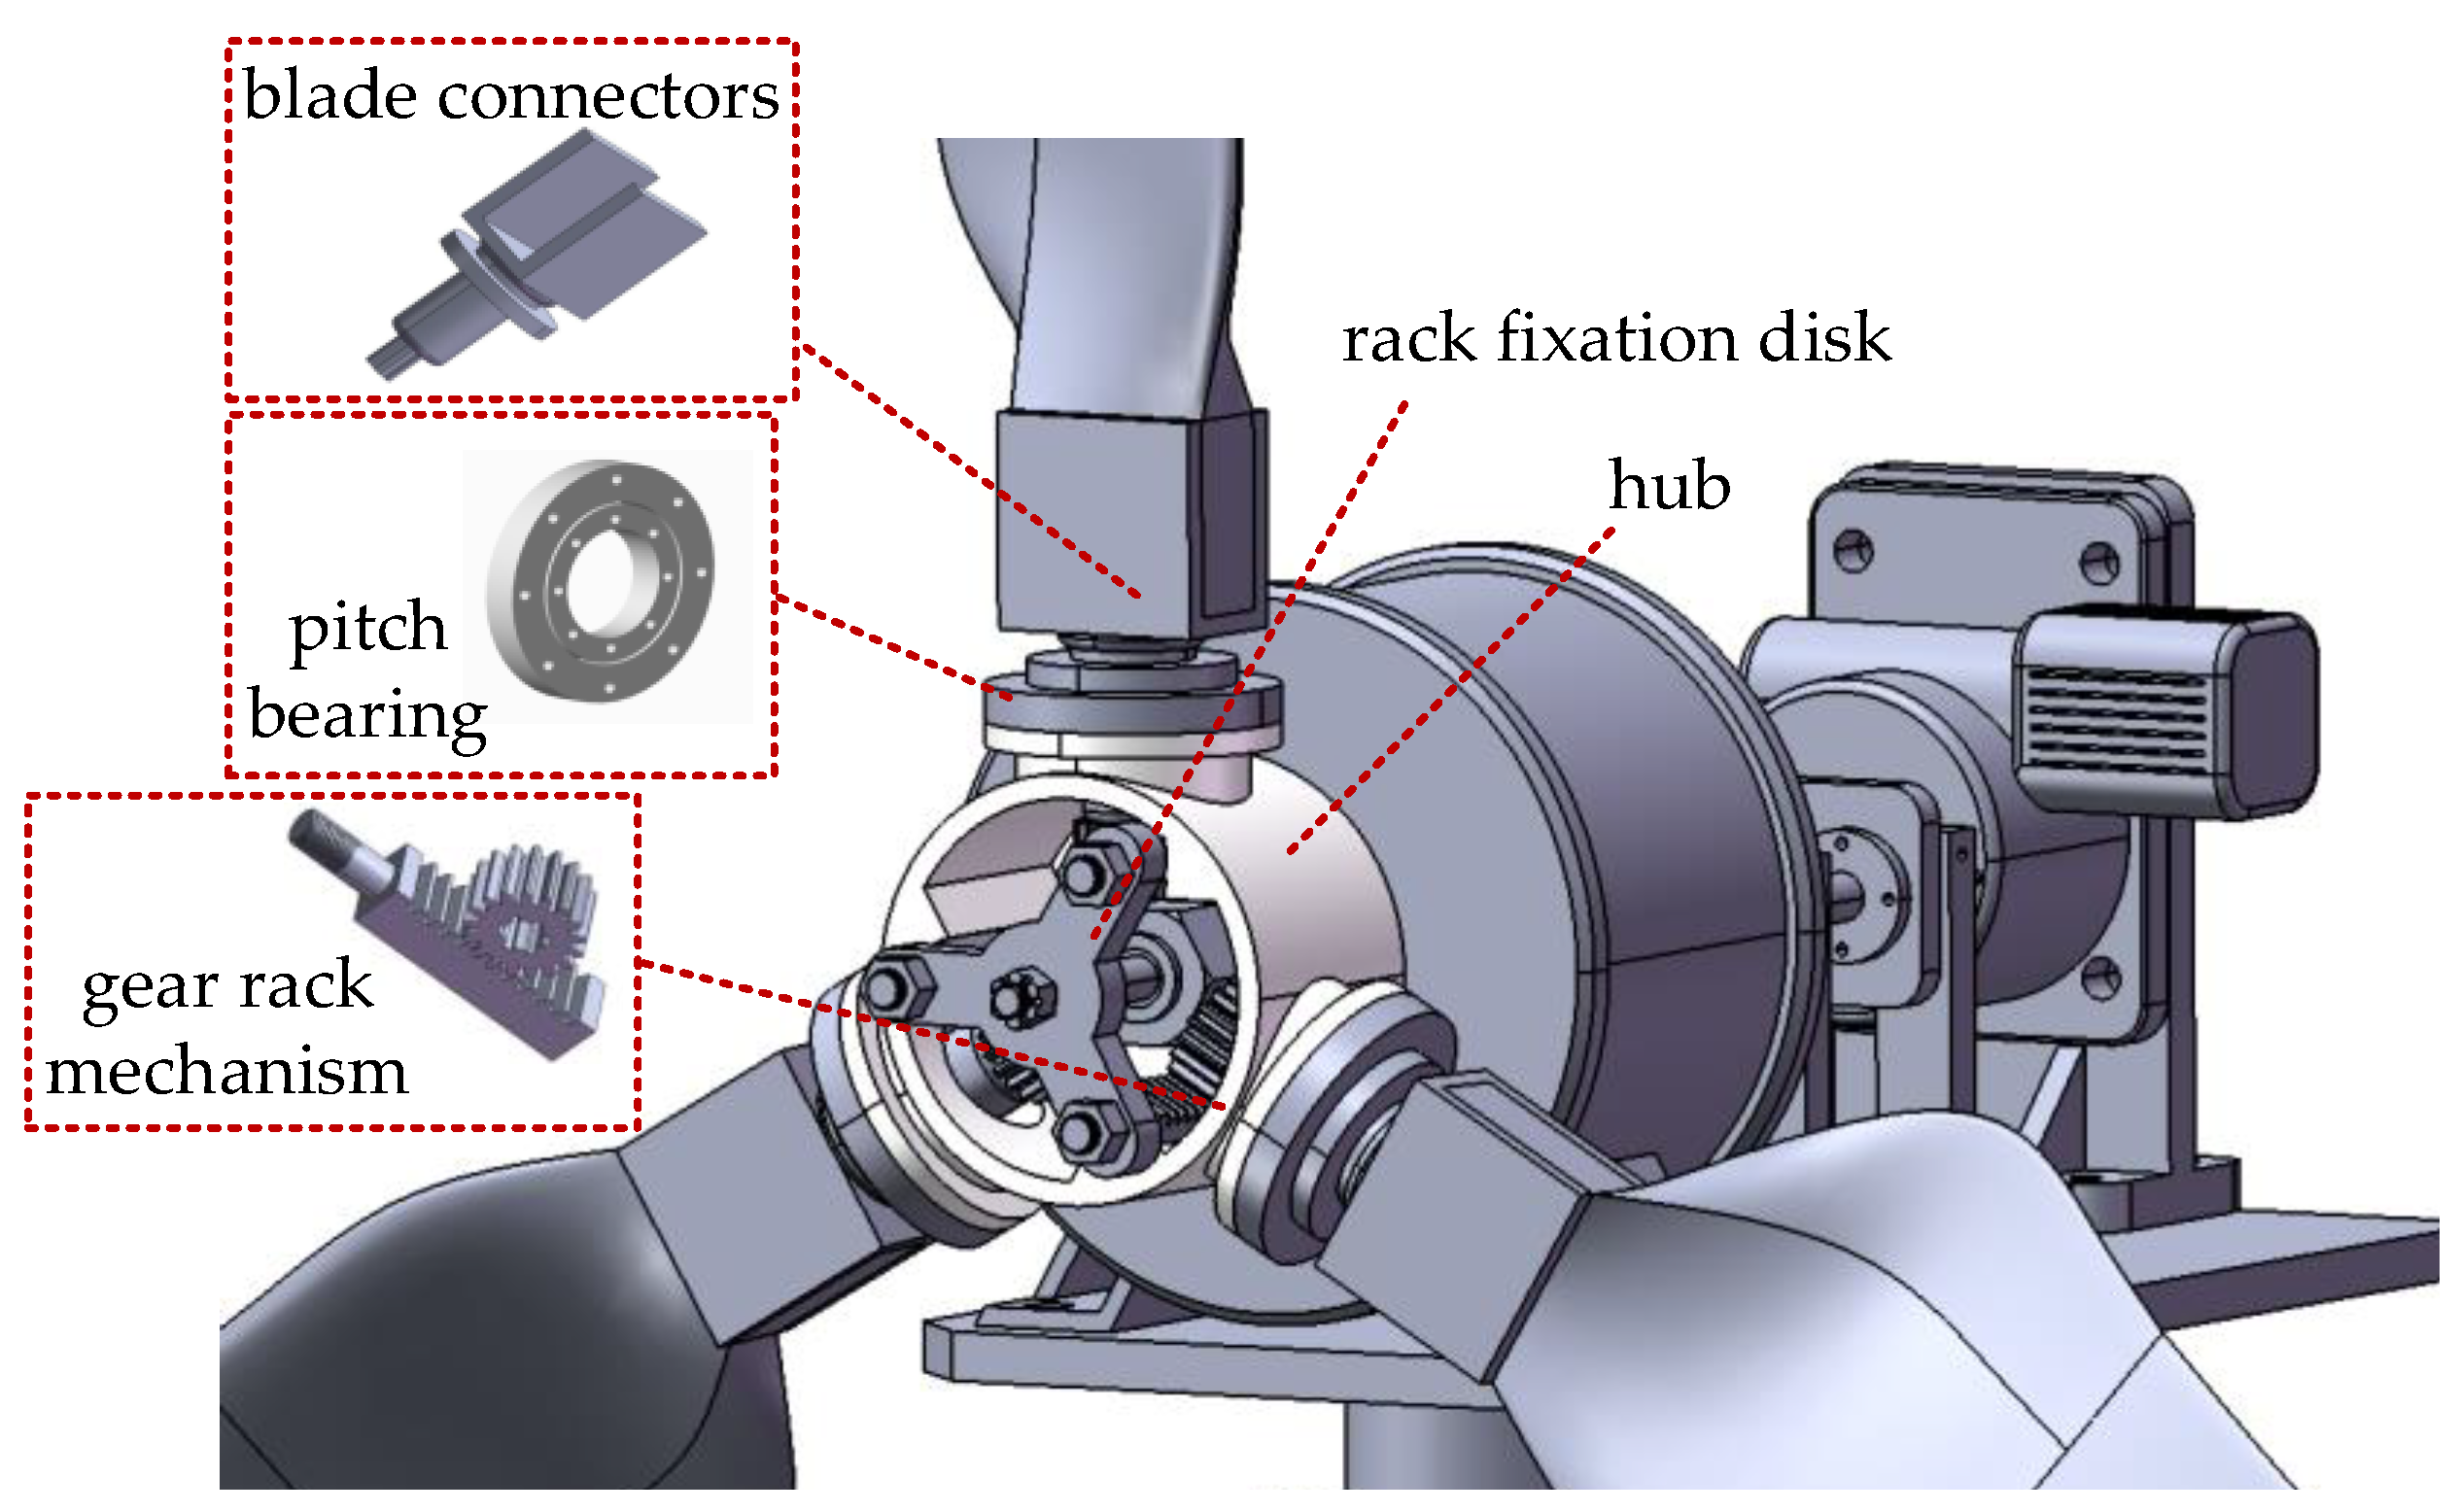
2.1. Basic Structure of the Novel Variable Pitch Wind Turbine

The overall structure of the novel variable pitch wind turbine is shown in Figure 3. The variable pitch wind turbine designed in this paper mainly consists of blades, a tower, a generator, a hub, a variable pitch adjustment mechanism, a drive mechanism, and a transmission rod. The generator’s main shaft is hollow, and the transmission rod passes through the middle. The variable pitch adjustment mechanism comprises a rack synchronizer, variable pitch bearings, a gear rack mechanism, and a blade connector. The drive mechanism includes an electric push rod, bidirectional thrust bearings, a guide rail, etc.
The drive mechanism and the variable pitch adjustment mechanism are the innovatively designed parts of the novel variable pitch wind turbine.
Figure 4 shows a detailed schematic diagram of the drive mechanism. The electric push rod moves forward or backwards when performing the variable pitch action, driving the transmission rod to also move forward or backwards through the bidirectional thrust bearing. The transmission rod rotates synchronously with the wind wheel. The hollow shaft of the generator and the transmission rod make contact through a graphite copper sleeve, thereby reducing friction. The transmission rod converts the complex motion of the rotation and translation into the translation motion, by cooperating with the bidirectional thrust bearing.
To ensure the accurate movement of the push rod along the generator axis and avoid motion interference during the variable pitch action, guide rail devices are also installed on both sides of the drive mechanism. The guide rail device consists of a connecting plate, a guide rail support, a linear bearing, and a guide rail. The guide rail is made up of two optical axes, and the linear bearing moves linearly on the guide rail, reducing the friction of the guide rail device.
Figure 5 shows the structural schematic diagram of the variable pitch adjustment mechanism.
The hub body is designed as a cylinder, and three flanges are evenly arranged on the outside of the hub body for fixing and installing variable pitch bearings. The flange is welded to the main body through a cylindrical support. Three guide platforms are provided inside the main body for guiding and positioning the variable pitch rack. The hub is fixed on the generator’s main shaft, radial fixation between the hub and the main shaft is realized by a flat key, and axial fixation is realized by a locking nut. One end of the transmission rod is fixed to the rack synchronizer by a locking nut, and three evenly arranged racks are fixed onto the synchronizer. The rack is installed on a specially designed guide platform inside the hub, which can realize axial movement and positioning functions. The gear and blade connector are connected by a spline shaft, and the blade connector is connected to the hub flange by a variable pitch bearing. The variable pitch bearing includes two parts: inner and outer. The inner ring is fixed to the blade connector by bolts, and the outer ring is fixed to the hub flange by bolts, which means relative rotation between the blade connector and the hub can be realized. The gear meshes with the rack enabling relative transmission.

2.2. Working Principle of the Novel Variable Pitch Wind Turbine

Figure 6 is a diagram of the principle action of the variable pitch adjustment mechanism. After the drive mechanism is actuated, the transmission rod moves through the hollow shaft of the generator, and the transmission rod is connected to the rack synchronizer in the variable pitch adjustment mechanism. This drives the rack to move axially, rotates the gear, and fixes the gear with the part connecting the blade, thereby changing the blade pitch angle. The action principle of the variable pitch mechanism indicates that the blade pitch angle depends on both the direction of the push rod movement and the initial alignment of the blade connector, gear, and rack. Among them, the moving speed V of the transmission rod is equal to the product of the blade variable pitch angular speed ω and the gear pitch circle radius.

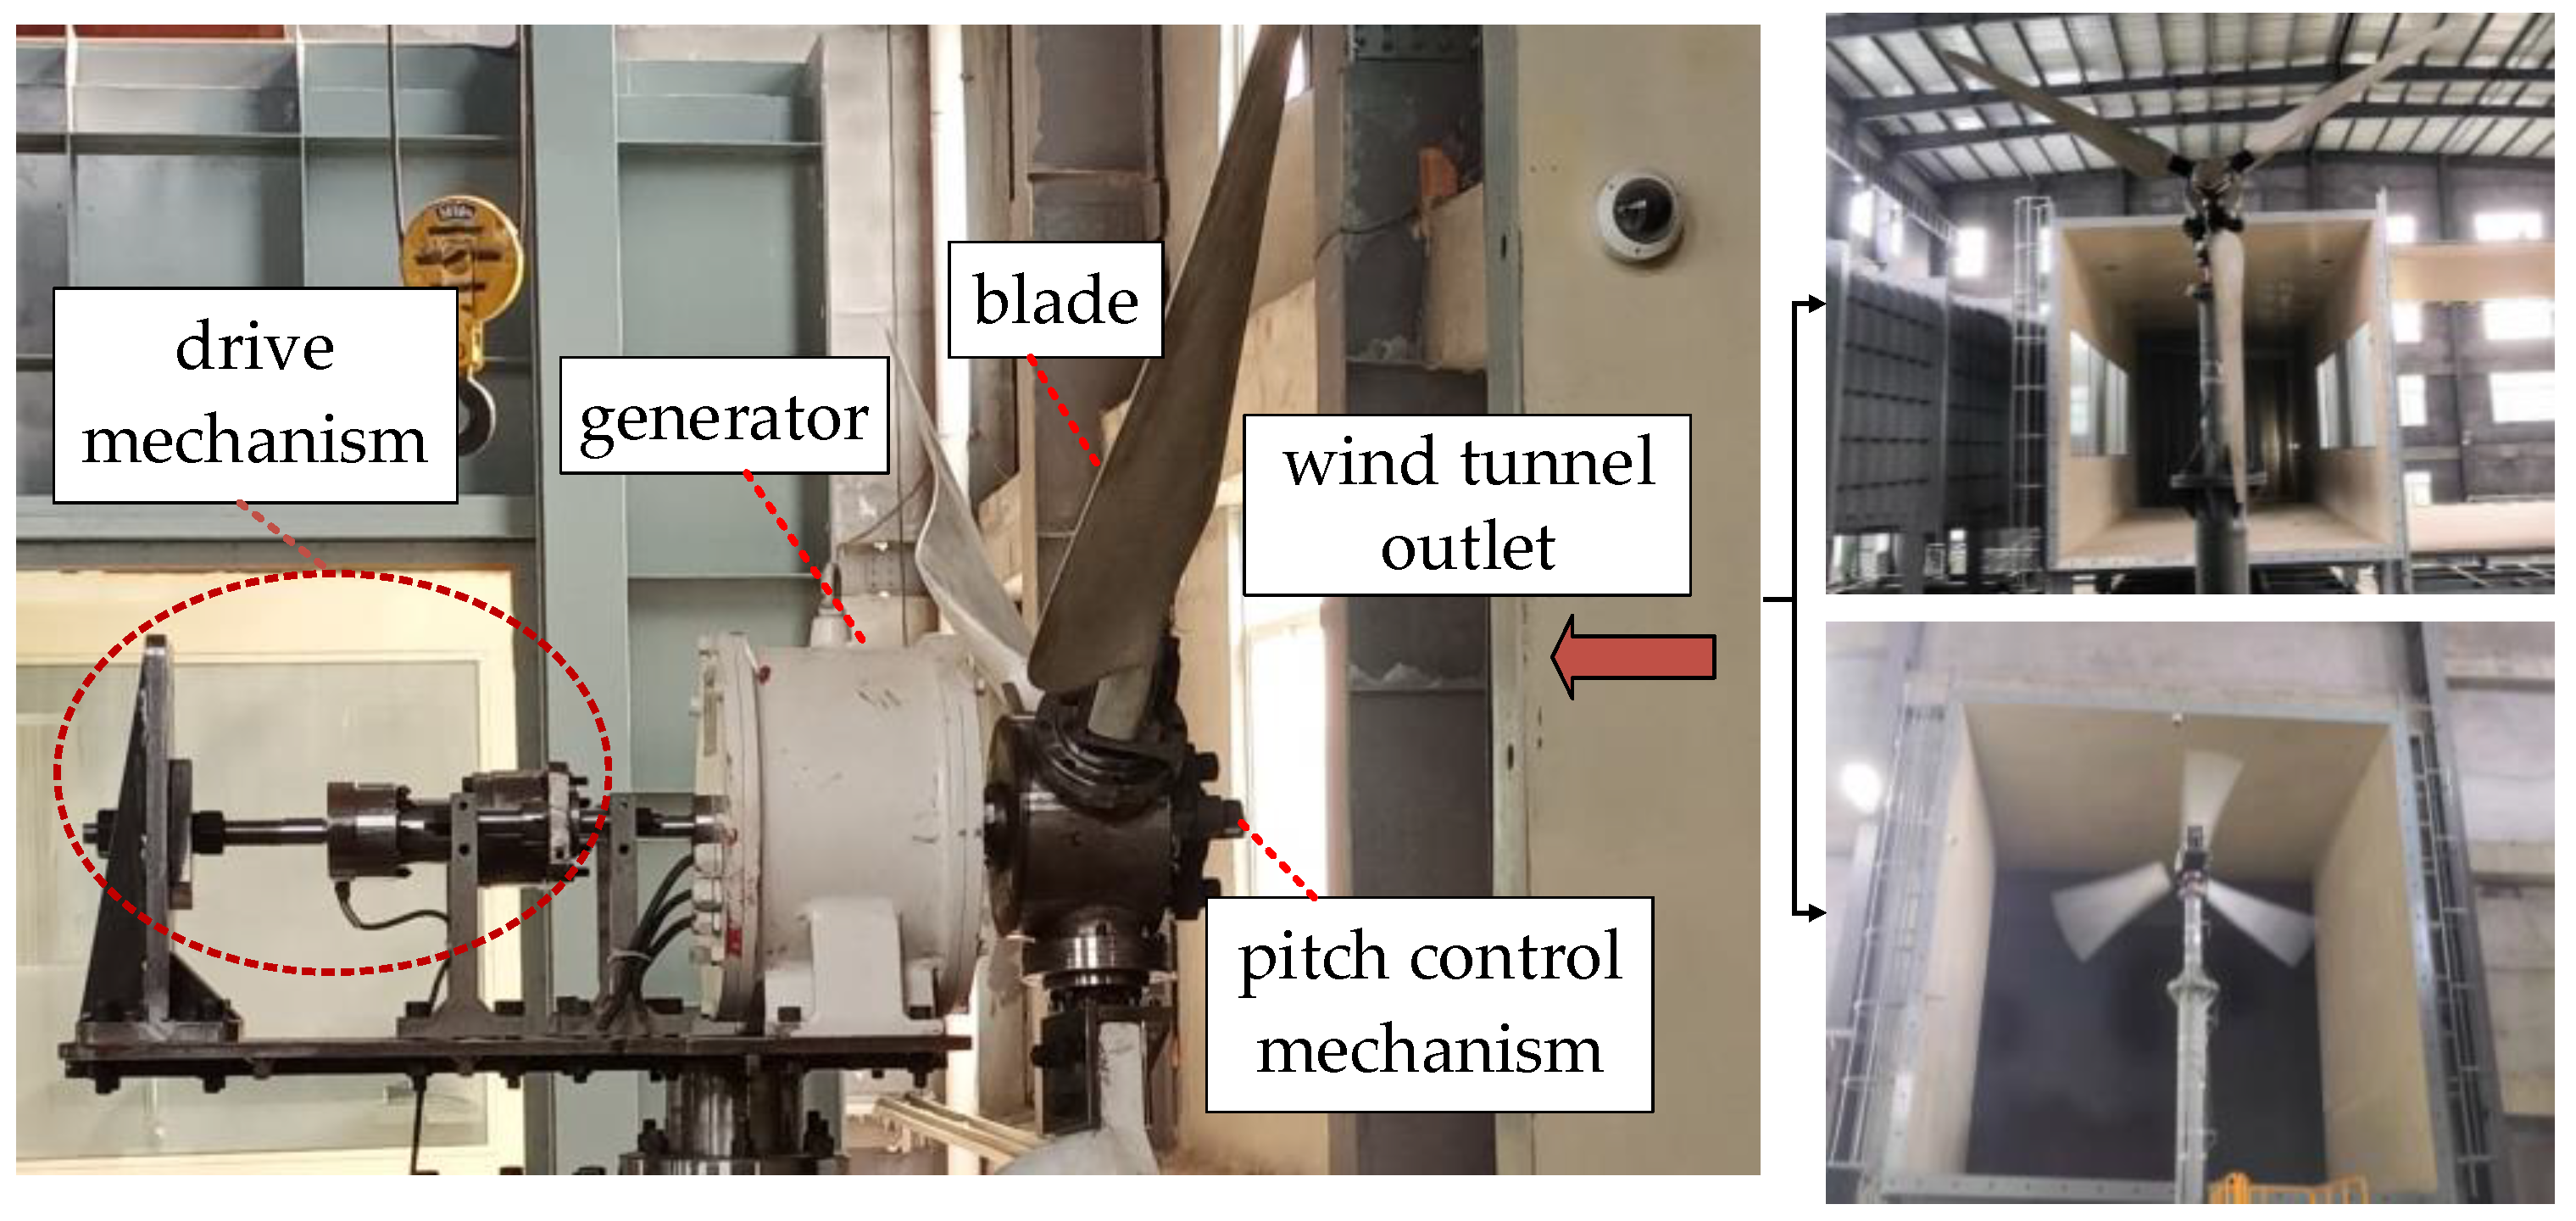
2.3. Small-Scale Model Test Verification

To eliminate potential errors in the design and simulation process, a small-scale prototype model (Figure 7) was constructed by scaling down the 3D model of the 1.5 kW wind turbine proportionally, using 3D printing technology to manufacture some parts, and assembling them. The model turbine blades were rotated around the variable pitch bearing by the action of the electric push rod at the tail, and the whole process was smooth, without motion interference. The test also demonstrated the feasibility of the variable pitch transmission device.

2.4. Experimental Study of a Prototype Test Hole for a New Variable Pitch Wind Turbine

In this study, a simple test prototype of the new pitch wind turbine was fabricated with a capacity of 1.5 kW and the start-up performance was tested in a wind tunnel. The test rig of the prototype in the wind tunnel test is shown in Figure 8. The test prototype was equipped with a screw unit instead of a motorized actuator unit. The pitch angle was manually adjusted during the test.
In the test, the generator will be in a no-load state, so that the wind speed of the wind tunnel will be gradually increased from 3 m/s. The starting wind speed under different pitch angles is recorded as shown in Figure 9; from the figure, it can be seen that the minimum starting wind speed of the wind turbine is 3.7 m/s, corresponding to the starting pitch angle of 50°, which is slightly higher than that of the commercially applied 1.5 kW small wind turbine. Future improvements in the manufacturing accuracy of the parts and the assembly accuracy will obtain a smaller starting wind speed [19,20].

2.5. Technical Advantages and Challenges of New Variable Pitch Wind Turbines

Firstly, the pitch adjustment device adopts a more reliable rack and pinion drive with simpler control logic, which is less prone to mechanical dead spot problems and less costly to manufacture than the hinged structure in Ref. [18]. Secondly, the new variable pitch wind turbine adopts a set of pitch drive units and is mounted on the rear side of the generator inside the nacelle, which is more flexible and simplifies the power supply of the drive unit compared with the actuator being mounted at the hub in Ref. [16].
In terms of application, the novel variable pitch wind turbine mainly targets areas such as marine islands and grassland pastures. Since these areas generally have a low degree of surface roughness and wind shear, they perfectly avoid the shortcomings of the unified variable pitch mode in dealing with wind shear situations [21,22].
However, the generator of the new variable pitch wind turbine has a hollow shaft, which undoubtedly increases the size of the generator. Secondly, some of the gravity of the rack and pinion components and synchronous discs will be applied to the drive rods, which will cause the drive rods to bend and wear. Therefore, there is a need for a suitable lightweight design of the components to reduce the size and wear conditions.

2.6. Stress Analysis of Variable Pitch Adjustment Mechanism Components

The design standards for small wind turbines are mainly for fixed pitch wind turbines, while for active-power-control-type small wind power units, the loads of key components are generally analyzed empirically by combining simplified model calculations and a large amount of test data [23].
This paper imported the established three-dimensional wind turbine model into the ANSYS Workbench CFX (version 18.2) module to perform aerodynamic force calculation and used a one-way fluid–solid coupling method to perform load simulation calculations of the variable pitch adjustment mechanism in the static structural module. It also analyzed the stress situation of key components in typical working conditions, verifying whether the mechanism meets the basic design requirements. This method can analyze the shortcomings of the mechanism design compared with the simplified load calculation method more intuitively.

2.6.1. Model Parameters

The blades in the initial wind turbine model were designed for 1.5 kW as the target, and the blade airfoil was NACA 4412. The blade length was 1380 mm, and the wind wheel diameter was 3060 mm. The three-dimensional model used for simulation omitted components such as the tower, drive mechanism, base plate, etc. This paper established five pitch angles of 6°, 9°, 12°, 15°, and 25° for comparative analysis.

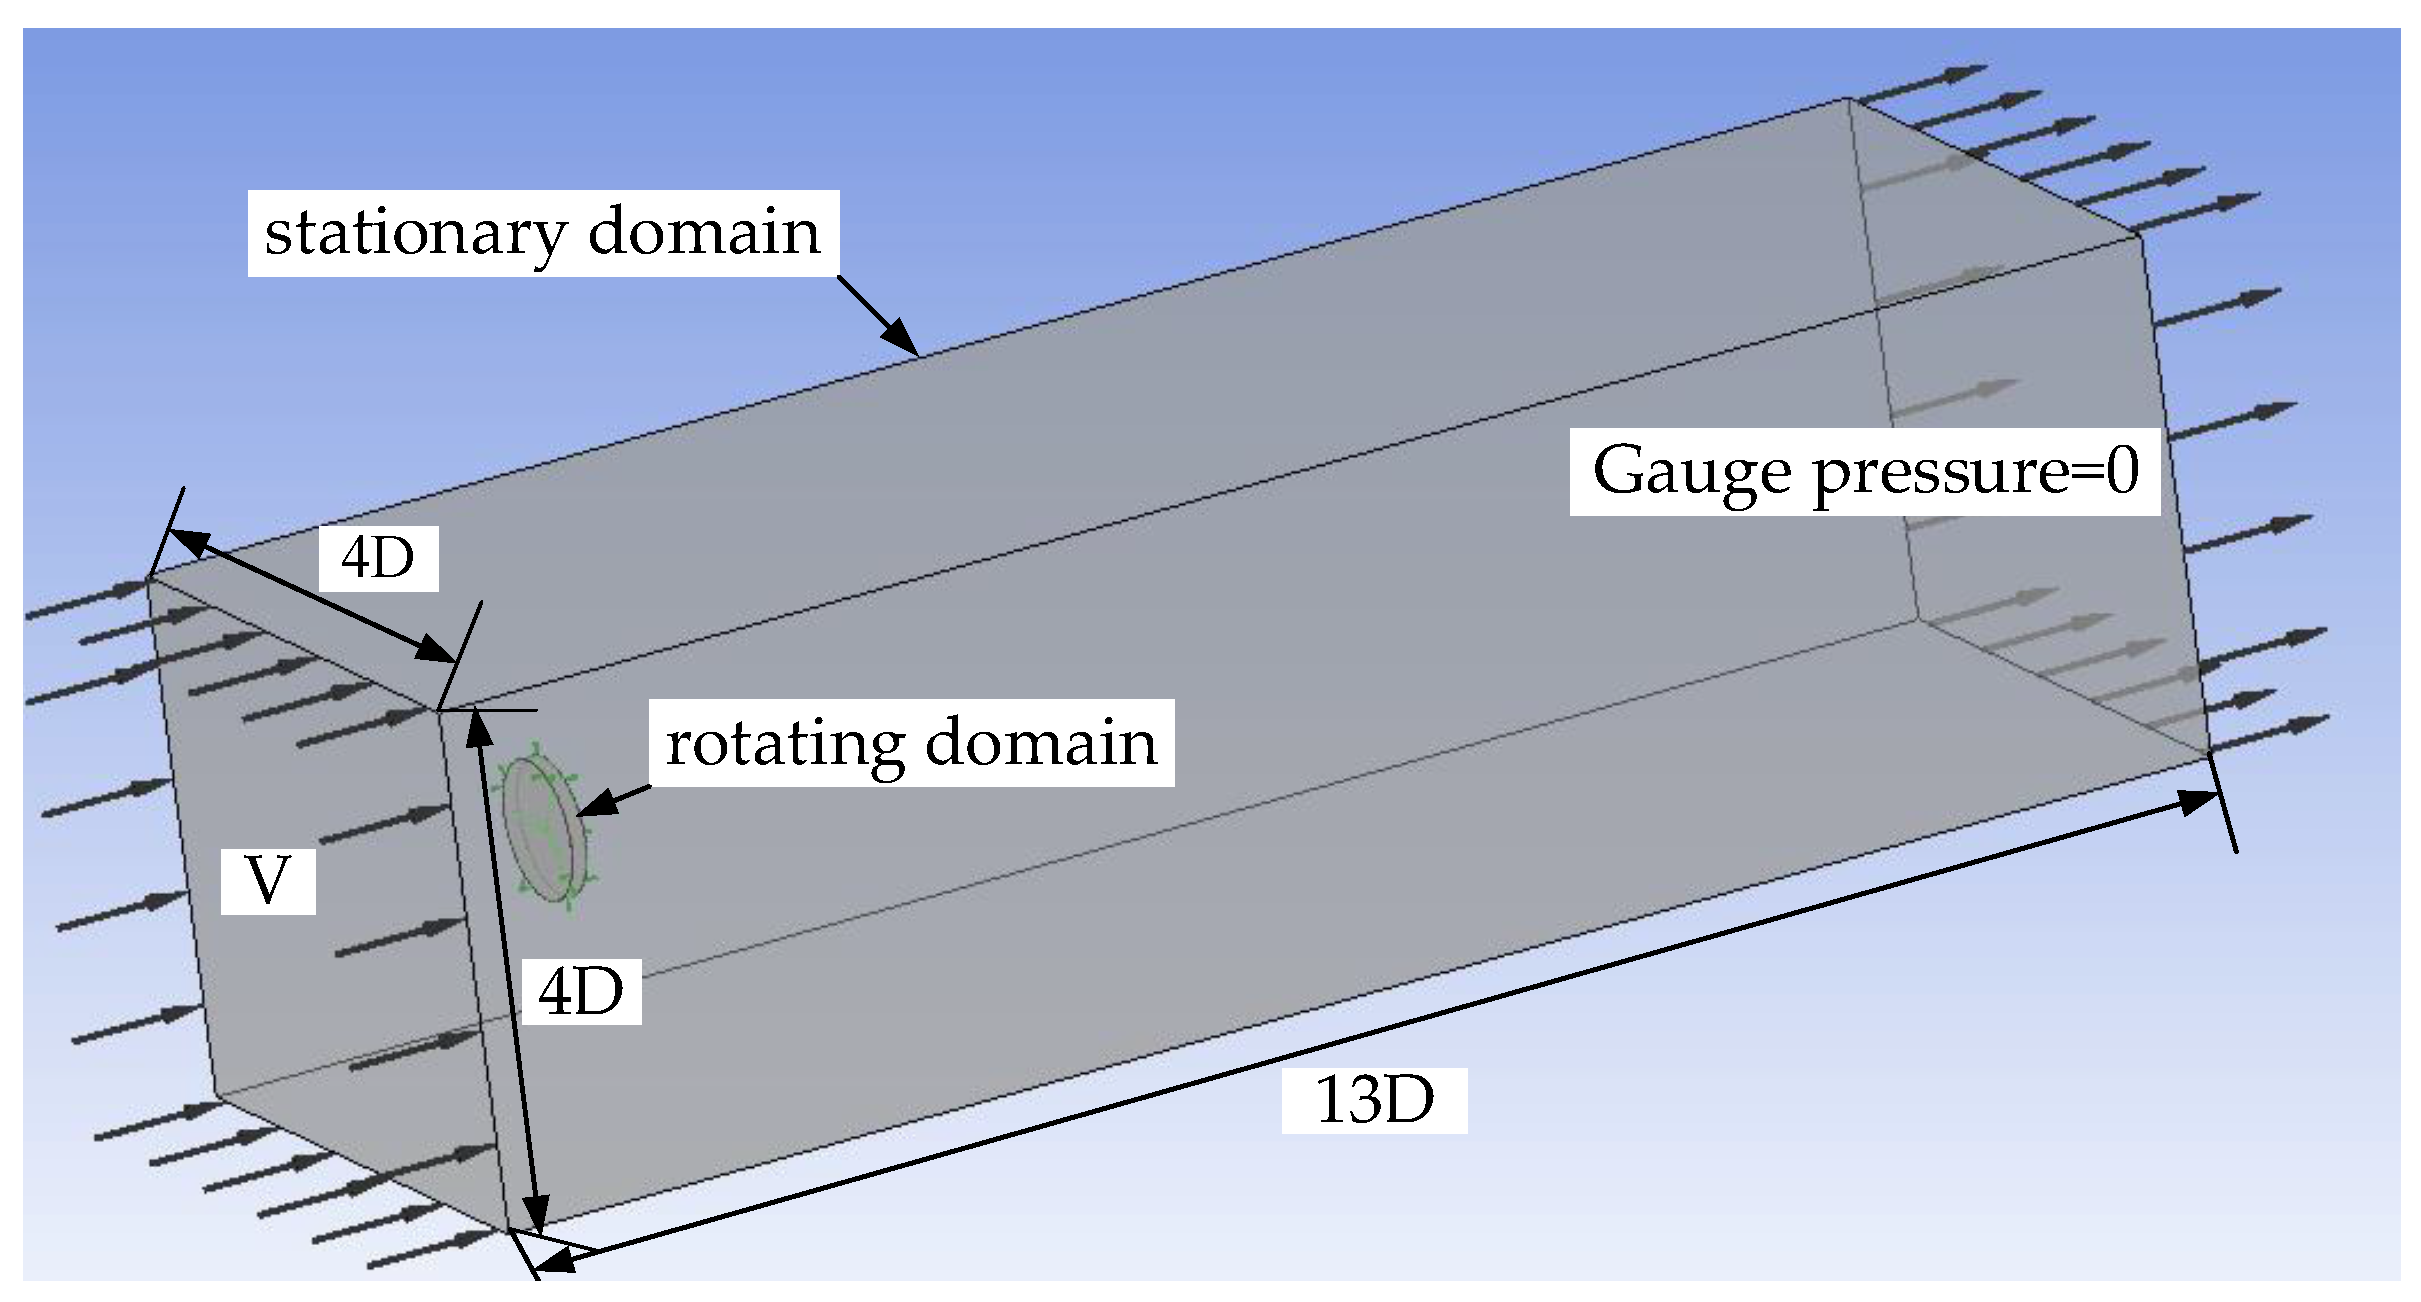
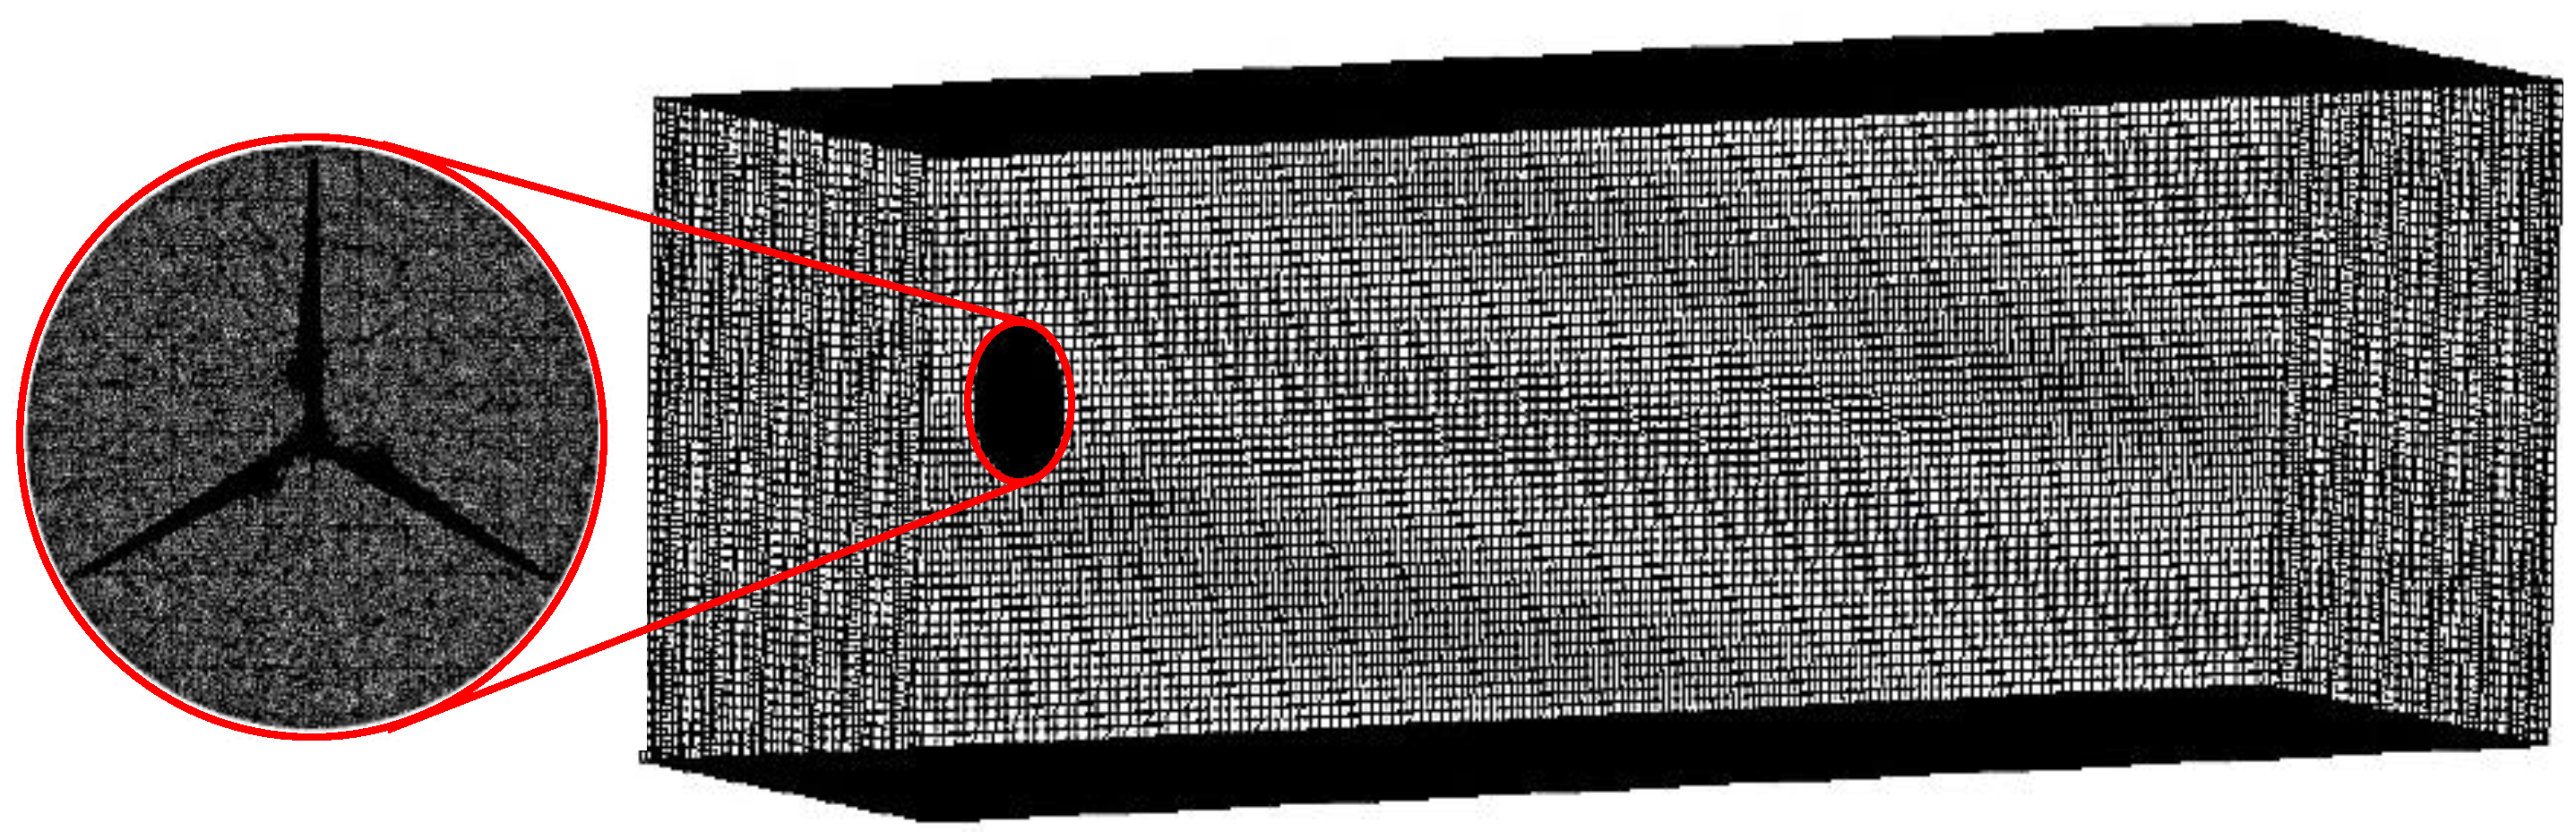
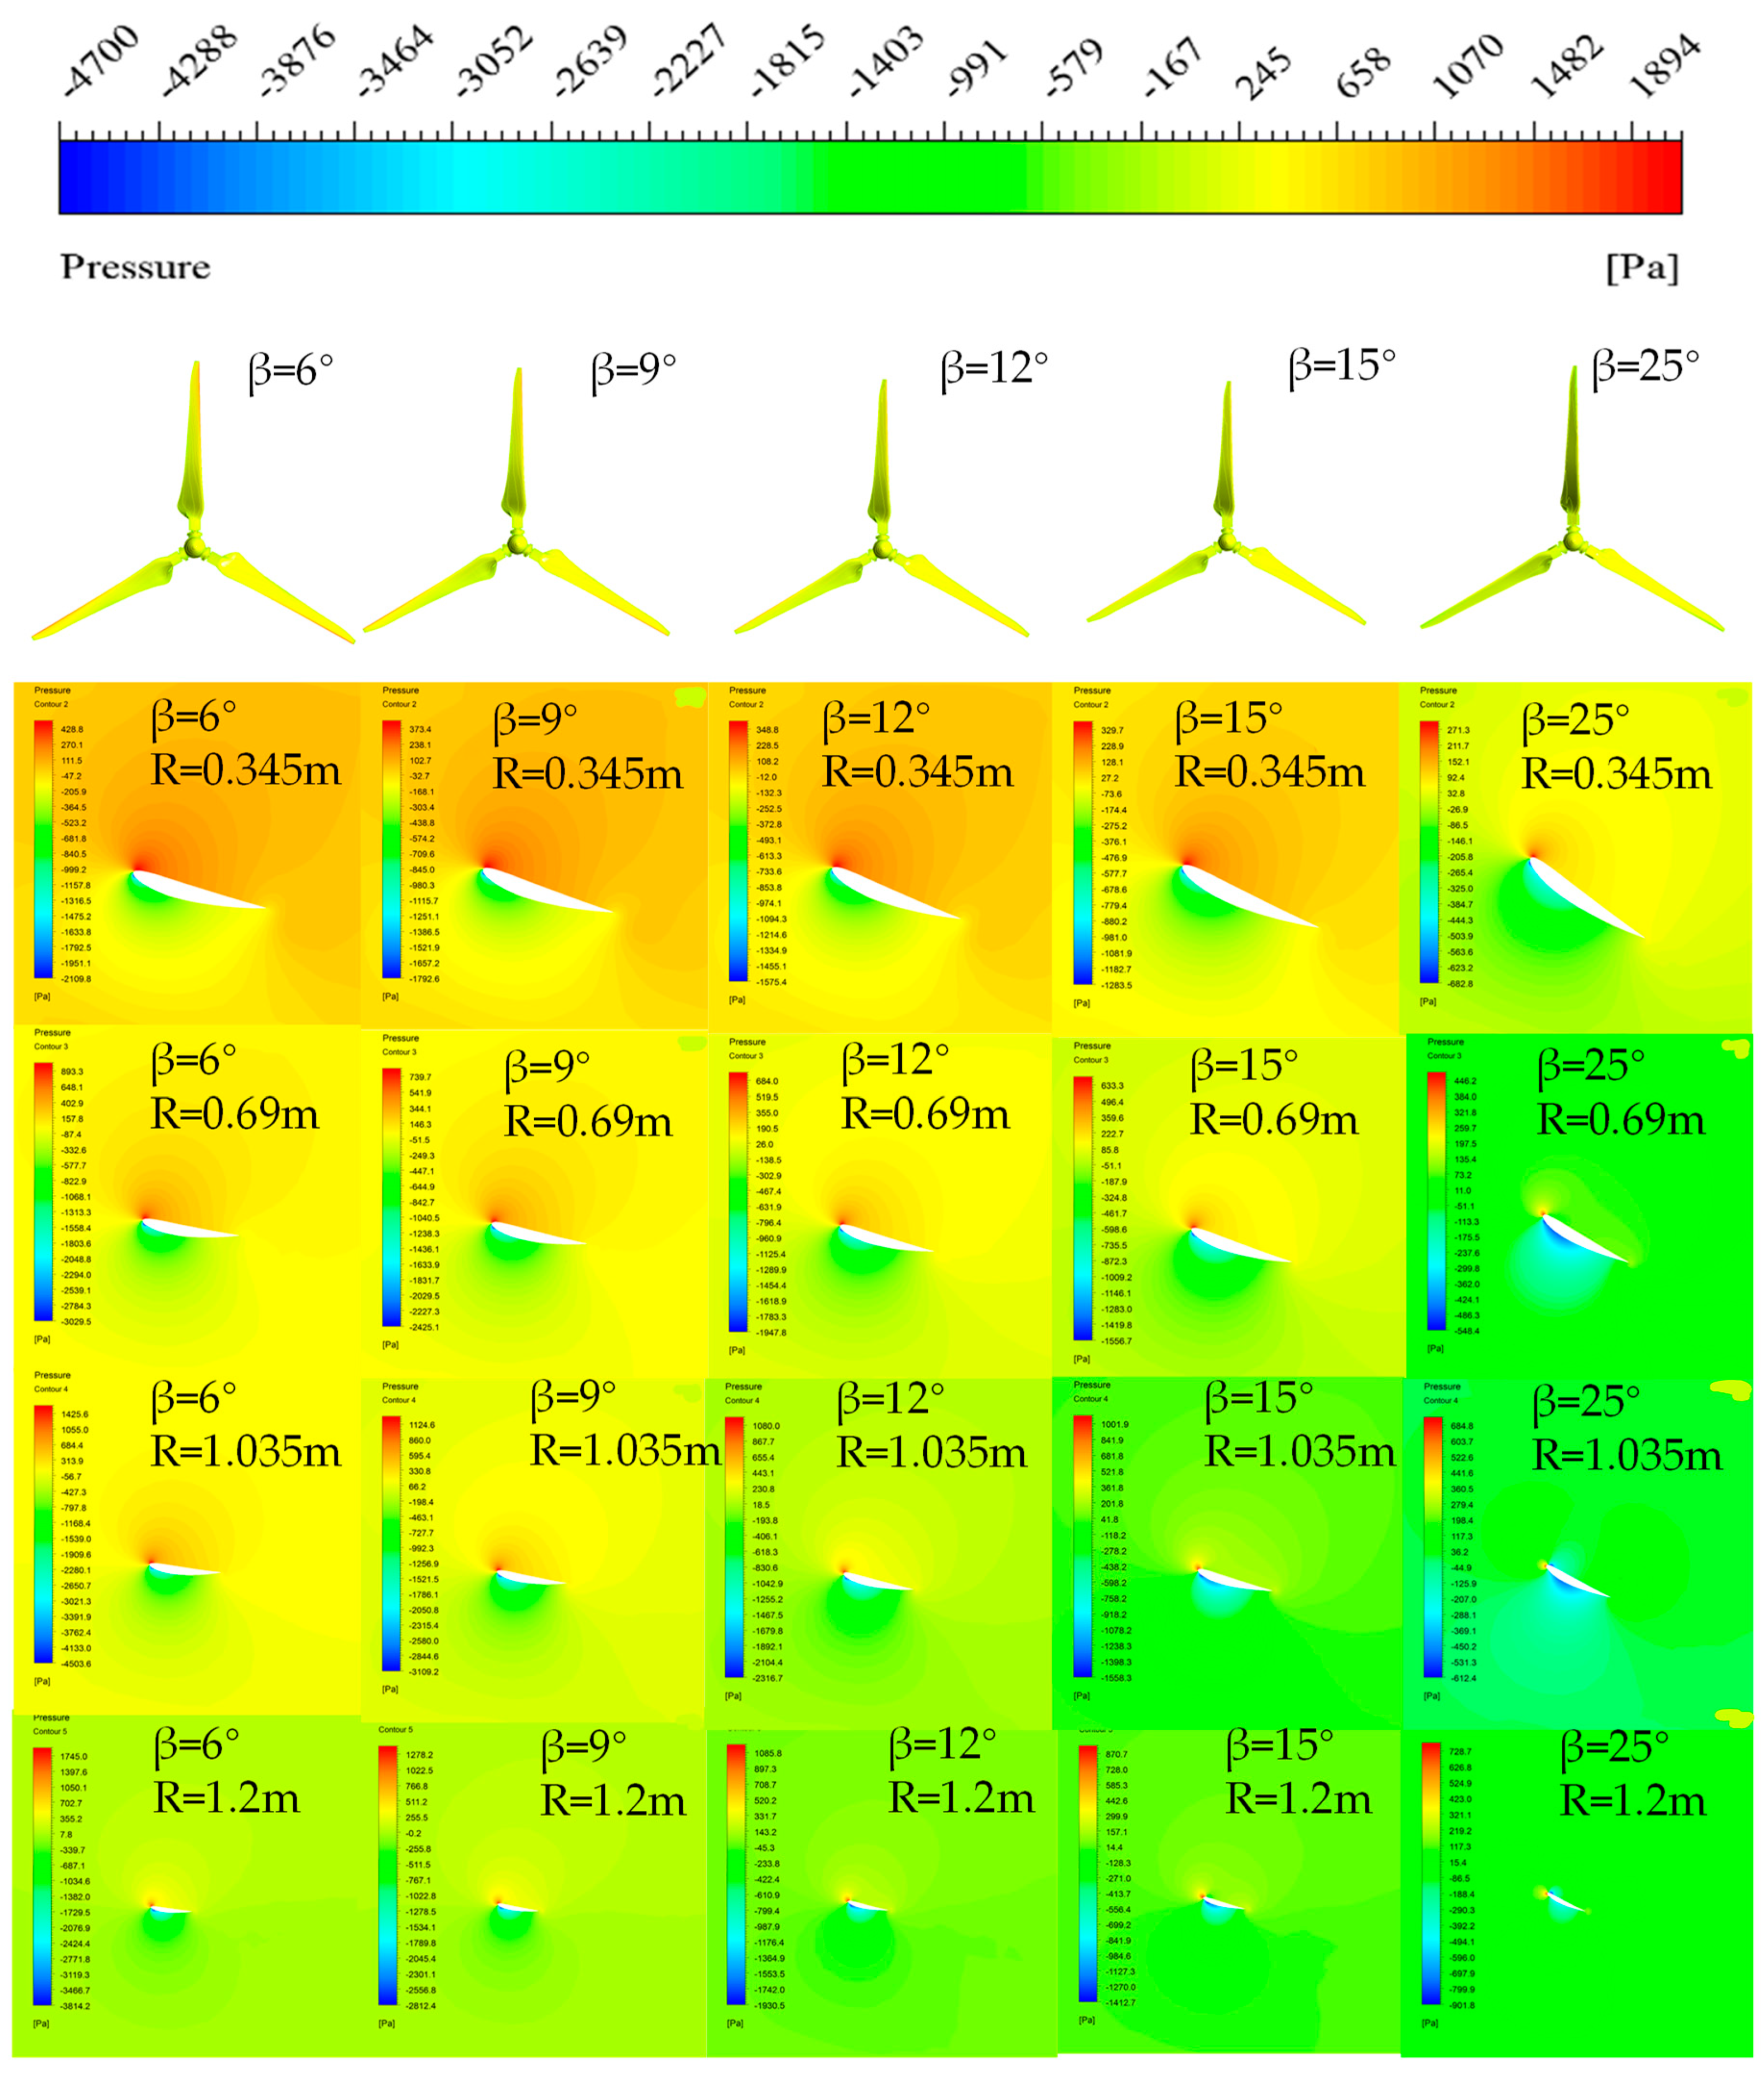
2.6.2. Boundary Condition Setting and Grid Validity Verification of Flow Field Analysis

Figure 10 shows the boundary condition setting of the computational domain. The stationary domain velocity inlet is set to a steady-state inlet flow and the turbulence intensity is set to 5%. The outlet is the pressure outlet, the relative pressure at the outlet is 0 Pa, and the wall surface is a no-slip wall surface. The rotating domain is established with the main axis of the wind turbine as the rotating center to simulate the rotating state of the wind turbine. The interface between the rotating domain and the stationary domain is set as Interface and the frozen rotor model is adopted to realize the data exchange between the two. The turbulence kinetic energy, turbulence dissipation term, and momentum equation are all discretized in a second-order windward format, and the solution method adopts the implicit solution method. The velocity–pressure coupling algorithm is the simple algorithm used. The turbulence model is the SST k-ω model for numerical calculation.
In the numerical simulation, grid resolution directly affects calculation accuracy and speed. Different grid generation methods and sizes are applied for the external stationary domain, internal rotating domain, and wind wheel surface, respectively. The results show that the grid resolution of the stationary domain and the rotating domain have little effect on the calculation results, and an appropriate grid size can be selected.
Figure 11 illustrates the grid generation process for the simulation. The stationary domain adopts a structured grid, and the rotating domain and wind wheel surface densification domain adopts an unstructured grid. As shown in Figure 12, by encrypting the grids in different regions, the wind turbine spindle torque under the same operating condition with different grid numbers is obtained, and the wind turbine spindle torque tends to be stable with the increase in grid number when the grid number reaches 8.74 million. After the grid number reaches 10.7 million, the torque only increases by 0.67%. In order to reduce the amount of calculation and ensure the accuracy of calculation, the 10.7 million grid model is selected [24].

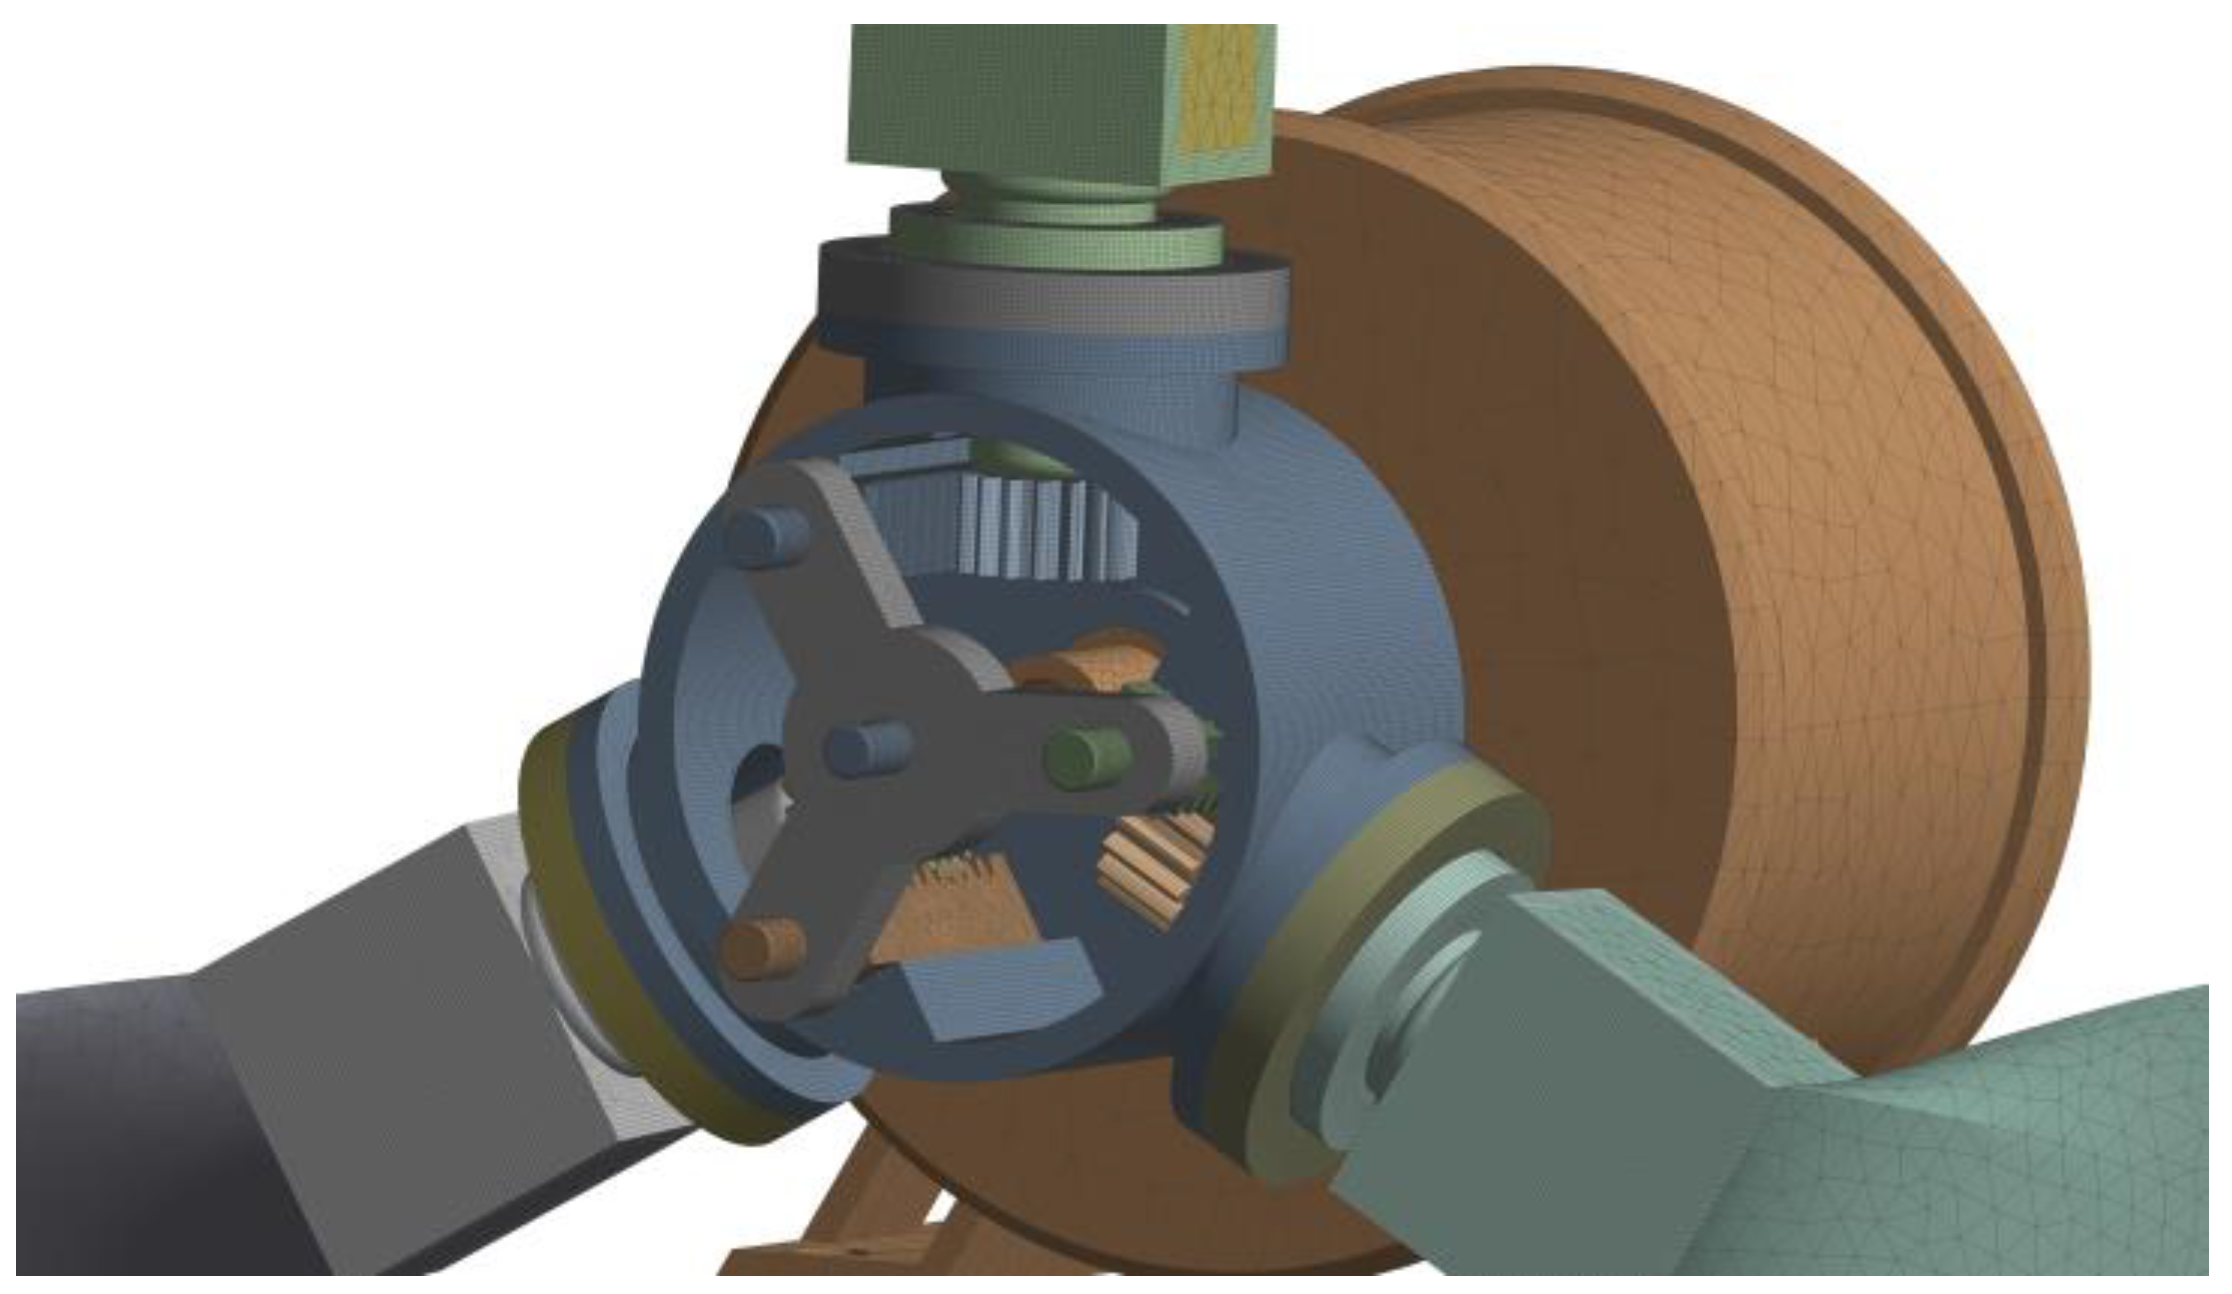
2.6.3. Meshing and Boundary Condition Setting for Structural Field Analysis

The model of the wind turbine’s structure was simplified by removing bolt holes, chamfers, etc., without affecting the overall structural load simulation conditions. To reduce the number of meshes and improve the meshing quality, hexahedral meshes were used for gears, hubs, synchronizers, and blade connectors, while tetrahedral meshes were used for blades, generators, push rods, and racks. The main load-bearing components such as gears, racks, hubs, etc., were locally refined. The meshing results of the structural field are shown in Figure 13.
Figure 14 shows a schematic diagram of load- and boundary condition settings for static analysis. The gravity load was applied to the entire wind turbine using “Standard Earth Gravity”, while the centrifugal force load was applied by defining “Rotational Velocity” around the main axis for the wind wheel. The aerodynamic load was applied on blade surfaces using “Imported Pressure”, with wind pressure obtained from CFX (version 18.2).
The boundary conditions between each component were set as follows: during the actual operation of the wind turbine, the generator was fixed to the bottom seat of the nacelle and set as a fixed boundary condition; the hollow shaft of the generator rotated with a wind wheel and was set as a cylindrical support along with the hub; the transmission rod moved along the axial direction of the hollow shaft of the generator and was set as a frictionless support; the gear–rack mechanism moved synchronously with the transmission rod, was installed inside the hub, and was set as a frictionless support; and the blade was connected to the hub by the pitch bearing and was set as the cylindrical support.
To ensure that the simulation results were as close as possible to the actual motion state, contact types of mating surfaces of each component in the adjustment mechanism were constrained as follows: the blade and blade connector, the blade connector and pitch bearing, the pitch bearing and hub, the blade connector and gear, and the rack and rack synchronizer were all subjected to bonded constraints; the hollow shaft of the generator and top rod were subjected to translational contact; and the gear and rack were subjected to bonded constraints.
The material parameters of each component were defined before the static analysis of the pitch adjustment mechanism. The blade was made of wood composite material, and components such as gears, racks, synchronizers, etc., were made of carbon steel SAE 1045. Table 1 shows the material properties of the components.
The rated wind speed of the new variable pitch wind turbine was 12 m/s, but to verify the stress state of the variable pitch mechanism under overrated conditions, the inflow wind speed for the flow field simulation was set to 16 m/s. The actual rotational speed of the wind turbine at a wind speed of 16 m/s was applied for static analysis. This paper referred to the rotational speed test results of a 1.5 kW wind turbine, as shown in Table 2.

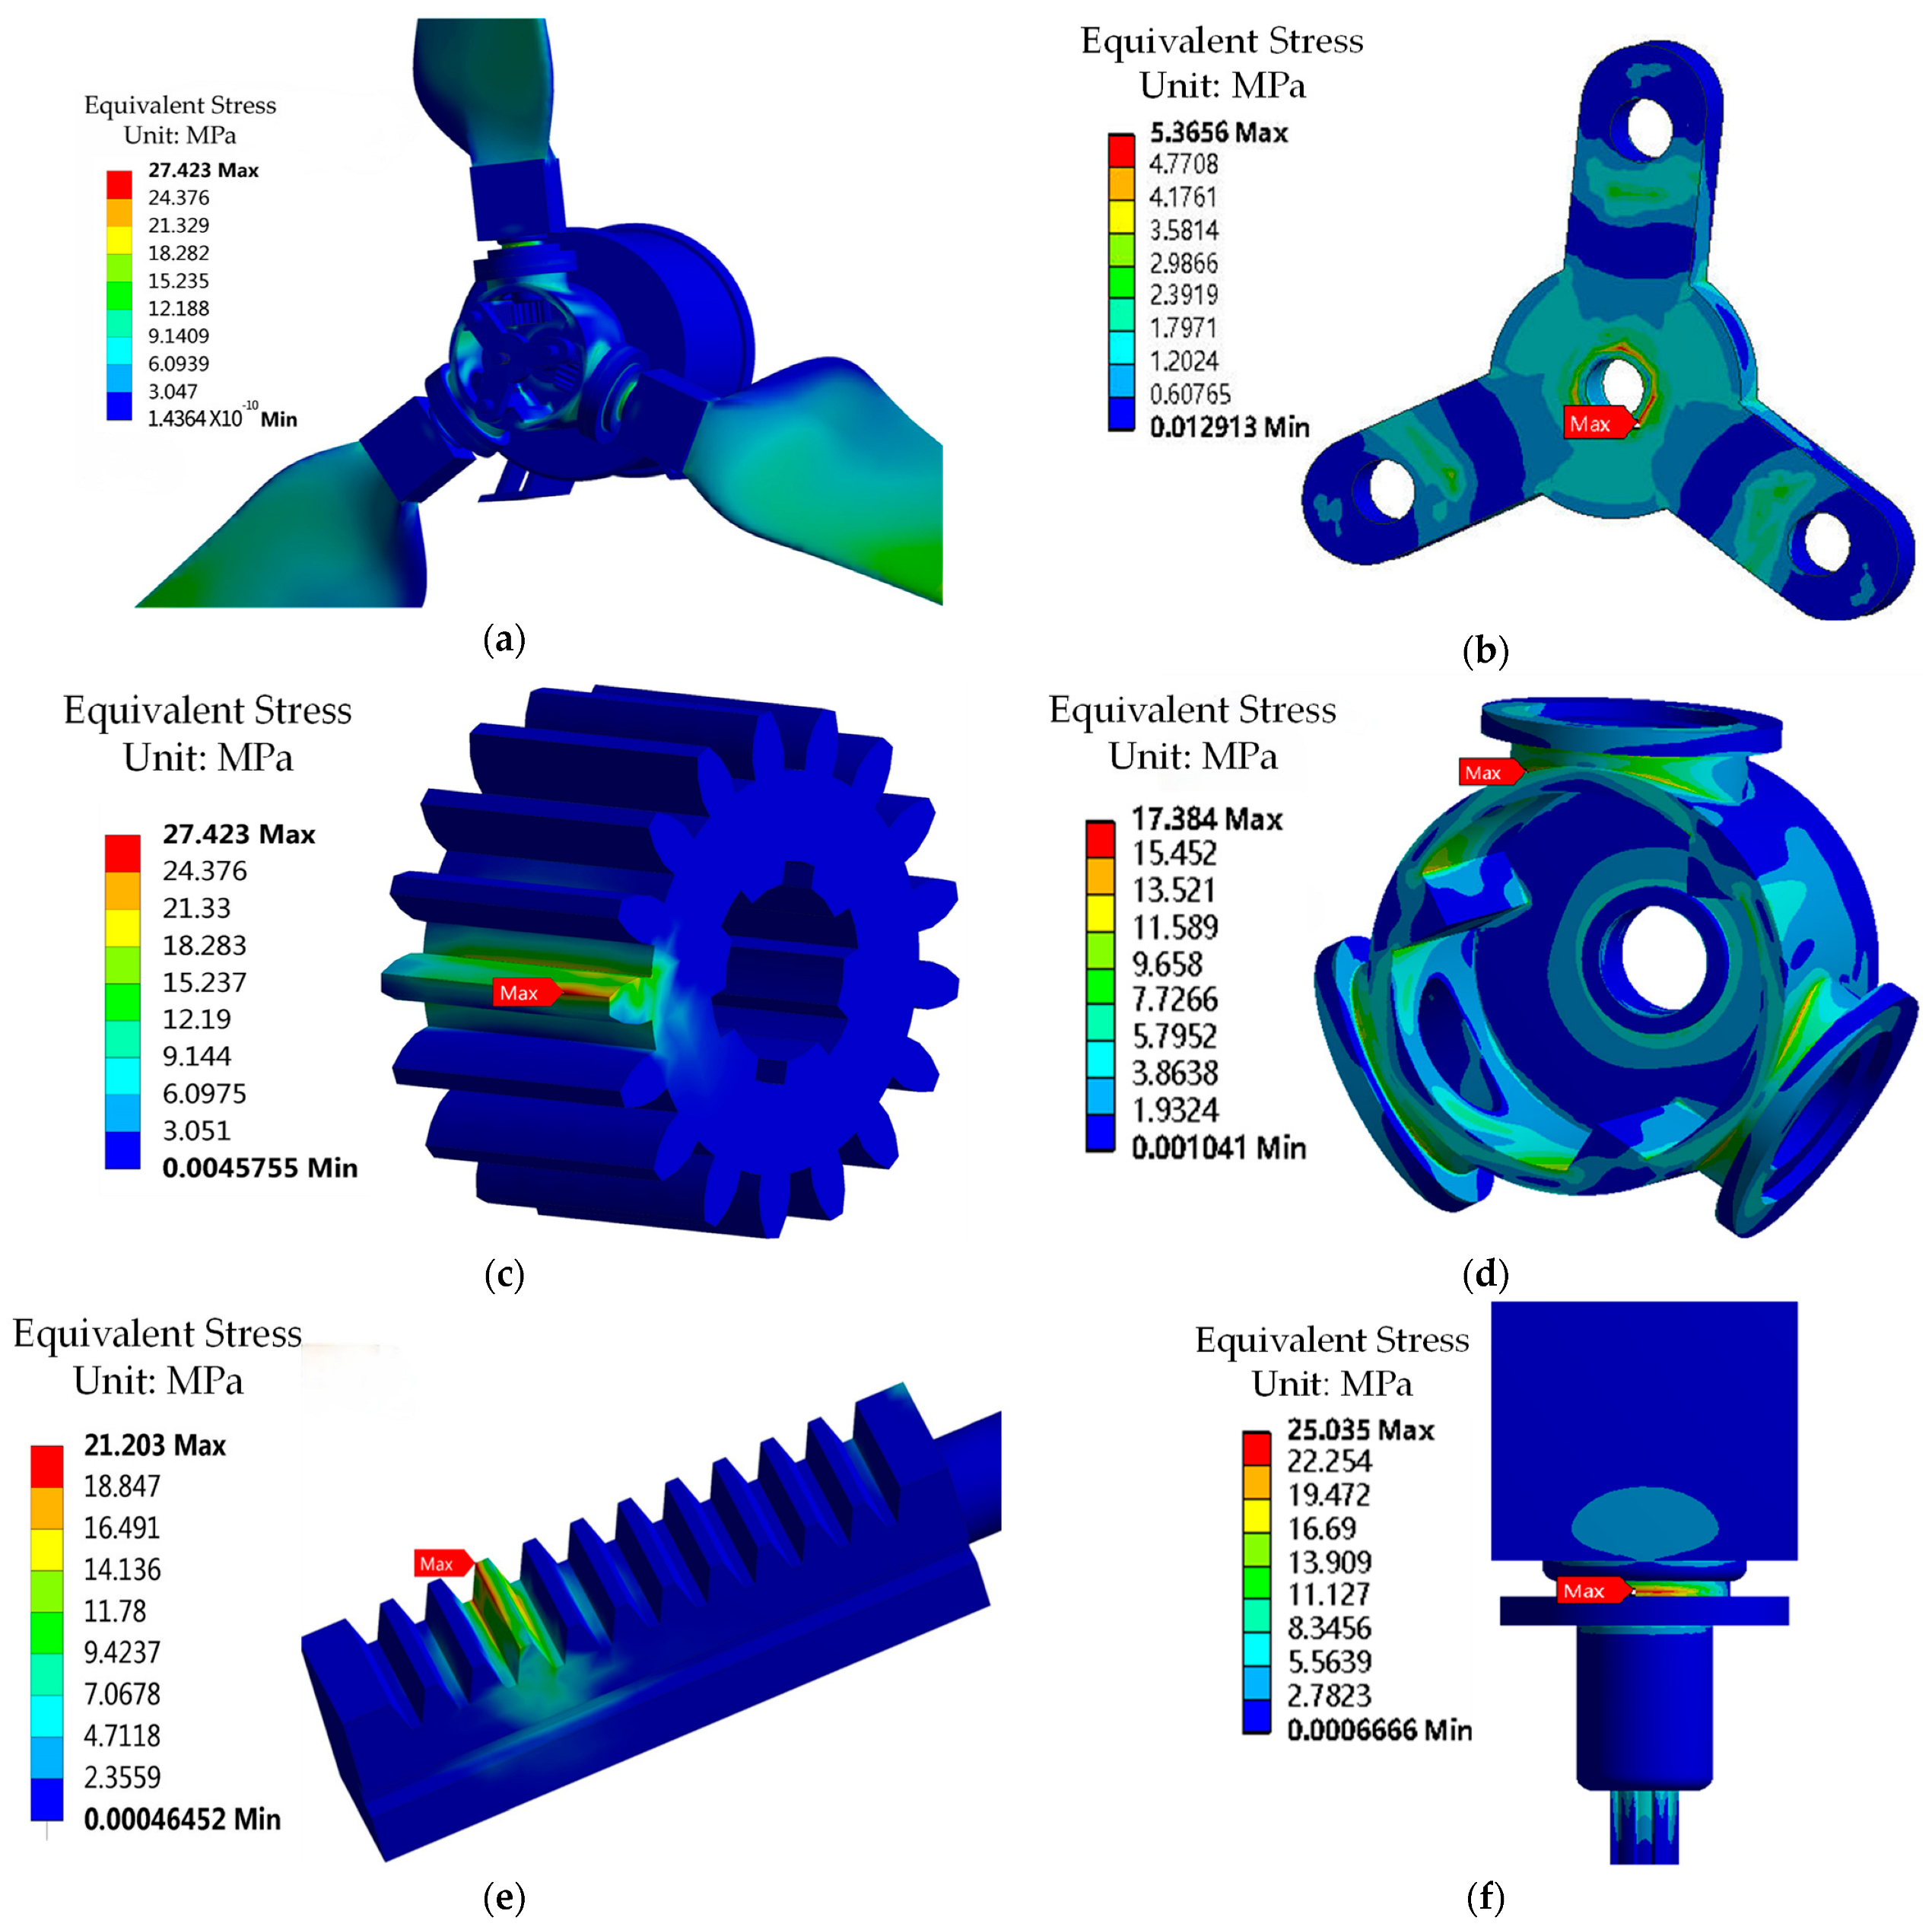
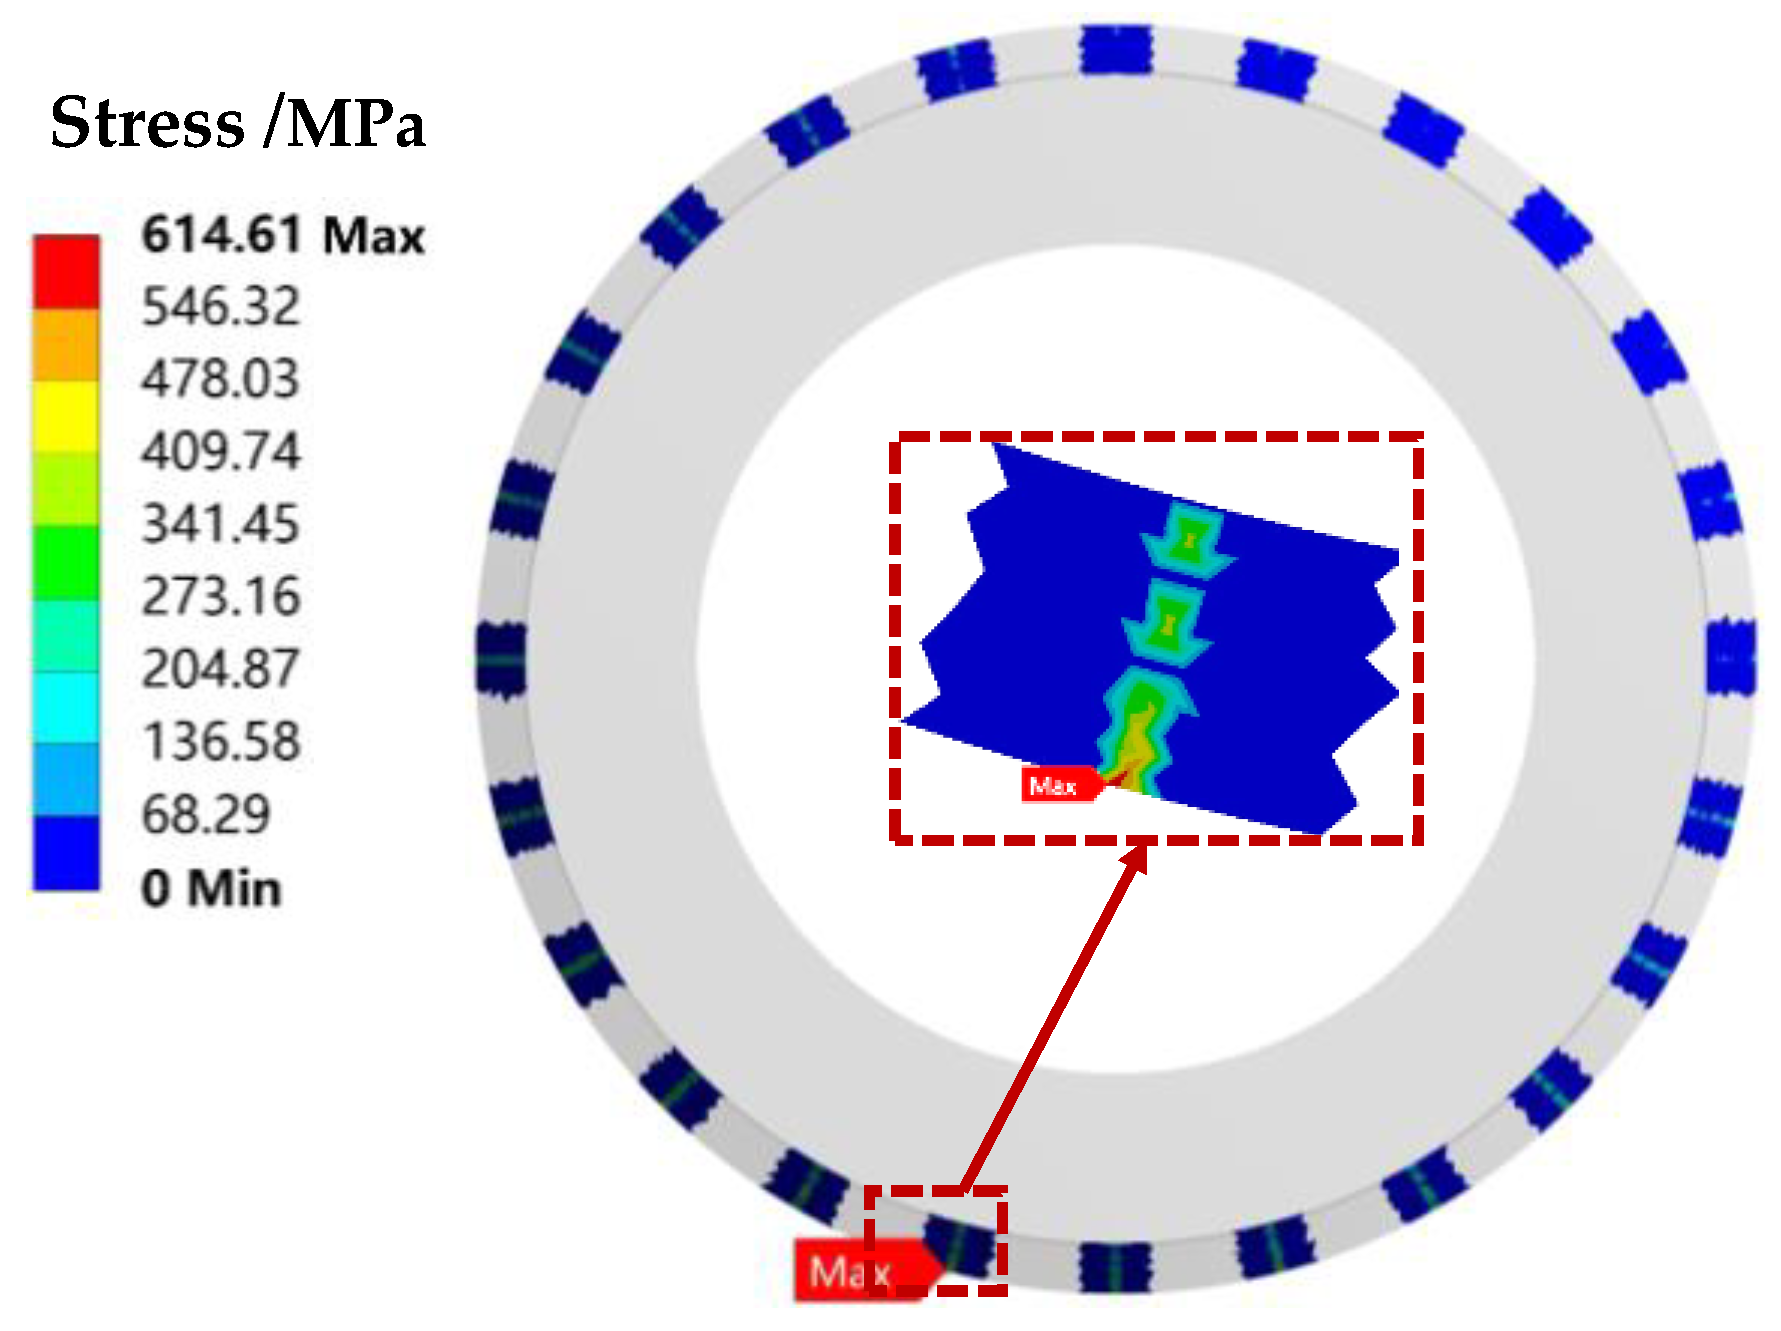
2.6.4. Results Analysis

The aerodynamic torque resulting from the rotation of the wind turbine wind wheel is closely related to the blade surface pressure, and analyzing the pressure distribution of the airfoil at different pitch angles and different blade vein cross-sections is essential for understanding the aerodynamic characteristics of wind turbines.
The pressure clouds of different pitch angles of the blade and different cross-sections of the blade are shown in Figure 15 for 16 m/s wind speed.
From the figure, it can be seen that under different pitch angle conditions, the pressure distribution of wind turbine blade elements is the same, with positive pressure on the windward side and negative pressure on the leeward side, and the maximum pressure value appears in the windward side of the blade elements near the leading edge region, and the minimum pressure value appears in the leeward side of the blade elements near the leading edge region.
The stress distribution of the hub and pitch adjustment mechanism under different working conditions was obtained through static analysis and maximum stress was analyzed. Figure 16 shows how the maximum stress values of each component varied with pitch angle.
As shown in the figure, the maximum stress values of each component decreased with the increasing pitch angle. At the same pitch angle, the maximum stress of the gear was significantly higher than that of other components. With the increasing pitch angle, the maximum stress value of the gear decreased from 27.42 MPa to 7.64 MPa, a reduction of 72.1%; the maximum stress value of the rack decreased from 21.20 MPa to 5.75 MPa, a reduction of 72.9%; the maximum stress value of the hub decreased from 17.83 MPa to 5.75 MPa, a reduction of 72.8%; and the maximum stress value of the blade connector decreased from 25.04 MPa to 6.88 MPa, a reduction of 72.5%. With the increasing pitch angle, the maximum stress values of each component decreased almost uniformly.
In summary, this section performed strength verification for each component of the pitch adjustment mechanism, and the verification formula is shown in Equation (1):
σ max < σ 0 / n
In the equation, σmax is the maximum equivalent stress value of each component, (MPa); σ0 is the yield strength of the material, (MPa); and n is the safety factor. According to the IEC61400-2 small wind turbine design requirements, the safety factor was 1.25 when used for fatigue strength verification, and it was 1.1 when used for ultimate strength verification [25,26]. Based on the maximum equivalent stress values of each component under different working conditions, the strength verification results of each component are shown in Table 3. The stress cloud of each component for this condition is given in Figure 17.
As shown in the table, the maximum stresses of each component of the hub and pitch adjustment mechanism were much lower than the allowable yield strength of the material, and the safety of the components was verified.
In the pitch adjustment mechanism, the gear–rack mechanism and pitch bearing were different from other components. The gear–rack mechanism was the key transmission component of the pitch adjustment mechanism, mainly bearing the blade pitch torque load. Besides analyzing the maximum equivalent stress of the gear, the root bending stress and the tooth surface contact stress were also important indicators for judging gear strength. This section analyzes the root bending stress and the tooth surface contact stress at the pitch angle of 6°. The basic parameters of the gear–rack mechanism are shown in Table 4.
The allowable tooth surface contact stress is given in Equation (2) [27,28].
σ H = σ H lim Z N T Z W S H min
In the equation, σ H lim is the contact fatigue stress limit, taken as 580 MPa; Z N T is the contact life coefficient, taken as 1.3; Z W is the tooth surface work hardening coefficient, taken as 1.0; and S H min is the minimum safety factor for contact strength, taken as 1.3. The calculated σ H is 580 MPa.
The allowable tooth root bending stress is given by Equation (3).
σ F = σ F lim Y S T Y N T Y δ r e l T S F min
In the equation, σ F lim is the bending fatigue stress limit, taken as 230 MPa; Y S T is the stress correction factor, taken as 2.0; Y N T is the tooth surface work hardening coefficient, taken as 1.0; Y δ r e l T is the tooth surface work hardening coefficient, taken as 1.0; and S F min is the minimum safety factor for bending strength, taken as 1.6. The calculated σ F is 287.5 MPa.
The following points are made about the values of the parameters in the equation.
First, the value of Z N T should be based on gear experiments or empirical statistics derived from the S-N curve, which is related to the gear material, heat treatment, and the use of lubricants. Because the selected gear-endurance life-condition cycle number N C = 5 × 10 7 , and the stress cycle number N L = 1 × 10 7 [29,30]. Therefore, its value is taken as 1.3.
Second, in the case of Y N T , its value is related to the material, heat treatment, load smoothness and residual stress, so it should be taken according to the ISO 6636-3:2006 standard by the empirical statistics of the S-N curve, which takes the value of 1.0.
Third, for S H min and S F min , since the working environment of the gear is a situation with high reliability requirements, the safety factor should be larger. According to the reference value of the minimum safety factor required by the ISO 6636-3:2006 standard, and considering that tooth breakage failure has more serious consequences than pitting failure, S F min should be greater than S H min . Therefore, S H min was taken to be 1.3 and S F min taken to be 1.6.
Fourth, in the case of Y S T , according to the ISO 6636-5:2006 standard, when using the σ F lim value calculated, it is set to 2.0.
Fifth, for Y δ r e l T , according to the ISO 6636-3:2006 standard, when using the gear life factor Y N T determined directly by the S-N curve and the S-N curve test conditions are exactly the same, it should be selected as 1.0.
Sixth, for Z W , because the hardness of the standard gear is not treated as especially high, and there is no machine-hardening phenomenon here, it is set to 1.0.
Seventh, in the cases of σ H lim and σ F lim , according to the table of commonly used materials and mechanical properties of gears in the ISO 6636-3:2006 standard, σ H lim is set to 580 MPa, and σ F lim is set to 230 MPa.
Figure 18a shows a tooth surface contact stress contour map. As shown in the figure, the maximum contact stress on the tooth surface occurred on the tooth surface that first made contact with the rack and was distributed in a band along the tooth width direction. The maximum contact stress was 38.40 MPa.
Figure 18b shows an equivalent stress contour map of the root of the gear teeth. Since the bending stress of gear teeth was mainly affected by the tension caused by the torque on the gear in a tangential direction, the equivalent stress at the root of the tension side teeth was used as a basis for analyzing the tooth root bending stress. The maximum tooth root bending stress was 18.13 MPa. The contact strength and bending strength of the gear both met the requirements and had a large safety margin.
The strength performance of the pitch bearing affects the overall safety of the wind turbine, and a key indicator for verifying the bearing strength is the contact stress between the bearing roller and the raceway. In this section, the maximum contact stress of the bearing was analyzed using a static analysis method. The pitch bearing of the new variable pitch wind turbine used the cross-roller bearing, and the model was selected as XRU5515UUCCO/P5. The manufacturing material was bearing steel GCr15, and selected parameters are shown in Table 5.
The analysis showed that under the eccentric load, the maximum contact stress of the inner ring raceway of the bearing was 614.61 MPa, as shown in Figure 19.
Based on the maximum contact stress of the bearing, the static load safety factor of the bearing could be calculated, and the calculation formula is shown in Equation (4).
f s = ( [ σ ] σ max ) 2
In the equation, f s is the static load safety factor and [σ] is the maximum allowable contact stress of the bearing.
According to the standard ISO 76:2006, the maximum allowable contact stress of the rolling bearings was about 4000 MPa and the calculated safety factor was about 42 [31,32]. For the static load safety factor of pitch bearings, the GL2010 wind turbine certification specification stipulated that it should be greater than 1.1, which showed that this type of pitch bearing fully met strength requirements.

3. Optimization of Components

The initial design of the pitch adjustment mechanism needed to be optimized several times before it could be practically applied. According to the structural design and static analysis results, it could be concluded that the strength safety margin of each component in the pitch adjustment mechanism was too large, and the shape, size, and gear parameters of each component needed to be further optimized to reduce material use and improve performance.

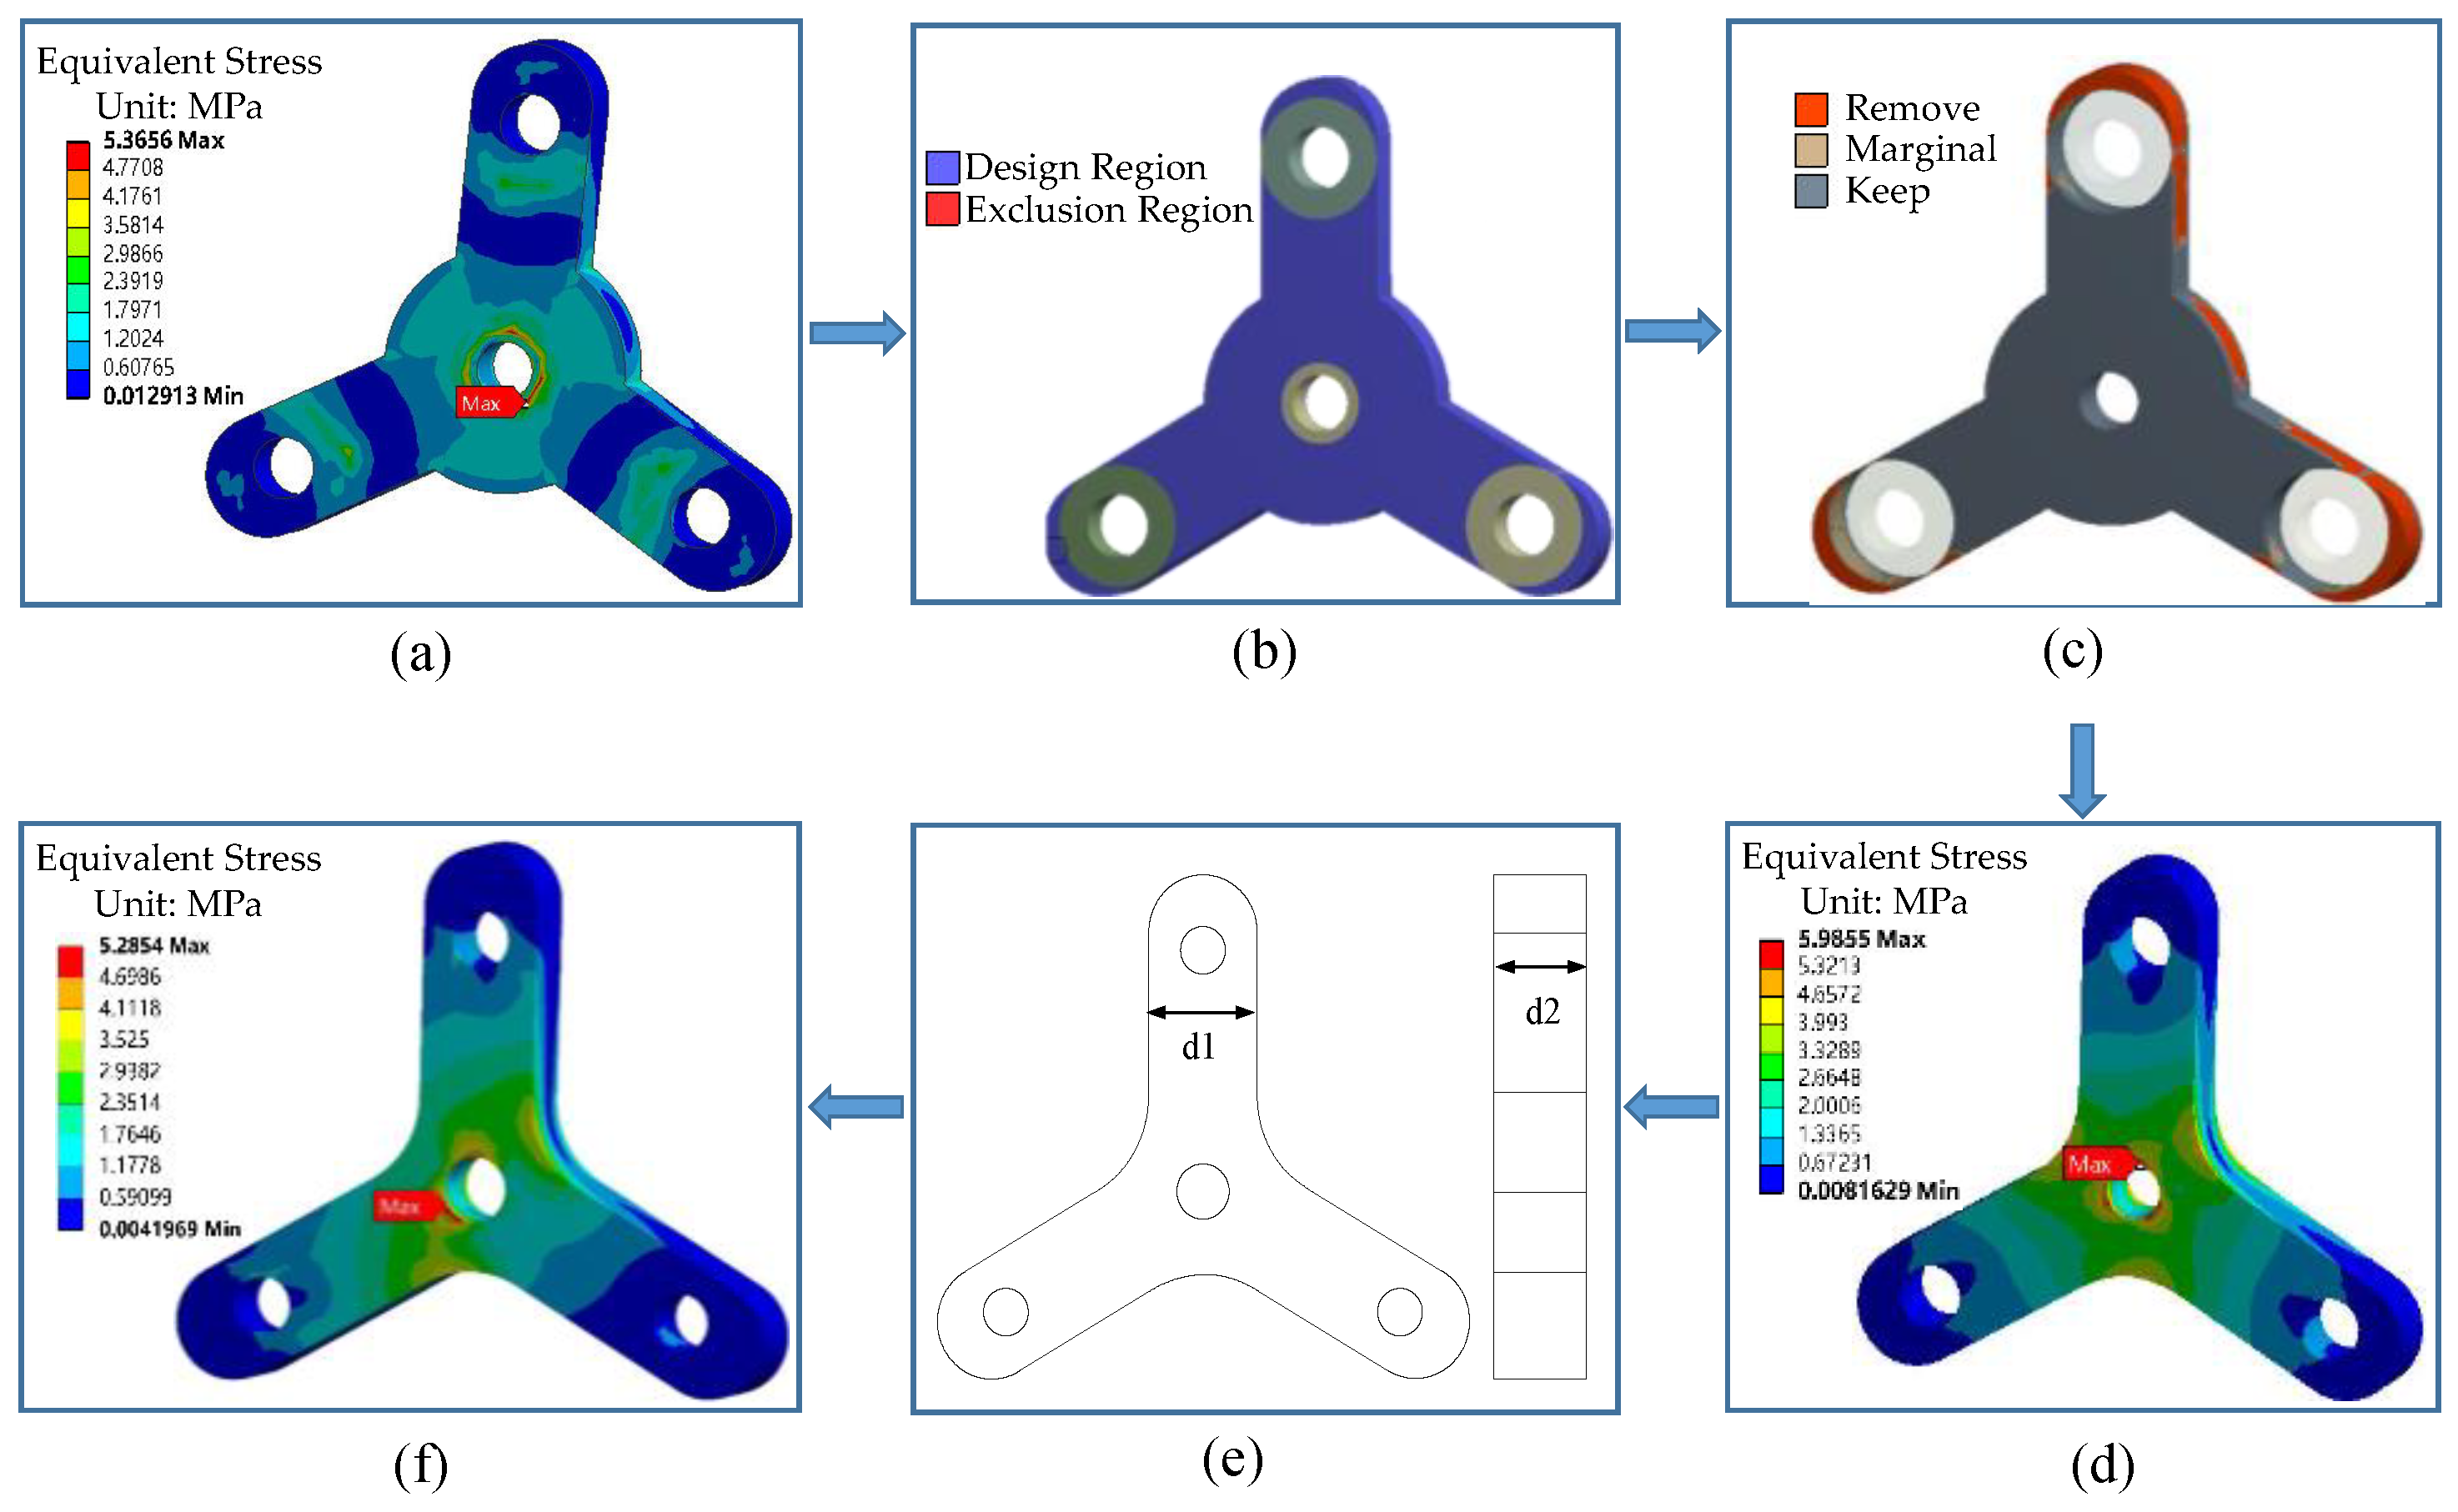
3.1. Optimization Design of the Rack Synchronizer

In this section, a multi-level optimization method was used to perform structural optimization design on the rack synchronizer. The goal was to reduce the mass of the rack synchronizer as much as possible while having little impact on its strength. The optimization process is shown in Figure 20.
Firstly, a static analysis was performed on the initial model of the rack synchronizer. Topology optimization was performed on it using the variable density method, and the material removal area and non-material removal area were divided (Figure 20a,b) [33,34].
Secondly, the material removal rate set by topology optimization was 20%. According to the topology optimization results, the material removal part mainly concentrated on the outer edge of the bolt hole matching with the rack, followed by the outer edge of the end face matching with the transmission rod (Figure 20b,c).
Thirdly, shape optimization was performed on the rack synchronizer and a stress analysis was performed again on an optimized rack synchronizer. The optimized rack synchronizer mass was 0.95 kg and the initial mass was 1.10 kg; this is a decrease of 13.6% compared with before optimization. The maximum stress was 5.89 MPa; this is an increase of 9.8% compared with before optimization. Although the maximum stress value increased after optimization, its value was still much lower than the strength requirement, which had a certain significance (Figure 20c,d).
Fourthly, based on shape optimization, size optimization was performed on a rack synchronizer based on the response surface method. The maximum stress value and mass of the component were optimization objectives. The optimized design parameter d1 was the width of the bolt hole and its outer edge part; the initial size was 30 mm; and the optimization range was set to 25 mm–35 mm. The thickness of the rack synchronizer was d2; the initial size was 20 mm; and the optimization range was set to 15 mm–20 mm (Figure 20d,e).
Fifthly, in the Workbench 18.2 platform’s DesignXplore module, the OSF method was used to generate test points; the number of test points was set to 30. The response surface was generated based on the Kriging model, and the MOGA algorithm was used for multi-objective optimization (Figure 20e,f) [35,36]. Optimization results are shown in Table 6.

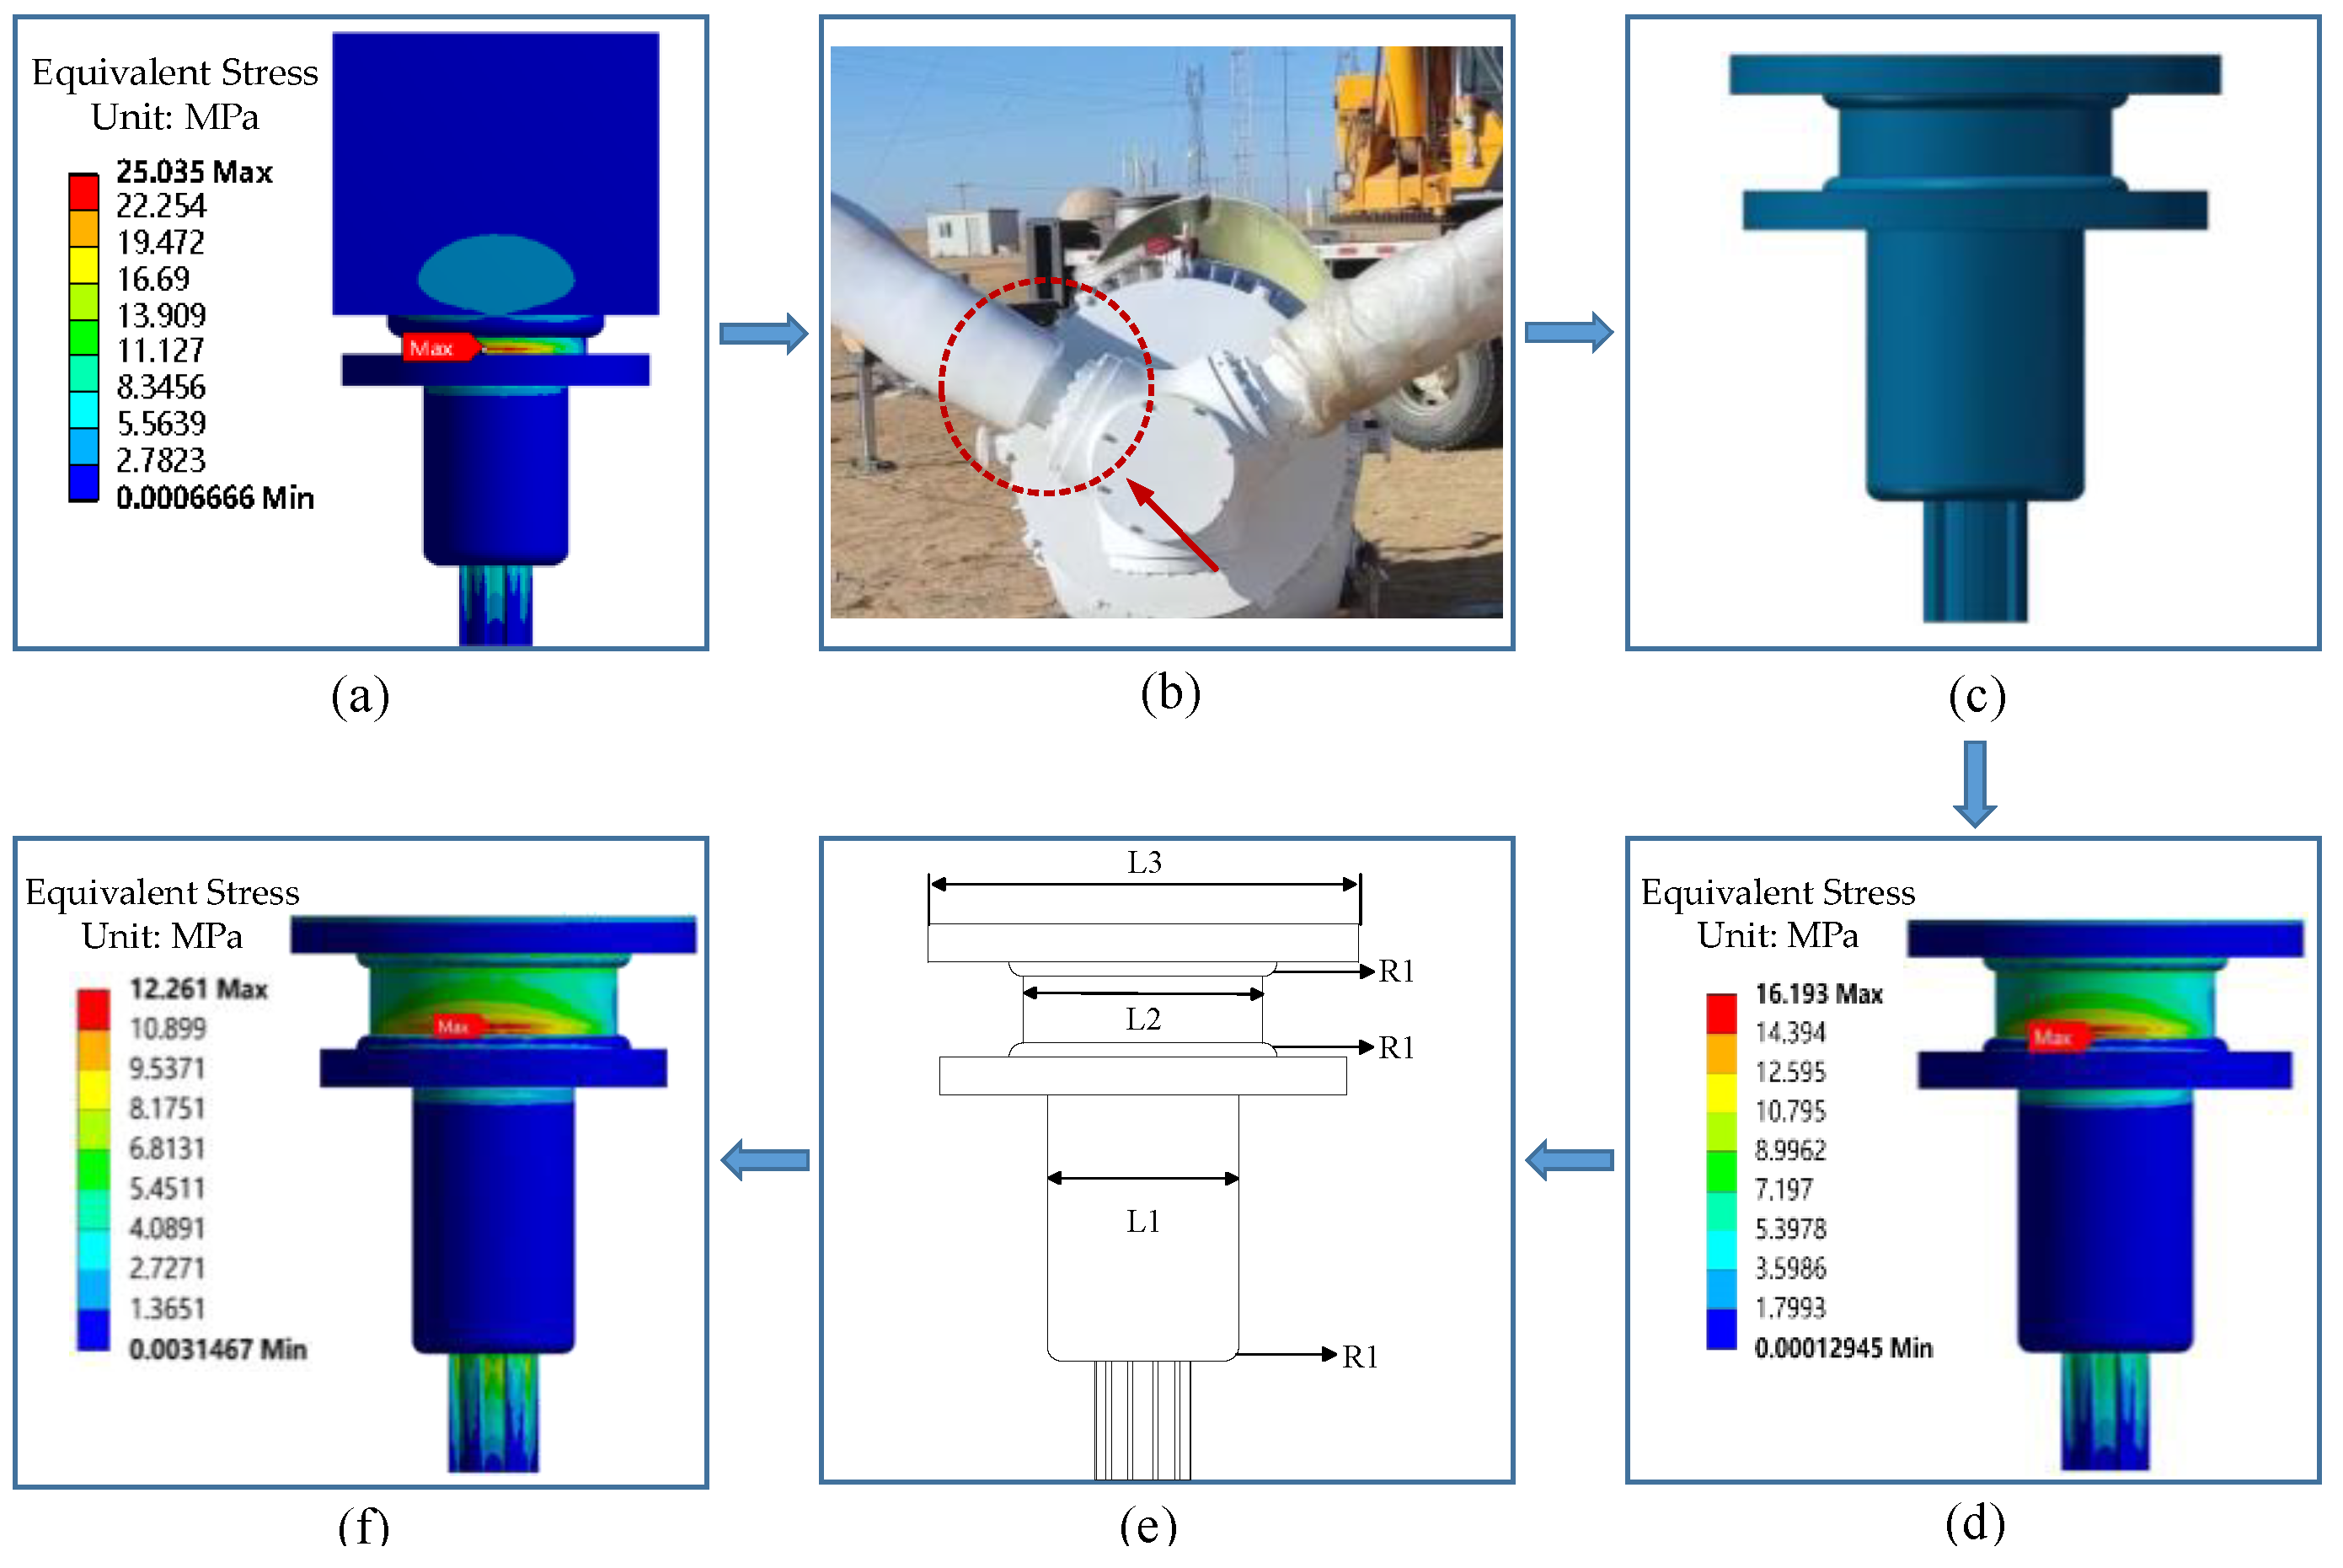
3.2. Optimization Design of the Blade Handle

The blade handle was a key component connecting the blade and the hub. If the mass of the blade handle was too large, it would not only increase the centrifugal force load of the hub but also increase the inertia of the wind wheel, affecting the start-up performance of the wind turbine at a low wind speed.
The optimization process of the blade handle is shown in Figure 21 and the main optimization process was similar to that of the rack synchronizer.
Firstly, in the initial stage of component design, the blade root was designed as a double-clamp structure, but most of the current mainstream commercialized small wind turbines had adopted a circular blade handle (such as seen in Figure 21b for a 50 kW active pitch wind turbine produced by a certain company) (Figure 21a,b).
Secondly, designing a blade handle with a circular structure compared with the double-clamp-type blade handle could not only reduce the component mass but also reduce the stall situation at the root of the blade (Figure 21b,c).
Thirdly, stress analysis was performed on a redesigned component, and it was found that compared with the double-clamp mechanism, the maximum stress value of the circular blade handle decreased by 35.5%. The component mass decreased to 2.15 kg compared with 3.7 kg for the original component mass; this is a decrease of 42%. The comprehensive performance of the blade handle was optimized (Figure 21c,d).
Fourthly, consistent rack synchronizer size optimization was performed on the blade root. The blade root diameters of the L1, the first connection section diameter (i.e., the connection section from the pitch bearing to the blade root) L2, the second connection section diameter (i.e., the connection section from the pitch bearing to the gear) L3, and the fillet radius L4 were selected as design variables (Figure 21d,e).
Fifthly, consistent with the rack synchronizer method (Figure 21e,f), the number of optimization test points was set to 65. Optimization results are shown in Table 7.

3.3. Optimization Design of the Gear Rack Mechanism

In gear rack components, the rack needs to be used with the gear, so the optimization of gear rack components should be based on the gear being the main object for optimization. The gear parameters are shown in Table 4, and the original mass of the gear rack mechanism is 0.7 kg. The parameters that affect the mass and strength of the gear are mainly the modulus M, the number of teeth Z, and the tooth width H, while the tooth height coefficient ha* and the top clearance coefficient C* have almost no effect on the mass, so they are not used as design variables. The difference from the optimization processes previously described is that the modulus and number of teeth of the gear are discrete variables. Parameter optimization based on the response surface obviously cannot obtain discrete candidate solutions. Therefore, this paper proposes a gear rack component optimization design scheme based on the finite element method combined with the entropy weight–TOPSIS method. The optimization process is shown in Figure 22.
The basic idea of applying the entropy weight–TOPSIS method to optimize decision making is to obtain the objective weight coefficient of each optimization objective based on the entropy weight method, and then rank and select the best design scheme using the TOPSIS method. Among them, the entropy weight method is used to judge the degree of dispersion of an objective function in all design schemes based on the definition of entropy. The greater the degree of dispersion, the greater the weight of this indicator in optimization design. The weights of each optimization objective can be obtained by entropy analysis, which can avoid the influence caused by subjective assignment.
The design of gears should refer to relevant gear design standards, and the key parameters of gears: the modulus and number of teeth should be optimized according to standard ISO 54:1996 [37]. By referring to the recommended table of the preferred modulus for spur gears in standard ISO 54:1996, and considering that the number of teeth is a positive integer and the minimum number of teeth without root cutting is 17, it is determined that the design parameters should be discretized and taken in intervals as shown in Table 8.
Three groups of design variables are arranged and combined to obtain 144 experimental sample points, that is, 144 design schemes of gear rack components. The response values of each sample point are calculated by Workbench one by one, as shown in Table A1 in Appendix A.
From Table 8, it can be seen that there are 144 design solutions, each corresponding to three optimization objectives, and the original data decision matrix can be built according to Equation (5) [38,39,40].
A = ( a i j ) m × n
The entropy–TOPSIS method first requires the decision matrix to meet the standardization conditions, which can be divided into positive and negative objectives, where the positive objective means that the larger the objective the better, while the negative objective is the opposite. As the mass, tooth contact stresses, and tooth root bending stresses are all negative targets, the normalization matrix can be obtained by Equation (6).
B = ( b i j ) m × n
First, calculate the degree of contribution of the decision matrix and the information entropy of the three optimization objectives. The weight coefficients of different optimization objectives are shown in Table 9.
After obtaining the weight coefficients of the optimization objectives by the entropy weight method, the standardized matrix is weighted to form a weighted matrix. Then, using the TOPSIS method, the relative closeness of each design scheme is calculated and arranged from large to small to obtain the priority order of each design scheme. The optimal scheme has the highest priority. Table A1 in Appendix A shows the relative closeness and ranking of all design schemes.
From Table 9, it can be seen that the maximum relative closeness is 0.880, and the optimal design scheme combination of gear parameters is modulus 2.25, the number of teeth is 21, and the tooth width 15 mm, corresponding to a mass of 0.46 kg, tooth surface contact stress of 18.99 MPa, and tooth root bending stress of 9.93 MPa in the optimization objectives.
Compared with the original design scheme, the mass of the optimal design scheme is reduced by 34.3%, the tooth surface contact stress is reduced by 50.5%, and the tooth root bending stress is reduced by 45.2%. The optimization objectives are all reduced, which shows that it is reasonable to use the entropy weight–TOPSIS method to optimize the gear design scheme, and the optimization effect is significant. Combined with the optimized design parameters of the gear, the modulus of the rack is redesigned as 2.25, and the thickness of the rack is redesigned as 15 mm, making the overall mass of the gear rack component lighter.

4. Conclusions

This paper presents a novel variable pitch adjustment device for small wind turbines. The main innovation is to adopt a self-developed unified variable pitch method to realize power control of small wind turbines.
The overall design structure of the new variable pitch adjustment device is introduced by establishing a three-dimensional model and explaining its basic working principle. A small-scale model is fabricated by a 3D printer to verify the feasibility of this design scheme.
The strength analysis of components such as variable pitch mechanisms, the hub, etc., under different pitch angles is carried out. The results indicate that the maximum stress value of each component increases with the decrease in the pitch angle. Among them, under the working condition of the 6° pitch angle and 16 m/s wind speed, the maximum stress value at the gear is 27.42 MPa, which is much smaller than the allowable stress of the material, and the safety factor of components is large.
The contact stress of the variable pitch bearing and the gear rack mechanism is analyzed. The results show that the tooth surface contact stress of the gear is greater than the tooth root bending stress. By calculating the gear’s allowable contact strength and allowable bending strength, it is concluded that the gear meets established strength requirements and has a large safety margin. Under an eccentric load, the bearing’s maximum contact stress occurs on the inner ring raceway, with a maximum stress value of 614.61 MPa. The calculated static load safety factor of the bearing is about 42, which verifies that the bearing meets strength requirements.
A multi-level optimization method is used to optimize the rack synchronizer for multiple objectives. The results show that by changing components’ shape and size parameters and removing some component materials, the component maximum stress value and mass can be reduced simultaneously. Changing the double-clamp blade root to a circular blade root and then optimizing the size can reduce the blade root’s maximum stress value and mass significantly. By using the entropy weight–TOPSIS method to optimize 144 gear design schemes, the optimal scheme shows that by appropriately reducing modulus and increasing the number of teeth, the gear tooth root bending stress and tooth surface contact stress can be effectively reduced. Table 10 shows the mass comparison before and after component optimization. It can be concluded that by optimizing three components to achieve a lightweight design, the variable pitch mechanism’s overall mass is reduced by 33.8%, improving the economic performance of a new variable pitch wind turbine.
It should be added, that although the finite element model was established using 3D modeling software for numerical simulation in this paper, the simulation calculations were only carried out through the one-way fluid–solid coupling method for the calculation and analysis of the steady state. Further multi-field source coupling simulation calculations can be carried out to thoroughly analyze the coupling effect between the loads. Secondly, the wind tunnel test was carried out to study selected pitch angle conditions by fixing the pitch angle, and the automatic control of the pitch angle can be realized through the PLC control program to further verify the control effect of the actual operation of the wind turbine.

Author Contributions

Conceptualization, P.W. and D.B.; methodology, P.W.; software, P.W.; validation, M.Z., Z.S. and D.B.; formal analysis, P.W.; investigation, F.H. and F.G.; writing—original draft preparation, P.W. and Z.S.; writing—review and editing, D.B. and M.Z.; funding acquisition, D.B. All authors have read and agreed to the published version of the manuscript.

Funding

This research was funded by the National Natural Science Foundation of China (grant No. 52266013), the Major Special Project of Scientific and Technological Cooperation in Ordos (grant No. 2021EEDSCXQDFZ009), and the Inner Mongolia Autonomous Region Focus on Research and Results Transformation Plan (grant No. 2022YFHH0048).

Data Availability Statement

Not applicable.

Conflicts of Interest

The authors declare no conflict of interest.

Appendix A

Table A1. Optimization target response value and relative closeness of different gear design schemes.
NumberModulus (M)Number of Teeth (Z)Width (H)/mmBending Stress/MPaContact Stress/MPaMass
/kg
Relative ClosenessRanking
11.25171543.2892.780.320.443139
21.25172034.3256.70.420.545128
31.25172538.9263.80.530.469133
41.25191555.3562.590.330.388142
51.25192050.0259.410.440.399140
61.25192550.0855.030.540.381144
71.25211532.6551.230.340.582122
81.25212025.9941.010.450.656105
91.25212521.0034.310.560.70888
101.25231531.7651.240.350.590118
111.25232025.9641.650.470.652107
121.25232522.0636.620.580.68896
131.25251551.6570.690.360.395141
141.25252041.5161.450.490.455136
151.25252535.4151.040.610.506132
161.25271559.0241.750.380.381143
171.25272040.4854.760.510.469134
181.25272530.3142.070.630.573124
191.5171536.0148.040.330.552127
201.5172033.6341.190.440.570125
211.5172528.6736.570.550.615114
221.5191542.3070.720.340.467135
231.5192032.1950.890.460.569126
241.5192519.8838.120.570.71386
251.5211536.3064.440.360.525131
261.5212033.5858.80.480.540129
271.5212528.6450.470.600.586120
281.5231527.5248.080.380.637111
291.5232041.6359.540.500.454137
301.5232519.2633.420.630.71683
311.5251517.7330.460.400.77851
321.5252019.2633.420.630.71683
331.525258.2915.580.660.83818
341.5271512.4121.010.420.8576
351.5272012.4121.010.420.8576
361.527257.9113.730.700.82723
371.75171532.8846.350.350.584121
381.75172032.3037.370.460.586119
391.75172528.5634.550.580.613115
401.75191529.9853.290.370.603116
411.75192021.4635.700.490.71387
421.75192513.0123.760.610.80435
431.75211532.5350.610.390.577123
441.75212029.9343.780.520.595117
451.75212524.6136.120.650.645108
461.75231522.8047.160.410.68897
471.75232016.7752.480.550.72282
481.75232511.7827.180.690.78747
491.75251520.5256.600.440.69294
501.75252016.7752.780.590.71485
511.75252513.6042.850.740.73079
521.75271513.7934.360.470.80733
531.75272011.2631.800.630.80039
541.7527259.9126.100.780.77456
552171534.7563.430.370.540130
562172047.6920.590.490.452138
572172523.8748.340.610.643109
582191515.930.840.390.80138
592192011.4823.460.530.84116
60219259.1118.100.660.82920
612211518.8448.560.420.72880
622212014.8742.990.560.76064
632212513.6439.960.710.74373
642231521.9958.090.460.671100
652232010.3628.760.610.81926
66223258.6220.580.760.79641
672251513.9240.360.490.78846
682252011.7642.140.650.77057
69225256.0219.740.820.78945
702271514.4844.590.530.76660
712272013.0923.220.700.77852
722272518.8448.560.880.637110
732.25171518.3146.540.390.74274
742.25172028.4134.130.520.626113
752.25172513.5040.180.650.75965
762.25191519.0930.940.420.75967
772.25192013.8825.430.570.80236
782.25192512.5022.40.710.78149
792.2521159.9318.990.460.8821
802.2521208.2714.870.620.85312
812.2521256.3511.630.770.81130
822.25231511.9122.90.500.84414
832.2523209.2019.10.670.82424
842.25232511.9737.900.840.72481
852.2525159.1625.040.550.85311
862.25252023.8721.000.730.656104
872.2525256.8616.430.910.75966
882.25271513.2021.860.590.81031
892.25272010.5617.860.790.77653
902.25272518.6615.200.990.653106
912.5171523.0249.620.420.68099
922.5172023.0043.270.560.670101
932.5172518.1338.40.700.70592
942.519159.8320.080.460.8812
952.519207.4516.060.610.8604
962.519255.9914.210.760.81428
972.5211512.2140.860.500.80237
982.5212010.838.200.670.78050
992.521258.7033.850.840.75271
1002.5231510.0721.570.550.85213
1012.523207.5319.840.740.80932
1022.523255.3321.370.920.75769
1032.5251512.0434.110.610.79443
1042.5252012.5236.630.810.73178
1052.5252511.2035.681.020.68298
1062.527156.9023.040.680.82922
1072.527206.2520.610.890.76462
1082.527255.6433.731.110.68995
1092.75171511.8136.960.450.82425
1102.75172013.0236.100.600.78448
1112.75172510.5633.620.750.76858
1122.75191512.4826.040.500.83219
1132.75192013.6627.220.670.77654
1142.75192512.0523.870.830.74672
1152.7521157.9027.400.560.85410
1162.75212013.7021.250.740.76363
1172.7521256.0118.300.930.75470
1182.7523156.8019.170.620.8569
1192.7523207.3433.970.820.76561
1202.7523256.8534.401.030.70590
1212.7525156.3524.350.680.82921
1222.7525207.8619.080.730.81229
1232.7525254.5119.581.140.69893
1242.7527158.6315.630.750.80434
1252.7527206.3912.501.000.73677
1262.7527255.1811.031.270.668102
1273171510.0116.380.480.8803
128317208.7313.220.640.84415
129317256.5111.450.810.79740
130319159.8521.050.540.8585
131319207.8417.310.720.81727
132319254.409.050.900.77555
133321158.814.060.600.8578
134321208.0910.470.810.79044
135321255.5514.751.000.73776
136323157.845.470.680.84017
137323206.3612.310.900.76759
138323255.079.881.130.70591
139325157.9124.190.760.79542
140325206.0311.151.000.73875
141325256.1519.431.260.661103
142327155.1437.950.850.75868
143327204.1718.781.120.70589
144327257.1317.711.400.626112

References

  1. Eras-Almeida, A.A.; Egido-Aguilera, M.A. Hybrid renewable mini-grids on non-interconnected small islands: Review of case studies. Renew. Sustain. Energy Rev. 2019, 116, 109417. [Google Scholar]
  2. Tummala, A.; Velamati, R.K.; Sinha, D.K.; Indraja, V.; Krishna, V.H. A review on small scale wind turbines. Renew. Sustain. Energy Rev. 2016, 56, 1351–1371. [Google Scholar]
  3. Chagas, C.C.M.; Pereira, M.G.; Rosa, L.P.; Da Silva, N.F.; Freitas, M.A.V.; Hunt, J.D. From Megawatts to Kilowatts: A Review of Small Wind Turbine Applications, Lessons from the US to Brazil. Sustainability 2020, 12, 2760. [Google Scholar] [CrossRef]
  4. Weir, T.; Kumar, M. Renewable energy can enhance resilience of small islands. Nat. Hazards 2020, 104, 2719–2725. [Google Scholar] [CrossRef]
  5. Ioannidis, A.; Chalvatzis, K.J.; Li, X.; Notton, G.; Stephanides, P. The case for islands’ energy vulnerability: Electricity supply diversity in 44 global islands. Renew. Energy 2019, 143, 440–452. [Google Scholar] [CrossRef]
  6. Orlando, N.A.; Liserre, M.; Mastromauro, R.A.; Dell’Aquila, A. A Survey of Control Issues in PMSG-Based Small Wind-Turbine Systems. IEEE Trans. Ind. Inform. 2013, 9, 1211–1221. [Google Scholar] [CrossRef]
  7. Battisti, L.; Ricci, M. MPPT with Current Control for a PMSG Small Wind Turbine in a Grid-Connected DC Microgrid. In Wind Energy Exploitation in Urban Environment; Battisti, L., Ricci, M., Eds.; Springer International Publishing AG: Cham, Switzerland, 2018; pp. 205–219. [Google Scholar]
  8. Calabrese, D.; Tricarico, G.; Brescia, E.; Cascella, G.L.; Monopoli, V.G.; Cupertino, F. Variable Structure Control of a Small Ducted Wind Turbine in the Whole Wind Speed Range Using a Luenberger Observer. Energies 2020, 13, 4647. [Google Scholar] [CrossRef]
  9. Çelik, E.; Kurt, E.; Öztürk, N. Wind turbine speed control of a contactless piezoelectric wind energy harvester. Int. J. Electron. 2020, 107, 226–238. [Google Scholar] [CrossRef]
  10. Mohammadi, E.; Fadaeinedjad, R.; Naji, H.R. Flicker emission, voltage fluctuations, and mechanical loads for small-scale stall- and yaw-controlled wind turbines. Energy Convers. Manag. 2018, 165, 567–577. [Google Scholar] [CrossRef]
  11. Meng, H.; Ma, Z.; Dou, B.; Zeng, P.; Lei, L. Investigation on the performance of a novel forward-folding rotor used in a downwind horizontal-axis turbine. Energy 2020, 190, 116384. [Google Scholar] [CrossRef]
  12. Akhter, M.Z.; Ali, A.R.; Jawahar, H.K.; Omar, F.K.; Elnajjar, E. Performance enhancement of small-scale wind turbine featuring morphing blades. Energy 2023, 278, 127772. [Google Scholar] [CrossRef]
  13. Cho, T.; Won, K.Y.; Jang, I.; Park, C.-w.; Kim, J. Experimental Study on the Aerodynamic Characteristics for the Side Furling Control System. J. Wind Energy 2017, 8, 39–44. [Google Scholar]
  14. Dong, Y.; Guo, J.; Zhang, X. Development and Performance Analysis of a Small Island Wind Turbine Generator System with High Reliability. J. Energy Eng. 2013, 139, 223–229. [Google Scholar] [CrossRef]
  15. Chirca, M.; Dranca, M.; Oprea, C.A.; Teodosescu, P.; Pacuraru, A.M.; Neamtu, C.; Breban, S. Electronically Controlled Actuators for a Micro Wind Turbine Furling Mechanism. Energies 2020, 13, 4207. [Google Scholar] [CrossRef]
  16. Chen, Y.; Shiah, Y. Experiments on the Performance of Small Horizontal Axis Wind Turbine with Passive Pitch Control by Disk Pulley. Energies 2016, 9, 353. [Google Scholar] [CrossRef]
  17. Staino, A.; Basu, B. Emerging trends in vibration control of wind turbines: A focus on a dual control strategy. Philos. Trans. R. Soc. A Math. Phys. Eng. Sci. 2015, 373, 20140069. [Google Scholar] [CrossRef]
  18. Sung, C.; Han, M. Design and performance evaluation of hinge type pitch control system in small-size wind turbine. Int. J. Precis. Eng. Manuf.-Green Technol. 2016, 3, 335–341. [Google Scholar] [CrossRef]
  19. Porto, H.A.; Fortulan, C.A.; Porto, A.J.V. Power performance of starting-improved and multi-bladed horizontal-axis small wind turbines. Sustain. Energy Technol. 2022, 53, 102341. [Google Scholar]
  20. Evans, S.P.; Bradney, D.R.; Clausen, P.D. Development and experimental verification of a 5 kW small wind turbine aeroelastic model. J. Wind Eng. Ind. Aerodyn. 2018, 181, 104–111. [Google Scholar] [CrossRef]
  21. Zhang, R.Y.; Chen, C.H.; Tang, Y.G.; Huang, X.Y. Research Development and Key Technical on Floating Foundation for Offshore Wind Turbines. Adv. Mater. Res. 2012, 446–449, 1014–1019. [Google Scholar] [CrossRef]
  22. Sakagami, Y.; Radunz, W.C.; Santos, P.; Haas, R.; Passos, J.C.; Taves, F.F. Power curve performance of coastal turbines subject to low turbulence intensity offshore winds. J. Braz. Soc. Mech. Sci. Eng. 2023, 45, 24. [Google Scholar] [CrossRef]
  23. Evans, S.; Dana, S.; Clausen, P.; Wood, D. A simple method for modelling fatigue spectra of small wind turbine blades. Wind Energy 2021, 24, 549–557. [Google Scholar] [CrossRef]
  24. Taghinezhad, J.; Abdoli, S.; Silva, V.; Sheidaei, S.; Alimardani, R.; Mahmoodi, E. Computational fluid dynamic and response surface methodology coupling: A new method for optimization of the duct to be used in ducted wind turbines. Heliyon 2023, 9, e17057. [Google Scholar] [CrossRef]
  25. Wood, D. Small Wind Turbines; Springer: Berlin/Heidelberg, Germany, 2011. [Google Scholar]
  26. IEC 61400-2; Wind turbines. Part 2: Design Requirements for Small Wind Turbines. International Electro-Technical Commission: Geneva, Switzerland, 2006.
  27. BS ISO 6336-3; Calculation of Load Capacity of Spur and Helical Gears—Part 3 Calculation of Tooth Bending Strength. International Organization for Standardization: Geneva, Switzerland, 2006.
  28. BS ISO 6336-5; Calculation of Load Capacity of Spur and Helical Gears—Part 5 Strength and Quality of Materials. International Organization for Standardization: Geneva, Switzerland, 2006.
  29. Liu, H.; Zhang, B.; Zhu, C.; Wei, P. State of art of gear contact fatigue theories. Jixie Gongcheng Xuebao/J. Mech. Eng. 2022, 58, 95–120. [Google Scholar]
  30. Liu, H.; Liu, H.; Zhu, C.; Ge, Y. Influence of load spectrum on contact fatigue damage of a case carburized wind turbine gear. Eng. Fail. Anal. 2021, 119, 105005. [Google Scholar] [CrossRef]
  31. ISO 76-2006; Rolling Bearings-Static Load Ratings. International Organization for Standardization: Geneva Switzerland, 2006.
  32. Guideline for the Certification of Wind Turbines; Edition 2010; Germanischer Lloyd: Hamburg, Germany, 2010.
  33. Wang, Y.; Qin, D.; Wang, R.; Zhao, H. Dynamic Topology Optimization of Long-Span Continuum Structures. Shock. Vib. 2021, 2021, 4421298. [Google Scholar] [CrossRef]
  34. Park, H.J.; Oh, M.K.; Park, S.; Yoo, J. Structural design methodology for lightweight supporting structure of a multi-rotor wind turbine. Wind Struct. 2022, 34, 291–301. [Google Scholar]
  35. Lee, S. Reliability based design optimization using response surface augmented moment method. J. Mech. Sci. Technol. 2019, 33, 1751–1759. [Google Scholar] [CrossRef]
  36. Zhang, B.S.; Song, B.W.; Mao, Z.Y.; Tian, W.L.; Li, B.Y.; Li, B. A Novel Parametric Modeling Method and Optimal Design for Savonius Wind Turbines. Energies 2017, 10, 301. [Google Scholar] [CrossRef]
  37. BS ISO 54-1996; Cylindrical Gears for General Engineering and for Heavy Engineering. Modules. International Organization for Standardization: Geneva, Switzerland, 1996.
  38. Pereira, J.; Guedes, F.C.; Francisco, M.B.; Chiarello, A.G.; Gomes, G.F. Multi-objective design optimization of a high performance disk brake using lichtenberg algorithm. Mech. Based Des. Struct. Mach. 2023. [Google Scholar] [CrossRef]
  39. Khan, M.M.; Nisar, M.; Hajam, M.I. High-Stress Abrasive Wear Analysis of in Situ TiC-Reinforced Zinc-Aluminum Composites Using Integrated Taguchi-TOPSIS Method. Adv. Eng. Mater. 2023, 25, 2201862. [Google Scholar] [CrossRef]
  40. Huang, X.; Ji, W.T.; Ye, X.R.; Feng, Z.J. Configuration Planning of Expressway Self-Consistent Energy System Based on Multi-Objective Chance-Constrained Programming. Sustainability 2023, 15, 5605. [Google Scholar] [CrossRef]
Figure 1. Tail deflection wind turbines. (a) Tail deflection (front drive motor); (b) Wind wheel deflection; (c) Tail deflection (rear drive motor).
Energies 16 06708 g001
Figure 2. Variable pitch wind turbines. (a) Passive pitch (gravity hammer); (b) Passive pitch (disk pulley); (c); Active pitch.
Energies 16 06708 g002
Figure 3. Schematic diagram of the overall structure of the novel wind turbine.
Energies 16 06708 g003
Figure 4. Schematic diagram of the drive mechanism.
Energies 16 06708 g004
Figure 5. Schematic diagram of the hub and variable pitch mechanism structure.
Energies 16 06708 g005
Figure 6. 3D prototype model.
Energies 16 06708 g006
Figure 7. Diagram of action principle of the variable pitch adjustment mechanism.
Energies 16 06708 g007
Figure 8. Prototype test rig.
Energies 16 06708 g008
Figure 9. Starting wind speed at different pitch angles.
Energies 16 06708 g009
Figure 10. Boundary condition setting of the computational domain.
Energies 16 06708 g010
Figure 11. Meshing of the computational domain.
Energies 16 06708 g011
Figure 12. Grid validation.
Energies 16 06708 g012
Figure 13. Meshing of structures.
Energies 16 06708 g013
Figure 14. Schematic diagram of the load- and constraint settings for the hydrostatic analysis.
Energies 16 06708 g014
Figure 15. Pressure cloud diagram.
Energies 16 06708 g015
Figure 16. Maximum stress values of each component varied with pitch angle.
Energies 16 06708 g016
Figure 17. Stress distribution of each component under the maximum stress condition: (a) overall structural stress distribution; (b) synchronizer stress distribution; (c) gear stress distribution; (d) hub stress distribution; (e) rack stress distribution; and (f) blade handle stress distribution.
Energies 16 06708 g017
Figure 18. Gears contact- and bending stresses: (a) contact stress; (b) bending stress.
Energies 16 06708 g018
Figure 19. Bearing contact stress.
Energies 16 06708 g019
Figure 20. Optimization process for rack synchronizers. (a) Initial stress distribution; (b) Topology optimization settings; (c) Topology optimization results; (d) Stress distribution after topology optimization; (e) Size optimization settings; (f) Stress distribution after size optimization.
Energies 16 06708 g020
Figure 21. Optimization process for blade handle. (a) Initial stress distribution; (b) Shape optimization basis.; (c) Shape optimization results; (d) Stress distribution after shape optimization; (e) Size optimization settings; (f) Stress distribution after size optimization.
Energies 16 06708 g021
Figure 22. Optimization process for gear rack mechanism.
Energies 16 06708 g022
Table 1. Material properties.
MaterialDensity/kg·m−3Elastic Modulus/GPaPoisson’s Ratio
Wood composite900150.3
Carbon steel SAE 104578502100.269
Table 2. Rotational speed test results.
Pitch Angle
12°15°25°
Rotational speed/(r/min)375332313301238
Table 3. Material properties.
Nameσmaxσ0/1.1σ0/1.25Yield Strength/σ0
hub17.38 MPa304.5 MPa268 MPa335 MPa
gear27.42 MPa
rack21.20 MPa
blade connector25.04 MPa
rack synchronizer5.36 MPa
Table 4. Material properties.
Parameter NameValueParameter NameValue
Modulus (M)2.5Number of teeth (Z)17
Gear width (H)25 mmPressure angle20°
Tip height coefficient (ha*)1Top clearance coefficient (C*)0.25
Pitch circle diameter (d)42.5 mmBase circle diameter (db)40 mm
Tip circle diameter (da)47.5 mmRoot circle diameter (df)39.5 mm
Table 5. Structural parameters of bearing.
ParameterNumber
of Rollers (Z)
Outer
Diameter (D)
Inner
Diameter (d)
Width (B)Roller
Diameter (R)
Value48120 mm55 mm15 mm5 mm
Table 6. Comparison of optimized parameters for rack synchronizers.
Parameterd1d2MassMaximum Stress
Before
optimization
30 mm20 mm1.10 kg5.37 MPa
After
optimization
25 mm21.5 mm0.87 kg5.29 MPa
Table 7. Comparison of optimized parameters for blade handle.
ParameterL1L2L3R1MassMaximum Stress
Before
optimization
40 mm50 mm85 mm3 mm3.70 kg25.04 MPa
After
optimization
36 mm55 mm77 mm2.6 mm2.15 kg12.61 MPa
Table 8. Comparison of optimized parameters for blade handle.
ParametersInitial ValueRange
Modulus (M)2.5[1.25,1.5,1.75,2,2.25,2.5,2.75,3]
Number of teeth (Z)17[17,19,21,23,25,27]
Gear width (H)/mm25 mm[15,20,25]
Table 9. Comparison of optimized parameters for blade handle.
Parameter NameMassContact StressBending Stress
Information
entropy
0.9540.9240.966
Weight
coefficient
0.2940.4880.218
Table 10. Mass optimization results.
Mass
Optimization
Gear Rack Component × 3Blade Handle × 3Rack
Synchronizer
Pitch Bearing × 3
Before2.10 kg11.10 kg1.10 kg7.80 kg
After1.38 kg4.59 kg0.87 kg7.80 kg
Disclaimer/Publisher’s Note: The statements, opinions and data contained in all publications are solely those of the individual author(s) and contributor(s) and not of MDPI and/or the editor(s). MDPI and/or the editor(s) disclaim responsibility for any injury to people or property resulting from any ideas, methods, instructions or products referred to in the content.

