Article

Parametric Modelling Study to Determine the Feasibility of the Co-Gasification of Macroalgae and Plastics for the Production of Hydrogen-Rich Syngas

by
David Antonio Buentello-Montoya
1,*,
Miguel Ángel Armenta-Gutiérrez
2 and
Victor Manuel Maytorena-Soria
3
1
Tecnologico de Monterrey, Escuela de Ingeniería y Ciencias, General Ramón Corona 2514, Zapopan 45201, Mexico
2
Departamento de Ciencias Agronómicas y Veterinarias, Instituto Tecnológico de Sonora, 5 de Febrero 818 sur, Obregón 85000, Mexico
3
Departamento de Ingeniería Química y Metalurgia, Universidad de Sonora, Luis Donaldo Colosio, Hermosillo 83000, Mexico
*
Author to whom correspondence should be addressed.
Energies 2023, 16(19), 6819; https://doi.org/10.3390/en16196819
Submission received: 17 August 2023 / Revised: 12 September 2023 / Accepted: 15 September 2023 / Published: 26 September 2023

Abstract

:
Seaweed is of importance to the environment due to properties such as its CO2 sequestration capability. On the other hand, plastic is a versatile material important to society. Unfortunately, the abundance of both plastics and seaweed represents a challenge due to the need of adequate waste management. At first, algae and plastics might not appear suitable for energy recovery; however, with co-gasification, the results are promising. This work presents a model to simulate the co-gasification of Chlorella vulgaris, Sargassum fluitans, and Sargassum natans with plastics. The effect of the gasification temperature (650–850 °C), equivalence ratio (0.25–0.45), and plastics/biomass ratio (0.0–1.0) on the produced gas’s lower heating value, tar concentration, and composition is assessed. Moreover, the environmental performance of using plastic to enhance the syngas produced from the co-gasification with sargassum is assessed using the life cycle assessment methodology. The results indicate that the lower heating value increases with the temperature and plastics/biomass ratio. Moreover, tar increases with the quantity of plastics, varying between 20 and 50 g/Nm3. Finally, adding plastics to algae during gasification reduces the variability in the syngas composition, simplifying the post-processing stage. With respect to environmental performance, gasification has an impact similar to those of pyrolysis and recycling, but the performance could improve with sufficient research and development.

1. Introduction

Adequate waste management is of worldwide concern because materials such as plastics have a long degradation time and can decompose into smaller debris, such as microplastics, which present hazards to the environment and human health [1,2,3]. Plastic waste (including microplastic waste) is usually found as a mixture of plastics, where the three most prevalent are polypropylene (PP), polyethylene (PE), and polyethylene terephthalate (PET) [4,5]. However, plastics are not the only kind of solid waste that represents a challenge to society. For example, macroalgae, such as sargassum, cause problems in different coastal environments due to its sheer abundance; it has been reported that around 1 million tons wash ashore the Gulf of Mexico every year [6,7]. Highly abundant macroalgae cause environmental, health, and economic damage [2,6,7]. To combat the issues, researchers have proposed different alternatives to use sargassum; for example, sargassum has been used to develop food supplements [8,9]. Unfortunately, the opportunities for food production using sargassum can become compromised in some circumstances, such as when microplastics are present in the algae [10,11,12]. When algae are contaminated with microplastics, these cannot be used for food production, and an alternative methodology must be employed for their usage. Technologies, such as pyrolysis and gasification, are popular to convert biomass and waste to energy and have received attention due to the versatility of the products; however, challenges exist in different forms [13,14,15]. For example, sargassum usually has a low hydrogen content; hence, its use as a fuel precursor can be limited [16]. Li et al. [17] gasified Sargassum horneri biochar and found that hydrogen-rich syngas was produced, attributed to its high ash content; it was noted, however, that the high ash content might be related to the algae-growing environment. Hence, it might be different for different cases. He et al. [18] gasified macroalgae in a fixed-bed reactor using sand and ash as the bed materials and found that the large amount of ashes in the macroalgae caused agglomerates in the bed. On the other hand, the thermal treatment of plastics can be complicated due to the materials melting and clogging the reactors [19,20]. Co-feeding biomass with other substances (coal, peat, or plastics) during either pyrolysis or gasification is an alternative to enhance the product properties, as, for example, the addition of coal can increase the overall carbon conversion [21,22,23,24,25,26,27]. Kositkanawuth et al. [22] experimented with the co-pyrolysis of sargassum and polystyrene and found that the addition of plastics to the pyrolysis of sargassum increased the product yield and hydrogen contents in the formed bio-oils. Cheng et al. [23] co-pyrolyzed sargassum and poplar and found that the co-pyrolysis enhanced the process since lower temperatures were required to achieve the material’s pyrolysis, when compared to the pyrolysis of a single feedstock. Understanding the characteristics of the products of the co-gasification of sargassum with plastics represents an opportunity to address two important types of solid waste while producing a chemical of interest [28,29]. When reactors have a long residence time (sufficient to achieve thermodynamic equilibrium), thermodynamic equilibrium models can be used [15]. The thermodynamic equilibrium assumption is adequate for downdraft and some fluidized bed gasifiers [15].
This work consists of a modelling study to determine the characteristics of the syngas (a mixture of H2, CO, CO2, CH4, and other compounds) produced from the air co-gasification of different biomasses (namely, sargassum) with a mixture of plastics at different operation conditions, with the aim of understanding the potential of gasification as a waste-management option, in terms of energetic and environmental performance. Particularly, the algae that grows in abundance and are washed ashore beaches in Mexico (Chlorella vulgaris (CV), Sargassum natans (SN), and Sargassum fluitans (SF)) were used as biomass feedstock [6], while a mixture of PP/PE/PET (3.6% PP, 51.9% PE, and 29.3% PET) was used to represent plastics; the plastic mixture composition was based on the common plastic mixture composition found in waste [30,31]. In the study, the effect of the gasification temperature, feedstock composition, and equivalence ratio on the syngas’ lower heating value (LHV), cold gas efficiency (CGE) process, syngas tar content, and gas composition was analyzed. The gas LHV is an indicator of the amount of energy released during the combustion of a fuel, while the process CGE is an indication of how much energy is released from oxidizing the produced syngas in comparison with the feedstock. The tar content is an important parameter for gasification because tar must be reduced significantly (or completely) for most downstream syngas applications [32]. The gas composition is important since it defines potential upgrade routes for usage (for example, the H2/CO ratio defines the capabilities of the syngas for Fischer–Tropsch synthesis) [33]. Finally, plastic has several well-studied and well-documented waste management methodologies; hence, these must be compared with the proposed co-gasification process. For this, an environmental performance analysis is presented in the form of a life cycle assessment comparing different waste disposal alternatives for plastics: landfill, recycling, and gasification [34,35].
The structure of the work is as follows: Firstly, the thermodynamic model is described, together with the methodology followed for the validation of the developed model. Afterwards, details on the LCA methodology are presented. Subsequently, Section 3 shows the results from the parametric analysis, where the input parameters (fuel to air, gasification temperature, and mixture composition) are varied to determine their effect on the gas quality and composition. Afterwards, a life cycle assessment (LCA), where the different waste management scenarios are analyzed, is presented. Finally, a summary and a series of conclusions are presented.

2. Methodology

2.1. Model Description

A thermodynamic equilibrium stoichiometric model, based on an in-house-developed Python code, was used to simulate the gasification. The model calculates the equilibrium composition (based on the feedstock ultimate analysis) of the gasification products (syngas) following the Gibbs free energy minimization method [36]. The model calculates the Gibbs free energy at different compositions and temperatures fulfilling a material and energy balance; the composition of the syngas is then fixed at the point where the Gibbs free energy is the lowest and the balance is fulfilled. For the material balance, it is assumed that the potential products are common products reported in experiments [37,38].
To represent the decomposition of biomass and plastics, the following pseudo-reactions were used:
CHαOβ + γ1(O2 + 3.76N2) ↔ x1H2 + x2CO + x3CO2 + x4CH4 + x5C6H6 + x6H2O + x7C + 3.76γ1N2
C10H8O4 + γ2(O2 + 3.76N2) ↔ y1H2 + y2CO + y3CO2 + y4CH4 + y5C6H6 + y6H2O + y7C + 3.76γ2N2
C3H6 + γ3(O2 + 3.76N2) ↔ z1H2 + z2CO + z3CO2 + z4CH4 + z5C6H6 + z6H2O + z7C + 3.76γ3N2
C2H4 + γ4(O2 + 3.76N2) ↔ w1H2 + w2CO + w3CO2 + w4CH4 + w5C6H6 + w6H2O + w7C + 3.76γ4N2
where α and β are the mass factors corresponding to the ultimate analysis of the biomass; γi is a mass factor associated to the air used for gasification; and wi, xi, yi, and zi are the molar fraction of species i, products from the decomposition of the feedstock [37]. Benzene (C6H6) is used to represent tar, since it is a well-known tar precursor refractory in nature [37]. Moreover, it is assumed that benzene can react and form other tar, toluene (C7H8) and naphthalene (C10H8), through the following reactions [38,39]:
C6H6 + CH2 ↔ C7H8
C6H6 ↔ C6H5* + H*
C6H5* + C2H2 ↔ C8H7* + H*
C8H7* + C2H2 ↔ C10H9*
C10H9* ↔ C10H8 + H*
The mass of air added to the gasifier is calculated with the equivalence ratio, ER [28]:
ER = (F/A)/(F/A)Stoic
where F/A is the fuel/air mass ratio, and the subindex “stoic” corresponds to stoichiometric quantities. The fuel mass is calculated using the sum of the ultimate analysis percentages of carbon, hydrogen, oxygen, and nitrogen in the feedstock, multiplying by the corresponding molecular weight.
To complete the thermodynamic equilibrium calculations, the following equations were used [37]:
CO + H2O ↔ CO2 + H2
C + 2H2 ↔ CH4
k6 = (PCO2PH2)/(PCOPH2O)
k7 = PCH4/PH2
where ki and Pj correspond to the equilibrium constant for equation I and the partial pressure of gas j, respectively [6,16]. The ultimate analysis of the gasified biomasses was extracted from references [6,22], whose details can be found in Table 1, while the plastic mixture composition was obtained from [31].
The energy balance for the reactions is calculated as follows:
j∆Hj0 = ∑ji xji ∆Hi
where xji is the molar fraction of the ith product from the decomposition of reactant j, ∆Hj0 is the standard enthalpy of the formation of species j, and ∆Hj are the changes in enthalpy of species j. The heat of formation for the biomass and the plastics is calculated following the relationship found in [40]:
∆H0Biomass = ∆H0CO2 + ∆H0H2O + (12 + α + 16β) LHVBiomass
The following mathematical expressions were used to calculate the LHVs [41]:
LHVFeedstock = LHVBiomass + LHVPP + LHVPE + LHVPET
LHVBiomass = 34.835wC + 93.87wH − 10.80wO + 6.28wN + 10.465wS
LHVSyngas = 4.180(2.57ΦH2 + 3.0ΦCO + 8.54ΦCO2 + 15.13ΦCH4) + 0.0422ΦC6H6
where Φi is the dry mole fraction of the species i. The LHV values of the different plastics can be found in reference [42].
Finally, the gas yield is calculated using the following relationship [41]:
vSyngas/mfeedstock = 22.4(ΦH2 + ΦCO + ΦCO2 + ΦCH4 + ΦN2 + β∑γi)/mfeedstock
where mfeedstock is the feedstock mass.
The produced syngas was analyzed with respect to the gas lower heating value (LHV), gas volume composition, H2-to-CO ratio, and CGE.
The CGE is a relationship between the LHV of the produced gas (LHVSyngas) and the LHV of the feedstock (LHVFeedstock), and can be used to determine the efficiency of the process with respect to the employed feedstock [28]:
CGE = LHVSyngas/LHVFeedstock

2.2. Model Validation

To validate the model, the experiments from the literature [26,43,44,45,46,47,48] were replicated and the experimentally produced syngas composition was compared with the composition estimated by the model. The mean absolute error (MAE) was used as an indicator of the accuracy of the model. The validation was conducted in two stages: (1) by experiments (i.e., the MAE of the whole experiment was calculated) and (2) by species (that is, for all of the experiments, the MAE of each species was calculated to determine whether the model is less accurate on the calculation for a particular species). Information on the validation by experiment can be found in Table 2, while the validation by species can be seen in Table 3. In Table 3, it can be seen that the model is the least accurate when the tar concentration is calculated; this occurs because tar has a diverse composition (while the present model only considers benzene, toluene, and naphthalene) and formation/decomposition rates [32].
The MAE was calculated using the equation:
MAE = ∑|Yi − Xi|/n
where Yi are the volumes of the species i (H2, CO, CO2, CH4, and tar) calculated using the developed model, Xi are the volumes of species i reported in the literature, and n is the number of values.

2.3. Life Cycle Assessment

A life cycle assessment (LCA) is a methodology where the impact of the different stages in the life cycle of a product are evaluated [49]. A basic principle of a LCA is to define the goal and scope of the study; in this work, since the aim is to assess co-gasification (COG) of plastics with biomass as a waste-handling alternative, the goal is to determine the environmental impact of using plastics as feedstock for gasification and comparing it with pyrolysis (PY), recycling (REC), and landfilling (LF) as end-of-life scenarios. The system boundary considers the processes involved in the different end-of-life scenarios (for example, plastic separation and grinding). The functional unit is the management of 1 ton of plastics. ReCiPe 2016 endpoint was used as an impact assessment method due to its robustness and ease of interpretation [50]. The inventory data for the gasification and pyrolysis of different plastic wastes were collected from the literature [51,52,53], and the energy consumption was calculated using the energy balance, assuming 80% efficiency (that is, only 80% of the energy consumed during the process is actually used for the gasification); the information was complemented with the Ecoinvent 3 database [54].
Importantly, since gasification leads to the production of syngas, it was assumed that the produced gas energy (in MJ, calculated from the gas yield and the gas LHV) prevented the environmental burden of the same amount of energy from fossil sources. Potential uses of the syngas, such as the synthesis of additives or other liquid fuels, is not considered in the LCA.

3. Results and Discussion

The simulations were conducted under different conditions to determine the effect of the parameters on the syngas LHV, CGE, tar concentration, and H2/CO ratio. The following parameters where varied: gasification temperatures (650, 750, and 850 °C), ERs (0.25, 0.35, and 0.45), and plastics/biomass mass ratios (called MR from here onwards) (0, 0.25, 0.50, 0.75, and 1.0); all the simulations were conducted using the three biomasses (CV, SN, and SF). The MR is defined as follows:
MR = mPlastics/mBiomass
where mPlastics is the mass of the plastic mixture, while mBiomass is the mass of sargassum added to the gasifier. The LCA results are presented considering the gasification of plastics only, since, of the different feedstocks, plastics comprise a significant environmental burden.

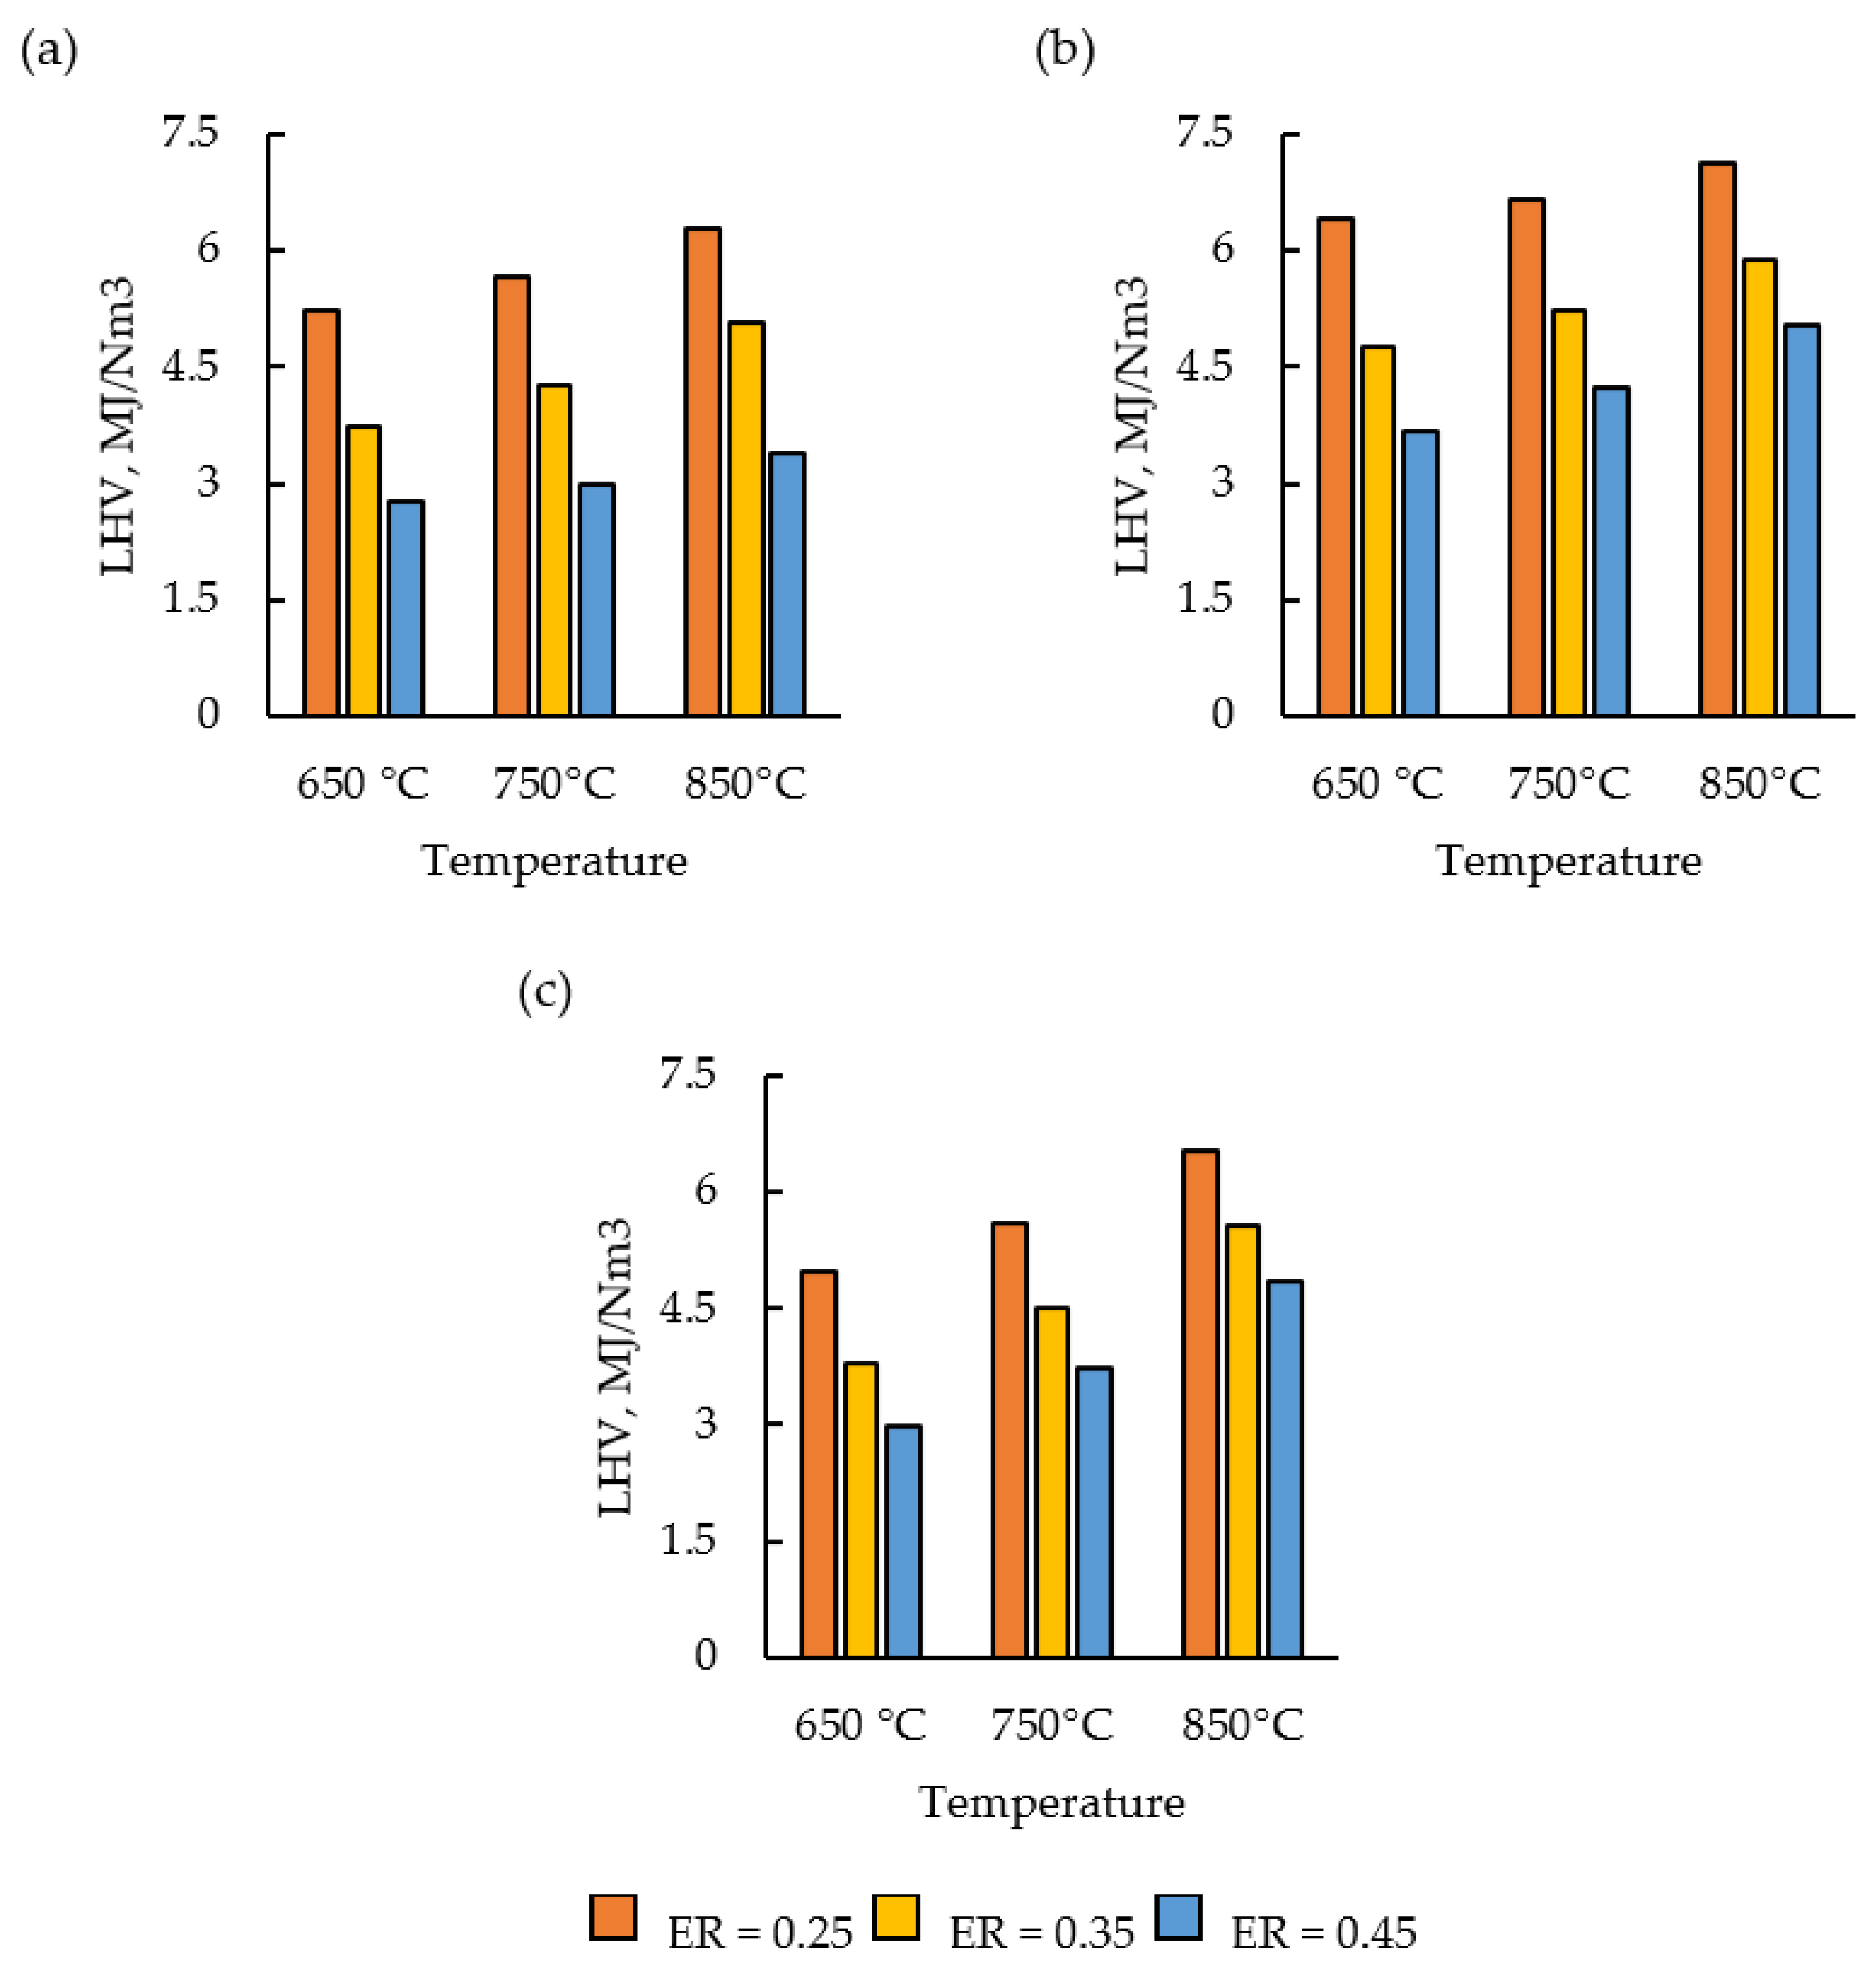
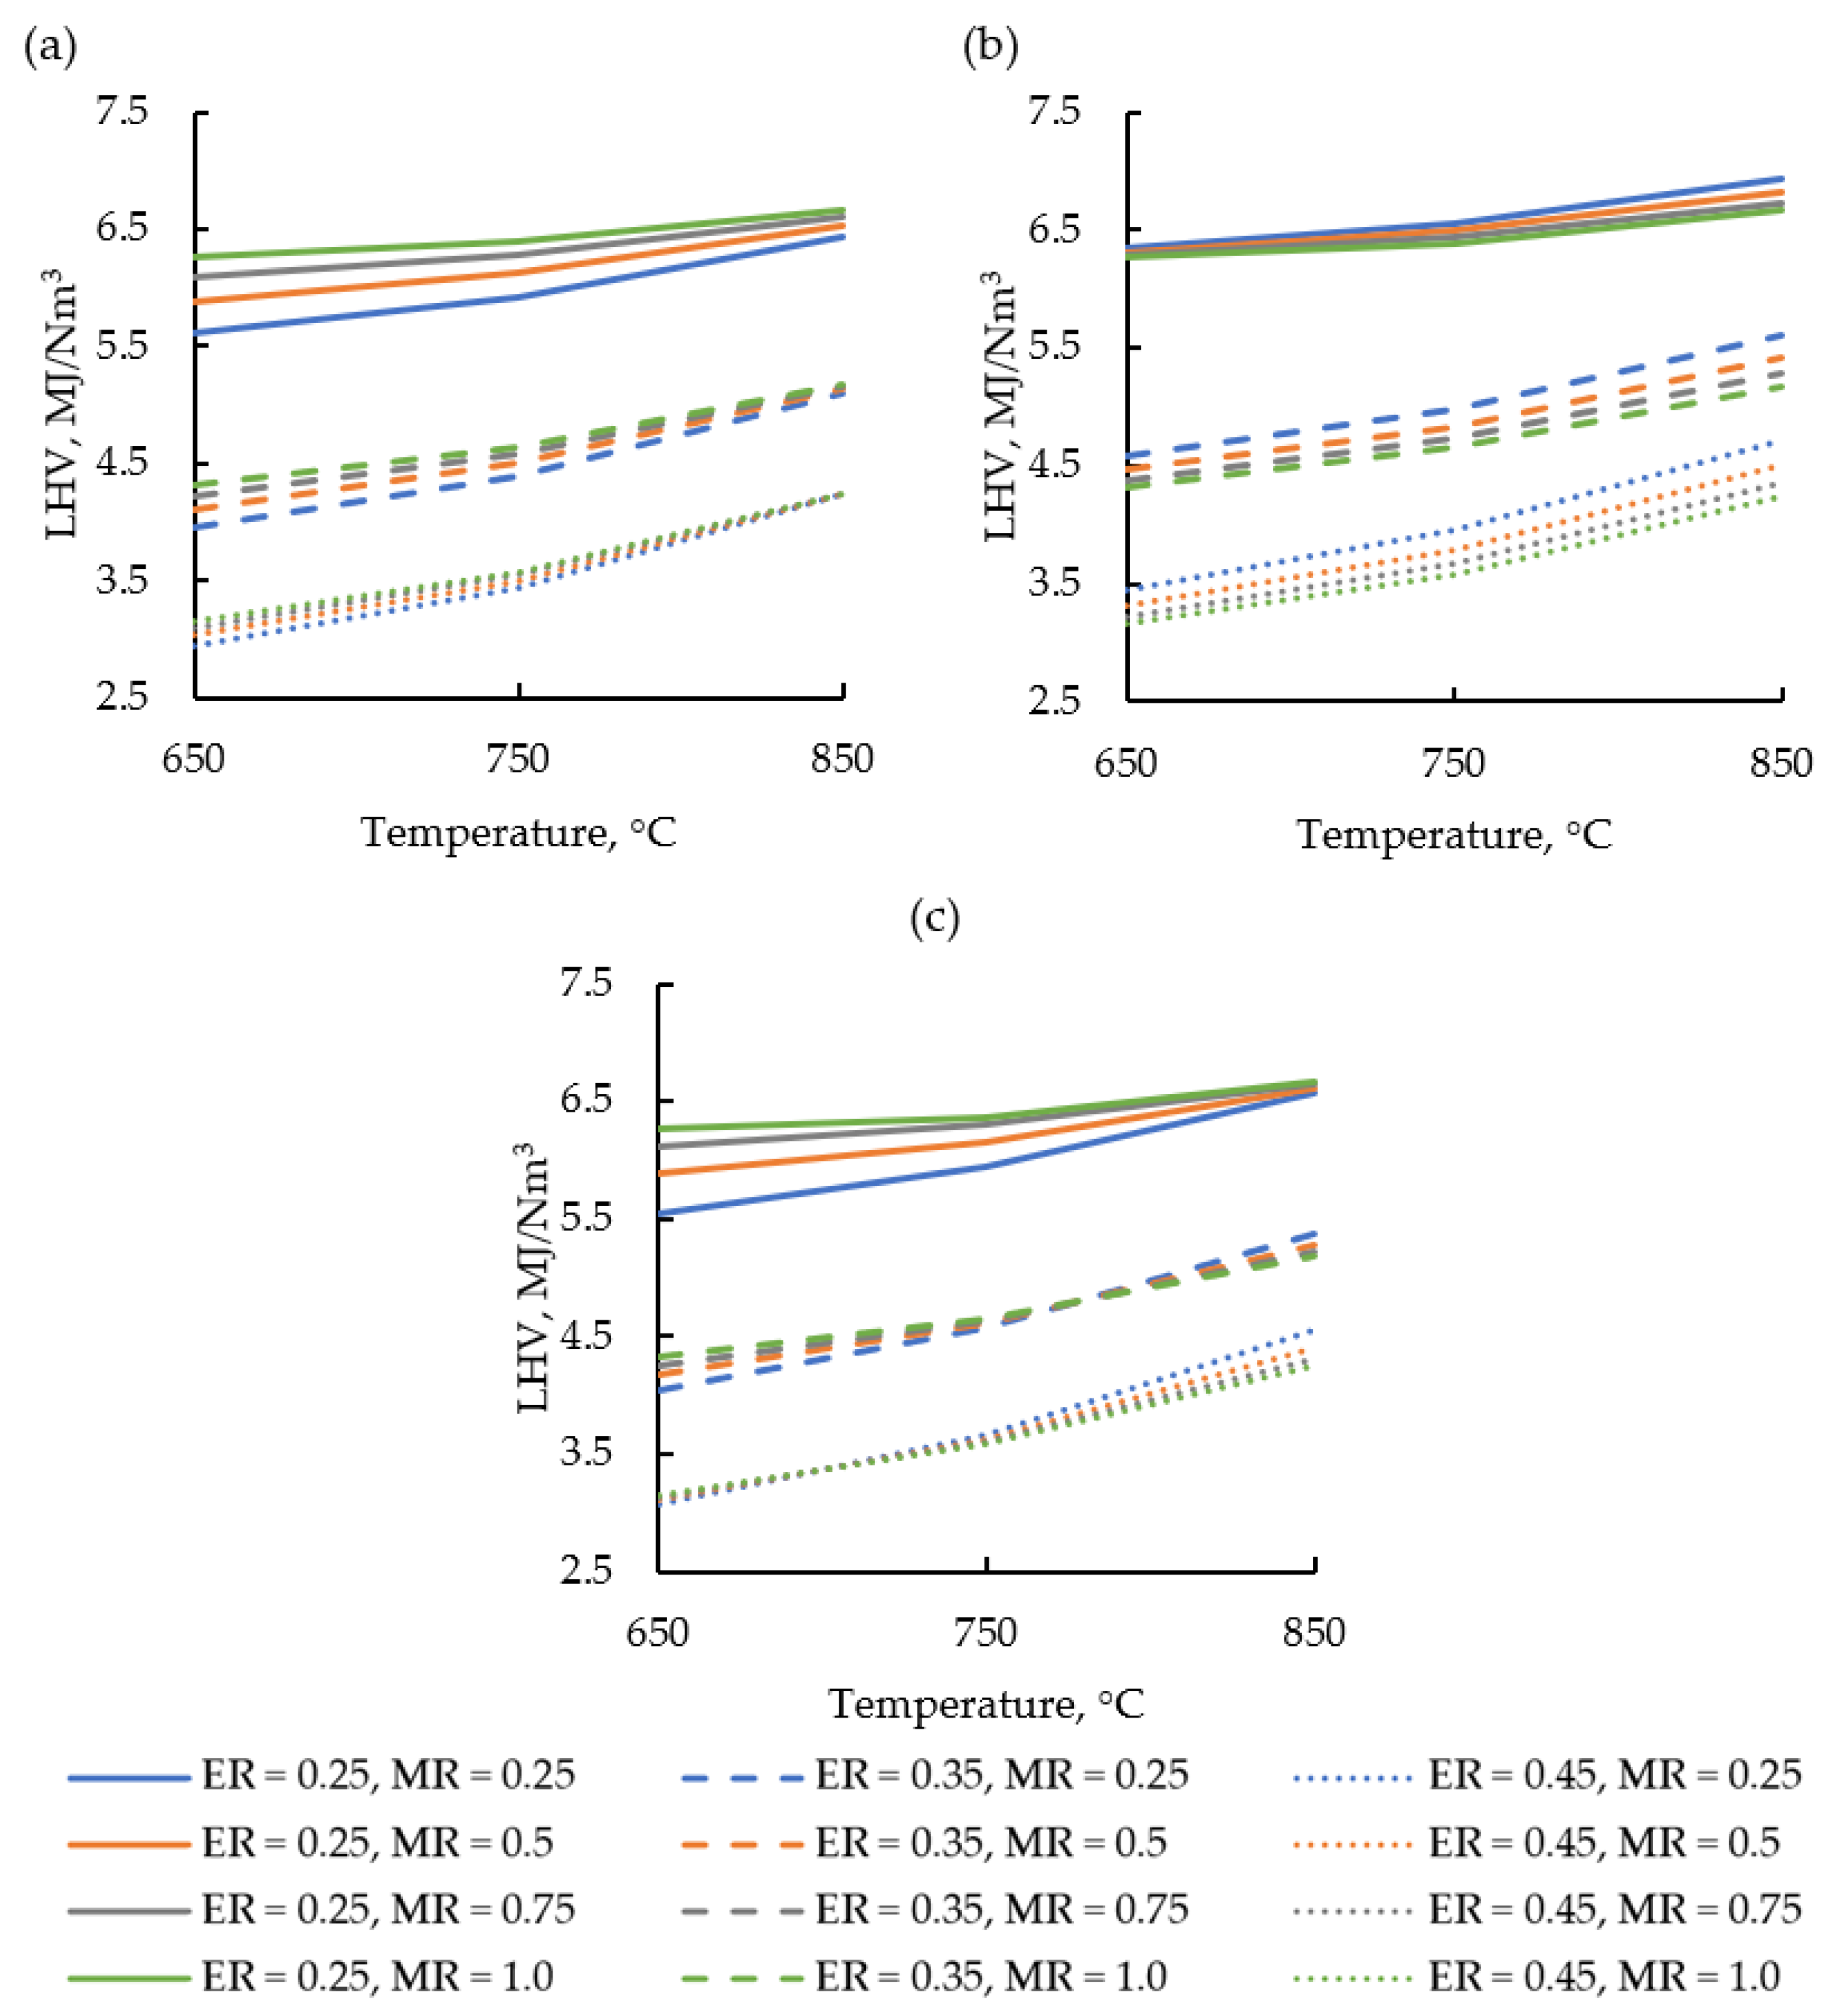
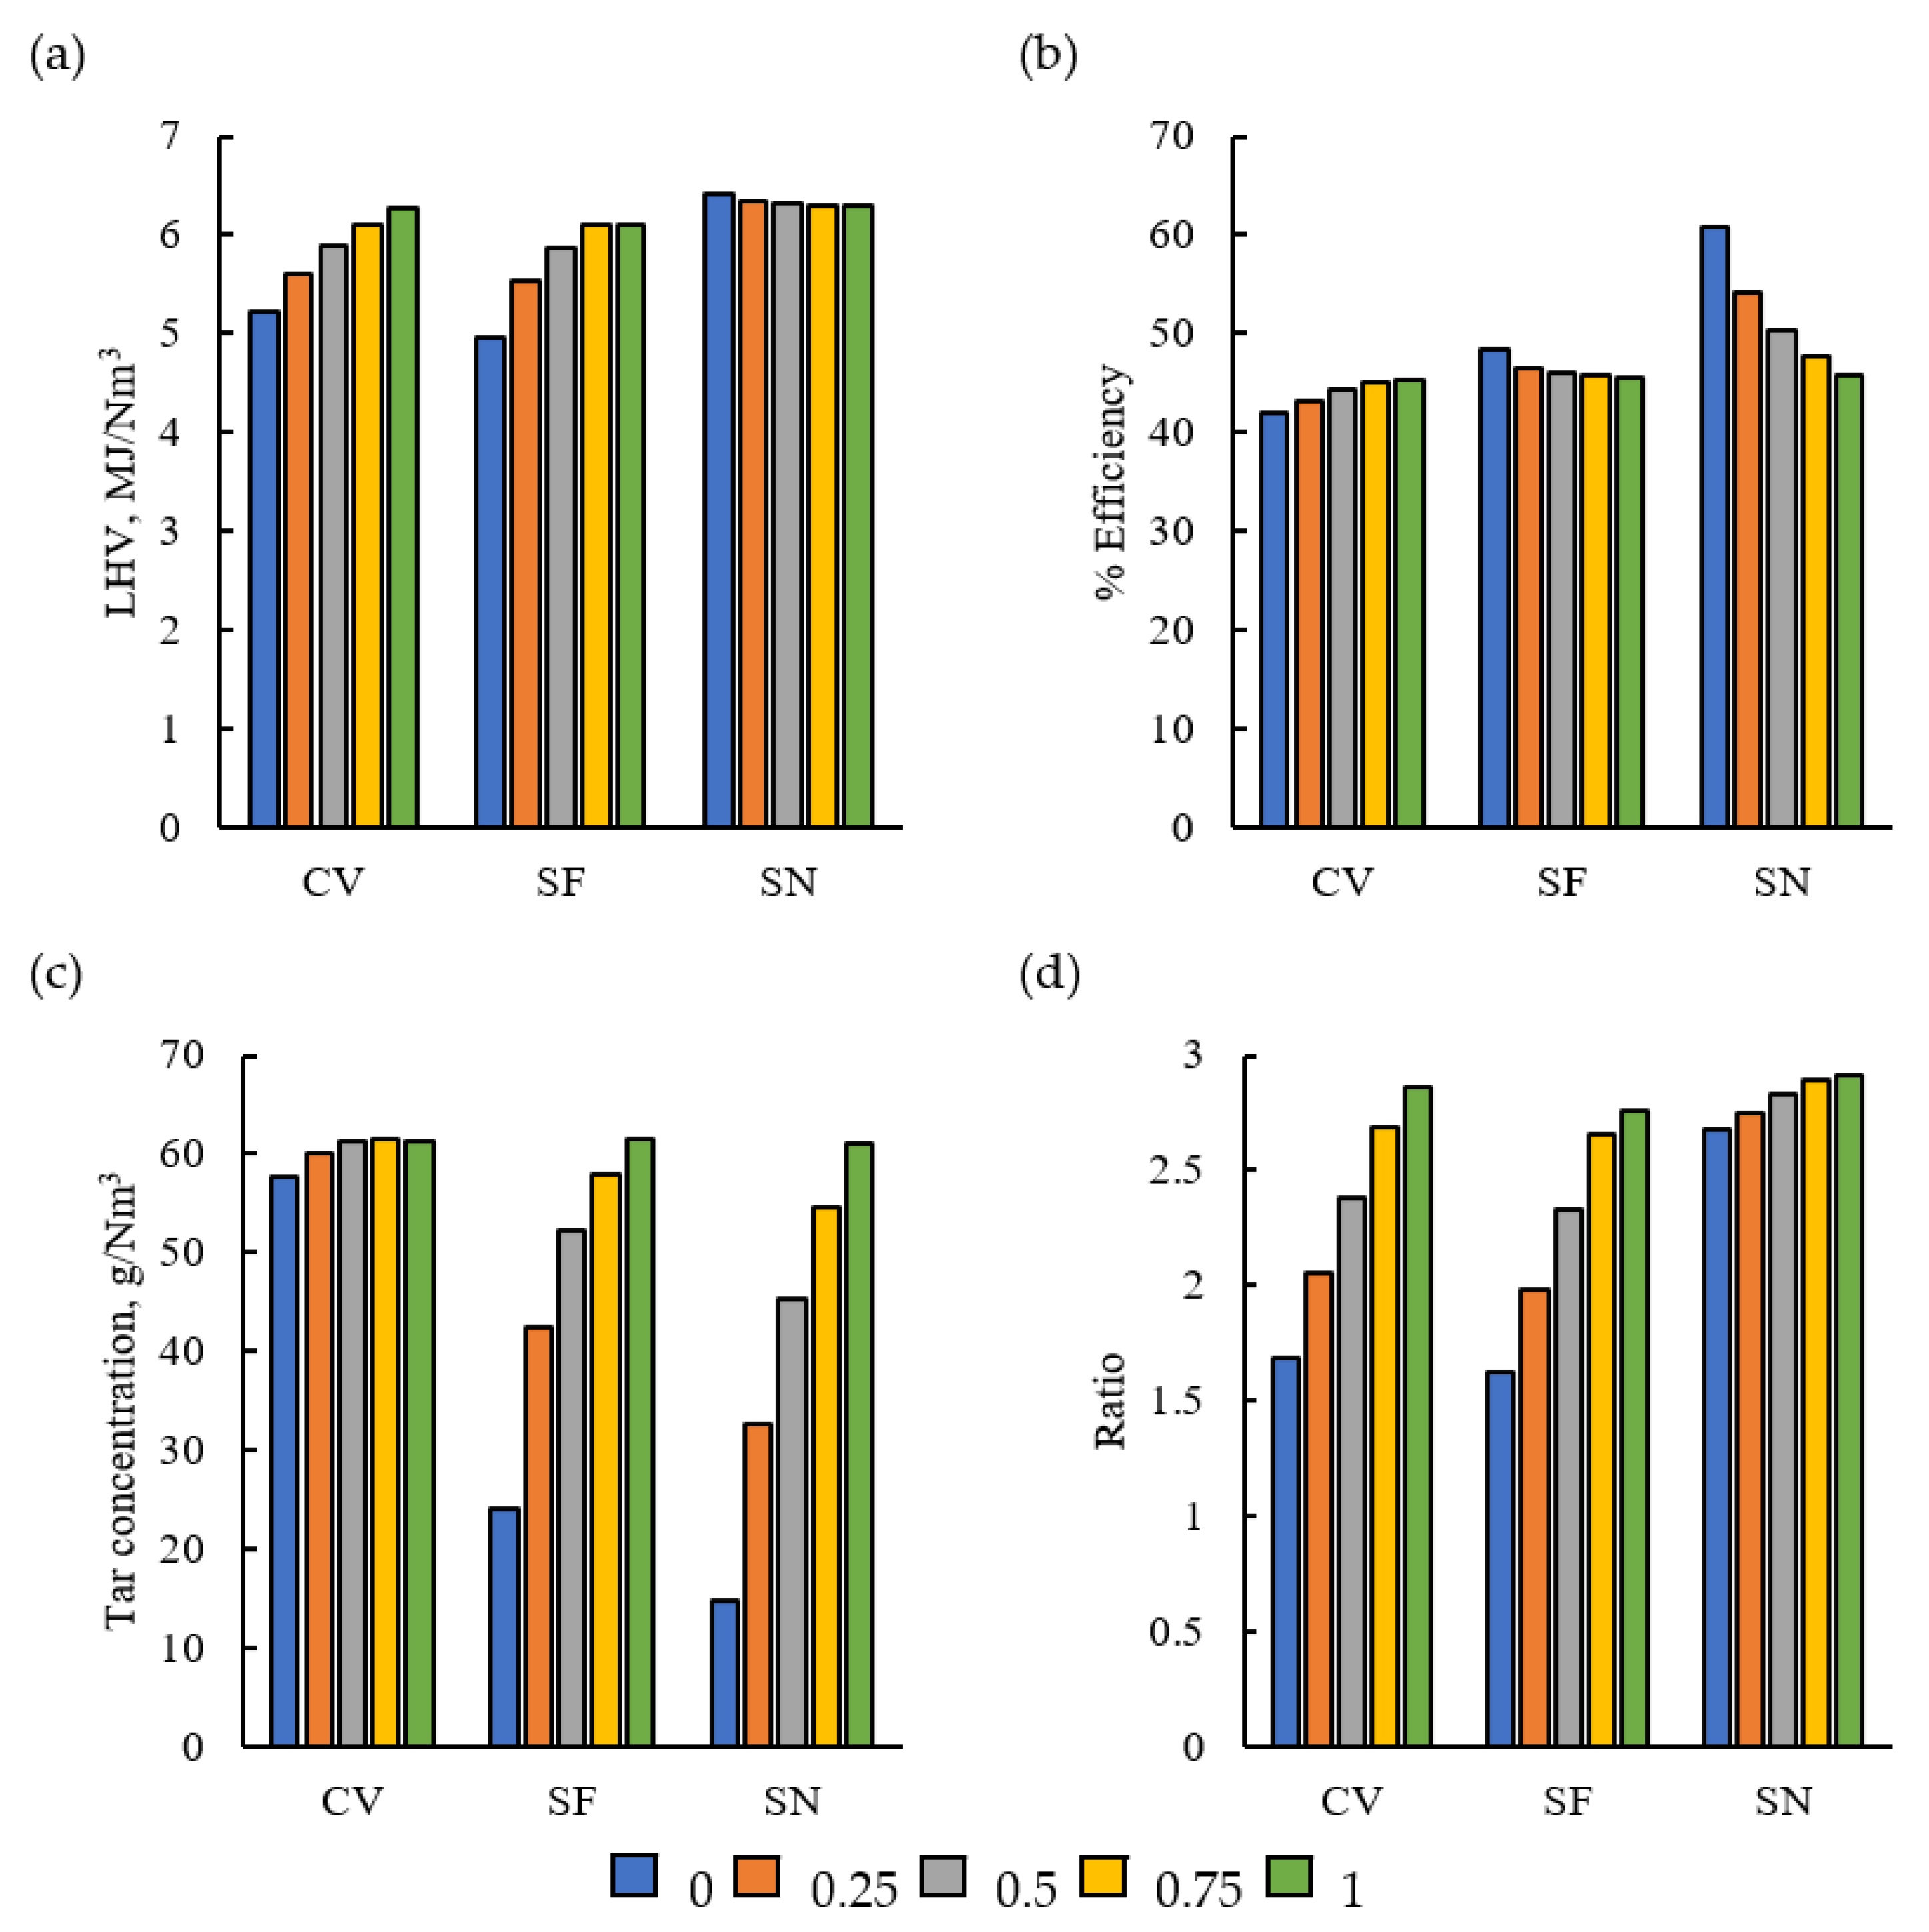
3.1. Effect of the Gas LHV

Figure 1 shows the LHV of the syngas at different gasification temperatures and ERs using pure (a) CV, (b) SN, and (c) SF as biomass feedstocks. It can be seen that, regardless of the biomass, the LHV increases with the temperature and decreases with the ER. Higher temperatures promote the formation of H2 (from the decomposition of the feedstock) and CO (from the water–gas shift reaction, WGS), which increase the gas LHV. On the other hand, the LHV decreases with the ER because the syngas becomes diluted with N2 from the gasifying agent. The trend followed by the different biomasses (in terms of LHV) changes with the operation conditions. At ER = 0.25, SN is the biomass that produces the best gas (in terms of LHV), followed by CV and SF. At ER = 0.45, the best biomass is still SN, but CV leads to the gas with the lowest LHV. Interestingly, the LHVs of the three algae are 2.160 MJ/kg for the CV, 1.803 MJ/kg for the SN, and 1.255 for the SN, calculated using Equation (18).
When the plastic mixture was added to the feedstock, the composition of the produced gas changed; the results obtained from mixing the algae with plastics, in terms of LHV, are shown in Figure 2, where (a) shows CV, (b) shows the gasification of SN, and (c) shows the gasification of SF. It can be seen that, for CV and SF, the LHV increased with the increase in MR, while SN has the opposite behavior. The behavior for the CV and SF cases is associated to the abundance of H atoms in plastics, which favors the formation of H2; on the other hand, since SN has a higher H content than the other biomasses, the plastics contribute to the formation of tar instead of hydrogen (as is explained in following subsections). The effect of the presence of plastics is particularly noticeable when ER = 0.25, where there is little N2 diluting the gas. Moreover, it can be seen that the LHV approaches a maximum value at MR = 1.0 and T = 850 °C (with the exception of the SN case); this can be associated to the produced tar being completely decomposed, as is discussed in Section 3.2. In the case of SN, the LHV decreases with the MR because of the relatively high hydrogen content in SN; the addition of carbon atoms to plastics results in the formation of CO and CO2 instead of H2, which does not contribute as much to the LHV [41]. With respect to the biomasses, the gas with the highest LHV is produced from SN, followed by SF and CV.

3.2. Effect of the Gas Tar Concentration

Figure 3 shows how the tar concentration varies with the operation conditions. For every case, the tar concentration decreases when the temperature or the ER increase; this occurs because higher ERs and temperatures promote the decomposition of tar (hydrocarbons) into CO and CO2 due to oxidation reactions (that is, the oxygen in the air oxidizes the heaviest hydrocarbons to produce CO and CO2), which also results in an increase in LHVs (although, in the end, the ER also results in an increase in N2 content, with the dilution of the gas and the decrease in the LHV). At the same time, it can be seen that the tar concentration increases with the MR; this occurs because the C atoms (present in PP, PE, and PET) and the O atoms (present in the PET) thermodynamically favor the formation of tar. However, since tar is practically completely removed at high temperatures and ERs, these operation parameters can be tweaked to achieve the required syngas LHVs. At high ERs and temperatures, tar is practically completely decomposed for each of the different biomasses and regardless of the mixing ratio. Therefore, in order to produce gas with a low amount of tar, either a large amount of air (or oxygen) or high gasification temperatures should be used.

3.3. Effect of Cold Gas Efficiency

Figure 4 shows the CGE ratio of the gasification process for the different operation conditions. For all the biomasses, MRs, and ERs, the CGE increases with the temperature, since high temperatures lead to the decomposition of hydrocarbons into H2 and CO, both of which have important heating values. The CGE decreases with the ER due to the addition of the practically inert N2 to the syngas. Moreover, although not particularly noticeable for the CV case, increasing the MR decreases the CGE; this occurs due to increasing the feedstock LHVs (due to the addition of plastics with a large percentage of hydrogen). For example, at MR = 0, the feedstock LHV is 17.83 MJ/kg, whereas at MR = 0.5, the feedstock LHV is 30.11 MJ/kg. On the other hand, the gas LHV is constrained by the amount of H2 formed from the decomposition of the feedstock. Moreover, since the WGS reaction is exothermic (that is, favored at low temperatures), the reverse WGS reaction leads to the formation of CO and H2O (gases with a low LHV), instead of H2 (a gas with a high LHV) and CO2. This indicates that, even without accounting for the energy required to achieve high temperatures, exceedingly high temperatures might be prejudicial to the formation of syngas with high H2, and to the whole gasification process.

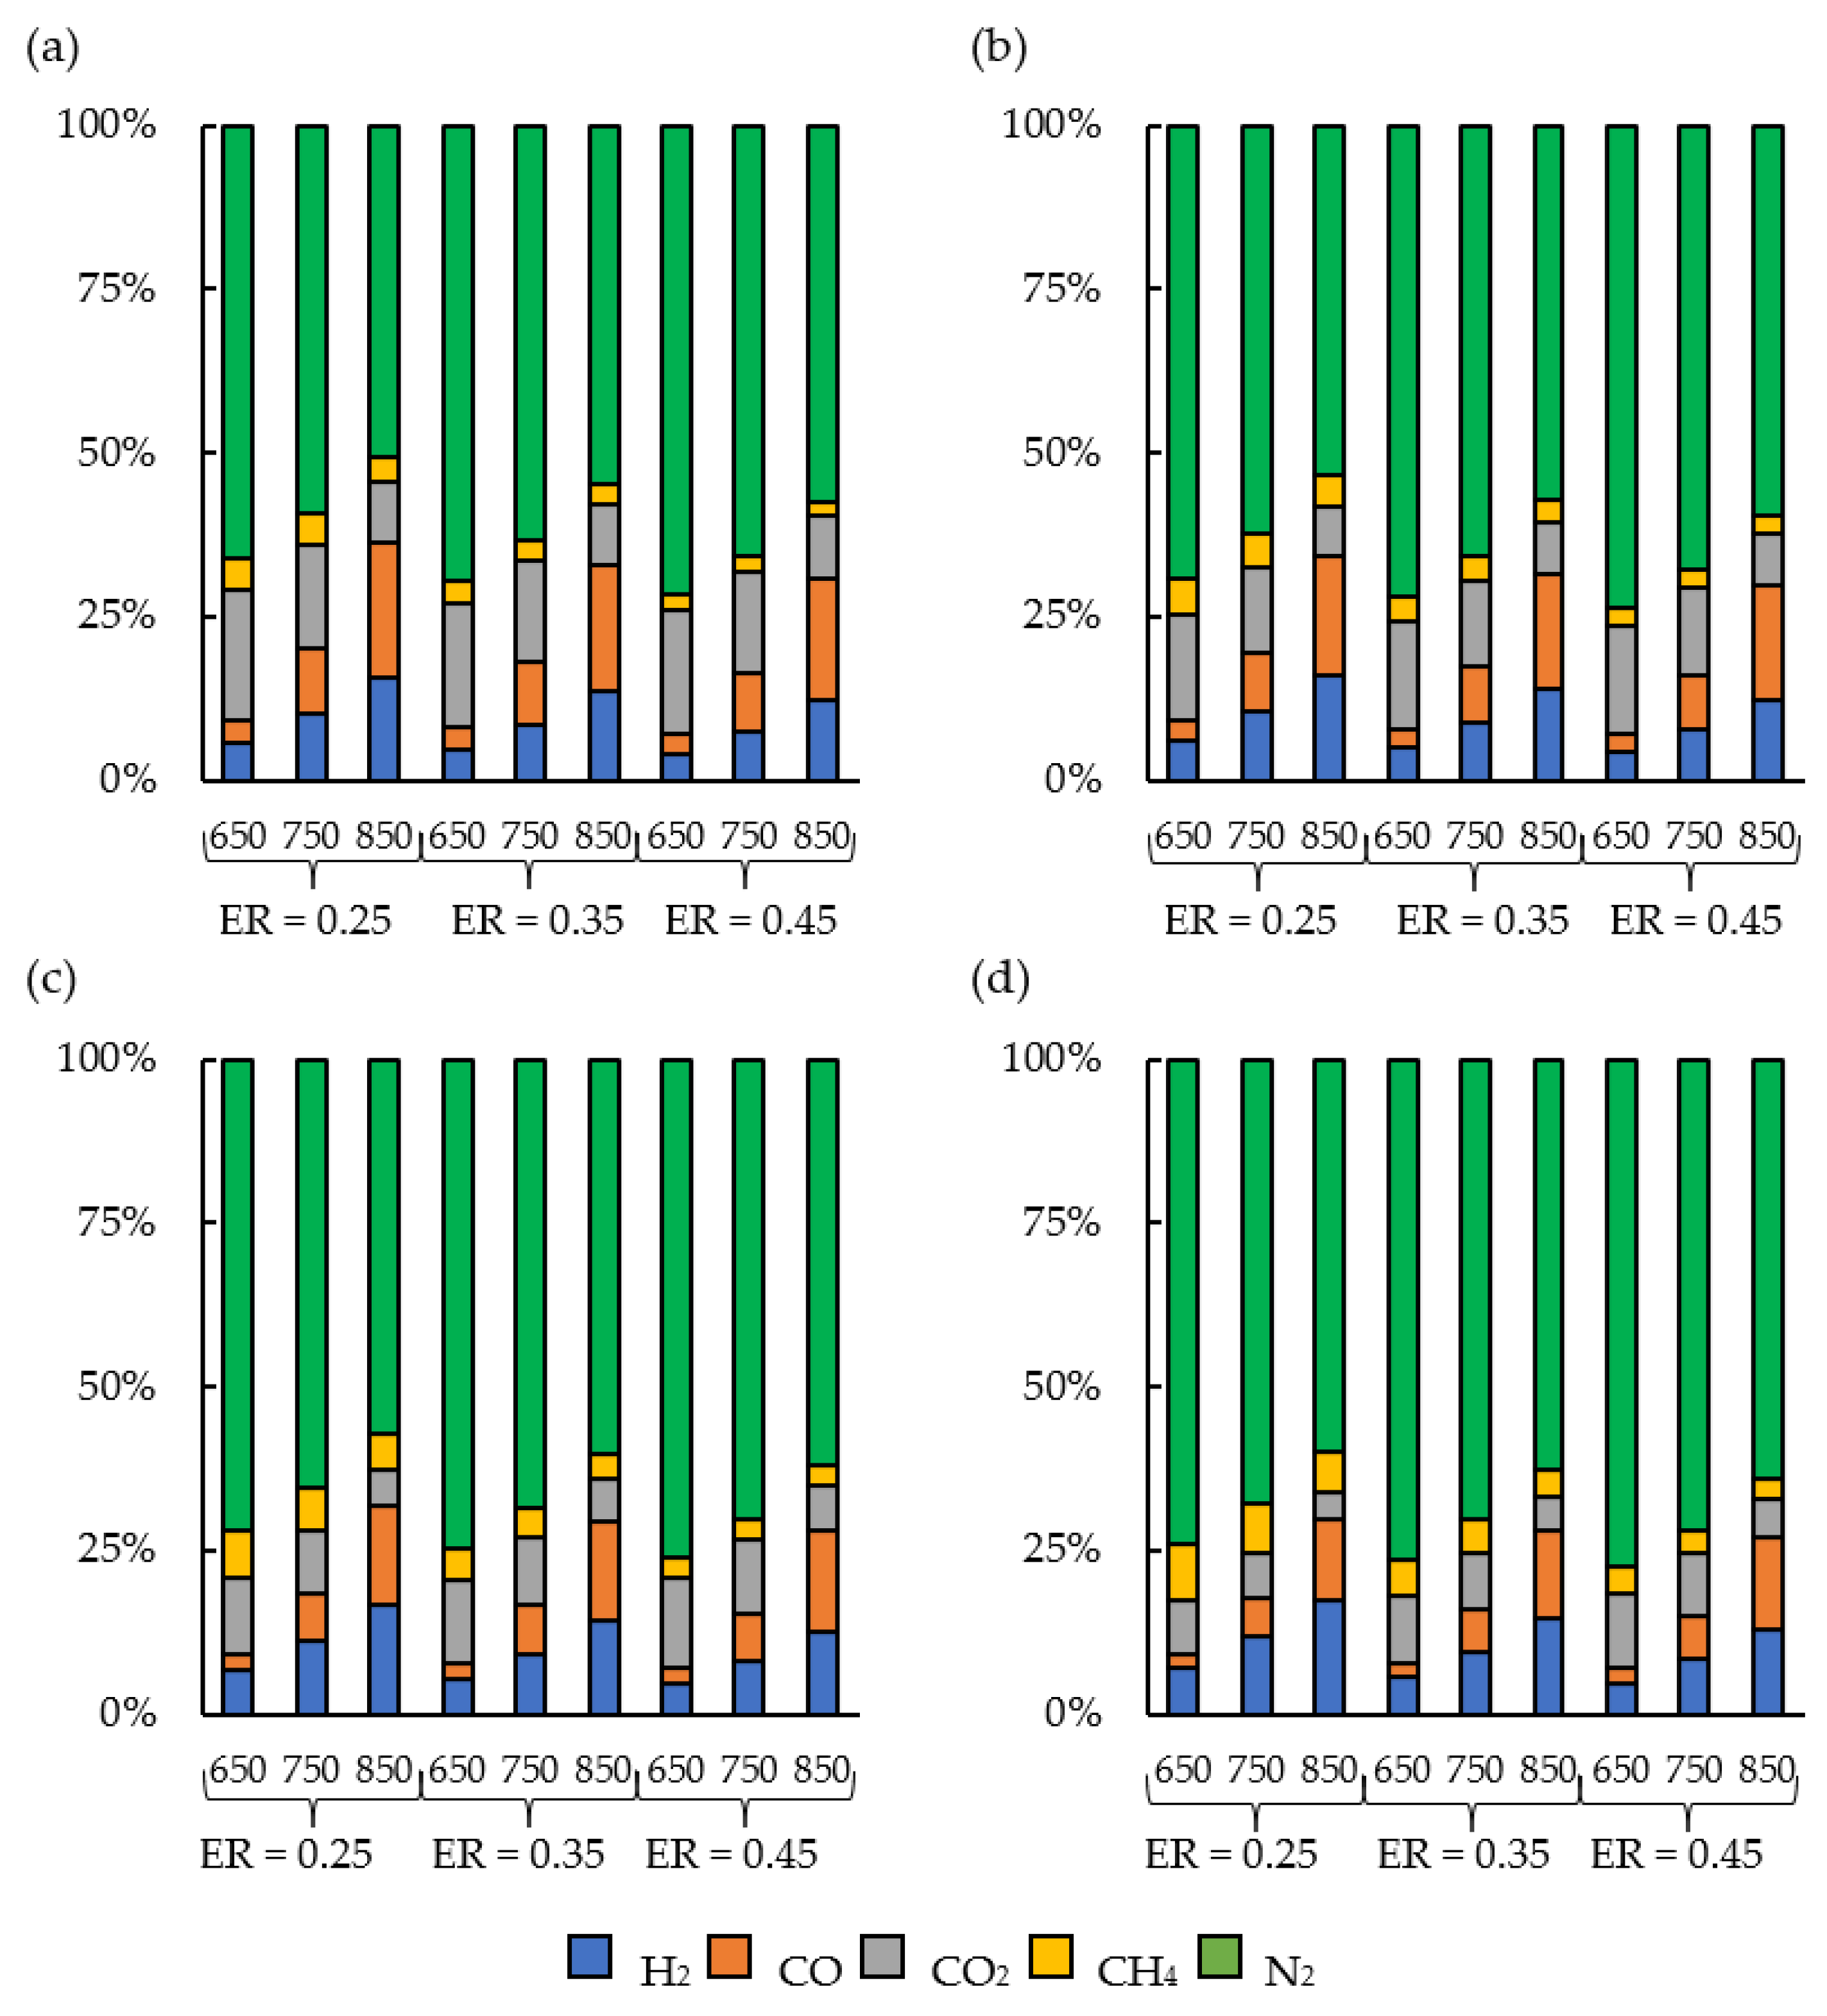
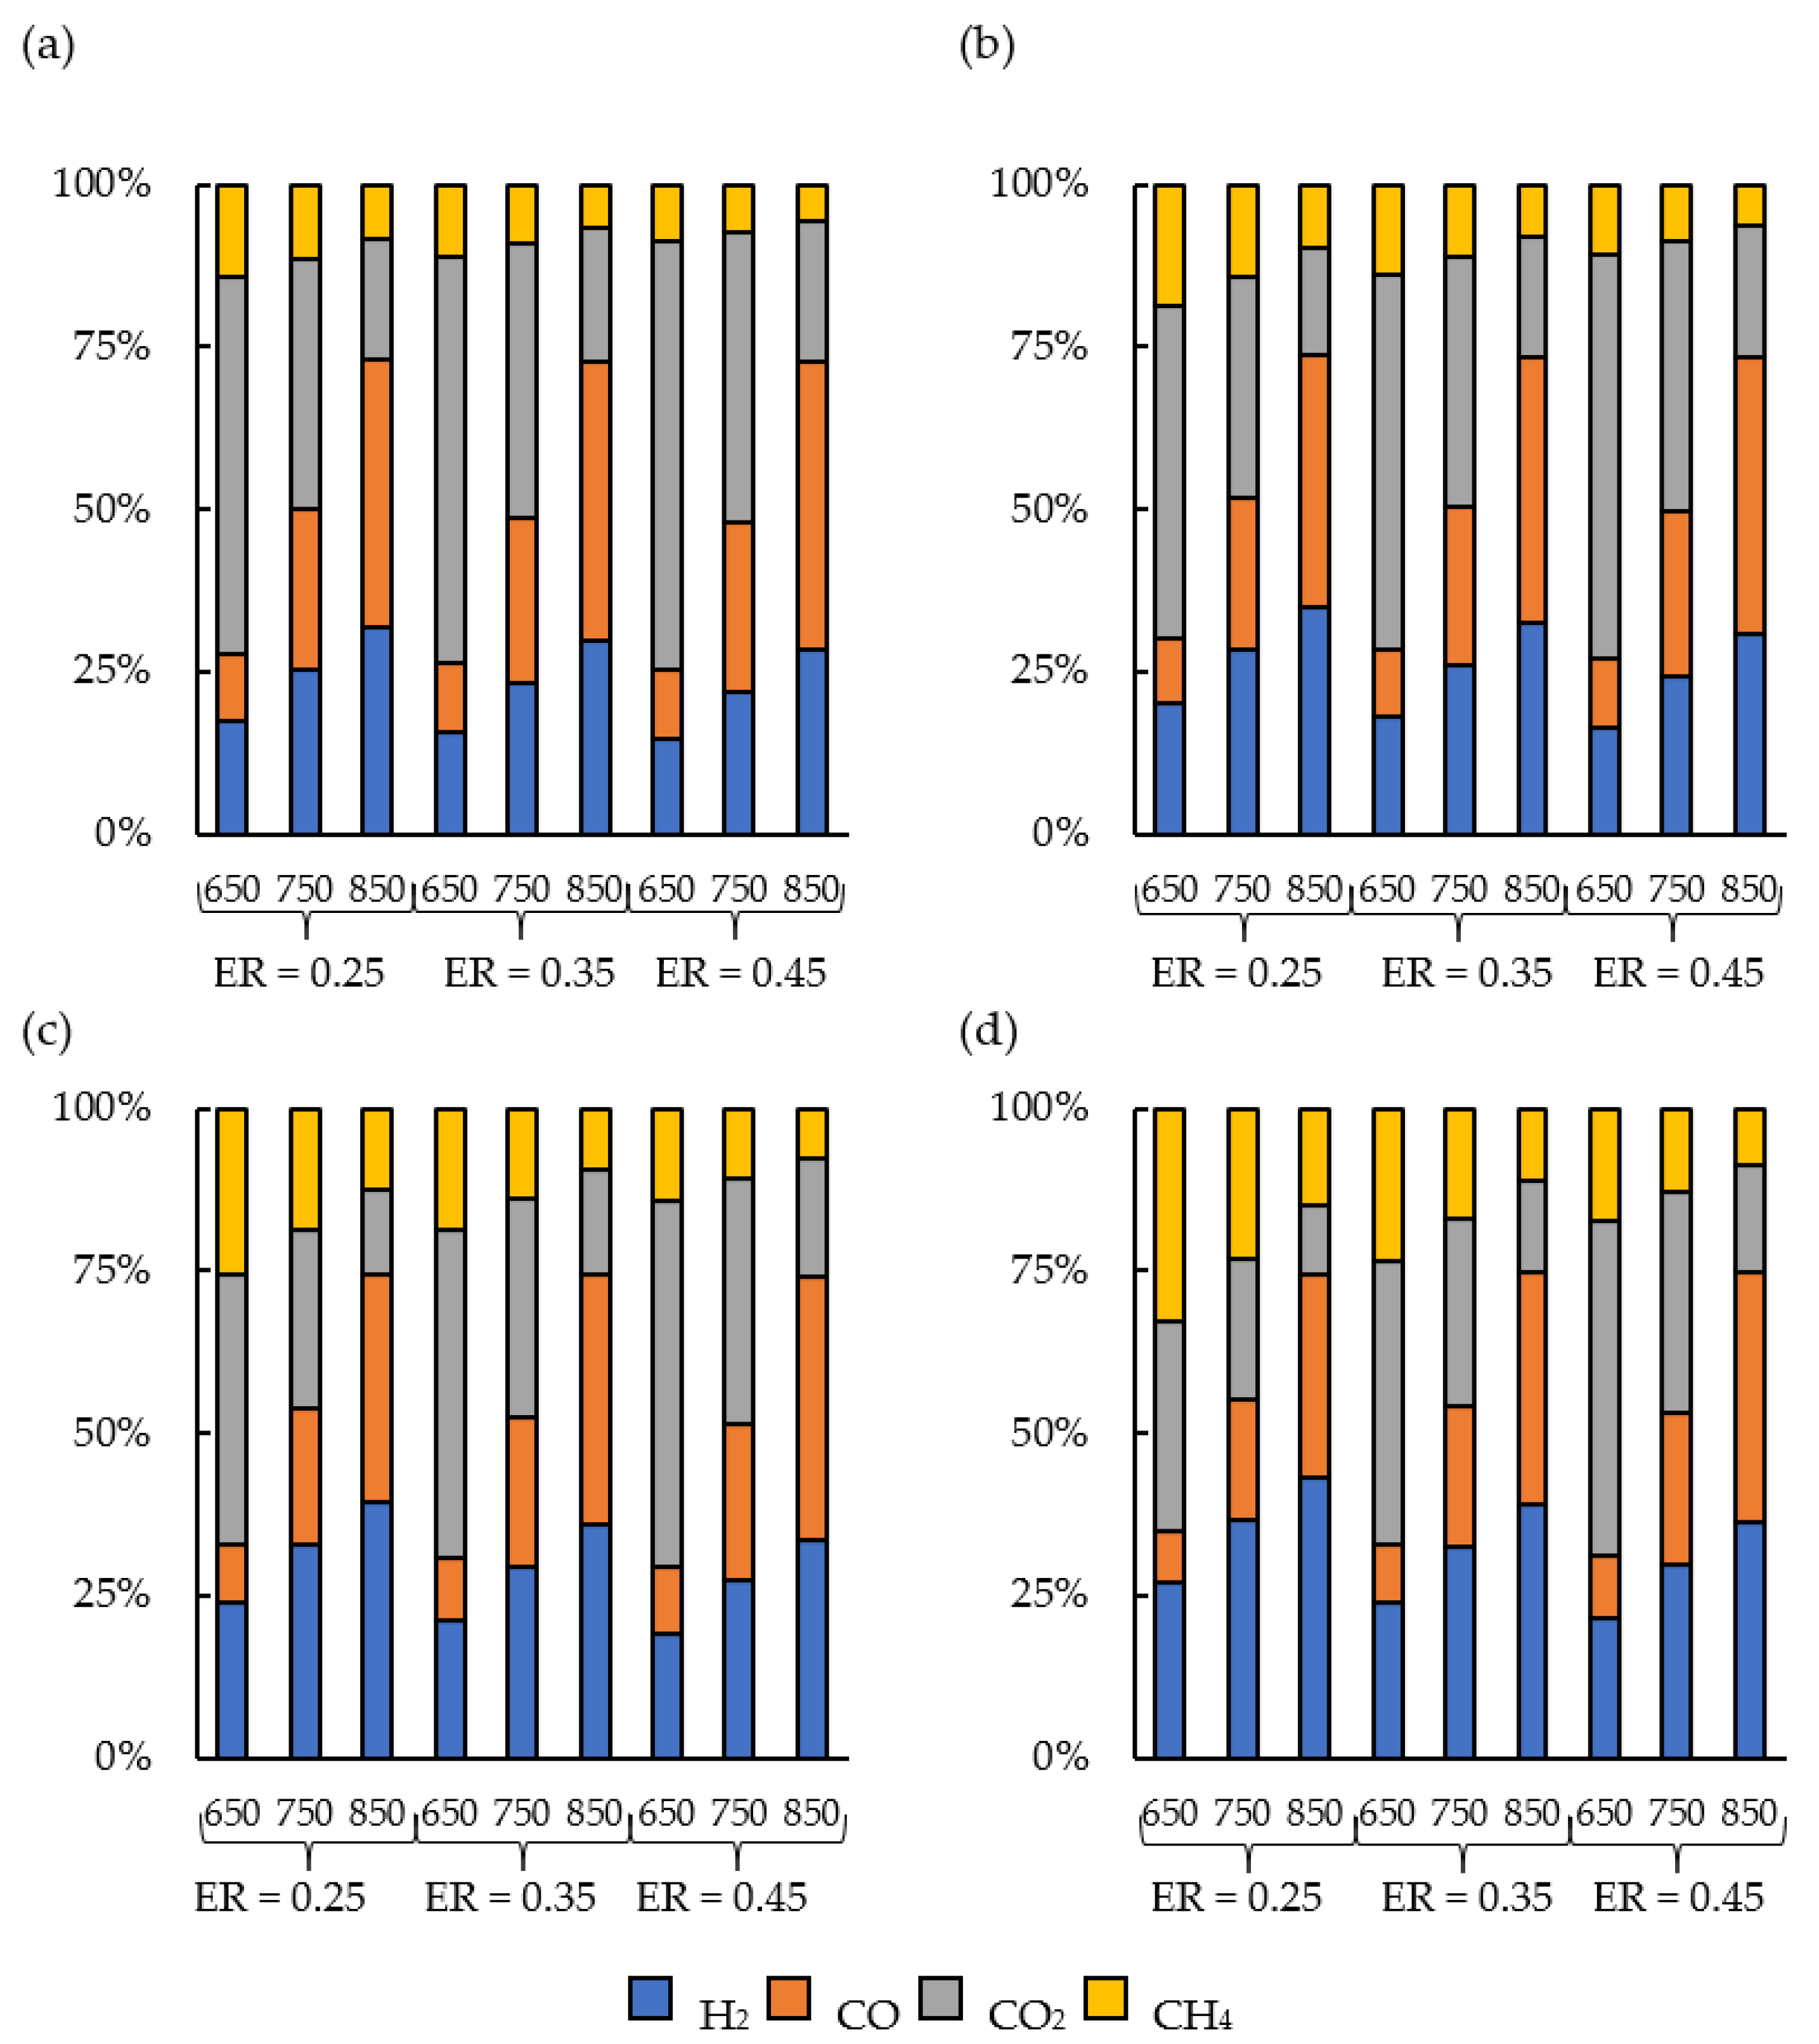
3.4. Effect of the Gas Composition

The effect of the co-gasification conditions in the gas composition were explored by calculating the dry gas composition of the syngas under different conditions (in volume percentages). The dry composition expresses the percentage of H2, CO, CO2, CH4, and N2 in the syngas and can be found in Figure 5, while Figure 6 shows the normalized syngas composition (without considering the N2 in the gas composition); in all cases, the data correspond to simulations using CV with the plastic mixture. It can be seen that the N2 increases with the ER, which is expected, since a higher ER implies more air (hence, N2) is added to the syngas. The N2 decreases with the temperature, not because less N2 is present, but because more of the feedstock decomposes to the other products (H2, CO, CO2, and CH4). On the other hand, the H2 and CO contents increase with the temperature, while the CO2 and CH4 decrease, and the later decreases marginally. Ideally, since CO2 is a byproduct, its contents in the produced syngas should be as low as possible from the production stage or otherwise removed in an additional process stage [55]. With respect to CH4, although the amount of methane produced is not particularly large, it can be reformed to increase the H2 contents in the syngas or recovered for the production of other chemicals of interest [56,57]. Additionally, it can be noted that the N2 increases slightly with the MR; this effect is not associated to an actual increase in the amount of N2 in the syngas, but to a decrease in the percent of CO, CO2, and H2 due to tar formation (which is expressed in g/Nm3 and not volume percent), in agreement with Figure 3.
When observing the normalized (without N2) syngas composition, it can be seen that the gas that has the largest increase with the temperature is CO. The normalized syngas composition allows for a better analysis of the effect of the MR in the syngas composition; when the MR increases, the amount of H2 and CH4 increases, while the CO and CO2 decreases. The highest increase is exhibited by the H2 (from 17% at 650 °C, an ER of 0.25 and MR of 0, to 27% at the same temperature and ER, but an MR of 1.5), while the highest decrease occurs for the CO2 (from 58% at 650 °C, an ER of 0.25 and MR of 0, to 32% at the same temperature and ER, but an MR of 1.5). This indicates that the addition of plastics results in a decrease in the produced CO2, which could result in a decreased environmental burden when considering syngas post-treatment (which is outside of the scope of the present work). Arguably, depending on the end-use of the syngas, the addition of plastics is beneficial to increase the H2 and CO in the syngas (with the exception of SN) and diminish the production of CO2, resulting in less syngas post-treatment [58].
An important parameter for syngas is the H2/CO ratio, since it dictates what kind of usage and/or upgrading the syngas can receive [33,59]. Figure 7 shows the H2/CO ratio of the syngas using the different operation conditions. The results indicate that the H2/CO ratio decreases with the temperature and ER and increases with the increase in MR (as seen when comparing Figure 7a–c). The results indicate that, without the addition of plastics, the biomass that yields the syngas with the highest LHV is SN, but with the addition of plastics, the three algae result in similar quality syngas.
All in all, it can be concluded that the addition of plastics to algae during gasification has advantages in terms of syngas quality and provides an alternative for waste handling. Moreover, since the H2/CO ratio decreases with the temperature, for applications where the H2/CO must be more than 2 (for example, the synthesis of fuel additive), gasification at low temperatures is preferred, even if the syngas has a lower LHV.

3.5. Effect of the Used Biomass

The studied algae have different characteristics; hence, the products from gasification are expected to vary. Figure 8 shows (a) the gas LHV, (b) the gas H2/CO ratio, (c) the gas tar contents, and (d) the CGE from gasifying the biomass at T = 650 °C, ER = 0.25, and a different MR. As discussed in Section 3.1, the syngas LHV increases with the MR (with the amount of plastics in the mixture). However, Figure 8a shows that, when SN is gasified, albeit slightly, the syngas LHV decreases with the increase in the plastic content; this occurs because of the relatively high hydrogen content in SN (the H content in SN, in weight percent, is 8.91%; as a reference, Vassilev et al. [60] analyzed 86 varieties of biomass and found that the average hydrogen content in biomass is 6.3). The same behavior occurs with the CGE (Figure 8b), since the biomass has a higher LHV than the biomass with the plastic mixture. With respect to the tar concentration, although it increases with the MR for all the biomasses, the effect is almost negligible in the CV case due to the higher C and intermediate H contents. Since tar are aromatic hydrocarbons, they require C for their formation, and the tar formation is limited by the presence of C in the biomass sample; this limitation does not occur in the CV case.
Finally, Figure 8d shows that the H2/CO ratio increases with the MR, and that the SN sees an almost negligible increase attributed to its composition.
Importantly, it can be seen that, although for low MRs (almost pure biomass gasification) the gas H2/CO ratio is different for the three algae, when the MR approaches 1, the difference becomes smaller; hence, mixing plastics with biomass in co-gasification can be useful to regulate the produced syngas H2/CO ratio. This might be particularly useful, since some applications require a specific H2/CO ratio (for example, Fischer–Tropsch synthesis).

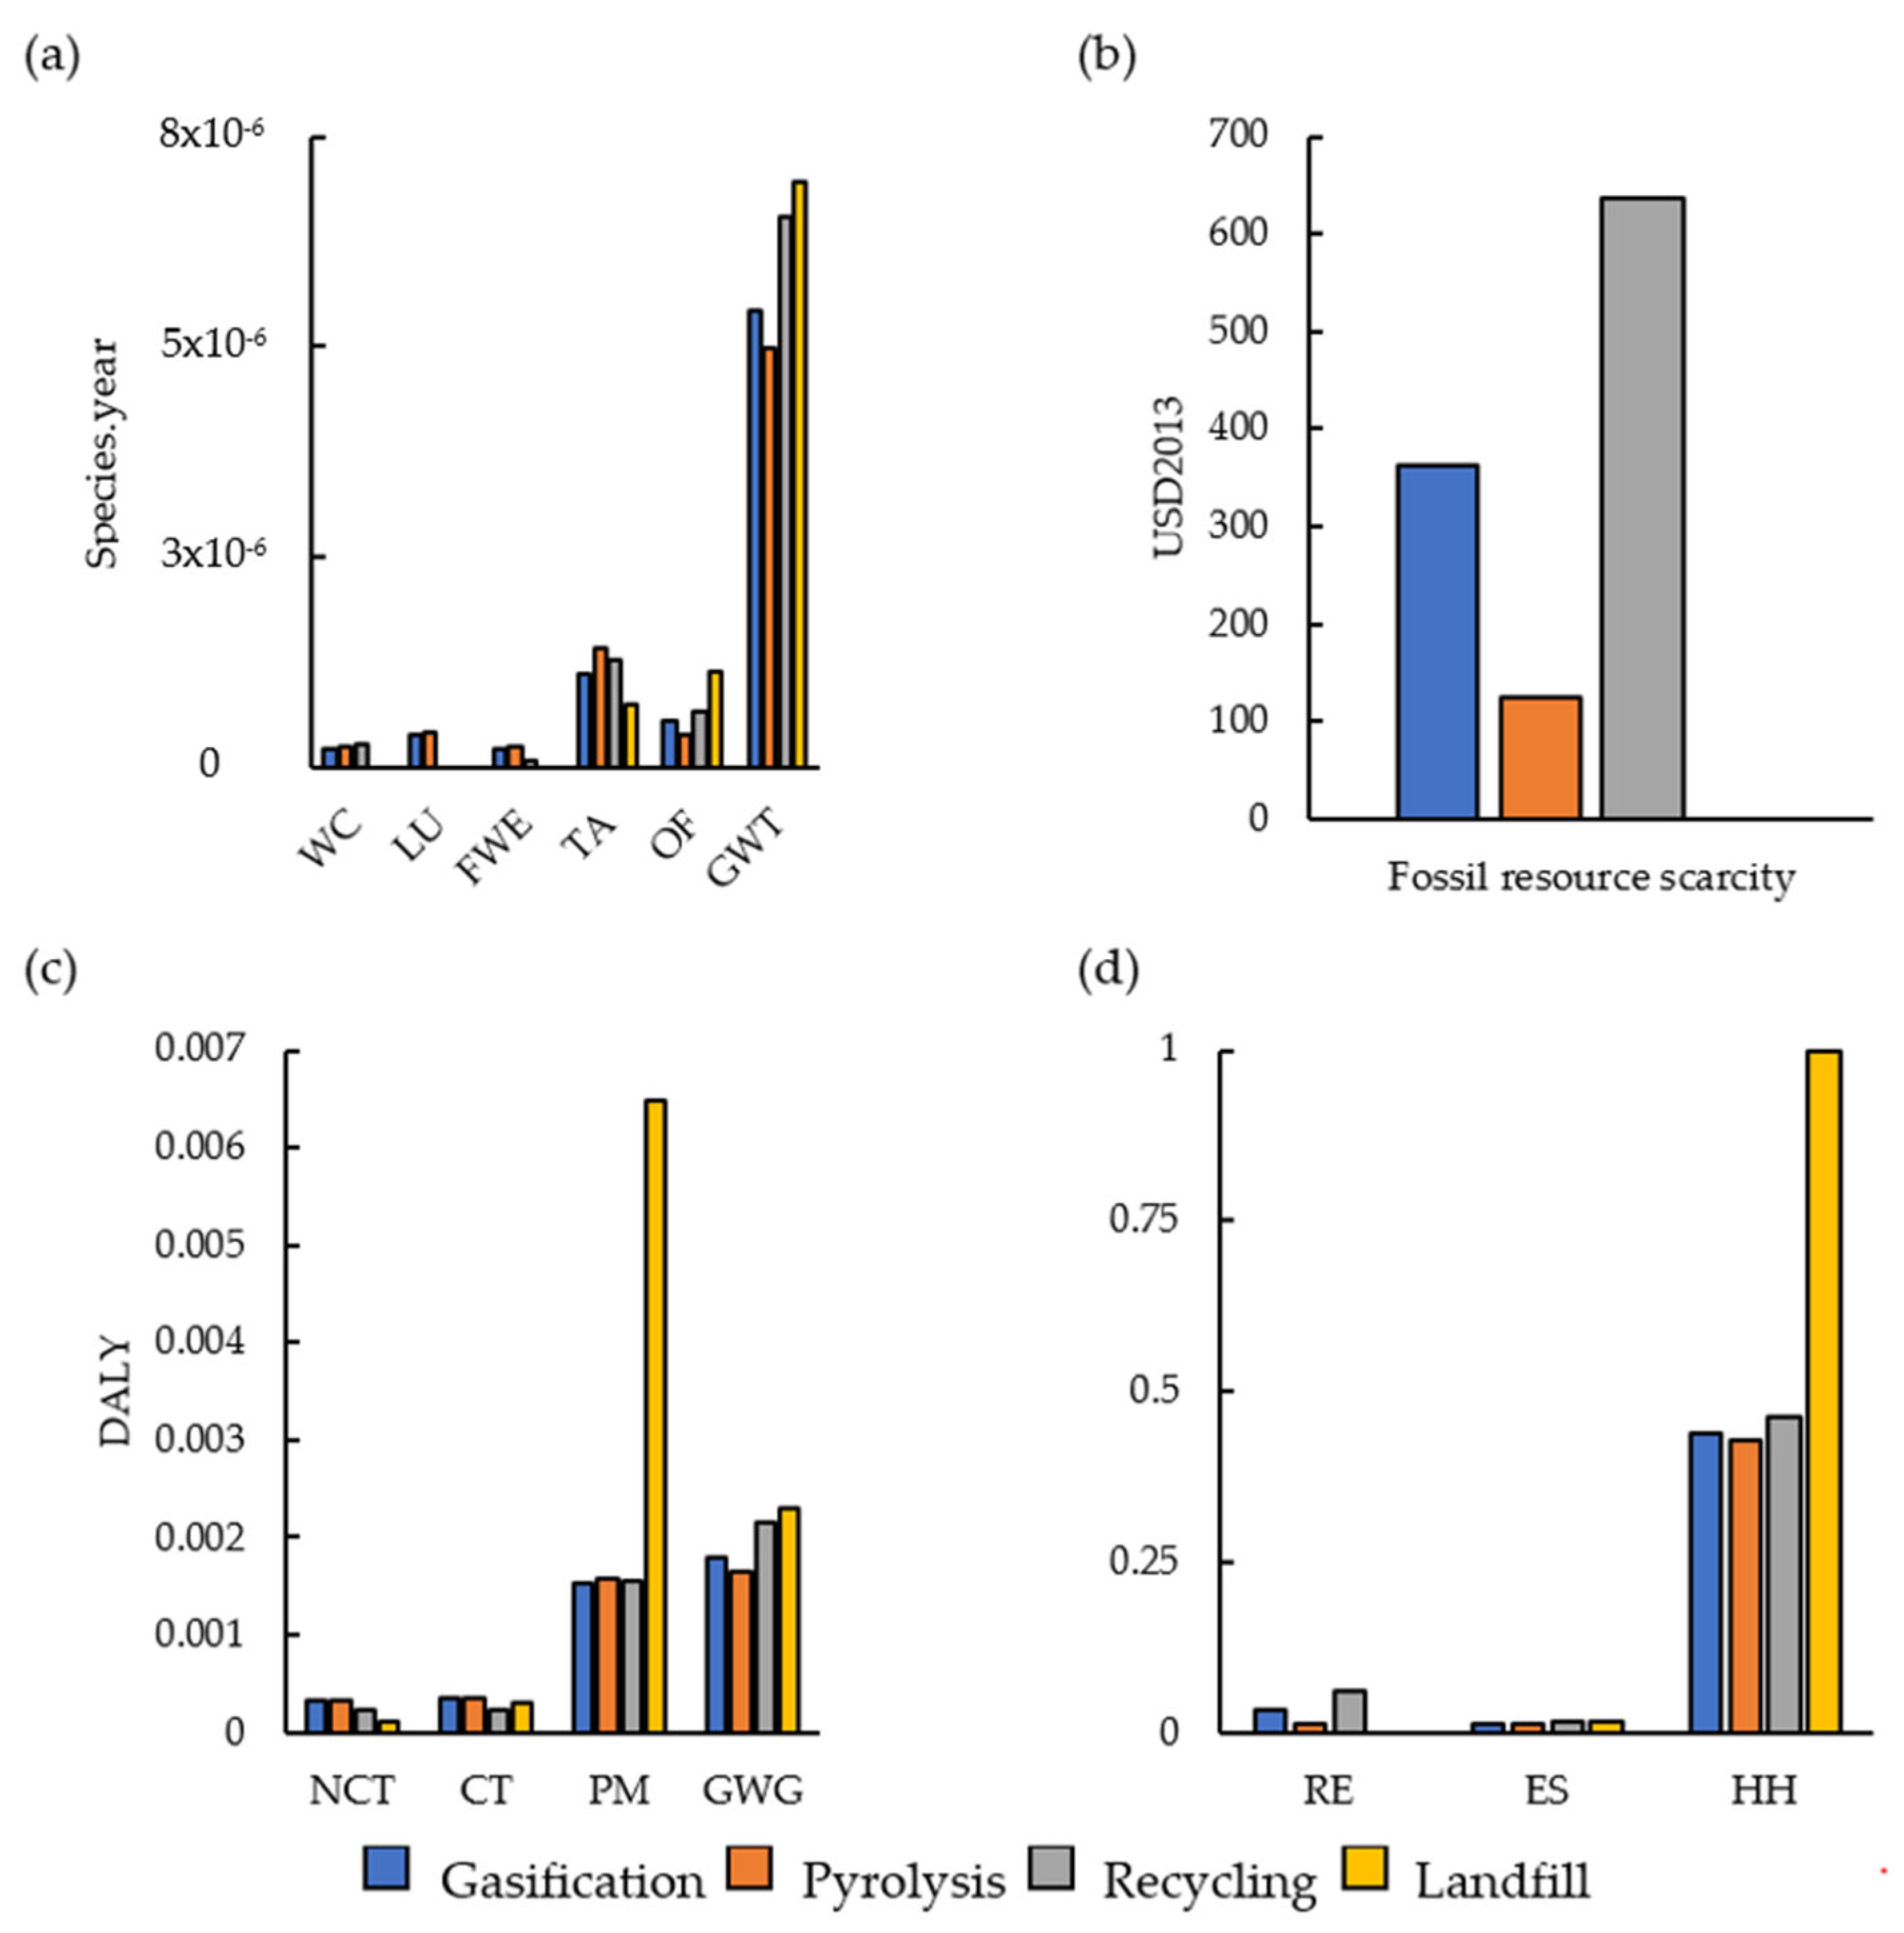
3.6. Life Cycle Assessment

A life cycle assessment of the different end-of-life scenarios for the plastic mixture was conducted. For the environmental burden prevention, it was assumed that the produced syngas has a LHV of 6.2 MJ/Nm3 and that the gas yield was 2.2 Nm3syngas/kgfeedstock, which are the mean values from the different co-gasification simulations from this work. Mean values were used to provide mean LCA results, since the operation conditions of an actual process using sargassum and plastics might be different from the particular cases reported in this work but might be closer to the average values. Figure 9 shows the impact scores of the different processes; Figure 9a portrays the impact to ecosystems (ES), Figure 9b shows the impact to resources (RE), Figure 9c shows the impact to human health (HH), and Figure 9d shows the normalized damage assessment considering the three above categories. Importantly, impact categories whose impact was lower than 1% of the maximum impact are not shown in the graphics. In the impact to ecosystems graphic (Figure 9a), the categories shown are the ones with the largest effect to the species.year indicator, and are water consumption in terrestrial ecosystems (WC), land use (LU), freshwater eutrophication (FWE), terrestrial acidification (TA), ozone formation in terrestrial ecosystems (OF), and global warming in terrestrial ecosystems (GWT). The fossil resource scarcity is the only indicator that contributes significantly to the resources category, while the human health category has contributions from the human non-carcinogenic toxicity (NCT), human carcinogenic toxicity (HCT), fine particulate matter formation (PM), and global warming and human health (GWG) indicators. In Figure 9a, it can be seen that most of the damage occurs in the GWT category; the performance, from worst to best, follows the sequence LF, REC, COG, and PY. With regards to RE, LF and PY are the best performing scenarios, whereas RE exhibits the worst performance (due to the energy consumption in mechanical separation and waste treatment); this burden can be alleviated with the implementation of technologies such as renewable energy [52]. On the other hand, when inspected together, Figure 9c,d show that most of the damage to human health occurs due to particulate matter (since PM in Figure 9c follows the same profile as HH in Figure 9d). Disregarding the LF scenario, PM and GWG are the two most important areas of opportunity. Particularly, fully developed and matured co-gasification or systems could reduce the problems related to particles, since, for example, instruments such as filters could diminish the PM environmental burden. Moreover, the processes could benefit from process intensification, co-generation, and similar technologies [61]. Arguably, REC, COG, and PY have similar environmental performances and are superior to the LF option. Without considering the level of maturity of the different technologies, the use of REC, COG, or PY in a particular location will depend on the end application of the recovered materials, either from mechanical or chemical recovery. For example, if the desired application is the production of polymers, REC or PY should prove superior than COG; on the other hand, for FT synthesis, COG could be the better option when compared to PY [33]. Finally, with mature enough technology, COG can have a particular advantage over REC in developing countries (developing countries have a low recycling rate due to a lack of incentives [62]), where energy and commercial chemical productions can prove attractive.

4. Summary and Conclusions

The co-gasification of three macroalgae species (Chlorella vulgaris, Sargassum natans, and Sargassum flutans) with a mixture of plastics (polypropylene, polyethylene, and polyethylene terephthalate) under various operation conditions was simulated and studied parametrically using an in-house-developed thermodynamic equilibrium model. To ensure the accuracy of the results presented in this work, the developed model was validated by reproducing results from the literature. The gasification temperature, equivalence ratio, and plastics/biomass ratio were varied, and the effects of said variation in the produced gas LHV, tar concentration, gas composition, H2/CO ratio, and process cold gas efficiency were analyzed. In order to measure the environmental performance of the co-gasification of sargassum with the mixed plastics, a life cycle assessment was conducted to compare gasification as an end-of-life option for plastic management.
From the study, the following was concluded:
  • Adding plastics to biomasses for co-gasification can enhance the gas LHV; however, this does not occur when the biomass has a high elemental hydrogen content, as in the case of Sargassum natans. Similarly, the cold gas efficiency of the process increases with the increase in plastic content, except in cases where the biomass has a high hydrogen content.
  • The presence of plastic in the biomass during co-gasification promotes the formation of tar; hence, although the co-gasification of plastics and sargassum can be a useful waste-handling alternative, and increasing the plastic content increases the gas LHV, a high plastic content (high mixing ratios) might not be operational in cases where the application of the produced gas requires a low tar concentration (for example, gas turbines).
  • The addition of plastics for biomass co-gasification can be useful to regulate the produced syngas H2/CO ratio, since increasing the amounts of plastics tends to homogenize the ratio.
  • Increasing the MR increases the amount of H2 and CH4 produced during gasification, while the CO and CO2 contents decrease.
  • The damage assessment information obtained from the life cycle analysis indicate that the gasification of plastics has an impact somewhat similar to that of pyrolysis and recycling. Using the ReCiPe Endpoint methodology, it was found that the categories with the largest impact are human health followed by ecosystem damage, due to the formation of particulate matter and greenhouse gas releases, respectively.
All in all, the results indicate that, although the gasification of macroalgae might lead to otherwise low-quality syngas, co-gasifying them with plastics can be a waste management alternative. The gasification of plastic competes evenly with pyrolysis and recycling as waste management options, but with adequate process integration and technology maturity, it can become feasible. This can be particularly useful, since algae contaminated with microplastics can be limited in terms of management alternatives (for example, algae with microplastics cannot be use for food production).
Future work will include a model of a complete Integrated Gasification Combined Cycle Plant, considering the first and second law of thermodynamics, as well as the environmental performance of the system.

Author Contributions

Conceptualization, D.A.B.-M.; Methodology, D.A.B.-M.; Formal analysis, M.Á.A.-G. and V.M.M.-S.; Writing—original draft preparation, D.A.B.-M.; Writing—review and editing, D.A.B.-M., M.Á.A.-G. and V.M.M.-S.; Visualization, V.M.M.-S. All authors have read and agreed to the published version of the manuscript.

Funding

The APC was funded by the Tecnologico de Monterrey, Scientific Papers Publication Grant #2265.

Data Availability Statement

No data available.

Conflicts of Interest

The authors declare no conflict of interest.

References

  1. Zhang, T.; Wang, J.; Liu, D.; Sun, Z.; Tang, R.; Ma, X.; Feng, Z. Loading of microplastics by two related macroalgae in a sea area where gold and green tides occur simultaneously. Sci. Total Environ. 2022, 814, 152809. [Google Scholar] [CrossRef] [PubMed]
  2. Li, Q.; Su, L.; Ma, C.; Feng, Z.; Shi, H. Plastic debris in coastal macroalgae. Environ. Res. 2022, 205, 112464. [Google Scholar] [CrossRef] [PubMed]
  3. Idumah, C.I.; Nwuzor, I.C. Novel trends in plastic waste management. SN Appl. Sci. 2019, 1, 1402. [Google Scholar] [CrossRef]
  4. PlasticsEurope. Plastics—The Facts 2020; PlasticsEurope: Brussels, Belgium, 2020. [Google Scholar]
  5. OECD. OECD (2022), ‘Global Plastics Outlook’, OECD Environment Statistics (Database); OECD: Paris, France, 2022. [Google Scholar]
  6. Milledge, J.J.; Harvey, P.J. Golden Tides: Problem or Golden Opportunity? The Valorisation of Sargassum from Beach Inundations. J. Mar. Sci. Eng. 2016, 4, 60. [Google Scholar] [CrossRef]
  7. Alvarez-Zeferino, J.C.; Ojeda-Benítez, S.; Cruz-Salas, A.A.; Martínez-Salvador, C.; Vázquez-Morillas, A. Microplastics in Mexican beaches. Resour. Conserv. Recycl. 2020, 155, 104633. [Google Scholar] [CrossRef]
  8. Mendes, M.C.; Navalho, S.; Ferreira, A.; Paulino, C.; Figueiredo, D.; Silva, D.; Gao, F.; Gama, F.; Bombo, G.; Jacinto, R.; et al. Algae as Food in Europe: An Overview of Species Diversity and Their Application. Foods 2022, 11, 1871. [Google Scholar] [CrossRef]
  9. Wells, M.L.; Potin, P.; Craigie, J.S.; Raven, J.A.; Merchant, S.S.; Helliwell, K.E.; Smith, A.G.; Camire, M.E.; Brawley, S.H. Algae as nutritional and functional food sources: Revisiting our understanding. J. Appl. Phycol. 2017, 29, 949–982. [Google Scholar] [CrossRef]
  10. Zhao, X.; You, F. Life Cycle Assessment of Microplastics Reveals Their Greater Environmental Hazards than Mismanaged Polymer Waste Losses. Environ. Sci. Technol. 2022, 56, 11780–11797. [Google Scholar] [CrossRef]
  11. Nava, V.; Leoni, B. A critical review of interactions between microplastics, microalgae and aquatic ecosystem function. Water Res. 2021, 188, 116476. [Google Scholar] [CrossRef]
  12. Feng, Z.; Zhang, T.; Shi, H.; Gao, K.; Huang, W.; Xu, J.; Wang, J.; Wang, R.; Li, J.; Gao, G. Microplastics in bloom-forming macroalgae: Distribution, characteristics and impacts. J. Hazard. Mater. 2020, 397, 122752. [Google Scholar] [CrossRef]
  13. Vuppaladadiyam, A.K.; Vuppaladadiyam, S.S.V.; Awasthi, A.; Sahoo, A.; Rehman, S.; Pant, K.K.; Murugavelh, S.; Huang, Q.; Anthony, E.; Fennel, P.; et al. Biomass pyrolysis: A review on recent advancements and green hydrogen production. Bioresour. Technol. 2022, 364, 128087. [Google Scholar] [CrossRef]
  14. Nguyen, V.G.; Nguyen-Thi, T.X.; Nguyen, P.Q.P.; Tran, V.D.; Ağbulut, Ü.; Nguyen, L.H.; Balasubramanian, D.; Tarelko, W.; Bandh, S.A.; Pham, N.D.K. Recent advances in hydrogen production from biomass waste with a focus on pyrolysis and gasification. Int. J. Hydrogen Energy 2023. [Google Scholar] [CrossRef]
  15. Sikarwar, V.S.; Zhao, M.; Clough, P.; Yao, J.; Zhong, X.; Memon, M.Z.; Shah, N.; Anthony, E.J.; Fennell, P.S. An overview of advances in biomass gasification. Energy Environ. Sci. 2016, 9, 2939–2977. [Google Scholar] [CrossRef]
  16. Tobío-Pérez, I.; Alfonso-Cardero, A.; Díaz-Domínguez, Y.; Pohl, S.; Piloto-Rodríguez, R.; Lapuerta, M. Thermochemical Conversion of Sargassum for Energy Production: A Comprehensive Review. BioEnergy Res. 2022, 15, 1872–1893. [Google Scholar] [CrossRef]
  17. Li, J.; Qiao, Y.; Chen, X.; Zong, P.; Qin, S.; Wu, Y.; Wang, S.; Zhang, H.; Tian, Y. Steam gasification of land, coastal zone and marine biomass by thermal gravimetric analyzer and a free-fall tubular gasifier: Biochars reactivity and hydrogen-rich syngas production. Bioresour. Technol. 2019, 289, 121495. [Google Scholar] [CrossRef]
  18. He, Z.; Saw, W.L.; Lane, D.J.; van Eyk, P.J.; de Nys, R.; Nathan, G.J.; Ashman, P.J. The ash-quartz sand interaction behaviours during steam gasification or combustion of a freshwater and a marine species of macroalgae. Fuel 2020, 263, 116621. [Google Scholar] [CrossRef]
  19. Saebea, D.; Ruengrit, P.; Arpornwichanop, A.; Patcharavorachot, Y. Gasification of plastic waste for synthesis gas production. Energy Rep. 2020, 6, 202–207. [Google Scholar] [CrossRef]
  20. Dogu, O.; Pelucchi, M.; Van de Vijver, R.; Van Steenberge, P.H.; D’Hooge, D.R.; Cuoci, A.; Mehl, M.; Frassoldati, A.; Faravelli, T.; Van Geem, K.M. The chemistry of chemical recycling of solid plastic waste via pyrolysis and gasification: State-of-the-art, challenges, and future directions. Prog. Energy Combust. Sci. 2021, 84, 100901. [Google Scholar] [CrossRef]
  21. Mariyam, S.; Shahbaz, M.; Al-Ansari, T.; Mackey, H.R.; McKay, G. A critical review on co-gasification and co-pyrolysis for gas production. Renew. Sustain. Energy Rev. 2022, 161, 112349. [Google Scholar] [CrossRef]
  22. Kositkanawuth, K.; Bhatt, A.; Sattler, M.; Dennis, B. Renewable Energy from Waste: Investigation of Co-pyrolysis between Sargassum Macroalgae and Polystyrene. Energy Fuels 2017, 31, 5088–5096. [Google Scholar] [CrossRef]
  23. Cheng, Z.; Gao, X.; Ma, Z.; Guo, X.; Wang, J.; Luan, P.; He, S.; Yan, B.; Chen, G. Studies on synergistic effects in co-pyrolysis of sargassum and poplar: Thermal behavior and kinetics. J. Anal. Appl. Pyrolysis 2022, 167, 105660. [Google Scholar] [CrossRef]
  24. Halba, A.; Thengane, S.K.; Arora, P. A Critical Outlook on Lignocellulosic Biomass and Plastics Co-Gasification: A Mini-Review. Energy Fuels 2023, 37, 19–35. [Google Scholar] [CrossRef]
  25. Inayat, M.; Sulaiman, S.A.; Kurnia, J.C.; Shahbaz, M. Effect of various blended fuels on syngas quality and performance in catalytic co-gasification: A review. Renew. Sustain. Energy Rev. 2019, 105, 252–267. [Google Scholar] [CrossRef]
  26. Fazil, A.; Kumar, S.; Mahajani, S.M. Downdraft co-gasification of high ash biomass and plastics. Energy 2022, 243, 123055. [Google Scholar] [CrossRef]
  27. Qin, Y.-H.; Han, Q.-Q.; Zhao, Z.-B.; Du, Z.-Y.; Feng, J.; Li, W.-Y.; Vassilev, S.V.; Vassileva, C.G. Impact of biomass addition on organic structure and mineral matter of char during coal-biomass co-gasification under CO2 atmosphere. Fuel 2017, 202, 556–562. [Google Scholar] [CrossRef]
  28. Brown, R.C. Thermochemical Processing of Biomass: Conversion into Fuels, Chemicals and Power; John Wiley & Sons, Ltd.: New York, NY, USA, 2011. [Google Scholar] [CrossRef]
  29. Basu, P. Biomass Gasification, Pyrolysis and Torrefaction. In Biomass Gasification, Pyrolysis and Torrefaction; Academic Press: Cambridge, MA, USA, 2013; pp. 439–455. [Google Scholar] [CrossRef]
  30. Fries, E.; Dekiff, J.H.; Willmeyer, J.; Nuelle, M.-T.; Ebert, M.; Remy, D. Identification of polymer types and additives in marine microplastic particles using pyrolysis-GC/MS and scanning electron microscopy. Environ. Sci. Process. Impacts 2013, 15, 1949–1956. [Google Scholar] [CrossRef]
  31. Hale, R.C.; Seeley, M.E.; La Guardia, M.J.; Mai, L.; Zeng, E.Y. A Global Perspective on Microplastics. J. Geophys. Res. Oceans 2020, 125, e2018JC014719. [Google Scholar] [CrossRef]
  32. Rios, M.L.V.; González, A.M.; Lora, E.E.S.; del Olmo, O.A.A. Reduction of tar generated during biomass gasification: A review. Biomass-Bioenergy 2018, 108, 345–370. [Google Scholar] [CrossRef]
  33. Zhang, X. Essential scientific mapping of the value chain of thermochemically converted second-generation bio-fuels. Green Chem. 2016, 18, 5086–5117. [Google Scholar] [CrossRef]
  34. Hellweg, S. Time- and site-dependent life cycle assessment of thermal waste treatment processes. Int. J. Life Cycle Assess. 2001, 6, 46. [Google Scholar] [CrossRef]
  35. Antelava, A.; Damilos, S.; Hafeez, S.; Manos, G.; Al-Salem, S.M.; Sharma, B.K.; Kohli, K.; Constantinou, A. Plastic Solid Waste (PSW) in the Context of Life Cycle Assessment (LCA) and Sustainable Management. Environ. Manag. 2019, 64, 230–244. [Google Scholar] [CrossRef] [PubMed]
  36. Koukkari, P. Introduction to Constrained Gibbs Energy Methods in Process and Materials. 2014. Available online: http://www.vtt.fi/inf/pdf/technology/2014/T160.pdf (accessed on 15 August 2023).
  37. Buentello-Montoya, D.; Zhang, X. An Energy and Exergy Analysis of Biomass Gasification Integrated with a Char-Catalytic Tar Reforming System. Energy Fuels 2019, 33, 8746–8757. [Google Scholar] [CrossRef]
  38. Puig-Arnavat, M.; Bruno, J.C.; Coronas, A. Review and analysis of biomass gasification models. Renew. Sustain. Energy Rev. 2010, 14, 2841–2851. [Google Scholar] [CrossRef]
  39. Jess, A. Mechanisms and Kinetics of Thermal Reactions of Aromatics From Pyrolysis of Solid Fuels. Fuel 1996, 75, 1441–1448. [Google Scholar] [CrossRef]
  40. Frenklach, M. Reaction mechanism of soot formation in flames. Phys. Chem. Chem. Phys. 2002, 4, 2028–2037. [Google Scholar] [CrossRef]
  41. Lim, Y.I.; Lee, U.D. Quasi-equilibrium thermodynamic model with empirical equations for air-steam biomass gasification in fluidized-beds. Fuel Process. Technol. 2014, 128, 199–210. [Google Scholar] [CrossRef]
  42. Parker, D.S.N.; Kaiser, R.I.; Troy, T.P.; Ahmed, M. Hydrogen Abstraction/Acetylene Addition Revealed. Angew. Chem. Int. Ed. 2014, 53, 7740–7744. [Google Scholar] [CrossRef]
  43. Aznar, M.P.; Caballero, M.A.; Sancho, J.A.; Francés, E. Plastic waste elimination by co-gasification with coal and biomass in fluidized bed with air in pilot plant. Fuel Process. Technol. 2006, 87, 409–420. [Google Scholar] [CrossRef]
  44. Aydin, E.S.; Yucel, O.; Sadikoglu, H. Development of a semi-empirical equilibrium model for downdraft gasification systems. Energy 2017, 130, 86–98. [Google Scholar] [CrossRef]
  45. Cho, M.-H.; Mun, T.-Y.; Choi, Y.-K.; Kim, J.-S. Two-stage air gasification of mixed plastic waste: Olivine as the bed material and effects of various additives and a nickel-plated distributor on the tar removal. Energy 2014, 70, 128–134. [Google Scholar] [CrossRef]
  46. Gai, C.; Dong, Y. Experimental study on non-woody biomass gasification in a downdraft gasifier. Int. J. Hydrogen Energy 2012, 37, 4935–4944. [Google Scholar] [CrossRef]
  47. Jayah, T.; Aye, L.; Fuller, R.; Stewart, D. Computer simulation of a downdraft wood gasifier for tea drying. Biomass-Bioenergy 2003, 25, 459–469. [Google Scholar] [CrossRef]
  48. Kramb, J.; Konttinen, J.; Gómez-Barea, A.; Moilanen, A.; Umeki, K. Modeling biomass char gasification kinetics for improving prediction of carbon conversion in a fluidized bed gasifier. Fuel 2014, 132, 107–115. [Google Scholar] [CrossRef]
  49. Tuomi, S.; Kaisalo, N.; Simell, P.; Kurkela, E. Effect of pressure on tar decomposition activity of different bed materials in biomass gasification conditions. Fuel 2015, 158, 293–305. [Google Scholar] [CrossRef]
  50. Xiao, R.; Jin, B.; Zhou, H.; Zhong, Z.; Zhang, M. Air gasification of polypropylene plastic waste in fluidized bed gasifier. Energy Convers. Manag. 2007, 48, 778–786. [Google Scholar] [CrossRef]
  51. ISO 14040; Environmental Assessment—Life Cycle Assessment—Principles and Framework. International Organization for Standardization: Geneva, Switzerland, 2009; 1997, pp. 1–20.
  52. Huijbregts, M.A.J.; Steinmann, Z.; Elshout, P.M.F.; Verones, F.; Vieira, M.; Zijp, M.; Hollander, A.; van Zelm, R. ReCiPe 2016 v1.1. RIVM Report 2016-0104. 2017, p. 201. Available online: www.rivm.nl/en (accessed on 20 July 2023).
  53. Jeswani, H.; Krüger, C.; Russ, M.; Horlacher, M.; Antony, F.; Hann, S.; Azapagic, A. Life cycle environmental impacts of chemical recycling via pyrolysis of mixed plastic waste in comparison with mechanical recycling and energy recovery. Sci. Total Environ. 2021, 769, 144483. [Google Scholar] [CrossRef]
  54. Khoo, H.H. LCA of plastic waste recovery into recycled materials, energy and fuels in Singapore. Resour. Conserv. Recycl. 2019, 145, 67–77. [Google Scholar] [CrossRef]
  55. Ardolino, F.; Lodato, C.; Astrup, T.F.; Arena, U. Energy recovery from plastic and biomass waste by means of fluidized bed gasification: A life cycle inventory model. Energy 2018, 165, 299–314. [Google Scholar] [CrossRef]
  56. Wernet, G.; Bauer, C.; Steubing, B.; Reinhard, J.; Moreno-Ruiz, E.; Weidema, B. The ecoinvent database version 3 (part I): Overview and methodology. Int. J. Life Cycle Assess. 2016, 21, 1218–1230. [Google Scholar] [CrossRef]
  57. Acharya, C.K.; Jiang, F.; Liao, C.-H.; Fitzgerald, P.; Vecchio, K.S.; Cattolica, R.J. Tar and CO2 removal from simulated producer gas with activated carbon and charcoal. Fuel Process. Technol. 2013, 106, 201–208. [Google Scholar] [CrossRef]
  58. Abdoulmoumine, N.; Adhikari, S.; Kulkarni, A.; Chattanathan, S. A review on biomass gasification syngas cleanup. Appl. Energy 2015, 155, 294–307. [Google Scholar] [CrossRef]
  59. Liu, Q.; Hu, C.; Peng, B.; Liu, C.; Li, Z.; Wu, K.; Zhang, H.; Xiao, R. High H2/CO ratio syngas production from chemical looping co-gasification of biomass and polyethylene with CaO/Fe2O3 oxygen carrier. Energy Convers. Manag. 2019, 199, 111951. [Google Scholar] [CrossRef]
  60. Vassilev, S.V.; Baxter, D.; Andersen, L.K.; Vassileva, C.G. An overview of the chemical composition of biomass. Fuel 2010, 89, 913–933. [Google Scholar] [CrossRef]
  61. Burra, K.; Gupta, A. Synergistic effects in steam gasification of combined biomass and plastic waste mixtures. Appl. Energy 2018, 211, 230–236. [Google Scholar] [CrossRef]
  62. Schwarz, A.E.; Ligthart, T.N.; Bizarro, D.G.; De Wild, P.; Vreugdenhil, B.; van Harmelen, T. Plastic recycling in a circular economy; determining environmental performance through an LCA matrix model approach. Waste Manag. 2021, 121, 331–342. [Google Scholar] [CrossRef]
Figure 1. Lower heating values of the syngas produced from the gasification of (a) CV, (b) SN, and (c) SF as a function of the temperature and equivalence ratio.
Energies 16 06819 g001
Figure 2. Lower heating values of the syngas produced from the co-gasification of a mixture of plastics with (a) CV, (b) SN, and (c) SF as a function of the temperature and equivalence ratio.
Energies 16 06819 g002
Figure 3. Tar (benzene) concentration in the syngas produced from the co-gasification of a mixture of plastics with (a) CV, (b) SN, and (c) SF as a function of the temperature and equivalence ratio.
Energies 16 06819 g003
Figure 4. Cold gas efficiency estimated from the co-gasification of a mixture of plastics with (a) CV, (b) SN, and (c) SF as a function of the temperature and equivalence ratio.
Energies 16 06819 g004
Figure 5. Syngas percent composition, on a dry basis, from the co-gasification of CV at (a) MR = 0, (b) MR = 0.25, (c) MR = 0.75, and (d) MR = 1.5.
Energies 16 06819 g005
Figure 6. Normalized syngas percent composition, on a dry basis, from the co-gasification of CV at (a) MR = 0, (b) MR = 0.25, (c) MR = 0.75, and (d) MR = 1.5.
Energies 16 06819 g006
Figure 7. H2/CO ratio in the syngas produced from the co-gasification of a mixture of plastics with (a) CV, (b) SN, and (c) SF as a function of the temperature and equivalence ratio.
Energies 16 06819 g007
Figure 8. (a) Lower heating value, (b) cold gas efficiency, (c) tar concentration, and (d) H2/CO ratio, calculated in the simulations from the co-gasification of a mixture of plastics with CV, SN, and SF at 650 °C and an equivalence ratio of 0.25 as a function of the MR.
Energies 16 06819 g008
Figure 9. Results from the LCA using the ReCiPe Endpoint method. (a) Impact to the ecosystem, (b) impact to resources, (c) impact to human health, and (d) normalized impacts by category.
Energies 16 06819 g009
Table 1. Ultimate analysis (in % weight) of the biomass feedstock used in the simulations.
ElementAlgae Species
Chlorella vulgarisSargassum natansSargassum fluitans
C52.139.7838
H6.58.915.5
O30.943.8955
N9.955.481.5
S0.551.920
Table 2. Details on the feedstock from the experiments used to validate the model and validation by experiment.
ReferenceGasifier TypeFeedstock CompositionMAE
CHON
[47]FB53.25.537.10.32.407
[44]DD43.835.9545.010.971.556
[46]FB51.06.042.80.14.017
[45]DD50.66.50.242.03.601
[48]FB86.4212.2800.722.045
[43]FB80.812.85.10.21.038
[26]DD42.385.2435.411.780.019
[26]DD85.3214.68000.019
Table 3. Validation of the model by species.
SpeciesMAE
H2 a1.872
CO a1.165
CO2 a1.142
CH4 a1.015
N2 a0.044
Tar b2.5
a In volume percent b In g/Nm3.
Disclaimer/Publisher’s Note: The statements, opinions and data contained in all publications are solely those of the individual author(s) and contributor(s) and not of MDPI and/or the editor(s). MDPI and/or the editor(s) disclaim responsibility for any injury to people or property resulting from any ideas, methods, instructions or products referred to in the content.

