

Techno-Economic Analysis of Hydrogen–Natural Gas Blended Fuels for 400 MW Combined Cycle Power Plants (CCPPs)


Abstract
:1. Introduction
2. Methodology
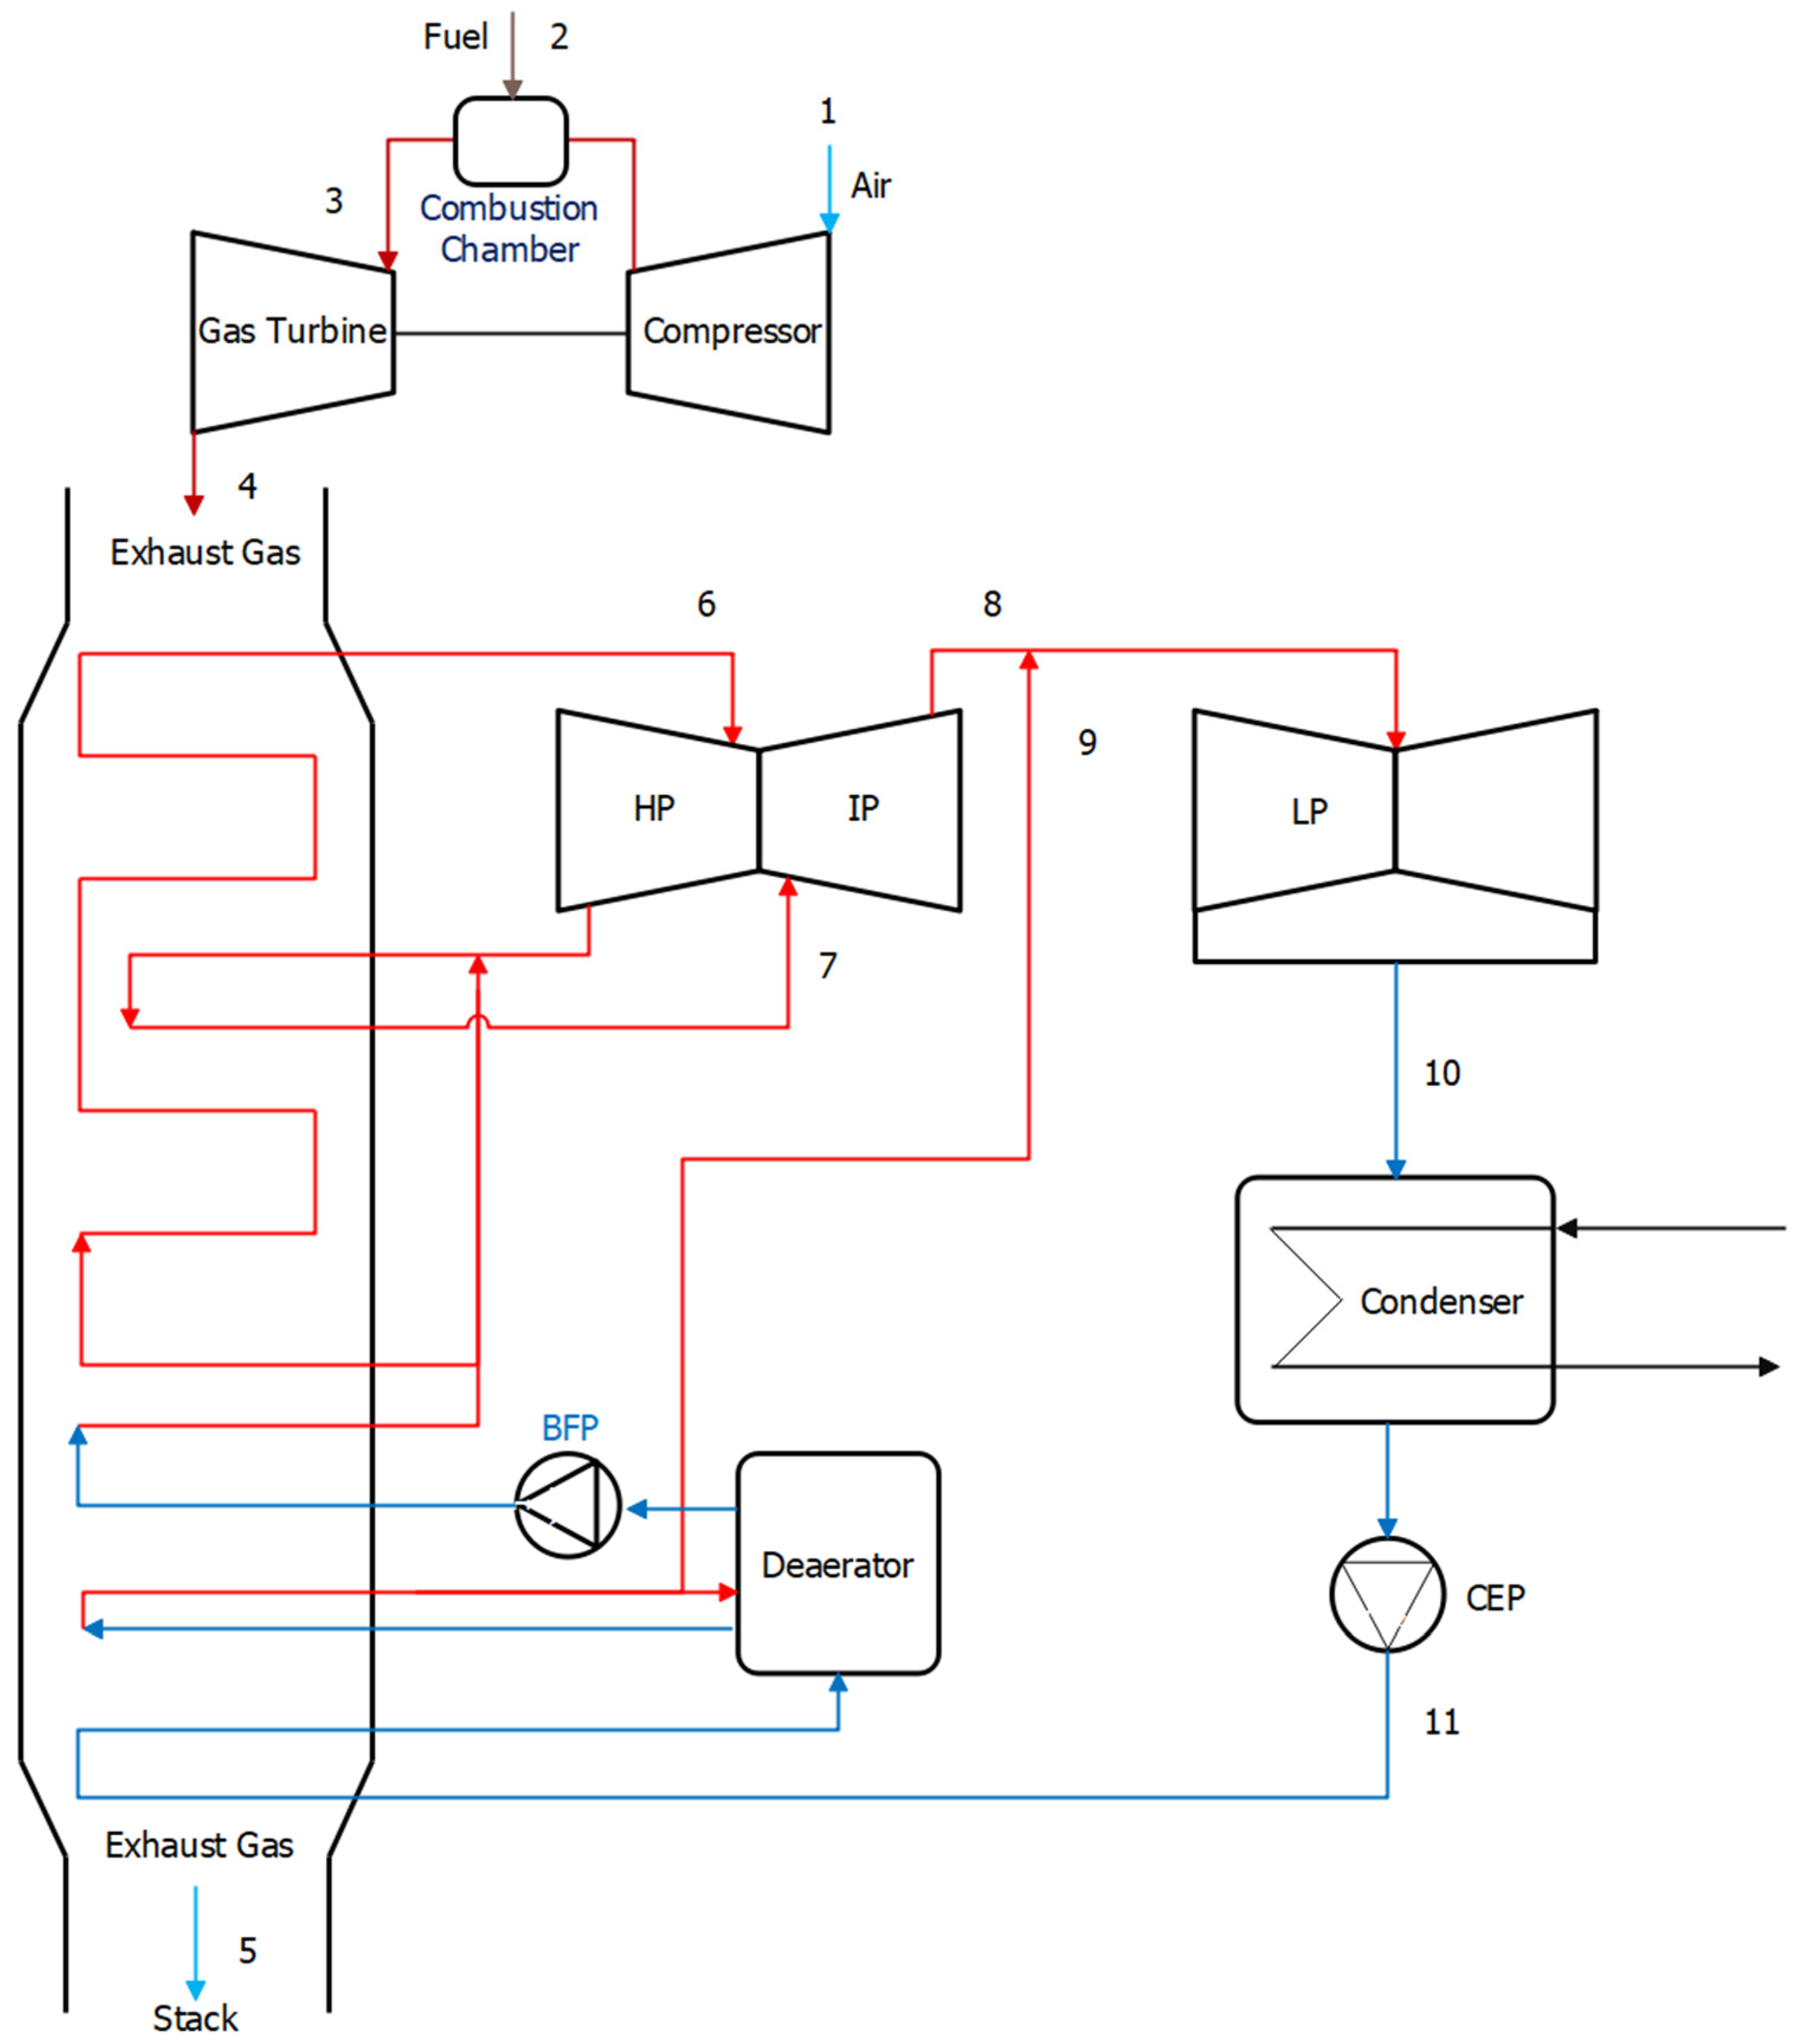
2.1. Process Model
2.1.1. Assumption of Combined Cycle Power Plant (CCPP)
- The flow is in a steady state.
- Air and combustion products are assumed as ideal gas.
- The gas turbine and steam turbine models are operated at a steady state.
- Heat transfer between the components of the plant and the environment is negligible.
2.1.2. Model simulation
2.2. Economic Model
2.2.1. Methodology of Levelized Cost of Electricity (LCOE)
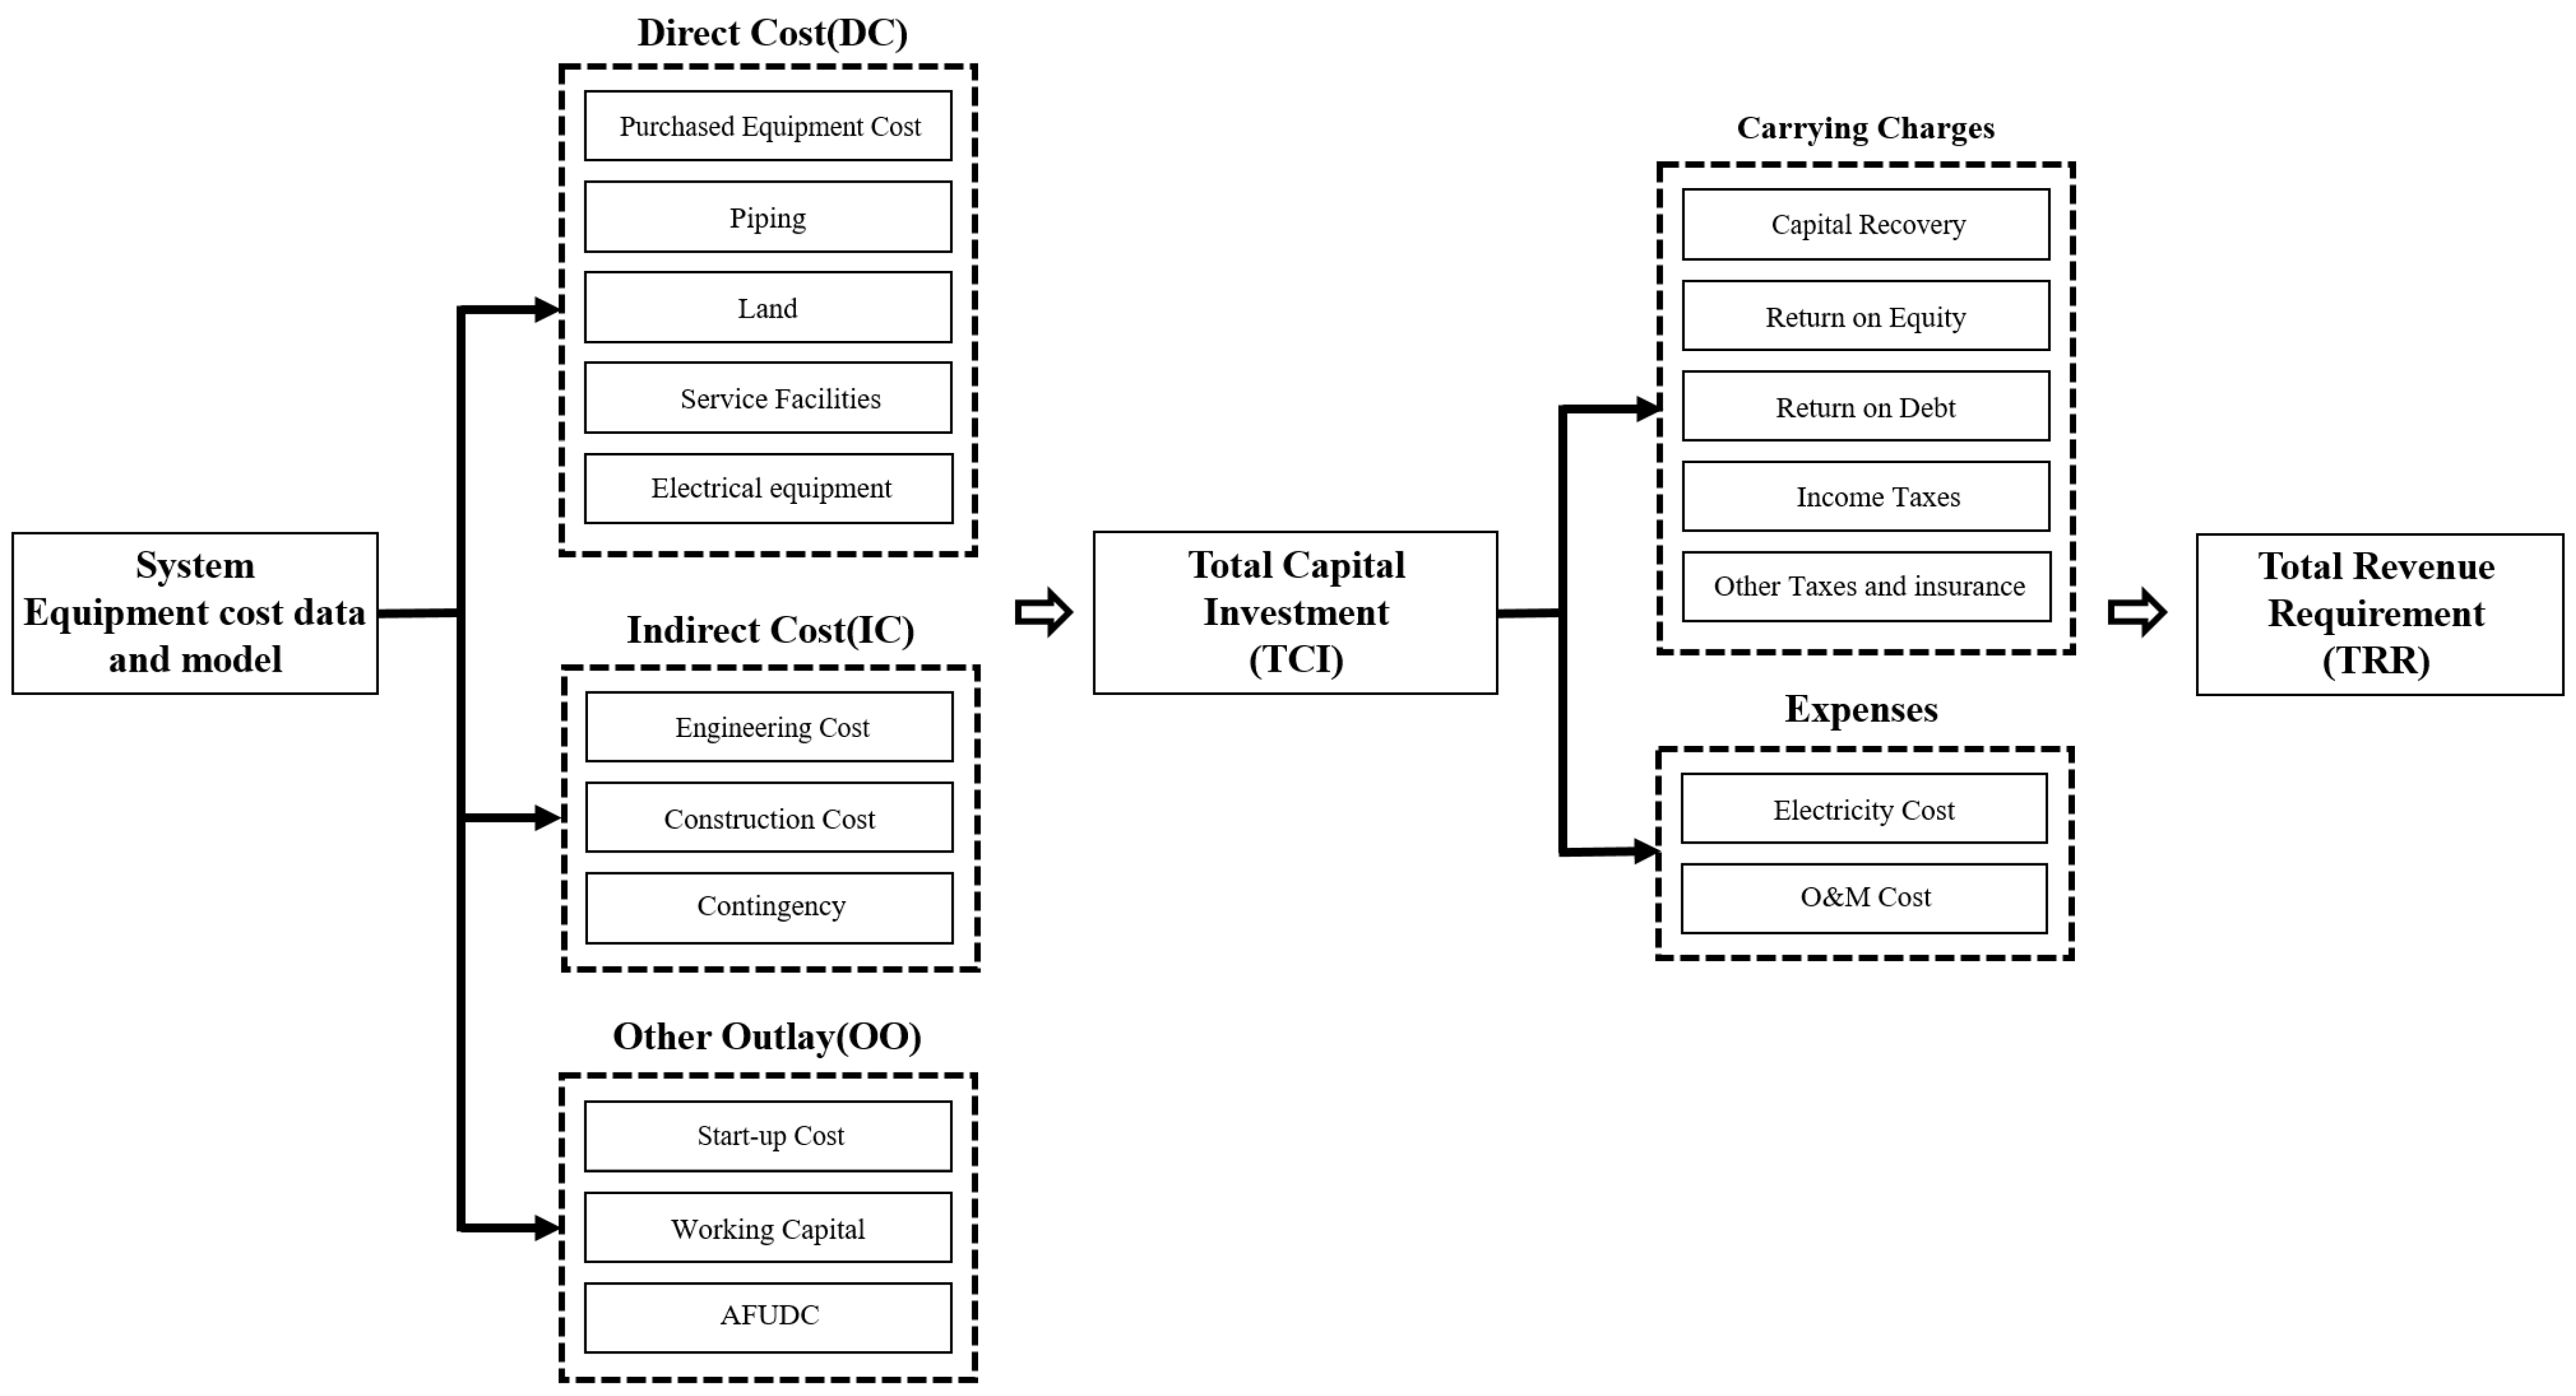
2.2.2. Capital Cost Calculation
2.2.3. Model Development
3. Analysis Results
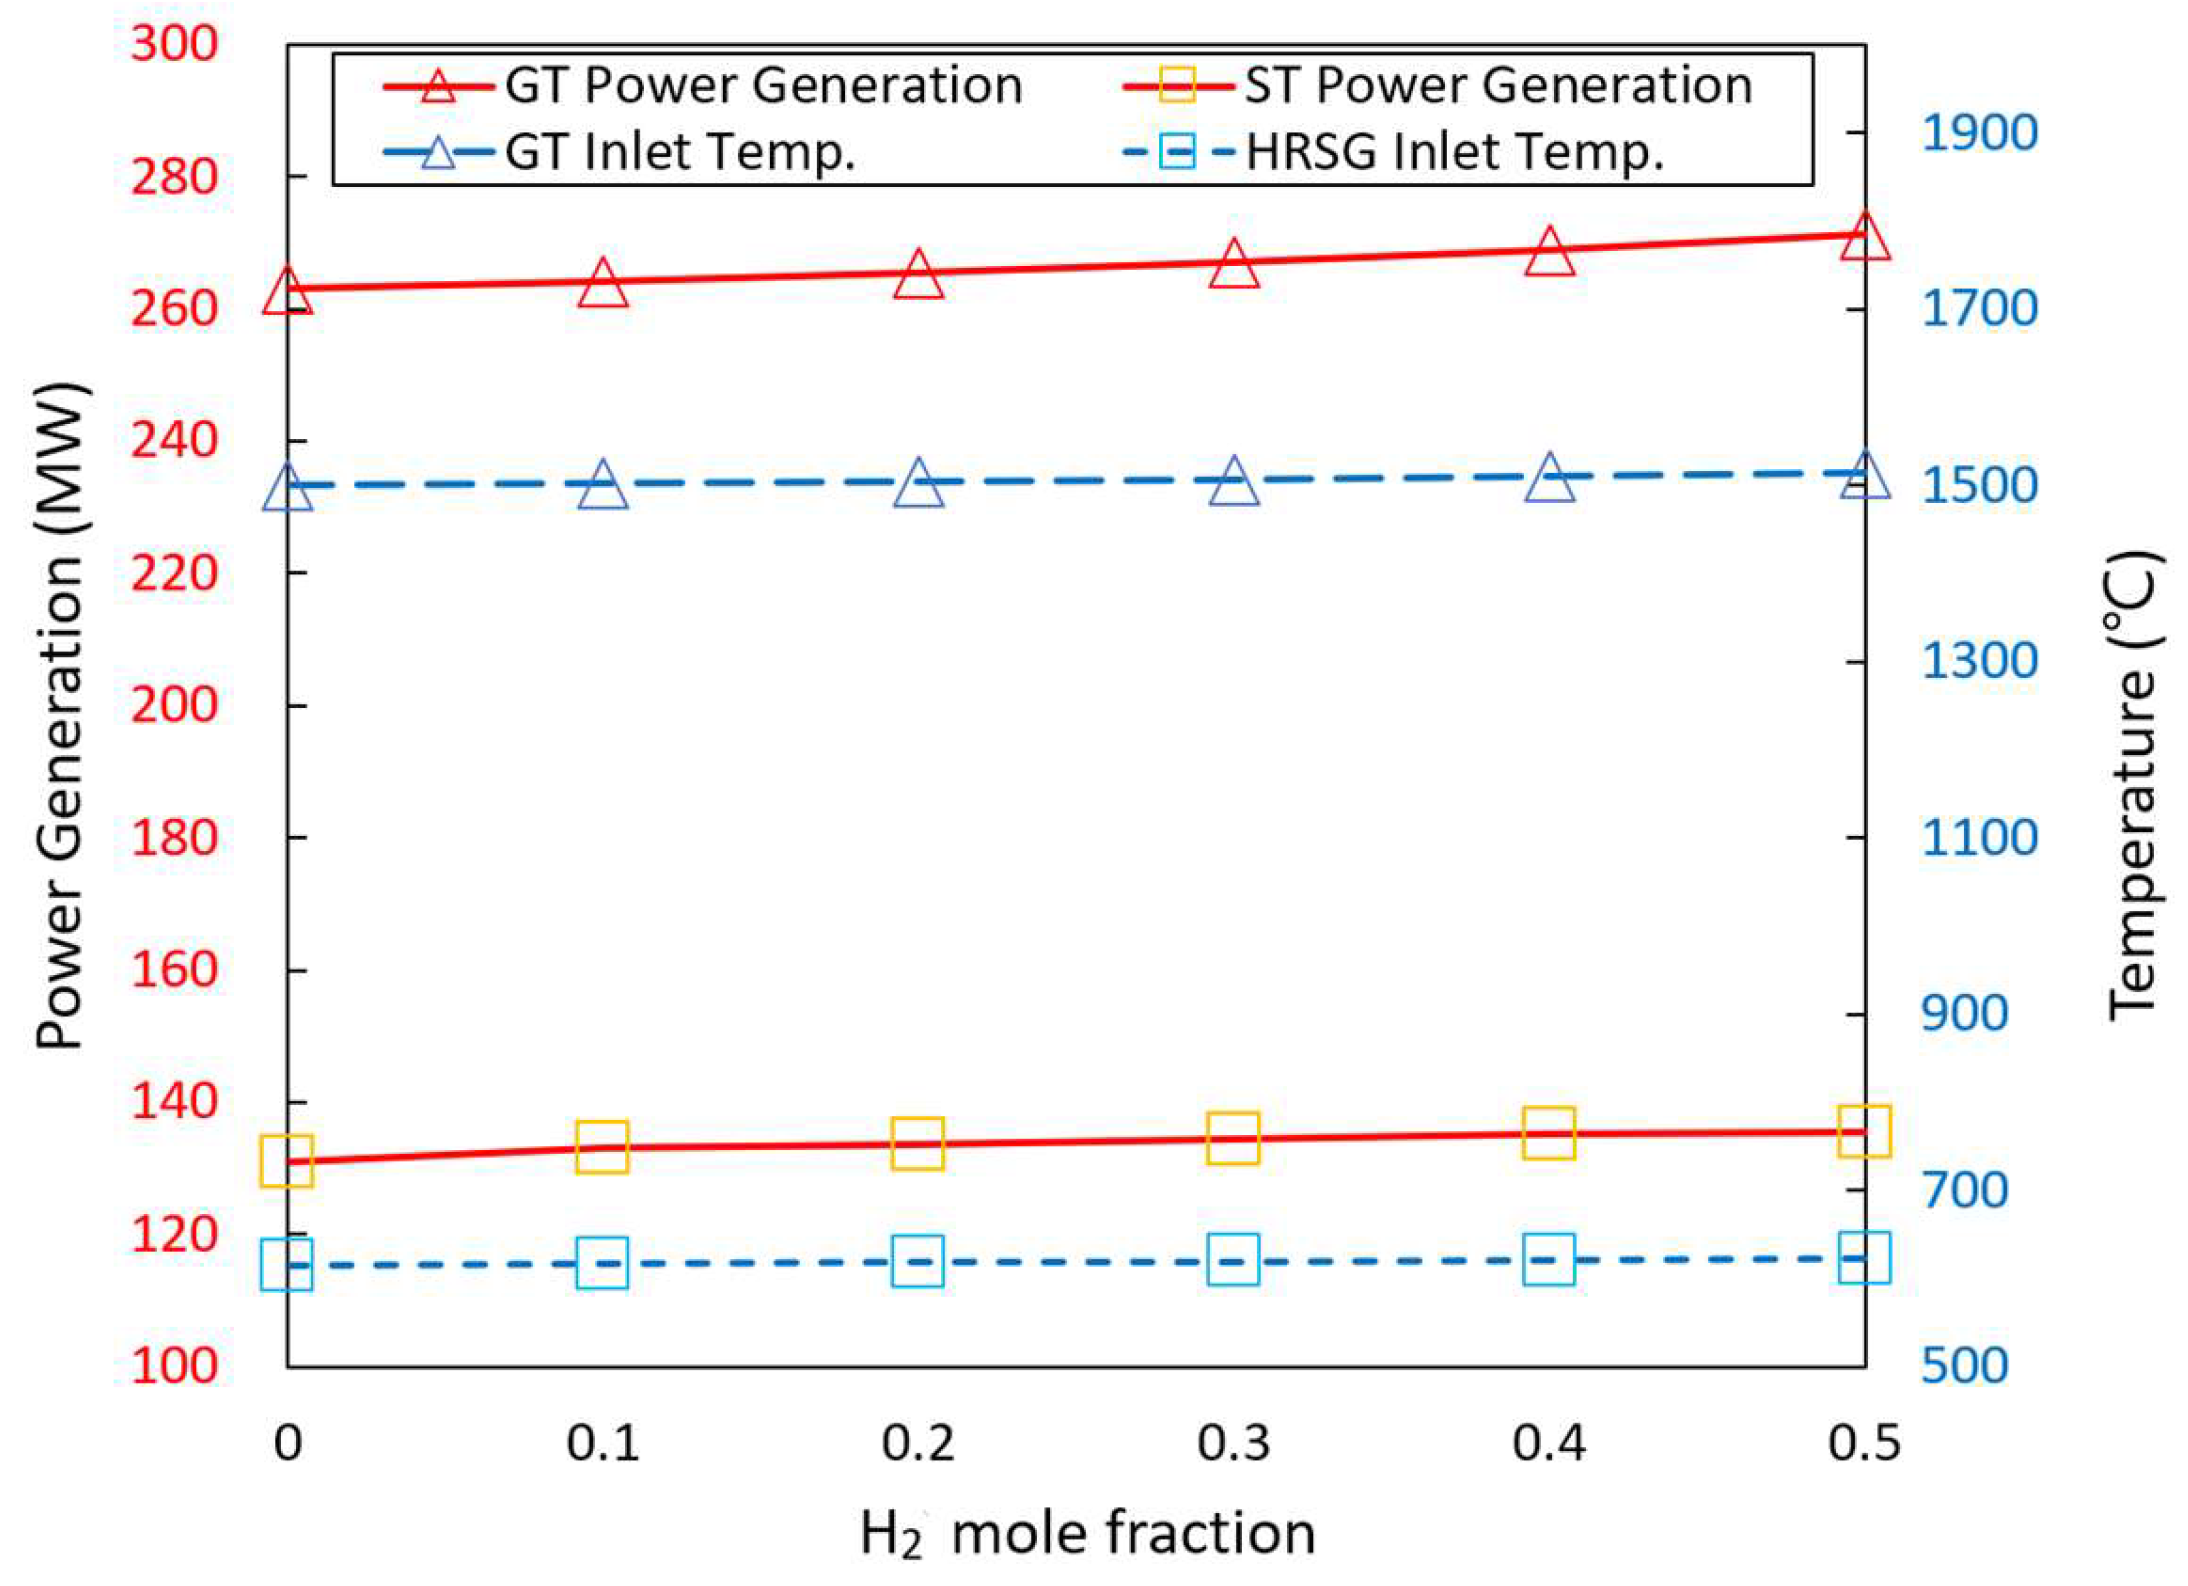
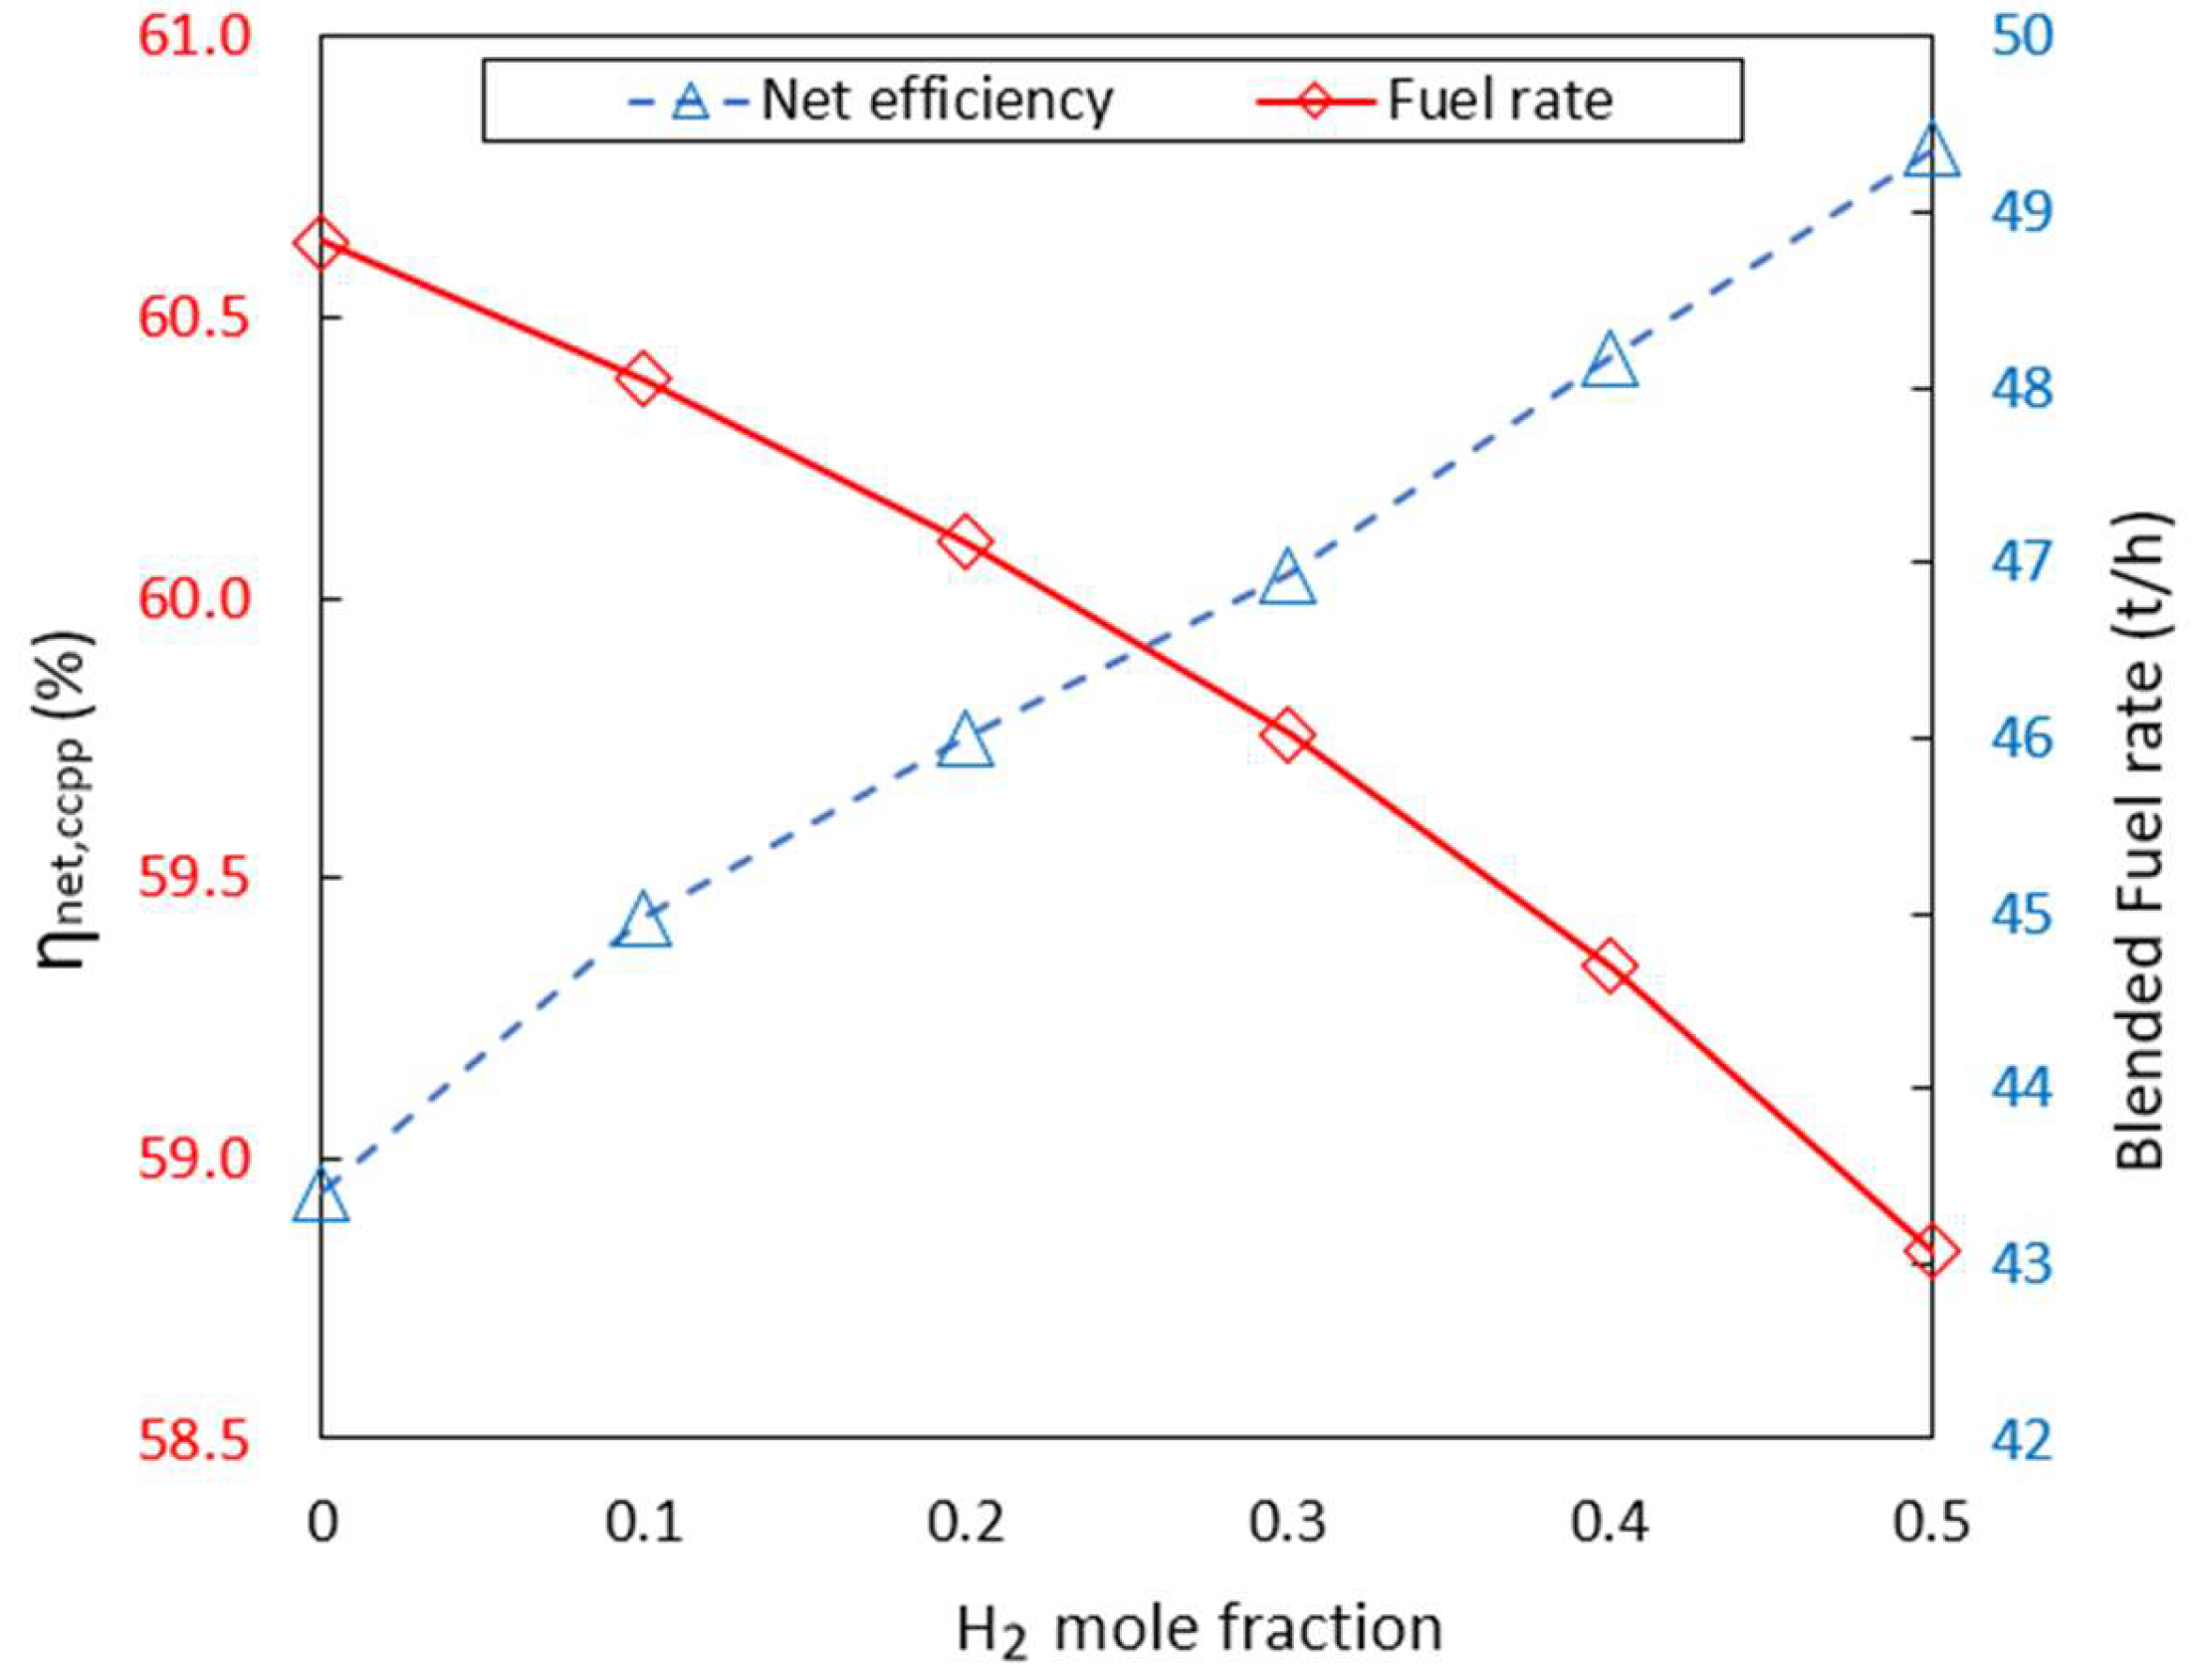
3.1. Process Simulation Results
3.2. LCOE of Natural Gas–Hydrogen CCPP
3.3. Sensitivity Analysis of LCOE
4. Discussion
5. Conclusions
- We developed a process model for natural gasbased CCPPs and compared the material properties of each key point with operation data, which revealed an error range of around 1%, thereby completing the validation of the process model.
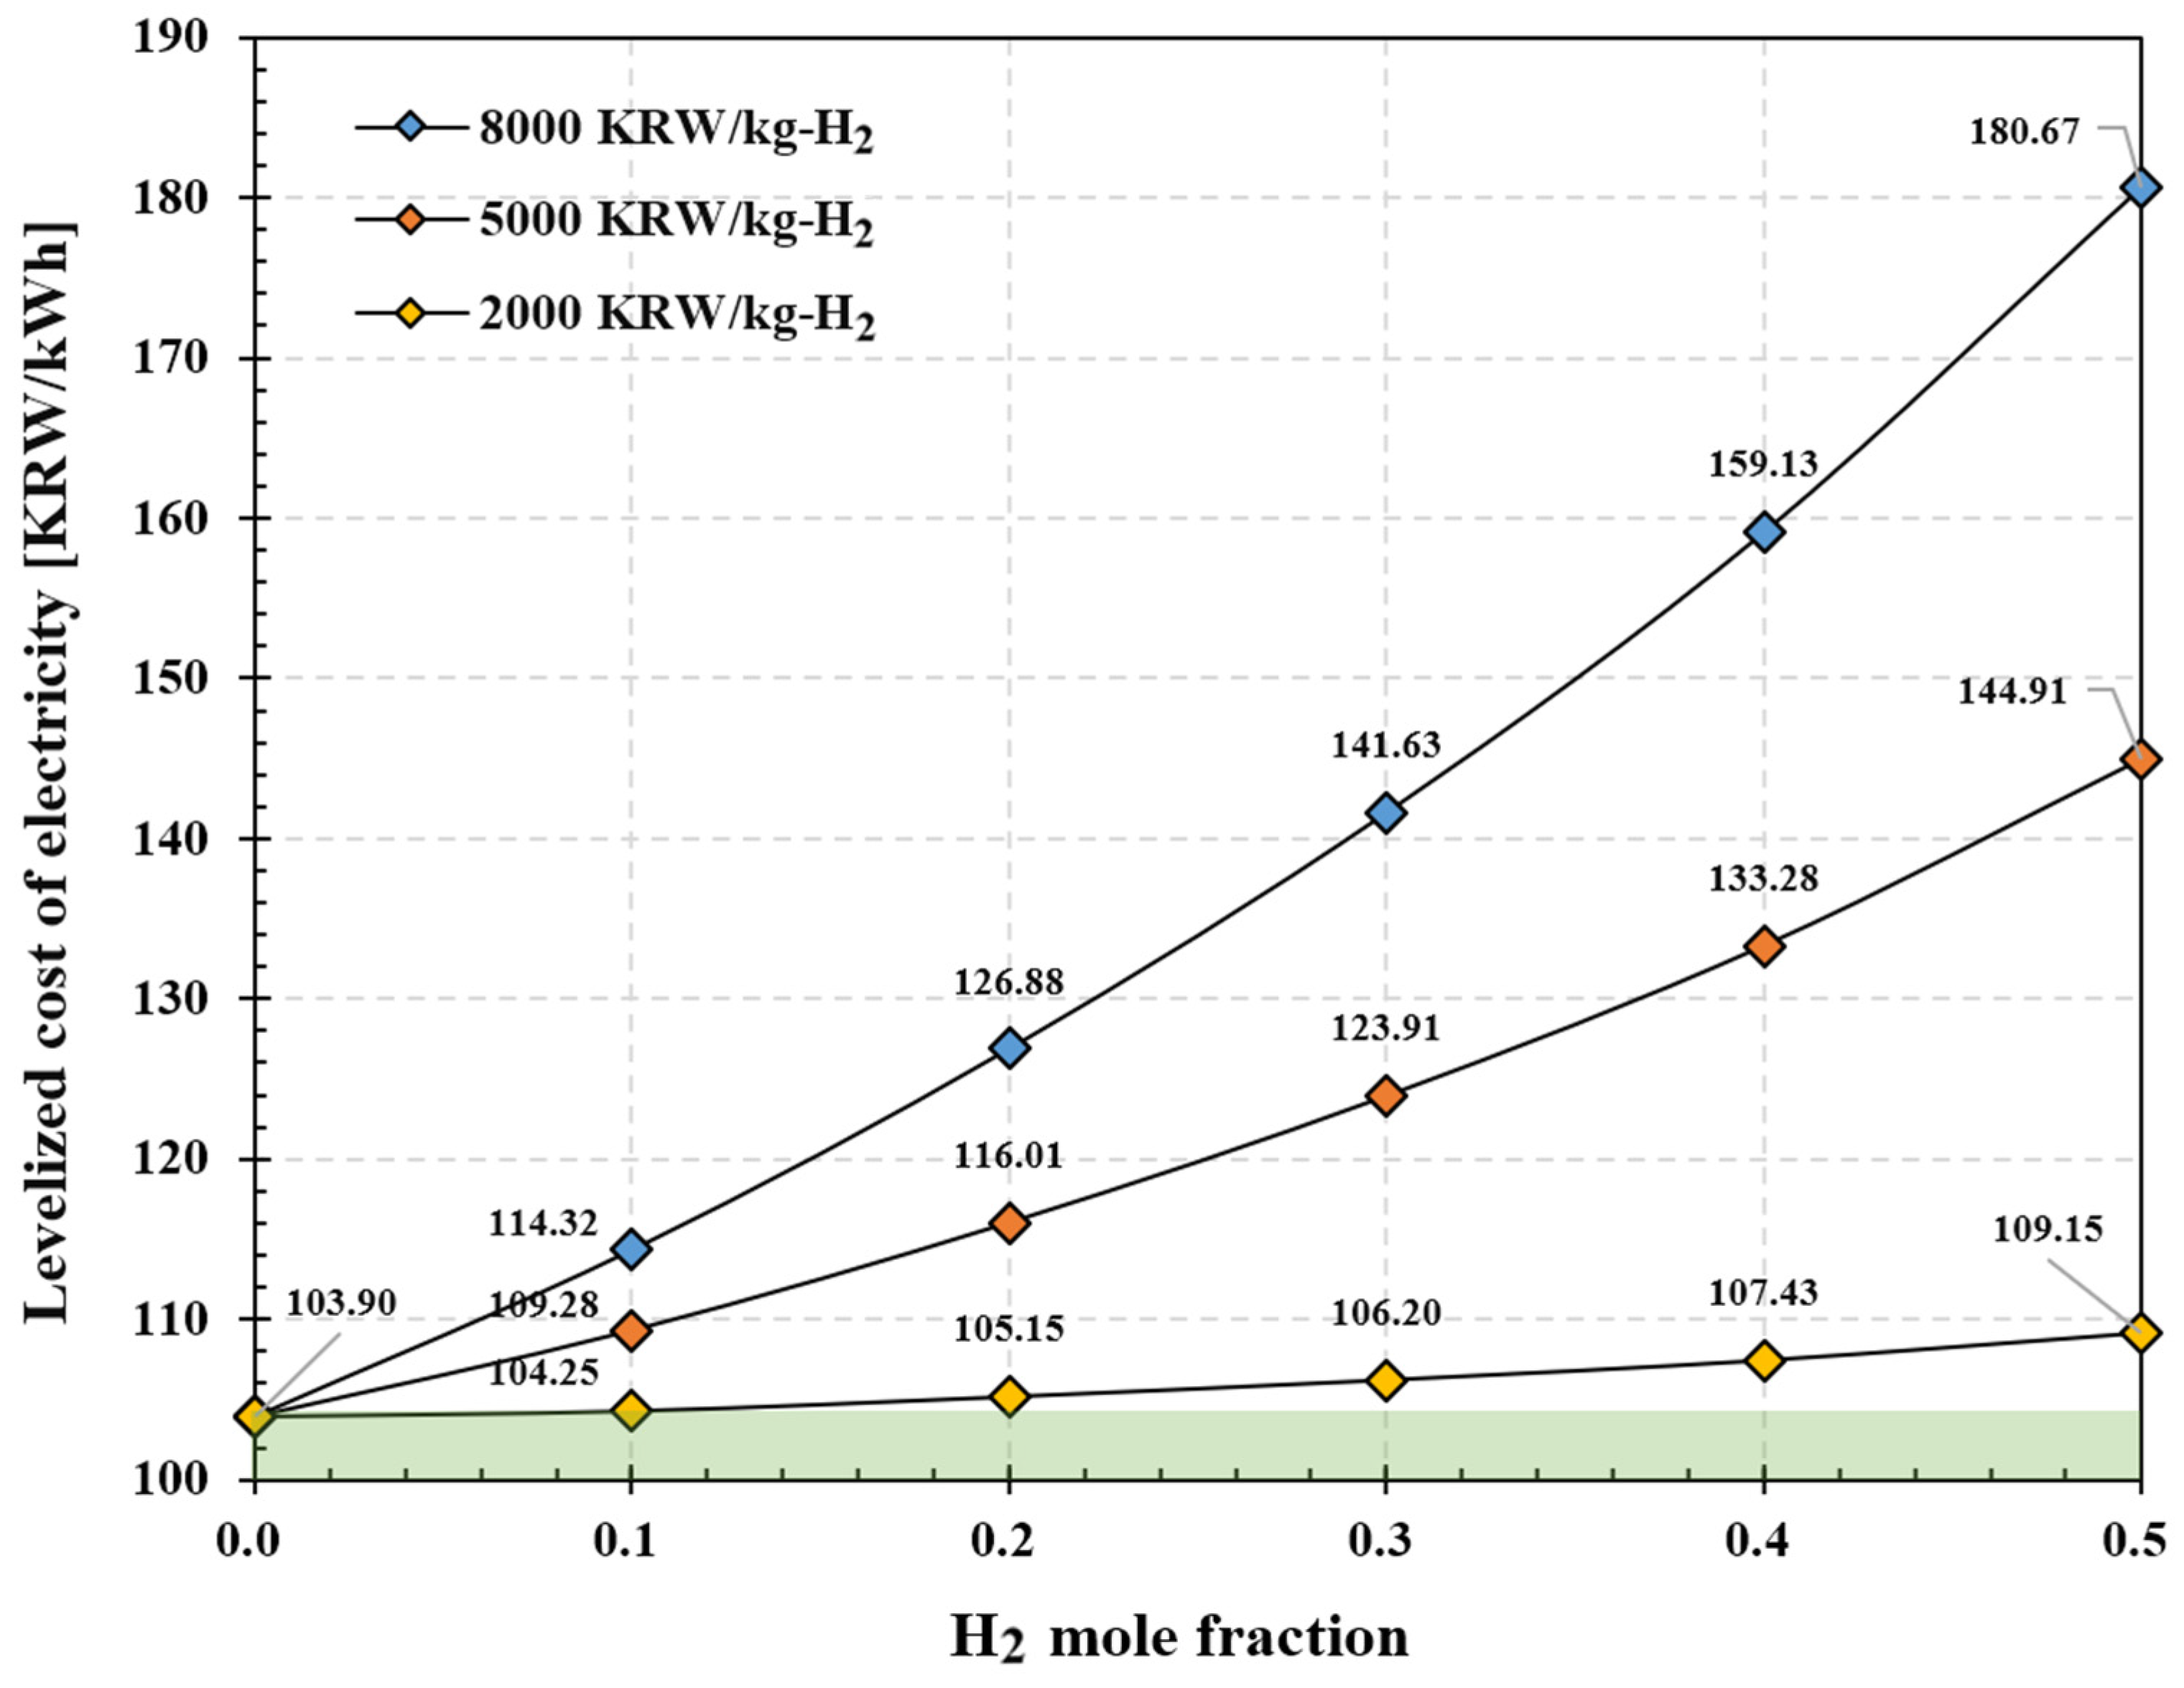
- When hydrogen fuel is supplied at 2000–8000 KRW/kg, the LCOE is 103.9–180.67 KRW/kWh. When it is supplied at under 2000 KRW/kg, the LCOE is 109.15 KRW/kWh even if the ratio of hydrogen blending is increased to 50%, showing a 5.0% increase from the LCOE of existing natural gas CCPPs (103.9 KRW/kWh).
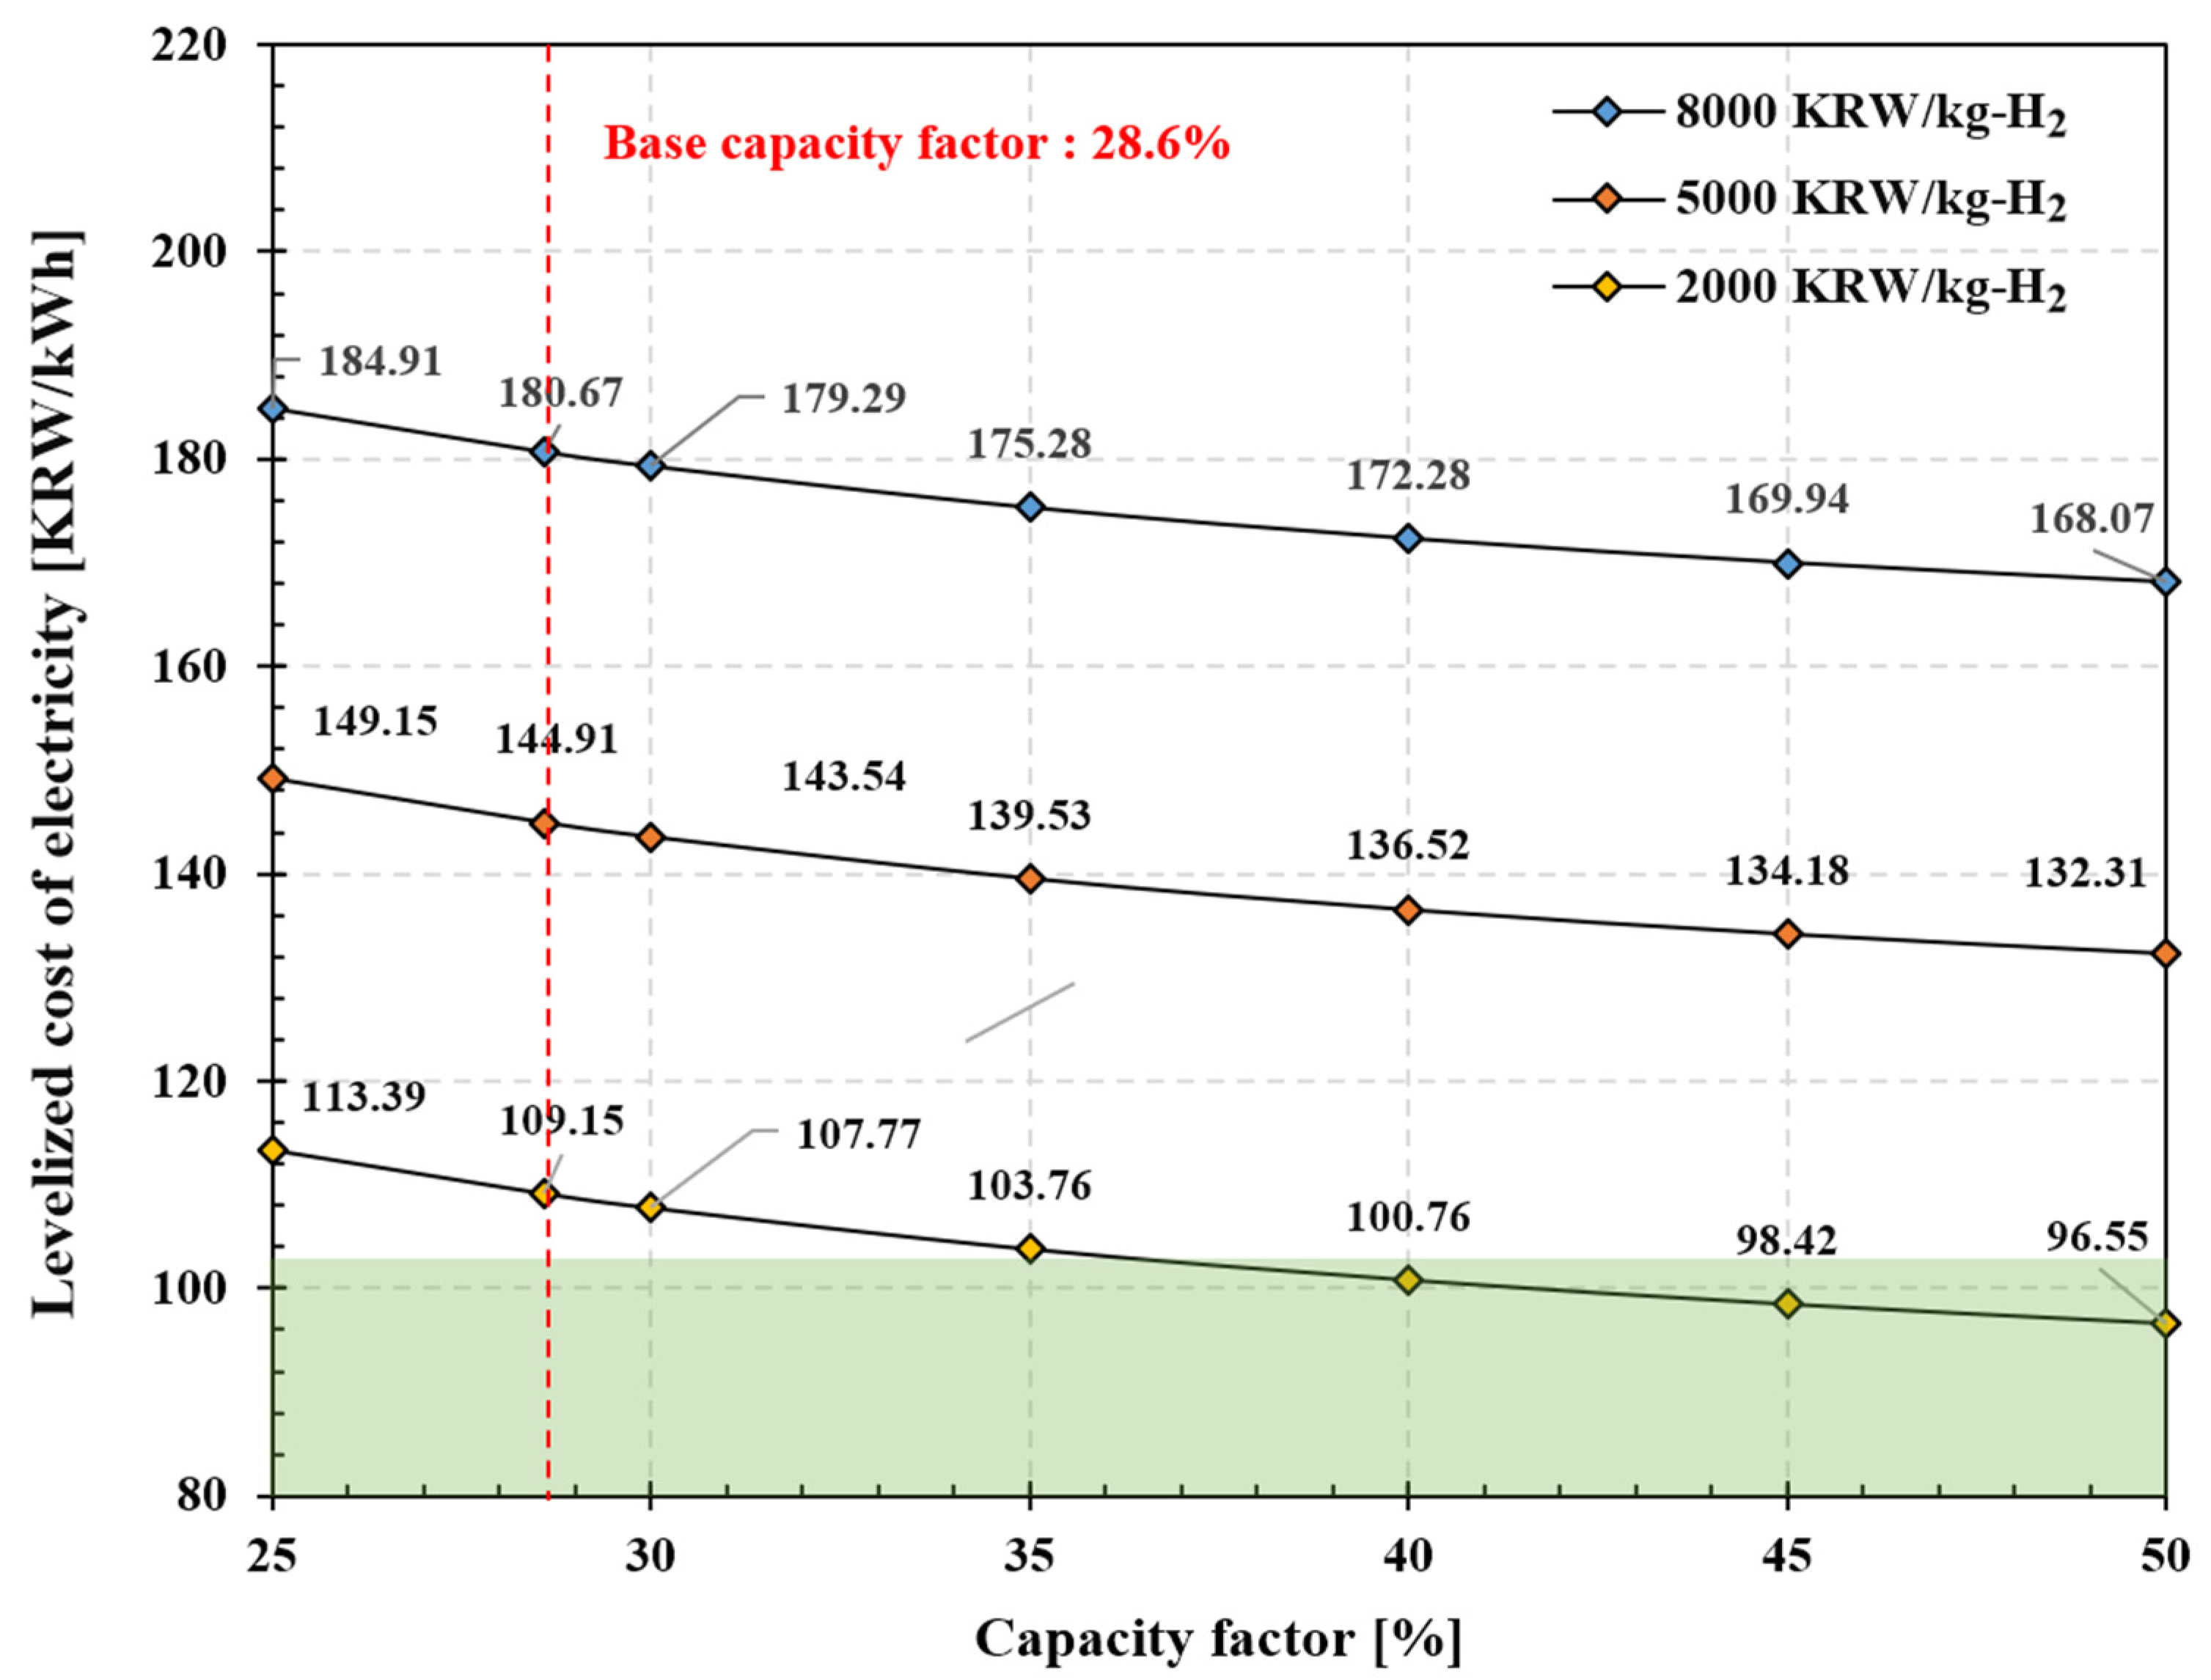
- When the capacity factor of the CCPP is increased from 28.6% to at least 35% after blending 50% hydrogen at the price of 2000 KRW/kg with natural gas, the LCOE falls under 103.76 KRW/kWh, thereby ensuring price competitiveness over CCPPs using only natural gas.
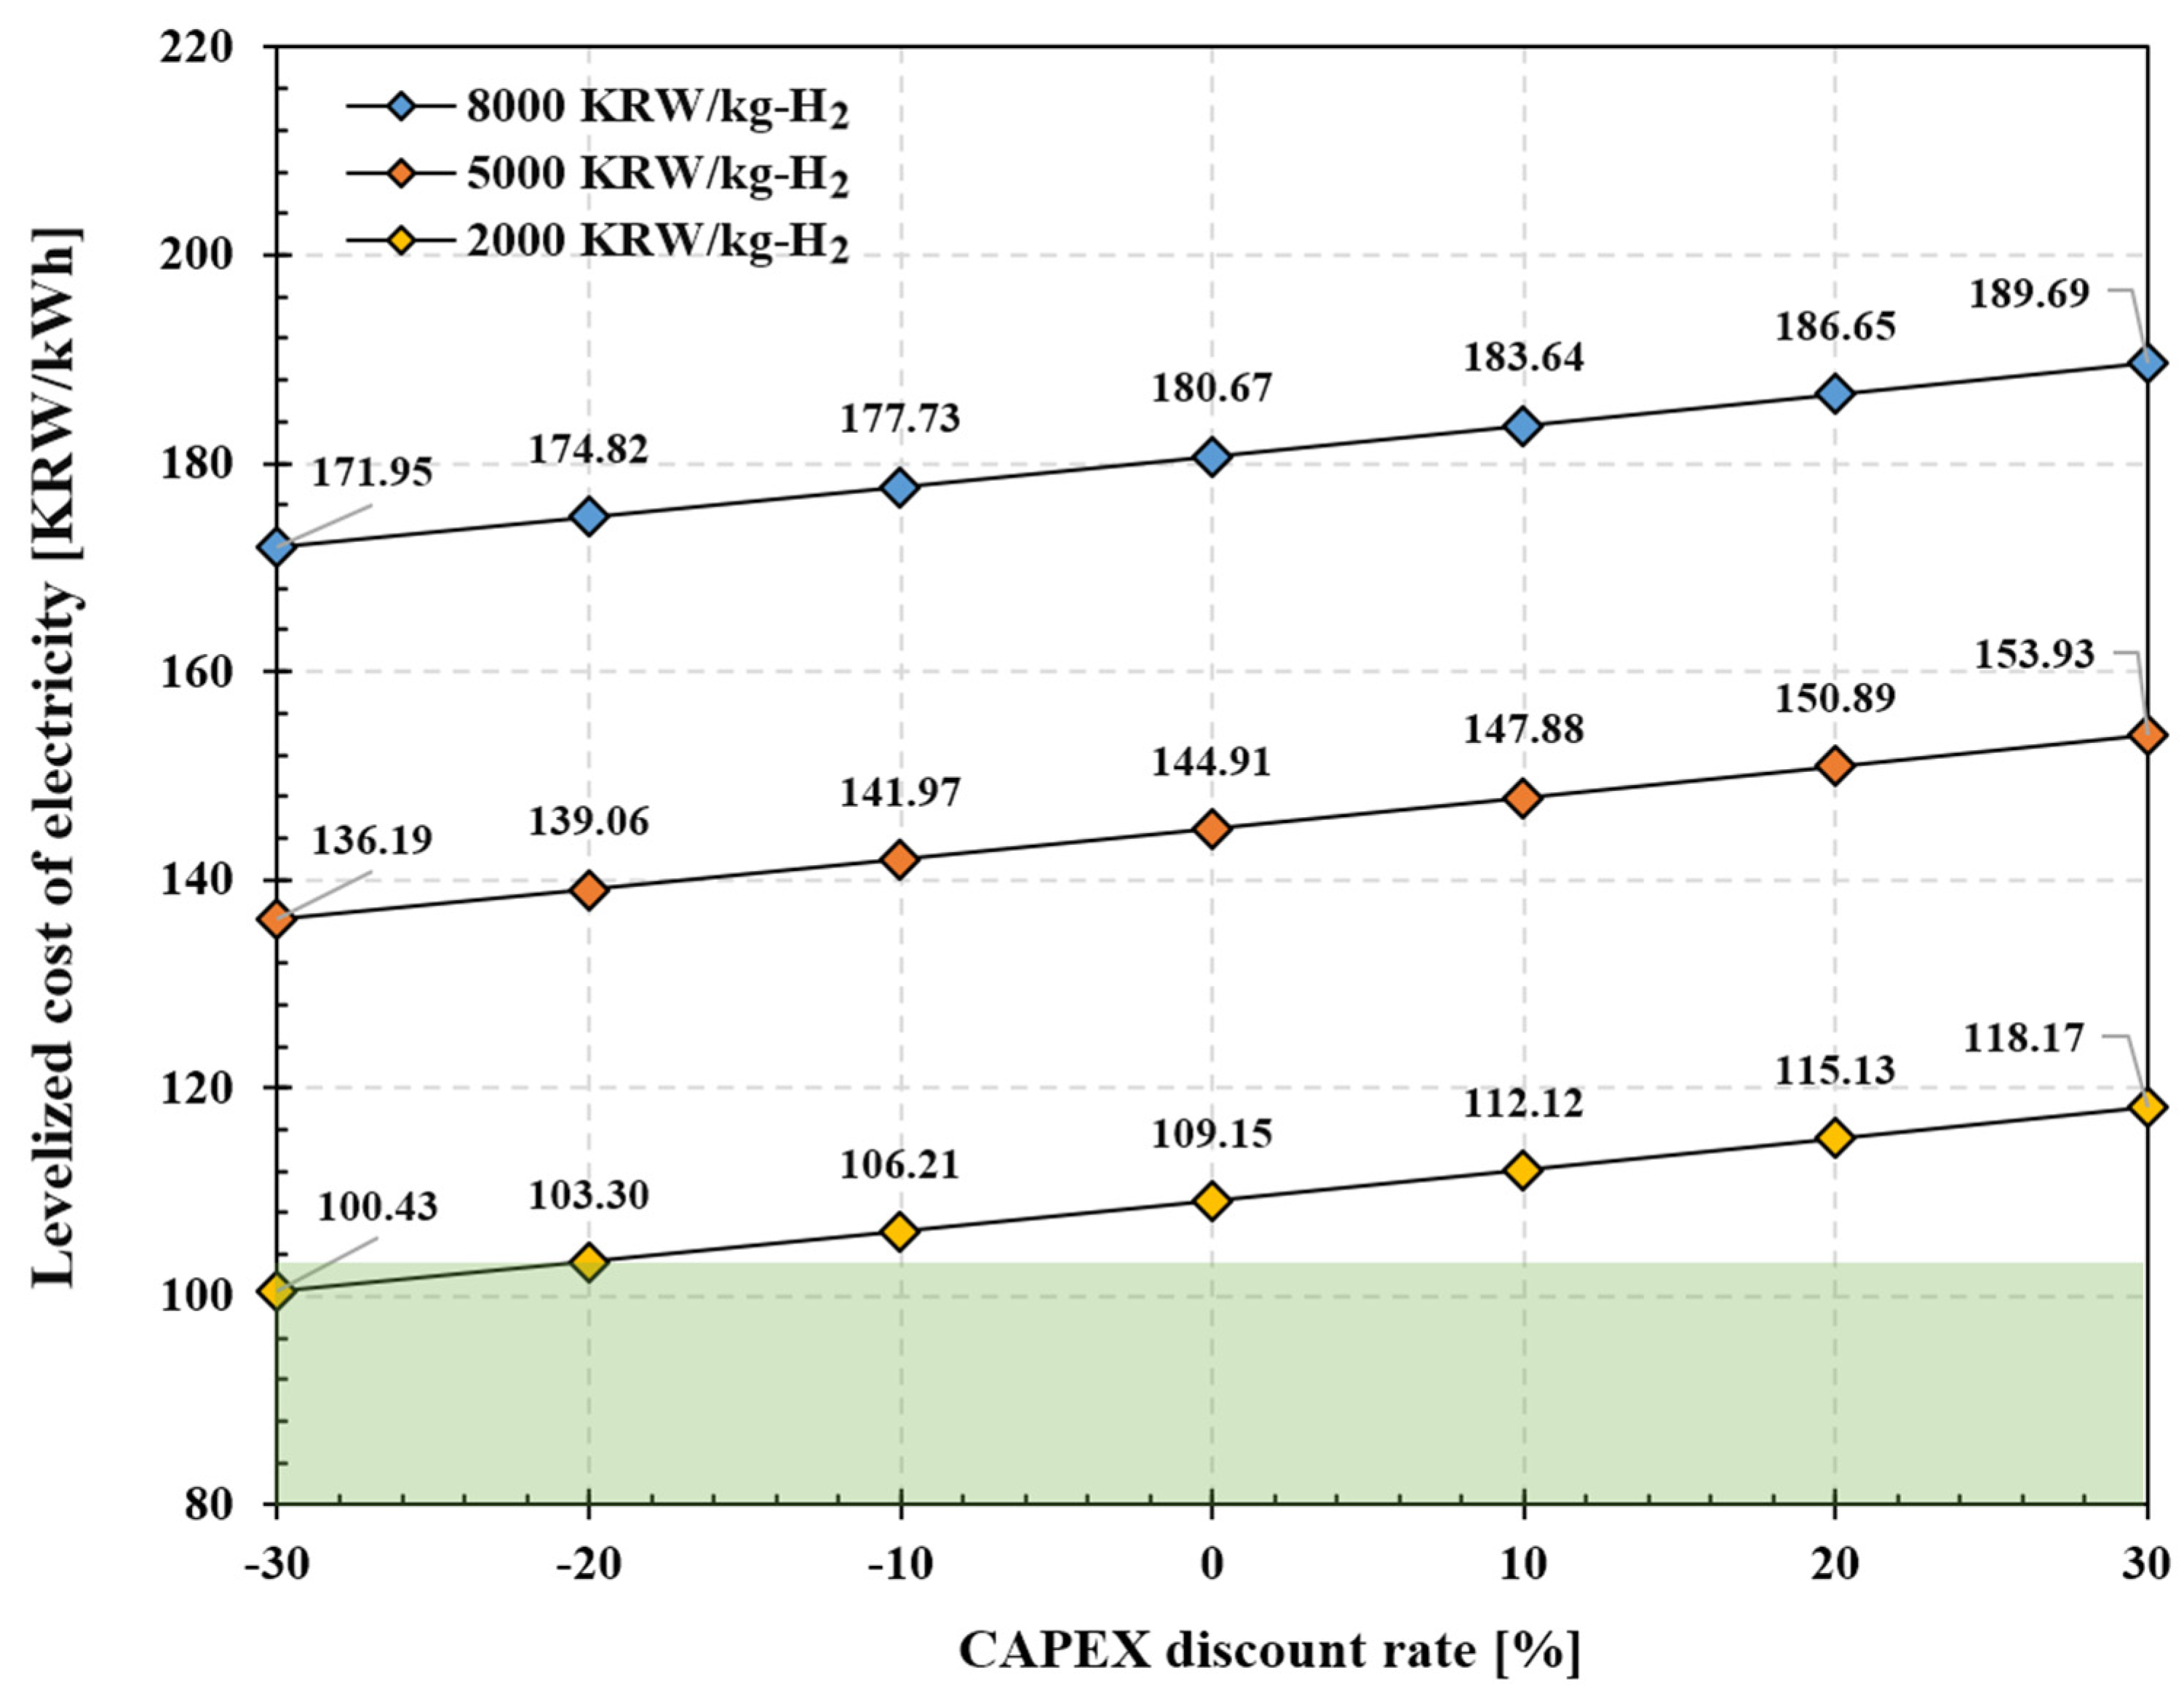
- Even when CAPEX is reduced by up to 30%, the LCOE is reduced by only around 5%, not showing much of a reduction effect. However, when it is reduced by 20%, the LCOE is 103.3 KRW/kWh, which is lower than that of a CCPP that uses only natural gas.
- The process analysis showed that blending 50% hydrogen is expected to result in power generation of 406.53 MW and an LCOE of 109.15 KRW/kWh, suggesting that the same LCOE as that of existing natural gas CCPPs can be secured when net power generation is increased by 20.47 MW by optimizing the process and improving efficiency.
Author Contributions
Funding
Institutional Review Board Statement
Informed Consent Statement
Data Availability Statement
Conflicts of Interest
Nomenclature
| ADJ | Adjustment |
| AFUDC | Allowance for funds used during construction |
| BBY | Balance beginning of year |
| BD | Book depreciation |
| BFP | Boiler feedwater pump |
| BPV | Byproduct value |
| CC | Carrying charge |
| CCPP | Combined cycle power plant |
| CEP | Condensate extraction pump |
| CP | Cumulative probability |
| CRF | Capital recovery factor |
| DC | Direct cost |
| DITX | Differed income taxes |
| ESS | Energy storage system |
| FCI | Fixed capital investment |
| FOM | Fixed operating and maintenance |
| IC | Indirect cost |
| LCOE | Levelized cost of electricity |
| MACRS | Modified accelerated cost recovery system |
| OO | Other outlay |
| OTXI | Other taxes and insurance |
| PEC | Purchased equipment cost |
| PEI | Plant facilities investment |
| RCEAF | Recovery of common-equity AFUDC |
| ROI | Return of investment |
| SRHF | Standing reserve hourly fee |
| SRP | Standing reserve payment |
| SRSC | Standing reserve scheduled capacity |
| TCI | Total capital investment |
| TCR | Total capital recovery |
| TDI | Total depreciable investment |
| TRR | Total revenue requirement |
| TRRL | Total revenue requirement levelized |
| TXD | Tax depreciation |
| Subscript | |
| a | Annualized |
| ce | Common equity |
| d | Debt |
| FC | Fuel cost |
| j | J th year |
| k | Ratio of specific heats |
| L | Levelized |
| η | Net efficiency |
| n | Operating year |
| OMC | Operating and maintenance cost |
| ps | Preferred stock |
| R | Replacement |
| r | Pressure ratio |
| t | Tax rate |
References
- Friedlingstein, P.; O’Sullivan, M.; Jones, M.W.; Andrew, R.M.; Gregor, L.; Hauck, J.; Le Quéré, C.; Luijkx, I.T.; Olsen, A.; Peters, G.P.; et al. Global carbon budget 2022. Earth Syst. Sci. Data 2022, 14, 4811–4900. [Google Scholar]
- Chen, J.M. Carbon neutrality: Toward a sustainable future. Innovation 2021, 2, 100127. [Google Scholar] [CrossRef] [PubMed]
- IEA. Energy Technology Perspectives 2020. Special Report on Carbon Capture, Utilisation and Storage. 2020. Available online: https://webstore.iea.org/download/direct/4191 (accessed on 7 August 2023).
- Yu, M.; Wang, K.; Vredenburg, H. Insights into low-carbon hydrogen production methods: Green, blue and aqua hydrogen. Int. J. Hydrogen Energy 2021, 46, 21261–21273. [Google Scholar]
- Ryi, S.K.; Han, J.Y.; Kim, C.H.; Lim, H.; Jung, H.Y. Technical Trends of Hydrogen Production. Clean Technol. 2017, 23, 121–132. [Google Scholar]
- International Energy Agency. The Future of Hydrogen: Seizing Today’s Opportunities; OECD: Paris, Franace, 2019. [Google Scholar] [CrossRef]
- Park, S.; Lee, C.; Ryu, J.-Y.; Hwang, S. An Economic Analysis on Slush Hydrogen Containing Liquid and Solid Phase for Long-Term and Large-Scale Storage. Trans. Korean Hydrog. New Energy Soc. 2022, 33, 247–254. [Google Scholar] [CrossRef]
- Lamb, K.E.; Webb, C.J. A quantitative review of slurries for hydrogen storage–Slush hydrogen, and metal and chemical hydrides in carrier liquids. J. Alloys Compd. 2022, 906, 164235. [Google Scholar]
- Hamayun, M.H.; Maafa, I.M.; Hussain, M.; Aslam, R. Simulation Study to Investigate the Effects of Operational Conditions on Methylcyclohexane Dehydrogenation for Hydrogen Production. Energies 2020, 13, 206. [Google Scholar] [CrossRef]
- Andersson, J. Application of liquid hydrogen carriers in hydrogen steelmaking. Energies 2021, 14, 1392. [Google Scholar]
- Meille, V.; Pitault, I. Liquid Organic Hydrogen Carriers or Organic Liquid Hydrides: 40 Years of History. Reactions 2021, 2, 94–101. [Google Scholar]
- Mneimneh, F.; Ghazzawi, H.; Abu Hejjeh, M.; Manganelli, M.; Ramakrishna, S. Roadmap to Achieving Sustainable Development via Green Hydrogen. Energies 2023, 16, 1368. [Google Scholar]
- Park, S.; Ryu, J.Y.; Sohn, G. Techno-Economic Analysis (TEA) on Hybrid Process for Hydrogen Production Combined withBiomass Gasification Using Oxygen Released from the Water Electrolysis Based on Renewable Energy. J. Korean Inst. Gas 2020, 24, 65–73. [Google Scholar]
- Chae, M.J.; Kim, J.H.; Moon, B.; Park, S.; Lee, Y.S. The present condition and outlook for hydrogen-natural gas blending technology. Korean J. Chem. Eng. 2022, 39, 251–262. [Google Scholar] [CrossRef]
- Sun, M.; Huang, X.; Hu, Y.; Lyu, S. Effects on the performance of domestic gas appliances operated on natural gas mixed with hydrogen. Energy 2021, 244, 122557. [Google Scholar]
- Tangoz, S.; Kahraman, N.; Akansu, S.O. The effect of hydrogen on the performance and emissions of an SI engine having a high compression ratio fuelled by compressed natural gas. Int. J. Hydrogen Energy 2017, 42, 25766–25780. [Google Scholar] [CrossRef]
- Makaryan, I.A.; Sedov, I.V.; Salgansky, E.A.; Arutyunov, A.V.; Arutyunov, V.S. A Comprehensive Review on the Prospects of Using Hydrogen–Methane Blends: Challenges and Opportunities. Energies 2022, 15, 2265. [Google Scholar] [CrossRef]
- Erdener, B.C.; Sergi, B.; Guerra, O.J.; Chueca, A.L.; Pambour, K.; Brancucci, C.; Hodge, B.M. A review of technical and regulatory limits for hydrogen blending in natural gas pipelines. Int. J. Hydrogen Energy 2023, 48, 5595–5617. [Google Scholar]
- Melaina, M.W.; Antonia, O.; Penev, M. Blending Hydrogen into Natural Gas Pipeline Networks: A Review of Key Issues; Technical Report; National Renewable Energy Laboratory: Golden, CO, USA, 2013.
- Quarton, C.J.; Samsatli, S. Power-to-gas for injection into the gas grid: What can we learn from real-life projects, economic assessments and systems modelling? Renew. Sustain. Energy Rev. 2018, 98, 302–316. [Google Scholar]
- Zachariah-Wolff, J.L.; Egyedi, T.M.; Hemmes, K. From natural gas to hydrogen via the Wobbe index: The role of standardized gateways in sustainable infrastructure transitions. Int. J. Hydrogen Energy 2007, 32, 1235–1245. [Google Scholar] [CrossRef]
- Janès, A.; Lesage, J.; Weinberger, B.; Carson, D. Experimental determination of minimum ignition current (MIC) ratio of hydrogen/methane (H2NG) blends up to 20 vol.% of hydrogen. Process Saf. Environ. Prot. 2017, 107, 299–308. [Google Scholar] [CrossRef]
- Meng, B.; Gu, C.; Zhang, L.; Zhou, C.; Li, X.; Zhao, Y.; Zheng, J.; Chen, X.; Han, Y. Hydrogen effects on X80 pipeline steel in high-pressure natural gas/hydrogen mixtures. Int. J. Hydrogen Energy 2016, 42, 7404–7412. [Google Scholar] [CrossRef]
- Cameretti, M.C.; De Robbio, R.; Tuccillo, R. CFD Study of a Micro—Combustor Under Variable Operating Conditions. In Proceedings of the ASME Turbo Expo 2017, Charlotte, NC, USA, 26–30 June 2017. Paper No: GT2017-63661. [Google Scholar]
- Pappa, A.; Bricteux, L.; Benard, P.; De Paepe, W. Can water dilution avoid flashback on a hydrogen enriched micro gas turbine combustion?—A large eddy simulation study. J. Eng. Gas Turbines Power 2021, 143, 041008-1. [Google Scholar] [CrossRef]
- De Robbio, R. Micro gas turbine role in distributed generation with renewable energy sources. Energies 2023, 16, 704. [Google Scholar] [CrossRef]
- Goldmeer, J. Power to Gas: Hydrogen for Power Generation; General Electric Company: Boston, MA, USA, 2019. [Google Scholar]
- Larfeldt, J.; Andersson, M.; Larsson, A.; Moell, D. Hydrogen Co-Firing in Siemens Low NOX Industrial Gas Turbines. In Proceedings of the POWER-GEN Europe, Cologne, Germany, 27–29 June 2017; Available online: https://pdfs.semanticscholar.org/37fd/8e07212bf1e60f6db535d6e422b11880b816.pdf (accessed on 7 August 2023).
- Jaworski, J.; Blacharski, T. Study of the effect of addition of hydrogen to natural gas on diaphragm gas meters. Energies 2020, 13, 3006. [Google Scholar] [CrossRef]
- Saccani, C.; Pellegrini, M.; Guzzini, A. Analysis of the existing barriers for the market development of power to hydrogen (P2H) in Italy. Energies 2020, 13, 4835. [Google Scholar] [CrossRef]
- Sorgulu, F.; Dincer, I. Analysis and Techno-Economic Assessment of Renewable Hydrogen Production and Blending into Natural Gas for Better Sustainability. Int. J. Hydrogen Energy 2022, 47, 19977–19988. [Google Scholar] [CrossRef]
- Kotowicz, J.; Brzęczek, M. Analysis of increasing efficiency of modern combined cycle power plant: A case study. Energy 2018, 153, 90–99. [Google Scholar] [CrossRef]
- Shin, Y.; Cho, E.S. Numerical Study on H2 Enriched NG Lean Premixed Combustion. J. Korean Soc. Combust. 2021, 26, 51–58. [Google Scholar] [CrossRef]
- Kurt, H.; Recebli, Z.; Gedik, E. Performance analysis of open cycle gas turbines. Int. J. Energy Res. 2009, 33, 285–294. [Google Scholar] [CrossRef]
- Khan, A.R.; Ravi, M.R.; Ray, A. Experimental and chemical kinetic studies of the effect of H2 enrichment on the laminar burning velocity and flame stability of various multicomponent natural gas blends. Int. J. Hydrogen Energy 2019, 44, 1192–1212. [Google Scholar] [CrossRef]
- Bejan, A.; Tsatsaronis, G.; Moran, M. Thermal Design and Optimization; Wiley: New York, NY, USA, 1996. [Google Scholar]
- Sohn, G.; Ryu, J.Y.; Park, H.; Park, S. Techno-economic analysis of oxy-fuel power plant for coal and biomass combined with a power-to-gas plant. Energy Sustain. Dev. 2021, 64, 47–58. [Google Scholar] [CrossRef]
- Park, S.H.; Lee, Y.D.; Ahn, K.Y. Performance analysis of an SOFC/HCCI engine hybrid system: System simulation and thermoeconomic comparison. Int. J. Hydrogen Energy 2014, 39, 1799–1810. [Google Scholar] [CrossRef]
- Statistics Korea. Consumer Price Index. Available online: https://https://kostat.go.kr/cpi (accessed on 7 August 2023).
- Statistics Korea. Exchange Rate of World Bank. Available online: https://kosis.kr/statHtml/statHtml.do?orgId=101&tblId=DT_2AQ4516&conn_path=I2 (accessed on 7 August 2023).
- National Tax Service South Korea. Income Tax. Available online: https://www.nts.go.kr/nts/cm/cntnts/cntntsView.do?mi=2372&cntntsId=7746 (accessed on 7 August 2023).
- Ji, D.-M.; Sun, J.-Q.; Sun, Q.; Guo, H.-C.; Ren, J.-X.; Zhu, Q.-J. Optimization of start-up scheduling and life assessment for a steam turbine. Energy 2018, 160, 19–32. [Google Scholar]
- Nazari, M.A.; Alavi, M.; Salem, M.; El Haj Assad, M. Utilization of hydrogen in gas turbines: A comprehensive review. Int. J. Low-Carbon Technol. 2022, 17, 513–519. [Google Scholar] [CrossRef]
- Shin, J.-E. Hydrogen Technology Development and Policy Status by Value Chain in South Korea. Energies 2022, 15, 8983. [Google Scholar] [CrossRef]
- International Energy Agency (IEA). The Future of Hydrogen 2019. Available online: https://www.iea.org/reports/the-future-of-hydrogen (accessed on 17 August 2023).
- Ajanovic, A.; Haas, R. Economic prospects and policy framework for hydrogen as fuel in the transport sector. Energy Pol. 2018, 123, 280–288. [Google Scholar] [CrossRef]
- Abdin, Z.; Khalilpour, K.; Catchpole, K. Projecting the levelized cost of large scale hydrogen storage for stationary applications. Energy Convers. Manag. 2022, 270, 116241. [Google Scholar] [CrossRef]


| Gas | CH4 | C2H6 | C3H8 |
|---|---|---|---|
| Vol (%) | 89.5 | 8.8 | 1.7 |
| Point | Stream | Temperature (°C) | Pressure (Bar) | Mass Flow Rate (t/h) | |||
|---|---|---|---|---|---|---|---|
| Actual | Simulation | Actual | Simulation | Actual | Simulation | ||
| 1 | Air | 15 | 15 | 1.013 | 1.013 | 2,122 | 2132 |
| 2 | Natural gas | 200 | 200 | 39 | 39 | 48.83 | 48.83 |
| 3 | Combustion gas | 1500 | 1,514 | 39 | 39 | 2,170 | 2181 |
| 4 | Exhaust gas | 611.8 | 616.0 | 1.039 | 1.09 | 2,170 | 2181 |
| 5 | Exhaust gas | 83.0 | 83.6 | 1.013 | 1.07 | 2,170 | 2181 |
| 6 | Steam | 596.4 | 596.0 | 129.7 | 129.7 | 257.5 | 288.8 |
| 7 | Steam | 582.3 | 582.0 | 27.2 | 31.3 | 283.1 | 317.4 |
| 8 | Steam | 235.5 | 238.2 | 2.0 | 2.5 | 289.5 | 289.6 |
| 9 | Steam | 244.2 | 245 | 4.0 | 4.2 | 47.8 | 49.2 |
| 10 | Steam | 29.4 | 31.2 | 0.041 | 0.094 | 340.1 | 342 |
| 11 | Water | 29.5 | 29.5 | 9.5 | 9.5 | 340.8 | 345 |
| Fuel Composition | |||
|---|---|---|---|
| H2 Mole Fraction | H2 Flow Rate (t/h) | NG Mole Fraction | NG Flow Rate (t/h) |
| 0 | 0 | 1.0 | 48.83 |
| 0.1 | 0.662 | 0.9 | 47.38 |
| 0.2 | 1.435 | 0.8 | 45.68 |
| 0.3 | 2.352 | 0.7 | 43.67 |
| 0.4 | 3.455 | 0.6 | 41.24 |
| 0.5 | 4.808 | 0.5 | 38.26 |
| Contents | Unit | Value | ||
|---|---|---|---|---|
| Overall economic index | Annual inflation rate [39] | % | 1.5 | |
| Nominal inflation rate [39] | % | 1.5 | ||
| Fuel escalation | % | 1.0 | ||
| Levelized interest rate | % | 4.7 | ||
| First FPI supply | % | 40.0 | ||
| Second FPI supply | % | 60.0 | ||
| Won–dollar exchange rate [40] | KRW | 1100 | ||
| System financing | Plant design start year | year | 2020 | |
| Plant construction start year | year | 2020 | ||
| Plant operation start year | year | 2022 | ||
| Common equity | Financing fraction Required annual return | % | 50.7 | |
| % | 7.0 | |||
| Preferred stock | Financing fraction | % | 0.0 | |
| Required annual return | % | 8.0 | ||
| Debt | Financing fraction | % | 49.3 | |
| Required annual return | % | 2.4 | ||
| Resulting average cost of money | % | 4.7 | ||
| Total income tax rate [41] | % | 22.0 | ||
| Other tax income rate [41] | % | 2.0 | ||
| Plant operation index | Plant life [42] | year | 30 | |
| Tax life | year | 20 | ||
| Capacity factor (or plant operation rate) | %/year | 28.6 | ||
| Power plant net power | kW | 406,211 | ||
| Fuel cost | Natural gas unit price | USD/MJ | 20,488 | |
| Hydrogen unit price | USD/t | 7273 | ||
| Combustor | Number of combustors | ea. | 14 | |
| Unit cost per combustor | USD/ea. | 272,727 | ||
| Lifetime of combustor | h | 25,000 | ||
| Total combustor cost for repair | USD | 26,757,818.2 | ||
| Total combustor cost for repair per year | USD/year | 1,337,891 | ||
| Contents | Cost (USD) | |||
|---|---|---|---|---|
| Fixed capital investment | Direct cost | Onsite costs | Purchased equipment cost | 209,090,909 |
| Offsite costs | Land cost | 20,909,901 | ||
| Civil, structural and supervision | 118,181,818 | |||
| Total cost | 348,181,818 | |||
| Indirect cost | Engineering and supervision | 27,854,545 | ||
| Construction cost | 52,227,273 | |||
| Contingency | 64,239,545 | |||
| Total cost | 144,321,364 | |||
| Total cost | 492,503,182 | |||
| Other outlay | Startup cost | Fuel and O&M for startup | 9,543,459 | |
| Escalated startup cost | 288,451 | |||
| Total cost | 9,831,910 | |||
| Working capital | Working capital cost | 23,233,479 | ||
| Escalated working capital cost | 1,061,267 | |||
| Total cost | 24,294,746 | |||
| AFUDC | Allowance for funds used during construction | 30,372,455 | ||
| Total AFUDC after 2 years | 34,883,398 | |||
| Total capital investment (TCI) | Total net outlay | Land cost | 20,909,091 | |
| Plant facilities investment | 490,220,655 | |||
| Startup cost | 9,831,910 | |||
| Working capital | 24,294,746 | |||
| Total net outlay | 545,256,402 | |||
| Total cost | 580,139,800 | |||
| Total depreciable capital Investment | Total net capital investment | Total capital investment | 580,139,800 | |
| Total cost | 580,139,800 | |||
| Total nondepreciable capital investment | Land cost | 20,909,091 | ||
| Working capital | 24,294,746 | |||
| Common equity AFUDC | 25,948,579 | |||
| Total cost | 71,152,416 | |||
| Total depreciable capital investment | 508,987,384 | |||
| Contents | Unit | Bundang CCPP-2 | TRR Method Simulation |
|---|---|---|---|
| Total capital investment | KRW | 162,900,000,000 | 162,900,000,000 |
| Common equity financing fraction | % | 50.73 | 50.73 |
| Cost of equity capital | % | 7.02 | 7.02 |
| Debt financing fraction | % | 49.27 | 49.27 |
| Cost of debt capital | % | 2.36 | 2.36 |
| Weighted average cost of capital | % | 4.7 | 4.7 |
| Income tax rate | % | 22 | 22 |
| Plant lifetime | Year | 30 | 30 |
| Capacity factor | % | 28.6 | 28.6 |
| Plant net power | MW | 368 | 368 |
| Fuel cost/year, only NG | KRW | 80,200,000,000 | 80,200,000,000 |
| Levelized cost of electricity | KRW/kWh | 95.16 | 96.5 |
| Contents | Unit | Actual | Simulation | Error (%) | |
|---|---|---|---|---|---|
| Gas turbine block | NG flow rate | t/h | 48.83 | 48.83 | - |
| Air flow rate | t/h | 2122 | 2132 | 0.46 | |
| GT inlet temperature | °C | 1500 | 1500 | - | |
| GT outlet temperature | °C | 611.8 | 616 | 0.65 | |
| GT exhaust gas flow rate | t/h | 2170 | 2181 | 0.46 | |
| Net power | kW | 263,180 | 263,197 | 0.01 | |
| Steam turbine block | BFP flow rate | t/h | 340 | 345 | 1.47 |
| HRSG inlet temperature | °C | 83 | 83.6 | 0.72 | |
| Net power | kW | 130,400 | 130,968 | 0.43 | |
| Total net power generation | kW | 393,580 | 394,165 | 0.14 | |
| (LHV) | % | 58.86 | 58.94 | 0.13 | |
| Unit | Natural Gas | Natural Gas and Hydrogen | |
|---|---|---|---|
| Total capital investment | KRW | 360,000,000,000 | 360,000,000,000 |
| Hydrogen mole fraction | - | 0 | 0.5 |
| Plant lifetime | Year | 20 | 20 |
| Plant operating rate | % | 28.6 | 28.6 |
| Plant net power | MW | 394.165 | 406.53 |
| Combustor repair cost | KRW/year | - | 1,470,000,000 |
| Fuel cost/year | KRW | 72,000,000,000 | 152,800,000,000 |
| Levelized cost of electricity | KRW/kWh | 103.9 | 180.67 |
Disclaimer/Publisher’s Note: The statements, opinions and data contained in all publications are solely those of the individual author(s) and contributor(s) and not of MDPI and/or the editor(s). MDPI and/or the editor(s) disclaim responsibility for any injury to people or property resulting from any ideas, methods, instructions or products referred to in the content. |
© 2023 by the authors. Licensee MDPI, Basel, Switzerland. This article is an open access article distributed under the terms and conditions of the Creative Commons Attribution (CC BY) license (https://creativecommons.org/licenses/by/4.0/).
Share and Cite
Ryu, J.-Y.; Park, S.; Lee, C.; Hwang, S.; Lim, J. Techno-Economic Analysis of Hydrogen–Natural Gas Blended Fuels for 400 MW Combined Cycle Power Plants (CCPPs). Energies 2023, 16, 6822. https://doi.org/10.3390/en16196822
Ryu J-Y, Park S, Lee C, Hwang S, Lim J. Techno-Economic Analysis of Hydrogen–Natural Gas Blended Fuels for 400 MW Combined Cycle Power Plants (CCPPs). Energies. 2023; 16(19):6822. https://doi.org/10.3390/en16196822
Chicago/Turabian StyleRyu, Ju-Yeol, Sungho Park, Changhyeong Lee, Seonghyeon Hwang, and Jongwoong Lim. 2023. "Techno-Economic Analysis of Hydrogen–Natural Gas Blended Fuels for 400 MW Combined Cycle Power Plants (CCPPs)" Energies 16, no. 19: 6822. https://doi.org/10.3390/en16196822
APA StyleRyu, J. -Y., Park, S., Lee, C., Hwang, S., & Lim, J. (2023). Techno-Economic Analysis of Hydrogen–Natural Gas Blended Fuels for 400 MW Combined Cycle Power Plants (CCPPs). Energies, 16(19), 6822. https://doi.org/10.3390/en16196822