Abstract
This article investigates the application of the pulse voltage method for detecting interturn short-circuit faults in the high-voltage windings of dry-type voltage transformers. We determined the characterization parameters of the high-voltage windings of dry-type voltage transformers and trends in the variation of the characterization parameters with frequency in the presence and absence of faults. The viability of using the pulse voltage method for the detection of interturn short-circuit faults in dry-type voltage transformers was analyzed. A pulse voltage test platform was designed to analyze the response voltage waveforms using pulse-oscillating voltage experiments on transformers with various short-circuit faults. The results demonstrate that during a turn-to-turn short circuit, the equivalent resistance and inductance of a high-voltage winding are significantly lowered. When employing the pulse voltage method to investigate interturn short-circuit faults, tiny inductors are connected in parallel to produce an oscillating voltage waveform that is more uniform. Upon incurring a short circuit between turns, the pulse’s oscillating voltage frequency increases. The greater the number of turns in the short-circuit fault is, the more significant the effect of the test.
1. Introduction
The voltage transformer, which may isolate measuring instruments and other equipment from a high-voltage system and expand the potential applications of low-voltage instruments, is a crucial component of power systems [1,2]. Compared to oil-immersed voltage transformers and SF6 gas-insulated voltage transformers, dry-type voltage transformers, which are frequently used in power systems, offer the advantages of straightforward designs, simple maintenance, and low costs [3]. However, a dry-type voltage transformer in a power system may break or even burn down due to insulation aging caused by overvoltage or other issues, such as long-term operation [4,5].
Many scholars have therefore studied the problem of turn-to-turn short-circuit faults in dry-type voltage transformers. The authors of [6,7] employed the lightning shock test to diagnose the turn-to-turn insulation of voltage transformers. The authors of [8] used the partial discharge technique to test the insulation of solid-insulated electromagnetic voltage transformers. The use of lightning impulse tests in the field is restricted by factors such as equipment size, intricate setup requirements, and wave adjustment requirements. Poor resistance to electromagnetic interference is also a flaw in the partial discharge approach. The turn-to-turn insulation of the voltage transformers was tested in [9,10] via the variable voltage ratio measurement method. The authors of [11,12] checked a voltage transformer’s application range by measuring the DC resistance of its windings. Both test methods are available in low-voltage detection schemes. However, the test results become unclear when interturn faults are present in high-turn voltage transformers. In coil-type devices such as transformers, turn-to-turn faults can result in tiny winding deformation defects that can be found using the scanning frequency response approach [13,14]. The method uses a voltage excitation signal to excite the windings, and the deformation brought on by a fault will cause the input-to-output response ratio to be out of whack, allowing the winding fault to be detected. However, the diagnostic band of the procedure is dependent on the make and model of the equipment being examined, its range is hard to ascertain, and the specific implementation approach is not practical. Therefore, it is crucial to develop a novel method for detecting turn-to-turn short-circuit faults in dry-type voltage transformers to lower the rate of operating faults and raise the security and stability of power systems.
A typical technique for assessing turn-to-turn short-circuit faults in coil-type equipment is the pulse voltage method [15,16]. The principle of the pulse voltage method is that the test power supply charges the charging capacitor, and the charging capacitor discharges the parallel equipment to be tested, forming an oscillating test voltage. When compared to the waveform of the standard oscillating voltage, the frequency of the oscillating test voltage will change if a turn-to-turn short-circuit defect occurs in the equipment, concluding the equipment detection. This technique makes conducting testing in the field simple and is resistant to external electromagnetic fields. Therefore, we attempt to assess the turn-to-turn insulation of dry-type voltage transformers using the pulse voltage approach. When interturn faults occur in the field, dry-type voltage transformers frequently become nonmetallic short circuits. The wire turn insulation is destroyed by the high voltage pulses used during testing via the pulse voltage method. As a result of the defective turns, an arc forms, and a metallic short circuit results [17,18]. Pulse voltage test equipment has been used to evaluate the turn-to-turn short-circuit faults of motors, dry-type air-core reactors, transformers, and other equipment in recent years. The pulse voltage method was utilized in [19,20,21,22] to detect turn-to-turn short-circuit faults in motors. Turn-to-turn short-circuit faults in dry-type air-core reactors were tested using the impulse voltage approach described in [23,24,25]. The authors of [26,27,28,29,30,31] used the impulse voltage method to inspect the turn-to-turn insulation of transformers. The impedance and inductive resistance of dry-type voltage transformers are substantially higher than those of other types of coil equipment; the impedance is too high to produce an oscillation test voltage, and the inductive resistance is too high to cause the oscillation frequency to be low, obscuring the detecting effect. It is thus questionable whether the turn-to-turn short-circuit fault testing of dry-type voltage transformers can be performed using the pulse voltage method.
Sheets of silicon steel are used to produce the cores of dry-type voltage transformers. This work used a JDZX9-20Q dry-type voltage transformer produced by Dalian No. 2 Instrument Transformer Group in China (which is frequently used in power systems) to ensure broadly applicable results. A sample device was constructed to determine the characterization parameters of the windings in dry-type voltage transformers and the changes in the characterization parameters with frequency in the presence and absence of faults. Calculations of the characteristic parameters of high-voltage windings in experimental dry-type voltage transformers were performed, and the feasibility of the impulse voltage method was analyzed. A pulse voltage test platform was designed to analyze the response voltage waveforms from pulse-oscillating voltage experiments on specimens with various short-circuit turns. The results can serve as a theoretical guide and practical foundation for the identification of turn-to-turn short-circuit faults in dry-type voltage transformers.
2. Experiments and Calculations of the Characterization Parameters
In the presence and absence of faults, we varied the system characterization parameters with frequency to determine a test frequency for the turn-to-turn short circuit fault testing of the dry-type transformer’s high-voltage windings using the impulse voltage method. The equivalent inductance and resistance of the high-voltage winding of a dry-type voltage transformer are influenced by several variables, including the permeability of the iron core, the eddy current loss, the number of turns, and the DC resistance. The permeability of the iron core and the eddy current loss change with the frequency of the applied voltage. The iron core of a JDZX9-20Q dry-type voltage transformer was chosen, sample devices with various numbers of turns were made, and test benches were configured to examine the relationship between the coil’s characterization parameters and its number of turns at various frequencies. The equivalent resistance and inductance of a dry-type voltage transformer with a relatively greater number of high-voltage winding turns were computed and determined using the results of the characterization parameters of the coils, with and without the flaws of the device with relatively fewer turns.
2.1. Basic Principles of the Characterization Parameter Test
The test specimen for the core coil model had a small number of coiled coil turns. In this test, the equivalent capacitance values of the model specimen exceeded the pF level, and the equivalent capacitive resistance values in the frequency range tested were close to hundreds of MΩ. The equivalent resistance and equivalent inductance of the model specimen were smaller at the Ω and mH levels, and the equivalent series impedance was roughly tens of kΩ. Since the equivalent capacitive resistance value was much higher than the equivalent impedance, the equivalent capacitance branch almost never had current flowing through it, and the equivalent capacitance value was essentially unaffected by the voltage frequency and turn-to-turn short-circuit fault. The core coil was equivalent to an R, L series circuit during the testing process.
The test circuit used for determining the characterization parameters of the coil is shown in Figure 1. The dashed box represents the power analyzer, Us is the inverter-based AC power supply, and R, L together represent an iron core coil.
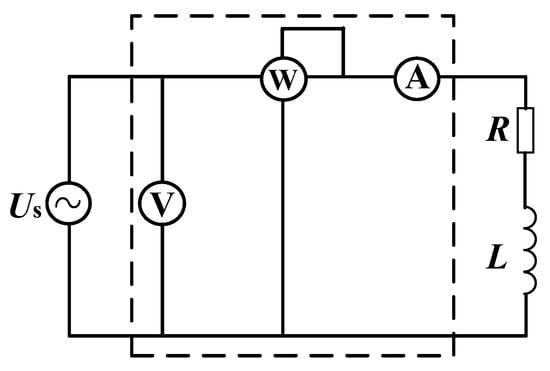
Figure 1.
Schematic circuit diagram of the characterization parameter determination test for coils.
A sinusoidal AC voltage was applied to the core, and quantities such as the voltage U, current I, and active power P were read from the power analyzer. The specific values of the apparent power S, reactive power Q, equivalent resistance R, equivalent reactance X, and equivalent inductance L were calculated according to (1) to (5).
2.2. Test Platform and Specimen
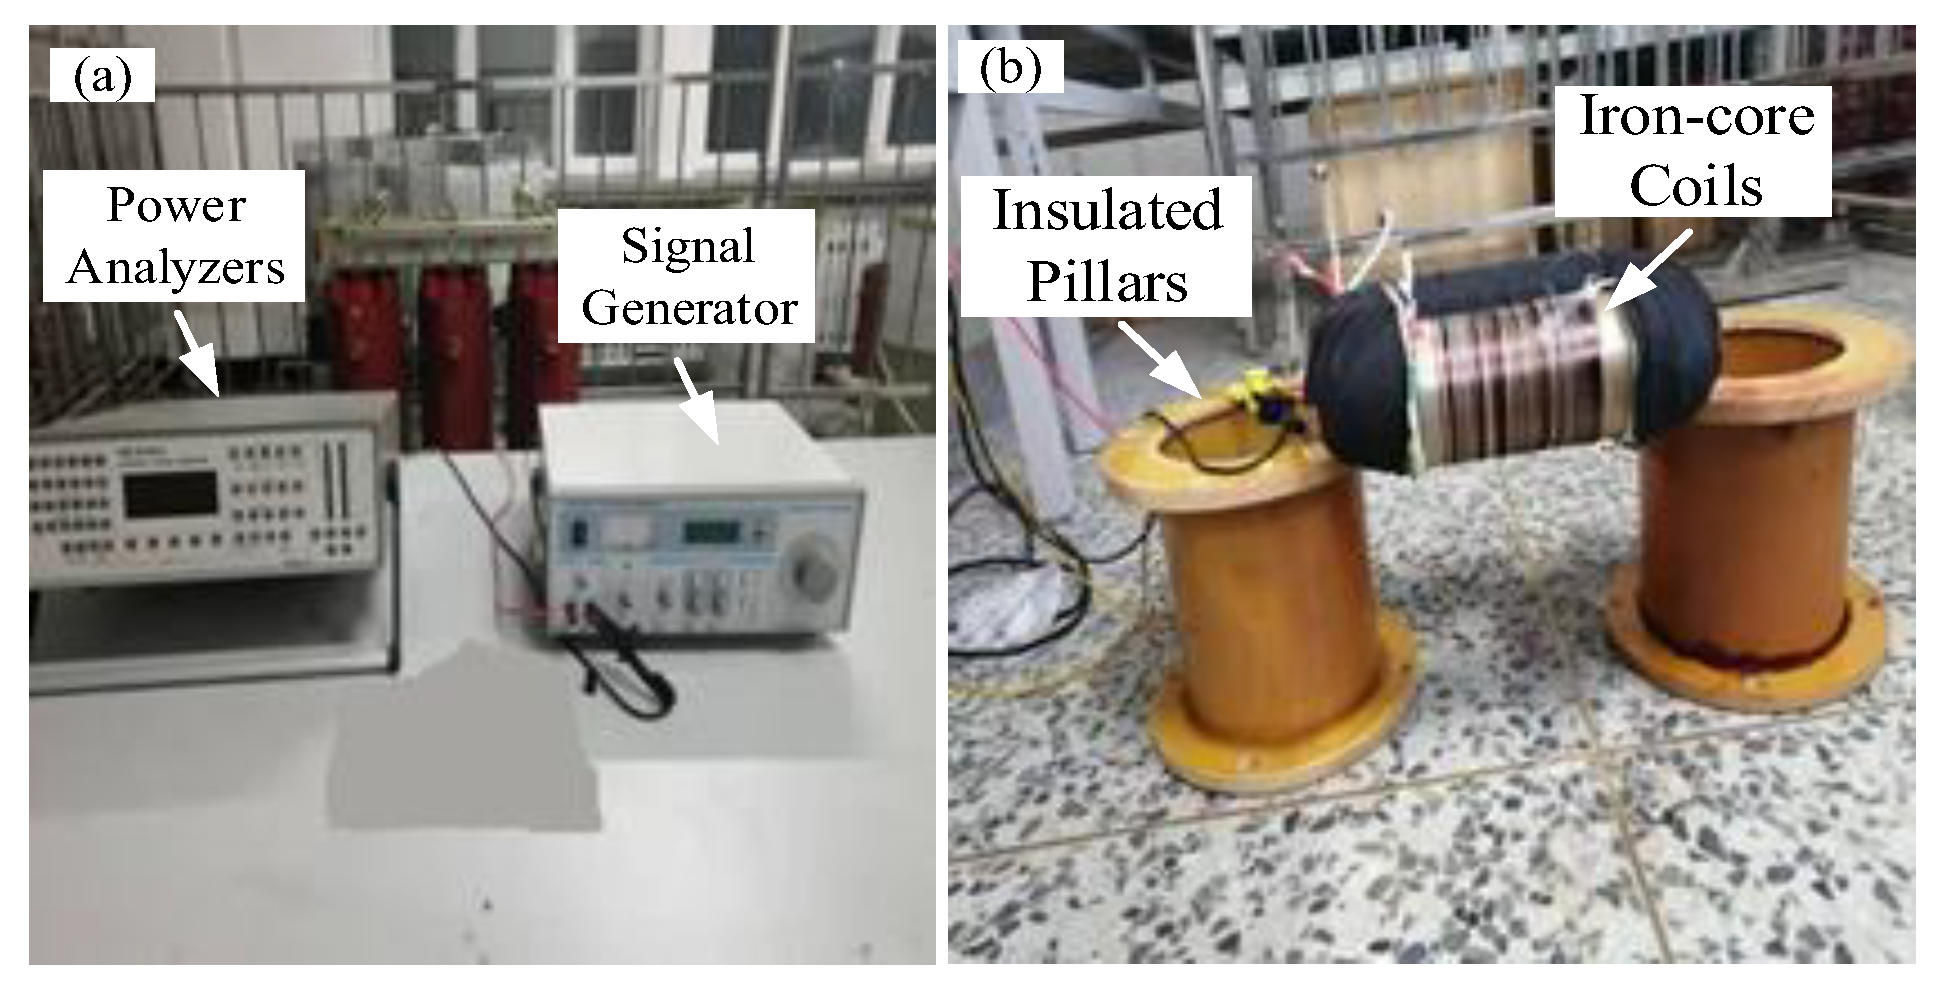
A Voltech PM3000A three-phase high-precision power analyzer and a YE1311E inverter signal generator produced by Shenzhen Xinyaode Electronic Instrument Co., Ltd. in Shenzhen, China were the system components used for measuring the coil characterization parameters. We built the test platform according to the circuit in Figure 1. Iron core coils of 10, 40, 100, and 100 turns, each with a single short-circuit fault, were constructed using an iron core obtained from a JDZX9-20Q-type dry-type voltage transformer. The system for measuring the characterization parameters is shown in Figure 2, with the power analyzer and signal generator on the left and the iron core coil device on the right.

Figure 2.
Characterization parameter measurement system for coils. (a) The power analyzer and signal generator; (b) the iron core coil device.
2.3. Relationship between Characterization Parameters and Coil Turn Ratio
For a voltage input at 50 Hz, the ratio of the equivalent resistance and inductance for the coil is equal to the square of the ratio of the coil turns. When the input frequency decreases, the relative permeability of the iron core transformer decreases, the magnetic flux is lower than at the power frequency, and the iron core is in an unsaturated state. To determine whether this relationship between the characterization parameters and turn ratio still holds at high frequencies, coil tests at high frequencies was conducted.
During the test, a voltage of 2.5 V was applied to the 10-turn coil, and a voltage of 10 V was applied to the 40-turn coil so that a voltage ratio of 4:1 was satisfied. A signal generator was used to apply high-frequency AC voltages with frequencies of 500 Hz, 1000 Hz, 2000 Hz, 5000 Hz, and 8000 Hz to the core coil. The voltage U and current I were measured using the power analyzer, and the resistance R and inductance L were computed. The data are shown in Table 1.

Table 1.
Test data of the characterization parameters of the core coils at high frequencies.
Table 1 shows that the relationship between the coil parameters and turn ratios in the frequency range of 500 Hz–8000 Hz is the same as the relationship in the power frequency range. The ratio of the equivalent resistance to the inductance is equal to the square of the turn ratio. This proves that as the frequency increases, the iron core does not completely fail and the magnetic flux continues to pass through it, even though its relative permeability decreases.
2.4. Trends in the Frequency Variations of the Coil Characterization Parameters with and without a Fault
The viability of using the pulse voltage method to evaluate the interturn insulation of dry-type voltage transformers was further analyzed. The characteristic parameters of experimental dry-type voltage transformers with and without faults were calculated using the values of the characteristic parameters of low-turn coils (with and without faults), based on the relationship between these characteristic parameters and the turn ratio.
When winding a coil with too many turns, its equivalent resistance is too high, and the output current is inadequate. Therefore, accurate current readings cannot be recorded on the power analyzer due to its limited current detection range. As a result, 100 turns of undamaged and single-turn short-circuit-fault iron-core coils were used to simplify the ensuing computation.
The equivalent resistance and inductance of the dry-type voltage transformer with a high-voltage winding, without a defect, and with a single short-circuited turn were calculated in a frequency range from 50 to 8000 Hz. The variations in the characterization parameters with the frequency are plotted in Figure 3 and Figure 4.
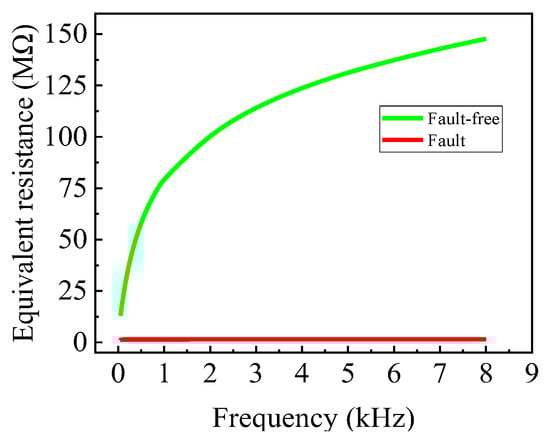
Figure 3.
Variation in the equivalent resistance of the dry-type voltage transformer with frequency, with and without a fault.

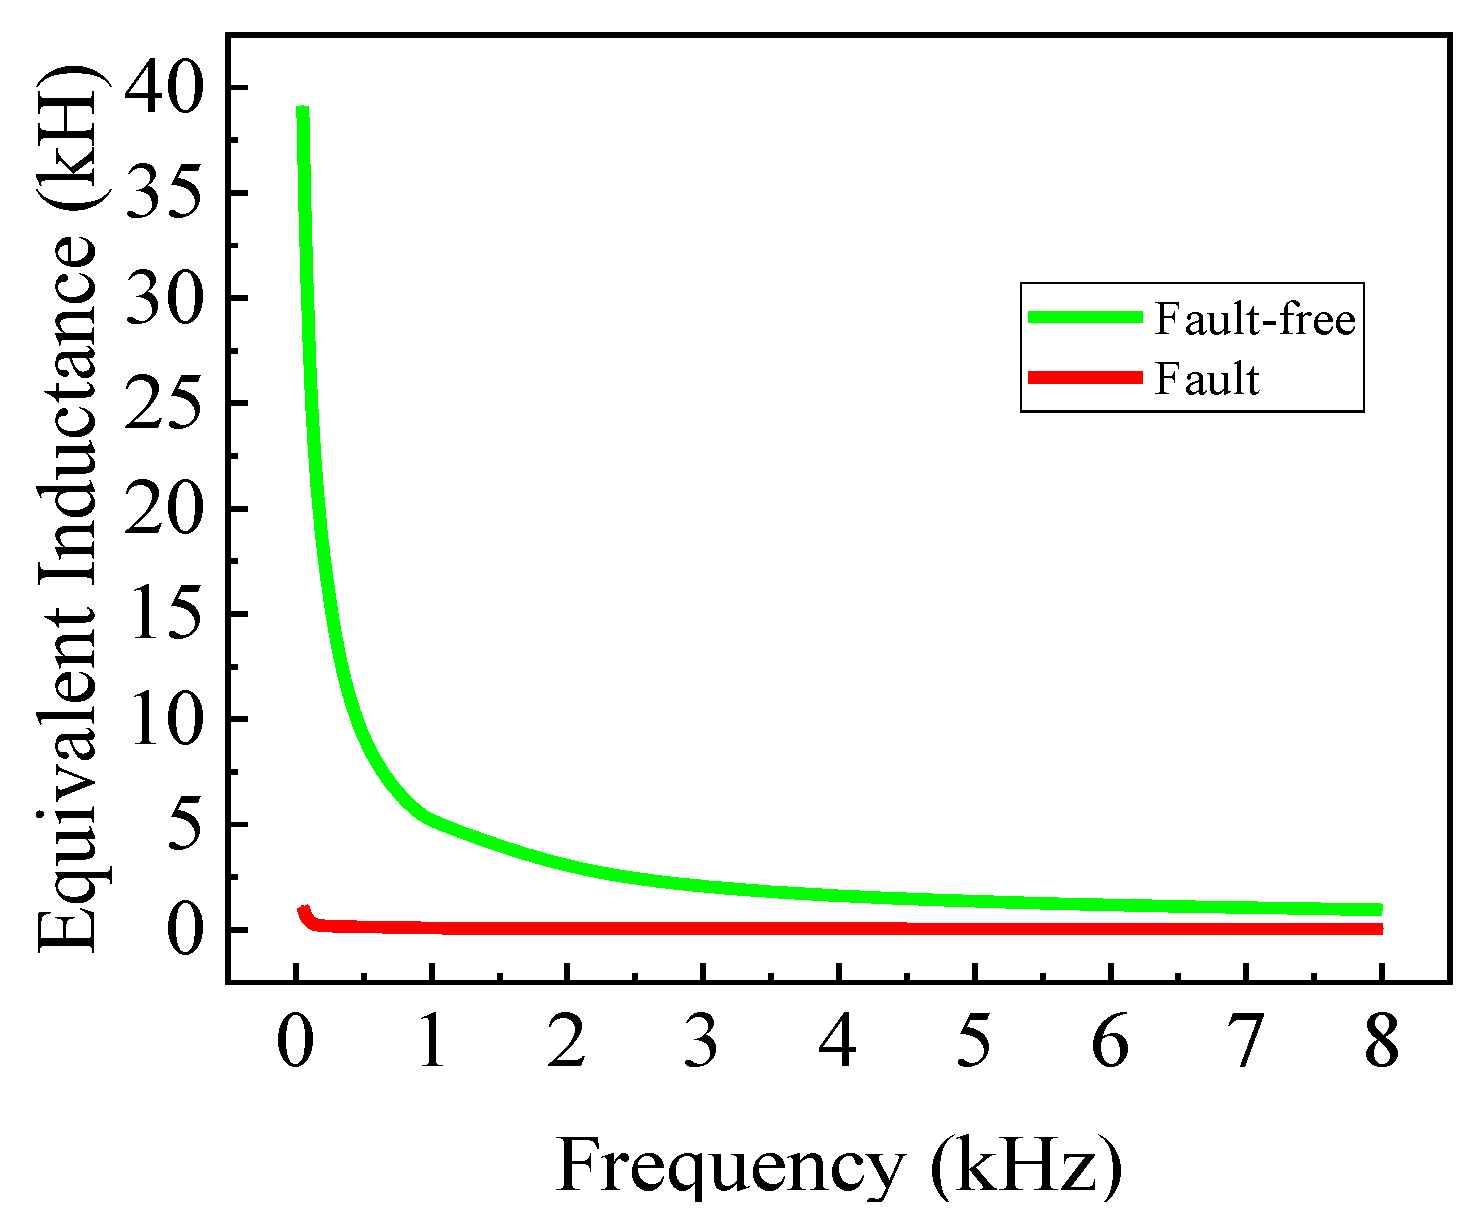
Figure 4.
Variation in the equivalent inductance of the dry-type voltage transformer with frequency, with and without a fault.
According to the fault-free curve in Figure 3, the equivalent resistance increases with increasing frequency. At low frequency, the equivalent resistance increases rapidly with frequency. As the frequency reaches 500 Hz, the equivalent resistance continues to increase but at a slower rate.
According to the fault-free curve in Figure 4, the equivalent inductance decreases with increasing frequency. At a low frequency, the equivalent inductance decreases rapidly with frequency. The equivalent inductance continues to decrease after the frequency is close to 500 Hz, but the rate of reduction slows, and the inductance eventually stabilizes. The rotational velocity in the magnetic domain steadily decreases as the frequency of the applied voltage increases, which leads to a decrease in the equivalent inductance. The magnetic permeability shows a decreasing trend with frequency. The equivalent inductance tends to remain steady when the frequency reaches a specific level because the core’s permeability is virtually zero at that point.
The relationship between the equivalent resistance and inductance with frequency and with no fault was fit (1stopt5.5 software) without requiring an initial value. The optimal function formula was selected based on parameters such as the root mean square error and correlation coefficient.
The equivalent resistance as a function of frequency was fit as follows:
where R is the equivalent resistance, f is the voltage frequency, a = −108.139, b = 63.346, and c = 0.156.
The equivalent inductance as a function of frequency was fit as follows:
where L is the equivalent inductance, f is the voltage frequency, a = 1.644 × 10⁻⁵, and b = 1.966 × 10⁻⁷.
From the comparison of the characterization parameters in Figure 3 and Figure 4 with and without faults, the data show that the equivalent resistance and inductance with faults are much smaller than the equivalent resistance and inductance without faults. The frequency of the oscillating voltage and the equivalent inductance of the coil are negatively correlated when the pulse voltage method is used for the turn-to-turn short-circuit fault testing of coil-type equipment. Consequently, the test voltage waveform’s oscillating frequency greatly increases following a problem when using the pulse voltage method for conducting an interturn inspection on a dry-type voltage transformer. If a problem exists with the interturn insulation of the high-voltage winding, then this problem can be detected by comparing the oscillation frequencies of the test voltage waveforms.
3. Design of the Pulse Voltage Test Circuit
3.1. Analysis of the Pulse Voltage Test Circuit
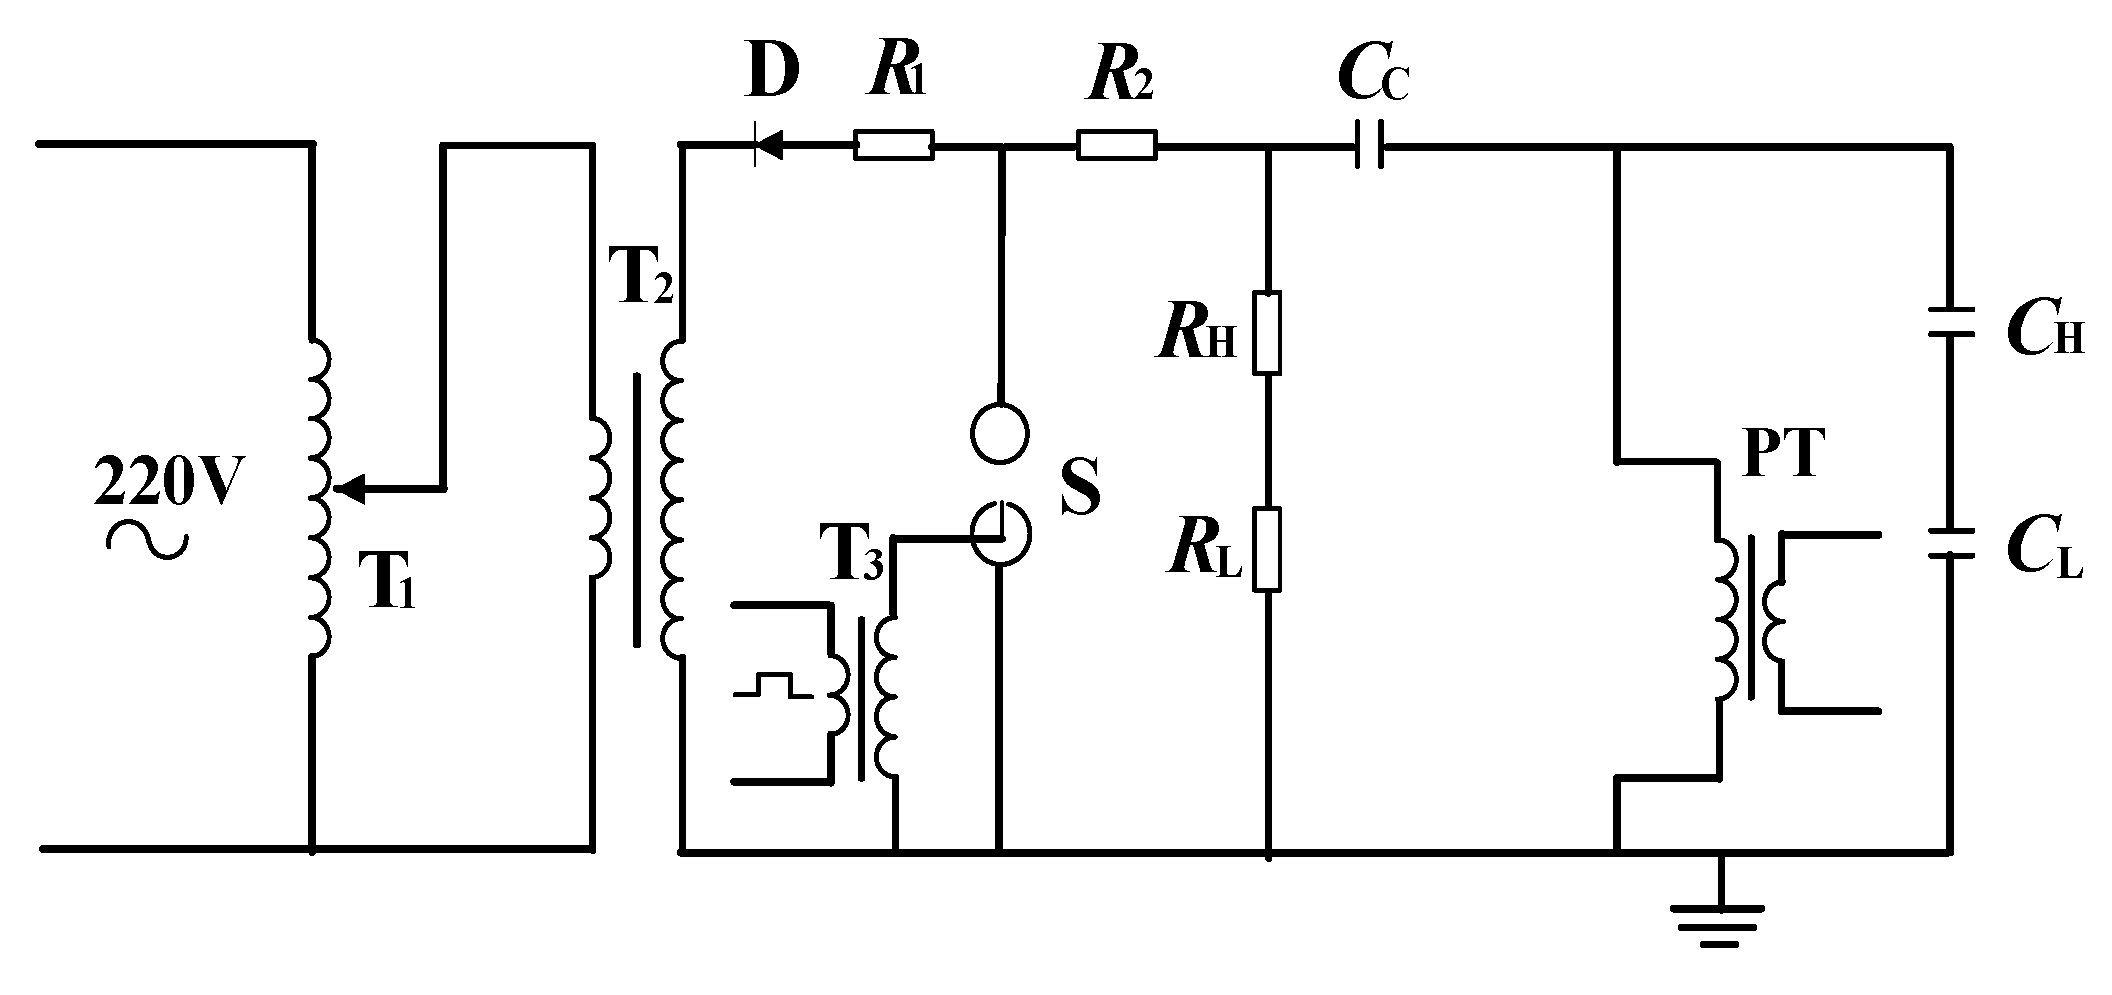
We refer to the standard for impulse voltage tests of the interturn insulation of dry-type air-core reactors [32]. Based on this method, a turn-to-turn insulation test system for dry-type voltage transformers was designed. The schematic circuit diagram was improved to exchange the position of the charging capacitor and the ball gap switch and realize the controlled discharge of the ball gap switch. The new test circuit for dry-type voltage transformer turn-to-turn insulation is shown in Figure 5. In the figure, T1 is the voltage regulator, T2 is the high-voltage transformer, T3 is the trigger transformer, D is the high-voltage rectifier silicon stack, R1 is the protection resistor, R2 is the damping resistor, S is the controlled-discharge sphere gap, RH is the high-voltage arm of the resistance divider, RL is the low-voltage arm of the resistance divider, CH is the high-voltage arm of the capacitor divider, CL is the low-voltage arm of the capacitor divider, CC is the charging capacitor, and PT is the dry-type voltage transformer.
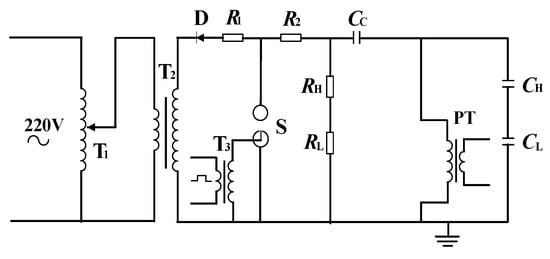
Figure 5.
Pulse test circuit for the dry-type voltage transformer.
The working process of the pulse test circuit is as follows: when the output voltage of the AC power supply is in its negative half-cycle, the high-voltage silicon stack is on, the ball gap is off, and the test circuit charges. When the output voltage of the AC power supply is in its positive half-cycle, the high-voltage silicon stack cuts off, the ball gap discharges, and the main capacitor CC discharges to the dry-type voltage transformer PT. This discharge energy is transformed using the magnetic and electric fields of the high-voltage winding in the PT and the main capacitor CC until it is completely absorbed by the circuit’s resistance and the damping resistor. Finally, the pulse oscillating test voltage is obtained at both ends of the high-voltage winding of the PT.
The main capacitor CC is set at 3 nF upon considering charging effectiveness, cost, and the reference test for the interturn insulation of dry-type air-core reactors using impulse voltage, resulting in equivalent impedance ZC = 1.05 MΩ during the charging of the AC power supply at the resonant power frequency. According to (6) and (7), the equivalent inductance and resistance of the JDZX9-20Q dry-type voltage transformer were calculated to be 39,096 H and 13 MΩ, respectively. During this charging, the equivalent impedance Z1 = 17.88 MΩ this charging. According to the electrostatic capacitance formula, the PT equivalent capacitance C = 15.98 pF, stray capacitance Cg1 = 70.13 pF, Cg2 = 41.91 pF, and equivalent capacitive reactance Z2 = 19.91 MΩ were determined. During this calculation, the capacitance branch could not be ignored as current flows through the transformer via both the R, L series branch and the interturn capacitance C branch. The total PT impedance ZPT = 9.42 MΩ. The main capacitor CC was unable to meet the charging requirement while the high-voltage silicon stack was conducting because the ZPT was significantly larger than the ZC. Therefore, a small inductor was connected in parallel with the PT to reduce its equivalent impedance.
3.2. Improvement and Simulation of the Pulse Test Circuit
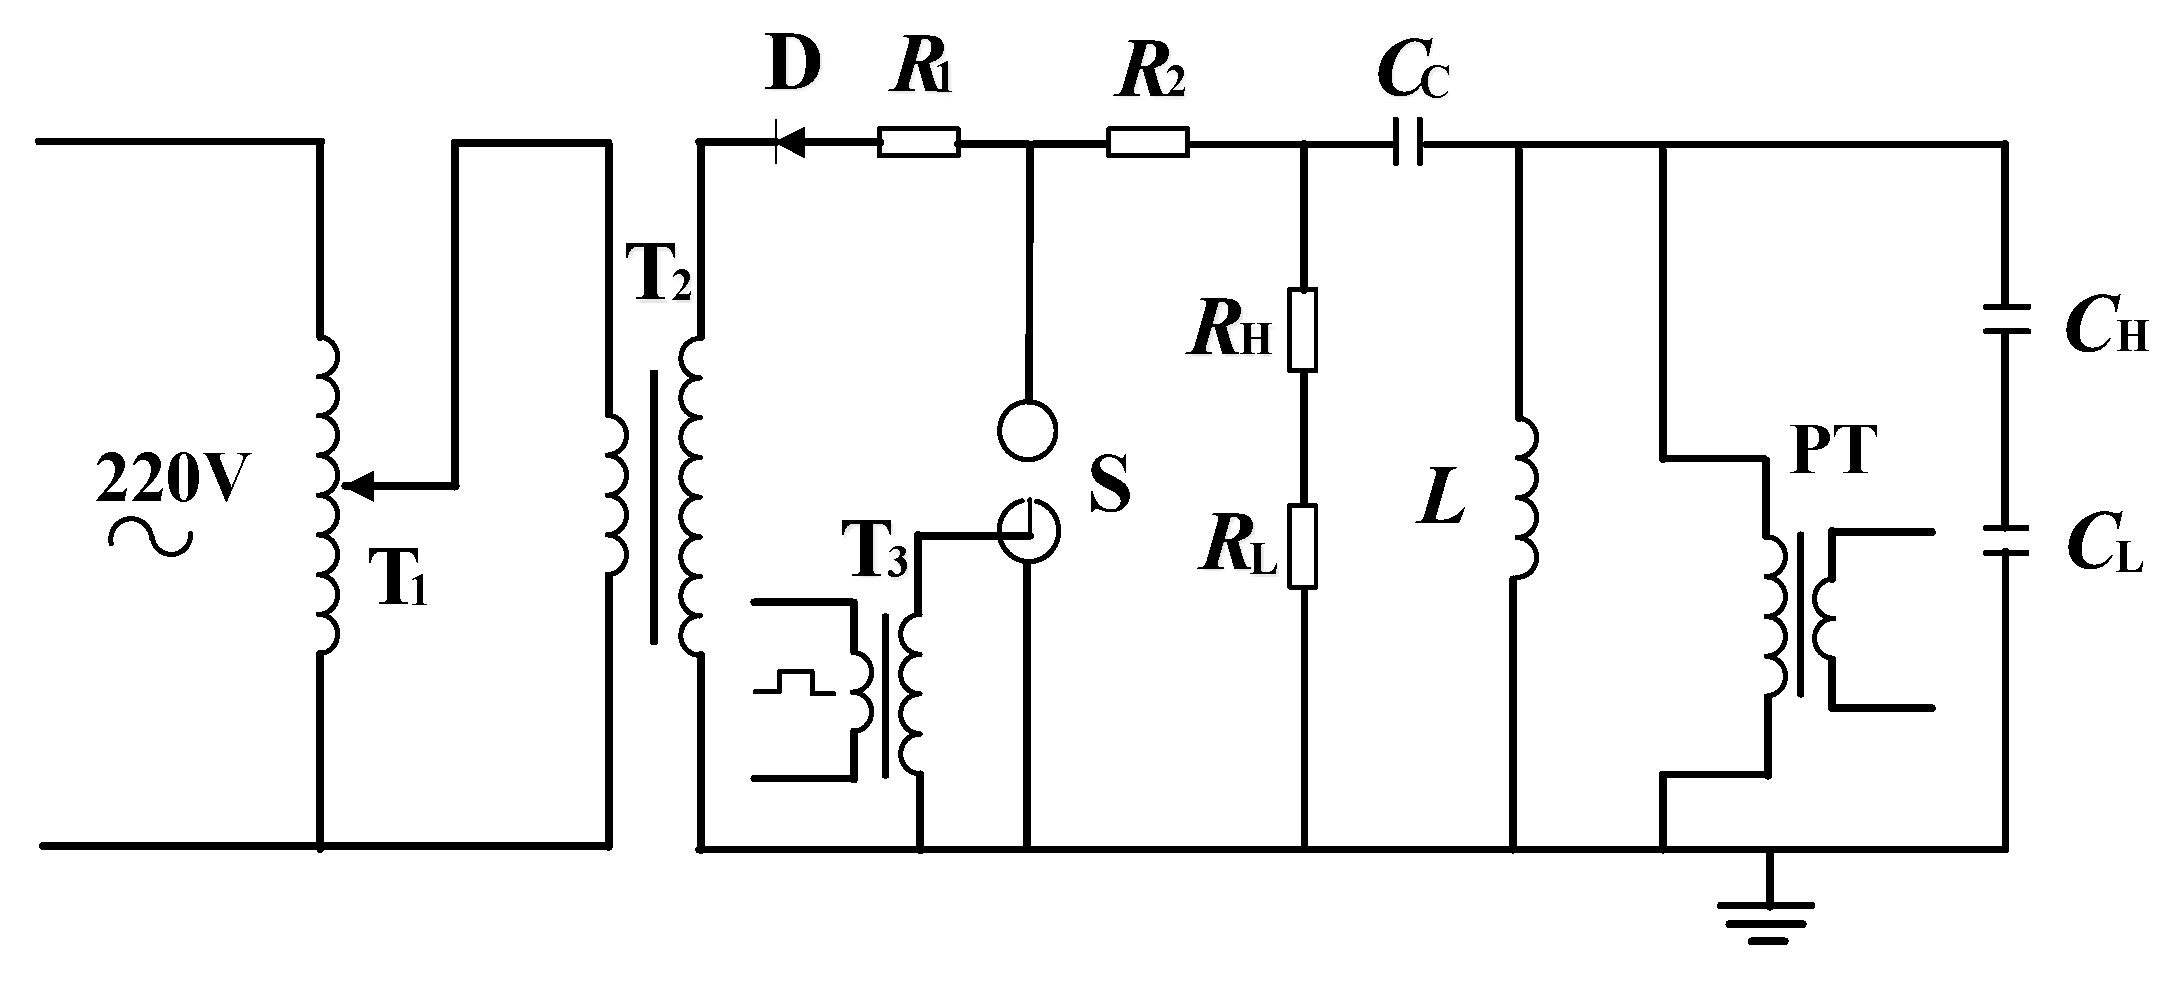
Based on the analysis in Section 3.1, an inductor was connected in parallel at both ends of the PT. The modified circuit is shown in Figure 6.
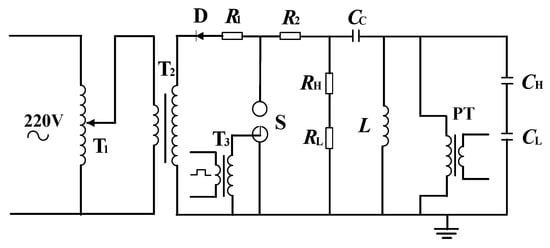
Figure 6.
Improved pulse test circuit for the dry-type voltage transformer.
Where L is a parallel inductor. According to the trends in the frequency variations of the equivalent resistance and inductance with the frequency with and without a fault in Figure 3 and Figure 4, the resistance changed minimally before and after the fault at frequencies below 500 Hz. The difference in inductance before and after the fault was also minimal at frequencies greater than 500 Hz.
The experimental test oscillation frequency of 500 Hz was chosen carefully. At this frequency, the high-voltage winding of the dry-type voltage transformer had an equivalent resistance of 58.9 MΩ and an equivalent inductance of 8715.4 H. The oscillating frequency of the test voltage was impacted by a significant equivalent resistance. The attenuation coefficient should be considered during the calculation of the specific value of the shunt inductor.
where is the intrinsic oscillation frequency, is the attenuation coefficient, and is the actual oscillation frequency.
We substituted the value of the main capacitance and the characterization parameters of the fault-free dry-type voltage transformer at 500 Hz into (8) to (10). The parallel inductance value was calculated to be 23 H.
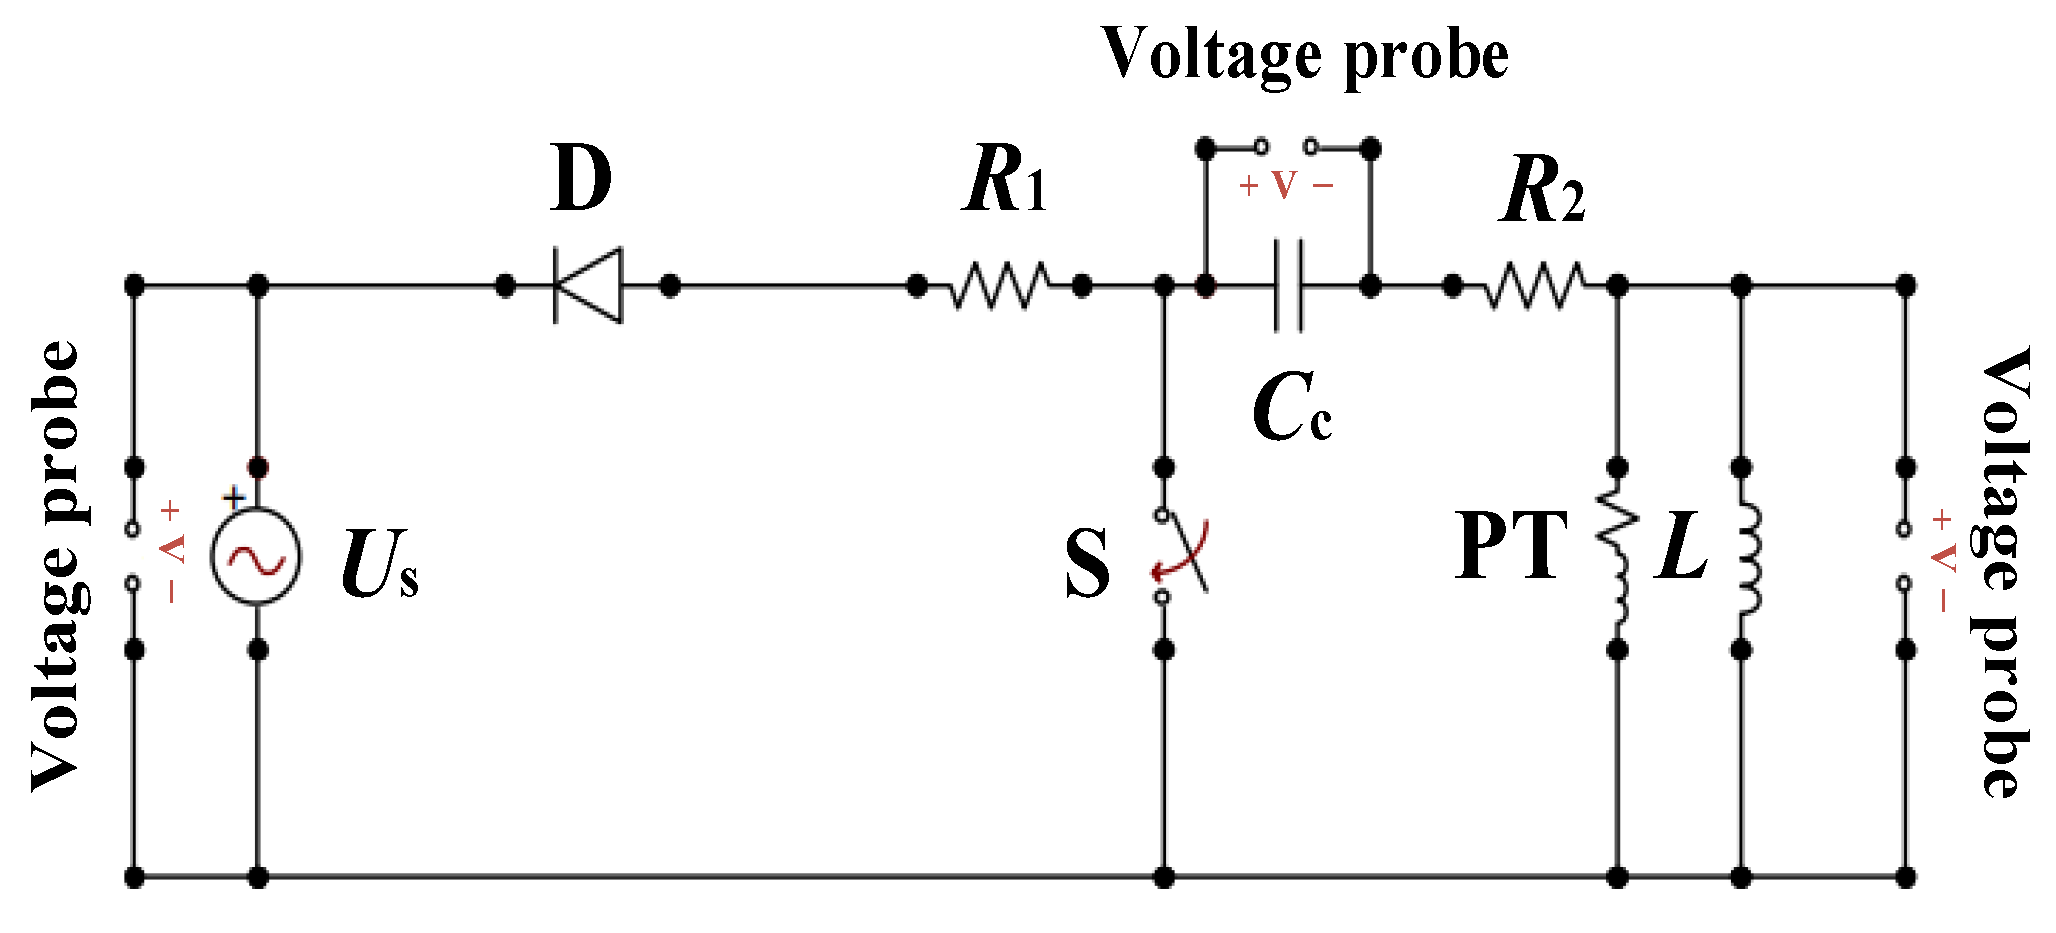
The rated voltage of the JDZX9-20Q dry-type voltage transformer is 20 kV. The settings for voltage transformer-related tests can be found in [33]. Additionally, considering the saturation of the iron core, the pulse test voltage was determined to be 60 kV. The 23 H inductor obtained from the above calculation was connected in parallel with both ends of the PT to obtain the simulation circuit shown in Figure 7.
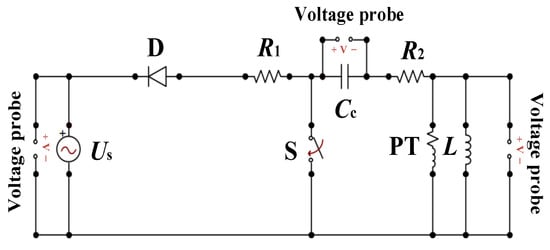
Figure 7.
Simulation diagram of the improved pulse test circuit.
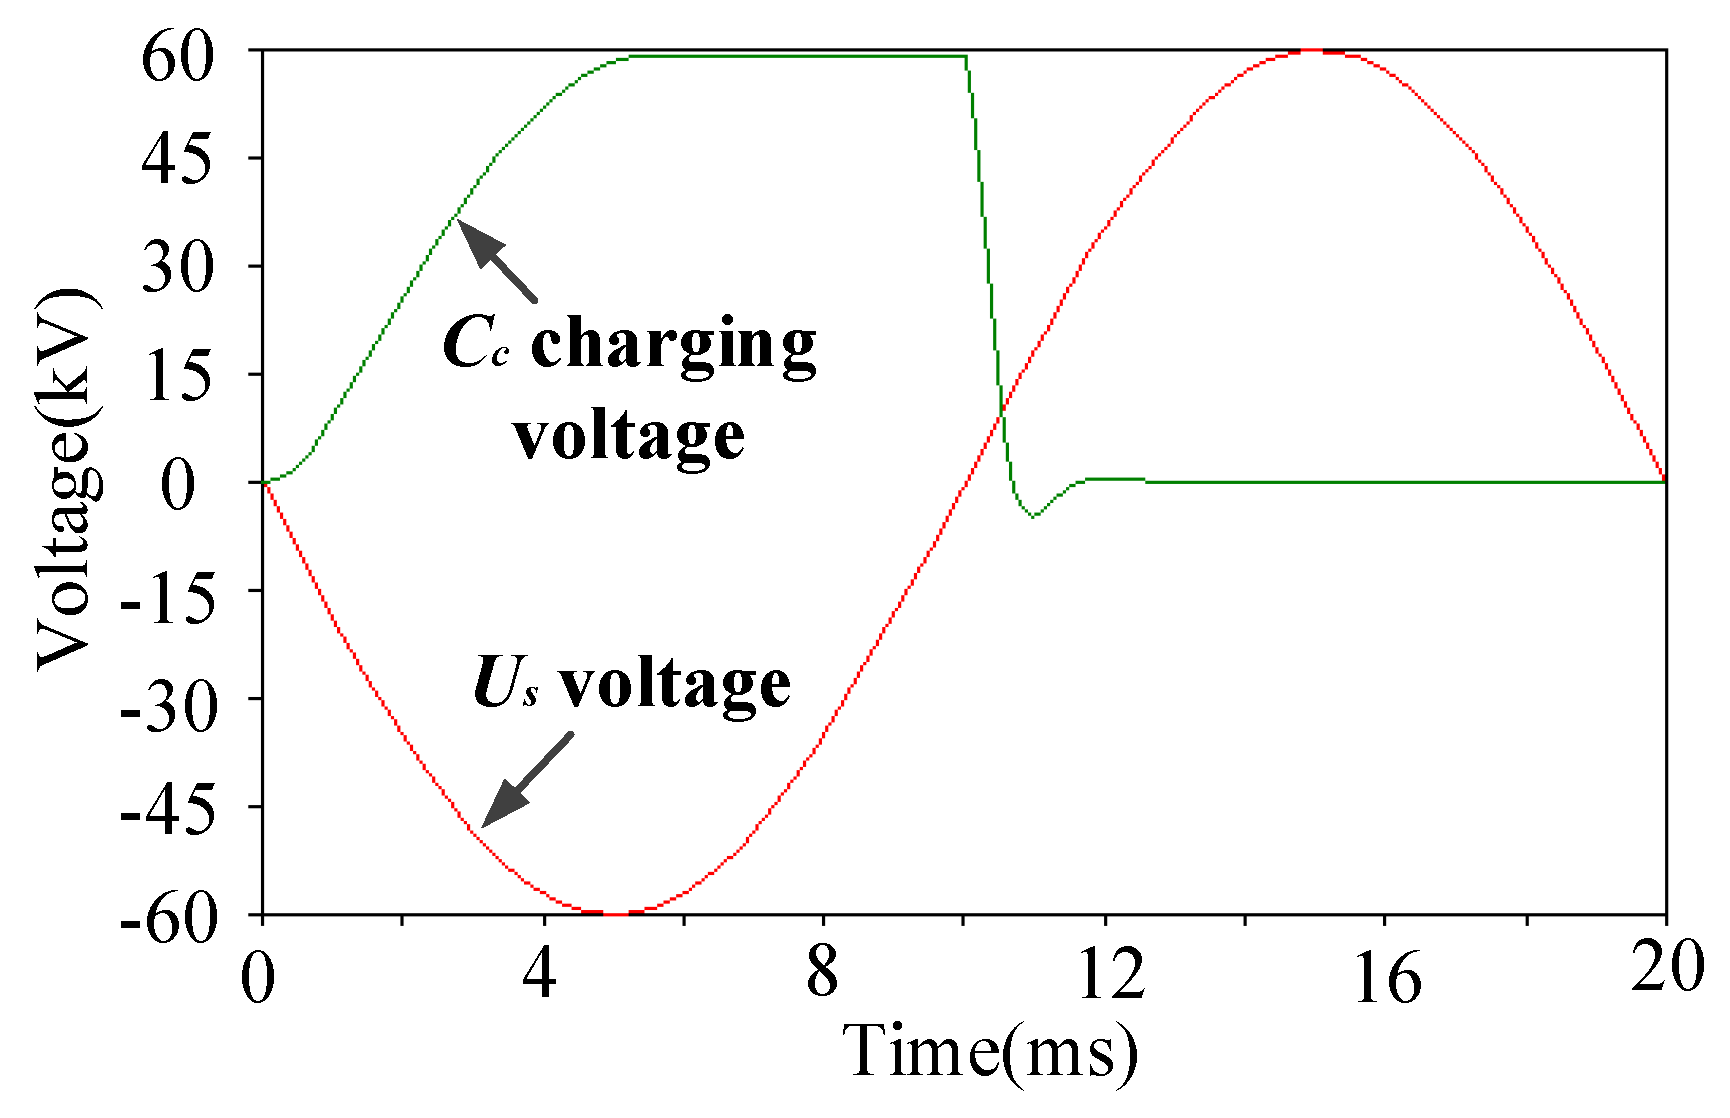
The voltage waveforms of the charging capacitor CC and the power supply Us during the charging process as measured by the voltage probe, are shown in Figure 8. The power supply Us was −60 sin (314t) kV, the charging time of the charging capacitor CC was 5 ms, and the charging voltage was 60 kV.
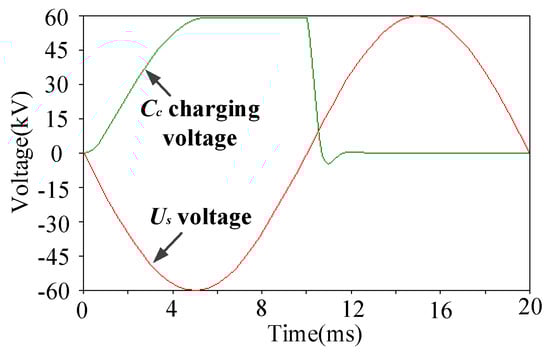
Figure 8.
The voltage waveform of the charging capacitor and power supply.
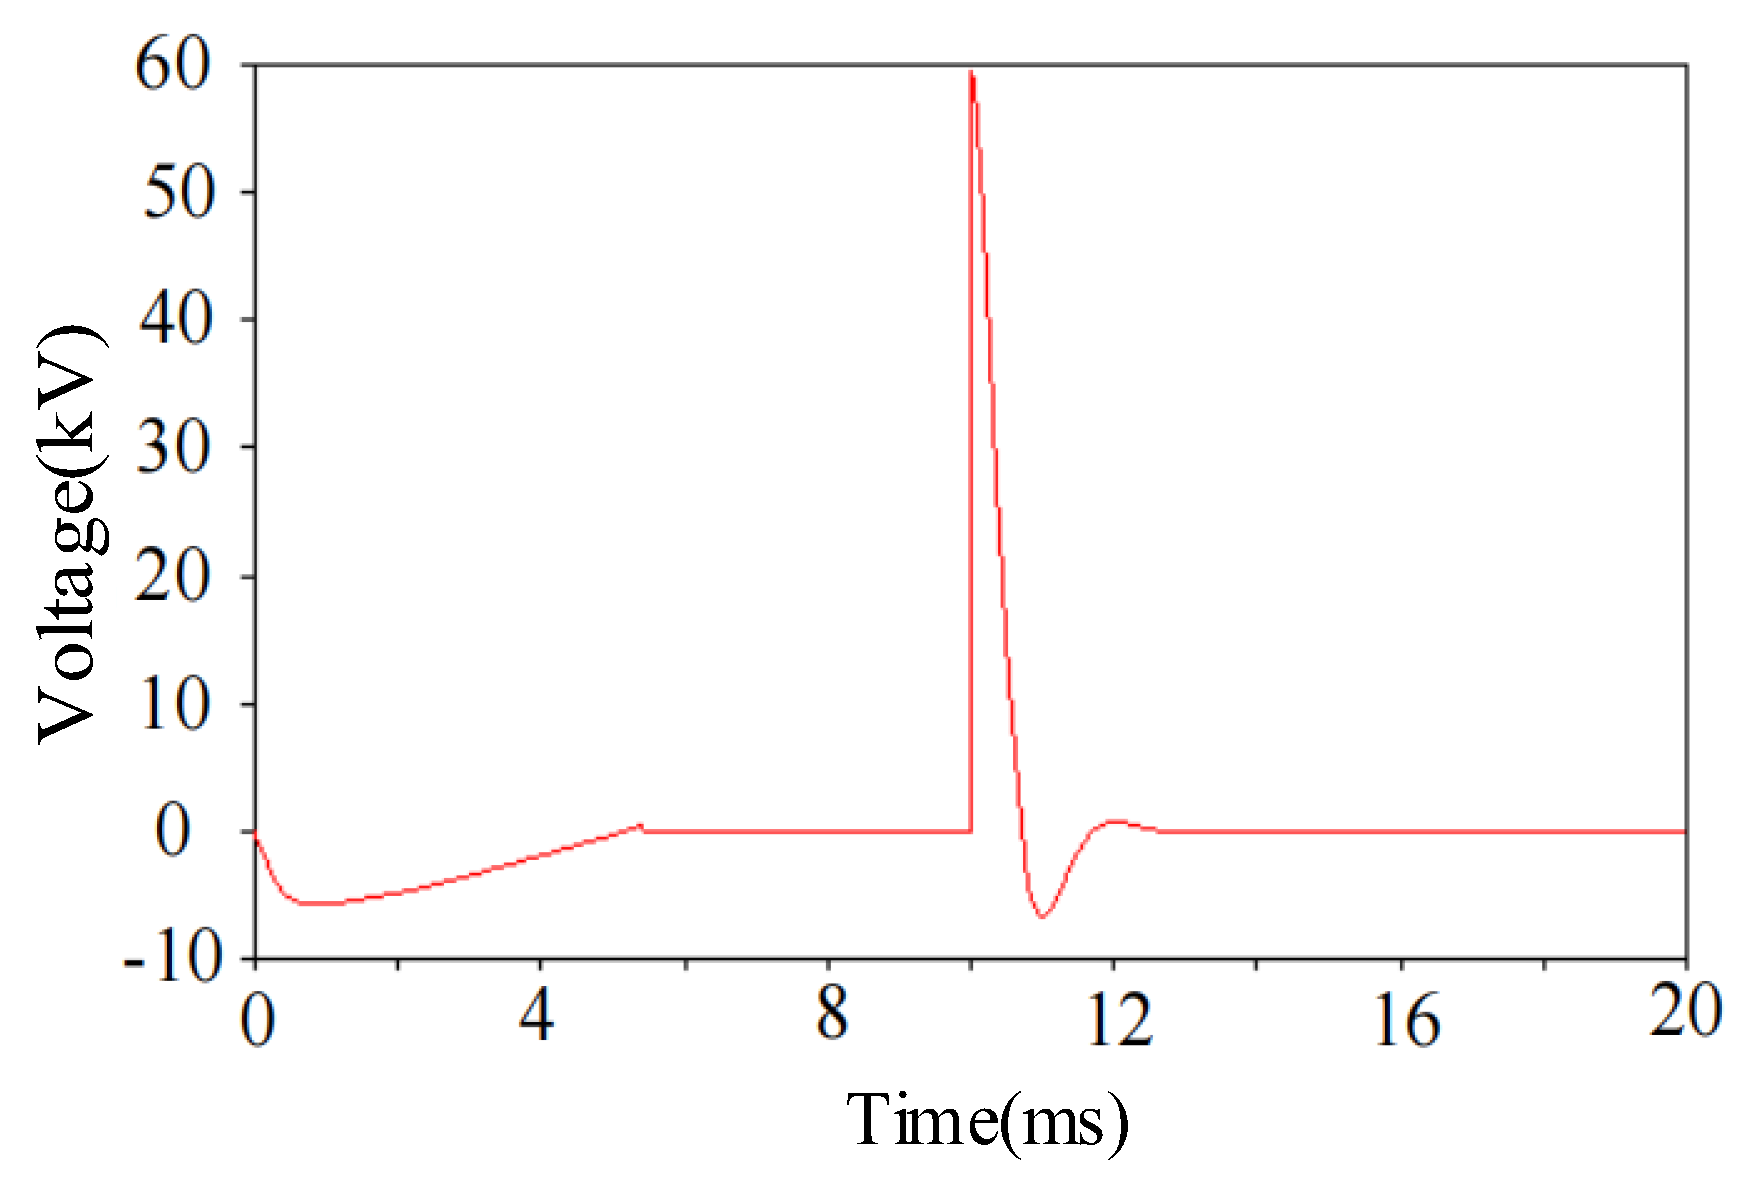
The voltage waveform during discharge across the dry-type voltage transformer positioned after the parallel inductor is shown in Figure 9.
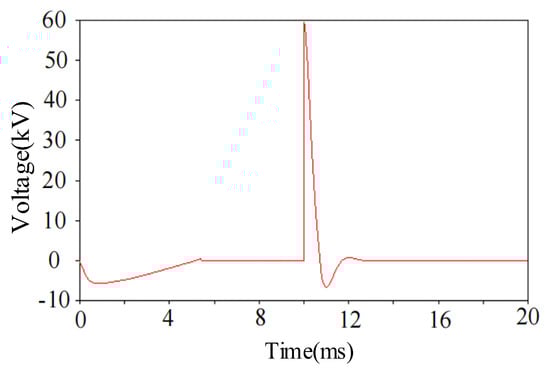
Figure 9.
Voltage waveform across dry-type voltage transformer without a fault.
The above figure shows that the dry-type voltage transformer obtains a decaying oscillating voltage, and the decay of this voltage waveform terminates within 2 ms. The oscillation frequency is 500 Hz. Thus, the charging capacitor completes charging and discharging in 20 microseconds, exceeding the national standard of 3000 cycles per minute.
When the test voltage frequency is 500 Hz, the fault-free PT has an equivalent inductance L = 8715.4 H, an equivalent resistance R = 58.9 MΩ, and an equivalent series branch impedance Z = 64.95 MΩ; the equivalent capacitive branch capacitance ZC = 19.91 MΩ remains constant. Its total equivalent impedance is 71.92 kΩ when connected in parallel with the 23 H inductor (an impedance of 72.26 kΩ). The equivalent inductance of the PT is 1.9 H, the equivalent resistance is 1.39 MΩ, the series branch impedance is Z = 1.40 MΩ, and the capacitive resistance ZC = 19.91 MΩ when there is a single-turn short-circuit problem in the winding. After the parallel connection with the added 23 H inductor, the total equivalent impedance is 47.56 kΩ.
When comparing the results before and after the fault, the equivalent capacitance C of the PT is essentially identical, but after the interturn short circuit, the equivalent inductance L and equivalent resistance R significantly decrease after the fault. Furthermore, as the equivalent inductance L decreases, the response test voltage waveform’s oscillation frequency in the fault case is increased in comparison to the no-fault case. Under the fault conditions, the equivalent inductance L drops more, and the frequency of the waveform oscillation increases more with the number of short-circuit turns.
To avoid the small inductor’s failure and its impact on our detection of interturn short-circuit faults in dry-type voltage transformers, before testing, the voltage waveform was measured at both ends of the small inductor. Then, the PT was tested for interturn short-circuit faults, and finally, the voltage waveform at both ends of the small inductor was measured again. If the voltage waveforms acquired prior to and following the measurement are the same, then the additional inductance has no impact on the detection of turn-to-turn short-circuit problems in dry-type voltage transformers. If there is a difference between the voltage waveforms measured before and after, the additional inductor is defective, making it difficult to detect interturn short-circuit defects and necessitating equipment repair or replacement.
4. Pulse Voltage Test of Dry-Type Voltage Transformer
4.1. Impulse Voltage Test
To determine whether it is feasible to use the pulse voltage method to evaluate the interturn insulation of high-voltage windings in dry-type voltage transformers, a test platform was built, and a pulse voltage test was performed on windings with and without interturn short-circuit faults. The difference between the two test voltage waveforms was then used to assess whether the dry-type voltage transformer has a turn-to-turn short-circuit fault.
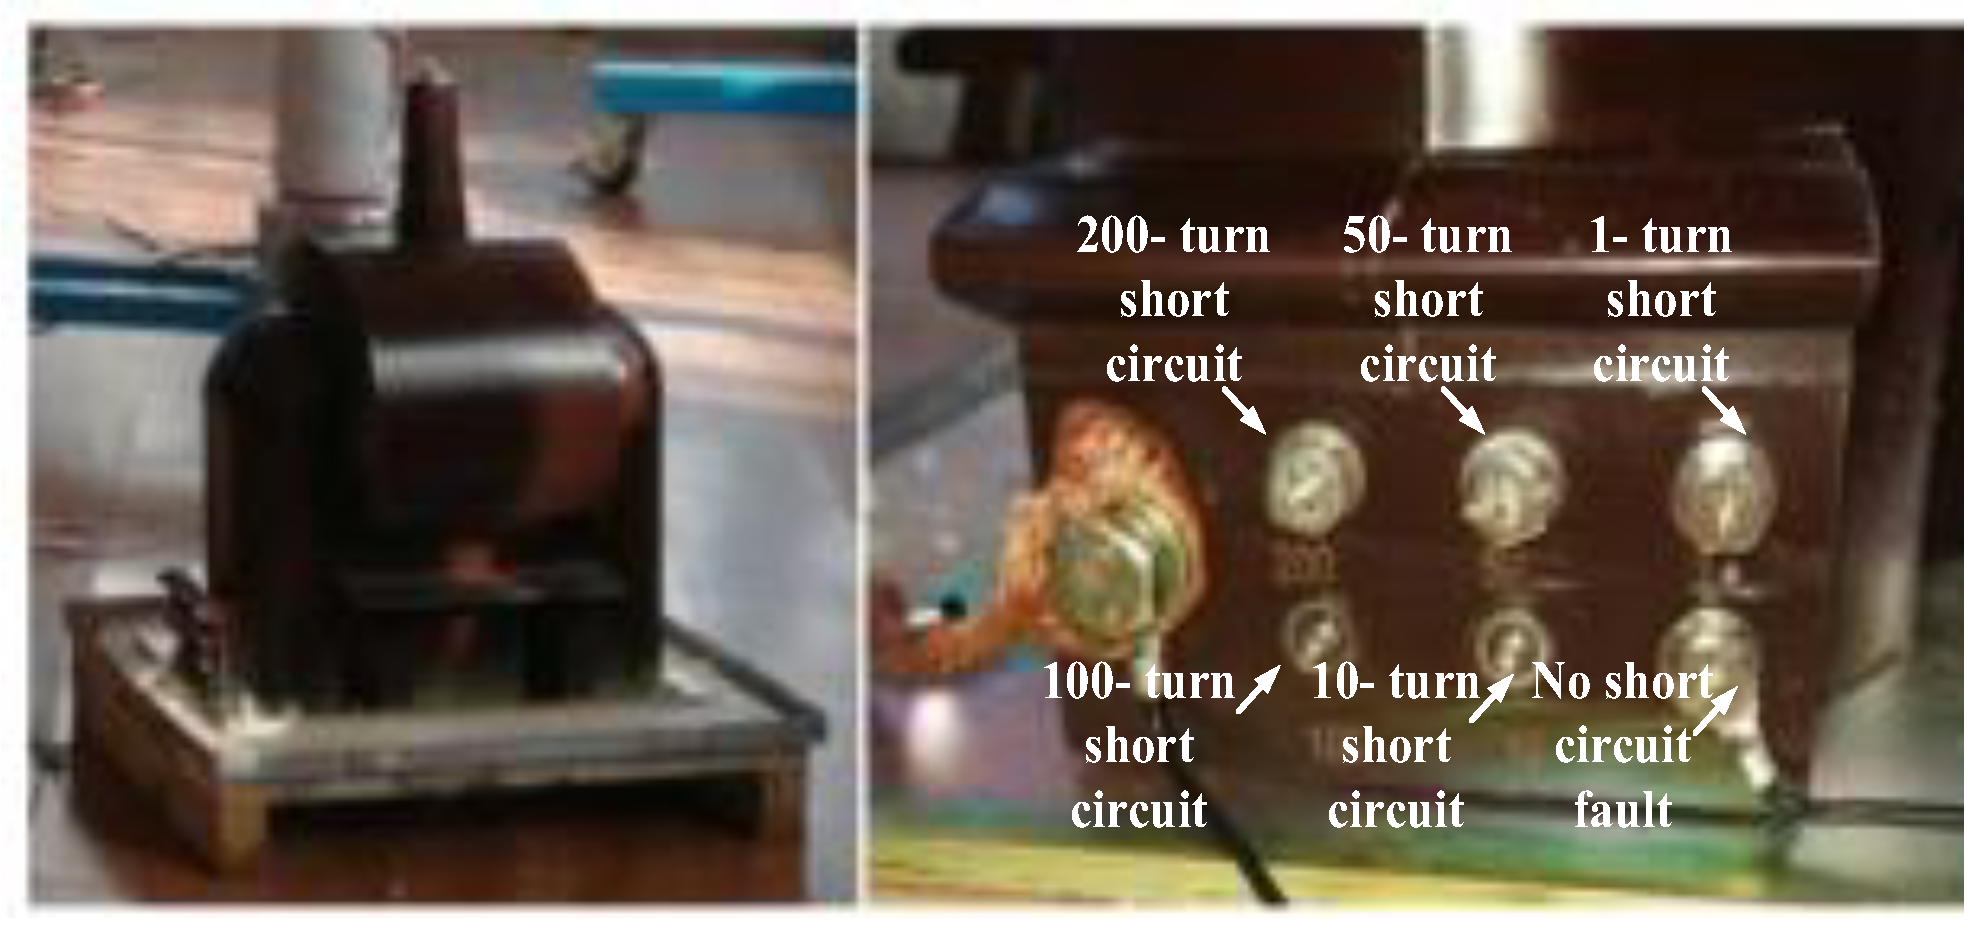
Regarding the processing technique of the JDZX9-20Q dry-type voltage transformer, an experimental dry-type voltage transformer was made. The device simulates zero turn-to-turn short circuits and 1-turn, 10-turn, 50-turn, 100-turn, and 200-turn short circuits. In Figure 10, the left side shows the device shape, and the right side shows the tap terminals for imposing different numbers of faulty turns.
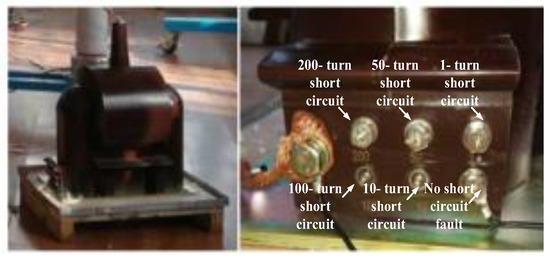
Figure 10.
Dry-type voltage transformer model specimens simulating different short-circuit turn faults.
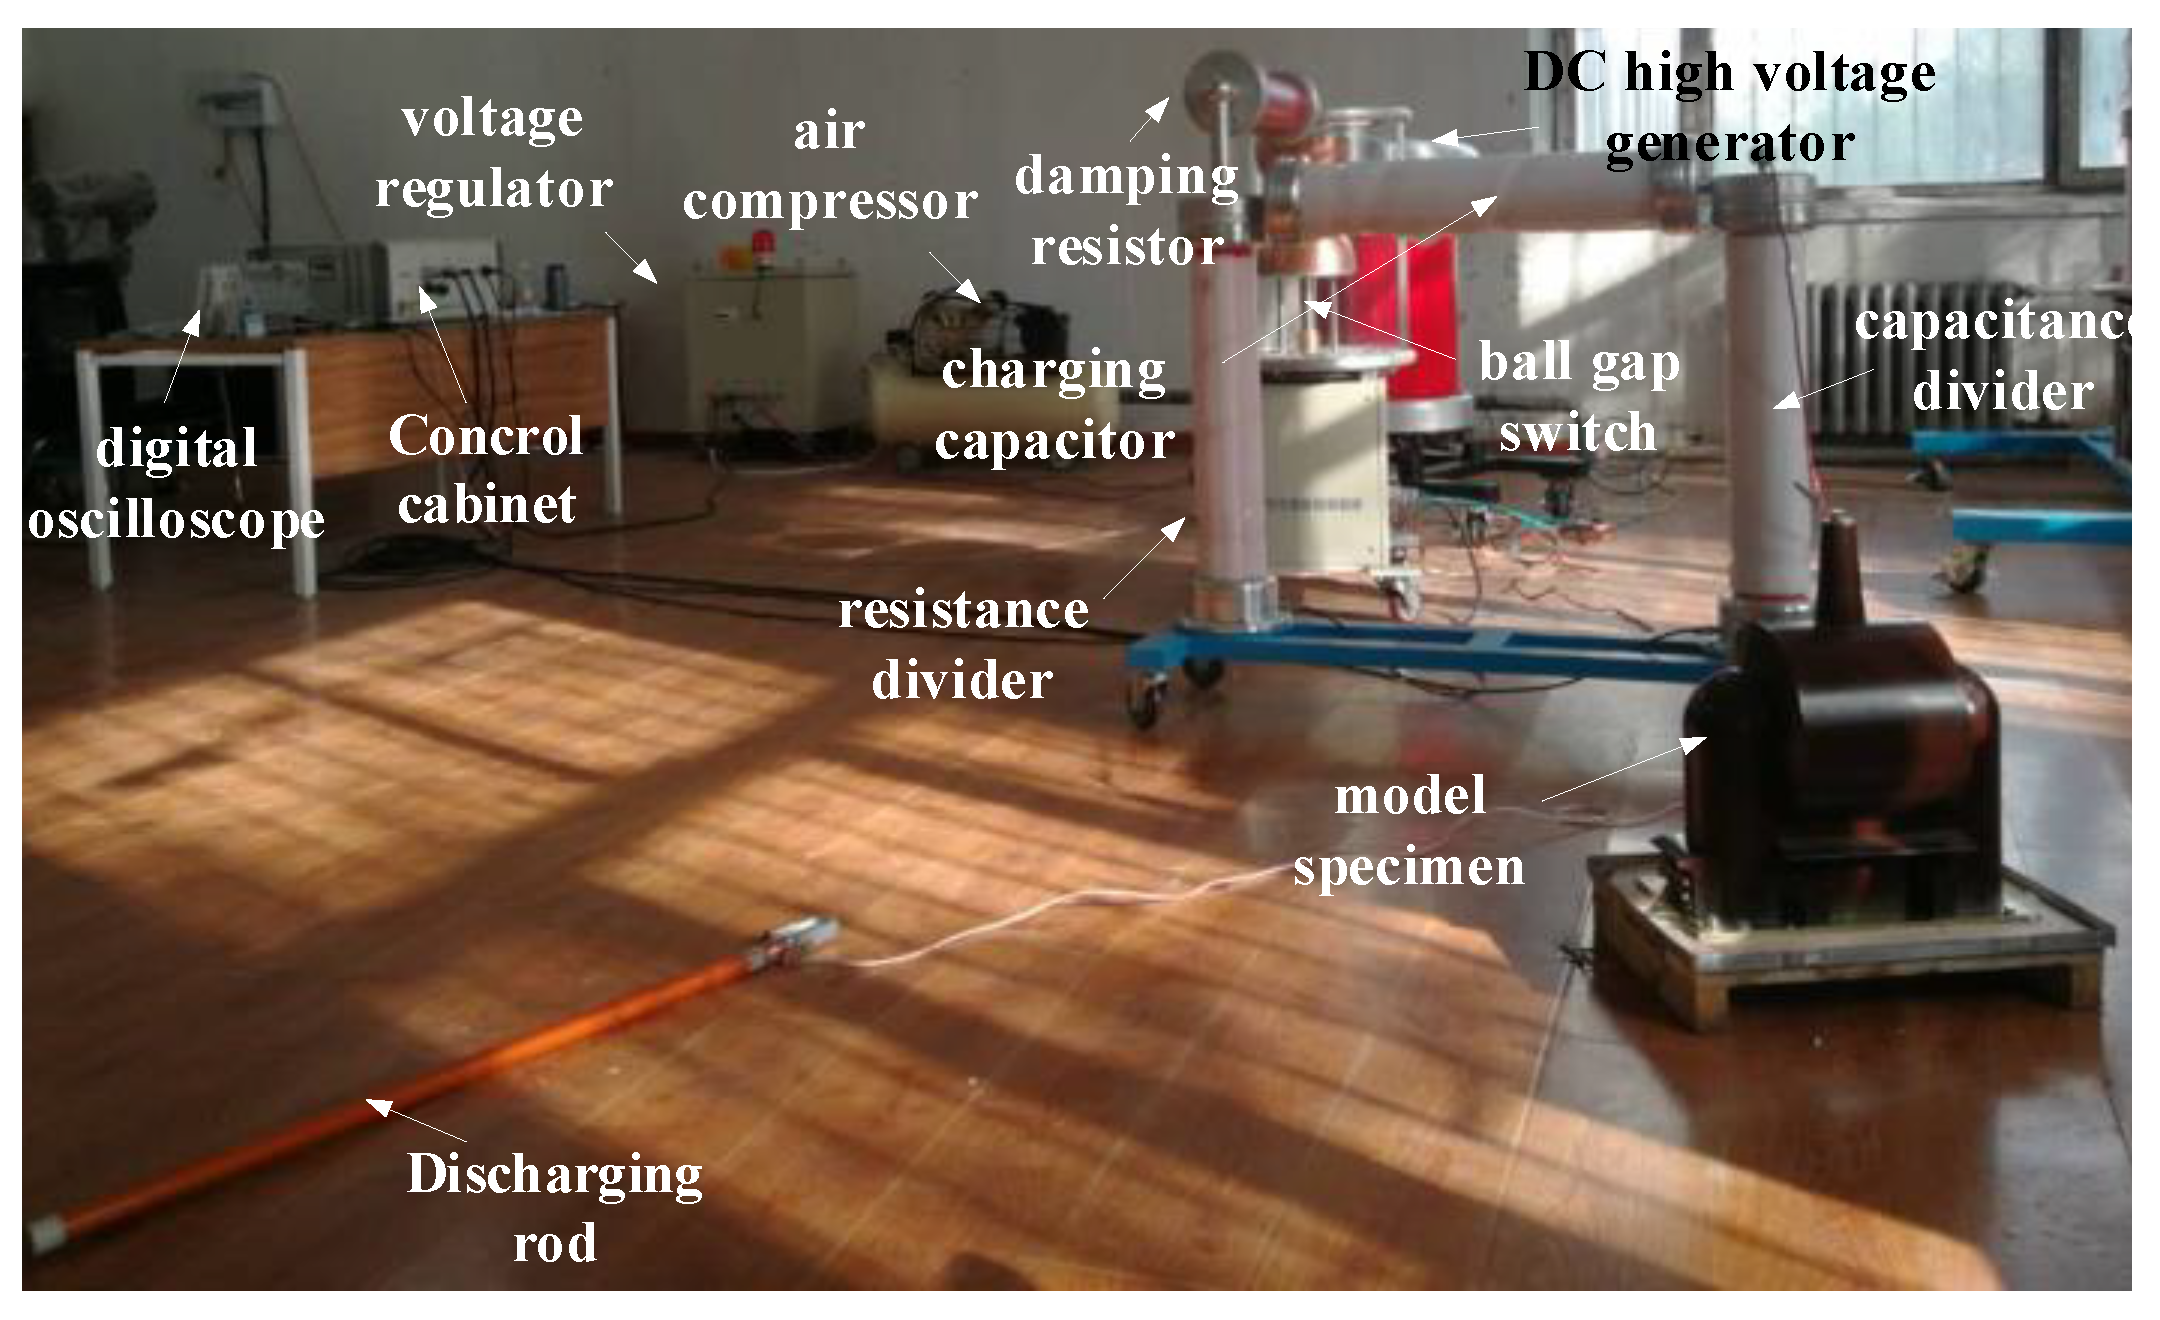
The test platform was built according to the test principle circuit question in Figure 6 and as in Figure 11. The equipment included a voltage regulator, a DC high-voltage generator, a damping resistor, a ball-gap switch, a capacitance divider, a resistance divider, a digital oscilloscope, a charging capacitor, a shunt inductor, a dry-type voltage transformer specimen, and an air compressor. For the ball gap to have the desired arc-extinguishing effect, air compression was used. The capacity of the voltage regulator was 10 kVA, considering the voltage efficiency, the DC high voltage generator voltage was 70 kV, the damping resistance was 40 Ω, the charging capacitance was 3 nF, the maximum breaking voltage of the ball-gap switch was 80 kV, the resistor divider dividing ratio was 1000:1, the high-voltage arm resistance was 500 MΩ, the low-voltage arm resistance was 500 kΩ, the capacitor divider to voltage divider ratio was 1000:1, the capacitance of the high-voltage arm was 150 pF, the capacitance of the low-voltage arm was 150 nF, and the shunt inductance was 1.9 H.
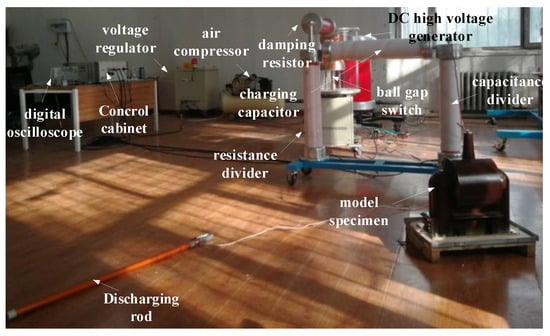
Figure 11.
The test system for the pulse voltage method.
The specific test steps used are as follows. After completing the circuit connection, press the high-voltage start switch to increase the voltage to the necessary test level, charge the main capacitor, and observe the charging voltage value through the resistor voltage divider; adjust the spacing of the trigger ball-gap switch to control its trigger conduction, and discharge the main capacitor to the equipment under test; from the oscilloscope connected to the capacitance divider, observe and record the results.
The dry-type voltage transformer’s short-circuit turns are adjusted to 1, 10, 50, 100, and 200 under each test. Repeat the test several times and record the test voltage waveform for each turn adjustment. We thus determined whether the pulse voltage approach was appropriate for the interturn insulation testing of dry-type voltage transformers by comparing the differences in the test voltage waveforms. The effect of single-turn versus multi-turn short circuits on the turn-to-turn insulation inspection was therefore analyzed via the pulse voltage method.
4.2. Results and Analysis of the Experiment
4.2.1. Single-Turn Short Circuit
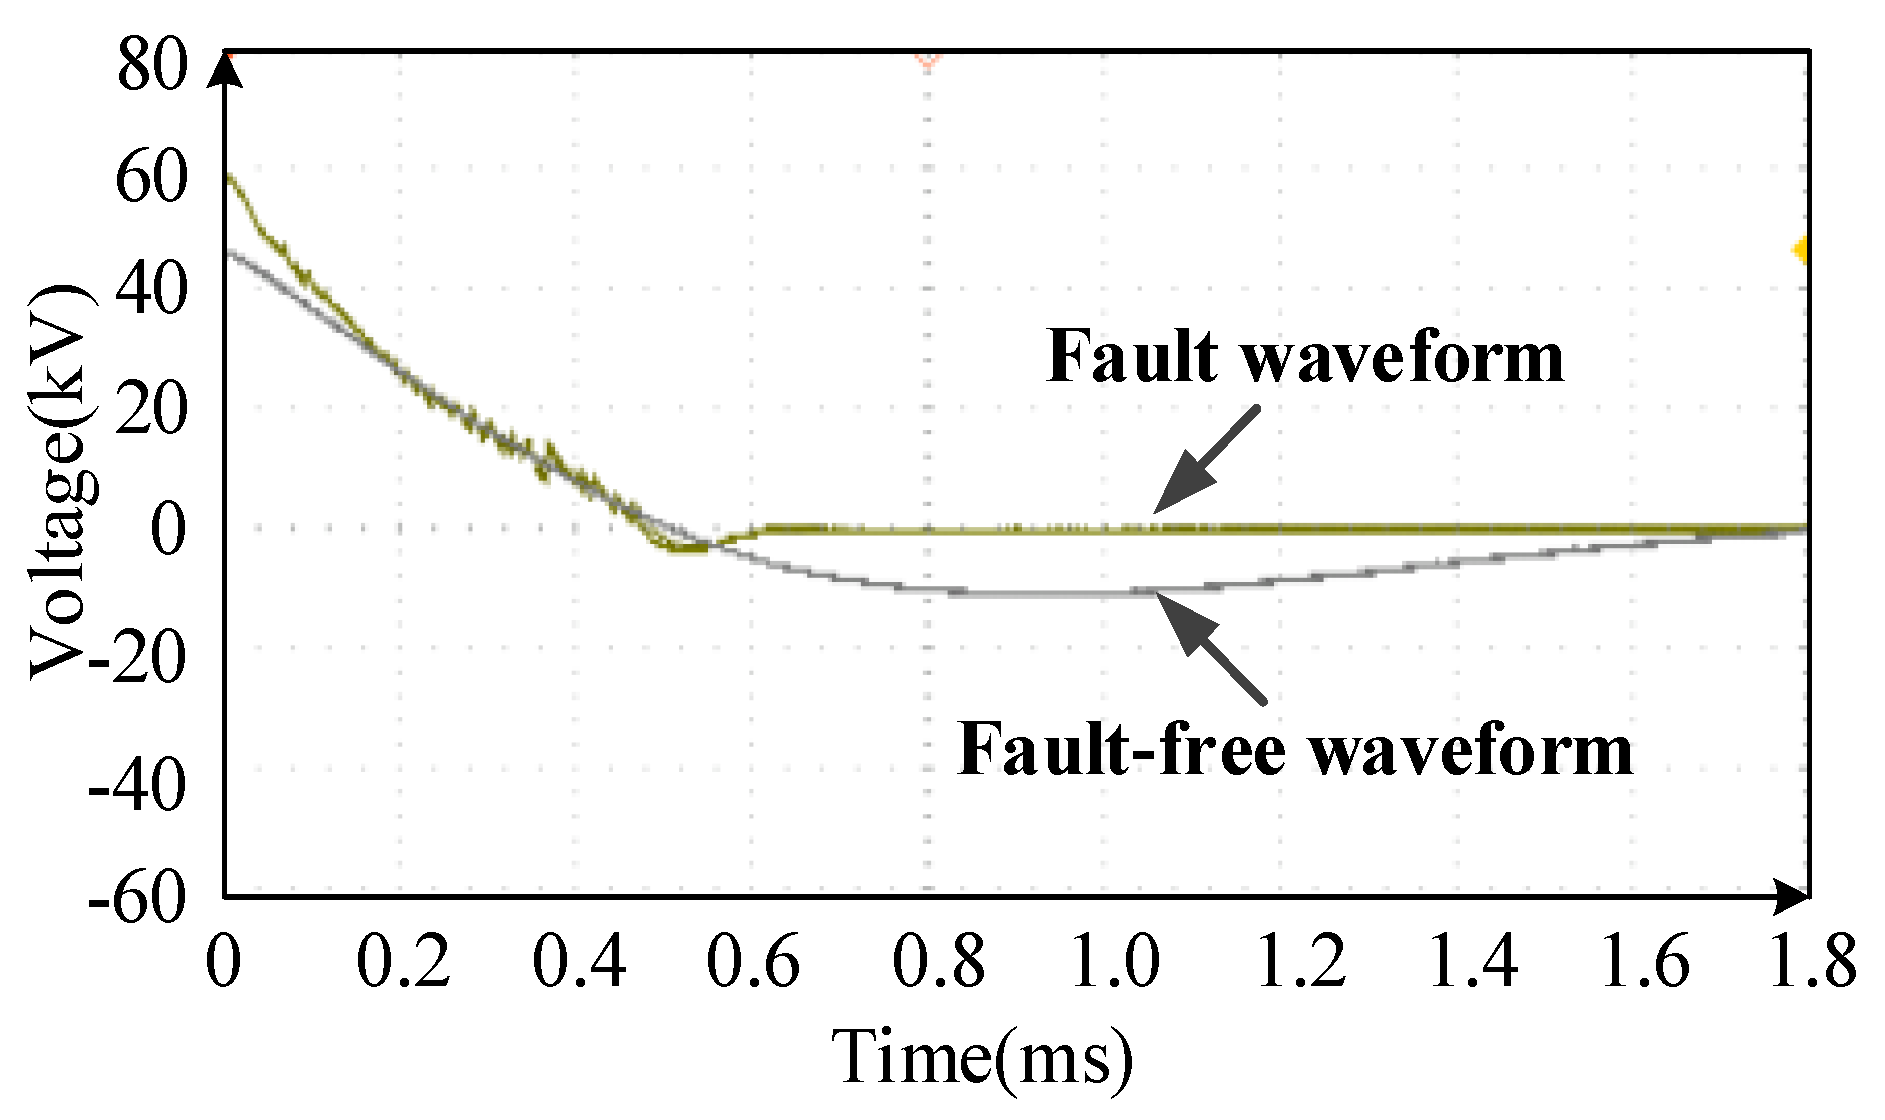
The device’s short-circuit turn adjustment was initially set to 1. Tests of dry-type voltage transformer windings with and without faults were carried out using an impulse voltage. The test voltage waveform is shown in Figure 12.
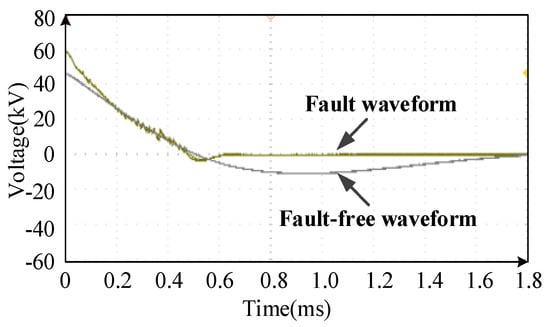
Figure 12.
Response voltage waveform of PT with a single-turn short-circuit fault compared to PT without a fault.
There is a difference between the test voltage waveforms of transformers with and without single-turn short circuits. When there is a single-turn short-circuit defect, the test voltage waveform oscillates more frequently than when there is no short-circuit fault, which is consistent with the analytical indication in Section 2.4.
4.2.2. Multiturn Short Circuit
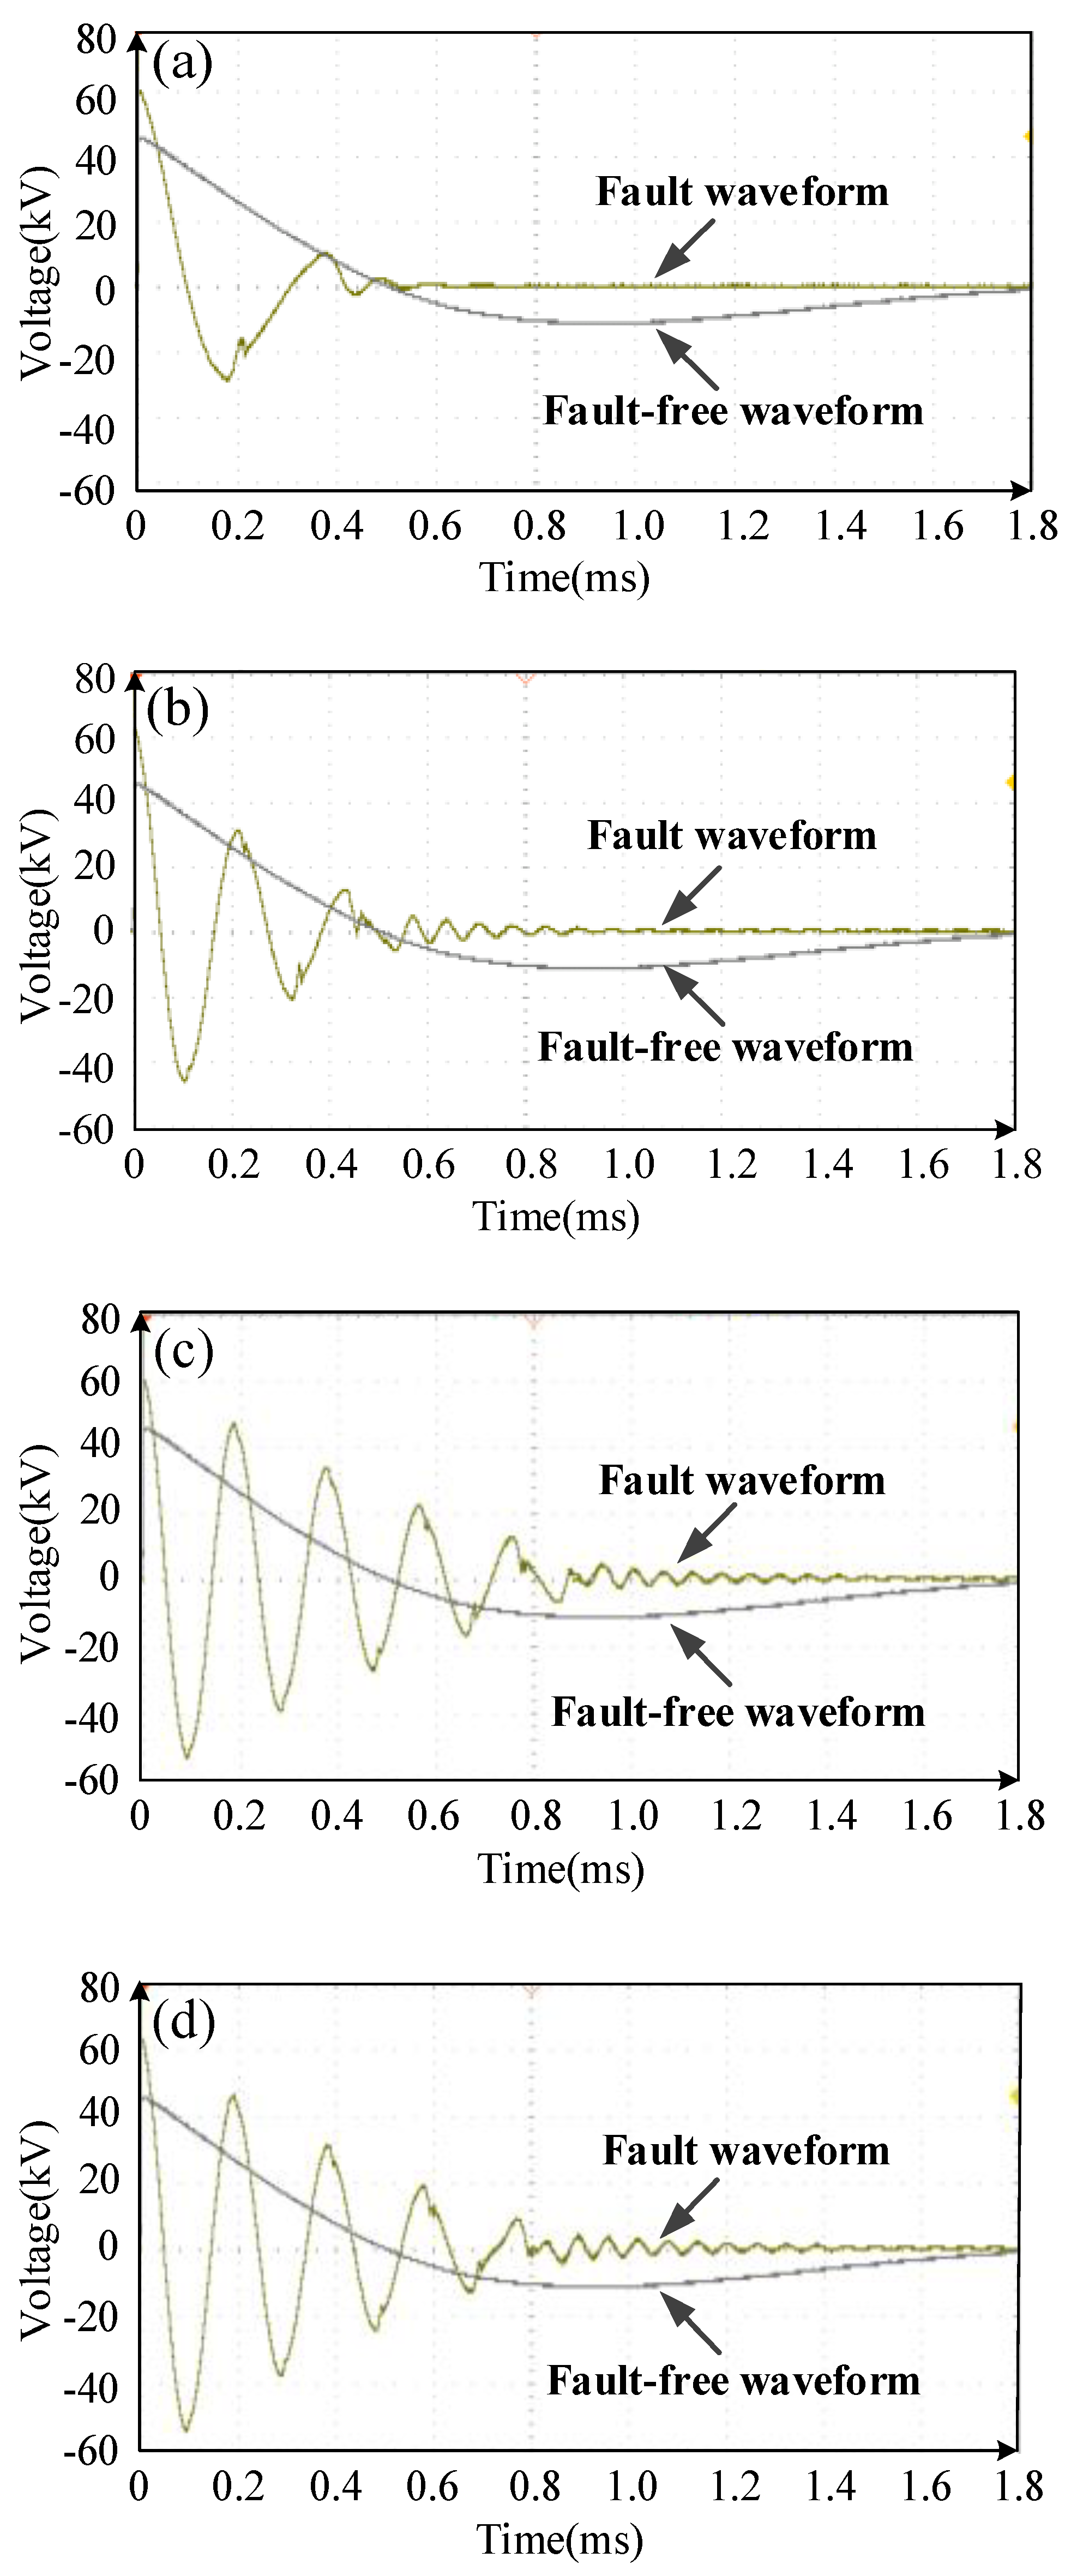
The short-circuit taps of the specimen were set to 10, 50, 100, and 200 turns. Different numbers of short-circuit turns were used under otherwise identical test conditions for this pulse voltage test. Figure 13a–d show the test voltage waveforms with 10, 50, 100, and 200 turns of short circuits, respectively.
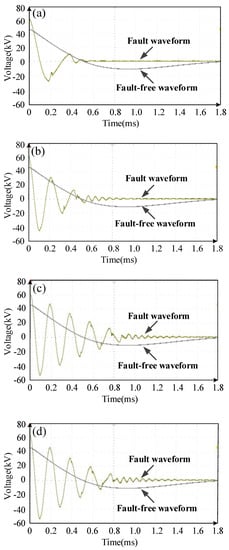
Figure 13.
Response voltage waveform of PT with multiturn short-circuit fault compared to PT without fault. (a) Comparison of voltage waveforms of 10-turn short circuit. (b) Comparison of voltage waveforms of 50-turn short circuit. (c) Comparison of voltage waveforms of 100-turn short circuit. (d) Comparison of voltage waveforms of 200-turn short circuit.
The pulse test voltage waveforms of the fault-free and multiturn short-circuits are clearly distinguished from each other. When a multiturn short-circuit fault occurs in the high-voltage winding of the dry-type voltage transformer, the oscillation frequency of the test voltage waveform rises when compared to a single-turn short-circuit fault.
4.2.3. Analysis of the Experimental Results
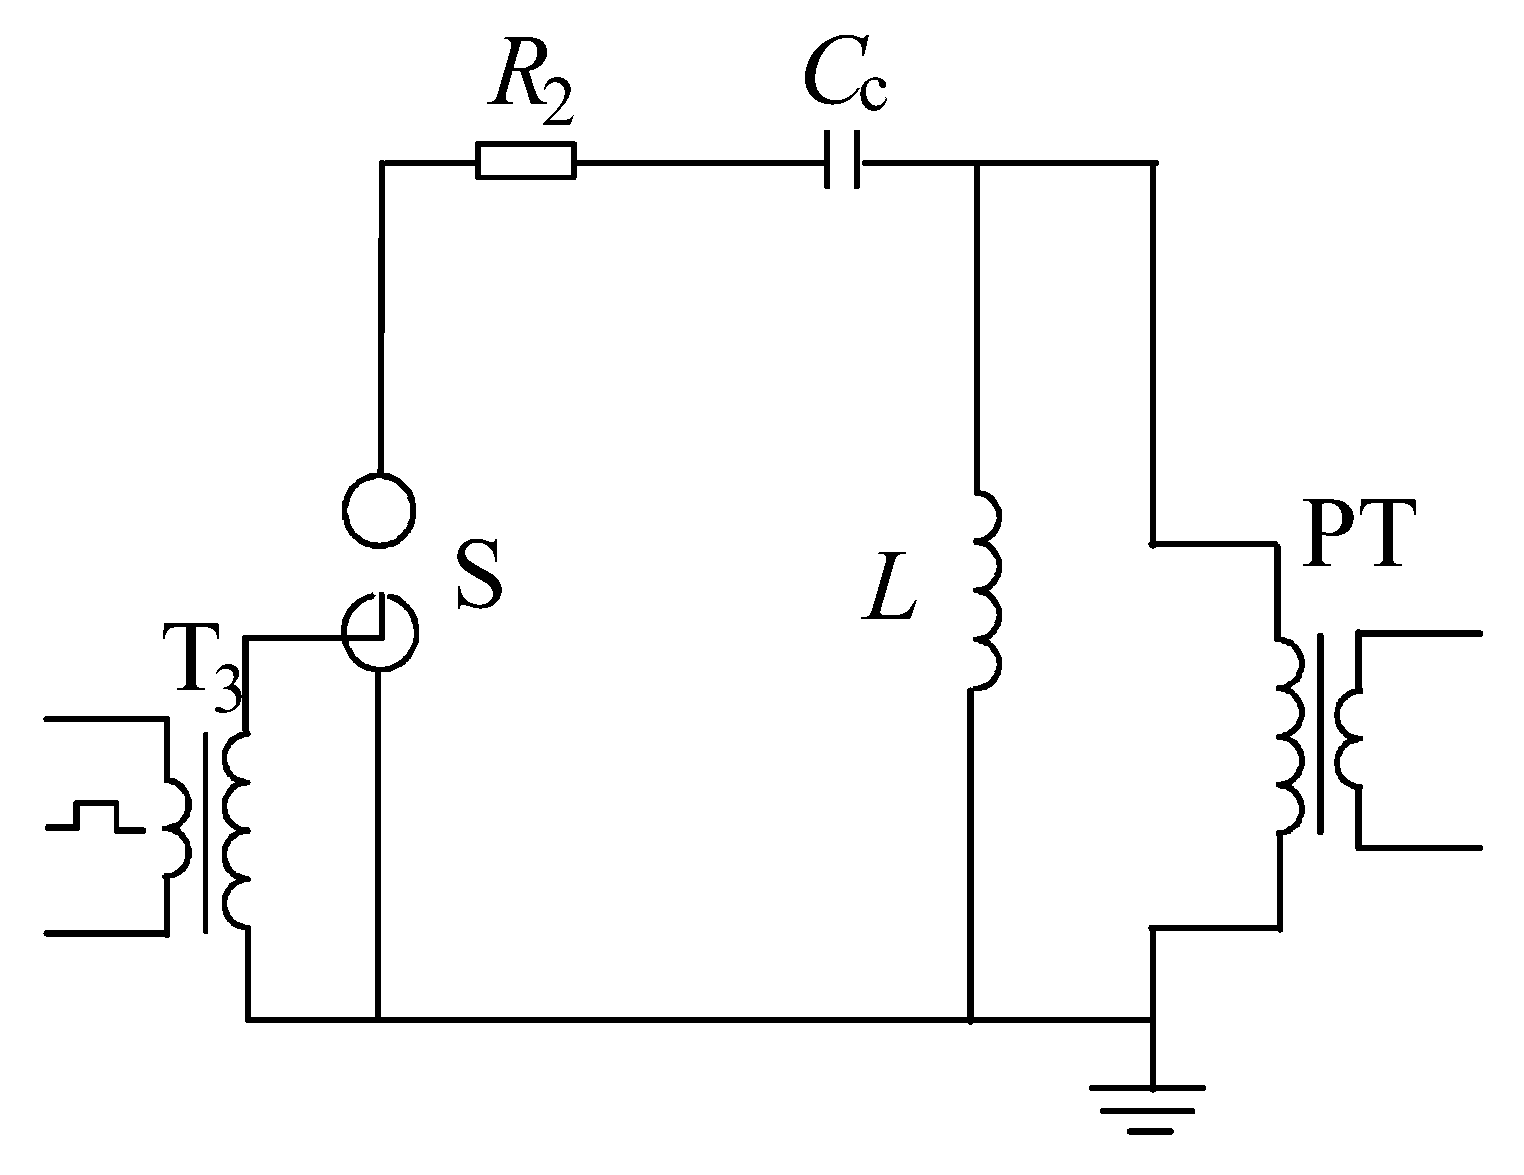
The discharge circuit of the pulse test circuit is shown in Figure 14.
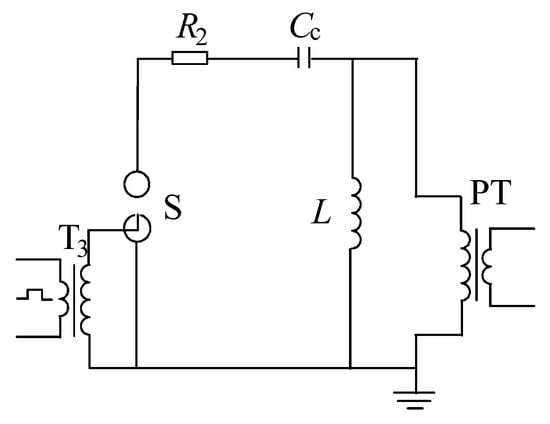
Figure 14.
The discharge circuit of the pulse test circuit.
The KVL equation for the discharge loop can be expressed as follows:
where L0 is the total parallel inductance of the equivalent inductance of the PT and the small inductor and R is the sum of the damping resistance R2 and the equivalent resistance of the PT.
The voltage UPT on the PT can be expressed as follows:
where is the intrinsic oscillation frequency, is the attenuation coefficient, is the actual oscillation frequency, is the initial phase, and is the charging voltage of the main capacitor CC.
The main capacitor CC and the PT’s equivalent inductance are connected to the voltage waveform’s oscillation frequency. The equivalent inductance value of a fault-free PT remains constant, as does the frequency at which the response pulse voltage waveform oscillates. The equivalent inductance decreases and is significantly lower than the equivalent inductance of the PT in the absence of the fault when an interturn short-circuit fault occurs, which causes an increase in the oscillation frequency of the response voltage waveform in the discharge circuit. More short circuits result in a more pronounced demagnetizing impact on the core, a more serious reduction in the equivalent inductance, and a higher oscillation frequency of the response voltage waveform.
5. Conclusions
This paper considers the application of the impulse voltage test approach for investigating the interturn insulation of high-voltage windings in dry-type voltage transformers. The main conclusions are as follows:
- (1)
- The equivalent resistance and inductance of dry-type voltage transformers are significantly reduced after a turn-to-turn short circuit fault occurs in the high-voltage winding.
- (2)
- The pulse voltage method can be used in parallel with a small inductor to create a more uniform oscillating voltage waveform; otherwise, the high equivalent impedance of the high-voltage windings obstructs testing.
- (3)
- A turn-to-turn short-circuit fault in a dry-type voltage transformer’s high-voltage winding causes the oscillation frequency of the test voltage waveform to rise; the greater the number of turns in the circuit fault, the more significant the effect on the test waveform is.
Based on the aforementioned findings, the method is highly efficient when used in the field for finding turn-to-turn short-circuit defects in transformers. Traditional lightning impact test equipment and partial discharge techniques have drawbacks such as complicated wave modulation and assembly and weak electromagnetic interference resistance. For high-turn voltage transformers, the transformer ratio measurement and winding DC resistance measurement are not immediately apparent. The scanning frequency response method’s range of applications is more challenging to define and more challenging to put into practice. Due to its ability to be used in field testing and guarantee that the outcomes are unaffected by electromagnetic fields and other outside influences, the pulse voltage method employed in this study may be able to readily overcome the aforementioned disadvantages.
The technique can be applied to a transformer manufacturer for factory testing and in power plant and power system handover testing. When run for a while after the periodic inspection, it can result in the early failure of the voltage transformer out of operation, preventing unnecessary financial losses and the occurrence of more serious harm.
However, whether oil-immersed voltage transformers can also use the technology and how to enhance the procedure in for use with a non-metallic turn-to-turn short circuit to broaden its range of applications remain to be determined. Future consideration should be given to these courses of action.
Author Contributions
H.N. and W.W. conceived and designed the experiments; W.W. performed the experiments; H.N., W.W. and Y.Y. analyzed the data; H.W. wrote the paper. All authors have read and agreed to the published version of the manuscript.
Funding
This research was funded by the National Natural Science Foundation of China, grant number 51977051.
Data Availability Statement
The data presented in this study are available on request from the corresponding author. The data are not publicly available due to privacy restrictions.
Conflicts of Interest
The authors declare no conflict of interest.
References
- Zhang, H.; Shao, H.; Wang, J.; Wang, W.; Lin, F.; Sun, T.; Zhao, W.; Li, C.; Wu, Y. Voltage Ratio Traceability of 10 kV Low-Voltage Excited Two-Stage Voltage Transformer. IEEE Trans. Instrum. Meas. 2017, 66, 1405–1410. [Google Scholar] [CrossRef]
- Xiong, C.J.; Gao, C.Y.; Chen, J.; Ding, Y.; Chen, S.Y.; Zhang, G.W. Measuring Method and Error Compensation for Amplitude-Frequency Characteristics of Electromagnetic Voltage Transformer. Adv. Mater. Res. 2014, 933, 566–571. [Google Scholar] [CrossRef]
- Kaczmarek, M.; Nowicz, R. Application of instrument transformers in power quality assessment. In Proceedings of the 2010 Modern Electric Power Systems, Wroclaw, Poland, 20–22 September 2010; pp. 1–5. [Google Scholar]
- Lachugin, V.F.; Platonov, P.S.; Alekseev, V.G.; Vazyulin, M.V.; Mitrofanov, N.N.; Popov, S.G.; Arutyunov, S.A.; Klyushkin, N.G.; Shemetov, A.S. Traveling Wave-Based Fault Location System Connected to Busbar Voltage Transformers. Power Technol. Eng. 2021, 55, 282–290. [Google Scholar] [CrossRef]
- Mellik, T.A.; Dionise, T.J.; Yanniello, R. A Case Study of Voltage Transformer Failures: Solution Implementation in a Modern Data Center. IEEE Ind. Appl. Mag. 2017, 24, 98–109. [Google Scholar] [CrossRef]
- Trkulja, B.; Drandić, A.; Milardić, V.; Žiger, I. Evaluation of Methodology for Lightning Impulse Voltage Distribution over High-Voltage Windings of Inductive Voltage Transformers. Energies 2021, 14, 5144. [Google Scholar] [CrossRef]
- Trkulja, B.; Drandić, A.; Milardić, V.; Župan, T.; Žiger, I.; Filipović-Grčić, D. Lightning Impulse Voltage Distribution over Voltage Transformer Windings-Simulation and Measurement. Electr. Power Syst. Res. 2017, 147, 185–191. [Google Scholar] [CrossRef]
- Leelachariyakul, B.; Yutthagowith, P. Resonant Power Frequency Converter and Application in High-Voltage and Partial Discharge Test of a Voltage Transformer. Energies 2021, 14, 2014. [Google Scholar] [CrossRef]
- Zhou, F.; Jiang, C.; Lei, M.; Lin, F. Improved Stepup Method to Determine the Errors of Voltage Instrument Transformer with High Accuracy. IEEE Trans. Instrum. Meas. 2019, 69, 1308–1312. [Google Scholar] [CrossRef]
- Lei, T.; Faifer, M.; Ottoboni, R.; Toscani, S. On-Line Fault Detection Technique for Voltage Transformers. Measurement 2017, 108, 193–200. [Google Scholar] [CrossRef]
- Li, P.; Guo, P. Diagnosis of interturn faults of voltage transformer using excitation current and phase difference. Eng. Fail. Anal. 2022, 134, 59–79. [Google Scholar] [CrossRef]
- Gevorkyan, V.M.; Krayushkin, K.V. Algorithm for Monitoring the State of Insulation in Voltage Measurement Transformers in the Generator Voltage Circuit of Power Plants. Meas. Tech. 2017, 60, 267–273. [Google Scholar] [CrossRef]
- Ludwikowski, K.; Siodla, K.; Ziomek, W. Investigation of transformer model winding deformation using sweep frequency response analysis. IEEE Trans. Dielectr. Electr. Insul. 2012, 19, 1957–1961. [Google Scholar] [CrossRef]
- Gojiya, M.V.; Badgujar, K.P. Effect of Transformer Windings (Not under the Test) on the Frequency Response (FR) of the Winding under the Test. In Proceedings of the 2022 Fourth International Conference on Emerging Research in Electronics, Computer Science and Technology (ICERECT), Mandya, India, 26–27 December 2022; pp. 1–8. [Google Scholar]
- Sima, W.; Sun, P.; Yang, M.; Wu, J.; Hua, J. Impact of time parameters of lightning impulse on the breakdown characteristics of oil paper insulation. High Volt. 2016, 1, 18–24. [Google Scholar] [CrossRef]
- Sun, P.; Sima, W.; Jiang, X.; Zhang, D.; He, J.; Ye, L. Review of accumulative failure of winding insulation subjected to repetitive impulse voltages. High Volt. 2019, 4, 1–11. [Google Scholar] [CrossRef]
- Zhang, X.; Wang, H.; Guo, R.; Zhang, Z.; Li, J.; Han, X. Fault diagnosis technologies for power transformers during the on-site inductive oscillating switching impulse voltage withstand test. IET Gener. Transm. Distrib. 2022, 16, 3894–3905. [Google Scholar] [CrossRef]
- Ren, H.; Chen, J. Study on lightning impulse voltage distribution and Transfer Overvoltage of 500 kV transformer. J. Phys. Conf. Ser. 2022, 2260, 012013. [Google Scholar] [CrossRef]
- Hayakawa, N.; Inano, H.; Nakamura, Y.; Okubo, H. Time variation of partial discharge activity leading to breakdown of magnet wire under repetitive surge voltage application. IEEE Trans. Dielectr. Electr. Insul. Publ. IEEE Dielectr. Electr. Insul. Soc. 2008, 15, 1701–1706. [Google Scholar] [CrossRef]
- Kikuchi, H.; Hanawa, H. Inverter surge resistant enameled wire with nanocomposite insulating material. IEEE Trans. Dielectr. Electr. Insul. Publ. IEEE Dielectr. Electr. Insul. Soc. 2012, 19, 99–106. [Google Scholar] [CrossRef]
- Tan, S.; Bai, Y.; Wang, X.; Liu, P. The detection method of inter-turn short-circuit current of in-phase coil compensation axial permanent magnet synchronous fault-tolerant motor. In Proceedings of the 2022 Asian Conference on Frontiers of Power and Energy (ACFPE), Chengdu, China, 21–23 October 2022; pp. 41–46. [Google Scholar]
- Hoffmann, A.; Ponick, B. Method to Predict the Non-Uniform Potential Distribution in Random Electrical Machine Windings under Pulse Voltage Stress. Energies 2022, 15, 358. [Google Scholar] [CrossRef]
- Gao, Z.; Zhu, X.; Song, X.; Wang, Y.; Yu, Z. Characteristics of PD for reactor interturn insulation under pulse oscillating voltage. In Proceedings of the 2015 IEEE 11th International Conference on the Properties and Applications of Dielectric Materials (ICPADM), Sydney, Australia, 19–22 July 2015; pp. 728–731. [Google Scholar]
- Zhu, L.; Du, Y.; Gao, L.; Zhuang, Z.; Ji, S. Vibration Distribution Detection Method for Turn-to-Turn Short-Circuit Fault of Dry-Type Air-Core Filter Reactors. IEEE Trans. Power Del. 2022, 37, 4474–4476. [Google Scholar] [CrossRef]
- Risheng, Q.; Wenlin, W.; Bin, W. Research on the Modeling Method and Turn-to-Turn Short Circuit Monitoring Method for the Dry-Type Air-Core Reactor. In Proceedings of the 2018 2nd IEEE Conference on Energy Internet and Energy System Integration (EI2), Beijing, China, 20–22 October 2018; pp. 1–7. [Google Scholar]
- Basuray, A.; Chatterjee, S. Study of transformer and motor winding under pulsed power application. In Proceedings of the 2017 IEEE 21st International Conference on Pulsed Power (PPC), Brighton, UK, 18–22 June 2017; pp. 1–5. [Google Scholar]
- Behjat, V.; Vahedi, A.; Setayeshmehr, A.; Borsi, H.; Gockenbach, E. Diagnosing Shorted Turns on the Windings of Power Transformers Based Upon Online FRA Using Capacitive and Inductive Couplings. IEEE Trans. Power Del. 2011, 26, 2123–2133. [Google Scholar] [CrossRef]
- Mohseni, B.; Hashemnia, N.; Islam, S.; Zhao, Z. Application of online impulse technique to diagnose inter-turn short circuit in transformer windings. In Proceedings of the 2016 Australasian Universities Power Engineering Conference (AUPEC), Brisbane, Australia, 25–28 September 2016; pp. 1–4. [Google Scholar]
- Quan, Y.-S.; Ning, Z.-S.; Chen, S.-Y.; Li, W.; Xu, T.-Y. Study on the methodology of detection for transformer winding insulation defects based on applied voltage test. In Proceedings of the 2012 IEEE International Symposium on Electrical Insulation, San Juan, Puerto Rico, 10–13 June 2012; pp. 153–155. [Google Scholar]
- Zhang, X.; He, C.; Guo, R.; Wang, Q.; Yang, Y.; Pu, J.; Gao, C.; Li, J. Study on Partial Discharge Characteristics in Transformer based on Oscillating Lightning Impulse Voltage Waveforms. In Proceedings of the 2020 IEEE International Conference on High Voltage Engineering and Application (ICHVE), Beijing, China, 6–10 September 2020; pp. 1–4. [Google Scholar]
- Shanmugam, N.; Madanmohan, B.; Rajamani, R. Influence of the Load on the Impulse Frequency Response Approach Based Diagnosis of Transformer’s Inter-Turn Short-Circuit. IEEE Access 2020, 8, 39454–39463. [Google Scholar] [CrossRef]
- 60076-6; Power Transformers—Part 6: Reators. IEC: Geneva, Switzerland, 2007.
- 60044-2; Instrument Transformers—Part 2: Inductive Voltage Transformers. IEC: Geneva, Switzerland, 2003.


Disclaimer/Publisher’s Note: The statements, opinions and data contained in all publications are solely those of the individual author(s) and contributor(s) and not of MDPI and/or the editor(s). MDPI and/or the editor(s) disclaim responsibility for any injury to people or property resulting from any ideas, methods, instructions or products referred to in the content. |
© 2023 by the authors. Licensee MDPI, Basel, Switzerland. This article is an open access article distributed under the terms and conditions of the Creative Commons Attribution (CC BY) license (https://creativecommons.org/licenses/by/4.0/).