Abstract
Electromobility and autonomous driving has started a transformation in the automotive industry, resulting in new requirements for vehicle systems. Due to its functions, the electrical/electronic (E/E) architecture is one of the essential systems. Zonal E/E architecture is a promising approach to tackle this issue. The research presented in this paper describes a methodology for determining the optimal number of zones, the position of the zone control units (ZCU), and the assignment of electric components to these zones and ZCUs. Therefore, the design of the power supply and the wiring harness is essential. This approach aims to identify the most suitable system architecture for a given vehicle geometry and a set of electric components. For this purpose, the assignment of electric components is accomplished by k-means clustering, and Dijkstra’s algorithm is used to optimize the cable routing. As ZCUs will be the hubs for the in-vehicle data and information transport in zonal architectures, their position and their number are crucial for the architecture and wiring harness development. Simulations show a suitable zonal architecture reduces wiring harness length as well as weight and brings functional benefits. However, the number of zones must be chosen with care, as there may also be functional limitations.
1. Introduction
The automotive industry is undergoing a fundamental transformation, which began a few years ago with the rise of electric mobility [1,2]. The energy density and thus the range of battery electric vehicles (BEV) is continually increasing as well as safety, which is indicated by falling fire accident numbers [3]. Katis summarizes the advancement in autonomous driving by abilities like autopilot and assisted navigation, wherefore further sensor technologies like lidar and radar as well as data analysis approaches using artificial intelligence are essential [4]. The rising number of electric vehicle production and sales leads to reduction in component cost according to the International Council on Clean Transportation (ICCT) [5]. High research focus is put on new battery materials, which are supposed to bring a strong increase in energy density of batteries [3,4,5].
Autonomous driving, digitalization, and electric mobility place new demands on vehicles and their systems such as the introduction of voltages above 60 V, the integration of additional sensors (lidar, radar) and data processing units for autonomous driving (computer vision, artificial intelligence), cloud services, and better connectivity within the vehicle and with its environment [6]. With a rising number of functions, the complexity of the vehicle increases, thus the in-vehicle networks need to fulfill higher and completely new requirements, which makes a profound change indispensable. Looking at the vehicle’s energy supply system, this means fundamental changes in the area of hardware and software. With the growing demand for BEV, platforms are being developed specifically to better meet their needs. However, they are still based on the E/E architecture of previous vehicle generations using internal combustion engines. One architectural approach supporting the advancing digitalization and connectivity is the zonal E/E architecture [7].
The E/E architecture of vehicles has grown rapidly in recent years. The first architectures included a few components and connections, including the 12 V battery, the lighting, and the ignition system. With the steady influx of electrical as well as electronic hard- and software, bus systems were necessary to reduce the number of interconnect lines. Over the years, these architectures have evolved and today almost all vehicles still use a decentralized architecture and domain controllers to bundle all functionalities of a domain. Continuous integration of additional functions, following the “one function per ECU”-approach, increased the number of ECUs to as many as 100. In addition, the wiring harnesses can be up to five kilometers long and weigh 60 to 80 kg, with individual cables having a length of up to eight meter [7,8]. Although it is common to arrange interrelated functions in one bus system, several ECUs, even from different busses, are usually required to realize a customer-related function. The advantage of this architecture is a relatively uncomplicated extension by single functions. The manufacturer integrates a new ECU with the corresponding function into the vehicle and connects it to the communication structure. However, decentralized architectures show some disadvantages regarding the changing requirements portfolio. The importance of software in vehicles has increased significantly in recent years and this trend will continue. Therefore, the extension of existing functions as well as the addition of new functions mainly involves new software. Due to the “one function per ECU” approach and its hardware parts developed for one specific function, it is also necessary to change parts of the hardware in current architectures. Furthermore, this approach leads to poor utilization of the available weight and volume. This is demonstrated by two ECUs, both of which perform separate functions. If combined, the weight and volume of the computing unit will increase, but the peripheral elements would increase relatively less since it is sufficient to have only one of them. The length and weight of the wiring harness in technical systems are proportional to the complexity of the architecture, i.e., the number of its components, connections, and interfaces. As the number of ECUs increases, so does the amount of cabling. This leads to weight increase, as well as restrictions in the composition of the systems, thus causing an increase in cost and time. Another challenge pushing the decentralized architecture to its limits is the high number of variants [9]. The required combinations of hard- and software determine the complexity of a variant. One variant consists of the basic functionalities in combination with the equipment- and market-specific functions [10]. A high number of variants, which is proportional to the quantity of ECUs, demands great effort for developing architectures and extending them. In addition, a high number of software variants and their specific requirements can increase the number of hardware variants [11].
Although vehicle manufacturers are aware of the problems of the decentralized architecture, current applications show little innovation. The large number of dependencies on other systems means that changes must be made over multiple product generations [12,13]. Since a first generation of zone controllers is already available, e.g., from Bosch or Vitesco, it can be expected that these will gradually replace existing ECUs in the coming years [14,15]. VW and Cariad follow a similar approach called E3, combining multiple ECUs into one physical ECU with multiple virtual ones [16]. To take full advantage of these technologies, methods and tools are necessary to design zonal architectures. Therefore, the aim of this paper is to create a method that helps define the architecture and the ZCU. This will help developers to evaluate concepts in an early phase and provide further requirements for the design of the ZCUs.
The article is structured as follows. After introducing current architectures, Section 2 presents the state of the art through two aspects. First, development trends of E/E architecture and features of zonal E/E architectures are given. Based on this, a practical approach to implement a zonal architecture in a test vehicle is shown. Secondly, the already existing measures for the optimization of vehicle power supply systems are presented considering the packaging and wiring harness design. These are checked in regard to their suitability to achieve a system that is optimum even under changing conditions. Section 3 deals with the novel method to develop and evaluate the zonal E/E architectures based on a design of the power supply system and wiring harness. It consists of several steps for analysis, conceptual design, dimensioning, and evaluation, including k-means and Dijkstra algorithm. In Section 4, the autoSHUTTLE, one of the UNICARagil vehicles, is evaluated for zone numbers of one to eight. Section 5 identifies findings of this paper and potentials for further research.
2. Power Supply in Zonal E/E Architectures: Basic Concepts and Research Gap
2.1. Basic Concepts: Shift in E/E Architecture
One centralization approach is the division of the E/E architecture into domains, such as powertrain, infotainment, and body, enabling a more structured architecture. When it was still possible to implement one function per controller, the domain-centralized architecture made it easy to add and verify individual functions. However, this advantage is dwindling with the increase in cross-domain functions and greater connectivity within the vehicle and with its environment [17]. Moreover, the domain-driven structure comes with two further drawbacks: The first is the high communication effort between communication nodes, as ECUs of different domains need to interact for many customer-related functions. The other is the blurring of boundaries between domains by strongly cross-domain functions. This results in a fuzzy structure, especially for autonomous driving and more digitalized vehicles. One possible approach addressing these issues is a cross-domain centralized architecture. Meaning, the functionalities of several domains are bundled in one ECU. Vitesco Technologies combines all the functions that are needed for driving in one ECU [15]. Yet, there is one major disadvantage, namely the communication effort. As the functions in the cross-domain controller increase, so does the calculation effort. Thereby, the bandwidth necessary to exchange data between these ECUs increases, leading to a heavier and more complex wiring harness [18].
The zonal architecture is helpful in tackling this problem. In contrast to domain-based and cross-domain-based architectures, the zonal architecture does not bundle or center functions with respect to domains; instead, it structures them according to geometric aspects [19]. Therefore, the vehicle is divided into zones, each with its own ZCU [11]. All sensors and actuators located in the same zone are connected to the corresponding ZCU. There are approaches in which the ZCUs only transmit the data to a central processing unit. It is also possible to process zone-related functions directly on the ZCU in order to relieve the central processing unit and the communication volume [8,20]. An approach towards the ZCU are generic ECUs as proposed by Tomar [21]. Generic ECUs are general-purpose nodes, which can be used for different processing tasks within the vehicle. Bosch estimates a weight reduction in the wiring harness of 15 to 20% by using a zonal architecture, while EDAG expects potential savings of up to 30% [7,22]. The zonal approach also enables more point-to-point connections of safety-critical components, making it easier and more cost-effective to ensure functional safety. Such architectures are already under development. However, no manufacturer known to the authors is currently using such architecture in a series production vehicle. Most system suppliers typically divide the vehicle along the longitudinal axis and one or more times parallel to the transverse axis, thus obtaining four to eight zones [23,24,25,26].
As other applications, such as unmanned aerial vehicles (UAV) and robots, also have an E/E architecture, it may be possible to utilize the benefits of zonal architecture in them as well. Cui’s research indicates a reduction in wiring harness length and weight by at least 16% [27]. Shrestha introduces a domain-based E/E architecture for UAVs and points out that the centralization of E/E architectures will likely introduce zonal architecture in UAVs in the future [28].
Figure 1 shows the geometrical and the functional view of the UNICARagil vehicle architecture. Figure 1a displays the geometrical view with the separation into four zones. The functional architecture with the components and their interfaces is shown in Figure 1b. In the UNICARagil project, the research consortium designed and built a platform for four autonomous vehicles [29,30,31,32]. This platform corresponds to a four-zone architecture, but without fully comprehensive zone controllers, as they were not available at the beginning of the project. Instead, the vehicle uses one sensor module per zone to process data from the optical sensors, one switch to connect components to the Ethernet network, and one battery including the power distribution unit (PDU) to supply the components in the zone. In addition to a reduction of the wiring harness weight, the zonal architecture has positive effects on safety, modularity, and offers new degrees of freedom in packaging [33]. To ensure the safety of the vehicle in the event of a driver absence, additional hardware is required, which is best provided in separate zones. Considering the increasing number of variants, modularity is an important factor. Interchangeable zones make the diversity of variants more manageable in terms of hardware and software. Efficient packaging leads to more cabin volume that is available for passengers. Furthermore, it offers additional degrees of freedom in the development of the overall vehicle, especially in the integration of other systems. In addition to handling the complexity of the system, freedom in packaging as well as a high degree of modularity reduces development time and lower costs.
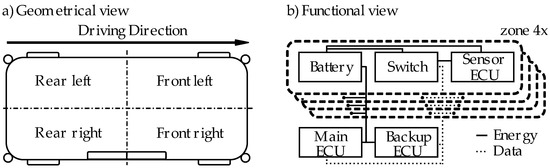
Figure 1.
Four-zone architecture of the UNICARagil vehicles.
2.2. Related Work: Optimization of Vehicle Powernet in Conventional and Domain-Based Architectures
The E/E architecture of vehicles consists of two essential subsystems: the power supply system for storing and distributing electrical energy and the communication structure for transmitting information. When comparing these two, it becomes obvious that the power supply requires volume- and weight-intensive components such as batteries, DC/DC-converters, and power cables. The communication structure, on the other hand, is mostly defined by the connection logic, protocols, and the deployment of software functions on the ECUs. As the zones in zonal E/E architectures are defined by geometrical aspects, hardware has a greater influence on it. Therefore, the method focuses on the volume- and weight intensive hardware of the E/E architecture, as the power supply systems, the wiring harness and the ZCU. To ensure a suitable architecture for the communication structure, the required cables for the vehicle networks are also considered. Several approaches optimize the power supply systems in conventional and domain-based architectures, considering the electrical components with varying level of detail. Since the E/E architecture design was dominated by the functional criteria, the methods used for previous or current architectures have a different perspective. As it is necessary to combine package, power supply, and wiring harness design to realize a suitable zonal E/E architecture, recent methods focusing on these aspects will be discussed.
Most approaches consider the battery as an essential component for BEVs, while further components such as the wiring harness and voltage converter are only covered by few. Package design usually takes the mass of the vehicle’s electrical system into account as it influences the energy consumption. It focuses on the allocation of vehicle space to components, the suitable arrangement of the vehicle components, and thus the realization of the required space in the passenger cabin. Fuchs and Sethuraman focus on a holistic vehicle design, thus considering the components of the E/E architecture in a simplified way [34,35]. Their approaches to assess package compatibility are not suitable for zonal E/E architectures, as they do not consider the wiring harness. Berthold and Fay developed approaches modeling the major components of the powertrain, as well as the battery, by scaling the cells while neglecting other components of the E/E architecture [36,37]. This can be useful for a technological or economic investigation of vehicles, but is not suitable for the design of the E/E architecture in an early concept phase. Lübke developed one of the first systematic approaches for optimizing the vehicle wiring systems [38]. He simplifies the E/E architectures to nodes and their connecting elements, varying the node position with a genetic algorithm. The costs are minimized under various constraints, but it neglects the electrical design and packaging aspects. Diebig develops a methodology for the simulation-based design of automotive wiring systems with a focus on the current carrying capacity of the cables as well as the voltage stability [39]. The thermal modeling of the cables is detailed, but the process simplifies the package situation and does not include any battery design. Consequently, this method is optimal for designing the power supply system at a later stage of development. Wang assesses common power system topologies with respect to their voltage stability using high-power loads [40]. Even though it is not possible to apply his method to power systems above 12 V, and it does not consider cost aspects, there are meaningful findings. However, transferring these findings to practical applications, especially in the context of zonal architectures, proves challenging. Zhu develops a framework for optimizing wiring harnesses in aircraft, which begins with the overall wiring harness design and meticulously optimizes the branch structure in detail [41]. While path planning is optimized, and packaging limitations are taken into account, additional electrical components are not considered. Braun presents a methodology for designing conventional and high-voltage vehicle power systems [42]. She investigates the influence of degrees of freedom in the development process based on energy consumption and total cost of ownership (TCO), taking voltage stability into consideration. For this purpose, she employs models to simulate the electrical behavior of the power network components. Braun also integrates cable routing into the methodology to determine cable lengths. The procedure is suitable for vehicles with conventional and domain-based architectures, but the lack of packaging consideration renders it inapplicable to zonal architectures. Becker and Frank delve into detailed modeling of the high-voltage energy storage system [43,44]. Both focus on the battery design investigating the effects on the energy consumption and the driving performance. Therefore, the battery performance is verified, but compatibility with the vehicle package is not ensured. In addition to automotive applications, there are some methods from other disciplines. In addition to the overall vehicle and communication structure, the power system, as part of the E/E architecture, is subject to requirements from almost all vehicle systems. The vehicle systems have demands regarding the power necessary and the position at which it should be available. The communication network can be understood as one of these vehicle systems or as an electrical load. In safety-critical cases, it may also be necessary for a component to require two power supplies. The requirements of the overall vehicle are directly linked to customer needs such as maximum speed, range, or possible load. Further requirements may be functional and technical, such as maximum weight and volume or failure behavior.
In Table 1, we summarize the modeling characteristics of the described literature. In conclusion, it is neither necessary nor possible to consider a detailed performance of electric components or the powertrain, as these are not fully defined in early development phases. Furthermore, a TCO calculation is possible, when environmental data are used as an input, but since the method brings a small mass reduction in relation to the vehicles mass, there might not be a significant efficiency benefit. The consideration of the E/E architecture hardware components as well as the wiring harness with respect to the packaging is essential for designing the most suitable zonal E/E architecture.

Table 1.
Literature review on electric system design with respect to packaging.
2.3. Research Gap and Contributions
In addition to the overall vehicle and communication structure, the power system, as part of the E/E architecture, is subject to requirements from almost all vehicle systems. The vehicle systems have demands regarding the power necessary and the position at which it should be available. The communication network can be understood as one of these vehicle systems or as an electrical load. In safety-critical cases, it may also be necessary for a component to require two power supplies. The requirements of the overall vehicle are directly linked to customer needs such as maximum speed, range, or possible load. Further requirements may be functional and technical, such as maximum weight and volume or failure behavior.
The shift to a zonal E/E architecture adds more requirements for the vehicle power system. Instead of structuring the vehicle by domains according to functional affiliation, the position of the component in the vehicle is decisive. This leads not only to limitations in the software but also to physical boundaries in the vehicle structure. To achieve the highest possible modularity, zones should be self-contained units. This allows different vehicle variants and models to reuse zones with little effort. It follows that both components and cabling should remain within their defined zone. The number of components that do not belong to a zone must remain as small as possible in favor of modularity. A fully self-sufficient zone would also require one independent energy storage device per zone, which is actually not practical. Therefore, only a logical separation of the battery cells is accomplished. Since a high number of energy storage units can be associated with higher costs, engineers must weigh up which concepts is most suitable. Modularity and practicability of the solution constantly have to be assessed.
Electric and autonomous driving define additional requirements and constraints for tomorrow’s architecture, particularly affecting the wiring harness. The introduction of HV components into vehicles has increased the number and the weight of the wiring harness because a second voltage level is necessary and the drives are supplied electrically. The zonal architecture solves this problem for the HV cables but only under certain conditions. Most concepts currently show the use of only one HV battery [7,8,20,45,46]. However, since the driver is no longer available as a fallback level due to autonomous driving functions, at least one energy storage device must be available in the event of a traction battery failure, providing the energy for driving an emergency trajectory. The introduction of new vehicle concepts, such as autonomous shuttles, increases the vehicle height and leads to further restrictions in regards of the packaging [30,47,48]. The high space requirement for the passenger cabin reduces the available volume for components. On the other hand, the number of antennas, sensors, and other electric loads rises at ceiling height, which also increases the number of cables in those areas. Hence, zone architectures are necessary to address these challenges [49]. In [7], an eight-zone architecture is assumed, while in [8], six to eleven, in [46] and [13] six, in [45] four, and in [50] two to four zones are defined. This already reveals a lack of a structured procedure for determining the number of zones. The criteria used to determine the number of zones are unknown. Likewise, the definition of zone controllers is imprecise, and a clear delimitation of the zone areas does not take place.
The authors are not aware of any holistic method for determining the optimal zonal E/E architecture or the optimal number of zones for same. In a holistic approach, it is necessary to consider packaging, the design of the electrical system, the cable layout, and their aggregation into an optimal architecture. Furthermore, one has to consider the requirements of the overall vehicle level and other vehicle systems. This paper presents a method supporting the comparison and selection of the optimal zone architecture already in early phases of product development with a focus on system specification. Since the selection of the architecture has extensive influence on the concept and costs of the vehicle, it is necessary to make the correct decision in early phases. For this purpose, the method carries out a zone optimization and designs the electrical system with few input data, such as vehicle dimensions, as well as the electrical data and the positions of the electrical components. The method combines optimization and design methods to map extensive wiring system architectures and compare them in early development phases. This reduces development and production effort of the cables, which results in an increase of redundancy and modularity of the electrical system architecture and the entire vehicle.
3. Coupled Approach of k-Means Clustering and Dijkstra’s Algorithm for Zonal E/E Architecture Optimization
To realize a holistic approach considering zone, battery, and wiring harness design, several optimization and design steps are necessary. Figure 2 shows the entire methodology to design a zonal E/E architecture with consideration of the power supply and the wiring harness. The methodology starts with the architecture definition to determine boundary conditions and discretization. In the next step, clustering techniques identify the optimal cluster position for the ZCU. The cluster position is corrected, considering package boundary conditions. Then, a genetic algorithm (GA) optimizes the HV traction battery, and a further procedure allocates the cells to each zone by their power share in relation to the vehicle’s entire power. Hereafter, the remaining components of the power supply system are designed, comprising the 12 V battery and the 48 V supercapacitors (SCAP). The algorithm designs and positions these components in the vehicle to ensure package and concept compatibility. The routing of the cables is optimized utilizing the Dijkstra algorithm and a map-based edge weighting. This allows determining the shortest cable paths while considering requirements from the overall vehicle level and the packaging.

Figure 2.
Design method for zonal E/E architectures.
3.1. Architecture Definition
For generating a three-dimensional grid of nodes and edges, the outer shell and dimensions of the passenger cabin are needed. This forms the basis of the geometric modeling. The nodes correspond to discrete points in the vehicle architecture, and the edges connect them according to the graph theory. After the removal of unused nodes or edges, the remaining ones are available to the algorithm. The electrical components are mapped to the node closest to their coordinates. The mapping of the other systems is performed according to the position and the energy demand of their assigned electronic components. Both sets of information are available, albeit with limited accuracy, prior to the elaboration of the systems. In the following, the set of available edges, nodes, and the power and position of the electrical loads is called the structure. In addition to the geometric representation, an electrical one is necessary, defining the energy and information flows in the architecture. Since it is not clear yet how the interface design of ZCUs will look, the architecture specified in Figure 3 is assumed. It shows a block definition diagram using the system modeling language (SysML). The E/E architecture is based on one or more zones. Each zone requires a ZCU, which incorporates a DC/DC converter and a switch, at least one HV battery cell, and electric components. The number of HV battery cells is proportional to the electric power consumption in a zone and thus also proportional to the number of electrical loads.
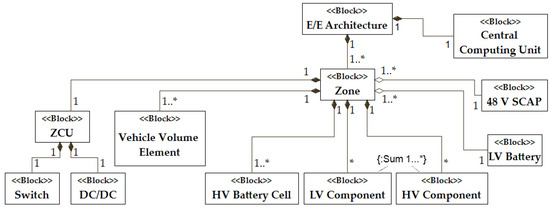
Figure 3.
Block definition diagram of the hardware relations for the zonal E/E architecture in vehicles.
The 48 V SCAP and the LV battery are shared between several zones. Besides the components, a zone is defined by the assigned space of the vehicle. Therefore, vehicle volume elements are assigned to a zone, defining spatial affiliation and delimitation. In addition to the structure, there are some functional dependencies. The ZCU controls the energy flow on the LV level within a zone. An HV line, which is connected to the HV energy storage via a PDU, supplies the ZCU. HV cables connect all other HV consumers in the zone to the HV energy storage via the PDU. The information flow within a zone corresponds to a star topology with the zone controller as the star point [51]. A ring line connects the zone controllers, and one of them may operate as the central computing unit to reduce wiring harness length. If a ring line is not applicable due to network specifications, the central computing unit is connected to all ZCUs as in a star topology [52].
3.2. Zone Optimization
In order to utilize the potential for reducing cable length and weight, it is necessary to minimize the distance between ZCUs and their dedicated loads. This is achieved by clustering the position of the electrical loads and positioning the ZCU at the cluster centers. Therefore, the method described by Maier is used and extended [53]. Since the possible number of clusters is defined based on the literature review as k = {1, 2, …, 8}, k-means clustering is most suitable. The aim of the k-means algorithm is to minimize the sum of the quadratic Euclidean distances D between data points and cluster centers.
wherein ‖xj − μi‖2 indicates the Euclidean distance (l2 norm) between the centroid coordinates μ = {μ1, …, μk}, and the data points X = {x1, …, xn}, 1 ≤ j ≤ n, which are categorized into clusters S = {S1, …, Sk}, 1 ≤ i ≤ k; k, n ∈ N>0. Clusters are groups of data that are similar regarding specific features. In this analysis, the features are the x-, y-, and z-coordinates of the electric components. k-means algorithm comprises three steps: initialization, assignment, and update [54]. In the initialization, the k cluster centers are positioned randomly in the search space. In the second step, the data points X are assigned to the clusters S, which has the nearest mean to the data point according to
For the update step, the new cluster centers are calculated based on the features of the assigned data points. Steps two and three are repeated until the algorithm converges, meaning a further iteration causes no change in the data point-to-cluster assignment. The k-means ++ -algorithm uses the same procedure as k-means, except for a different initialization [55]. The first cluster is initialized randomly. Based on the distance between each data point and the nearest cluster point, the next cluster point is selected. The probability that a datapoint is selected as a new cluster center is proportional to the squared distance to its nearest cluster center. The benefit of the k-means++ initialization step is a shorter convergence time with similar results, as the initial cluster centers are already closer to the final ones. The sum of the Euclidean distances is proportional to the wiring harness cost and enables the identification of suitable ZCU positions. Manhattan distance describes the cable routes better, but as there are limitations like the passenger cabin, they are optimized in a later step using the Dijkstra algorithm.
Nevertheless, there are two issues that k-means algorithm cannot handle: The approximation of the vehicle by a grid and a uniform cluster size. As the vehicle is approximated by a three-dimensional grid of nodes and edges, components may not be positioned exactly on a node and therefore need to be assigned to a node. Starting from the optimal centroid position, the next available node is searched for and determined as the ZCU position, and the Euclidean distances are recalculated based on this node. The consistent cluster size is essential to realize uniform ZCUs, which will increase the quantity of similar produced units. This will lead to increased flexibility for hardware and software and a reduction of the cost. Based on the number of data points n and the number of clusters k, the maximum number of components per cluster, respectively, ZCU xmax is determined using
To ensure that the clusters comprise a similar number of data points, the clusters ci are categorized into three groups by the following condition, wherein |xi| is the number of data points assigned to a cluster:
- I |xi| < |xmax|, the cluster is in the receiver group,
- if |xi| > |xmax|, the cluster is in the deliverer group,
- if |xi| = |xmax|, the cluster is in the neutral group, which is not considered in the balancing process.
The balancing process sorts data points from the group of delivering clusters to the nearest cluster of the receiving group. After each resorting step, the receiving and the delivering clusters are evaluated by the conditions above and regrouped. The balancing process continues until all clusters are in the receiver or in the neutral group. While the balancing process increases the sum of the Euclidean distance, it simultaneously reduces costs for the ZCUs. ZCU costs CZCU are calculated using a third-degree polynomial that is assumed to account for the effect of cost degression and is expressed as follows:
where fZCU is the cost factor of a ZCU, k is the number of zones, respectively, the number of ZCUs in an architecture. The coefficients of the polynomial, p1, p2, p3, and p4, are listed in Appendix A.
3.3. Battery Optimization
The HV battery is a decisive component for the vehicle powernet, as it is one of the components with the highest weight and volume. Therefore, an optimal design of the battery offers potential for increasing vehicle performance and improving the packaging efficiency considering other requirements. Becker describes an approach for designing the optimal traction battery by mixing different battery cells using a genetic algorithm, namely the Covariance Matrix Adaptation Evolution Strategy (CMA-ES) [33]. As the disadvantages of different cell types outperform the benefits, most vehicle manufacturers and suppliers do not pursue this approach further. The traction battery in this article is thus also generated using one cell type. The optimal cell number for one cell type is determined using the Non-Dominated Sorting Genetic Algorithm II (NSGA-II), which shows good results for various optimization problems [56]. The optimization problem concerns the optimal design of the energy storage system considering the criteria acceleration, component cost, range, volume, and weight. It is assumed that there is an exponential relationship between the number of cells and acceleration, while a linear relationship is supposed for the other criteria. A genetic algorithm is employed to solve the optimization problem efficiently and identify a sufficiently robust solution. The number of cells is used as the optimization variable via binary encoding. Beginning with an initial population, the genetic algorithm generates new populations that are either equivalent or superior. Three mechanisms are available for this purpose: mutation, recombination, and a specific selection mechanism described later on. Recombination combines several existing individuals, while mutation modifies an individual at one or more positions in the binary encoding. Recombination is essential for improving the solution, while mutation helps prevent constraints imposed by local minima. The choice of the recombination and mutation rate decisively influences the quality of the solution as well as the computation time. The selection mechanism consists of a binary tournament pairing selection as well as sorting by displacement distance. For tournament pairing selection, it is necessary to evaluate the performance of each individual concerning the target functions. The sum of the equally considered five objectives cost fC, mass fm, volume fV, acceleration fa, and range fR is the fitness value g according to
with the lower boundary for the number of cells nC defined as
wherein EVeh is the energy requirement for the demanded vehicle range and EC is the energy of a single cell. The energy demand of the vehicle is determined using a one-dimensional driving model. Based on acceleration and rolling resistance as well as drag, the energy consumption of the vehicle drives is determined for an autonomous shuttle bus using Worldwide Harmonized Light Vehicles Test Procedure (WLTP). The consumption of the electric components is simplified by their average power consumption, which is based on the power consumption and the duration of usage for each device. The necessary electric loads were determined based on the components of the UNICARagil platform. As the vehicles based on this platform are able to fulfill functions specified in SAE automated driving level 4, the dataset is considered as representative for shuttles of level 4 and below [57]. The electric data of the components do not match those of the UNICARagil vehicles as these are prototypes. To achieve better alignment with the values of production vehicles, literature and datasheets were consulted. The data for the electric components are listed in Appendix A.
The algorithm stops when the termination criteria are met. Using the NSGAII algorithm, a Pareto front is generated, which consists of a set of optimal solutions. When no weighting is applied to the cost factors, the variant with the lowest sum of cost factors is chosen. Depending on requirements, development preferences, and vehicle classification, a weighting factor can be obtained to identify the most suitable solution from the Pareto front. To achieve high modularity, it is necessary to allocate the optimized number of battery cells for the entire vehicle to its various zones. This allocation is based on the power requirements of each zone, as energy can be shifted between zones during operation. The shifting of power between zones would be necessary in short time, which comes with higher cost, as all electric components need to withstand higher currents. The number of battery cells nB,i per zone is determined using
where Pi is the electric power consumption in zone i, PVeh is the electric power consumption of the vehicle, and nB,tot is the total number of cells.
In addition to optimizing the system design and placement of the power supply system, the aim is to achieve overall vehicle optimization. In terms of the vehicle’s performance, this is considered in the evaluation criteria of the genetic algorithm. Requirements regarding the position of the battery cell are considered too. The battery’s volume is constrained by the space below the cabin and between the wheels. The battery’s height is determined by the number of cells necessary to fulfill the range requirements. This ensures that the battery can still be manufactured and mounted as a single component and a logical separation of the battery cells B = {B1, …, Bm}, 1 ≤ i ≤ m, to the zones brings modularity and reliability. To avoid compromising driving dynamics, the battery cells are positioned on the chassis floor symmetrically to the longitudinal axis. The placement in the transverse direction is determined by the position and power distribution of the drive units. The UNICARagil platform uses four drive units with equal power share, each in one corner resulting in a symmetrical placement in reference to the transverse axis. Many passenger cars have one drive unit in the front, causing a shift towards the front of the vehicle. Once the entire battery is placed, the cells are logically separated based on their nearest zone, considering the assigned number of battery cells. Therefore, there are no battery cells Bi* with a shorter Euclidean distance to the cluster center µi than its assigned cells Bi, so the following applies:
As a result, all battery cells are positioned at the vehicle bottom and closest to their respective zone. Another approach is the separation of cells from the main battery and therefore realizing decentralized energy storages. This is not investigated in detail here, as separate auxiliary components like the battery management system (BMS) and the housing would lead to disproportionately higher additional costs. With respect to housing, there is research about approaches to tackle this issue, using batteries that are integrated into the chassis and do not have their own housing [58].
3.4. Electric System Design
Besides the HV battery, it is necessary to design and position LV components. For this purpose, the architecture presented in Section 3.1 is assumed. Since the ZCUs serve as the central power distributors, the DC/DC converters will be integrated into them. This means that the 12 V battery and an optional 48 V SCAP remain for design and positioning. In order to guarantee the function of the LV components in case of a failure in the HV voltage level, two 12 V batteries and 48 V SCAPs are used. Two of each are used to avoid large and heavy components. The components with safety-critical functions of the dedicated zones are connected to the battery or the SCAP depending on their power level. The design is performed based on a worst-case scenario, assuming that the zone with the most powerful components dedicated to the battery or SCAP, stops operating. The time for an emergency halt maneuver tEH and the power of the safety-critical components in this zone on the corresponding voltage level, ∑PC12V,i for 12 V and ∑PC48V,i for 48 V, are used to determine the necessary energy of the batteries EBat,i or SCAP ESC,i according to
and
Recuperation is considered in the design of the 48 V SCAP. Therefore, the power of the 48 V loads PZ,48V and the maximum charging power due to the recuperation PR,max of the drive units are compared, and the higher one is selected. The position of the 12 V batteries and the 48 V SCAPs is determined by minimizing the distance to the connected components.
3.5. Cable Routing Optimization:
The components of an E/E architecture are connected by cables for energy and information transmission. Cables for energy transmission are denoted by E = {E1,..., Em}, the cables for information transmission by I = {I1,..., In}. Since there is currently no standard for energy and information transmission on the same cable in the automotive sector (cf. USB in the consumer sector), a distinction between cables for energy and information transmission is made. In the following, the term wiring harness indicates all cables considering power or data transmission. As the vehicle structure is approximated by a three-dimensional graph of nodes and edges, the cable routing is treated as a single-source shortest path (SSSP) problem. Dijkstra algorithm is a well-established algorithm to solve SSSP problems as it considers the edge weight, which represents requirements of other vehicle systems, e.g., temperature or EMC. Using Dijkstra’s algorithm, the length of each cable is minimized regarding edge cost. Dijkstra’s algorithm aims to minimize the distance of a path; for orthogonal three-dimensional grids, it is similar to the Manhattan distance, which is defined as the sum of the absolute differences of all vector components [59]. The nodes are defined by the properties distance and predecessor. Furthermore, they are classified into two sets of nodes: the unvisited and the visited ones. In the initialization step, all nodes are put into the set of unvisited ones. The algorithm starts by inspecting the starting node, while the predecessor is empty for all nodes. Therefore, the distance for the starting node is set to zero, for all other nodes it is infinite. Beginning with the starting node, all nodes are visited. When a node is investigated, the distances of all its neighbor nodes are checked and updated if the shortest path to the visited node plus the distance to the neighboring node is less than the current distance. After completing this procedure for all neighboring nodes, the current node is put into the set of visited nodes and never visited again. The next inspected node is the unvisited node having the shortest distance to the starting node. The stopping criteria depends on the aim of the algorithm. The variant used here, plans the shortest path between start and end node. Therefore, it stops as soon as the target node is put in the set of visited nodes. The other variant identifies the shortest path between a starting node and all other nodes and terminates when there are only unvisited nodes with distance infinite left. This means that there is no path to the start node.
Based on the system definition described in Figure 3, start and end point are specified as follows: when the voltage of the start component is below 60 V, the target component is the ZCU, otherwise it is the HV PDU. For information processing, the ZCUs are always the targets, except for the cables connecting the ZCUs. The cost of the cables is determined using
wherein ‖x − γ‖1 is the Manhattan distance (l1 norm) of the starting node x, which are the electric components, and the target node γ, which is a ZCU or the HV PDU. cI is the cost factor for information transmission cables in €/m, cE is the cost factor for energy transmission cable in €/m, which is depending on the diameter of the cable, and fE is the factor for the ground line, which is one for components that operate on a voltage below 48 V. Components that operate on 48 V or above need a separate ground line, therefore the factor is two for them. Besides these cables, there is a ring line for data transmission between all ZCUs, respectively, the centroids µ. Its length corresponds to the Manhattan distance between the ZCUs, which is determined according to
The effort required for cable installation can vary at local level. Influencing factors may be preferred cable routing, temperature, distance to ZCUs as well as occupancy of existing paths [49]. To reduce manufacturing time and cost, car manufacturers define main cable routes. It is requested to use these when designing the cable route between components. There are three common variants for designing the main cable paths: the E-variant, the H-variant, and the double-H-variant [60]. According to Neckenich, especially for long vehicles, the double H-variant is dominant. As the UNICARagil vehicles are shuttle busses, the double-H-variant appears to be most suitable. This routing variant consists of two paths along the longitudinal axis, one on each side, and two paths along the transverse axis, approximately at one third and two thirds of the vehicle length. The routing is extended to include four paths along the vertical axis of the vehicle, which are located in the four corners, and a second double-H structure in the vehicle roof. In order to consider these influences, a characteristic map for the graph is required. In Figure 4, the cost of all usable edges for the Dijkstra algorithm of the autoSHUTTLE are visualized. The characteristic map represents the requirements of the overall vehicle and the packaging to ensure that the Dijkstra algorithm respects them in the optimization of the wiring harness. The extended double-H-paths are indicated by lower edge weight in the vehicle floor and roof.
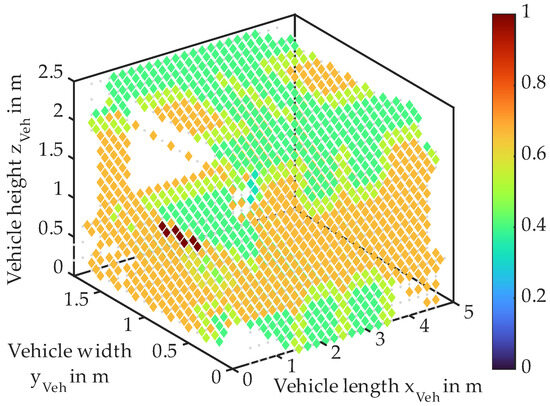
Figure 4.
Characteristic edge cost map for cable routing optimization based on vehicle requirements.
3.6. Evaluation
Based on the previous optimization steps, the architectures are compared and evaluated by cost, weight, system complexity, state of function (SOF), and zone balance. Component cost and weight are estimated based on the electrical power or capacity utilizing cost functions. The definition of complexity for E/E architectures ΛE/E is based on the number of components, their dynamic, and interfaces according to
wherein λ ∈ ℚ [0, 1] indicates the components of complexity [53]. While the first index represents the dimension (p for physical, v for virtual), the second index names the aspect (i for interdependence, m for multiplicity, d for dynamic) [61].
Besides the development aspects like cost, weight, and complexity it is important to consider the functional differences caused by topologies. By separating the vehicle in zones, it is possible to realize self-sufficient functional units. They are supposed to operate independently, and therefore a measure that determines the remaining functions, whenever one zone has an error, is necessary. As the available energy Eel,SOF and power Pel,SOF are proportional to the functions, they are used to define the E/E architecture state of function SOFEE. For the determination of the SOFEE, the worst-case scenario is considered, and therefore the most powerful zone quits operating. The SOFEE is determined based on
with Eel,tot as total energy and Pel,tot as total power of the architecture. The zone balance is the sum of the relative deviations of all zone powers of an architecture from their average power. The algorithm prioritizes these criteria according to the vehicle type and the user requirements.
Software has a higher share in vehicle development today, which will further increase in the future. As product development for software components is faster and more agile than for hardware components, it will be important for these architectures to be updateable and more flexible for changes. As the assignment of components defines the architectures, it is representative to evaluate the quality of the clustering as a measurement for flexibility of an architecture. There are different internal clustering validation measures as the Calinski–Harabasz index (CHI), the Davies–Bouldin index (DBI), or silhouette coefficient (SC), which are compared by Liu et al. [62]. The CHI is based on the similarity of a data point to its cluster (separation) compared with the similarity to other clusters (cohesion). The separation is defined by the distances between the data points in a cluster to their centroid, and cohesion is determined using the distance of the cluster centroids to the global one. The Davies–Bouldin index measures the quality of the clusters by comparing the distance between clusters with the size of the clusters themselves. The silhouette coefficient uses the average distance of an object to other objects in the same cluster and subtracts it from the average distance of the object to the objects of the nearest other cluster. As electric components in vehicles are distributed inhomogeneous, the distance between components can be higher than the size of a cluster. Nevertheless, it is reasonable to put them in the same cluster. Therefore, DBI and SC have a disadvantage against CHI, since they use a global cluster centroid for comparison. As the clusters of electric components are classified by geometric features reducing the total distance, the delimitation of clusters might not be as clear as with a set of problem-specific features. Therefore, the results of DBI and SC indicate a low to medium quality in cluster results, whereas CHI calculates an absolute value. As the target is to identify the most suitable architecture, it is more reasonable to use an index that puts the focus on the comparison of architectures instead of an index evaluating the quality of the architectures. CHI is determined according to
using SSB as between-cluster variance, SSW as within-cluster variance, k as the number of clusters, and n the number of data points in X [63]. The between-cluster variance SSB and the within-cluster SSW variance are determined using
and
|xi| is the number of data points of the dedicated cluster Si, xm is the mean of all data points xj, and ‖µi − xm‖ and ‖xj − µi‖ are the Euclidean distance between two vectors.
4. Discussion
The methodology described is verified by means of simulations. For this purpose, the structure of the prototype vehicle autoSHUTTLE and the electric components based on literature are used. The main dimensions of the vehicle are shown in Appendix A while the component data are listed in Appendix A. The vehicle has four-wheel hub drives and four sensor modules with cameras, lidars, and radars in each of the four corners of the vehicle. The other loads are distributed unevenly throughout the vehicle. Table 2 shows the simulation results for the designed zonal architectures. The criteria are SOFEE, balance, flexibility, the mass of the E/E architecture mEE, and the length of the wiring harness LWH. The SOFEE and balance are normalized values reaching from zero to one, where one represents the best possible fulfillment of the criterion. Rising zone numbers go along with an increase in the SOFEE, as the power per zone and therefore the number of supplied functions decreases. Higher SOFEE values indicate a lower complexity of the system, which is meaningful as the wiring harness is highly simplified by zone separation. The breakdown in several zones also reduces the complexity of the electronic components as the number of states, the variants, and their dynamic behavior simplifies. The balance decreases as zone numbers rise, caused by an increasing divergence in the power of the individual zones. The higher the balance, the more similar are the zones and their ZCUs, leading to higher modularity and less variants. Therefore, balance has a high influence on the variant cost, but no influence on functional aspects. The flexibility, which is characterized by the CHI, decreases as well with rising zone numbers.
Table 2.
Functional criteria evaluation based on simulation of zonal E/E architectures from zone numbers of one to eight.
An increased number of zones will come with both advantages and disadvantages. While the availability of function improves, there is a slight decrease of the balance, which is related to modularity. Flexibility lowers with a rising zone number, beside the five-zone architecture, which stands out with an increased value in opposition to the trend. Surjekat et al. discuss five different zonal architectures, having 3, 5 or 6 ZCUs [52]. In these architectures, the ZCUs are interconnected using a star topology, ring topology, or a combination of both. However, it is important to note that while they assess these architectures in terms of flexibility and safety, comparing their results to the findings outlined in this paper may not be meaningful. This is because the evaluation criteria are not clearly defined nor is the wiring harness considered in detail in their assessment.
Table 3 lists the mass mWH and length LWH of the entire wiring harness as well as the separate values for the information transmission (mWH,I, LWH,I) and energy transmission (mWH,E, LWH,E) cables. The wiring harness mass is reduced between 6.8 and 8.8%. While all architectures show a reduced weight in comparison to the reference architecture with one zone, the lowest weight is obtained for seven zones. Regarding the wiring harness mass of the one zone architecture, one needs to consider that four drive units in each corner of the vehicles were used, which is a major drawback for architectures with few zone numbers, while the mass of almost 60 kg is still meaningful [7,8]. The mass for the information transmission cables is reduced by up to one kilogram in accordance with their length decrease. The length of the cables for energy transmission rises while their mass decreases sharply. This is caused by the fact that more power cables are necessary as all ZCUs need to be connected to the HV battery. The weight of the power cables is reduced, as the cable diameter from the ZCU to the component is reduced. Evaluating the length of the entire wiring harness for the different zone numbers, a reduction of 5.6 to 13.6% is accomplished. The overall decrease in mass and length shows that there is potential to improve the E/E architecture by centralization, using ZCUs to optimize the wiring harness. Cui reduces the length and mass of its wiring harness by 16% and more considering only cables for information transmission [27]. With this method, their length is reduced by 6.7 to 13.6% and their mass by 5.7 to 13.6%. The difference is caused by the different application. In the following, the volumes of humanoid robots and vehicles will be compared, so the terms height, width, and length will be specified for the robot as follows: Height is the dimension from the back of the body to the front, that is, from back to chest. Width is the dimension between the outsides of both hands, and length is the dimension between the bottom of the feet and the top of the head. Comparing the volumes of the humanoid robot and the vehicle, it can be seen that the longitudinal extent of both is significantly greater than the extent in the other two axes. The ratio of length to height and width is significantly smaller for the humanoid robot. A further difference is the limited cable paths in robots, since no cables can be laid between the extremities. Thus, most cable paths are longitudinal connections; elevated and transverse connections are only useful for a few routes. In vehicles, on the other hand, connections are possible in all spatial directions; only the vehicle interior prevents connections inside the vehicle. The restriction to one spatial direction in humanoid robots leads to a higher percentage of weight and length savings, since practically only the connections to the furthest away components and short branches to the closer components are determined. Park reports reduction in length of 24.7% and in mass of 24.6% [6]. The pure values of Park seem superior, while one needs to consider that he focuses on end-to-end timing of messages and does not provide information regarding the design procedure of the wiring harness as well as the distribution of the ECUs in the vehicle. The end-to-end timing of messages is influenced by the wiring harness design, while the results are still meaningful for the architecture comparison. Regarding the wiring harness length and weight, the meaningfulness is reduced as power distribution as well as wiring harness routing is not considered. Besides the functional and package criteria, the cost is crucial when it comes to architecture design. The cost for the entire E/E architecture CEE is decreasing with rising zone number caused by decreasing cost for the information transmission CWH,I and energy transmission CWH,P cables, whereby one should consider that CWH,E for one zone might be too high, as in a one-zone architecture are power distribution devices to reduce cable mass. Comparing the values listed in Table 4 with a recent study of the ICCT shows that the predicted costs are reasonable [62]. The summed cost projection by the ICCT for the electric components in BEVs are up to approx. USD 2000 (EUR 11,182.86, 5 September 2023) for 2019, while they are decreasing to approx. USD 5000 in 2030.
Table 3.
Packaging criteria evaluation based on simulation of zonal E/E architectures from zone numbers of one to eight.
Table 4.
Cost evaluation based on simulation of zonal E/E architectures from zone numbers of one to eight.
5. Conclusions
In early development phases, technical details of most electrical components are unclear. Since the power supply system interfaces with almost all systems, its design is highly dependent on them. Late consideration in the design process leads to problems in packaging, especially in regards to the wiring harness and the traction battery. This paper introduces a method to tackle this issue. Based on a minimum of information about, respectively, position, power consumption, and voltage level, a zonal architecture is designed in early development phases. As there is an intense interaction between the E/E architecture and its electronic components, developing one without the other will cause significant problems. Having a closer lock on the components with the highest problem potential, the traction battery and the wiring harness are the most critical of the power supply system. The wiring harness spans the entire vehicle structure, and the battery has a high weight and volume share of the vehicle. To tackle these problems, a coupled approach of k-means clustering and Dijkstra algorithm is introduced. The k-means algorithm identifies the most likely zone numbers for the components, the zone classification, and the position of its central power and data device, the ZCU. This is accomplished by clustering the position of the electric components and determining the best position for the centroid with respect to the vehicle packaging. To ensure that the proposed architecture is package-compatible, the design of the traction battery and the wiring harness is integrated. Therefore, the battery for a given range is determined and integrated in the vehicle packaging. The wiring harness is routed based on the definition of the system using SysML v1.6 and with respect to requirements such as temperature or EMC. This enables a synthesis of concepts from different disciplines and systems already in an early phase. This design method enables the determination of the optimal number of zones according to application-specific criteria. In this paper, functional, packaging, and cost criteria are used to evaluate the variant. The selection of the best variant is dependent on the development aim. For compact vehicles, the version with the lowest cost might be the best one, and for high-class vehicles, an architecture with the best fulfillment of the functional criteria is more suitable. With the presented method, it is possible to identify the optimal zone architecture and design a vehicle power supply system, even when facing uncertainties. Early identification of the optimal zone and power supply design increases the quality of the solution and reduces iteration loops, thereby cutting development time and costs.
The research identified that it is possible to design a zonal architecture with limited information and to utilize the potential of this new architecture approach. Even with such rudimentary data as position, power consumption, and voltage of the electric loads, the optimization procedure is able to structure the electric loads and reduce wiring harness length and weight. As the approach uses k-means clustering and Dijkstra’s algorithm, a model compatible with both was identified and adapted. Furthermore, an adaption for k-means clustering was developed, which realizes an equal cluster size with minimal length increase. By combining electrical, package, and wiring harness design, this method realizes a guideline for the development of zonal E/E architectures in early design phases.
The results of the simulation show that there is a dependency of the clusters on the distribution of the components, but their electric power is not considered in the clustering process. The influence and the meaningfulness of its consideration in the clustering procedure needs to be investigated in the future. Furthermore, the sensitivity of the clusters to position data changes has to be examined to identify further potential for improvement in the clustering procedure. The relation of the optimization result to the consumer position, distribution, and power is essential in this case. A detailed sensitivity investigation is necessary to ensure the extensibility of the optimized architectures in both electrical and geometrical terms. For a more accurate determination of the power consumption, a traffic simulation should be added. To ensure that the cost projection for the architecture is reliable in the future, the declining costs for batteries and electronic components must be considered.
Author Contributions
Conceptualization, J.M.; methodology, J.M.; software, J.M.; validation, J.M.; formal analysis, J.M.; investigation, J.M.; resources, J.M.; data curation, J.M.; writing—original draft preparation, J.M.; writing—review and editing, H.-C.R.; visualization, J.M.; supervision, H.-C.R.; project administration, H.-C.R.; funding acquisition, H.-C.R. All authors have read and agreed to the published version of the manuscript.
Funding
This research was funded by the Federal Ministry of Education and Research of Germany (BMBF), AUTOtechagil (FKZ 01IS22088x). This publication was funded by the German Research Foundation (DFG) grant “Open Access Publication Funding/2023–2024/University of Stuttgart” (512689491).
Data Availability Statement
No new data were created or analyzed in this study. Data sharing is not applicable to this article.
Conflicts of Interest
The authors declare no conflict of interest.
Nomenclature
| B | Battery cell | nB,tot | Total number of battery cells |
| CC,El | Cable cost, € | p1–p4 | Parameter for ZCU cost function |
| cE | Cost factor for energy tra. cables | Pi | Power of a zone, W |
| cI | Cost factor for information tra. cables | PC12V | Safety-critical power of a zone on 12 V, W |
| CC,ZCU | Cable cost ring line ZCU, € | PC12V | Safety-critical power of a zone on 48 V, W |
| CZCU | Zone control unit cost, €/Unit | Pel,SOF | Remaining electric power, W |
| D | Total Euclidean distance, m | Pel,tot | Total electric power, W |
| d(x) | Diameter of cable x | PVeh | Power consumption of the vehicle, W |
| E | Cable for energy transmission | Si | Cluster |
| EBat | Energy of the 12 V battery, J | SOFEE | State of Function of E/E architecture |
| EC | Energy of a battery cell, Wh | SSB | Between-cluster variance |
| ESC | Energy of the 48 V SCAP, J | SSW | Within-cluster variance |
| Eel,SOF | Remaining electric energy, J | tEH | Emergency halt maneuver time, s |
| Eel,tot | Total electric energy, J | xj | Data points of electric components |
| EVeh | Necessary energy for the vehicle range, J | xm | Mean of all data points x |
| fa | Cost factor acceleration | xmax | Max. number of data points per cluster |
| fc | Cost factor material cost | |x| | Number of data points in a cluster |
| fE | Cost factor for ground line | x | Vehicle length, m |
| fm | Cost factor mass | y | Vehicle width, m |
| fR | Cost factor Range | z | Vehicle height, m |
| fV | Cost factor volume | γ | Target node |
| fZCU | Cost factor ECU, € | λp,i | Physical interdependence |
| g | Fitness value | λp,d | Physical dynamic |
| I | Cable for information transmission | λp,m | Physical multiplicity |
| k | Zone number | λv,i | Virtual interdependence |
| n | Number of data points | λv,d | Virtual dynamic |
| nC | Lower boundary cell number | λv,m | Virtual multiplicity |
| nB,i | Number of battery cells per zone | µi | Centroid |
Appendix A
Table A1.
Parameters.
Table A1.
Parameters.
| Symbol | Description | Value | Units |
|---|---|---|---|
| EC | Energy of a battery cell | 11.5 | Wh |
| FZCU | Cost ZCU | 150 | € |
| p1 | p1 of ZCU Cost Function | −0.003571 | - |
| p2 | p2 of ZCU Cost Function | 0.06667 | - |
| p3 | p3 of ZCU Cost Function | −0.425 | - |
| p4 | p4 of ZCU Cost Function | 1.362 | - |
| tEH | Emergency halt maneuver time | 30 | s |
| xVeh | Vehicle length | 4.97 | m |
| yVeh | Vehicle width | 2.05 | m |
| zVeh | Vehicle height | 2.44 | m |
Table A2.
Assumed electric loads for the E/E architecture of SAE level 4 vehicles.
Table A2.
Assumed electric loads for the E/E architecture of SAE level 4 vehicles.
| Component | Maximum el. Power Pmax [W] | Usage Time tU [%] | Average el. Power Pavg [W] | Number [-] | Reference |
|---|---|---|---|---|---|
| Camera | 2 | 100 | 2 | 7 | [64] |
| CPU for | 96 | 100 | 96 | 2 | [64] |
| DSRC (dedicated short-range communication) | 2 | 100 | 2 | 1 | [64] |
| Lidar sensor | 60 | 100 | 60 | 4 | [64] |
| Radar sensor | 8 | 100 | 8 | 8 | [64,65] |
| Sonar/Ultrasound sensor | 0.15 | 100 | 0.15 | 2 | [64] |
| Air conditioner front | - | 100 | 600 | 1 | [66] |
| Anti-fog light | 35 | 0 | 0 | 3 | [67] |
| Blind zone radar | 5 | 100 | 5 | 1 | [67] |
| Braking light | 21 | 50 | 10.5 | 3 | [67] |
| Cabin lights | 20 | 100 | 20 | 1 | [67] |
| Door module | - | 100 | 360 | 2 | [66] |
| Electric roof | 300 | 5 | 15 | 1 | [67] |
| Front window heater | 1500 | - | 120 | 1 | [68] |
| Headlamps | 60 | 100 | 60 | 2 | [67] |
| Rear window heating | - | - | 120 | 1 | [69] |
| Reversing light | 21 | 10 | 2.1 | 2 | [67] |
| Body Control Modul | 360 | 100 | 360 | 1 | [70] |
| Seats electronics | 300 | 5 | 15 | 2 | [67] |
| Turning light | 21 | 20 | 4.2 | 6 | [67] |
| 5G Router | 68.4 | 100 | 68.4 | 1 | [71] |
| GNSS | 0.55 | 100 | 0.55 | 1 | [72] |
| Audio system | 25 | 100 | 25 | 1 | [67] |
| Multimedia screens | 30 | 100 | 30 | 2 | [67] |
| Navigation | 15 | 100 | 15 | 1 | [67] |
| ABS | - | 100 | 600 | 1 | [73] |
| Brake-by-wire | 1300 | - | 150 | 1 | [74] |
| Cooling pump | 1200 | 100 | 500 | 1 | [68] |
| Cooling radiator | 500 | 50 | 100 | 1 | [69] |
| Engine ECU | - | 100 | 700 | 1 | [74] |
| ESP | 7800 | - | 3000 | 1 | [66] |
| Steer-by-wire | 1400 | - | 28 | 1 | [74] |
| Suspension pump | 1000 | 20 | 200 | 1 | [67] |
| Vehicle control unit (Control and Fusion) | 1000 | - | 750 | 1 | [74] |
| Drive Modul | 13,000 | 25 | 3250 | 4 | [75] |
| BMS | 24 | 100 | 24 | 1 | * |
| Backup ADAS ECU | 500 | 100 | 500 | 1 | [76] |
* Measurement.
References
- Bernhart, W.; Riederle, S.; Hotz, T.; Olschewski, I.; Busse, A. E-Mobility Index 2021. Available online: https://www.rolandberger.com/publications/publication_pdf/roland_berger_e_mobility_index_2021_en.pdf (accessed on 28 August 2023).
- Kampker, A.; Offermanns, C.; Heimes, H.; Bi, P. Meta-analysis on the Market Development of Electrified Vehicles. ATZ Worldw. 2021, 123, 58–63. [Google Scholar] [CrossRef]
- He, H.; Sun, F.; Wang, Z.; Lin, C.; Zhang, C.; Xiong, R.; Deng, J.; Zhu, X.; Xie, P.; Zhang, S.; et al. China’s battery electric vehicles lead the world: Achievements in technology system architecture and technological breakthroughs. Green Energy Intell. Transp. 2022, 1, 100020. [Google Scholar] [CrossRef]
- Katis, C.; Karlis, A. Evolution of Equipment in Electromobility and Autonomous Driving Regarding Safety Issues. Energies 2023, 16, 1271. [Google Scholar] [CrossRef]
- Lutsey, N.; Cui, H.; Rujie, Y. Evaluating Electric Vehicle Costs and Benefits in China in the 2020–2035 Time Frame; White Paper; International Council for Clean Transportation: Washington, DC, USA, 2021. [Google Scholar]
- Park, C.; Park, S. Performance Evaluation of Zone-Based In-Vehicle Network Architecture for Autonomous Vehicles. Sensors 2023, 23, 669. [Google Scholar] [CrossRef] [PubMed]
- Maul, M.; Becker, G.; Bernhard, U. Service-oriented EE zone architecture key elements for new market segments. ATZ Elektron. Worldw. 2018, 13, 36–41. [Google Scholar] [CrossRef]
- Klaus-Wagenbrenner, J. Zonal EE Architecture: Towards a Fully Automotive Ethernet–Based Vehicle Infrastructure. In Proceedings of the Automotive E/E Architecture Technology Innovation Conference, Shanghai, China, 7–8 November 2019. [Google Scholar]
- Otten, S.; Glock, T.; Hohl, C.P.; Sax, E. Model-based Variant Management in Automotive Systems Engineering. In Proceedings of the 5th IEEE International Symposium on Systems Engineering, Edinburgh, UK, 1–3 October 2019. [Google Scholar] [CrossRef]
- Mischo, S.; Kornhaas, R.; Krauter, I.; Kersken, U.; Schöttle, R. E/E architectures at the crossroads. ATZ Elektron. Worldw. 2008, 3, 10–13. [Google Scholar] [CrossRef]
- Bandur, V.; Selim, G.; Pantelic, V.; Lawford, M. Making the Case for Centralized Automotive E/E Architectures. IEEE Trans. Veh. Technol. 2021, 70, 1230–1245. [Google Scholar] [CrossRef]
- Buttle, D.; Gold, S. MCUs and Virtualization in Zone E/E Architectures. ATZ Elektron. Worldw. 2022, 17, 18–24. [Google Scholar] [CrossRef]
- Schäfer, C.; Denkelmann, R. Sustainable E/E Architecture Power Supply and Data Transmission for Autonomous Driving. ATZ Elektron. Worldw. 2018, 13, 16–21. [Google Scholar] [CrossRef]
- Robert Bosch GmbH. Vehicle Control Unit: Die Vehicle Control Unit als zentrale E/E-Architekturkomponente für Alle Powertrain Topologien. Available online: https://www.bosch-mobility.com/de/loesungen/steuergeraete/vehicle-control-unit/ (accessed on 28 August 2023).
- Vitesco Technologies GmbH. Vitesco Technologies Entwickelt Master Controller für Eine Neue Ära in der Antriebssteuerung. Available online: https://www.vitesco-technologies.com/de-de/press-events/press/tech-day-master-controller (accessed on 28 August 2023).
- Stroh, C.A. E/E-Architekturen Frischzellenkur. Available online: https://www.automotiveit.eu/exklusiv/frischzellenkur-210.html (accessed on 28 August 2023).
- Askaripoor, H.; Hashemi Farzaneh, M.; Knoll, A. E/E Architecture Synthesis: Challenges and Technologies. Electronics 2022, 11, 518. [Google Scholar] [CrossRef]
- Brunner, S.; Roder, J.; Kucera, M.; Waas, T. Automotive E/E-architecture enhancements by usage of ethernet TSN. In Proceedings of the 2017 13th Workshop on Intelligent Solutions in Embedded Systems (WISES), Hamburg, Germany, 12–13 June 2017; IEEE: Piscataway, NJ, USA, 2017; pp. 9–13, ISBN 9781538611579. [Google Scholar]
- Zhu, H.; Zhou, W.; Li, Z.; Li, L.; Huang, T. Requirements-Driven Automotive Electrical/Electronic Architecture: A Survey and Prospective Trends. IEEE Access 2021, 9, 100096–100112. [Google Scholar] [CrossRef]
- Frigerio, A.; Vermeulen, B.; Goossens, K.G.W. Automotive Architecture Topologies: Analysis for Safety-Critical Autonomous Vehicle Applications. IEEE Access 2021, 9, 62837–62846. [Google Scholar] [CrossRef]
- Tomar, A.S. Modern Electrical/Electronic Infrastructure for Commercial Trucks: Generic Input/Output nodes for sensors and actuators in Commercial Trucks. Master’s Thesis, KTH Royal Institute of Technology, Stockholm, Sweden, 2017. [Google Scholar]
- Robert Bosch GmbH. E/E-Architecture in a Connected World; Robert Bosch GmbH: Gerlingen, Germany, 8 March 2017. [Google Scholar]
- Niklas-Höret, M. Impact of the Zone Architecture on the in Vehicle SW Distribution. Available online: https://ahkfinnland.de/filehub/deliverFile/e9a3077f-b2ce-425f-8835-a61b2e62513b/1229026/Continental_Keynote_1229026.pdf (accessed on 28 August 2023).
- Avery, G.; Dawson, J.; Dornbusch, G. Zonal Architecture: Making the Car of the future Possible; White paper; Molex: Lisle, IL, USA, 2023. [Google Scholar]
- Infineon Technologies AG. Dependable Solutions for Future Mobility and Zonal E/E Architectures; Infineon Technologies AG: Neubiberg, Germany, 2021. [Google Scholar]
- Aberl, P.; Haas, S.; Vemuri, A. How a Zone Architecture Paves the Way to a Fully Software-Defined Vehicle; White Paper. Available online: https://www.ti.com/lit/wp/spry345a/spry345a.pdf?ts=1681378174830&ref_url=https%253A%252F%252Fwww.google.com%252F (accessed on 28 August 2023).
- Cui, C.; Park, C.; Park, S. Physical Length and Weight Reduction of Humanoid In-Robot Network with Zonal Architecture. Sensors 2023, 23, 2627. [Google Scholar] [CrossRef] [PubMed]
- Shrestha, R.; Kim, D.; Choi, J.; Kim, S. A Novel E/E Architecture for Low Altitude UAVs. In Proceedings of the 2022 IEEE International Symposium on Circuits and Systems (ISCAS), Austin, TX, USA, 27 May–1 June 2022; IEEE: Piscataway, NJ, USA, 2022; pp. 346–350, ISBN 9781665484855. [Google Scholar]
- Zaheri, D.; Niedballa, D.; Leuffen, M.; Bilkei-Gorzo, G. Practical Implementation of a Zonal E/E Architecture for Autonomous Vehicles in UNICARagil. ATZ Electron. Worldw. 2023, 18, 8–12. [Google Scholar] [CrossRef]
- Woopen, T.; Lampe, B.; Böddeker, T.; Lutz, E.; Kampmann, A.; Alrifaee, B.; Kowalewski, S.; Moormann, D.; Torben, S.; Jatzkowski, I.; et al. UNICARagil—Disruptive Modular Architectures for Agile, Automated Vehicle Concepts. In Proceedings of the 27th Aachen Colloquium Automobile and Engine Technology, Aachen, Germany, 8–10 October 2018. [Google Scholar]
- Goth, M.; Keilhoff, D.; Reuss, H.-C. Fault tolerant electric energy supply system design for automated electric shuttle bus: Band 2. In 20. Internationales Stuttgarter Symposium; Springer: Berlin/Heidelberg, Germany, 2020; pp. 441–455. [Google Scholar] [CrossRef]
- Gehringer, D.; Kuthada, T.; Wagner, A. Thermal Management System of the UNICARagil Vehicles—A Comprehensive Overview. World Electr. Veh. J. 2023, 14, 6. [Google Scholar] [CrossRef]
- Moran, R.; Sindaco, F.; Birnie, A.; Vermeulen, B. Der Plattform-Ansatz als Revolution der Fahrzeugarchitektur: Von Domänen zu Zonen: Architektur für Autonome Autos Neu Gedacht. Available online: https://www.all-electronics.de/automotive-transportation/von-domaenen-zu-zonen-architektur-fuer-autonome-autos-neu-gedacht-197.html (accessed on 28 September 2023).
- Fuchs, S. Verfahren zur Parameterbasierten Gewichtsabschätzung neuer Fahrzeugkonzepte. Ph.D. Thesis, Technische Universität München, Munich, Germany, 2014. [Google Scholar]
- Sethuraman, G. Vehicle Component Configuration Design and Packaging in Virtual Environment for Autonomous Electric Buses. Ph.D. Thesis, Tokyo University of Agriculture and Technology, Tokyo, Japan, 2019. [Google Scholar]
- Fay, T.-A. Methodischer Technologieverleich von Systemkonzepten für die Elektrifizierung von Stadtbussen. Ph.D. Thesis, Technical University of Berlin, Berlin, Germany, 2019. [Google Scholar]
- Berthold, K. Techno-Ökonomische Auslegungsmethodik für die Elektrifizierung Urbaner Busnetze; Karlsruhe Institute of Technology: Karlsruhe, Germany, 2019. [Google Scholar]
- Lübke, A. Systematischer Bordnetzentwurf: Optimierung der Bordnetzarchitektur mit Hilfe von Genetischen Algorithmen; Technische Universität Dresden: Dresden, Germany, 1999; ISBN 3896535609. [Google Scholar]
- Diebig, M. Entwicklung einer Methodik zur Simulationsbasierten Dimensionierung von Kfz-Bordnetzen. Ph.D. Thesis, Technical University of Dortmund, Dortmund, Germany, 2016. [Google Scholar]
- Wang, J. Simulationsumgebung zur Bewertung von Bornetz-Architekturen mit Hochleistungsverbrauchern. Ph.D. Thesis, University of Kassel, Kassel, Germany, 2016. [Google Scholar]
- Zhu, Z.; La Rocca, G.; van Tooren, M.J.L. A methodology to enable automatic 3D routing of aircraft Electrical Wiring Interconnection System. CEAS Aeronaut. J. 2017, 8, 287–302. [Google Scholar] [CrossRef]
- Braun, L. Modellbasierte Design-Space-Exploration Nicht-Funktionaler Auslegungskriterien des Fahrzeugenergiebordnetzes. Ph.D. Thesis, Karlsruhe Institute of Technology, Karlsruhe, Germany, 2018. [Google Scholar]
- Becker, J.N. Dimensioning and Optimization of Hybrid Li-Ion Battery Systems with different Optimization Goals; RWTH Aachen University: Aachen, Germany, 2017. [Google Scholar]
- Frank, F. Optimierter Hochvoltbatterieentwurf Hinsichtlich Mechanischer, Thermischer und Elektrischer Randbedingungen unter Berücksichtigung der Produktionskosten. Ph.D. Thesis, University of Duisburg-Essen, Duisburg, Germany, 2019. [Google Scholar]
- Meyer, G. Schlüsselrolle der EE-Architektur und der Bordnetze für das Automobil der Zukunft; White Paper. Available online: https://www.strategiekreis-automobile-zukunft.de/files/enova-position-bordnetze-und-fahrzeugarchitektur.pdf (accessed on 28 September 2023).
- Müller, M. Zonen-Basierte E/E-Architektur im Fokus: Automatisiertes und Vernetztes Fahren; HANSER Automotive: Ulm, Germany, 2021; pp. 26–28. [Google Scholar]
- Zoox Inc. Introducing Zoox: Built for Riders, Not Drivers. Available online: https://zoox.com/vehicle/ (accessed on 28 August 2023).
- LOHR Group. Le Cristal: Mobilitätslösung 100% Elektrisch, Flexibel und Vernetzt. Available online: https://www.lohr.fr/uploads/2023/05/d18647c-2023-03-plaquette-cristal-de.pdf (accessed on 28 August 2023).
- Maier, J.; Reuss, H.-C. A Framework for Optimizing the Wiring Harness of Automated Electric Vehicles. In Proceedings of the 6th Shanghai-Stuttgart-Symposium, Shanghai, China, 1–2 December 2022. [Google Scholar]
- Bornemann, M. Zone Controllers Build Bridge to Tomorrow’s Technology; White Paper. Available online: https://www.aptiv.com/docs/default-source/white-papers/2021_aptiv_whitepaper_zonecontroller.pdf?sfvrsn=c1f9163d_23 (accessed on 28 August 2023).
- Liebetrau, T. E/E Architecture Transformation How it impacts value chain and networking technologies. In Proceedings of the AmE 2022: Automotive Meets Electronics: 13th GMM-Symposium, Dortmund, Germany, 29–30 September 2022; Wahl, M., Stockem, A., Eds.; VDE Verlag Gmbh: Offenbach, Germany, 2022. ISBN 9783800759552. [Google Scholar]
- Surjekar, N.N.; Patwardhan, Y.; Konduju, V. A Case Study on Migrating towards Functionally Safe Zonal Architecture using MBSE. In Proceedings of the 33rd Annual INCOSE International Symposium, Honolulu, HI, USA, 15–20 July 2023; Wiley: Hoboken, NJ, USA, 2023; Volume 33, pp. 1403–1417. [Google Scholar] [CrossRef]
- Maier, J.; Reuss, H.-C. Handling System Complexity in Zonal E/E Architectures. Transp. Eng. 2023, 13, 100195. [Google Scholar] [CrossRef]
- Lloyd, S. Least squares quantization in PCM. IEEE Trans. Inform. Theory 1982, 28, 129–137. [Google Scholar] [CrossRef]
- Arthur, D.; Vassilvitskii, S. k-means++: The advantages of careful seeding. In Proceedings of the 18th Annual ACM-SIAM Symposium on Discrete Algorithms, New Orleans, LA, USA, 7–9 January 2007; pp. 1027–1035. [Google Scholar]
- Deb, K.; Pratap, A.; Agarwal, S.; Meyarivan, T. A fast and elitist multiobjective genetic algorithm: NSGA-II. IEEE Trans. Evol. Computat. 2002, 6, 182–197. [Google Scholar] [CrossRef]
- SAE International. Taxonomy and Definition for Terms Related to Driving Automation Systems for On-Road Motor Vehicles; Revision April 2021 (J3016); SAE International: Warrendale, PA, USA, 2021. [Google Scholar]
- Asp, L.E.; Bouton, K.; Carlstedt, D.; Duan, S.; Harnden, R.; Johannisson, W.; Johansen, M.; Johansson, M.K.G.; Lindbergh, G.; Liu, F.; et al. A Structural Battery and its Multifunctional Performance. Adv. Energy Sustain. Res. 2021, 2, 2000093. [Google Scholar] [CrossRef]
- Dijkstra, E.W. A Note on Two Problems in Connexion with Graphs. In Edsger Wybe Dijkstra: His Life, Work, and Legacy; ACM Books: New York, NY, USA, 2022; pp. 287–290. [Google Scholar] [CrossRef]
- Neckenich, J. 3D-Master-Leitungssatz—Konzept zur Entwicklung von Leitungssätzen als 3D-Masterin Einem Realistischen, Vollständigen DMU-Modell. Ph.D. Thesis, Saarland University, Saarbrücken, Germany, 2017. [Google Scholar]
- Riesener, M.; Dölle, C.; Keuper, A.; Fruntke, M.; Schuh, G. Quantification of complexity in cyber-physical systems based on key figures. Procedia CIRP 2021, 100, 445–450. [Google Scholar] [CrossRef]
- Liu, Y.; Li, Z.; Xiong, H.; Gao, X.; Wu, J. Understanding of Internal Clustering Validation Measures. In Proceedings of the 2010 IEEE International Conference on Data Mining, Sydney, Australia, 13–17 December 2010; IEEE: Piscataway, NJ, USA, 2010. ISBN 9781424491315. [Google Scholar]
- Calinski, T.; Harabasz, J. A dendrite method for cluster analysis. Comm. Stats.-Theory Methods 1974, 3, 1–27. [Google Scholar] [CrossRef]
- Gawron, J.H.; Keoleian, G.A.; de Kleine, R.D.; Wallington, T.J.; Kim, H.C. Life Cycle Assessment of Connected and Automated Vehicles: Sensing and Computing Subsystem and Vehicle Level Effects. Environ. Sci. Technol. 2018, 52, 3249–3256. [Google Scholar] [CrossRef] [PubMed]
- Kutila, M.; Virtanen, A.; Tarkiainen, M.; Peussa, P. Sensor System Power Adaptation for Automated Vehicles. In Proceedings of the 2019 IEEE 15th International Conference on Intelligent Computer Communication and Processing (ICCP), Cluj-Napoca, Romania, 5–7 September 2019; Nedevschi, S., Potolea, R., Slavescu, R.R., Eds.; IEEE: Piscataway, NJ, USA, 2019. ISBN 9781728149141. [Google Scholar]
- Kohler, T.P. Prädiktives Leistungsmanagement in Fahrzeugbordnetzen; Springer Fachmedien Wiesbaden: Wiesbaden, Germany, 2014; ISBN 9783658050115. [Google Scholar]
- Kavalchuk, I.; Arisoy, H.; Stojcevski, A.; Maun Than Oo, A. Advanced Simulation of Power Consumption of Electric Vehicles. Int. J. Electr. Comput. Electron. Commun. Eng. 2015, 9, 53–59. [Google Scholar]
- Wallentowitz, H.; Reif, K. Handbuch Kraftfahrzeugelektronik: Grundlagen, Komponenten, Systeme, Anwendungen; Wallentowitz, H., Ed.; Vieweg: Wiesbaden, Germany, 2006; ISBN 352803971X. [Google Scholar]
- Bosch Automotive Electrics and Automotive Electronics; Springer Fachmedien Wiesbaden: Wiesbaden, Germany, 2014; ISBN 9783-658017835.
- Bosch Engineering. Body Computer Module (BCM); Data Sheet. Available online: https://www.bosch-engineering.cn/media/de/pdfs/einsatzgebiete_1/produktdatenblaetter/110621_BEG-BCM_EN.pdf (accessed on 5 September 2023).
- Sierra Wireless, S.A. AirLink® XR90—Router Specifications; Data Sheet. Available online: https://www.sierrawireless.com/router-solutions/xr90#specs (accessed on 5 September 2023).
- TerrisGPS. Harxon HX-AULT006 High-Precision GNSS Vehicle Antenna; Data Sheet. Available online: https://www.terrisgps.com/product/harxon-hx-ault006/ (accessed on 5 September 2023).
- Heinemann, D. Strukturen von Batterie- und Energiemanagementsystemen mit Bleibatterien und Ultracaps. Ph.D. Thesis, Technical University of Berlin, Berlin, Germany, 2007. [Google Scholar]
- Schumi, S.; Graf, A. Energy and Supply Concepts for Automated Drving. In Proceedings of the AmE 2018—Automotive Meets Electronics, 9th GMM-Symposium, Dortmund, Germany, 7–8 March 2018; VDE: Berlin, Germany, 2018; pp. 95–99, ISBN 3800745240. [Google Scholar]
- Harkort, C.; Kesselgruber, D.; Kraus, M.; Moseberg, J.; Wuebbolt-Gorbatenko, B. Mobil in der stadt von morgen: Die Verschmelzung von Antrieb und Chassis. In Mobility for Tomorrow; Schaeffler Technologies AG & Co., KG: Herzogenaurach, Germany, 2018; p. 397. [Google Scholar]
- Grubmüller, S.; Stettinger, G.; Nešić, D.; Watzenig, D. Concepts for improved availability and computational power in automated driving. Elektrotech. Inftech. 2018, 135, 316–321. [Google Scholar] [CrossRef]

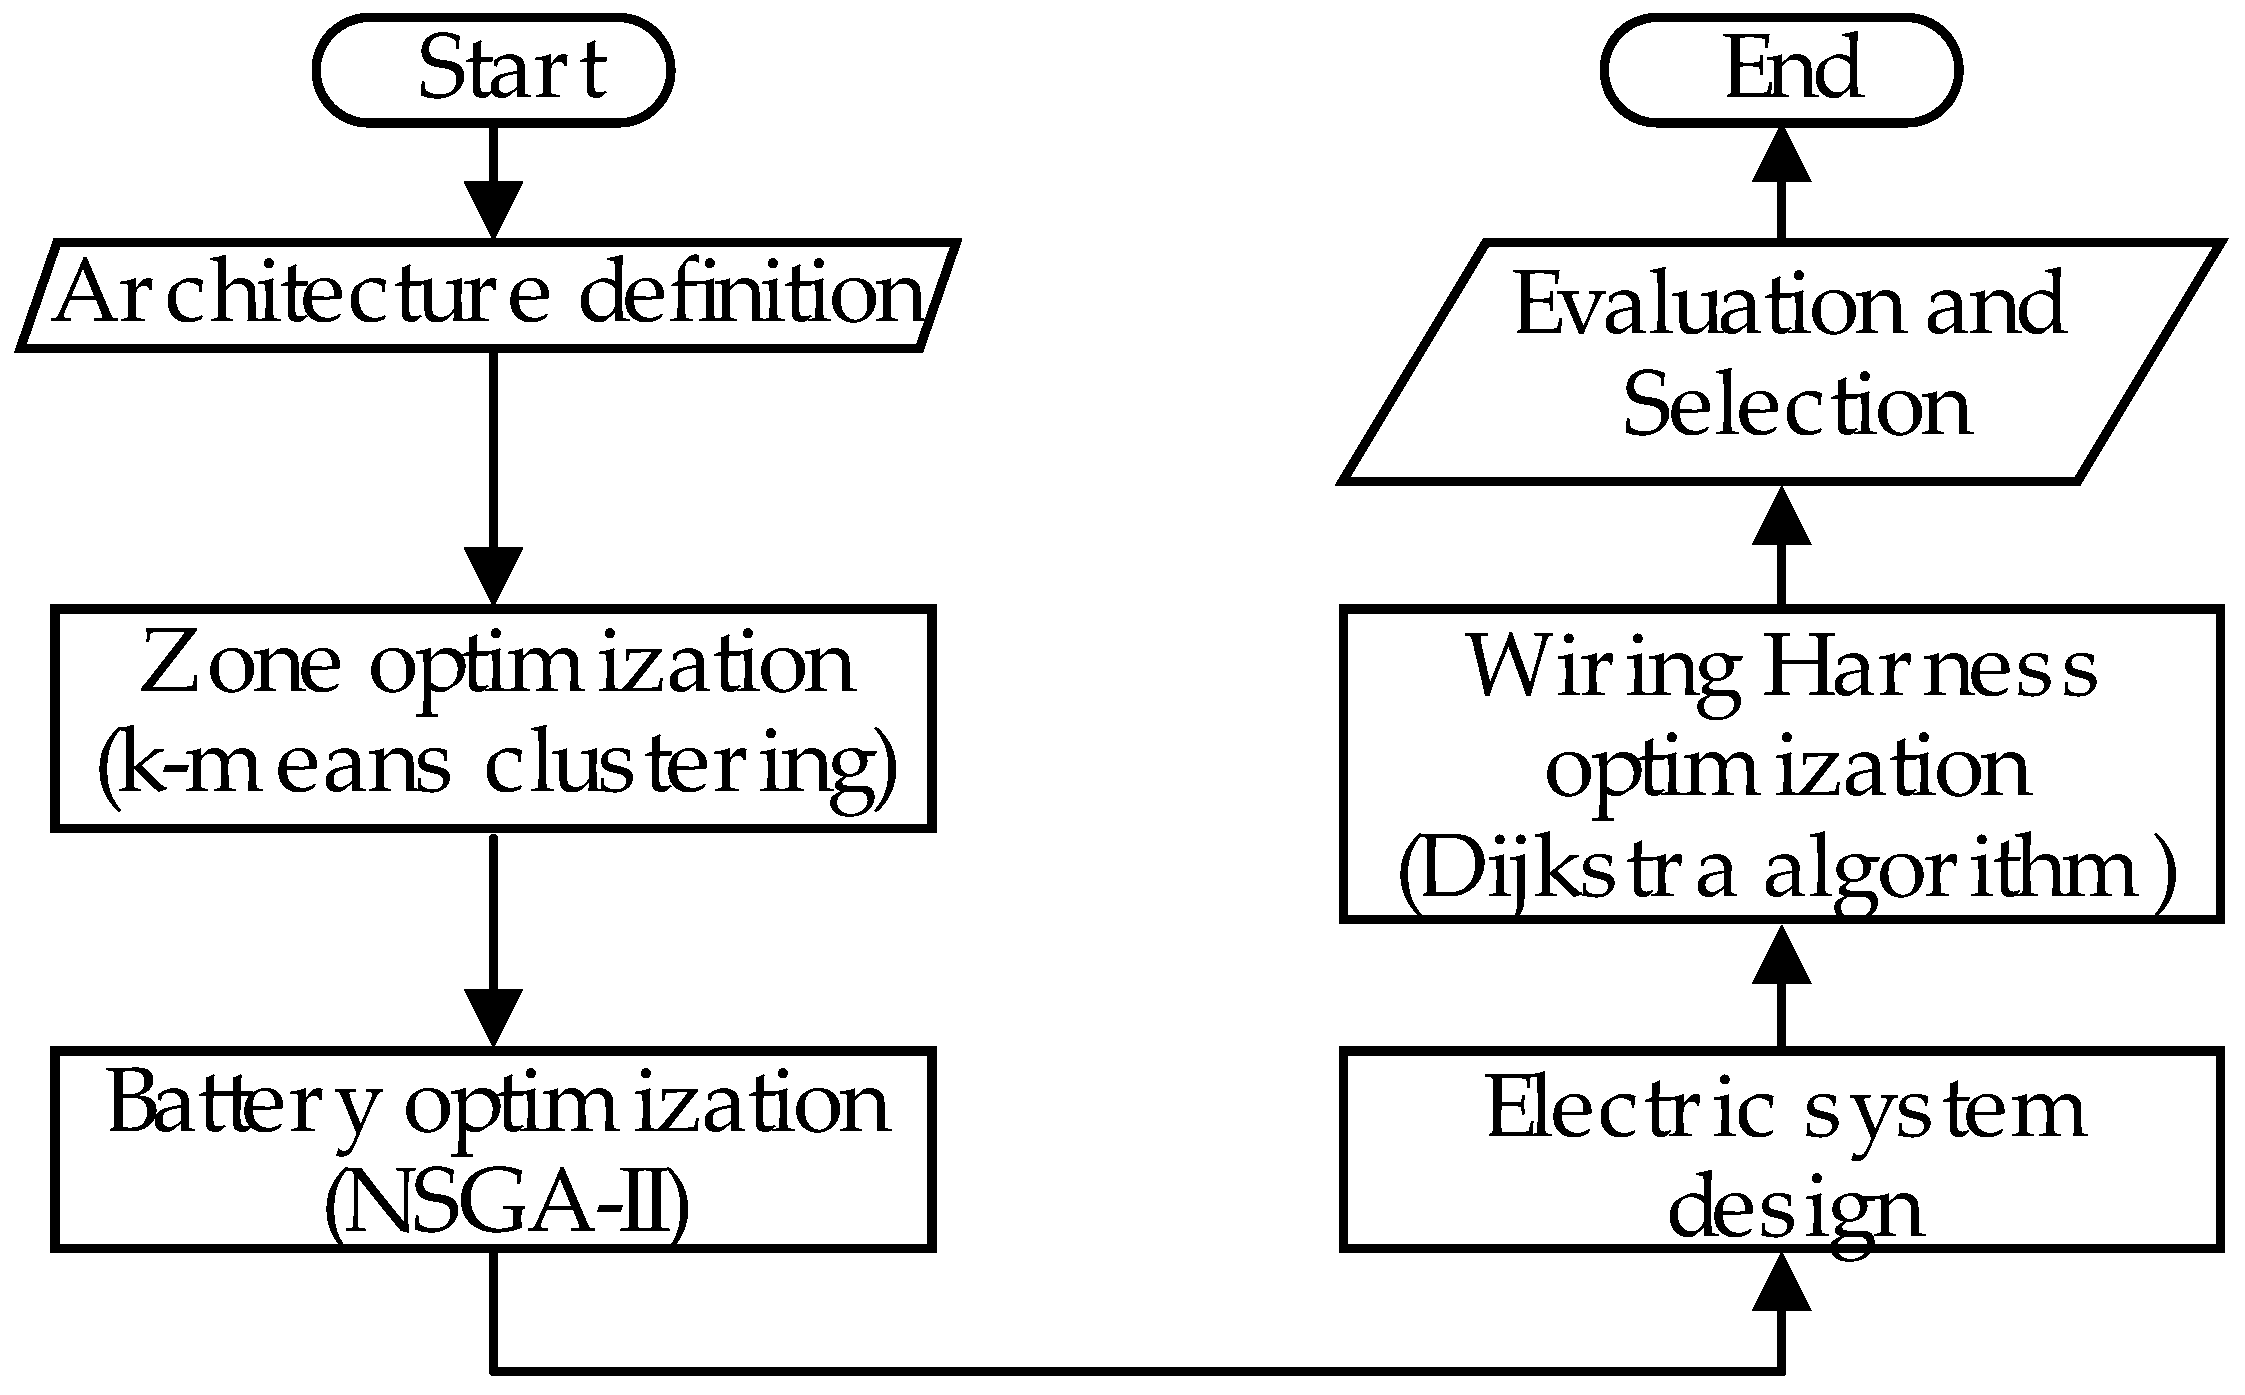
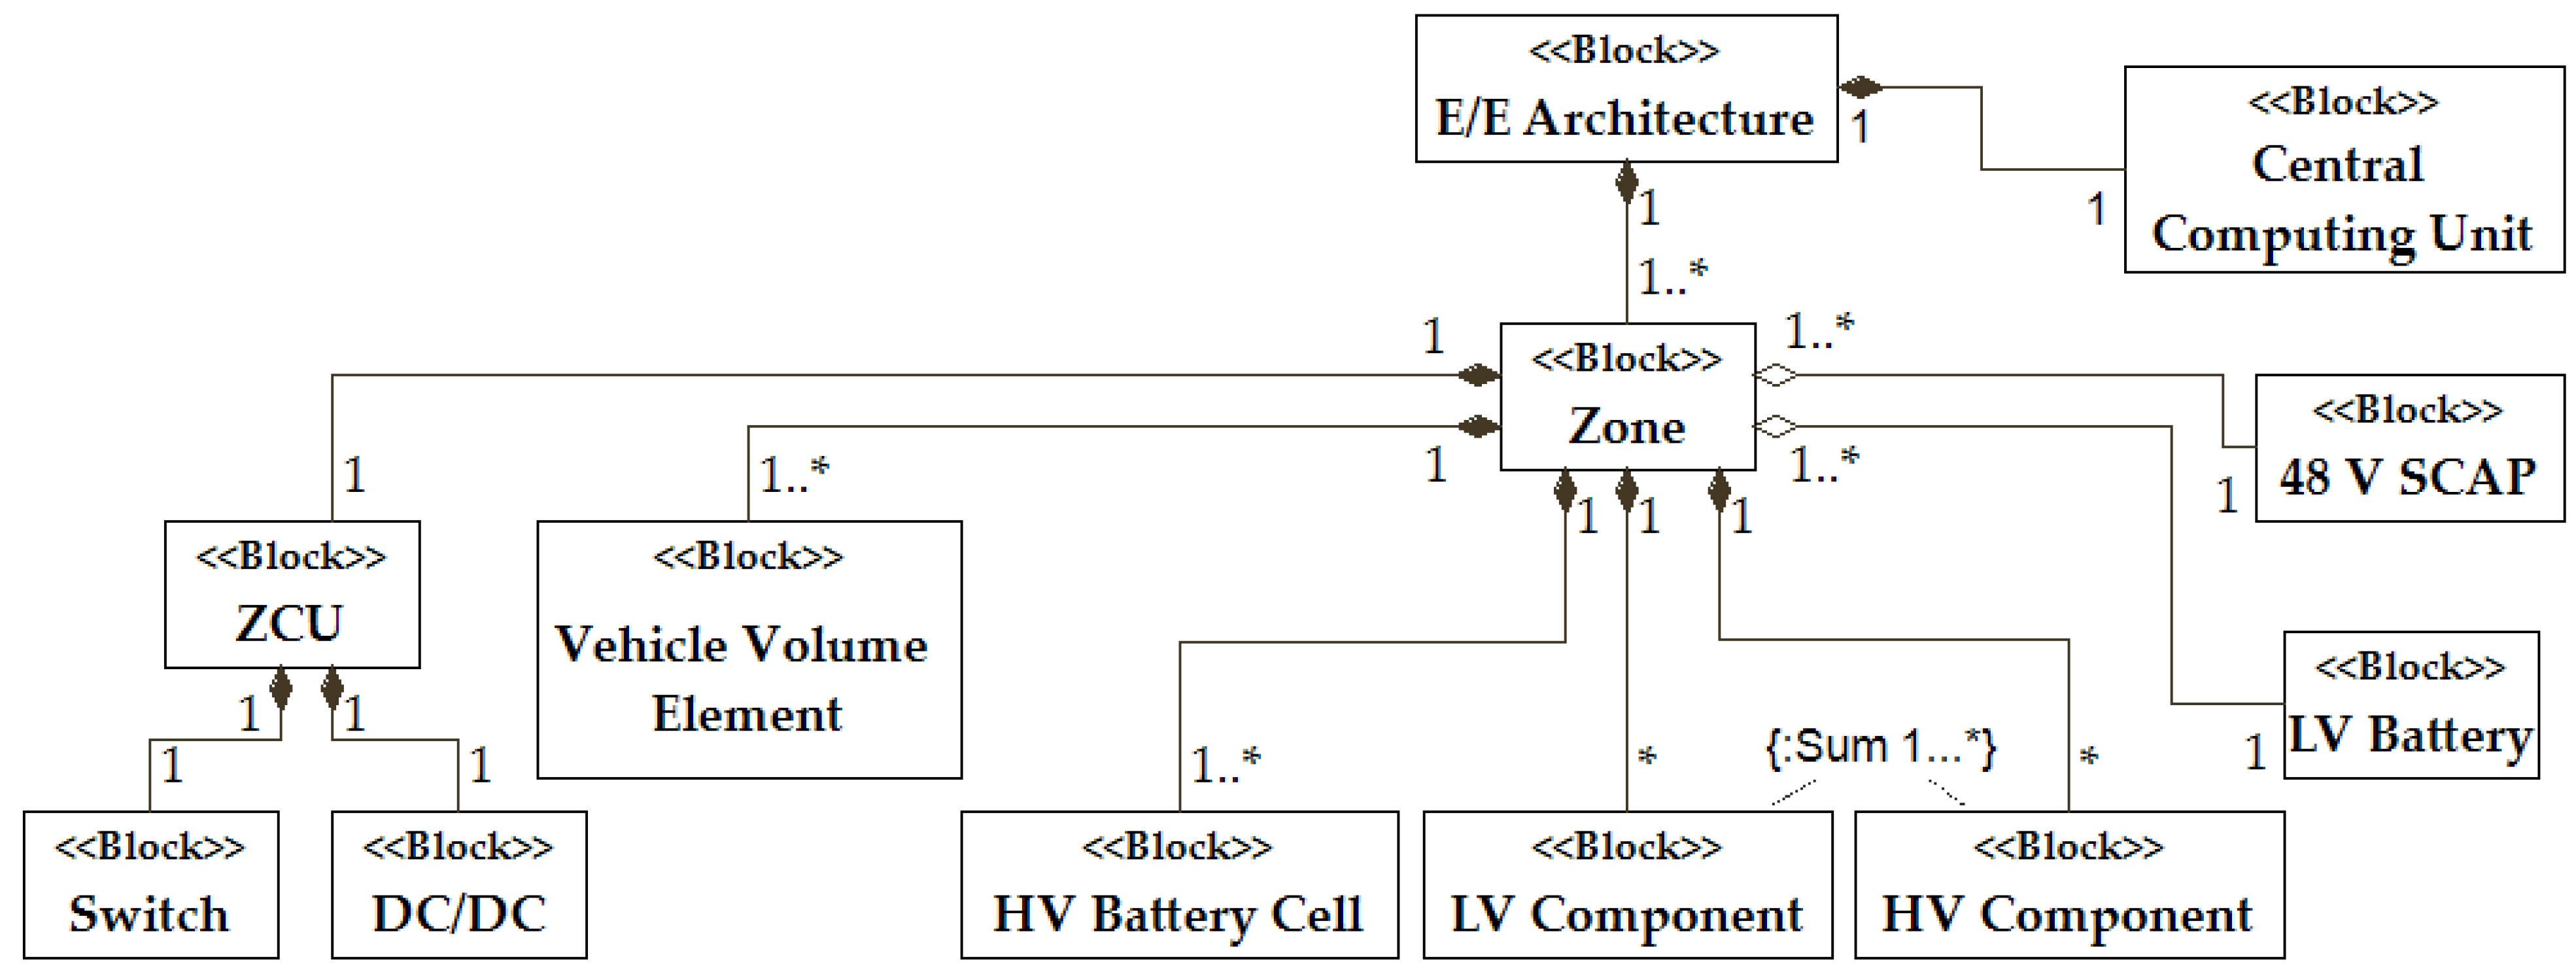
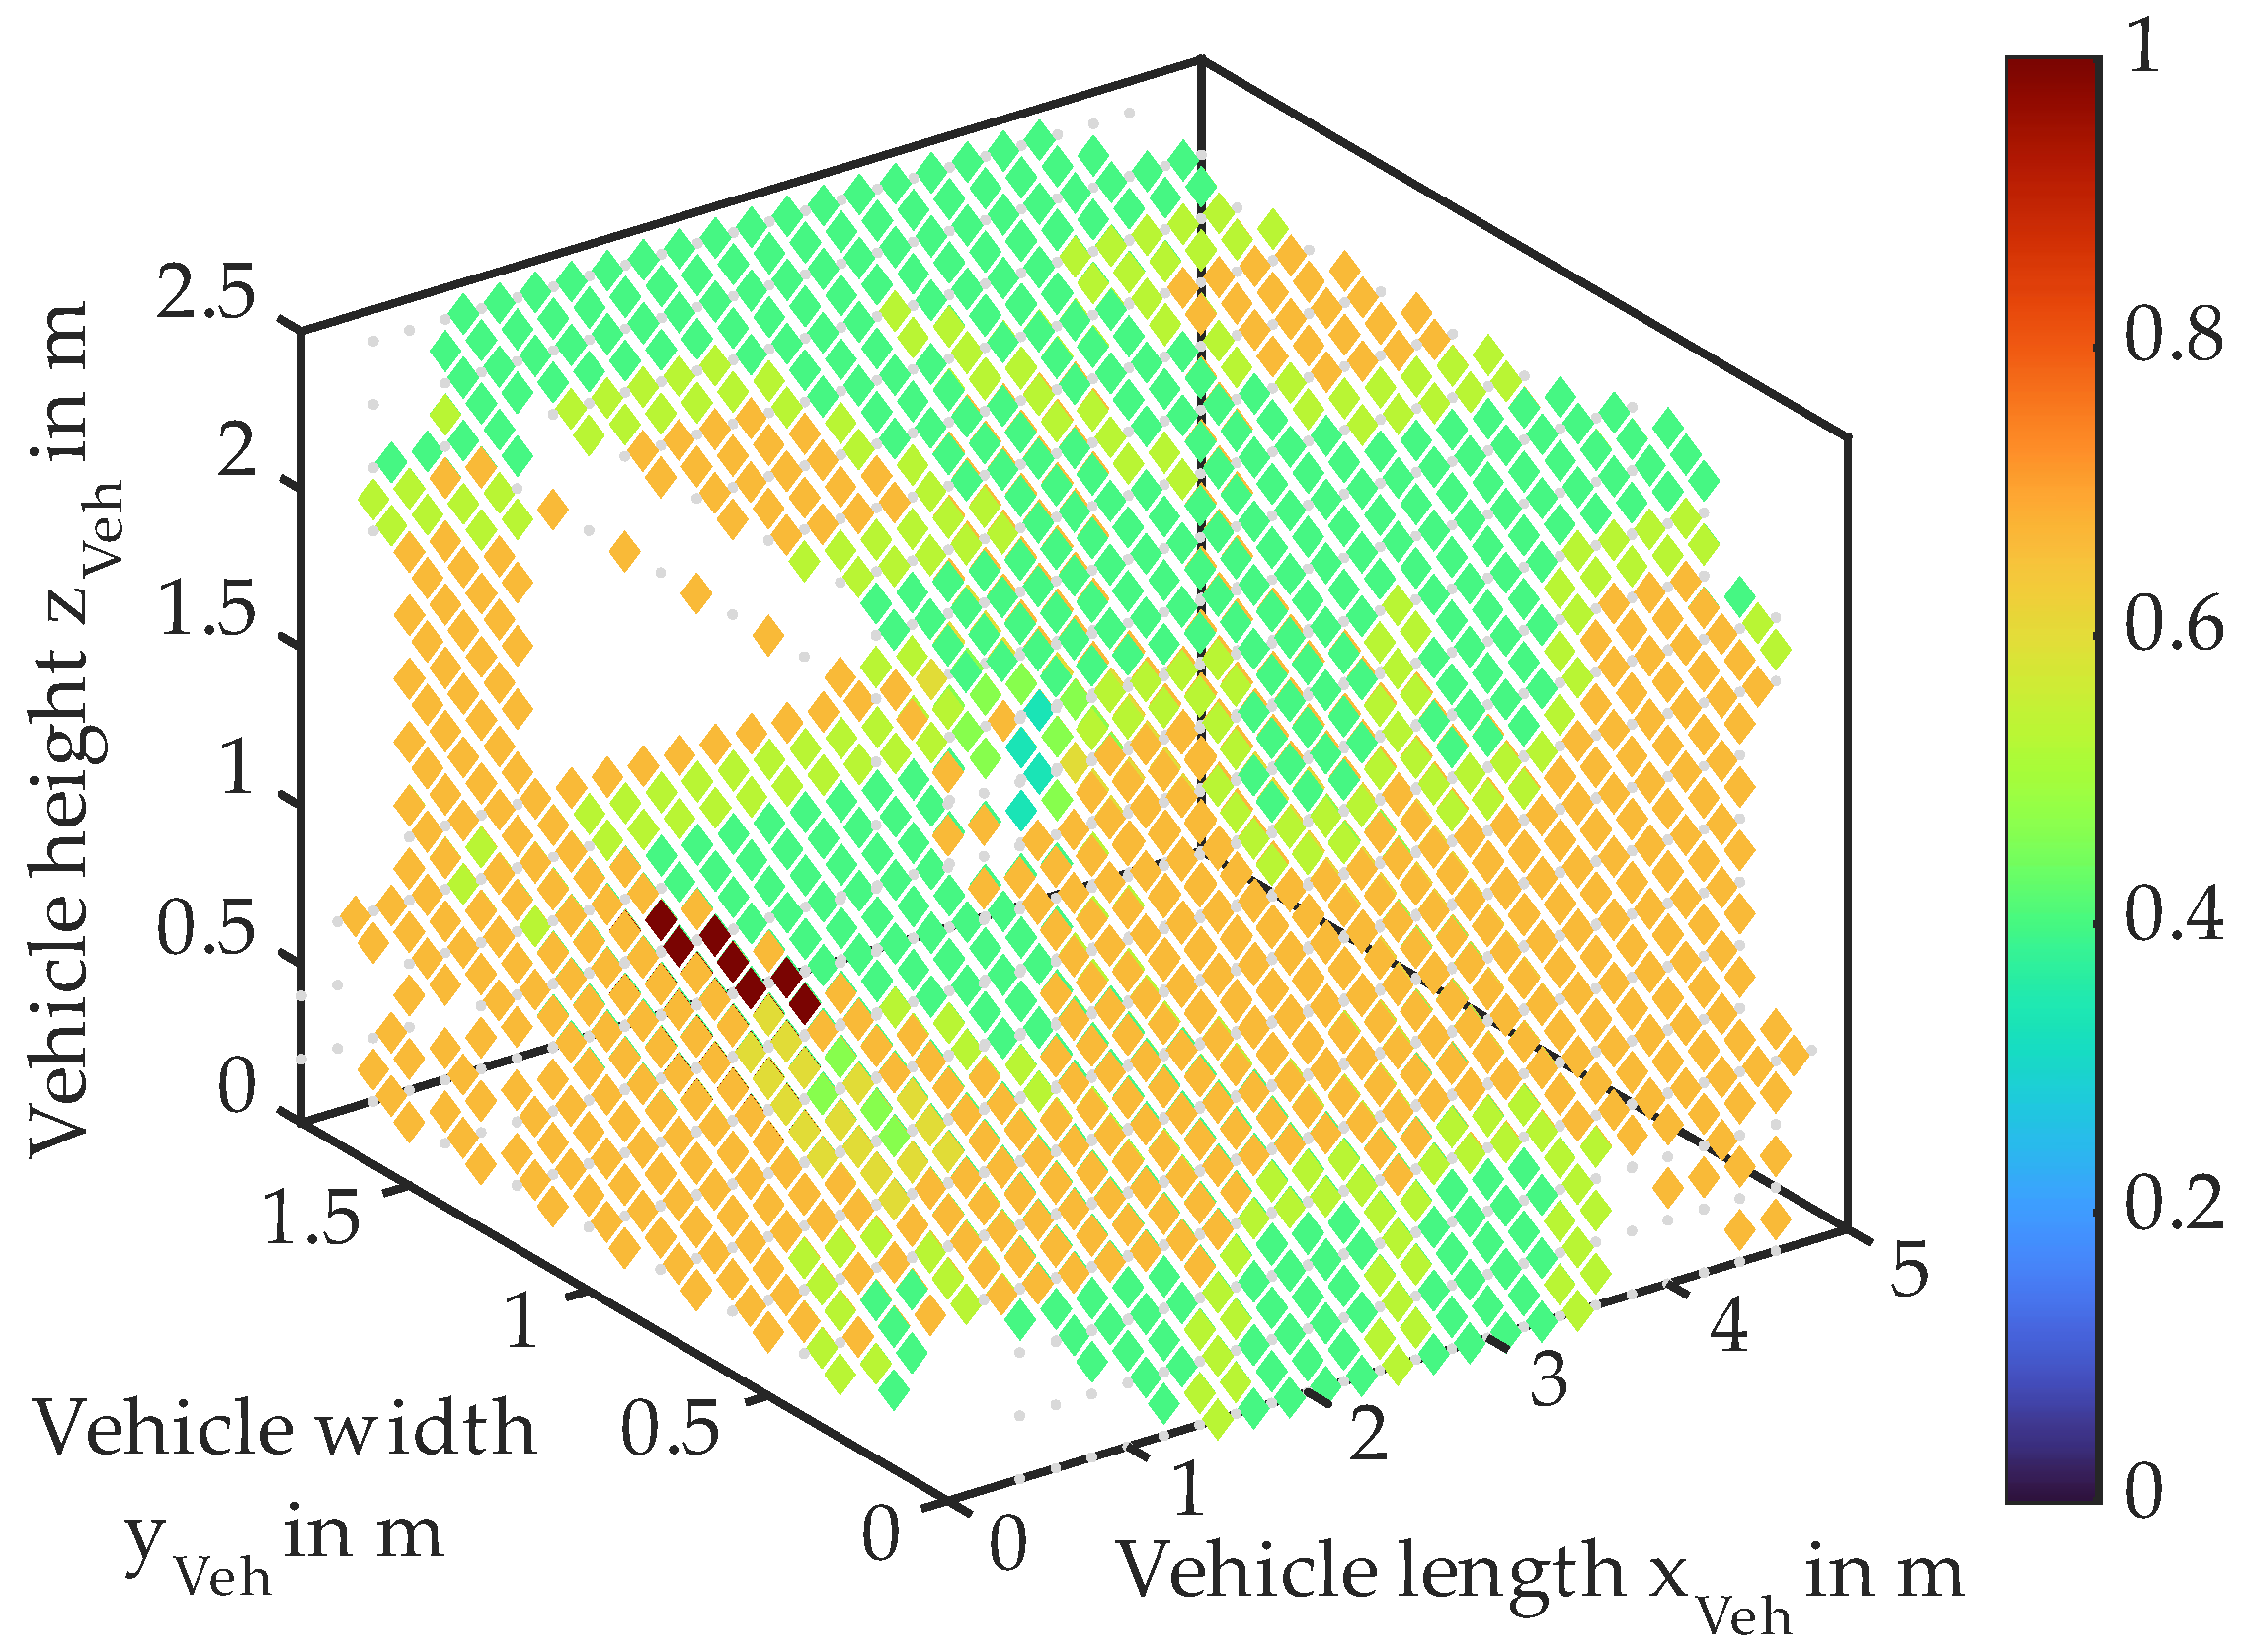
Disclaimer/Publisher’s Note: The statements, opinions and data contained in all publications are solely those of the individual author(s) and contributor(s) and not of MDPI and/or the editor(s). MDPI and/or the editor(s) disclaim responsibility for any injury to people or property resulting from any ideas, methods, instructions or products referred to in the content. |
© 2023 by the authors. Licensee MDPI, Basel, Switzerland. This article is an open access article distributed under the terms and conditions of the Creative Commons Attribution (CC BY) license (https://creativecommons.org/licenses/by/4.0/).