
Structural Vulnerability Analysis of Interdependent Electric Power and Natural Gas Systems
Abstract
:1. Introduction
- (1)
- Different from the existing works with a focus on the static vulnerability analysis of IPGSs, we consider both static and dynamic vulnerability analysis of a realistic IPGS to understand their relationship in this paper.
- (2)
- Different from the existing works with a focus on the IPGS, we not only analyze the vulnerability of the IPGS as a whole but also analyze the vulnerability of the PS and GS, in order to understand how the vulnerability of the IPGS is affected by its PS and GS via static and dynamic vulnerability analysis.
2. Topological Approach for Structural Vulnerability Analysis
3. Structural Vulnerability Analysis of the IPGS
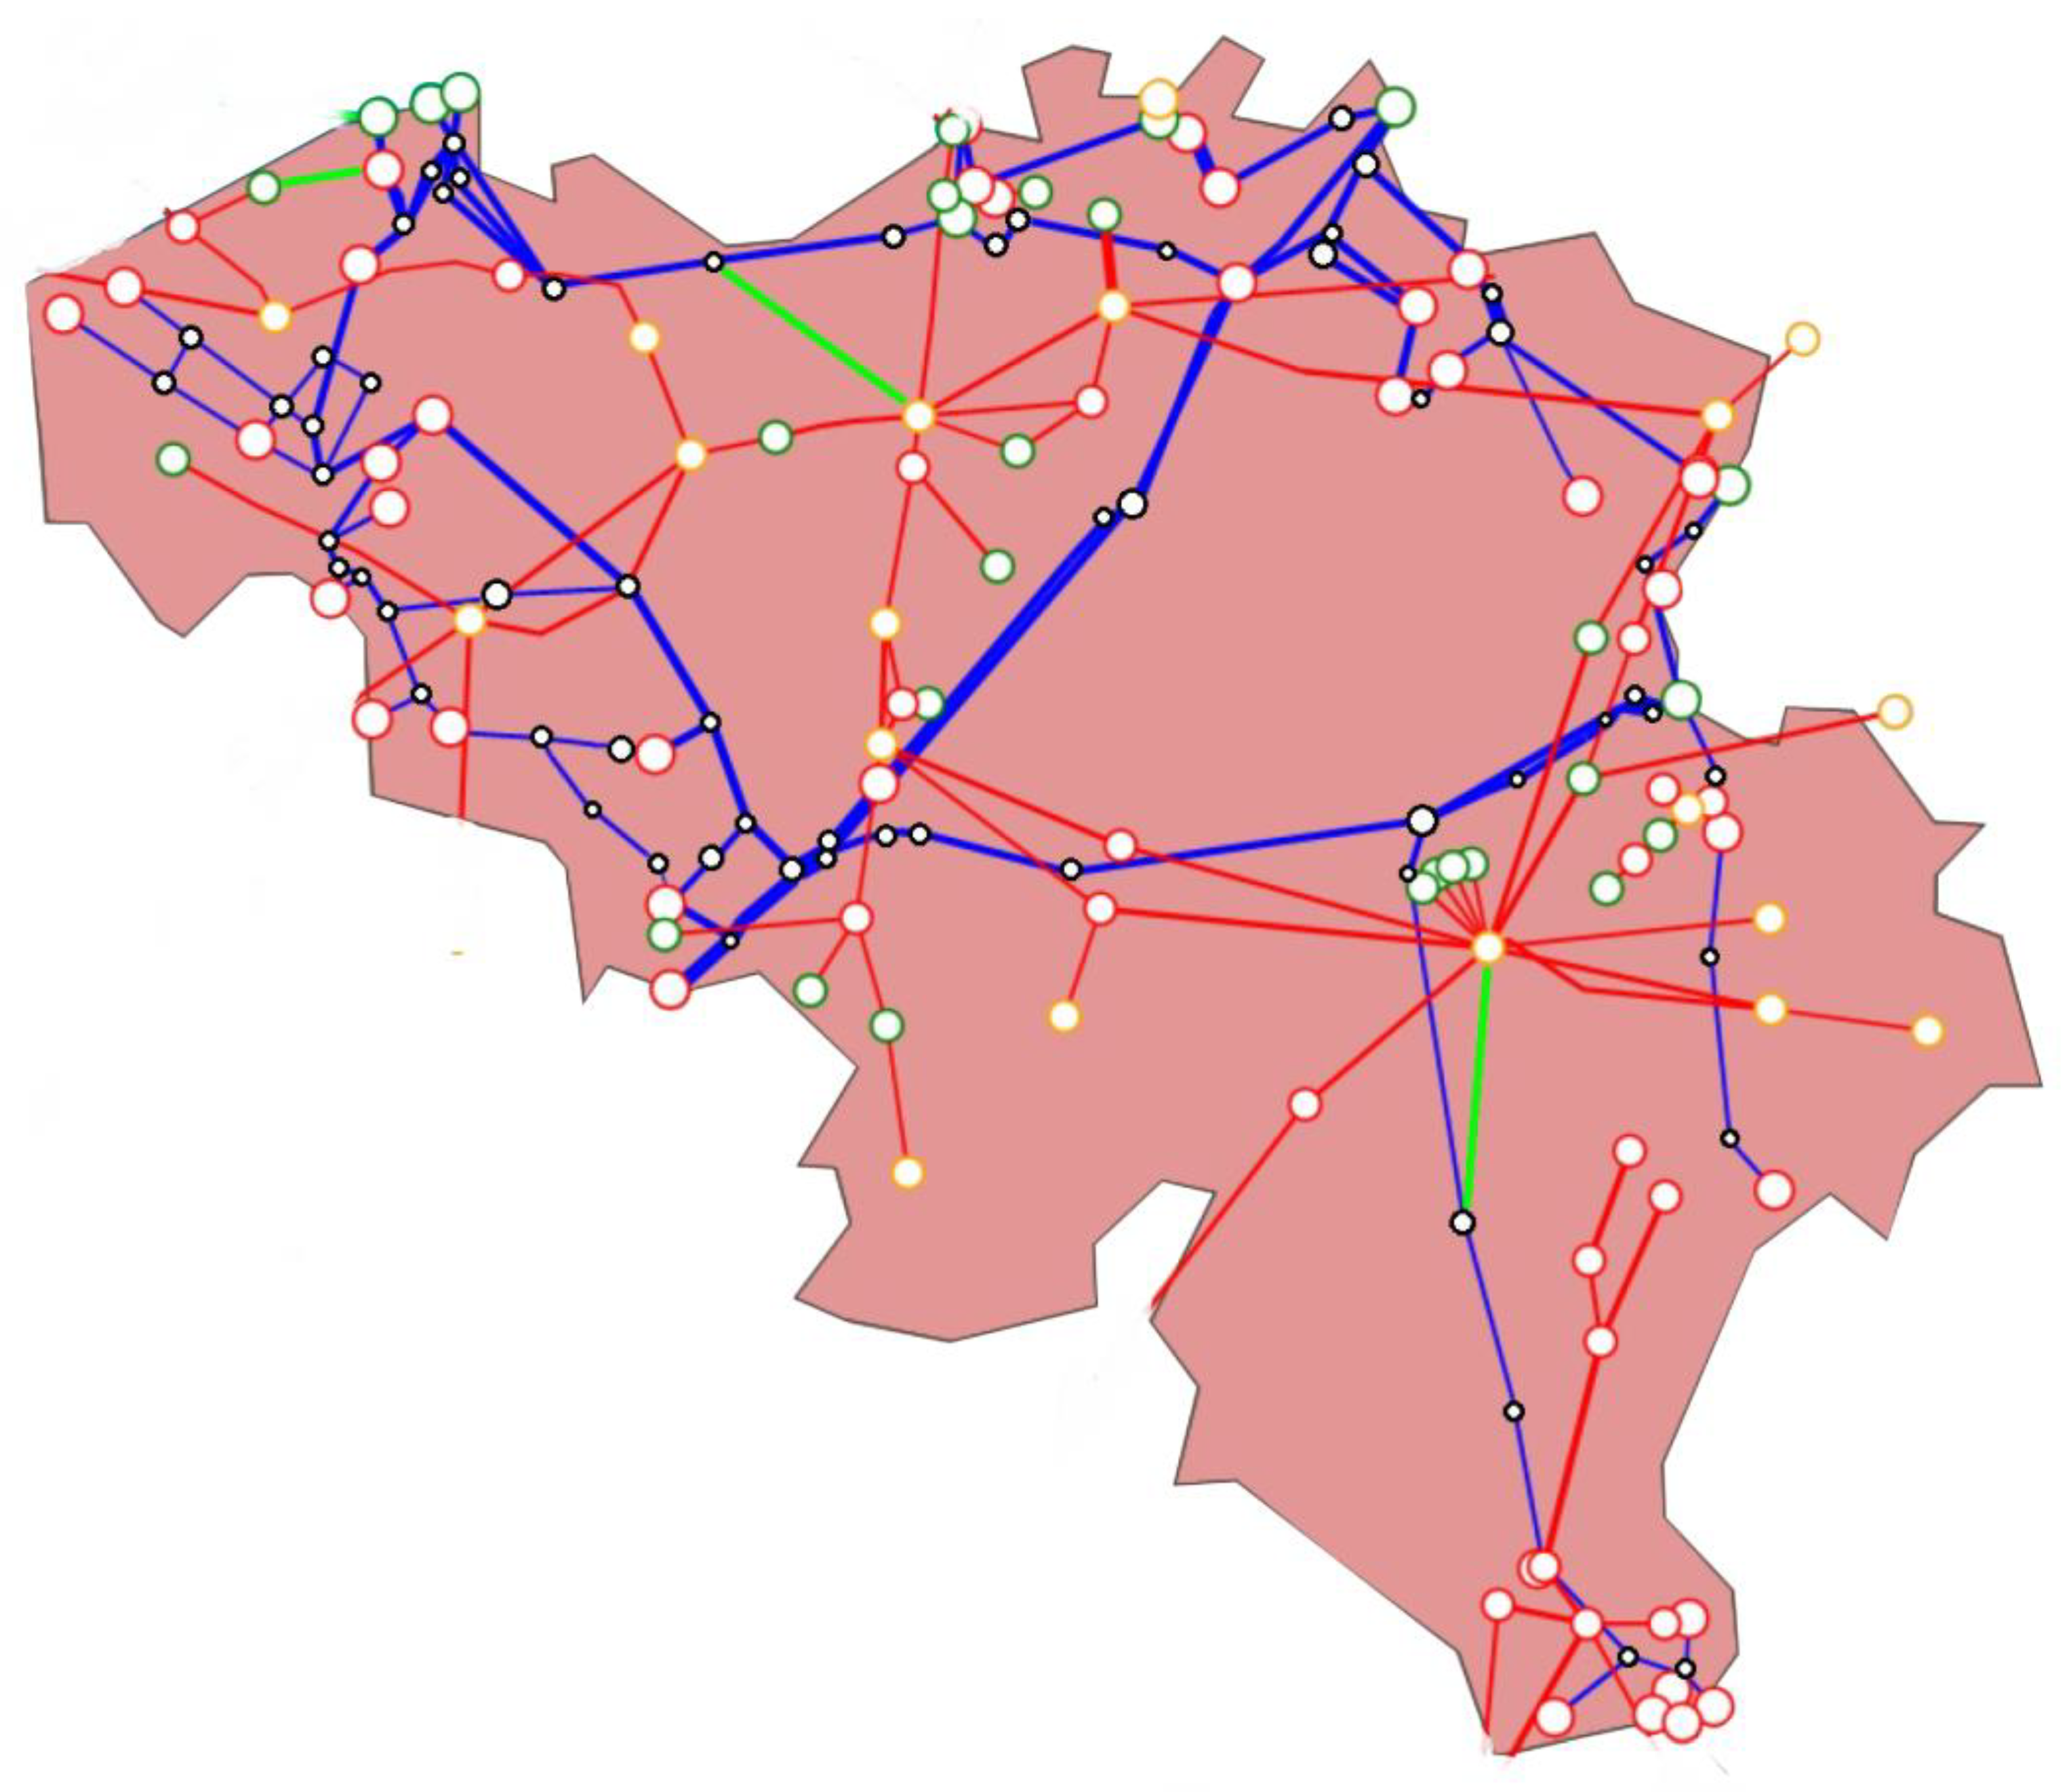
3.1. Description of the Investigated IPGS
3.2. Structural Vulnerability Analysis of the IPGS
3.2.1. Static Vulnerability Analysis
3.2.2. Dynamic Vulnerability Analysis
4. Conclusions
- (1)
- If the PS and GS are more susceptible to cascading failures than selective and random failures, the IPGS as a whole is also more vulnerable to cascading failures. When the IPGS has 12% of nodes under cascading failures, it completely loses its network performance. However, when the IPGS has 20% of nodes under selective failures (or random failures), it retains 10% (or 20%) of the original network performance.
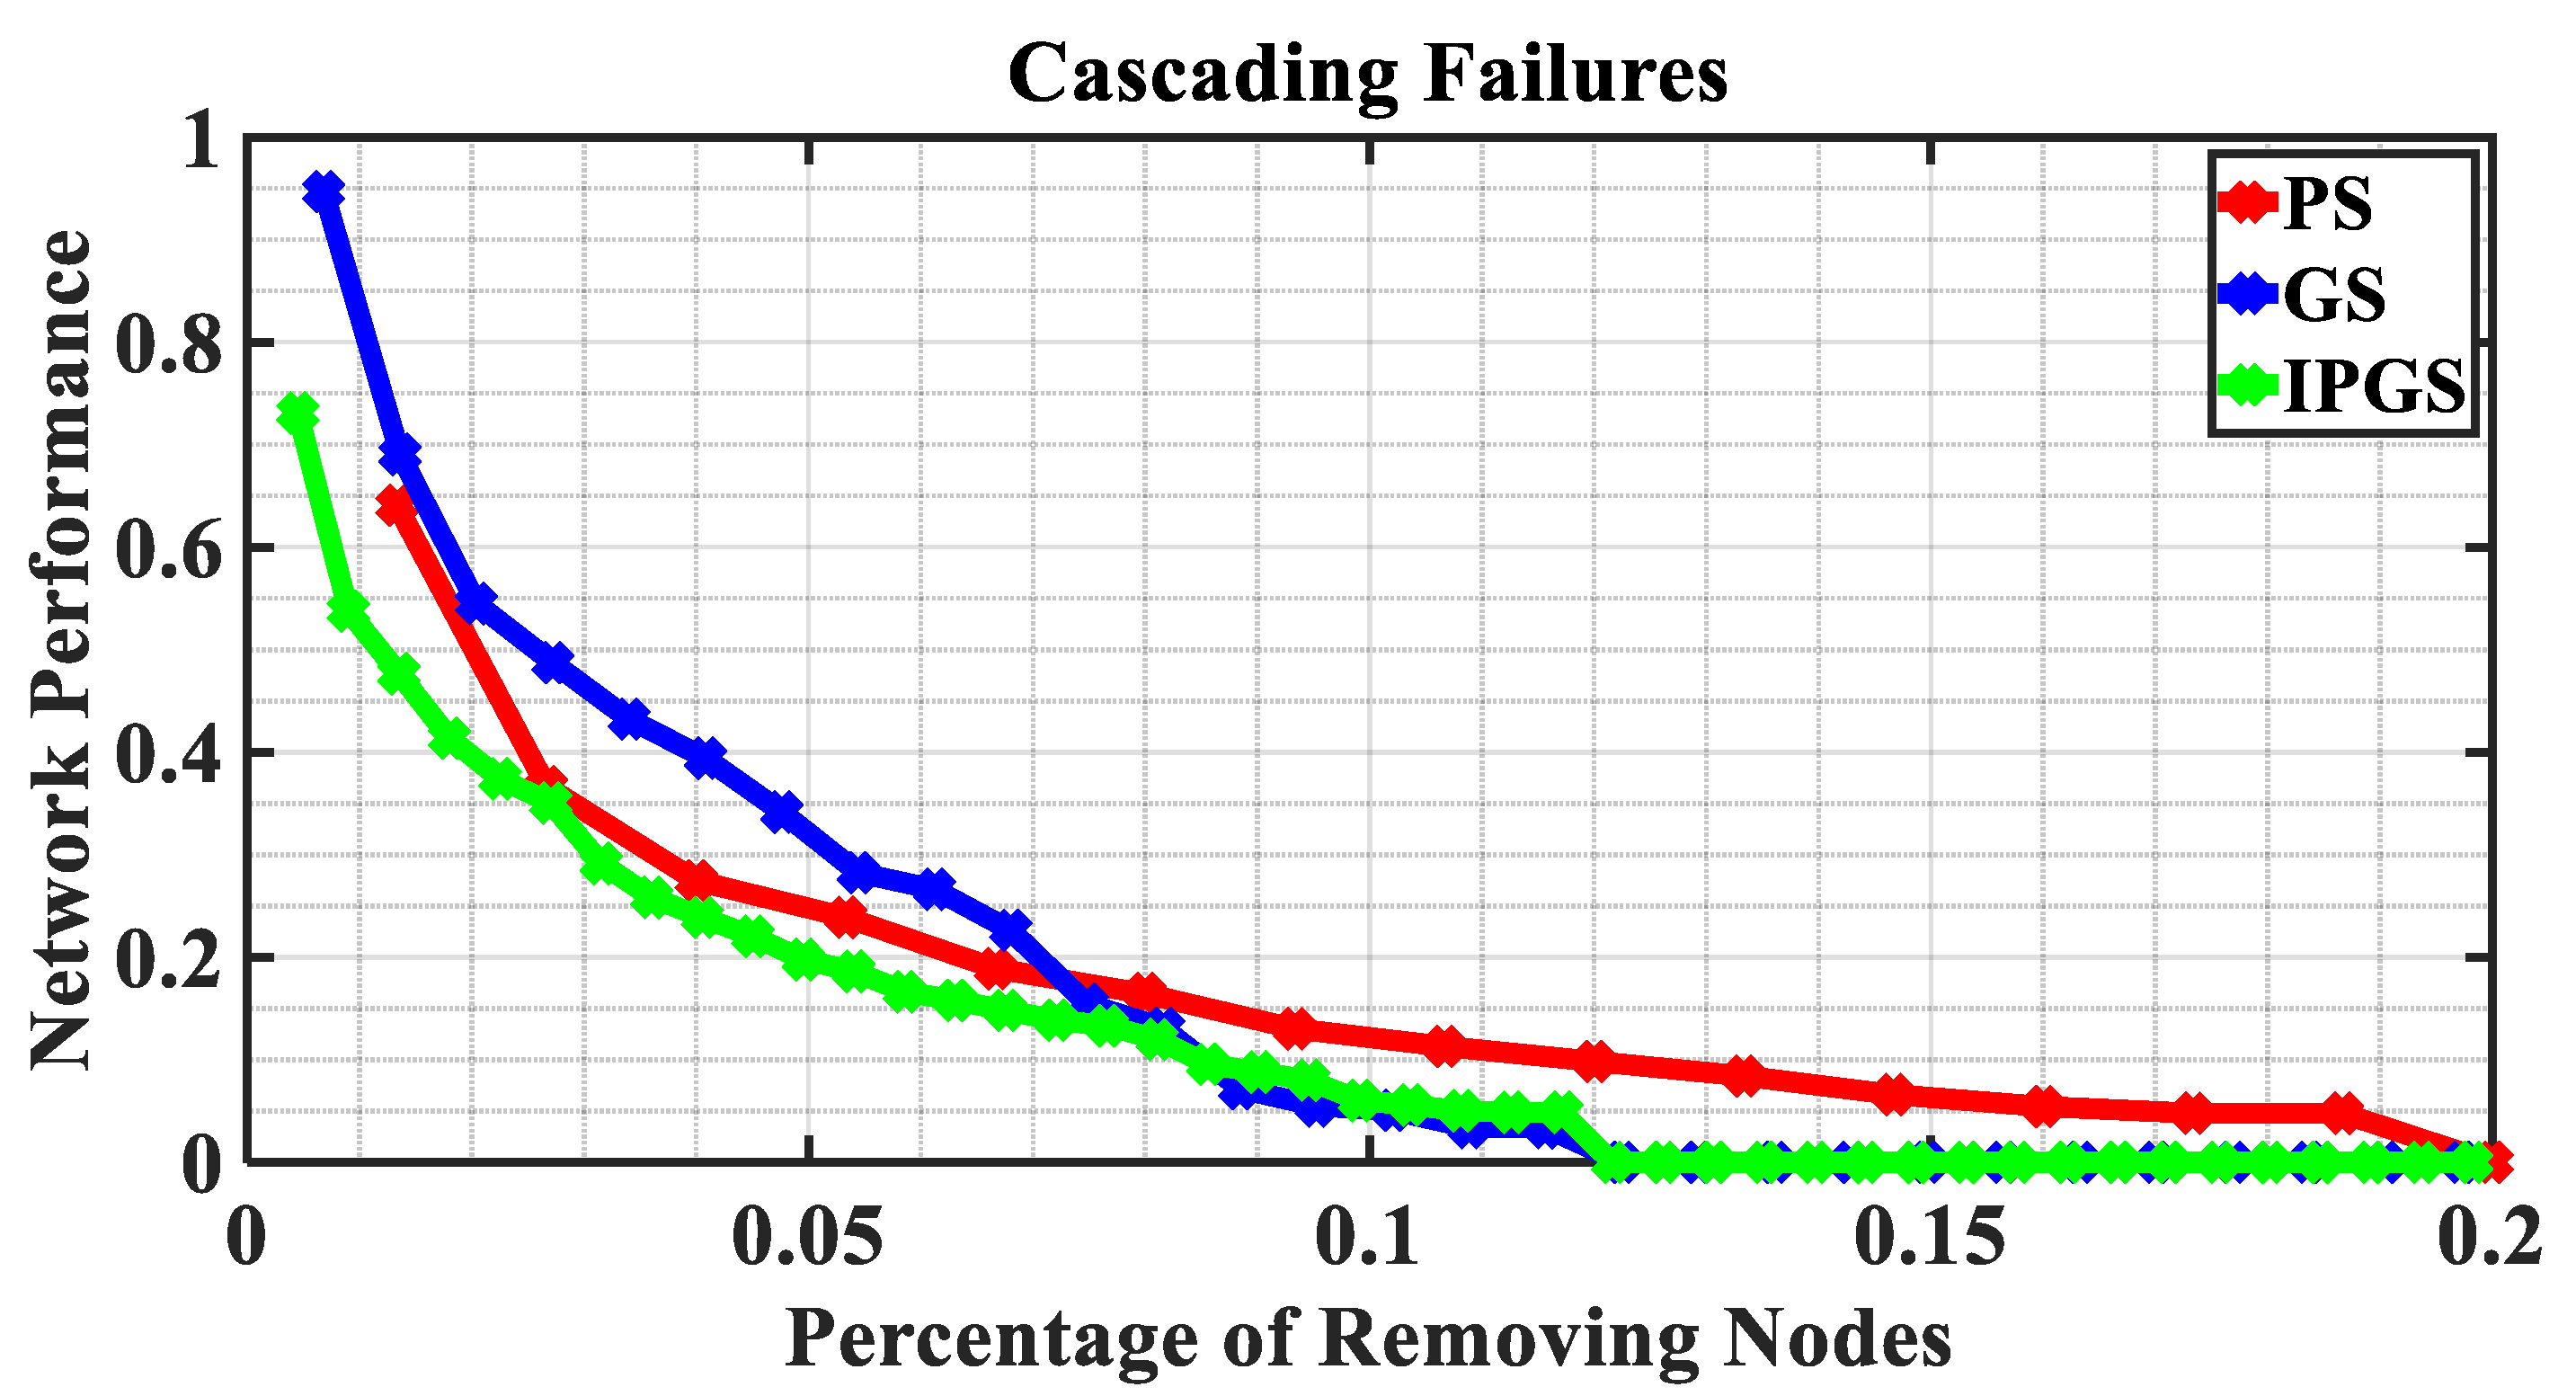
- (2)
- There are different dominant factors affecting the IPGS vulnerability under cascading failures and selective failures. The static vulnerability analysis shows the vulnerability of the IPGS under selective failures is mainly affected by the PS since the PS is more vulnerable than the GS under selective failures. When 20% of critical nodes are removed from the GS, it retains about 15% of the original network performance. However, when 20% of critical nodes are removed from the PS, the PS only has about 5% of the original network performance. Similarly, when 20% of critical nodes are re-moved from the IPGS, IPGS has about 5% of the original network performance. The dynamic vulnerability shows the vulnerability of the IPGS under cascading failures is mainly affected by the GS since the GS is more vulnerable than the PS under cascading failures. When the PG has 12% of nodes under cascading failures, it still retains 10% of the original network performance. When the GS has 12% of nodes under cascading failures, it loses its network performance completely. Similarly, when the IPGS has 12% of nodes under cascading failures, it also loses its network performance completely.
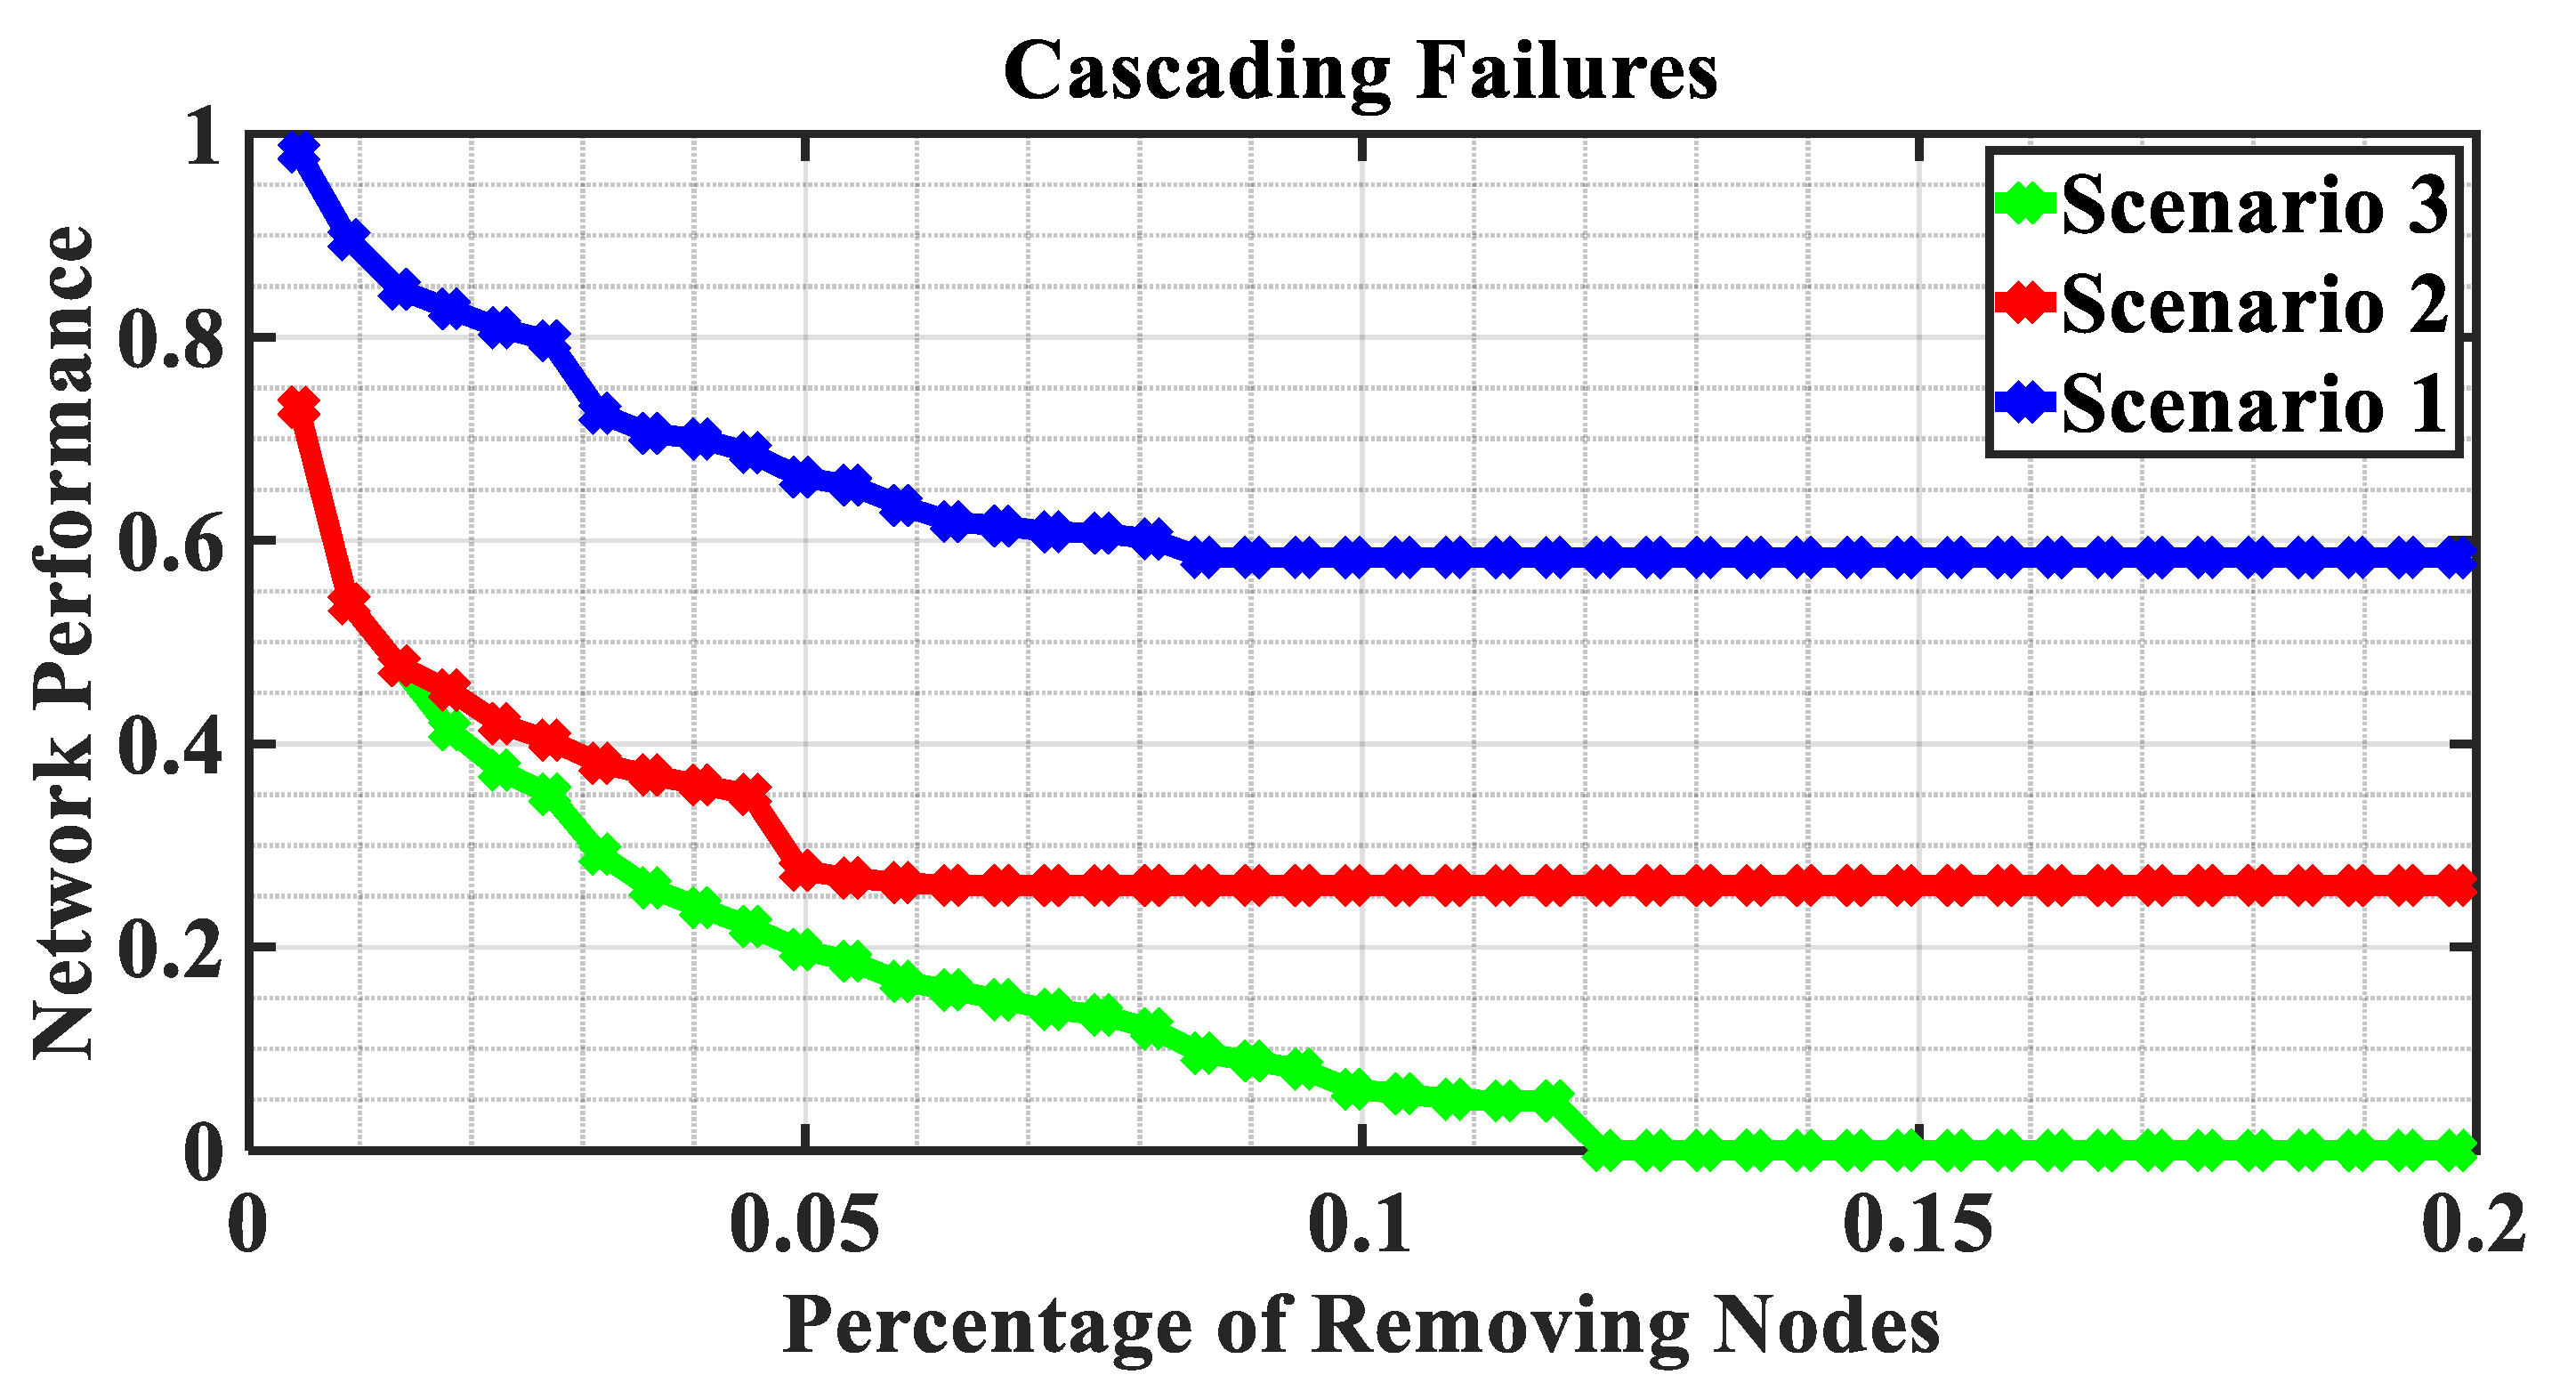
- (3)
- The IPGS is more vulnerable to the failures on the critical nodes which are identified from the IPGS as a whole rather than from the individual PS or GS. If the cascading failures occur on the 20% of critical nodes identified from the IPGS as a whole, the IPGS loses its network performance completely; however, if the cascading failures occur on the 20% of critical nodes identified from the individual PS or GS, the IPGS still retains more than 30% of the original network performance. Similarly, if the selective failures occur on the 20% of critical nodes identified from the IPGS as a whole, the IPGS retains 10% of its original network performance completely; however, if the selective failures occur on the 20% of critical nodes identified from the PS or GS, the IPGS still retains more than 20% of the original network performance.
Author Contributions
Funding
Data Availability Statement
Acknowledgments
Conflicts of Interest
References
- Quelhas, A.; Gil, E.; McCalley, J.D.; Ryan, S.M. A Multiperiod Generalized Network Flow Model of the US Integrated Energy System: Part I—Model Description. IEEE Trans. Power Syst. 2007, 22, 829–836. [Google Scholar] [CrossRef]
- Natural Gas Monthly. Available online: https://www.eia.gov/naturalgas/monthly/pdf/ngm_all.pdf (accessed on 18 August 2019).
- Hagan, D.; Forbush, J.; Bryant, A. The Texas Blackout: A Regulatory Retrospective and Future Outlook. Available online: https://www.whitecase.com/publications/alert/texas-blackout-regulatory-retrospective-and-future-outlook (accessed on 16 March 2021).
- Zeng, Z.; Ding, T.; Xu, Y.; Yang, Y.; Dong, Z.Y. Reliability Evaluation for Integrated Power-Gas Systems with Power-to-Gas and Gas Storages. IEEE Trans. Power Syst. 2020, 35, 571–583. [Google Scholar] [CrossRef]
- Sheng, W.; Yi, D.; Chengjin, Y.; Can, W.; Yuchang, M. Reliability Evaluation of Integrated Electricity–Gas System Utilizing Network Equivalent and Integrated Optimal Power Flow Techniques. J. Modern Power Syst. Clean Energy 2019, 7, 1523–1535. [Google Scholar] [CrossRef]
- Bao, M.; Ding, Y.; Singh, C.; Shao, C. A Multi-State Model for Reliability Assessment of Integrated Gas and Power Systems Utilizing Universal Generating Function Techniques. IEEE Trans. Smart Grid 2019, 10, 6271–6283. [Google Scholar] [CrossRef]
- Lei, Y.; Hou, K.; Wang, Y.; Jia, H.; Zhang, P.; Mu, Y.; Jin, X.; Sui, B. A New Reliability Assessment Approach for Integrated Energy Systems: Using Hierarchical Decoupling Optimization Framework and Impact-Increment Based State Enumeration Method. Appl. Energy 2018, 210, 1237–1250. [Google Scholar] [CrossRef]
- Zhang, H.; Zhao, T.; Wang, P.; Yao, S. Power System Resilience Assessment Considering of Integrated Natural Gas System. In Proceedings of the IET International Conference on Resilience of Transmission and Distribution Networks (RTDN 2017), Birmingham, UK, 26–28 September 2017. [Google Scholar] [CrossRef]
- Zhang, X.; Che, L.; Shahidehpour, M.; Alabdulwahab, A.S.; Abusorrah, A. Reliability-Based Optimal Planning of Electricity and Natural Gas Interconnections for Multiple Energy Hubs. IEEE Trans. Smart Grid 2017, 8, 1658–1667. [Google Scholar] [CrossRef]
- Zhao, B.; Conejo, A.J.; Sioshansi, R. Coordinated Expansion Planning of Natural Gas and Electric Power Systems. IEEE Trans. Power Syst. 2018, 33, 3064–3075. [Google Scholar] [CrossRef]
- Zhang, X.; Shahidehpour, M.; Alabdulwahab, A.S.; Abusorrah, A. Security-Constrained Co-Optimization Planning of Electricity and Natural Gas Transportation Infrastructures. IEEE Trans. Power Syst. 2015, 30, 2984–2993. [Google Scholar] [CrossRef]
- He, Y.; Shahidehpour, M.; Li, Z.; Guo, C.; Zhu, B. Robust Constrained Operation of Integrated Electricity-Natural Gas System Considering Distributed Natural Gas Storage. IEEE Trans. Sustain. Energy 2018, 9, 1061–1071. [Google Scholar] [CrossRef]
- He, C.; Wu, L.; Liu, T.; Bie, Z. Robust Co-Optimization Planning of Interdependent Electricity and Natural Gas Systems with a Joint N-1 and Probabilistic Reliability Criterion. IEEE Trans. Power Syst. 2018, 33, 2140–2154. [Google Scholar] [CrossRef]
- Shao, C.; Shahidehpour, M.; Wang, X.; Wang, X.; Wang, B. Integrated Planning of Electricity and Natural Gas Transportation Systems for Enhancing the Power Grid Resilience. IEEE Trans. Power Syst. 2017, 32, 4418–4429. [Google Scholar] [CrossRef]
- Wang, C.; Wei, W.; Wang, J.; Liu, F.; Qiu, F.; Correa-Posada, C.M.; Mei, S. Robust Defense Strategy for Gas–Electric Systems Against Malicious Attacks. IEEE Trans. Power Syst. 2017, 32, 2953–2965. [Google Scholar] [CrossRef]
- Portante, E.C.; Kavicky, J.A.; Craig, B.A.; Talaber, L.E.; Folga, S.M. Modeling Electric Power and Natural Gas System Interdependencies. J. Infrastruct. Syst. 2017, 23, 395. [Google Scholar] [CrossRef]
- Wang, B.; Wan, S.; Zhang, X.; Choo, K.-K.R. A Novel Index for Assessing the Robustness of Integrated Electrical Network and a Natural Gas Network. IEEE Access 2018, 6, 40400–40410. [Google Scholar] [CrossRef]
- Alabdulwahab, A.; Abusorrah, A.; Zhang, X.; Shahidehpour, M. Stochastic Security Constrained Scheduling of Coordinated Electricity and Natural Gas Infrastructures. IEEE Syst. J. 2017, 11, 1674–1683. [Google Scholar] [CrossRef]
- He, C.; Wu, L.; Liu, T.; Shahidehpour, M. Robust Co-Optimization Scheduling of Electricity and Natural Gas Systems via ADMM. IEEE Trans. Sustain. Energy 2017, 8, 658–670. [Google Scholar] [CrossRef]
- Liu, V.; Shahidehpour, M.; Wang, L. Coordinated Scheduling of Electricity and Natural Gas Infrastructures with a Transient Model for Natural Gas Flow. Chaos 2011, 21, 761. [Google Scholar] [CrossRef]
- Dokic, S.B.; Rajakovic, N.L. Security Modelling of Integrated Gas and Electrical Power Systems by Analyzing Critical Situations and Potentials for Performance Optimization. Energy 2019, 184, 141–150. [Google Scholar] [CrossRef]
- Shen, Y.; Gu, C.; Yang, X.; Zhao, P. Impact Analysis of Seismic Events on Integrated Electricity and Natural Gas Systems. IEEE Trans. Power Deliv. 2021, 36, 1923–1931. [Google Scholar] [CrossRef]
- Bao, Z.; Jiang, Z.; Wu, L. Evaluation of bi-directional cascading failure propagation in integrated electricity-natural gas system. Inter. J. Elect. Power Ener. Syst. 2020, 121, 1046045. [Google Scholar] [CrossRef]
- Beyza, J.; Garcia-Paricio, E.; Yusta, J.M. Ranking Critical Assets in Interdependent Energy Transmission Networks. Elect. Power Syst. Res. 2019, 172, 242–252. [Google Scholar] [CrossRef]
- Correa, G.J.; Yusta, J.M. Geodesic Vulnerability Index for Contingency Analysis in Electric Infrastructures. In Proceedings of the VII Symposium on Power Quality—SICEL 2013, Medellin, Colombia, 27–29 November 2013; pp. 1–7. [Google Scholar] [CrossRef]
- Crucitti, P.; Latora, V.; Marchiori, M. Model for Cascading Failures in Complex Networks. Phys. Rev. E Stat. Phys. Plasmas Fluids Relat. Interdiscip. 2004, 69, 104. [Google Scholar] [CrossRef]
- Beyza, J.; Yusta, J.M. Robustness Assessment of the Expansion of Coupled Electric Power and Natural Gas Networks Under Cascading Failures. IET Gen. Transm. Distrib. 2018, 12, 5753–5760. [Google Scholar] [CrossRef]
- Hines, P.; Cotilla-Sanchez, E.; Blumsack, S. Do Topological Models Provide Good Information About Electricity Infrastructure Vulnerability? Chaos 2010, 20, 887. [Google Scholar] [CrossRef]
- Albert, R.; Jeong, H.; Barabási, A. Error and Attack Tolerance of Complex Networks. Nature 2000, 406, 378–382. [Google Scholar] [CrossRef] [PubMed]
- Crucitti, P.; Latora, V.; Marchiori, M.; Rapisarda, A. Efficiency of Scalefree Networks: Error and Attack Tolerance. Phys. A 2003, 320, 622–642. [Google Scholar] [CrossRef]
- Moreno, Y.; Gomez, J.B.; Pacheco, A.F. Instability of Scale-Free Networks under Node-Breaking Avalanches. Europhys. Lett. 2002, 58, 630. [Google Scholar] [CrossRef]
- Motter, A.E.; Lai, Y.-C. Cascade-Based Attacks on Complex Networks. Phys. Rev. E 2002, 66, 065102. [Google Scholar] [CrossRef]
- Kinney, R.; Crucitti, P.; Albert, R.; Latora, V. Modeling Cascading Failures in the North American Power Grid. Europhys. J. B 2005, 46, 101–107. [Google Scholar] [CrossRef]
- Beyza, J.; Ruiz-Paredes, H.F.; Garcia-Paricio, E.; Yusta, J.M. Assessing the criticality of interdependent power and gas systems using complex networks and load flow techniques. Phys. A Stat. Mech. Applic. 2020, 212, 123169. [Google Scholar] [CrossRef]
- Wei, T.; Chu, X.; Liu, Y. Security Assessment of Interdependent Electricity-Gas Networks. In Proceedings of the 2020 IEEE Sustainable Power and Energy Conference (iSPEC), Chengdu, China, 23 November 2020; pp. 1484–1490. [Google Scholar]
- Crucitti, P.; Latora, V.; Marchiori, M. Locating Critical Lines in High-Voltage Electrical Power Grids. Fluct. Noise Lett. 2005, 5, L201–L208. [Google Scholar] [CrossRef]
- Goh, K.-I.; Kahng, B.; Kim, D. Universal Behavior of Load Distribution in Scale-Free Networks. Phys. Rev. Lett. 2001, 87, 278701. [Google Scholar] [CrossRef] [PubMed]
- Newman, M.E.J. Scientific Collaboration Networks. II. Shortest Paths, Weighted Networks, and Centrality. Phys. Rev. E 2001, 64, 016132. [Google Scholar] [CrossRef] [PubMed]
- Albert, R.; Albert, I.; Nakarado, G.L. Structural Vulnerability of The North American Power Grid. Phys. Rev. E 2004, 69, 025103. [Google Scholar] [CrossRef]
- Latora, V.; Marchiori, M. Efficient Behavior of Small-World Networks. Phys. Rev. Lett. 2001, 87, 198701. [Google Scholar] [CrossRef]
- Newman, M.E.J. The structure and function of complex network. SIAM Rev. 2003, 45, 167–256. [Google Scholar] [CrossRef]
- Boccaletti, S.; Latora, V.; Moreno, Y.; Chavez, M.; Hwang, D.-U. Complex networks: Structure and dynamics. Phys. Rep. 2006, 424, 175–308. [Google Scholar] [CrossRef]


| PS | GS | IPGS | |
|---|---|---|---|
| Nodes | 75 | 147 | 222 |
| Links | 89 | 178 | 277 |
| No. of Coupling Links | Nodes in PS | Nodes in GS | Function |
|---|---|---|---|
| 1 | 70 | 192 | Gas-fired power generator |
| 2 | 21 | 162 | Electricity-driven gas compressor |
| 3 | 11 | 98 | Electricity-driven gas compressor |
| 4 | 14 | 216 | Gas-fired generator |
| 5 | 34 | 159 | Electricity-driven gas compressor |
| 6 | 70 | 174 | Electricity-driven gas compressor |
| 7 | 70 | 176 | Electricity-driven gas storage |
| 8 | 58 | 175 | Electricity-driven gas storage |
| 9 | 45 | 150 | Electricity-driven gas storage |
| 10 | 2 | 150 | Electricity-driven gas storage |
Disclaimer/Publisher’s Note: The statements, opinions and data contained in all publications are solely those of the individual author(s) and contributor(s) and not of MDPI and/or the editor(s). MDPI and/or the editor(s) disclaim responsibility for any injury to people or property resulting from any ideas, methods, instructions or products referred to in the content. |
© 2023 by the authors. Licensee MDPI, Basel, Switzerland. This article is an open access article distributed under the terms and conditions of the Creative Commons Attribution (CC BY) license (https://creativecommons.org/licenses/by/4.0/).
Share and Cite
Amusan, O.; Shi, S.; Wu, D.; Liao, H. Structural Vulnerability Analysis of Interdependent Electric Power and Natural Gas Systems. Energies 2023, 16, 6918. https://doi.org/10.3390/en16196918
Amusan O, Shi S, Wu D, Liao H. Structural Vulnerability Analysis of Interdependent Electric Power and Natural Gas Systems. Energies. 2023; 16(19):6918. https://doi.org/10.3390/en16196918
Chicago/Turabian StyleAmusan, Olabode, Shuomang Shi, Di Wu, and Haitao Liao. 2023. "Structural Vulnerability Analysis of Interdependent Electric Power and Natural Gas Systems" Energies 16, no. 19: 6918. https://doi.org/10.3390/en16196918