
Primary Energy Consumption Patterns in Selected European Countries from 1990 to 2021: A Cluster Analysis Approach


Abstract
:1. Introduction
1.1. Historical Development of Energy Security
- The non-politicized stage;
- The politicized stage;
- The securitized stage [4].
1.2. Modern Definitions and Components
- Availability: Ensuring physical access to energy.
- Accessibility: Overcoming geographical, political, demographic, and technological barriers to obtain energy resources.
- Affordability: Ensuring cost-effective energy sources.
- Acceptability: Prioritizing environmentally and societally acceptable energy sources [11].
1.3. Threats and Challenges
- Technical challenges, such as infrastructure failures.
- Social behaviors, including volatile energy demand or politically motivated supply suspensions.
- Natural threats, like the depletion of fossil fuel reserves [18].
1.4. Primary Energy Consumption and Energy Security
- The diversification of sources: A country primarily reliant on a single energy source is more susceptible to supply disruptions than a country utilizing a diverse range of energy sources [24].
- Dependency on imports: A high level of energy imports, especially from a single country or region, can increase the risk of supply disruptions due to political or economic factors. Dependence on hydrocarbon imports, such as crude oil and natural gas, can pose a significant risk to a country’s energy security. High levels of import of these resources lead to several key issues, including the following [25,26,27,28]:
- −
- Sensitivity to price fluctuations: Hydrocarbon prices are often unstable and can undergo rapid changes in response to geopolitical factors, natural disasters, or decisions by the OPEC cartel. Countries heavily dependent on imports are more exposed to these fluctuations, which can lead to rising energy prices for consumers.
- −
- Risk of supply disruptions: Political conflicts, economic sanctions, or even trade decisions can lead to disruptions in hydrocarbon supplies, which, in turn, can affect the stability of energy supplies.
- −
- Geopolitical dependency: Dependence on hydrocarbon imports can lead to geopolitical dependency on exporting countries, which can influence the political and diplomatic decisions of the importing country.
- Investments in renewable energy sources: Long-term investments in renewable energy sources can enhance energy security by diversifying sources and reducing dependency on unstable commodity markets. This trend is driven by both environmental and economic considerations [29,30]:
- −
- Reduction in CO2 emissions: Fossil fuels are the primary source of carbon dioxide emissions, which contribute to global warming. Transitioning to renewable energy sources can aid in reducing these emissions.
- −
- Production costs: The costs of producing energy from renewable sources, such as solar or wind energy, are continually decreasing, making them increasingly competitive compared to traditional fossil fuels.
- The challenges of renewable energy sources: However, renewable energy sources, such as solar or wind energy, also present certain challenges, such as the following [31,32,33]:
- −
- Stability and predictability of supplies: Renewable energy sources, like solar or wind energy, are inherently unstable. Their production depends on weather conditions, which can lead to irregular energy supplies.
- −
- Need for energy storage: To compensate for the instability of renewable energy sources, there is a need to develop energy storage technologies, which come with additional costs and pose a technological challenge.
- The trend of moving away from fossil fuels: The modern world observes a global trend of moving away from fossil fuels, such as coal, in favor of more sustainable and ecological energy sources. This trend is driven both by environmental and economic considerations. Fossil fuels are the main source of carbon dioxide emissions, which contribute to global warming. Transitioning to renewable energy sources can help in reducing these emissions.
- The diverse approaches and attitudes towards nuclear energy: Nuclear energy, as a primary energy source, has always been a subject of intense debate and varying perceptions across countries. Its utilization and integration into the energy mix are influenced by myriad factors [34,35]:
- −
- Safety concerns: Historical events, such as the Chernobyl and Fukushima disasters, have heightened safety concerns surrounding nuclear energy. These incidents have led to rigorous safety standards and protocols, but they have also fostered skepticism and apprehension in certain regions.
- −
- Economic implications: The initial investment required for nuclear power plants is substantial. However, once operational, they can offer a stable and often cost-effective source of energy. The economic viability of nuclear energy is often weighed against its long-term benefits and the costs associated with waste management and plant decommissioning.
- −
- Environmental impact: While nuclear energy produces minimal greenhouse gas emissions, the challenge of radioactive waste management remains. Solutions such as deep geological repositories are being explored, but the long-term environmental implications are a significant consideration.
- −
- Geopolitical considerations: The need for uranium as a fuel, and the potential for nuclear weapon proliferation, make nuclear energy a geopolitical concern. Countries with abundant uranium reserves wield a certain level of influence, and international treaties, such as the Nuclear Non-Proliferation Treaty, aim to ensure peaceful nuclear energy use.
- −
- Public perception and acceptance: The public’s perception of nuclear energy varies widely. While some view it as a clean alternative to fossil fuels, others are wary of its potential risks. Public opinion can significantly influence governmental policies and decisions related to nuclear energy development.
- −
- Small Modular Reactors (SMRs): A recent innovation in the realm of nuclear energy is the development and promotion of Small Modular Reactors (SMRs). These reactors offer a different approach compared to traditional large-scale nuclear reactors. SMRs represent a promising avenue for the future of nuclear energy, offering a blend of flexibility, safety, and economic viability. As countries grapple with the challenges of energy security, carbon reduction, and economic growth, SMRs may play a pivotal role in shaping the nuclear landscape [36,37,38].
Incorporating nuclear energy into a country’s energy strategy requires a holistic assessment of its benefits and challenges. While it offers a solution to reduce carbon emissions and provides a stable energy supply, the complexities associated with safety, waste management, and geopolitics cannot be overlooked. As the global community strives for a sustainable energy future, the role of nuclear energy remains a nuanced and evolving discussion.
1.5. Objectives and Contributions of This Study
2. Cluster Analysis
- In marketing, cluster analysis is often used to identify groups of customers based on their purchasing or demographic behaviors. By clustering customers based on their similarities in purchase history, preferences, and other factors, firms can create more targeted marketing campaigns and tailor products and services to specific customer groups.
- In biology, cluster analysis can be used to group genes with similar expression patterns. This can help researchers identify genes that are involved in a specific biological process or disease and develop new methods of treatment or therapy.
- In computer science, cluster analysis can be used to identify groups of similar documents or web pages. This can be useful in information retrieval when the fast and accurate retrieval of relevant information is important.
- In the energy sector, for example, it can be used to cluster households with similar energy consumption patterns, which can help energy companies develop more targeted energy efficiency programs and demand response initiatives. It can also be used to cluster wind turbines with similar wind speeds and other environmental conditions, which can help optimize energy production and reduce costs. This method can also find its application in solving many other business problems in the energy sector.
- Hierarchical clustering is a popular method of grouping similar data points into clusters based on a similarity measure. It can be performed using either a “bottom-up” or “top-down” approach. In the “bottom-up” approach, each data point is initially treated as a separate cluster, and then clusters are successively merged based on their similarity. In the “top-down” approach, all data points initially belong to one cluster, which is then successively divided into smaller clusters based on their differences.
- K-means clustering is another popular method of assigning data points to clusters by minimizing the sum of squared distances between data points and the assigned cluster centroid. The number of clusters is usually predetermined by the user, and the algorithm iteratively assigns data points to the nearest cluster centroid until convergence is achieved. K-means clustering is a fast and efficient method that can be used for large datasets.
- Density-based clustering is another type of clustering that identifies clusters based on areas of high density in the data. The most well-known density-based clustering algorithm is DBSCAN (Density-Based Spatial Clustering of Applications with Noise), which clusters data points that are within a certain distance of each other and have a minimum number of neighboring points. DBSCAN is particularly useful for datasets with a lot of noise or when clusters have irregular shapes.
2.1. K-Means
2.1.1. Steps of the K-Means Clustering Algorithm
- Initialization: First, the number of clusters, k, needs to be specified. Randomly initialize k centroids, either by selecting k data points from the dataset or by using a different initialization strategy such as k-means.
- Assignment: Assign each data point to the nearest centroid based on a distance metric, commonly Euclidean distance. This step forms k clusters.
- Update: Recalculate the centroids of the clusters by computing the mean of all the data points assigned to each cluster.
- Convergence: Repeat steps 2 and 3 until convergence is achieved, i.e., when the centroids no longer change significantly or a maximum number of iterations is reached.
- Final result: After convergence, the algorithm assigns each data point to the cluster represented by the nearest centroid. The result is a partitioning of the dataset into k clusters.
2.1.2. Advantages
- Simplicity: K-means is a straightforward and easy-to-understand algorithm with a clear objective.
- Scalability: It can handle large datasets with a linear time complexity, making it suitable for clustering big data.
- Efficiency: The algorithm converges relatively fast due to its simplicity.
- Interpretability: The resulting clusters can often be interpreted meaningfully, especially in low-dimensional spaces.
- Versatility: K-means can be applied to various types of data, such as numerical, categorical, or binary.
2.1.3. Limitations
- Dependency on Initial Centroids: The algorithm’s performance heavily depends on the initial placement of centroids, which can lead to different results for different initializations.
- Sensitivity to Outliers: K-means is sensitive to outliers, as they can significantly affect the position and size of clusters.
- Cluster Shape Assumptions: The algorithm assumes that the clusters are convex and have similar sizes, which can be limiting in some scenarios.
- Determining the Optimal Number of Clusters: Deciding the appropriate value of k is often subjective and can impact the clustering quality.
- Influence of Feature Scaling: If features have different scales, the algorithm may be biased towards features with larger values.
2.1.4. Optimal Number Od Clusters
- Total within-cluster sum of square (WSS) minimization;
- Average silhouette method.
- Apply the clustering algorithm, such as k-means, for different values of k (the number of clusters), typically ranging from a minimum to a maximum value.
- For each value of k, calculate the WSS, which is the sum of squared distances between each data point and its assigned centroid within the cluster.
- Plot the values of k on the x-axis and the corresponding WSS on the y-axis.
- Examine the resulting plot and look for a distinctive “elbow” point, which appears as a bend or curve in the plot.
- The elbow point represents the value of k where adding more clusters provides diminishing returns in terms of reducing the WSS.
- Based on the elbow point, select the corresponding value of k as the estimated optimal number of clusters.
- represents the average dissimilarity (distance) between data point i and all other points within the same cluster.
- represents the average dissimilarity between data point i and all points in the nearest neighboring cluster (i.e., the cluster with the smallest average dissimilarity to data point i).
- Apply the clustering algorithm for different values of k (the number of clusters) ranging from a minimum to a maximum value.
- For each value of k, compute the average silhouette coefficient across all data points.
- Identify the value of k that maximizes the average silhouette coefficient. This value represents the optimal number of clusters.
3. Consumption of Primary Energy in Selected European Countries between 1990 and 2021
4. Cluster Analysis of Primary Energy Consumption Patterns in Selected European Countries
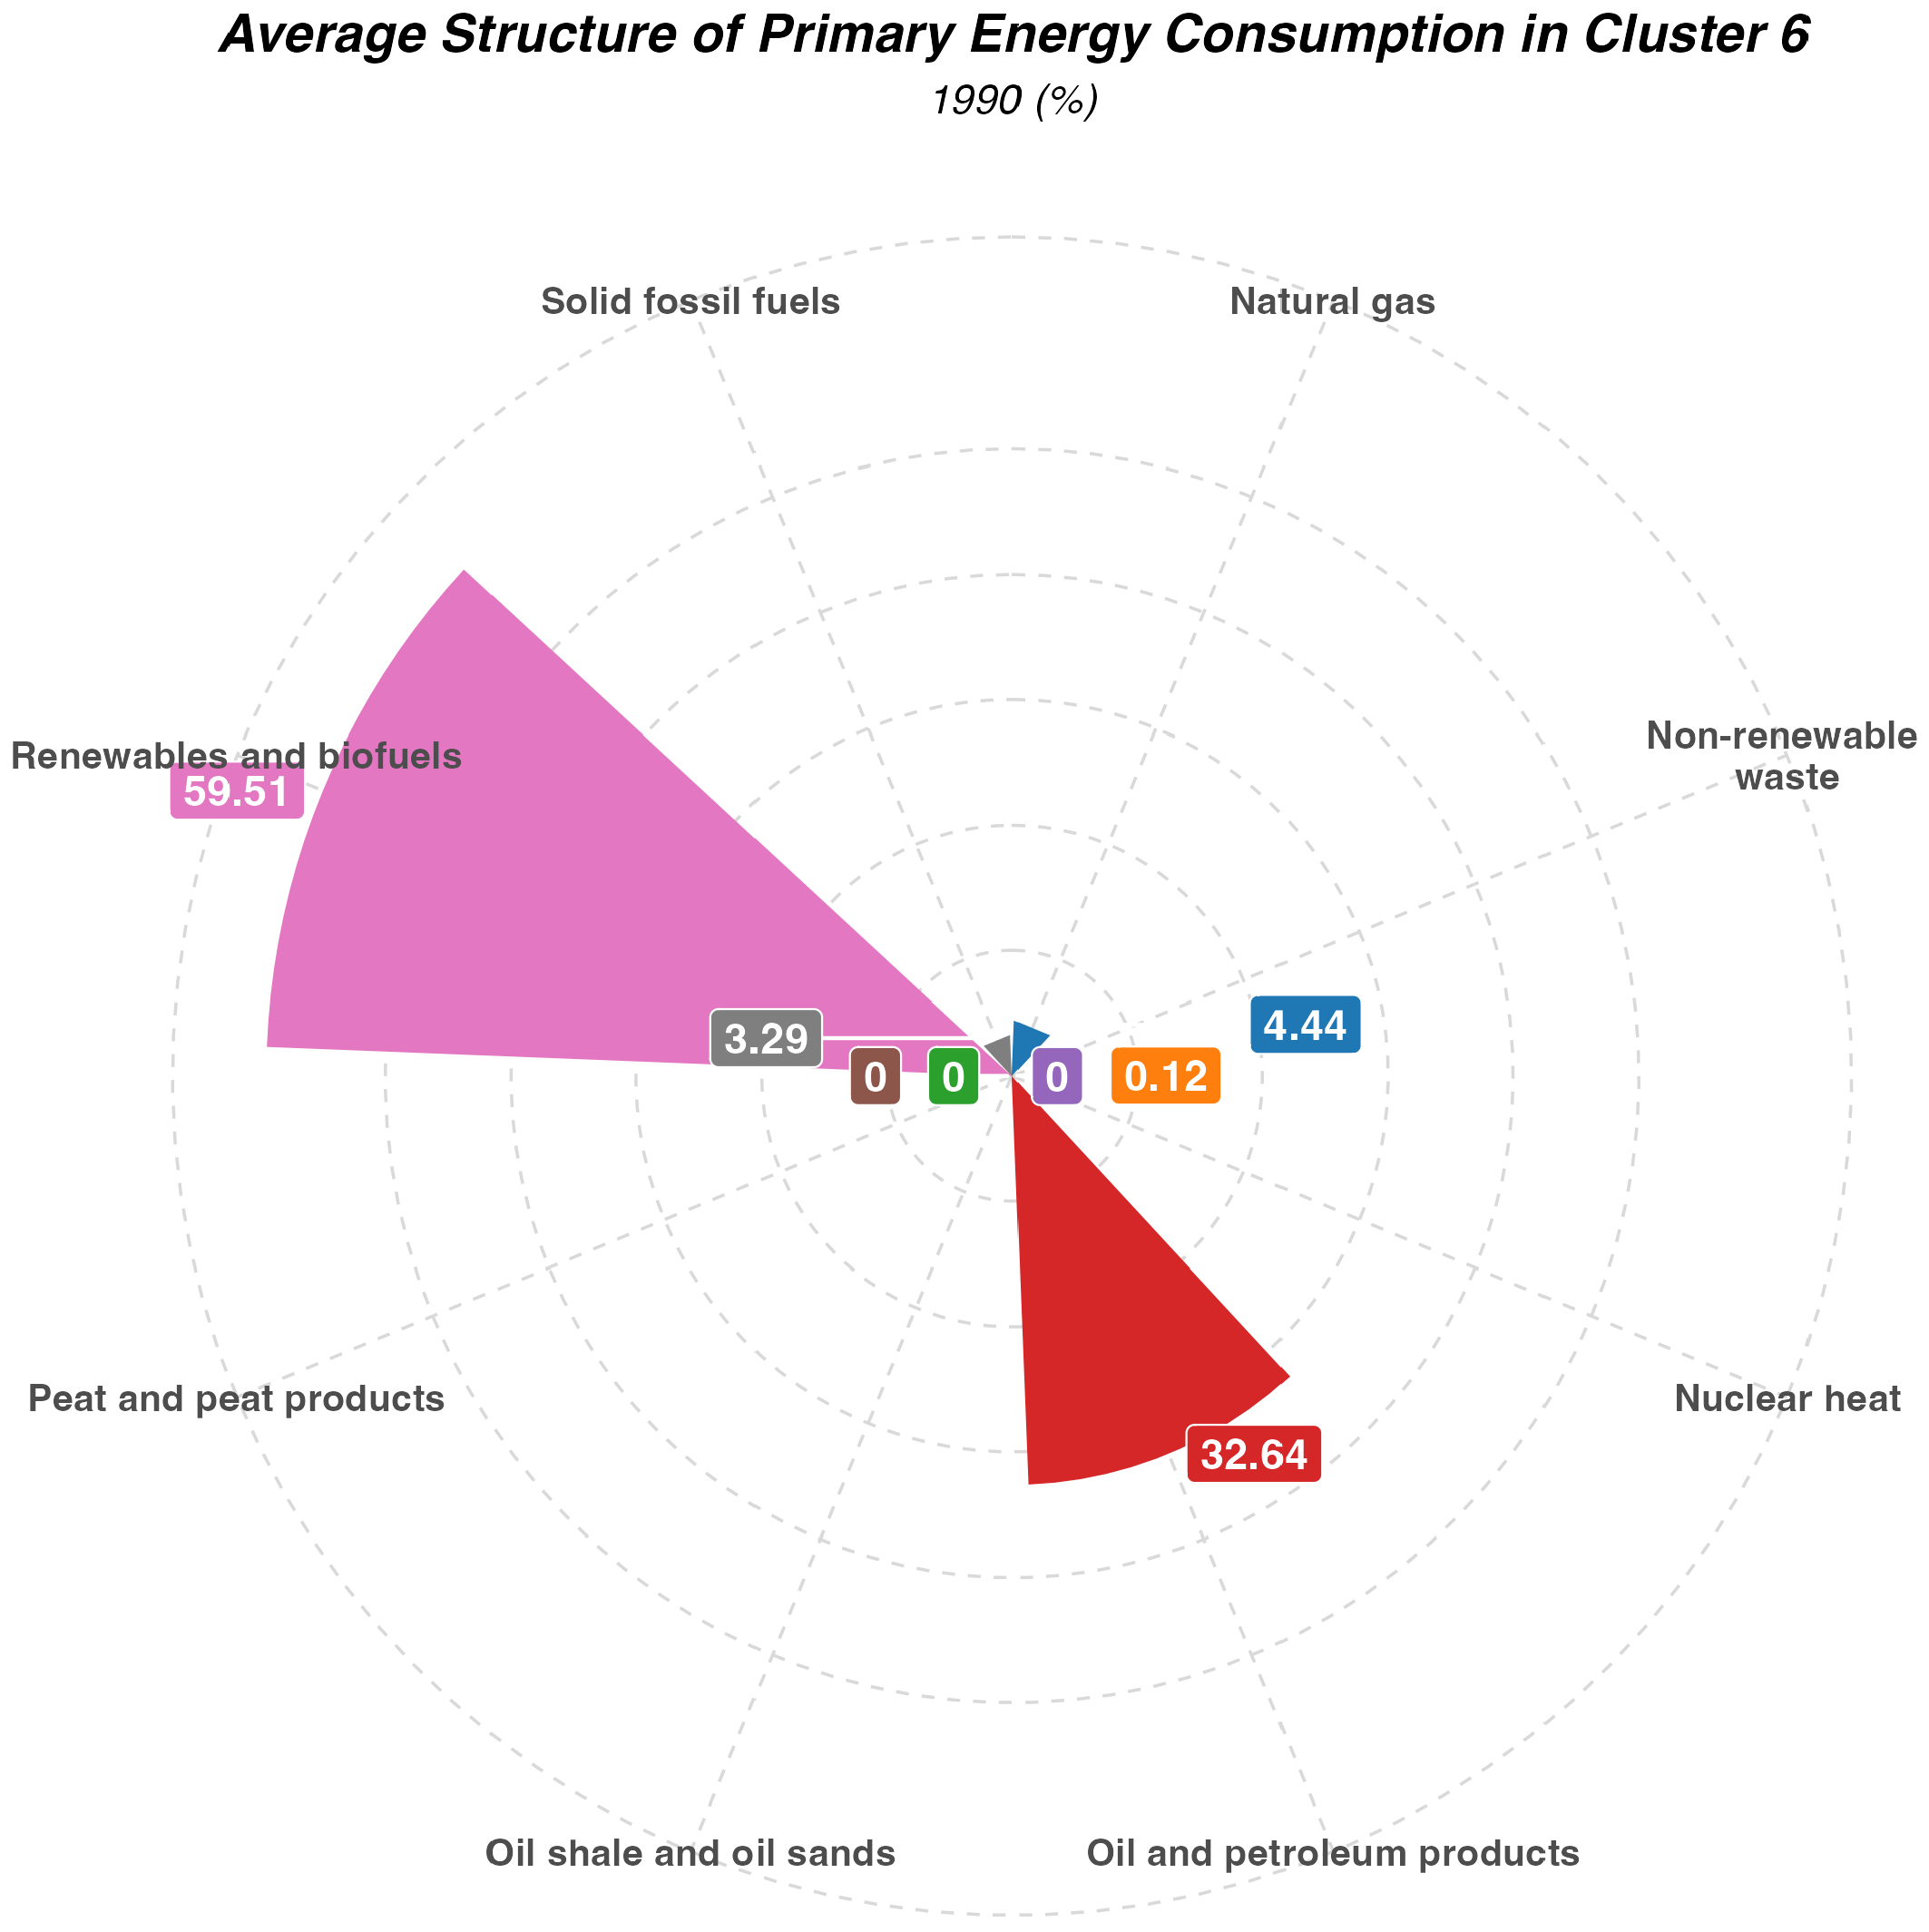
4.1. Year 1990
4.2. Year 2021
5. Discussion and Conclusions
- A clear trend of moving away from solid fossil fuels. Even in countries where this remains the primary source of energy, its share in overall consumption has significantly decreased.
- Renewable energy sources have seen the most substantial growth in share across all groups. This robust trend will undoubtedly continue in the coming years, aligning with the policies of the European Union and individual countries. However, this shift also presents challenges. Most of this growth has been achieved through relatively unstable sources, such as wind and solar energy. This introduces several serious implications, including the need for energy storage, periodic energy shortages or surpluses, and the necessity to balance the energy system with other sources during windless or sunless periods.
- A noticeable increase in natural gas consumption, which serves as a transitional fuel in the energy transformation process and is well-suited for stabilizing energy systems during renewable energy shortages. It also acts as a good substitute for solid fossil fuels.
- During the analyzed period, there was a kind of stagnation in the development of nuclear energy. Some countries continued its development, while others decided to gradually phase it out (e.g., Germany). However, overall changes in both consumption volume and share were minimal. This situation may change in the coming years due to the consequences of Russia’s aggression against Ukraine, the loss of energy security in Europe, and the further development of renewable energy sources, which require balancing and backup from alternative sources. As a result, many countries are considering the development of nuclear energy or have already taken steps in this direction.
- For most countries, oil remains crucial, although its share in total primary energy consumption is slowly decreasing.
- Renewable sources are politically and ecologically favorable. However, they are typically unstable and require support from other energy sources, at least until effective renewable energy storage technologies are developed and implemented.
- Solid fossil fuels are relatively easy to use, do not require dedicated, extensive transport infrastructure, and provide stable energy supplies. However, due to CO2 emissions, they are an unsustainable energy source in the long run, and a shift away from them seems inevitable.
- Natural gas is a flexible and easy-to-use transitional fuel. However, it requires extensive transport and storage infrastructure and is perhaps the most politicized primary energy source. The consequences of Russia’s aggression against Ukraine and its use of natural gas as a geopolitical tool, leading to an energy and economic crisis in Europe, have clearly demonstrated this. Moreover, natural gas is also a fossil fuel, generating CO2 emissions, and Europe lacks significant reserves.
- Nuclear energy has faced negative publicity, exacerbated by disasters in Chernobyl and Fukushima, geopolitical issues, and a certain aura of mystery and fear surrounding nuclear technologies. On the other hand, it seems to be an ideal complement to renewable sources. However, the significant investments associated with the development of nuclear energy can be a barrier.
- Oil is currently a key component of the energy mix for European countries. However, it is also a fossil source responsible for CO2 emissions, and due to a lack of significant reserves in Europe, it mostly requires import. Its ease of transport, processing, and the high amount of energy carried per volume unit make oil a very convenient primary energy source.
- The first cluster is characterized by a significant reliance on solid fossil fuels. While these sources are often locally available or easily imported, they are becoming increasingly untenable due to environmental, political, and social concerns. This has also led to their diminishing economic viability. Countries in this cluster, notably Poland, are transitioning towards renewable energy sources, increasing natural gas consumption, and planning substantial investments in nuclear energy.
- The second group predominantly utilizes oil, natural gas, and renewable sources. Given that the majority of their oil and natural gas is imported, it is crucial for these countries to ensure diversified supplies and a well-developed transport and storage infrastructure. The Ukraine conflict highlighted the risks, as seen in Germany, of over-reliance on a single supplier, especially for natural gas.
- The third cluster boasts the most diverse energy mix in terms of primary energy consumption. However, the relatively high proportion of solid fossil fuels remains a concern. A significant advantage for this group is their use of nuclear energy, ensuring a stable energy supply.
- The fourth group, comprising two small countries, primarily consumes oil. It i challenging to assess them collectively due to Cyprus’s unique geopolitical situation and Luxembourg’s affluent status in Western Europe. Nonetheless, reliance on a single, imported primary energy source is suboptimal.
- The fifth group is distinguished by its substantial use of renewable energy sources. While this is theoretically ideal, it necessitates backup energy sources, especially when relying on unstable renewables. This issue is less pertinent for Iceland, which benefits from hydro and geothermal energy, and to a lesser extent for Norway and Sweden, which utilize hydropower. However, prolonged droughts can disrupt such energy production. This renewable-centric model seems to be the European goal, but establishing a balanced system with backup energy sources during renewable shortages remains a challenge.
- The final group consists of a single country, Estonia, which stands out in Europe due to its shale oil reserves. While this ensures energy security for Estonia, it poses environmental, political, and social challenges. Consequently, Estonia is gradually moving away from this primary energy source and increasingly turning to renewables.
- Methodological Limitations: We employed the k-means clustering algorithm to categorize countries based on their primary energy consumption patterns. While k-means is a widely used method, it has its limitations. For instance, it assumes spherical clusters and is sensitive to the initial placement of centroids, which could affect the final clustering outcome. Additionally, k-means does not provide a measure of the “goodness of fit” for the chosen number of clusters, which could be a limitation in understanding the robustness of our categorizations.
- Data Scope: Our analysis is limited to countries for which data is available in the Eurostat database. This means that some European countries that are not part of the Eurostat database were not included in our study. The exclusion of these countries could potentially limit the comprehensiveness of our findings and their applicability to the entire European region.
- Temporal Limitations: Our study covers the period from 1990 to 2021. While this provides a long-term view, it may not capture very recent policy changes or technological advancements that have not yet significantly impacted primary energy consumption statistics.
- Lack of Qualitative Data Analysis: Our study is primarily quantitative and does not delve into the qualitative aspects, such as political, social, or economic factors, that might influence energy consumption patterns and energy security in individual countries.
Author Contributions
Funding
Data Availability Statement
Conflicts of Interest
Abbreviations
| OPEC | Organization of the Petroleum Exporting Countries |
| SMR | Small Modular Reactor |
| IDE | Integrated Development Environment |
| DBSCAN | Density-Based Spatial Clustering of Applications with Noise |
| EU27 | 27 Countries of the European Union |
| EJ | exajoule |
| PJ | petajoule |
| WSS | Within-Cluster Sum of Squares |
References
- Palonkorpi, M. Energy Security and the Regional Security Complex Theory. Q. J. Political Res. 2006, 1, 302–313. [Google Scholar]
- Stern, D. Energy and Economic Growth: The Stylized Facts. Int. Assoc. Energy Econ. 2011, 37, 223–255. [Google Scholar]
- Mazur, A.; Rosa, E. Energy and Life-Style. Science 1974, 186, 607–610. [Google Scholar] [CrossRef]
- Özcan, S. Securitization of Energy Through the Lenses of Copenhagen School. In Proceedings of the 2013 Orlando International Conference, Orlando, FL, USA, 21–23 March 2013. [Google Scholar]
- Flaherty, C.; Filho, W.L. Energy Security as a Subset of National Security. In Global Energy Policy and Security; Springer: London, UK, 2013; pp. 11–25. [Google Scholar] [CrossRef]
- Roberts, P. The End of Oil. On the Edge of Perilous New World; Houghton Mifflin Harcourt: Boston, MA, USA, 2004. [Google Scholar]
- Kemp, G. Scarcity and Strategy. Foreign Aff. 1978, 56, 396. [Google Scholar] [CrossRef]
- Bahgat, G. Oil Security at the Turn of the Century: Economic and Strategic Implications. Int. Relat. 1999, 14, 41–52. [Google Scholar] [CrossRef]
- Cocklin, C. Anatomy of a future energy crisis Restructuring and the energy sector in New Zealand. Energy Policy 1993, 21, 881–892. [Google Scholar] [CrossRef]
- Coates, J.F. Technological change and future growth: Issues and opportunities. Technol. Forecast. Soc. Chang. 1977, 11, 49–74. [Google Scholar] [CrossRef]
- Cherp, A.; Jewell, J. The three perspectives on energy security: Intellectual history, disciplinary roots and the potential for integration. Curr. Opin. Environ. Sustain. 2011, 3, 202–212. [Google Scholar] [CrossRef]
- Skinner, R. Energy Security and Producer-Consumer Dialogue: Avoiding a Maginot Mentality. The Oxford Institute for Energy Studies. 2005. Available online: https://www.oxfordenergy.org/publications/energy-security-and-producer-consumer-dialogue-avoiding-a-maginot-mentality (accessed on 16 August 2023).
- Skinner, R.; Arnott, R. The Oil Supply and Demand Context for Security of Oil Supply to the EU form the GCC Countries. The Oxford Institute for Energy Studies. 2005. Available online: https://www.oxfordenergy.org/publications/the-oil-supply-and-demand-context-for-security-of-oil-supply-to-the-eu-from-the-gcc-countries/ (accessed on 16 August 2023).
- Yergin, D. Ensuring Energy Security. Foreign Aff. 2006, 85, 69. [Google Scholar] [CrossRef]
- Williams, P.D.; Mc Donald, M. (Eds.) Energy Security; Routledge: London, UK, 2018; pp. 483–496. [Google Scholar] [CrossRef]
- APERC. A Quest for Energy Security in the 21st Century Resources and Constraints; APERC: Hyderabad, India, 2007. [Google Scholar]
- Ren, J.; Sovacool, B.K. Quantifying, measuring, and strategizing energy security: Determining the most meaningful dimensions and metrics. Energy 2014, 76, 838–849. [Google Scholar] [CrossRef]
- Winzer, C. Conceptualizing energy security. Energy Policy 2012, 46, 36–48. [Google Scholar] [CrossRef]
- Energy Security: Reliable, Affordable Access to All Fuels and Energy Sources. International Energy Agency. 2020. Available online: https://www.iea.org/topics/energy-security (accessed on 16 August 2023).
- Study on Energy Supply Security and Geopolitics. European Commission. 2004. Available online: https://www.clingendaelenergy.com/inc/upload/files/Study_on_energy_supply_security_and_geopolitics.pdf (accessed on 16 August 2023).
- Hedenus, F.; Azar, C.; Johansson, D.J. Energy security policies in EU-25—The expected cost of oil supply disruptions. Energy Policy 2010, 38, 1241–1250. [Google Scholar] [CrossRef]
- Kazantsev, A. Policy networks in European–Russian gas relations: Function and dysfunction from a perspective of EU energy security. Communist-Post-Communist Stud. 2012, 45, 305–313. [Google Scholar] [CrossRef]
- The European Parliament and of the Council. Directive 2008/92/EC of the European Parliament and of the Council of 22 October 2008 Concerning a Community Procedure to Improve the Transparency of Gas and Electricity Prices Charged to Industrial End-Users (Recast) (Text with EEA Relevance); The European Parliament and of the Council: Strasbourg, France, 2008. [Google Scholar]
- Šipkovs, P.; Pelīte, U.; Kashkarova, G.; Lebedeva, K.; Migla, L.; Shipkovs, J. Policy and Strategy Aspects for Renewable Energy Sources Use in Latvia. In Proceedings of the World Renewable Energy Congress 2011, Linkoping, Sweden, 8–12 May 2011. [Google Scholar] [CrossRef]
- Erkök, B.; Küçük, Y. Dependency on imported energy in Turkey: Input-output analysis. Marmara Univ. J. Econ. Adm. Sci. 2023, 45. [Google Scholar] [CrossRef]
- Gutmann, J.; Pitlik, H.; Fronaschütz, A. Has the Russian invasion of Ukraine reinforced anti-globalization sentiment in Austria? Empirica 2023, 50, 289–299. [Google Scholar] [CrossRef]
- Adamczyk, P. Does the Volatility of Oil Price Affect the Structure of Employment? The Role of Exchange Rate Regime and Energy Import Dependency. Energies 2022, 15, 6895. [Google Scholar] [CrossRef]
- Štreimikienė, D.; Siksnelyte-Butkiene, I.; Lekavičius, V. Energy Diversification and Security in the EU: Comparative Assessment in Different EU Regions. Economies 2023, 11, 83. [Google Scholar] [CrossRef]
- Hailemariam, A.; Ivanovski, K.; Dzhumashev, R. Does R&D investment in renewable energy technologies reduce greenhouse gas emissions? Appl. Energy 2022, 327, 120056. [Google Scholar] [CrossRef]
- Razmjoo, A.; Kaigutha, L.G.; Rad, M.V.; Marzband, M.; Davarpanah, A.; Denai, M. A Technical analysis investigating energy sustainability utilizing reliable renewable energy sources to reduce CO2 emissions in a high potential area. Renew. Energy 2021, 164, 46–57. [Google Scholar] [CrossRef]
- Ang, T.Z.; Salem, M.; Kamarol, M.; Das, H.S.; Nazari, M.A.; Prabaharan, N. A comprehensive study of renewable energy sources: Classifications, challenges and suggestions. Energy Strategy Rev. 2022, 43, 100939. [Google Scholar] [CrossRef]
- Muruganantham, B.; Gnanadass, R.; Padhy, N. Challenges with renewable energy sources and storage in practical distribution systems. Renew. Sustain. Energy Rev. 2017, 73, 125–134. [Google Scholar] [CrossRef]
- Trainer, T. Some problems in storing renewable energy. Energy Policy 2017, 110, 386–393. [Google Scholar] [CrossRef]
- Badora, A.; Kud, K.; Woźniak, M. Nuclear Energy Perception and Ecological Attitudes. Energies 2021, 14, 4322. [Google Scholar] [CrossRef]
- Ho, S.S.; Kristiansen, S. Environmental Debates over Nuclear Energy: Media, Communication, and the Public. Environ. Commun. 2019, 13, 431–439. [Google Scholar] [CrossRef]
- Mignacca, B.; Locatelli, G. Economics and finance of Small Modular Reactors: A systematic review and research agenda. Renew. Sustain. Energy Rev. 2020, 118, 109519. [Google Scholar] [CrossRef]
- Maio, F.D.; Bani, L.; Zio, E. The Contribution of Small Modular Reactors to the Resilience of Power Supply. J. Nucl. Eng. 2022, 3, 152–162. [Google Scholar] [CrossRef]
- Vinoya, C.L.; Ubando, A.T.; Culaba, A.B.; Chen, W.H. State-of-the-Art Review of Small Modular Reactors. Energies 2023, 16, 3224. [Google Scholar] [CrossRef]
- Eurostat. Energy Balances—Table nrg_bal_s; Eurostat: Luxembourg, 2023. [Google Scholar]
- R Core Team. R: A Language and Environment for Statistical Computing; R Foundation for Statistical Computing: Vienna, Austria, 2021. [Google Scholar]
- RStudio Team. RStudio: Integrated Development Environment for R; RStudio, PBC: Boston, MA, USA, 2022. [Google Scholar]
- Wickham, H.; Averick, M.; Bryan, J.; Chang, W.; McGowan, L.D.; François, R.; Grolemund, G.; Hayes, A.; Henry, L.; Hester, J.; et al. Welcome to the tidyverse. J. Open Source Softw. 2019, 4, 1686. [Google Scholar] [CrossRef]
- MacQueen, J.B. Some Methods for Classification and Analysis of MultiVariate Observations. In Proceedings of the Fifth Berkeley Symposium on Mathematical Statistics and Probability, Riverside, CA, USA, 21 June–18 July 1965, 27 December 1965–7 January 1966; Cam, L.M.L., Neyman, J., Eds.; University of California Press: Riverside, CA, USA, 1967; Volume 1, pp. 281–297. [Google Scholar]
- Jain, A.K.; Dubes, R.C. Algorithms for Clustering Data; Prentice-Hall, Inc.: Upper Saddle River, NJ, USA, 1988. [Google Scholar]
- Kaufman, L.; Rousseeuw, P.J. (Eds.) Finding Groups in Data; John Wiley & Sons, Inc.: Hoboken, NJ, USA, 1990. [Google Scholar] [CrossRef]
- Xu, R.; Wunsch, D. Survey of Clustering Algorithms. IEEE Trans. Neural Netw. 2005, 16, 645–678. [Google Scholar] [CrossRef]
- Mirkin, B. Clustering for Data Mining; Chapman and Hall/CRC: Boca Raton, FL, USA, 2005. [Google Scholar] [CrossRef]
- Everitt, B.; Landau, S.; Leese, M. Cluster Analysis, 4th ed.; Arnold: London, UK, 2001. [Google Scholar]
- Hennig, C. What are the true clusters? Pattern Recognit. Lett. 2015, 64, 53–62. [Google Scholar] [CrossRef]
- Jain, A.K. Data clustering: 50 years beyond K-means. Pattern Recognit. Lett. 2010, 31, 651–666. [Google Scholar] [CrossRef]
- Arthur, D.; Vassilvitskii, S. K-Means++: The Advantages of Careful Seeding. In Proceedings of the SODA ’07: Eighteenth Annual ACM-SIAM Symposium on Discrete Algorithms, Philadelphia, PA, USA, 7–9 January 2007; pp. 1027–1035. [Google Scholar]
- Tan, P.N.; Steinbach, M.; Kumar, V. Introduction to Data Mining; Addison-Wesley Longman Publishing Co., Inc.: Reading, MA, USA, 2005. [Google Scholar]
- Milligan, G.W.; Cooper, M.C. An examination of procedures for determining the number of clusters in a data set. Psychometrika 1985, 50, 159–179. [Google Scholar] [CrossRef]
- Hastie, T.; Tibshirani, R.; Friedman, J. The Elements of Statistical Learning; Springer: New York, NY, USA, 2009. [Google Scholar] [CrossRef]
- Rousseeuw, P.J. Silhouettes: A graphical aid to the interpretation and validation of cluster analysis. J. Comput. Appl. Math. 1987, 20, 53–65. [Google Scholar] [CrossRef]


| Cluster | ||||||
|---|---|---|---|---|---|---|
| 1 | 2 | 3 | 4 | 5 | 6 | 7 |
| Czechia | Bulgaria | Albania | Cyprus | Belgium | Iceland | Estonia |
| North Macedonia | Germany | Austria | Malta | Finland | Norway | |
| Poland | Hungary | Denmark | France | |||
| Serbia | The Netherlands | Greece | Lithuania | |||
| Romania | Spain | Sweden | ||||
| Slovakia | Croatia | Slovenia | ||||
| Ukraine | Ireland | |||||
| The UK | Italy | |||||
| Luxembourg | ||||||
| Latvia | ||||||
| Portugal | ||||||
| Turkey | ||||||
| Cluster | |||||
|---|---|---|---|---|---|
| 1 | 2 | 3 | 4 | 5 | 6 |
| Bosnia and Herzegovina | Austria | Belgium | Cyprus | Albania | Estonia |
| Montenegro | Germany | Bulgaria | Luxembourg | Denmark | |
| North Macedonia | Greece | Czechia | Finland | ||
| Poland | Spain | France | Iceland | ||
| Serbia | Georgia | Slovenia | Latvia | ||
| Kosovo | Croatia | Slovakia | Norway | ||
| Hungary | Sweden | ||||
| Ireland | |||||
| Italy | |||||
| Lithuania | |||||
| Moldova | |||||
| Malta | |||||
| The Netherlands | |||||
| Portugal | |||||
| Romania | |||||
| Turkey | |||||
Disclaimer/Publisher’s Note: The statements, opinions and data contained in all publications are solely those of the individual author(s) and contributor(s) and not of MDPI and/or the editor(s). MDPI and/or the editor(s) disclaim responsibility for any injury to people or property resulting from any ideas, methods, instructions or products referred to in the content. |
© 2023 by the authors. Licensee MDPI, Basel, Switzerland. This article is an open access article distributed under the terms and conditions of the Creative Commons Attribution (CC BY) license (https://creativecommons.org/licenses/by/4.0/).
Share and Cite
Kosowski, P.; Kosowska, K.; Janiga, D. Primary Energy Consumption Patterns in Selected European Countries from 1990 to 2021: A Cluster Analysis Approach. Energies 2023, 16, 6941. https://doi.org/10.3390/en16196941
Kosowski P, Kosowska K, Janiga D. Primary Energy Consumption Patterns in Selected European Countries from 1990 to 2021: A Cluster Analysis Approach. Energies. 2023; 16(19):6941. https://doi.org/10.3390/en16196941
Chicago/Turabian StyleKosowski, Piotr, Katarzyna Kosowska, and Damian Janiga. 2023. "Primary Energy Consumption Patterns in Selected European Countries from 1990 to 2021: A Cluster Analysis Approach" Energies 16, no. 19: 6941. https://doi.org/10.3390/en16196941
APA StyleKosowski, P., Kosowska, K., & Janiga, D. (2023). Primary Energy Consumption Patterns in Selected European Countries from 1990 to 2021: A Cluster Analysis Approach. Energies, 16(19), 6941. https://doi.org/10.3390/en16196941