Article

Thermoelectric-Based Radiant Cooling Systems: An Experimental and Numerical Investigation of Thermal Comfort

by
Benjamin Kubwimana
,
Mohadeseh Seyednezhad
and
Hamidreza Najafi
*
Department of Mechanical and Civil Engineering, Florida Institute of Technology, Melbourne, FL 32901, USA
*
Author to whom correspondence should be addressed.
Energies 2023, 16(19), 6981; https://doi.org/10.3390/en16196981
Submission received: 11 September 2023 / Revised: 27 September 2023 / Accepted: 5 October 2023 / Published: 7 October 2023
(This article belongs to the Section G: Energy and Buildings)

Abstract

:
Researching novel cooling and heating technologies as alternatives to conventional vapor-compression refrigeration cycles has received growing attention in recent years. Thermoelectric (TE) systems rank among promising emerging technologies within this category. This paper presents a comprehensive investigation, utilizing numerical modeling and analysis via COMSOL Multiphysics along with experimental validation, to evaluate the performance of a radiant cooling ceiling panel working on thermoelectric principles. Performance metrics are based on thermal comfort levels within the designed test chamber. The system comprises a rectangular test chamber (~1.2 m × 1.2 m × 1.5 m) with a centrally positioned ceiling panel (dimensions: 0.6 m × 0.6 m × 0.002 m). Four TE modules are attached on top of the ceiling panel, facilitating effective cooling to regulate the ceiling temperature to the desired setpoint. The resultant lower ceiling temperature enables heat exchange within the chamber environment via radiation and convection mechanisms. This study examines the time-dependent variations in mean radiant temperature and operative temperature under natural convection conditions, with comfort level assessment carried out using the PMV method according to ASHRAE Standard 55. An experimental chamber is built to validate the numerical model by performing experiments at various ceiling temperatures. Design challenges are discussed in detail. The results of this investigation offer valuable insights into the anticipated thermal comfort achievable through TE-based radiant cooling systems across various operating conditions.

1. Introduction

Over the decades, more fossil fuel has been burnt to fulfill the energy demands of the growing human population worldwide. This has led to an increase in carbon footprint emissions, resulting in the distribution of pollutants and contributing to ozone layer depletion [1]. Over the past few decades, many efforts have been put into developing energy-efficient technologies [2,3,4] as well as increasing the share of renewable energies in different sectors [5,6]. It is known that buildings are a major energy consumer sector in the US [7]. Space heating, ventilation, and air-conditioning (HVAC) systems are among the largest energy end-users in buildings [8].
Additionally, given the popularity of vapor-compression cooling/heating systems, the fact that they require refrigerants, and the known harmful effect that the use of refrigerants imposes on the environment, the quest for developing alternative heating/cooling technologies has been growing. One of these technologies is the application of thermoelectric (TE) modules. TE modules operate based on the Peltier effect. The Peltier effect refers to the phenomenon of generating a temperature gradient between the junctions as the result of applying DC voltage difference across the terminals of a thermoelectric module. Peltier (thermoelectric-based) cooling does not need a refrigerant and is considered very environmentally friendly [9]. It produces no noise and does not require large mechanical devices, i.e., compressors; it is reliable and is easy to install [9,10]. These desirable characteristics motivated engineers to explore the application of Peltier-based cooling and heating systems for built environments [11]. TE modules have been used for building applications through integration in the building envelope or as a separate unit (non-integrated). A typical non-integrated system is a TE cooling system and an individual ventilation unit [12]. The integrated TE-based cooling system could be used in walls [13,14,15,16], windows [17], or the ceiling/roof of a building [18,19,20]. In such applications, the TE modules provide a cool/warm surface that facilitates cooling/heating via radiation and convection. It is noteworthy that the radiant cooling system only handles the sensible load, and other systems must be considered for addressing the latent load [21].
The radiant panel surface area’s ratio to the ceiling needs to be maintained at 30–50% to achieve proper thermal comfort [21]. The radiant cooling’s surface temperature combined with diffusers usually operates in the temperature range of 16–19 °C to maintain thermal comfort [22]. The indoor air temperature must be set between 18 and 24 °C with controlled humidity and air velocity below 0.2 m/s [23,24]. It has already been demonstrated that radiant cooling systems are energy-efficient systems [25]; however, to date, not many studies have been conducted on TE radiant cooling systems, particularly pertaining to thermal comfort. Lertsatitthanakorn et al. [26] used a series of water pipes attached to the hot side of the TE modules that were used on the ceiling cooling system. The results showed that the smaller vertical temperature gradient would result in an acceptable temperature range for thermal comfort. They obtained a coefficient of performance (COP) of 0.75 with an average indoor temperature of 27 °C when the system was operating with 1.5 A. Another study was conducted using the same average indoor temperature of 27 °C, and an improved COP of 0.82 was achieved using an air velocity of 0.8 m/s, and the target thermal comfort condition was achieved [27]. A few researchers [28,29,30,31] were able to enhance the COP of the TE-based cooling/heating systems, even though, in most cases, a conventional HVAC system has a larger COP. However, a TE-based cooling system can provide better thermal comfort for the occupants as it can be controlled locally for the occupied zone. Conventional systems typically operate based on the mean air temperature of a thermal zone, which may result in unnecessary cooling of unoccupied areas [32,33,34]. The application of localized cooling was studied by Catalina et al. [35] after performing a series of experiments on a full-scale building.
Typically, the assessment of indoor thermal comfort relies on a subjective perception, wherein occupants express their preferences differently [36]. This evaluation can be accomplished through the direct involvement of individuals or by employing established standard scales, notably the predicted mean vote (PMV) and predicted percentage dissatisfied (PPD) models, which are widely recognized indices [37]. The PMV, a prominent metric, is derived from six key variables encompassing aspects like physical activity level and clothing insulation, as well as thermal environment parameters such as air humidity, velocity, and temperature. The PMV serves as a representation of measurements in accordance with the ASHRAE thermal sensation scale [21].
A limited number of studies are available on the resulting thermal comfort from radiant cooling systems. Nagano and Mochida [38] conducted a comprehensive set of twenty-eight experiments involving five subjects positioned in a supine (lying down horizontally) orientation within an experimental chamber. They installed radiant ceiling panels on a chamber measuring 3.3 m × 2.3 m × 2.3 m in size; a 75 mm insulation layer was used to envelop the chamber surface. A large foam board with embedded water pipes was placed between the radiant panels and the insulation layer, ensuring a consistent ceiling temperature (ranging from 23 °C to 26 °C). The water pipes also maintained wall and floor temperatures between 28 °C and 29 °C. The results showed that a temperature difference of less than 13 °C was achieved between the air inside the room and the radiant ceiling panel. The dissatisfaction rate was reported to be less than 5%.
Hodder et al. [39] discussed the thermal comfort experienced by occupants seated in a test room using a chilled ceiling and ventilation system. They showed that the vertical radiant temperature asymmetry greatly impacts the thermal comfort experience. Kitagawa et al. [40] concentrated on examining the impact of air movement and humidity within an experimental chamber featuring a radiant cooling ceiling system, considering the occupants were seated on a chair. They meticulously controlled the experimental conditions using a humidifier and an air-conditioning system equipped with a re-heat exchanger unit. Their conclusions highlighted that elevated humidity levels correlate with warmer thermal sensations. They managed to achieve an optimal sensation vote of around −0.5 and demonstrated that even minimal air movement inside the room can generate a cooler environment compared to still air.
Thermal comfort is influenced by both physiological factors (e.g., metabolic heat rate) and environmental conditions, particularly air velocity, relative humidity, mean radiant temperature, and dry bulb temperature [41]. It is important to note that the accuracy of results tends to increase with a larger number of participants in an experiment. However, conducting thermal comfort evaluations with many subjects can be costly and time consuming [36]. As an alternative, researchers have embraced the use of experimental data and numerical methods (i.e., Computational Fluid Dynamics (CFDs)) to assess the parameters influencing occupants’ thermal comfort. The application of the CFD method has demonstrated promising outcomes, particularly when evaluating parameters, such as the building’s dry bulb temperature and airflow patterns [42].
Catalina et al. [36] assessed the temperature distribution and mean airflow velocity in a room with a chilled water radiant cooling system on the ceiling using a numerical approach. The water temperature was controlled within the range of 17–20 °C, and the ceiling temperature ranged from 16.9 °C to 18.9 °C. They achieved a high level of indoor thermal comfort, especially with airflow velocities below 0.2 m/s. Stamou and Katsiris [43] utilized CFDs to evaluate the thermal comfort within the Olympic Arena Stadium with an integrated HVAC system. They employed four different turbulence models to find the average air velocity and temperature, assessing thermal comfort at various locations using the PMV and PPD models. Their results indicated that an optimal inlet air temperature of 16 °C would yield satisfactory conditions.
Tye-Gingras et al. [44] devised a 2D CFD model for a room and conducted a multi-objective optimization for a full-scale room with a hydronic radiant cooling ceiling and wall. They considered thermal comfort and energy consumption as the two objective functions and explored the resulting solutions. They highlighted that the water inlet temperature has a higher impact compared with the panel surface area in achieving the optimal solution. Their approach included adopting radiation in participating media to account for radiation heat exchange within the room. Other researchers, such as Hussain et al. [45], employed the discrete transfer radiation model (DTRM) for radiation heat transfer through the façade glass surface coupled with the near-wall turbulence model for airflow inside atria. Numerous studies have assessed the thermal comfort of indoor environments featuring radiant cooling ceilings, ventilation systems, and virtual manikins using CFDs. Corgnati et al. [46] developed a CFD simulation involving manikins within a two-desk office environment, exploring two scenarios: (1) an air-only ventilation system and (2) a ventilation system combined with radiant cooling ceiling panels. They focused on draft risk and concluded that integrating radiant cooling panels could notably mitigate the risk of condensation stemming from cold airdrops.
In the present study, a numerical model is developed using COMSOL Multiphysics 5.5a to assess the performance of TE-based cooling panels for producing indoor thermal comfort. The mean radiant temperature (MRT), relative humidity (Rh), and operative temperature (OPR) are used to evaluate thermal comfort using the PMV method according to ASHRAE Standard 55 [47]. Several design challenges are discussed, including the need to balance the cooling capacity of the TE modules with the heat load from the occupants and the environment. An experimental study is also conducted using a chamber (~1.2 m × 1.2 m × 1.5 m) with a black-coated aluminum ceiling panel in the center of the ceiling (0.6 m × 0.6 m × 0.002 m). The ceiling panel with top-attached TE modules makes an integrated radiant cooling system. The cooling system inside the ceiling controls the test chamber’s environment through the integration of an embedded power controller and sensors to measure the MRT, Rh, and OPR in the test chamber. This ensured that the results were accurate and reliable. This chamber creates a test setup like the simulation model performed in COMSOL, thus enabling validation of the cooling system’s performance under real environments. This study presents the novelty of developing a simulation model for a TE-based radiant cooling system along with a simple and inexpensive lab setup to validate the model’s performance, using results from a series of experiments to calibrate the simulation model for further improvements. This study was conducted in a climate-controlled laboratory, which ensured that the results were not affected by outside factors, such as weather or sunlight. The results of this study have important implications for the design and implementation of TE-based radiant cooling systems in buildings.

2. System Description

Figure 1 shows the 3D model of the system created in COMSOL. The system comprises a rectangular test chamber with dimensions of 1104 mm × 1157 mm × 1562 mm, featuring a ceiling panel positioned at the center of the ceiling.
Two distinct designs are considered for the ceiling panel. (A) The first design features a ceiling panel with dimensions of 0.6 m × 0.6 m, covering approximately 29% of the total ceiling area. This configuration assumes that four TE modules are affixed to the top of the ceiling panel (refer to Figure 1). (B) The second design involves a larger ceiling panel with dimensions of 0.862 m × 0.862 m, covering a more extensive area of the ceiling, approximately 58%. In this case, eight TE modules are attached to the top of the panel. These two design variations are being considered to assess their respective impacts on the system’s performance.
Since thermal radiation is a significant heat transfer mode for this particular application, a crucial aspect of the model involves including a spherical object representing a globe thermometer (GT). This addition enables the calculation of the globe temperature, subsequently contributing to the determination of the resulting mean radiant temperature [48]. The sphere in question is characterized by a black-coated shell with a thickness of 4 mm. Positioned at the center of this sphere is a thermocouple (TCP). The GT is initially located at the center of the room, maintaining a distance of 1257 mm from the floor. The test chamber in this simulation does not incorporate any inflow or outflow of air; instead, air circulation is solely driven by natural convection within the chamber.
In radiative cooling applications aimed at achieving thermal comfort, the recommended range for the ceiling temperature lies between 18 °C and 22 °C [49]. It is important to highlight that adjustments are made to the TE modules’ cold-side temperature setpoint, as well as the number of TE modules used, to ensure that the system operates within this specified comfort temperature range. For case A, using four TE modules and assuming a constant cold-side temperature (Tc) of the TE modules at 13.5 °C and 18.5 °C, the calculated average ceiling panel surface temperature (Trcc) is 18 °C and 21.6 °C, respectively. In the case of B, with eight TE modules, the calculated Trcc is 18.4 °C and 21.85 °C for the Tc values of 13.5 °C and 18.5 °C, respectively.
Simulation runs are conducted to compute the transient variation in ceiling temperature, internal chamber air temperature, and operative temperature. Additionally, the resultant distribution of steady-state temperatures within the chamber is determined for four distinct conditions outlined in Table 1. The thermal comfort for each case is also evaluated using PMV and PPD criteria.

3. Numerical Model

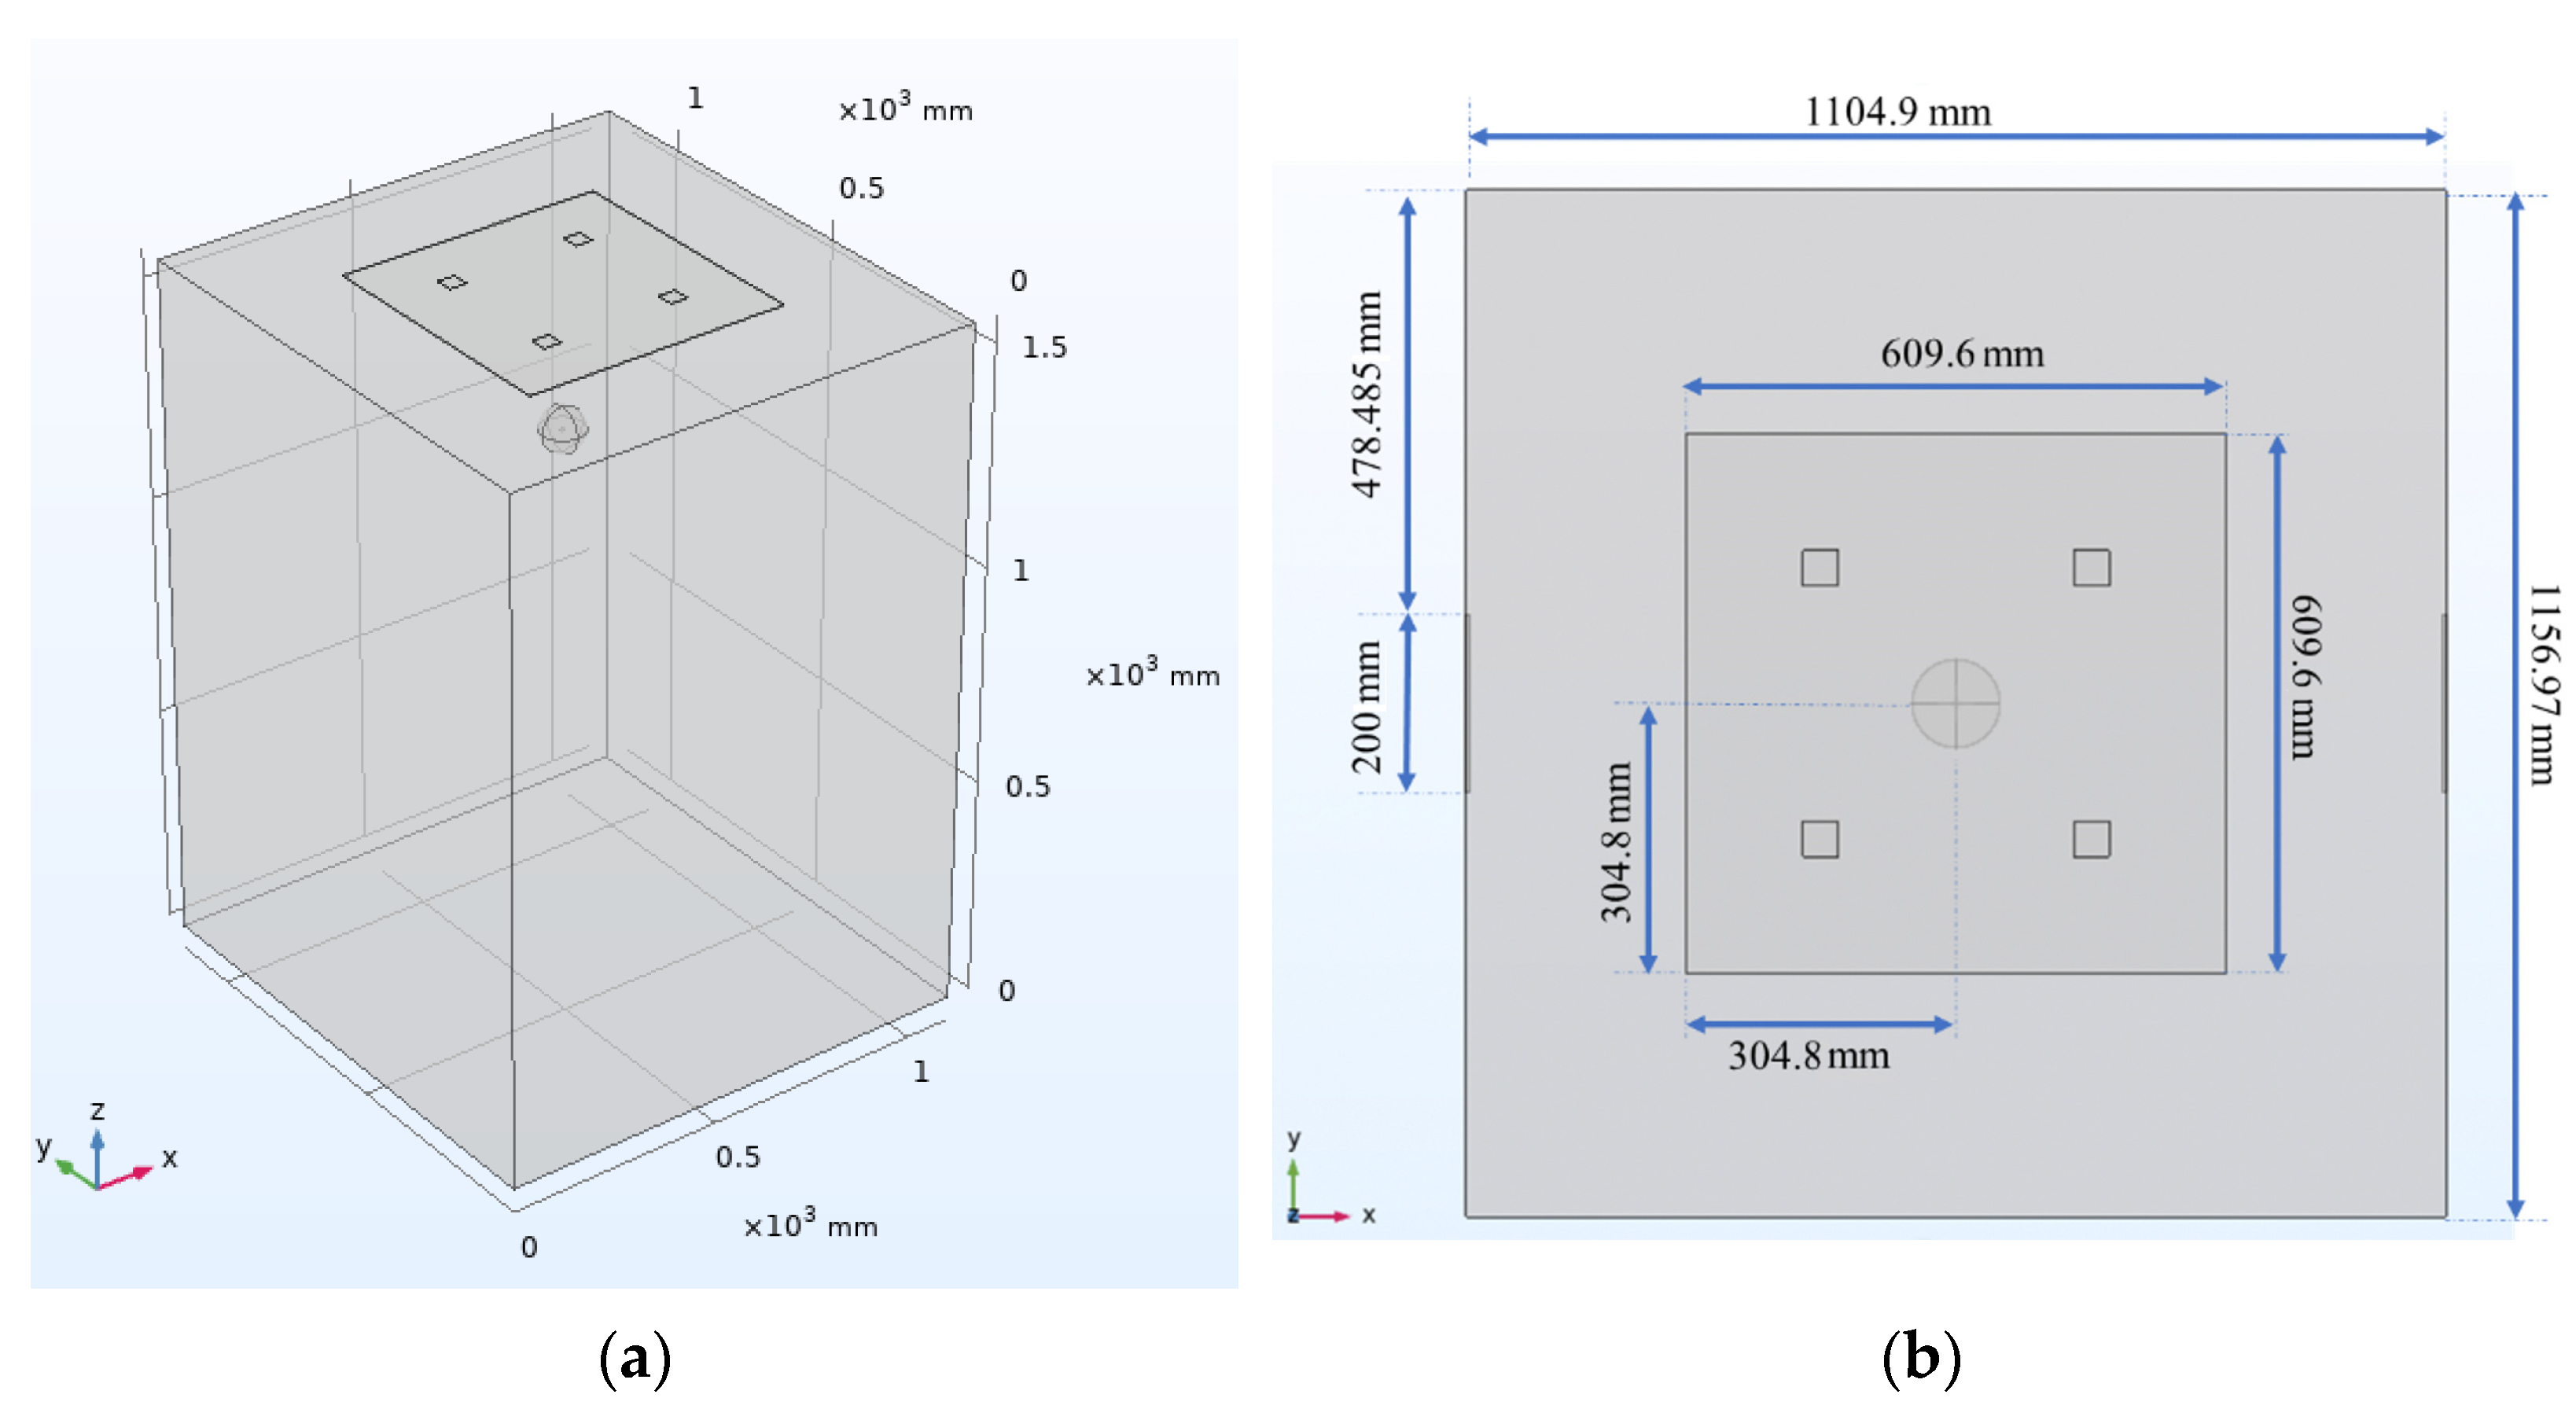
3.1. COMSOL Simulation Model

The temperature distribution and flow pattern within the space are computed using COMSOL Multiphysics, a tool that has been used for numerical simulation and thermal analysis for a variety of problems [50]. This study applies the experimental condition and data to establish boundary conditions for the numerical model. Three key modules in COMSOL are employed: heat transfer in solids, surface-to-surface (S2S) radiation, and laminar flow interfaces [51]. The model represents a small-size chamber.
The finite element method has been employed to solve all governing PDE equations using physics-controlled tolerance and time-dependent analysis. A tetrahedral and triangular mesh type was adopted, featuring a maximum of 30,086 elements. A finer mesh was applied for TE modules and the GT (including shell and TCP), aluminum sheet, and the air domain. Mesh quality was assessed using skewness, and mesh statistics confirmed that the element density was suitable for achieving grid-independent results. The model effectively depicted indoor temperature distribution while maintaining a favorable computational time.

3.2. Assumptions and Initial and Boundary Conditions

The characteristics of the TE modules are presented in Table 2. The details regarding the test chamber are shown in Table 3. It is assumed that the ceiling temperature (TAL) is maintained higher than the air dew point temperature to avoid condensation. The numerical model used brass material to represent the globe thermometer (GT) used in the experimental setup. This was performed to ensure that the results of the numerical model were comparable to the experiment results (see Table 3).
The physics interface used for the analysis, as well as the initial and boundary conditions for the time-dependent study, are presented in Table 4. The initial ambient temperature of the entire system is assumed to be 29 °C. When the system starts operating, the TE modules maintain a uniform temperature (13.5 °C/18.5 °C). The air is treated as a non-participating medium, and gravitational effects are considered for natural convection. S2S radiation employs the hemicube method with a 256 resolution and linear radiosity. Radiation direction is defined for both sides of the aluminum panel and GT (shell and TCP) surfaces. The energy conservation equation for each part of the model can be defined as:
ρ C p ( 𝜕 T 𝜕 t + u t r a n s T ) + ( q c o n d + q r a d ) = Q a d + Q t e d + Q p
where qrad and qcond are the heat flux through radiation and conduction, respectively, ρ represents density, specific heat is denoted as Cp, and utrans is the velocity vector for the fluid. Qp and Qad represent the represents the viscous dissipation and additional heat source, respectively, and Qted is the thermoelastic damping effects in solids. The conduction heat flux can be found using Fourier’s law:
q c o n d = k T
Here, k is thermal conductivity. It should be noted that BC1 describes the constant temperature boundary condition for TE modules when operating with a constant electrical input. At the beginning, the modules’ cold-side temperature is set at 13.5 °C and then at 18.5 °C to reach the desirable radiant panel surface temperature.
T = T 0
It is assumed that the upper surface of the radiant panel is fully insulated (BC2). Additionally, all walls, floor, and ceiling surface areas have adiabatic boundary conditions:
n q = 0
The surface-to-surface radiation boundary condition (BC3) is considered for the radiant panel’s backside surface and GT, assuming they both have diffuse surfaces. To simplify the model, radiation from the walls, floor, and ceiling is considered negligible. The radiosity from each surface can be found as:
J = ε e b T + ρ d G
where the total hemispherical emissive power (eb(T)), as well as the total irradiation (G), can be determined using:
e b T = n 2 σ T 4
G = G m J + G a m b + G e x t
Here, n is the normal vector, Gm represents the mutual radiation exchange between surfaces, Gext denotes radiation from external sources, and Gamb expresses the amount of ambient radiation. The Navier–Stokes and energy balance equations are solved numerically to find the velocity and temperature distributions for the air inside the chamber. The flow is considered laminar and non-isothermal single phase. The governing equation for laminar flow can be written as:
ρ 𝜕 u 𝜕 t + ρ u . u = . P + τ + F + ρ g
Here, u represents the velocity field, P expresses the pressure, τ denotes the viscous stress tensor, and F is the volume force vector. The four top corners of the model are defined as hydrostatic pressure points. The no-slip condition is considered for all the walls as:
ρ u = 0
The heat transfer in solid, surface-to-surface radiation, and laminar flow, are coupled together in COMSOL. Equations (1)–(9) are solved concurrently to evaluate the velocity and temperature distributions for all components of the model. The resulting data are then utilized for assessing thermal comfort and estimating potential energy-saving benefits.

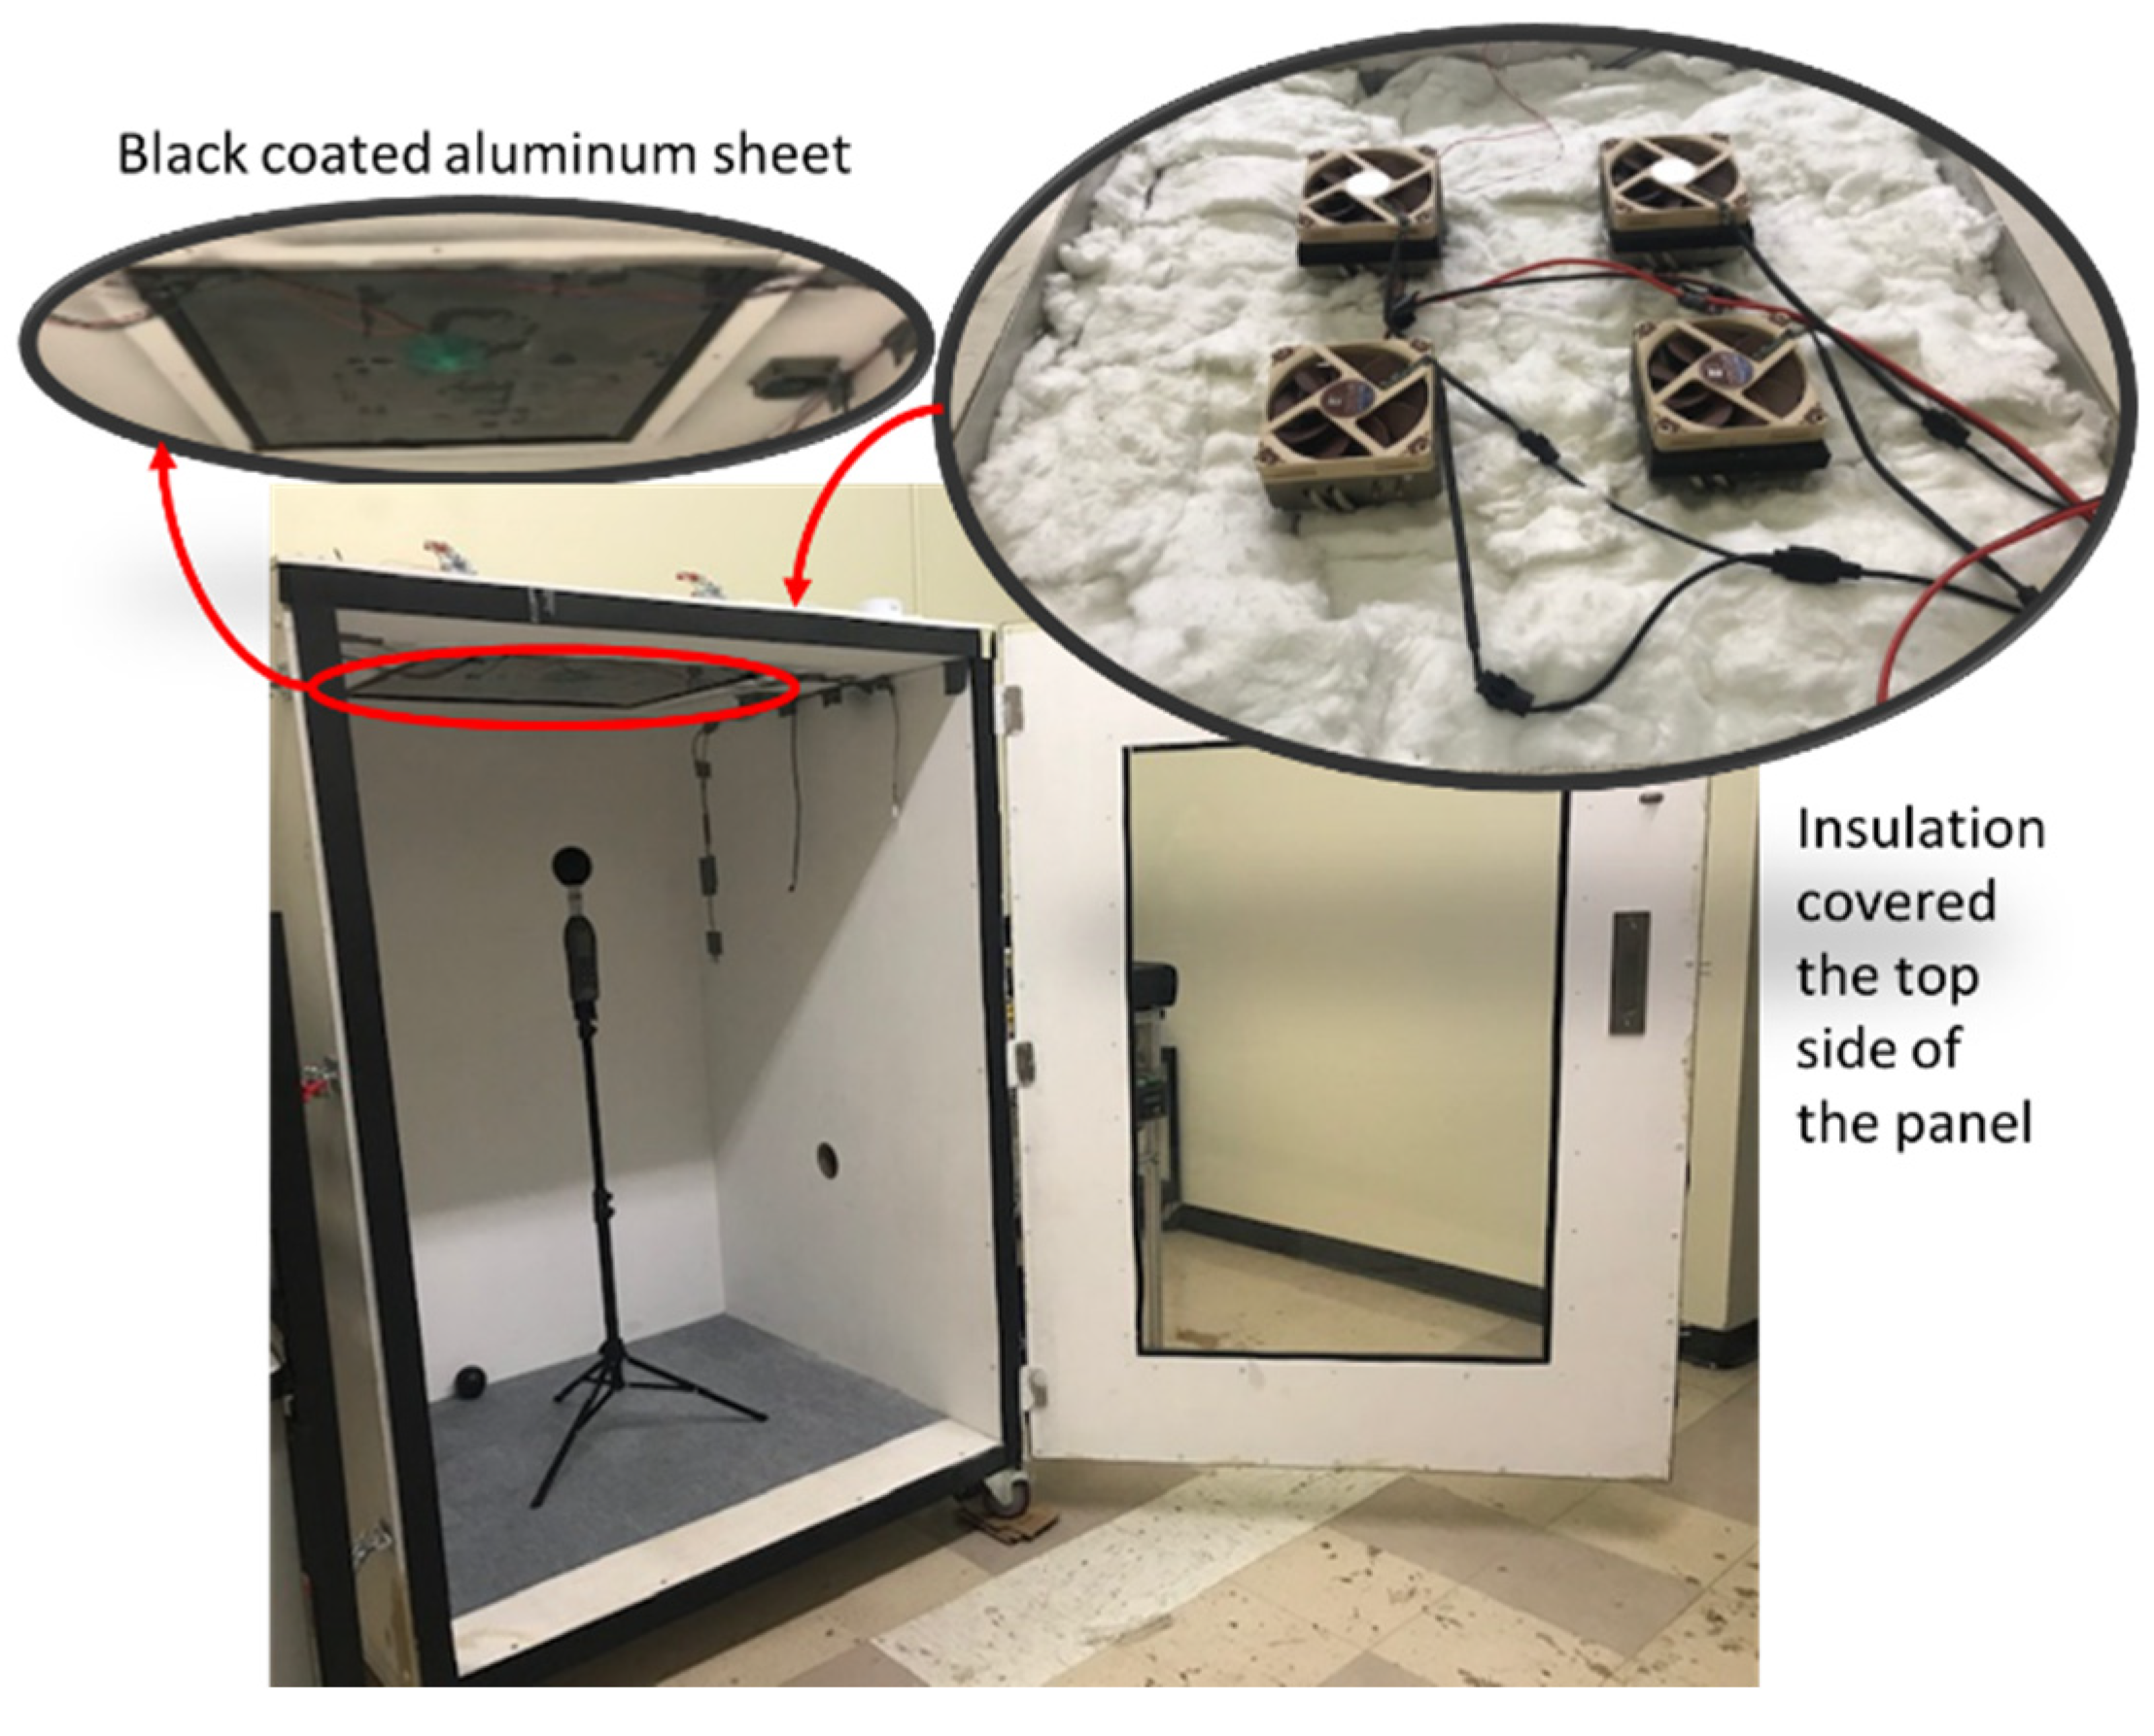
4. Experimental Setup

4.1. COMSOL Simulation Model

An experimental setup was developed to investigate the feasibility of a TE-based radiant ceiling panel and validate the numerical model introduced in this article. Figure 2 displays the test chamber that was built and used to test the TE-based radiant ceiling panel. The panel is integrated at the chamber’s ceiling center. Similar to the numerical model, the ceiling panel is constructed from a 609.6 × 609.6 mm2 aluminum sheet with a thickness of 2 mm, fastened to the ceiling. Four TE modules are attached on top of the ceiling panel 10 cm from the edges. The optimal number of TE modules has been determined in previous research papers [52]. To manage heat dissipation from the TE modules, each module is equipped with an air-cooled heatsink. The remaining portion of the radiant ceiling panel’s upper surface is covered with ceramic fiber insulation material.
The structural insulated panels (SIPs) are the prefabricated composite construction elements [53] that have a thickness of 50.8 mm. These panels are used for the chamber’s walls, floor, and ceiling. To ensure proper radiation, the entrance door has a Plexiglass section at its center. The internal dimensions of the test chamber measure 1104 mm × 1157 mm × 1562 mm, which closely resemble the dimensions of the numerical model. The test chamber is mounted on four wheels for easy mobility.
Inside the test chamber, a globe thermometer (GT) is added to measure the mean radiant temperature. In addition, the entire chamber is fully insulated and sealed to minimize the impact of infiltration and exfiltration.
As shown in Figure 2, the entire panel is covered with a black coating. Additionally, to prevent condensation problems, clear protective film stickers designed to counteract condensation are affixed to the lower surface of the aluminum panel.

4.2. Experimental Setup and Test Procedure

The data recorded during the experimental procedure are mean radiant temperature, relative humidity of the air, ambient temperature, input electric power, the temperature at the center of the bottom side of the ceiling panel, and the high-temperature side of the TE modules. The measuring devices used are outlined in Table 5.
As shown in Table 6, a total of three cases are examined in this study to validate the findings. The experiments involve measuring the transient variation of the ceiling temperature in steady-state conditions under three different circumstances, as shown in Table 7. The TE modules are supplied with a specific input current and voltage to lead the radiant ceiling panel temperature to settle at 18 °C, 16 °C, and 14 °C in cases 1, 2, and 3, respectively.
The characteristics of the TE modules were previously detailed in Table 2. The initial and boundary conditions used in the experiments are presented in Table 8. The lab room’s air temperature (Tamb) was maintained at 23.6 °C, and all components were initially at equilibrium with Tamb. The relative humidity (RH) was nearly 47.9%, 46.6%, and 47.9% for the Trcc (radiant ceiling panel temperature) of 14 °C, 16 °C, and 18 °C, respectively. Each series of experiments had a 50 min test duration, with data being recorded at one-second intervals. It is important to note that radiation within participating media was neglected in numerical cases to reduce the computation time.

5. Results and Discussion

This section presents and discusses the findings of the time-dependent simulations that were performed for four different conditions.

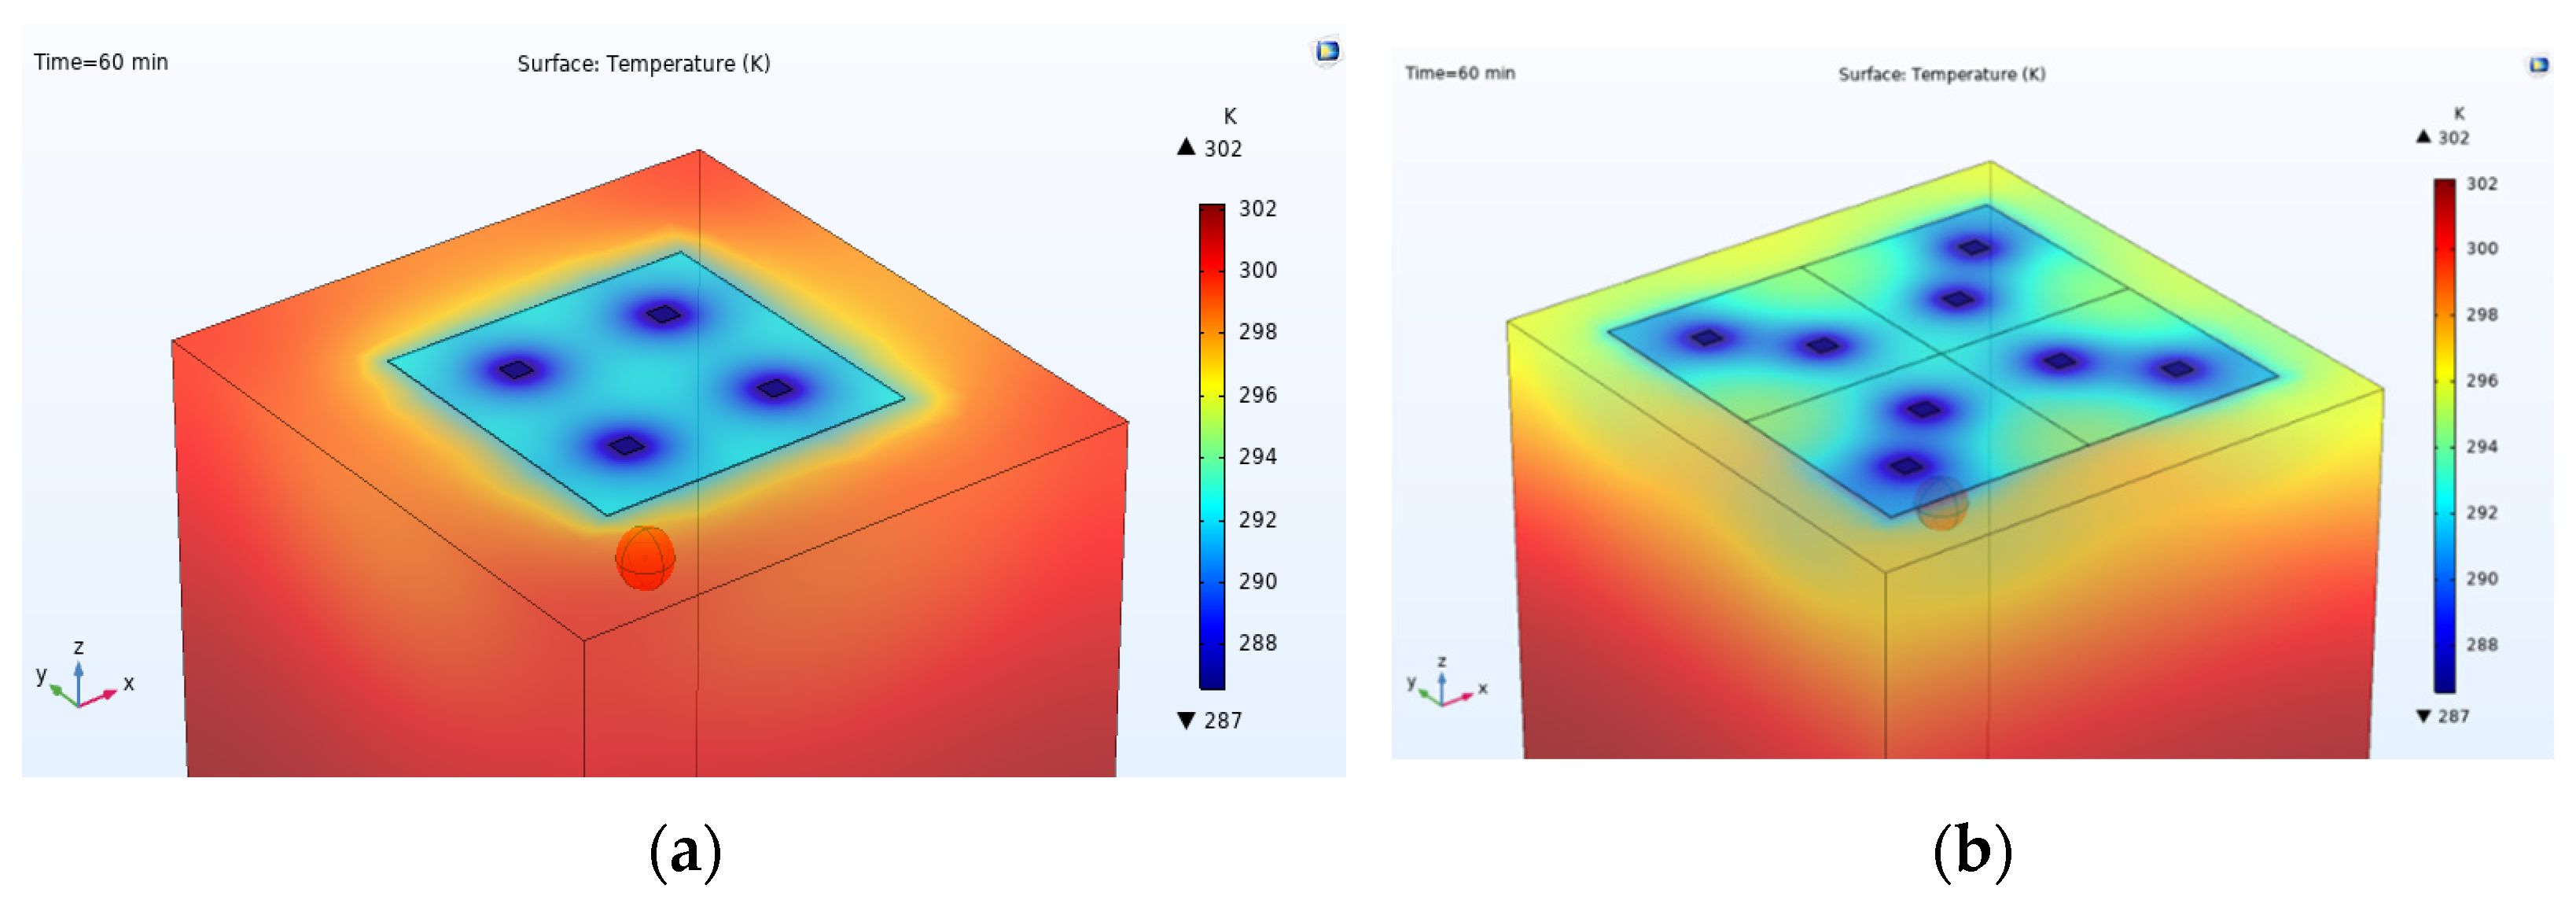
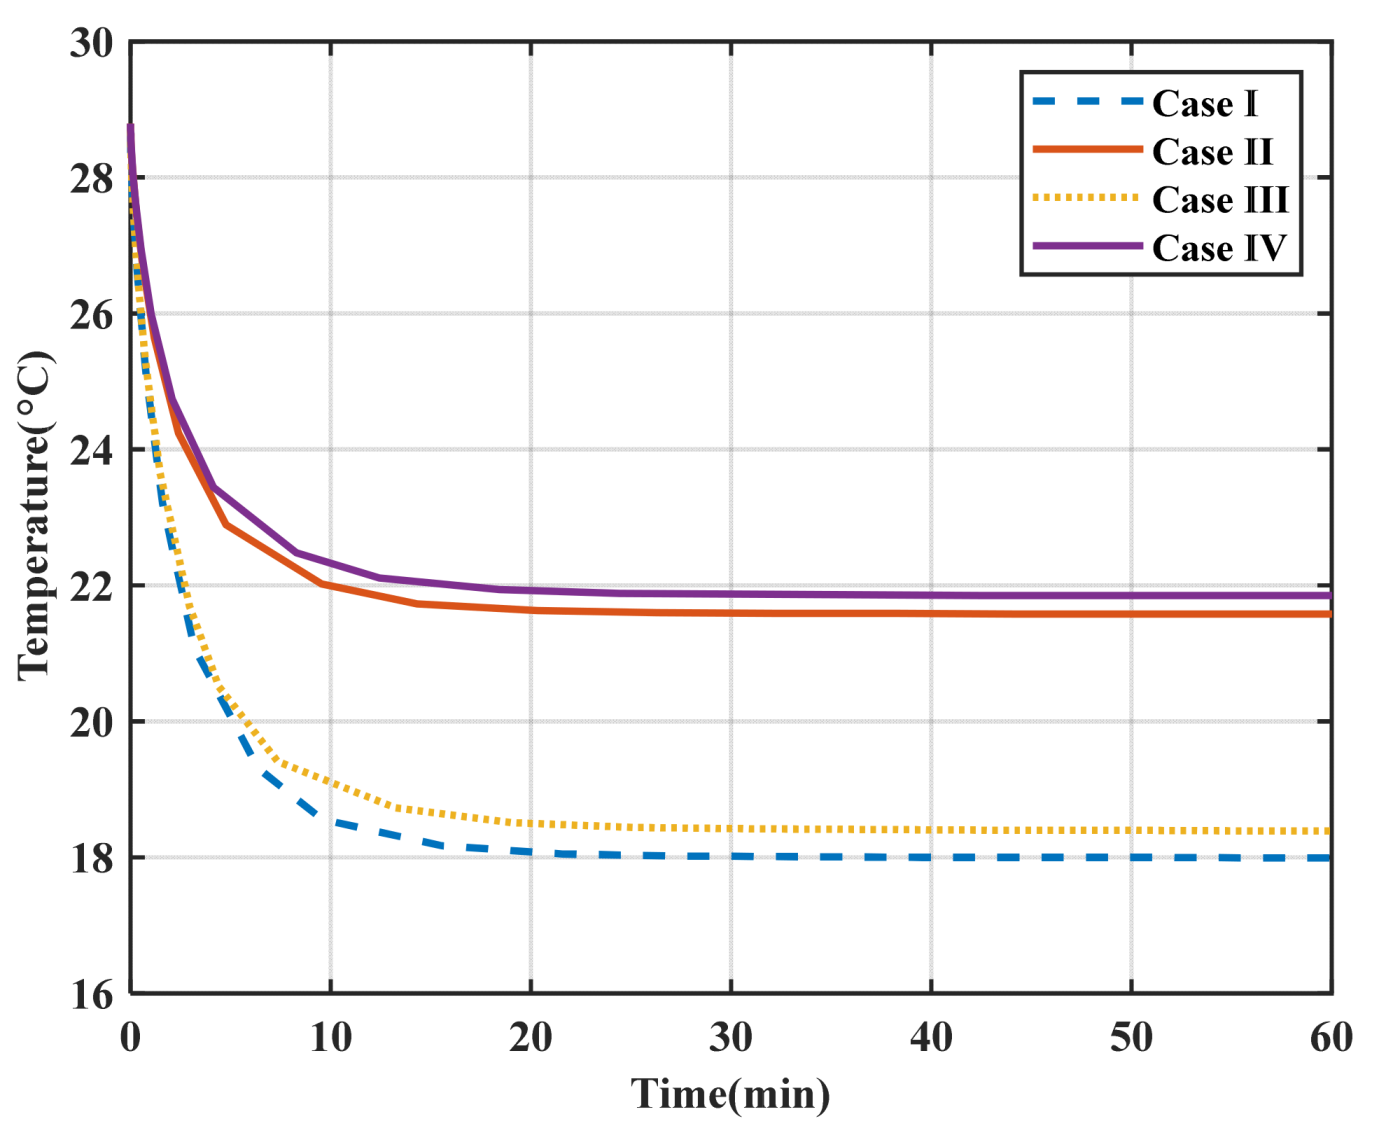
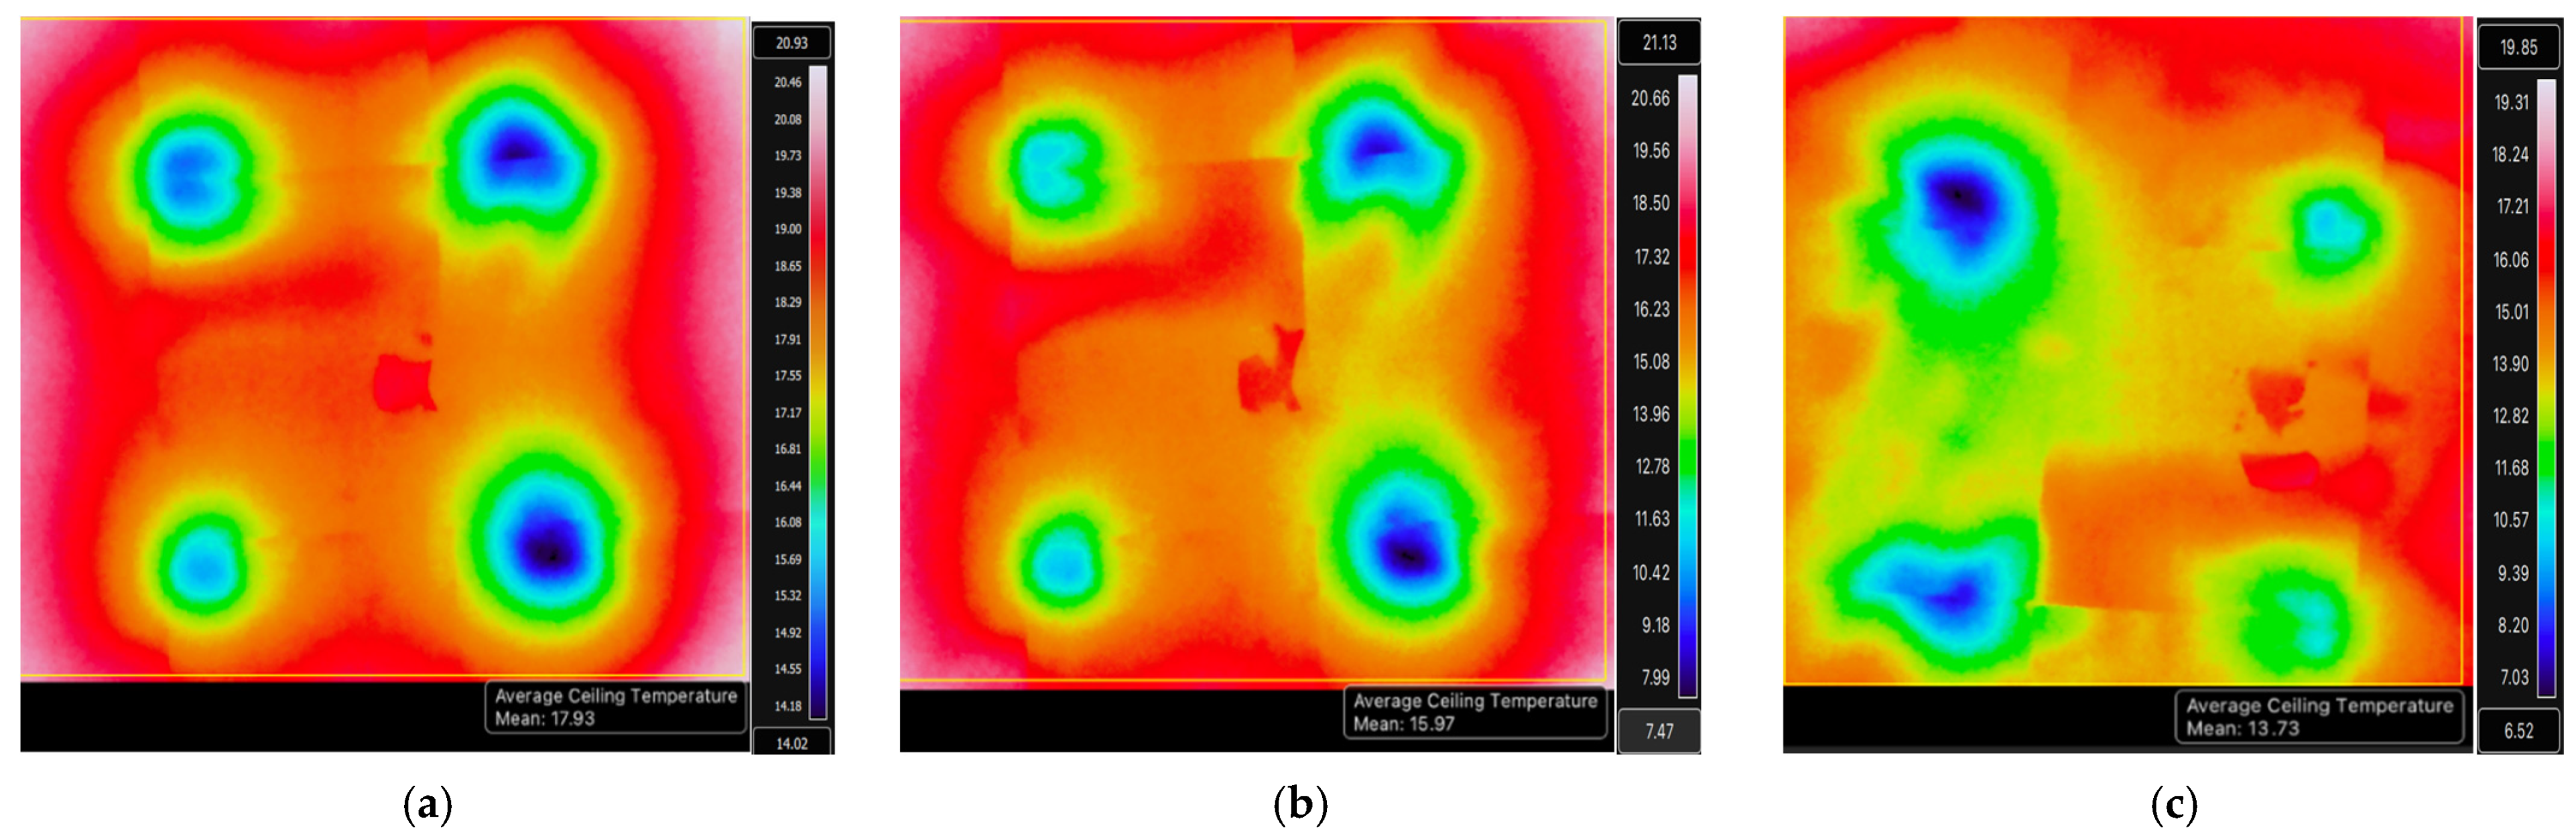
5.1. Parametric Study: Surface Temperature of the Ceiling Panel

For the first simulation, it is assumed that a small ceiling panel is used (four embedded TE modules). Two possible cold-side surface temperatures for the TE modules are considered: 13.5 °C and 18.5 °C. The recommended operating temperature range for radiant ceiling panels lies between 18 and 22 °C. Therefore, the TE module temperature is chosen in a manner that achieves this temperature range for the ceiling panel. The results of the simulation after 60 min are presented in Table 9. The average indoor air temperature is computed across all cases; notably, the average temperature of the ceiling panel (Trcc) for cases I and II are 18 °C and 21.6 °C, respectively. Note that cases I and II correspond to Tc = 13.5 °C and Tc = 18.5 °C, respectively. Moreover, the mean air temperature inside the chamber is calculated for each of these cases after 60 min as 27.8 °C and 28.2 °C, respectively.
For cases III and IV, where Tc = 13.5 °C and Tc = 18.5 °C, the Trcc values are determined to be 18.4 °C and 21.85 °C, respectively. The average air temperature inside the test chamber in these scenarios is computed as 27.23 °C and 27.81 °C.
The predicted mean vote (PMV), as well as the predicted percentage of the dissatisfied (PPD), are found for each case, and the results are presented in Table 10. The analysis reveals that none of these cases meet the criteria for achieving thermal comfort conditions.
Chiang et al. [21] reported comparable findings for a TE-based ceiling cooling system with free convection. In their study, they investigated the average indoor temperature across different ceiling temperatures for both occupied and unoccupied conditions. Their setup included a 10.14 m × 7.6 m ceiling fitted with forty-four radiant ceiling panels, each measuring 0.6 m × 1.2 m. Their research results indicated that achieving thermal comfort was not feasible with the system configuration alone. Nonetheless, they demonstrated that the radiant ceiling temperature of 18 °C came closer to the upper limit of thermal comfort. The results of the present study align well with the findings from the numerical investigation by Chiang et al. [21].
Figure 3a displays the temperature distribution inside the test chamber one hour after the start of the operation. Significant temperature variations can be observed vertically. Air closer to the ceiling reached lower temperatures, while the temperatures increased at larger distances from the ceiling. The absence of a continuous inflow or outflow of air constrains the airflow within the chamber to natural circulation driven by buoyancy forces.

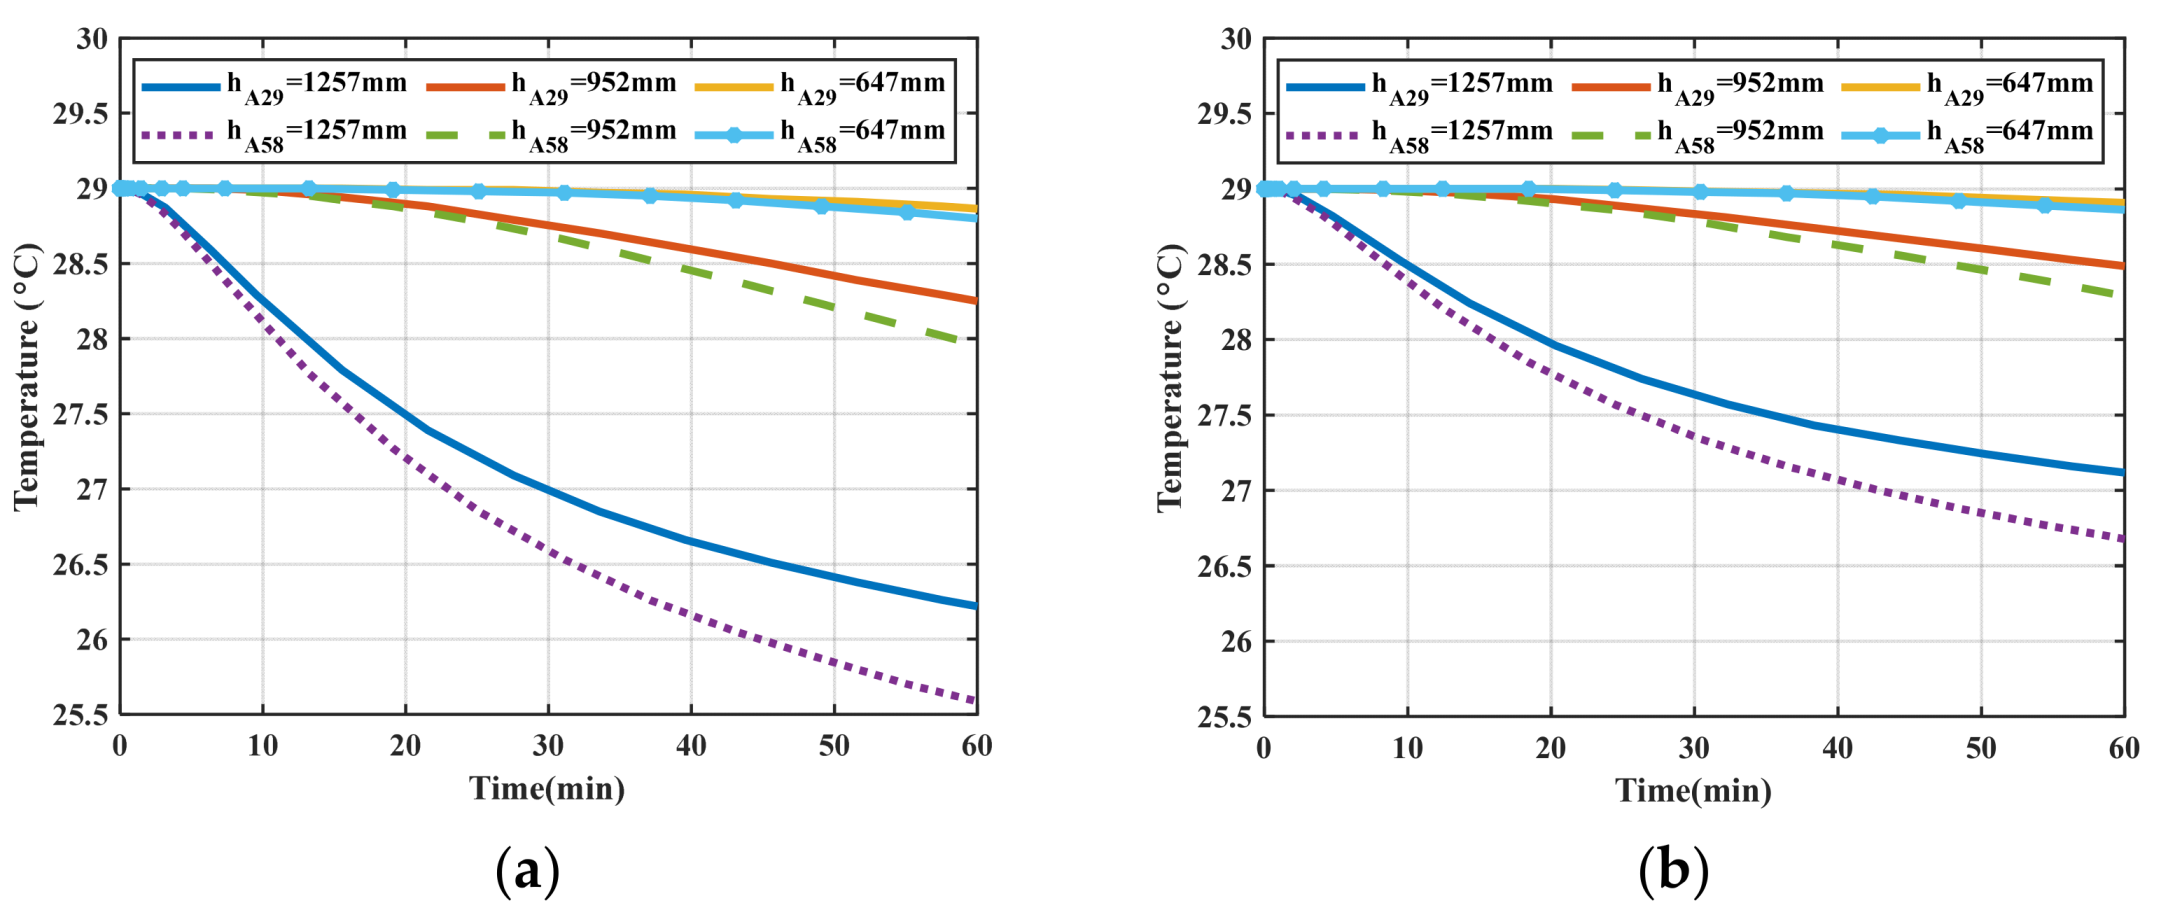
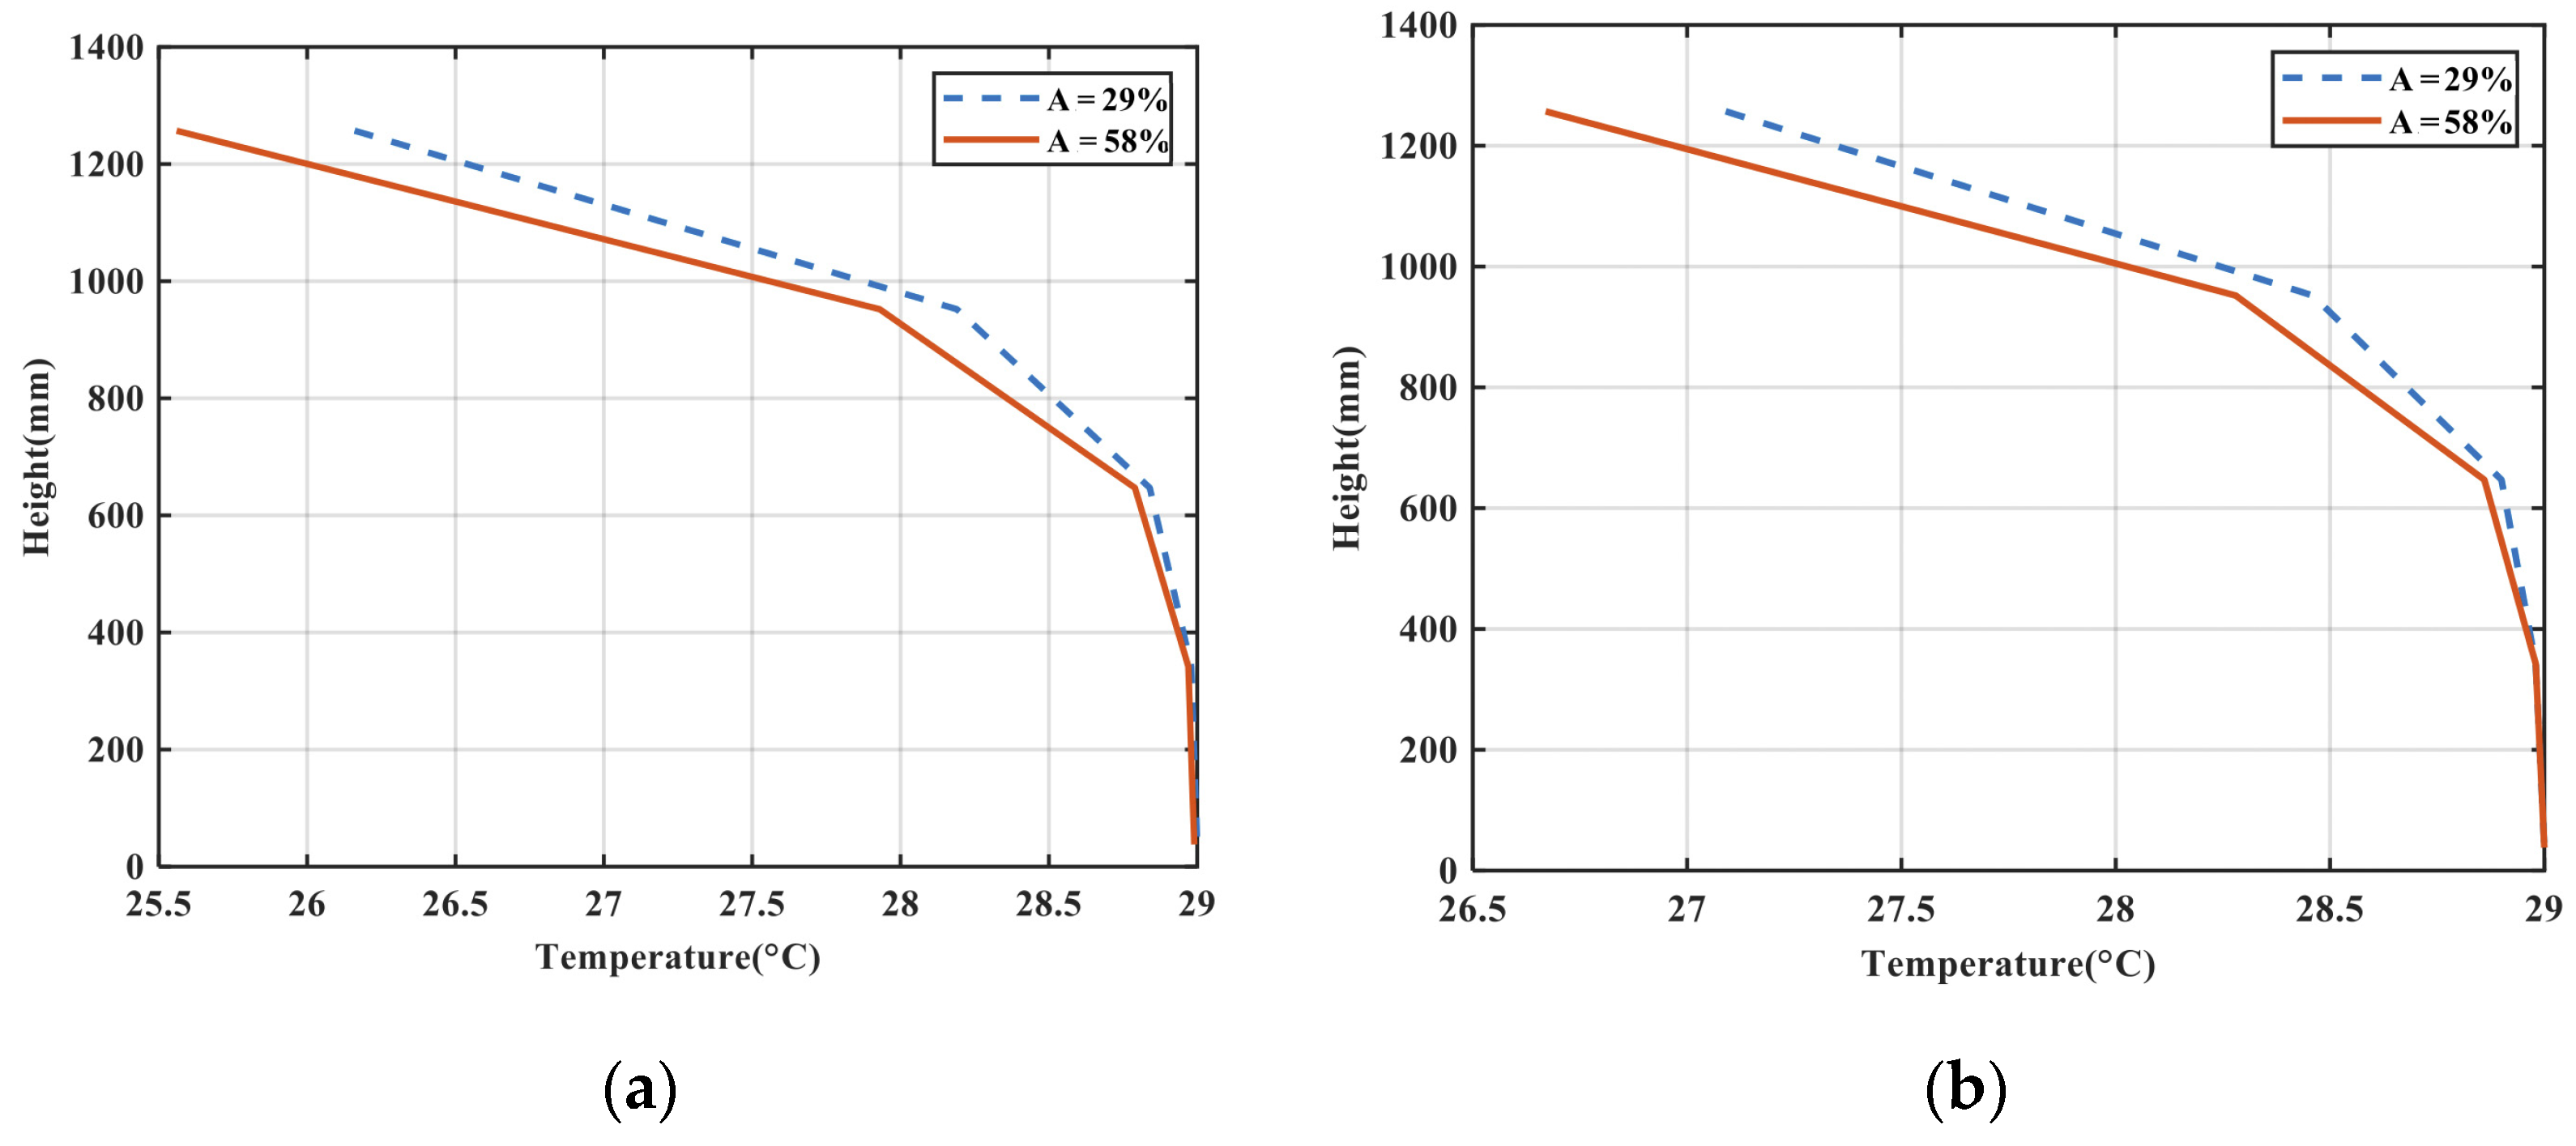
5.2. Parametric Study: Surace Area of the Ceiling Panel

To explore the possibility of achieving thermal comfort levels, the impact of increasing the radiant panel area was examined. The first case involves a radiant cooling panel with four TE modules and covers 29% of the ceiling area. For the second case, the surface area of the panel was expanded to cover 58% of the ceiling area, and the number of TE modules increased to eight. Previous research demonstrated that four TE modules could provide a uniform temperature distribution for a 0.6 m × 0.6 m panel and effectively lower the ceiling temperature.
When the size of the radiant panel is doubled, Tc must be set at 10 °C in order to achieve the desired ceiling temperature of 18 °C. As a result, a larger temperature gradient across a TE module is observed, which leads to a smaller COP value. Consequently, using four TE modules for a doubled-size panel would require more power per unit of the cooling effect produced by the panel. Therefore, it is decided to use eight TE modules for the larger ceiling panel (Figure 3b). Despite an increased panel surface area resulting in a cooler air temperature close to the ceiling, the average air temperature within the chamber only decreased by 0.5 °C compared to the smaller panel size (as listed in Table 9).
Figure 4 illustrates the change in the ceiling panel temperature with time for the four cases that were studied. In each case, the ceiling panel’s temperature achieves a steady-state condition within 15 min. For each setpoint for the TE temperature, the decrease in temperature resulting from expanding the panel’s surface area is smaller than one degree. Given the size of the chamber and the panel, that result is expected. Comparable findings were also observed by Chiang et al. [21].
It is observed that for each ceiling panel size (29% or 58% ceiling area coverage), increasing the TE temperature setpoint from 13.5 °C to 18.5 °C leads to a ceiling panel temperature rise of 4 degrees. This is expected since constant temperature boundary conditions were considered for both cases pertaining to each setpoint.
Figure 5 demonstrates the temperature changes for different heights in the test chamber. Note that all height measures are referenced from the floor. At a height of 1257 mm and with the small ceiling panel (29% coverage), the air temperature reached 26.25 °C and 27.25 °C with Tc of 13.5 °C and 18.5 °C, respectively. When the larger ceiling panel is simulated, for each TE temperature setpoint, the magnitude of temperature drop compared to the small-sized panel becomes significant at distances near the ceiling and becomes very small at larger distances. This implies that a seated person might perceive little to no temperature distinction at knee level (647 mm from the floor), while there could be a subtle temperature difference noticed at neck level (1257 mm from the floor) as the panel area increases.
Regardless of the TE temperature and the ceiling panel coverage area, the air temperature at the knee and feet levels remained constant in all cases. However, the air temperature close to the ceiling (1257 mm from the floor) gradually decreased over time.
Figure 6 illustrates the vertical temperature distribution inside the test chamber for two distinctive panel temperatures. Once more, the figure indicates that a seated occupant would experience a cooler sensation in the head zone (attributed to the proximity to the ceiling panel) and a warmer sensation in the feet zone. The range of heights considered spans from 38 mm (minimum) to 1257 mm (maximum). The temperature readings corresponding to the least heights for all four cases are determined. At the largest height, the temperature values are found to be 26.15 °C, 27.05 °C, 25.55 °C, and 26.65 °C for cases 1, 2, 3 and 4, respectively. This indicates that the lowest temperature is achieved closest to the ceiling when the larger ceiling panel operates at a temperature of Tc = 13.5 °C.
In a study by Chiang et al. [20], it was demonstrated that in an office space without supplied air with a radiant panel surface temperature of 18 °C, the vertical air temperature distribution ranged from 30.5 °C near the feet zone to 32.5 °C near the ceiling (located at a height of 2.9 m). This occurred when a configuration of forty-four cooling panels with 41.68% ceiling coverage was employed in a room of 0.14 m (length) × 7.6 m (width) × 2.9 m (height).
In this study, following a 60 min operational period with a ceiling temperature of 18 °C (where Tc = 13.5˚C) and a ceiling coverage of 58%, the maximum vertical temperature gradient between the ceiling to the ground is found to be 2.65 °C. This result is notably consistent with the findings reported in [21].

5.3. Thermal Comfort Assessment
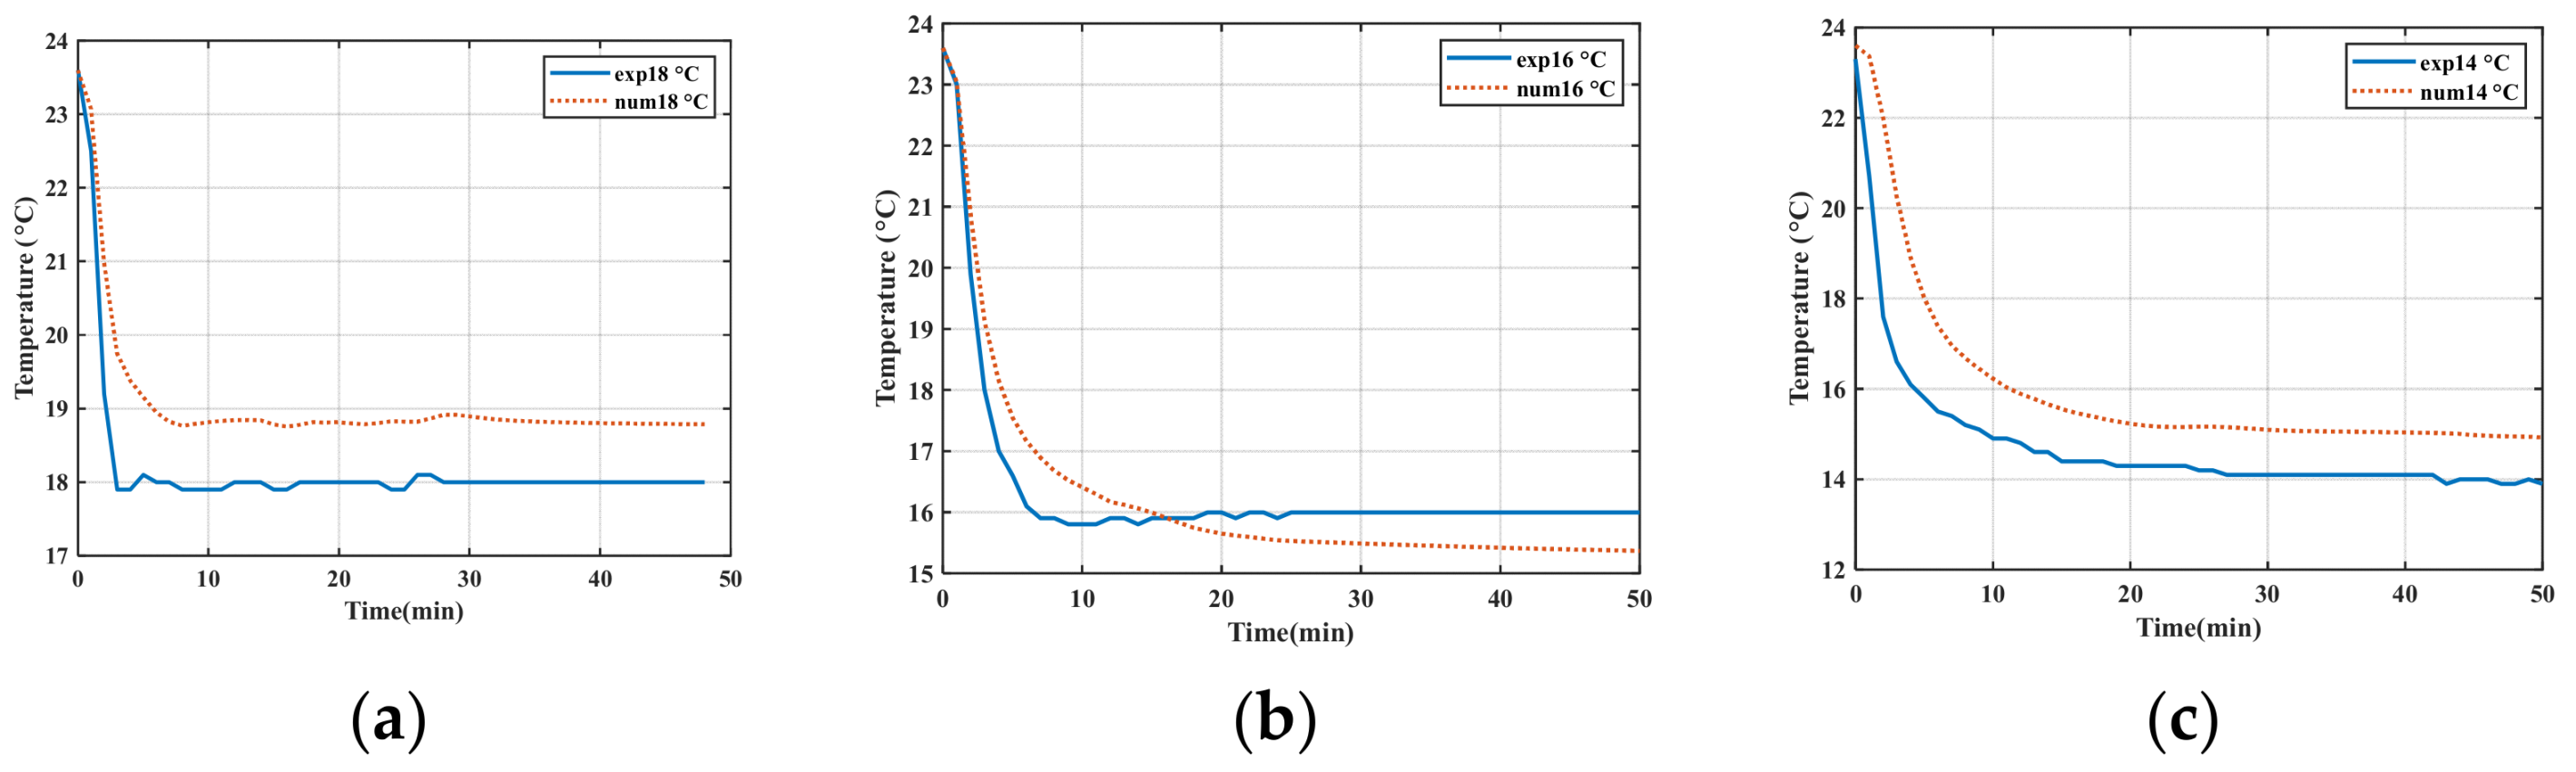
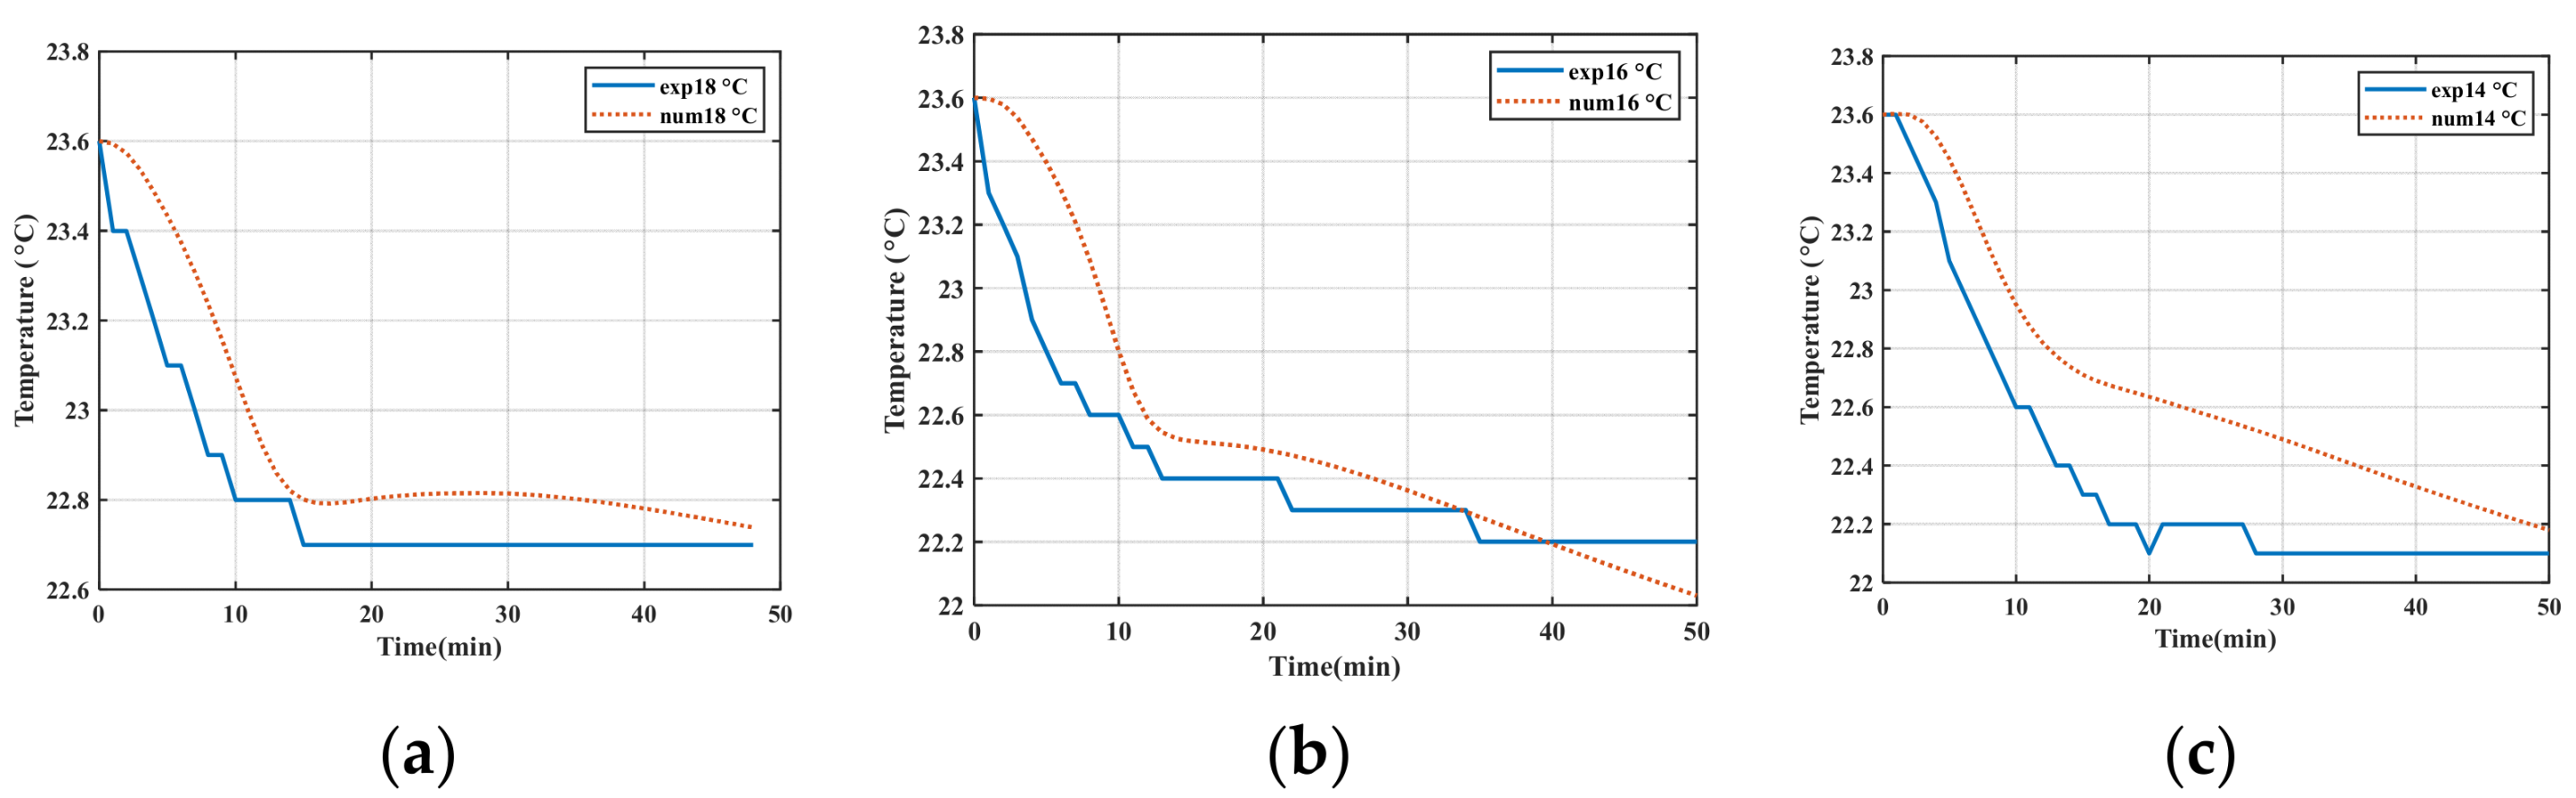
The temperature data acquired through COMSOL enables the evaluation of thermal comfort using the psychrometric chart [54]. The mean radiant temperature (Tmrt) is determined as follows:
T m r t 4 = T g 4 + C u ¯ 0.5 T g T a i r
where Tg is the globe temperature, C is constant 0.247 × 10⁹, u represents the mean air velocity (0.01 m/s), and Tair denotes the air temperature inside the chamber.
The operative temperature measures the thermal comfort in a built environment. It can be evaluated using mean radiant temperature and dry bulb temperature values.
T o p r = T m r t + T a i r 2
In this study, a relative humidity of 50%, a metabolic rate of 1 met (~104 W), and a clothing level of 0.6 are considered. Table 10 presents the results of the thermal comfort analysis, showing the PMV and PPD data evaluated using the CBE Thermal Comfort Tool [54] at three different heights. The local Topr is calculated according to the air temperature and the GT thermocouple’s (TCP) temperature at each specific height.
When the radiant panel operates at 18 °C (Tc = 13.5 °C), which covers 58% of the ceiling area, good thermal comfort can be achieved at the neck zone, as indicated by a PMV of 0.32 and PPD of 7%. The thermal sensation vote for such a case is neutral. For the case with the area coverage of 29%, a PMV of 0.5 is achieved, which shows that the operative temperature at the height of 1257 mm falls on the upper boundary of the thermal comfort zone.
The findings demonstrate that when the radiant panel operates at 21.6 °C (Tc = 18.5 °C), achieving thermal comfort becomes challenging across various heights and panel coverage scenarios. The perceived thermal sensation in this case leans slightly warm. It is worth noting that appropriate adjustments in supply air velocity and temperature could potentially result in more effective and uniform cooling. However, high air speed or too high/low air temperature could cause dissatisfaction.
Kitagawa et al. [40] studied the thermal comfort of seated occupants within a chamber measuring 4 m × 4 m × 2.5 m. A horizontal radiant panel (1.6 m × 2 m) was attached at the center of the room and located 1.8 m from the floor, just above the subject’s head. To enhance the view factor, two additional radiant panels (0.9 m × 2 m) were attached along the length of the horizontal panel. All panels were coated in black, and their surface temperatures were controlled through water circulation. The study revealed that a seated person’s thermal comfort could be improved with slight air movement under natural conditions, reaching a PMV of 0.5°.

6. Model Validation

Table 11 presents the variation of the ceiling panel temperature and the corresponding indoor air temperature, where E1, E2, and E3 refer to the experimental tests, and tests N1, N2, and N3 refer to the numerical studies conducted using COMSOL Multiphysics.
Following a 50 min operational period, for Trcc set at 18 °C, the average air temperature inside the test chamber reached 23.1 °C (E1), while in the numerical study, the average air temperature reached 21.24 °C (N1). In tests E2 and E3 with Trcc of 16 °C and 14 °C, Tair,avg was about 23.2 °C and 22.7 °C, while in tests N2 and N3, Tair,avg was calculated to be 19.13 °C and, 19.34 °C, respectively. It can be seen that the temperature difference between the experimental and numerical models was less than one degree in all tests.
Figure 7 displays an example of temperature distribution on the surface of the ceiling panel captured by an infrared thermal camera when the system reaches the steady-state condition. In tests, E1, E2, and E3, using a thermal camera, the average surface temperatures of the ceiling panel were measured to be 17.93 °C, 15.97 °C, and 13.73 °C, respectively. The average surface temperatures for the computational models for tests N1, N2, and N3 were estimated to be 17.88 °C, 15.2 °C, and 14.96 °C, respectively. In addition, the panel surface temperature closer to the edges was marginally warmer than the areas near the TE modules. It should be noted that the small circular area close to the center of the panel, as seen in Figure 7, is the thermocouple that is attached to the bottom surface of the panel.
The temperature variation at the center of the radiant ceiling panel in all three setpoint tests is shown in Figure 8. The temperatures are very comparable to the temperature measured by the thermal camera. In the numerical simulations, tests N1, N2, and N3 reached 18.78 °C, 15.37 °C, and 14.94 °C, respectively. Their time to reach a steady state was 20, 10, and less than 5 min, respectively. The discrepancy between surface temperatures between experimental and numerical results arises from several variables, including material properties, experimental measurement errors, ambient conditions, etc., as it pertains to TE modules and ceiling panel boundary conditions.
Furthermore, relative humidity was not defined in the numerical model, and the radiation in the participating media was neglected. Also, four heat sinks were placed on each TE module in the experiments to release the heat into the environment properly. In contrast, in the numerical simulation, the forced convection caused by air-cooled heat sinks was disregarded to reduce the computation time. Only a transient temperature boundary condition was used for the TE modules.
In all the experimental tests, the cooling system and the chamber’s MRT took an acceptable amount of time to reach a steady-state condition. Comparing these results with findings from other authors, it was evident that our systems performed well in terms of stabilization time. As anticipated, the MRT required a longer time to reach a steady state, averaging around 30 min. A study conducted by Lertsatitthanakorn et al. [26] is particularly relevant in this context. They built a chamber with dimensions of 1.5 × 1.5 × 2 m3 and installed a 50 × 50 cm2 ceiling panel comprising 36 TE modules. Their research revealed that in the cooling mode, the chamber took roughly 30 min to achieve a steady-state temperature of approximately 15 °C, while the ambient temperature remained around 20 °C. These findings align with our experiment’s results and provide additional support for the conclusion that our systems’ stabilization time falls within an acceptable range.
The transient variation of temperature at the closest position to the ceiling (1257 mm height) for experimental and numerical models is presented in Figure 9. In the experimental study, after 50 min of operation, the air temperature reached around 22.7 °C, 22.2 °C, and 22.1 °C for all three tests, respectively. This difference might have been caused by the small temperature difference between the set point temperatures of the cooling panels. In the numerical models, the air temperature declined by about 1 °C when the ceiling panel temperature reduced from 18 °C to 14 °C. Also, in some tests, steady-state conditions occurred earlier, which is possibly due to the errors involved in experimental measurements.
The thermal comfort of all experimental tests has been investigated. For instance, when Trcc is at 14 °C, the operative temperature (Topr) and PMV reach about 22.53 °C and −0.99, respectively. As a result, the thermal sensation is slightly cool, which occurred on the psychrometric chart’s left side of the thermal comfort zone.
The experiments were performed in a conditioned room where the operative temperature was initially about 24 °C in all tests, which led to a PMV of −0.47 with the neutral thermal sensation that complies with ASHRAE Standard 55; therefore, before performing the experiments, the room temperature was already conditioned, and the thermal comfort condition was provided for the occupant.
While complete thermal comfort was not attained, the success of the experiment lies in its ability to validate the simulation models created to understand the performance of the radiant cooling system, rather than focusing solely on occupant comfort. The radiant ceiling panel demonstrated effective operation in reducing both ceiling and air temperatures, resulting in a modest cooling effect within the room. This study provides further insights into the performance of thermoelectric-based cooling systems from a thermal comfort perspective, in addition to the previous studies on energy and economic analysis [55]. Further studies are desired to explore other advanced modeling strategies as well as various performance improvement strategies to accomplish optimal performance.

7. Conclusions

In this study, a numerical model of a thermoelectric (TE)-based radiant cooling system integrated into a ceiling panel is developed in COMSOL Multiphysics. Through a parametric analysis, this study examines how variations in ceiling panel size, the number of TE modules, and the temperature of these TE modules impact the transient temperature variation within the room. Four scenarios are considered for simulation, and the corresponding thermal comfort conditions for each scenario are assessed after the system reaches its steady-state conditions. Two of the scenarios that correspond to a 29% ceiling area coverage with four thermoelectric modules operating at 13.5 °C and 18 °C are validated using a custom-built thermal chamber in a lab environment. The key findings of this study can be summarized as follows:
  • Reducing the cold-side temperature of the thermoelectric modules from 18.5 °C to 13.5 °C resulted in a 4 °C decline in the average temperature of the ceiling panel. Additionally, this change is followed by a reduction in air temperature inside the test chamber at positions close to the ceiling;
  • For a larger-sized ceiling panel (covering 58% of the ceiling area), a temperature reduction of 0.5 °C is accomplished at positions close to the ceiling, irrespective of TC value. This temperature difference is smaller for positions at higher distances from the ceiling;
  • In the absence of any external forces and input/output airflow (free convection), the average air temperature in the room cannot reach the thermal comfort condition. Further study is needed to consider the airflow exchange in the conditioned space and how it may impact the system’s performance for achieving thermal comfort;
  • The local thermal comfort was achieved at 1257 mm when the cold-side TE temperature was set at 13.5 °C and the large-size ceiling panel was in use, covering 58% of the ceiling. It was demonstrated that although case III is the optimum condition, it is possible to approach the comfort condition for case I with a PMV of 0.5 and a PDD of 10%;
  • The experiments could successfully verify the numerical model by lowering the ceiling and room temperature to about 2 degrees at a height of 1257 mm;
  • The test results are also a basis for future studies on thermoelectric-based cooling systems as alternatives to traditional cooling technologies.
Thermoelectric cooling systems offer major advantages, such as controllability and modular design. There is no need for refrigerants, and, therefore, no potential for global warming or ozone depletion, and no need for major moving parts. However, the low value of the figure of merit and, as a result, relatively small coefficient of performance, higher initial cost, and challenges in switching the mode of operation between heating and cooling, must be explored and addressed in order to further use this technology as a promising alternative for conventional cooling and air conditioning systems. Future studies may include assessing the effect of adding forced convection on the resulting thermal comfort from the system. Furthermore, other aspects, including the need for dehumidification and ventilation, should be explored in detail to better understand the requirements associated with thermoelectric-based cooling systems.

Author Contributions

Formal analysis, writing—original draft preparation, B.K. and M.S.; Experiment, validation, B.K.; Conceptualization, methodology, investigation, writing—review and editing, H.N.; All authors have read and agreed to the published version of the manuscript.

Funding

The experimental apparatus used for the validation study was built through the ASHRAE Undergraduate Equipment Grant (2019–2020).

Data Availability Statement

The data produced in this study can be accessed by sending requests to the corresponding author.

Conflicts of Interest

The authors declare no conflict of interest.

Nomenclature

S2SSurface to surface
AArea (m2)
A29Radiant ceiling with 29% area coverage
A58Radiant ceiling with 58% area coverage
BCBoundary Condition
CpSpecific heat capacity (J/kg.k)
IInput current (a)
eEmissive power (W)
FVolume force vector (N)
GIrradiation (W/m2)
GTGlobe thermometer
gGravitational acceleration (m/s2)
JRadiosity (W)
kThermal conductivity (W/m.K)
NNumber of TE modules
PPressure (Pa)
QHeat transfer (W)
RThermal resistance (K/W)
TTemperature (K)
TCPThermocouple
uVelocity (m/s)
VVoltage (v)
Subscript
ambAmbient
adAdditional
bBlack body
cCold side
condConduction
dDiffuse surfaces
extExternal
hHot side
mMutual radiant exchange
mrtMean radiant temperature (K)
oprOperative temperature (°C)
PPressure
radRadiation
rccRadiant cooling ceiling
transTranslational motion
TEThermoelectric
tedThermoelastic
Greek
ɛEmissivity
Gradient
σStephan Boltzmann constant (5.6703 × 10⁻⁸ W/m2K4)
ρDensity (Kg/M3)
τViscous stress tensor

References

  1. Fong, K.; Chow, T.; Lee, C.; Lin, Z.; Chan, L. Solar hybrid cooling system for high-tech offices in subtropical climate—Radiant cooling by absorption refrigeration and desiccant dehumidification. Energy Convers. Manag. 2011, 52, 2883–2894. [Google Scholar] [CrossRef]
  2. Pacheco, R.; Ordóñez, J.; Martínez, G. Energy efficient design of building: A review. Renew. Sustain. Energy Rev. 2012, 16, 3559–3573. [Google Scholar] [CrossRef]
  3. Doiphode, G.; Najafi, H.; Migliori, M. Energy Efficiency Improvement in K-12 Schools: A Case Study in Florida. ASME J. Eng. Sustain. Build. Cities 2021, 2, 011001. [Google Scholar] [CrossRef]
  4. Kwame, A.B.; Troy, N.V.; Hamidreza, N. A Multi-Facet Retrofit Approach to Improve Energy Efficiency of Existing Class of Single-Family Residential Buildings in Hot-Humid Climate Zones. Energies 2020, 13, 1178. [Google Scholar] [CrossRef]
  5. Rochelle, D.; Najafi, H. A review of the effect of biodiesel on gas turbine emissions and performance. Renew. Sustain. Energy Rev. 2019, 105, 129–137. [Google Scholar] [CrossRef]
  6. Najafi, H. Evaluation of Alternative Cooling Techniques for Photovoltaic Panels. Ph.D. Thesis, University of Alabama, Tuscaloosa, AL, USA, 2012. [Google Scholar]
  7. U.S. Energy Information Administration (EIA). Frequently Asked Questions (FAQs). Available online: https://www.eia.gov/tools/faqs/faq.php?id=87&t=1 (accessed on 22 September 2023).
  8. Cao, X.; Dai, X.; Liu, J. Building energy-consumption status worldwide and the state-of-the-art technologies for zero-energy buildings during the past decade. Energy Build. 2016, 128, 198–213. [Google Scholar] [CrossRef]
  9. Seyednezhad, M.; Najafi, H. Energy and Economic Analysis of a Novel Hybrid Photovoltaic-Thermoelectric System for Building Cooling Applications. In Proceedings of the ASME International Mechanical Engineering Congress and Exposition (IMECE), Salt Lake City, UT, USA, 11–14 November 2020; Volume 6. [Google Scholar] [CrossRef]
  10. Ma, X.; Zhao, H.; Zhao, X.; Li, G.; Shittu, S. Building Integrated Thermoelectric Air Conditioners—A Potentially Fully Environmentally Friendly Solution in Building Services. Future Cities Environ. 2019, 5, 12. [Google Scholar] [CrossRef]
  11. Zuazua-Ros, A.; Martín-Gómez, C.; Ibañez-Puy, E.; Vidaurre-Arbizu, M.; Gelbstein, Y. Investigation of the thermoelectric potential for heating, cooling and ventilation in buildings: Characterization options and applications. Renew. Energy 2019, 131, 229–239. [Google Scholar] [CrossRef]
  12. Le Pierrès, N.; Cosnier, M.; Luo, L.; Fraisse, G. Coupling of thermoelectric modules with a photovoltaic panel for air pre-heating and pre-cooling application; an annual simulation. Int. J. Energy Res. 2008, 32, 1316–1328. [Google Scholar] [CrossRef]
  13. Liu, Z.; Zhang, L.; Gong, G.; Han, T. Experimental evaluation of an active solar thermoelectric radiant wall system. Energy Convers. Manag. 2015, 94, 253–260. [Google Scholar] [CrossRef]
  14. Irshad, K.; Habib, K.; Basrawi, F.; Saha, B.B. Study of a thermoelectric air duct system assisted by photovoltaic wall for space cooling in tropical climate. Energy 2017, 119, 504–522. [Google Scholar] [CrossRef]
  15. Luo, Y.; Zhang, L.; Liu, Z.; Yu, J.; Xu, X.; Su, X. Towards net zero energy building: The application potential and adaptability of photovoltaic-thermoelectric-battery wall system. Appl. Energy 2020, 258, 114066. [Google Scholar] [CrossRef]
  16. Liu, Z.; Zhang, L.; Gong, G.; Luo, Y.; Meng, F. Evaluation of a prototype active solar thermoelectric radiant wall system in winter conditions. Appl. Therm. Eng. 2015, 89, 36–43. [Google Scholar] [CrossRef]
  17. Xu, X.; Van Dessel, S. Evaluation of a prototype active building envelope window-system. Energy Build. 2008, 40, 168–174. [Google Scholar] [CrossRef]
  18. Lertsatitthanakorn, C.; Tipsaenprom, W.; Srisuwan, W.; Atthajariyakul, S. Study on the Cooling Performance and Thermal Comfort of a Thermoelectric Ceiling Cooling Panel System. Indoor Built Environ. 2008, 17, 525–534. [Google Scholar] [CrossRef]
  19. He, W.; Zhou, J.; Hou, J.; Chen, C.; Ji, J. Theoretical and experimental investigation on a thermoelectric cooling and heating system driven by solar. Appl. Energy 2013, 107, 89–97. [Google Scholar] [CrossRef]
  20. Liu, Z.; Zhang, L.; Gong, G. Experimental evaluation of a solar thermoelectric cooled ceiling combined with displacement ventilation system. Energy Convers. Manag. 2014, 87, 559–565. [Google Scholar] [CrossRef]
  21. Chiang, W.-H.; Wang, C.-Y.; Huang, J.-S. Evaluation of cooling ceiling and mechanical ventilation systems on thermal comfort using CFD study in an office for subtropical region. Build. Environ. 2012, 48, 113–127. [Google Scholar] [CrossRef]
  22. Loveday, D.; Parsons, K.; Taki, A.; Hodder, S. Displacement ventilation environments with chilled ceilings: Thermal comfort design within the context of the BS EN ISO7730 versus adaptive debate. Energy Build. 2002, 34, 573–579. [Google Scholar] [CrossRef]
  23. Niu, J.L.; Zuo, H.G.; Burnett, J. Simulation Methodoly of Radiant Cooling with Elevated Air Movement. 2001. Available online: https://www.aivc.org/resource/simulation-methodoly-radiant-cooling-elevated-air-movement (accessed on 23 September 2023).
  24. Gan, G. Numerical investigation of local thermal discomfort in offices with displacement ventilation. Energy Build. 1995, 23, 73–81. [Google Scholar] [CrossRef]
  25. Zhang, L.; Niu, J. Indoor humidity behaviors associated with decoupled cooling in hot and humid climates. Build. Environ. 2003, 38, 99–107. [Google Scholar] [CrossRef]
  26. Lertsatitthanakorn, C.; Srisuwan, W.; Atthajariyakul, S. Experimental performance of a thermoelectric ceiling cooling panel. Int. J. Energy Res. 2008, 32, 950–957. [Google Scholar] [CrossRef]
  27. Lertsatitthanakorn, C.; Wiset, L.; Atthajariyakul, S. Evaluation of the Thermal Comfort of a Thermoelectric Ceiling Cooling Panel (TE-CCP) System. J. Electron. Mater. 2009, 38, 1472–1477. [Google Scholar] [CrossRef]
  28. Shen, L.; Xiao, F.; Chen, H.; Wang, S. Investigation of a novel thermoelectric radiant air-conditioning system. Energy Build. 2013, 59, 123–132. [Google Scholar] [CrossRef]
  29. Lim, H.; Kang, Y.-K.; Jeong, J.-W. Application of a phase change material to a thermoelectric ceiling radiant cooling panel as a heat storage layer. J. Build. Eng. 2020, 32, 101787. [Google Scholar] [CrossRef]
  30. Bhargava, A.; Najafi, H. Photovoltaic-Thermoelectric Systems for Building Cooling Applications: A Preliminary Study. In Proceedings of the ASME 2016 International Mechanical Engineering Congress and Exposition, Phoenix, AZ, USA, 11–17 November 2016; Volume 6b, p. V06BT08A011. [Google Scholar] [CrossRef]
  31. Lim, H.; Kang, Y.-K.; Jeong, J.-W. Development of empirical models to predict cooling performance of a thermoelectric radiant panel. Energy Build. 2019, 202, 109387. [Google Scholar] [CrossRef]
  32. Practical Applications of Radiant Heating and Cooling to Maintain Comfort Conditions (Conference). OSTI.GOV. Available online: https://www.osti.gov/biblio/392494 (accessed on 22 September 2023).
  33. Khatri, R.; Khare, V.R.; Kumar, H. Spatial distribution of air temperature and air flow analysis in radiant cooling system using CFD technique. Energy Rep. 2020, 6, 268–275. [Google Scholar] [CrossRef]
  34. Imanari, T.; Omori, T.; Bogaki, K. Thermal comfort and energy consumption of the radiant ceiling panel system: Comparison with the conventional all-air system. Energy Build. 1999, 30, 167–175. [Google Scholar] [CrossRef]
  35. Catalina, T.; Virgone, J.; Martin, J.J. Evaluation of Performances, Thermal Comfort and Energy Consumption of a Reversible Radiant Ceiling by Capillary Mat: Application for the Prefabricated Buildings. 2006. Available online: https://www.aivc.org/resource/evaluation-performances-thermal-comfort-and-energy-consumption-reversible-radiant-ceiling (accessed on 22 September 2023).
  36. Catalina, T.; Virgone, J.; Kuznik, F. Evaluation of thermal comfort using combined CFD and experimentation study in a test room equipped with a cooling ceiling. Build. Environ. 2009, 44, 1740–1750. [Google Scholar] [CrossRef]
  37. ISO 7730:1984; Moderate Thermal Environments—Determination of the PMV and PPD Indices and Specification of the Conditions for Thermal Comfort. International Organization for Standardization: Geneva, Switzerland, 1984. Available online: https://www.iso.org/standard/14566.html (accessed on 22 September 2023).
  38. Nagano, K.; Mochida, T. Experiments on thermal environmental design of ceiling radiant cooling for supine human subjects. Build. Environ. 2004, 39, 267–275. [Google Scholar] [CrossRef]
  39. Hodder, S.; Loveday, D.; Parsons, K.; Taki, A. Thermal comfort in chilled ceiling and displacement ventilation environments: Vertical radiant temperature asymmetry effects. Energy Build. 1998, 27, 167–173. [Google Scholar] [CrossRef]
  40. Kitagawa, K.; Komoda, N.; Hayano, H.; Tanabe, S.-I. Effect of humidity and small air movement on thermal comfort under a radiant cooling ceiling by subjective experiments. Energy Build. 1999, 30, 185–193. [Google Scholar] [CrossRef]
  41. Carlucci, S.; Pagliano, L. A review of indices for the long-term evaluation of the general thermal comfort conditions in buildings. Energy Build. 2012, 53, 194–205. [Google Scholar] [CrossRef]
  42. Bartzanas, T.; Kittas, C.; Sapounas, A.; Nikita-Martzopoulou, C. Analysis of airflow through experimental rural buildings: Sensitivity to turbulence models. Biosyst. Eng. 2007, 97, 229–239. [Google Scholar] [CrossRef]
  43. Stamou, A.I.; Katsiris, I.; Schaelin, A. Evaluation of thermal comfort in Galatsi Arena of the Olympics “Athens 2004” using a CFD model. Appl. Therm. Eng. 2008, 28, 1206–1215. [Google Scholar] [CrossRef]
  44. Tye-Gingras, M.; Gosselin, L. Comfort and energy consumption of hydronic heating radiant ceilings and walls based on CFD analysis. Build. Environ. 2012, 54, 1–13. [Google Scholar] [CrossRef]
  45. Hussain, S.; Oosthuizen, P.H.; Kalendar, A. Evaluation of various turbulence models for the prediction of the airflow and temperature distributions in atria. Energy Build. 2012, 48, 18–28. [Google Scholar] [CrossRef]
  46. Corgnati, S.; Perino, M.; Fracastoro, G.; Nielsen, P. Experimental and numerical analysis of air and radiant cooling systems in offices. Build. Environ. 2009, 44, 801–806. [Google Scholar] [CrossRef]
  47. ASHRAE 55 Standard; Thermal Environmental Conditions for Human Occupancy. American Society of Heating, Refrigerating, and Air-Conditioning Engineers: Peachtree Corners, GA, USA, 2020.
  48. Teitelbaum, E.; Chen, K.W.; Meggers, F.; Guo, H.; Houchois, N.; Pantelic, J.; Rysanek, A. Globe thermometer free convection error potentials. Sci. Rep. 2020, 10, 2652. [Google Scholar] [CrossRef]
  49. Osterman, E.; Tyagi, V.; Butala, V.; Rahim, N.; Stritih, U. Review of PCM based cooling technologies for buildings. Energy Build. 2012, 49, 37–49. [Google Scholar] [CrossRef]
  50. Uyanna, O.; Najafi, H.; Rajendra, B. An inverse method for real-time estimation of aerothermal heating for thermal protection systems of space vehicles. Int. J. Heat Mass Transf. 2021, 177, 121482. [Google Scholar] [CrossRef]
  51. Introduction to COMSOL Multiphysics; COMSOL: Burlington, MA, USA, 2019.
  52. Seyednezhad, M.; Najafi, H.; Kubwimana, B. Numerical and Experimental Investigation of a Thermoelectric-Based Radiant Ceiling Panel with Phase Change Material for Building Cooling Applications. Sustainability 2021, 13, 11936. [Google Scholar] [CrossRef]
  53. Sadineni, S.B.; Madala, S.; Boehm, R.F. Passive building energy savings: A review of building envelope components. Renew. Sustain. Energy Rev. 2011, 15, 3617–3631. [Google Scholar] [CrossRef]
  54. Tartarini, F.; Schiavon, S.; Cheung, T.; Hoyt, T. CBE Thermal Comfort Tool: Online tool for thermal comfort calculations and visualizations. SoftwareX 2020, 12, 100563. [Google Scholar] [CrossRef]
  55. Seyednezhad, M.; Najafi, H. Solar-Powered Thermoelectric-Based Cooling and Heating System for Building Applications: A Parametric Study. Energies 2021, 14, 5573. [Google Scholar] [CrossRef]
Figure 1. (a) Schematic of the whole test chamber, (b) the top view of the design chamber.
Energies 16 06981 g001
Figure 2. Experimental apparatus of the test chamber.
Energies 16 06981 g002
Figure 3. Temperature distributions for two configurations: (a) Arcc = 29%, (b) Arcc = 58%.
Energies 16 06981 g003
Figure 4. Ceiling panel temperature for various TE temperatures and areas.
Energies 16 06981 g004
Figure 5. Variations of vertical and operative temperature distribution with time; (a) Tc = 13.5 °C, (b) Tc = 18.5 °C.
Energies 16 06981 g005
Figure 6. Vertical temperature distribution at different heights: (a) Tc = 13.5 °C, (b) Tc = 18.5 °C.
Energies 16 06981 g006
Figure 7. Infrared images of the radiant panel surface temperature distribution after 30 min of operation: (a) Trcc = 17.93 °C, (b) Trcc = 15.97 °C, (c) Trcc = 13.73 °C.
Energies 16 06981 g007
Figure 8. TE-based radiant ceiling panel bottom surface temperature at the center: (a) Trcc = 18 °C, (b) Trcc = 16 °C, (c) Trcc = 14 °C.
Energies 16 06981 g008
Figure 9. Comparing the globe temperature at a height of 1257 mm: (a) Trcc = 18 °C, (b) Trcc = 16 °C, (c) Trcc = 14 °C.
Energies 16 06981 g009
Table 1. Numerical simulation design criteria.
Case NumberPercentage of Area CoverageTc
I29%13.5 °C
II29%18.5 °C
III58%13.5 °C
IV58%18.5 °C
Table 2. The characteristics of the TE module.
Dimension (mm)40 × 40 × 3
VTE,max16.1 V
ITE,max8 A
ΔTTE,max71 K
Qmax80 W
Table 3. The characteristics of the test chamber, aluminum sheet, air, and GT.
Ceiling Panel (Aluminum)Globe
Thermometer: Shell (Copper)
Globe Thermometer: TCP (Copper)AirGlobe
Thermometer Shell (Brass *)
Dimension (mm)L = 600,
W = 600,
H = 2
Ri = 50
Ro = 49.6
Rt = 5L = 1156.97,
W = 1104.9,
H = 1562.1
Ri = 50
Ro = 49.6
Density (kg/m3)270089608960varying with temp.8530
Specific Heat,
Cp (J/kg.K)
904385385varying with temp.375
Thermal Conductivity, k (W/m.K)237400400varying with temp.109.0
Emissivity, ε0.950.950.950.950.90
* The brass shell is used in Section 6 for model validation.
Table 4. The initial and boundary conditions for numerical analysis; constituent physics: heat transfer in solids, S2S radiation, and laminar flow.
ComponentsInitial & Boundary Conditons
TE modulesIC: T = 29 °C
BC1: Constant temperature: Tc = 13.5 °C, and 18.5 °C
Aluminum sheet top sideIC: T = 29 °C
BC2: insulation (adiabatic)
Aluminum sheet backsideIC: T = 29 °C
BC3: S2S radiation-diffuse surface, ε = 0.95
Ceiling (areas not covered by TE-radiant panel)IC: T = 29 °C
BC2: insulation (adiabatic)
Air in the roomIC: T = 29 °C,
Walls & floorIC: T = 29 °C
BC2: insulation (adiabatic)
GT & TCPIC: T = 29 °C
BC3: S2S radiation-diffus surface, ε = 0.9
Table 5. Description of the measurement instrument.
CategoryAccuracy or Range
NTC Thermistor: MP-2996
MP-3193
15K ohms at 25 °C
Range: −20 °C to +100 °C
Temperature controller:
TC-48-20
Voltmax = 50 V
Imax = 20 A
Wet bulb globe thermometer (WBGT) data logger (87786 AZ)Accuracy: ±0.6 °C
Range: 0~50 °C
HOBO data loggerAccuracy: ±0.21 °C from 0° to 50 °C
Range: −20° to 70 °C
Thermal camera, FLIR A70Thermal sensitivity/NETD < 35 mK
Accuracy:
±2 °C or ±2% of reading, for ambient temperature 15–35 °C and object temperature above 0 °C (32 °F)
Table 6. Number and type of cases in the validation process.
Validation CaseTrcc (°C)Tc,avg (°C)
Experimental cases
E11817.93
E21615.97
E31413.73
Numerical cases
N11818.85
N21615.49
N31414.93
Table 7. Power supply parameters used in the experiment.
Validation Case #TrccI (A)Volt (V)P (W)
E118 °C1724408.3
E216 °C23.524564
E314 °C29.724712.8
Table 8. The experimental conditions.
ComponentsInitial and Boundary ConditionsComponentsInitial and Boundary Conditions
Room temperature (Tamb)Tinit = 23.6 °CAir in the roomIC: Tinit = 23.6 °C,
RH%Trcc = 18 °C; RH = ~47.9%
Trcc = 16 °C; RH = ~46.6%
Trcc = 14 °C; RH = ~47.9%
Aluminum sheet bottom surfaceIC: Tinit = 23.6 °C
BC3: S2S radiation—diffuse surface, ε = 0.95
BC4: free convection
(hal = 4 W/m2K, Tamb = 23.6 °C)
BC1: constant temperature:
Tc = 14 °C, 16 °C, and 18 °C
TE modulesIC: Tinit = 23.6 °C
BC3: S2S radiation—diffuse surface, ε = 0.9
BC4: forced convection
(hte = 20 W/m2K, Tamb = 23.6 °C)
Ceiling panel (areas not covered by the TE radiant panel)IC: Tinit = 23.6 °C
BC2: insulation (adiabatic)
Aluminum sheet top sideIC: Tinit = 23.6 °C
BC2: insulation (adiabatic)
GTIC: Tinit = 23.6 °C
BC3: S2S radiation—diffuse surface, ε = 0.99
Walls and floorIC: Tinit = 23.6 °C
BC2: insulation (adiabatic)
TCPIC: Tinit = 23.6 °C
BC3: S2S radiation—diffuse surface, ε = 0.99
Table 9. Average indoor air temperature inside the test chamber and the ceiling panel temperature after one hour of operation.
Case #Ceiling Area CoverageTc (°C)Trcc (°C)Average Indoor Air
Temperature (˚C)
I29%13.51827.8
II29%18.521.628.2
III58%13.518.427.23
IV58%18.521.8527.81
Table 10. Thermal comfort analysis.
Case NumberA (%) Tc (°C) H (mm) PMVPPD
I2913.512570.510%
9521.0428%
6471.2236%
II2918.512570.7918%
9521.1533%
6471.2538%
III5813.512570.327%
9520.9323%
6471.1533%
IV5818.512570.6514%
9521.0428%
6471.2236%
Table 11. The average indoor air temperature inside the test chamber and the corresponding radiant panel surface temperature for different test cases.
Validation CaseTrcc (°C)Tc,avg (°C)Tg,avg (°C)
Experimental Tests
E11823.122.81
E21623.222.42
E31422.722.67
Numerical Tests
N11821.2422.94
N21619.1322.55
N31419.3422.38
Disclaimer/Publisher’s Note: The statements, opinions and data contained in all publications are solely those of the individual author(s) and contributor(s) and not of MDPI and/or the editor(s). MDPI and/or the editor(s) disclaim responsibility for any injury to people or property resulting from any ideas, methods, instructions or products referred to in the content.

