1. Introduction
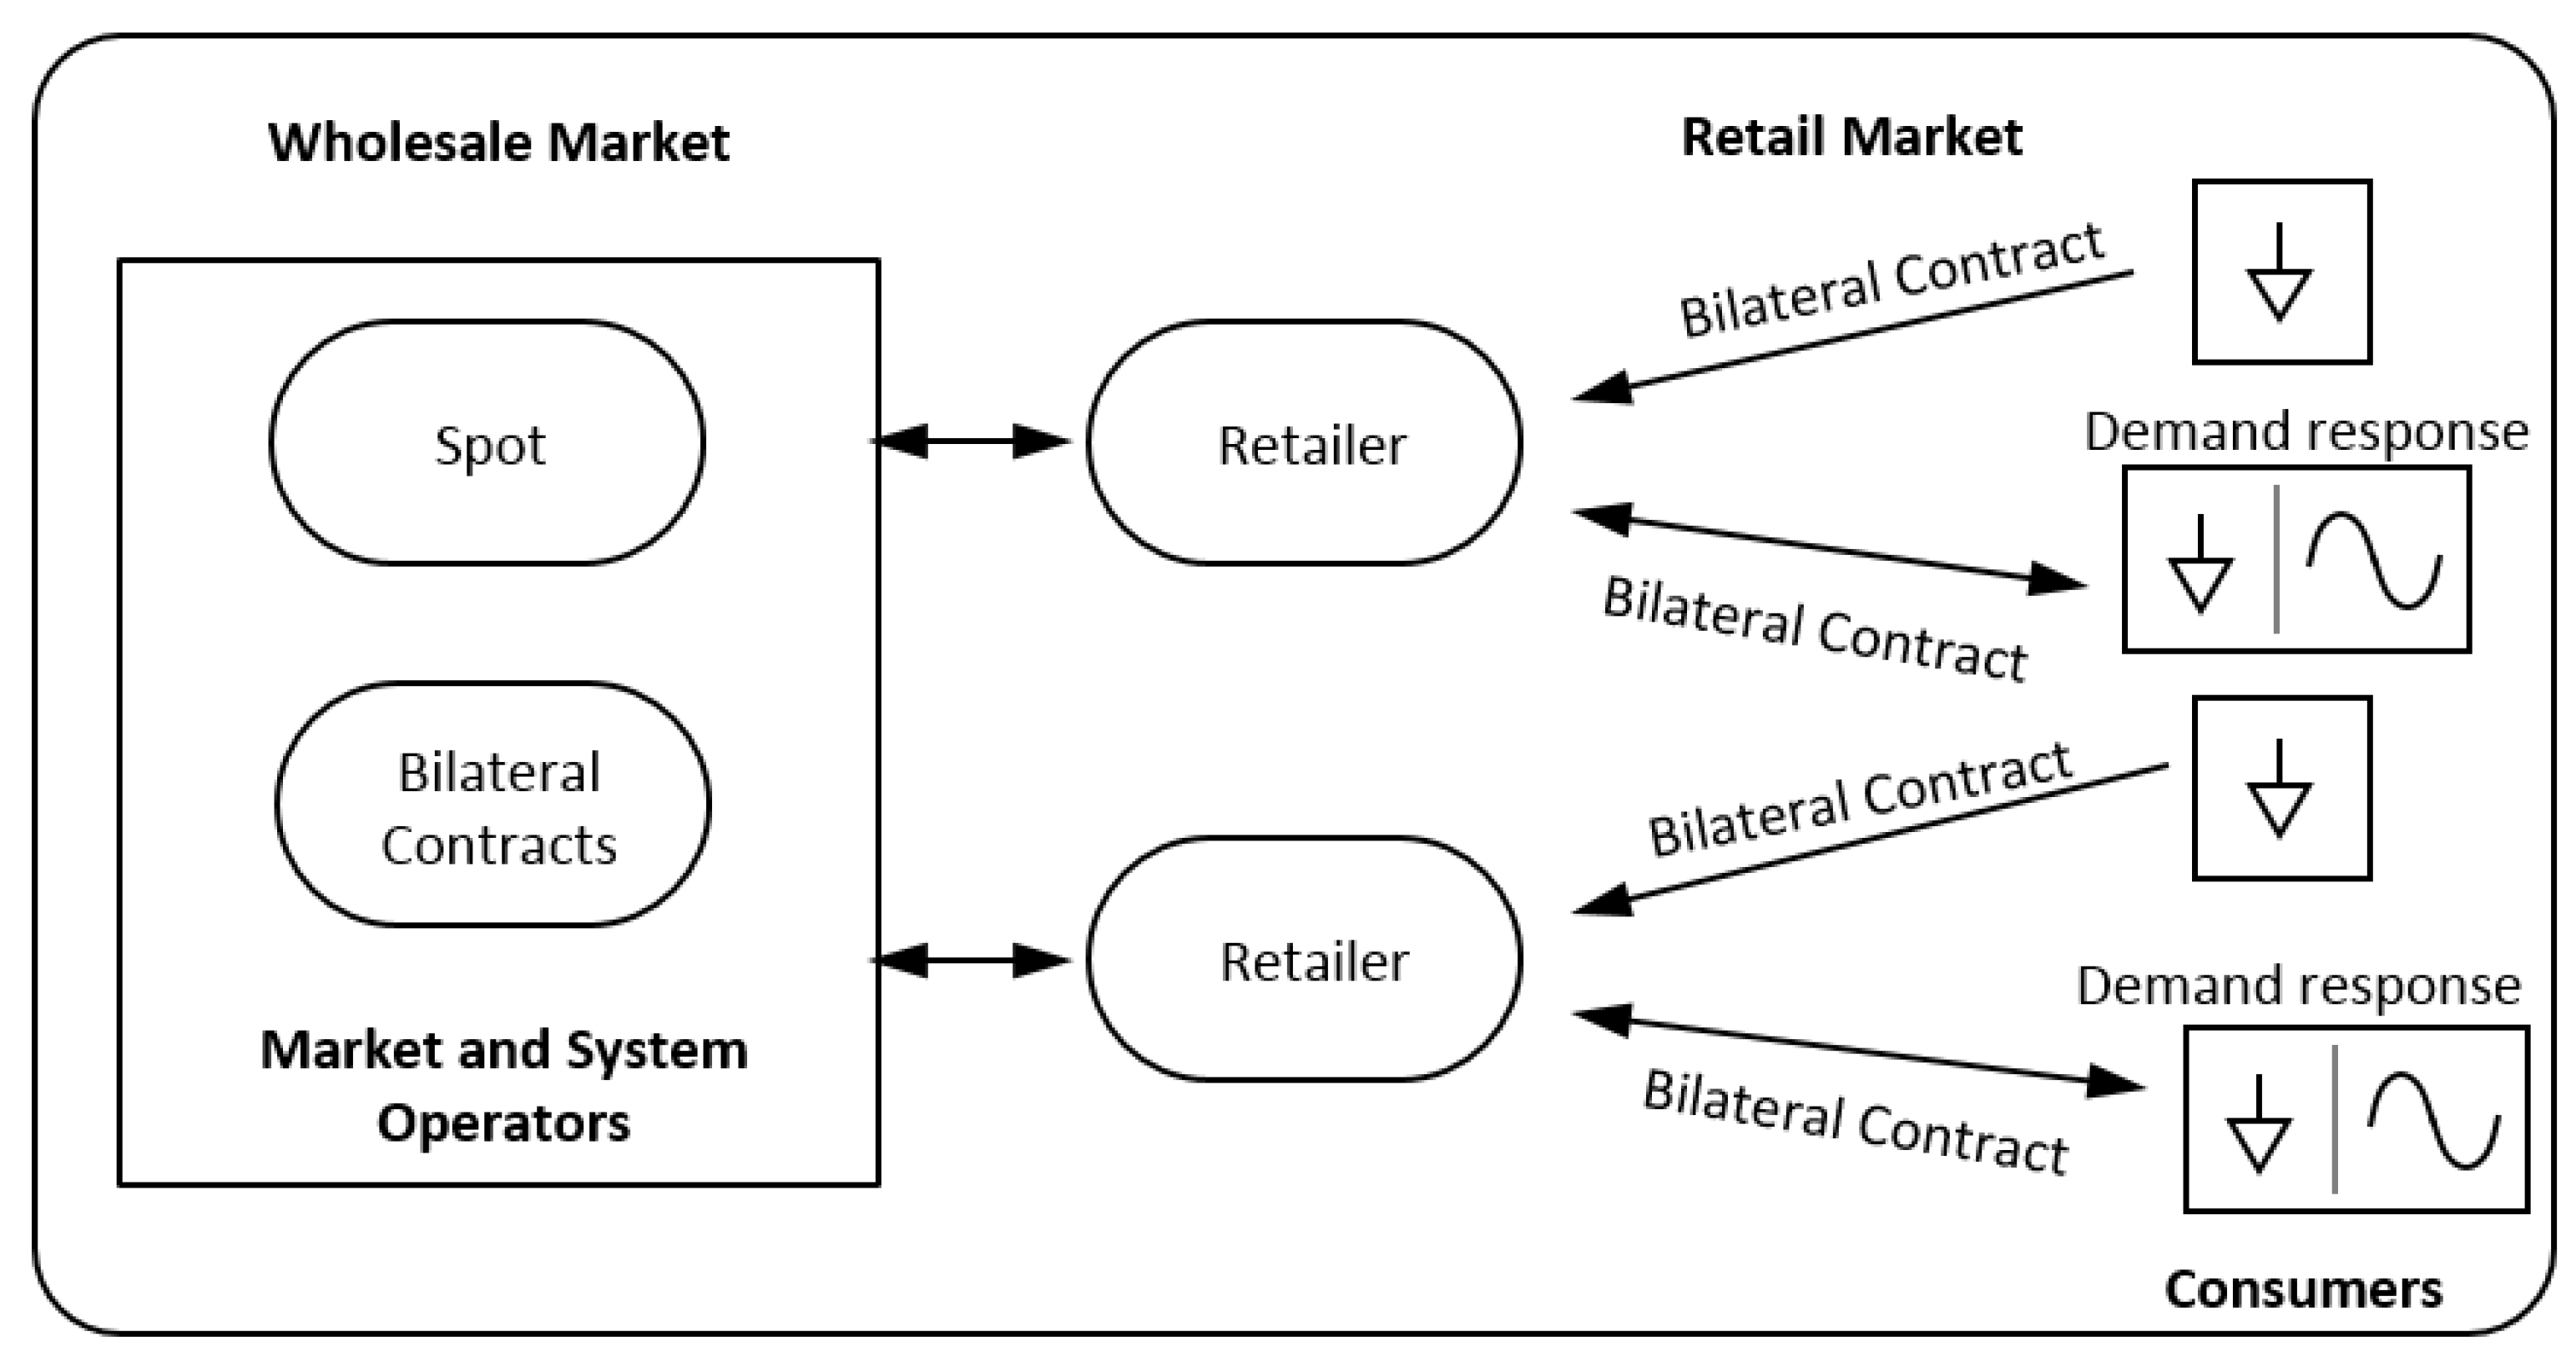
Liberalized electricity markets (EMs) are systems where competitive demand and supply players trade energy. Several electricity market models are often considered, including pools, derivatives and bilateral contracts [
1,
2]. Pools are marginal markets, which consist of auctions of supply and demand offers with the goal of maximizing the social welfare of participants. Derivative markets involve physical and financial tradable products that players can use to mitigate the price volatility of energy pools [
3]. Bilateral contracting consists typically of a private negotiation of power over several months or years between two parties. The parties set the terms and conditions of agreements independently of market operators. They negotiate their own terms and only submit prices, quantities, periods and market zones to market operators.
Bilateral contracts are used to mitigate the risk associated with uncertain pool prices [
4]. However, there is always some risk associated with energy price and quantity [
5]. Price risk is related to wholesale market prices and is relevant in cases of poor agreements, when negotiated prices significantly differ from future prices of electricity [
6]. Quantity risk is also relevant. Retailers usually sign non-standard forward contracts with consumers, consisting of fixed prices, but variable quantities [
7]. So, there is the risk of acquiring energy that differs markedly from the energy requested by customers, paying substantial penalties for deviations [
8]. A possible solution to mitigate this risk is to promote demand response (DR) programs and demand-side management (DSM) measures (see, e.g., [
9,
10]).
The ongoing transition to carbon-neutral societies involves a high penetration of variable renewable energy, such as wind and solar photovoltaic [
11]. Variable renewable energy sources (vRESs) can be cost-effective when compared to traditional fossil fuel power plants, whose tendency is to increase their cost with the increased cost of carbon emissions [
12]. However, renewable energy has a stochastic nature, being uncertain in the mid term and depending on weather conditions during real-time operation [
13]. Scarcity periods may lead to high market prices and periods with an excess of energy to vRES curtailments. Replacing fossil fuel dispatchable technologies with vRES relies on significant investments in expensive energy storage solutions and/or fast-responsive dispatchable power plants, to balance supply and demand. Hence, to avoid the payment of high costs to achieve a carbon-neutral society, consumers can have an active participation in the power system. To this end, consumers can adopt demand response programs and demand-side management measures.
Demand response may be defined as changes in the usage of electric power by end-use customers from their typical consumption patterns in response to changes in the price of electricity over time [
14]. DR is used to mitigate the need for additional power capacity and/or distribution facilities. DR also allows consumers to adapt their behavior to the uncertainty of renewable variable generation, avoiding investing in expensive storage solutions and/or fast-responsive dispatchable power plants. Price-based DR programs consider the active participation of consumers in electricity markets by responding to price changes over time. From the perspective of retailers, the emphasis of DR is on reducing the energy usage at peak periods and increasing it in base periods. Retailers can plan and encourage the participation of consumers in price-based DR programs, by offering time-of-use (TOU) tariffs with two, three and more periods of time involving significant differences between the price of energy in each period. This can influence consumers to change their consumption behavior, with the goal of reducing the cost of electricity. This work focuses on TOU tariffs.
In relation to demand-side management, customers may adopt one or more of the following load shape strategies [
15,
16]: peak clipping, valley filling, load shifting, strategic conservation, strategic load building and flexible load shape. These strategies may contribute to a reduction in the load and market price volatility, reducing the risk inherent to retailers. This reduction of risk, together with a potential increase in the profit of retailers, may contribute to a reduction in their tariffs. Such a reduction may, in turn, incentivize a change in the behavior of consumers, avoiding an increase in peak consumption and promoting an increase in off-peak consumption. Indirectly, this work considers that customers may adopt three load shape strategies: peak clipping, valley filling and load shifting strategies. While peak clipping may increase the return of retailers by decreasing peak prices, valley filling and load shifting may increase their profit by increasing the consumption of clients. The conservation strategy may decrease the profit of retailers and the flexible load shape strategy can be hard and costly to implement for retailers. All strategies can be favorable to a reduction in the costs of market players, except the load building strategy.
DR programs and DSM measures incentivize the investment and use of more efficient technologies, which may reduce the costs for customers. These technologies tend to last longer and have lower operation and maintenance costs. This is especially true for measures that incentivize the use of high efficiency heating, ventilation and air conditioning (HVAC) systems, energy efficient lighting and process technologies, such as fans and motors. Using high efficiency HVAC systems to define lower ambient temperature set-points is the main measure to reduce natural gas consumption, mainly during winter time. Another important measure consists in replacing natural gas with alternative sources [
17]. Adapting the HVAC system set-points is one of the most easy and quick DSM measures for curtailing and/or shifting consumption (see, e.g., [
9]). However, in some cases it may affect the comfort levels of consumers. In this case, utility functions can be used to evaluate the cost–benefit of DR and DSM measures.
A review of the main concepts behind DR and DSM can be found in [
18,
19,
20,
21]. In particular, a primer on demand-side management with a description of load-shape objectives and real examples of price-based DR programs applied in different states of the United States is presented in [
18]. There is a special focus on describing the outcomes of time-of-use tariffs and the response of consumers to critical-peak pricing (CPP) and real-time pricing (RTP) tariffs. The real examples show the success of DR and DSM measures, with special emphasis on a reduction of 27% in the peak consumption of residential consumers with CPP tariffs, in the state of California.
The majority of work about DR and DSM uses load aggregation to achieve target reductions in the consumption of peak periods (see [
22,
23,
24,
25,
26]). There is only a reduced number of articles that focus on the perspective of consumers. For example, Ogunjuyigbe et al. [
27] developed a load-satisfaction algorithm that maximizes the residential satisfaction of consumers considering a target budget. The algorithm receives the power ratings of the devices, their time-of-use tariffs, their consumption and the satisfaction of users for each device. By considering a target budget, defined by users, the algorithm selects the devices that should be utilized to maximize the satisfaction of users. Arteconi et al. [
28] simulated the control of the cooling loads of an industrial building in four different scenarios, with and without storage, by considering the following: (i) a typical dual Italian tariff (peak: 0.164 EUR/kWh, off peak: 0.149 EUR/kWh) without storage (baseline), (ii) a typical Italian tariff with storage, (iii) a tariff similar to the Chinese tariff (peak: 0.164 EUR/kWh, off peak: 0.082 EUR/kWh) with storage and (iv) PV and the Italian tariff with storage. In relation to the baseline, the authors concluded that only the fourth scenario can bring economic outcomes in a typical week, while in a hot week only the second scenario does not bring economic outcomes. Wang et al. [
29] presented a bi-level demand response model to coordinate spatially distributed thermally controllable loads. The authors considered a demand response market by using a load aggregator of thermally controllable loads, which responds to price signals of distribution network operators that want to improve the efficiency of operations by reducing costs. Bernath et al. [
30] analyzed the impact of the most relevant flexibility options of consumers on the market value of renewable energy. Consumers adopted the available options to shift consumption to cheaper hours with higher penetrations of variable generation, decreasing their costs with energy and increasing the renewable energy value. Tavakkoli et al. [
31] proposed to use consumption flexibility for strategic bidding of consumers that participate in day-ahead and balancing markets, considering a bi-level optimization model. Simulation results showed that consumers can impact the price in their favor by bidding strategically in power markets.
Against this background, the purpose of this article is threefold:
To model retailer agents able to consider DR programs and to propose strategic tariffs by considering the behavior of consumers;
To model consumer agents able to respond to DR programs and to adopt DSM measures in order to deal with different tariffs (and minimize costs);
To study the behavior of retailer and consumer agents. In particular, to experimentally analyze the response of a consumer to a time-of-use tariff proposed by a retailer, as well as the response of the retailer to the behavior changes of the consumer.
The work presented here is a natural extension of our previous work in the area of multi-agent electricity markets. Lopes et al. [
32] presented a model of individual behavior for software agents operating in distributed environments (e.g., a supply chain or an energy market). The model enables agents to negotiate the terms and conditions of bilateral contracts. Specifically, the authors presented a bilateral negotiation model involving an interaction protocol and a set of negotiation strategies and tactics (e.g., concession and integrative strategies and tactics).
Following this, Lopes et al. [
33] formalized several new strategies, including a “price management” strategy for producers/retailers and a “volume management” strategy for consumers. Both strategies are associated with the load response of consumers, particularly shifting, enabling market players to promote DR. The authors also presented a study on forward bilateral contracts.
Moreover, Lopes et al. [
34] extended the previous work by formalizing several DR strategies involving hour-wise tariffs and enabling consumers to deal with both energy price and energy quantity variations, instead of energy price concessions only. Lopes et al. [
35] paid special attention to the scoring preferences of the negotiating agents. Notably, they considered different utility functions to rate and compare offers. Algarvio et al. [
9] described a real-world case-study involving a public library (real consumption and equipment specifications). The study considered specific DSM measures and a direct load control program to reduce costs. The results showed a significant reduction in total energy cost. Finally, Lopes et al. [
10] described key DR programs and presented a study of the price-effect of DR on the Iberian day-ahead market for the period between January 2014 and January 2017. The study considered market prices above 80 EUR/MWh and reductions in demand of 1%, 3% and 5%. The results showed that the prices were reduced between 0.38% in 2017 and 37.35% in 2014. The benefit of adopting DR measures varied between 3.44% in cases of a reduction of 1% in 2017 and 49.40% in cases of a reduction of 5% in 2014.
The remainder of the paper is structured as follows.
Section 2 is devoted to negotiations between software agents. It introduces a multi-agent electricity market and briefly describe a negotiation model for autonomous agents.
Section 3 is devoted to bilateral contracting with DR. It describes several strategies for promoting demand response.
Section 4 presents a study on bilateral contracting involving DR. Finally, concluding remarks are presented in
Section 5.
3. Strategies and Tactics for Promoting Demand Response
This section focuses on price-based demand response and presents several tactics for promoting DR (see also [
41] for details). Broadly speaking, customers respond to high prices by adopting load response strategies from the two fundamental groups [
14,
42]:
Foregoing: this involves reducing electricity usage at times of high prices without making it up later (e.g., a commercial facility may turn off office equipment or adjust the air-conditioning set-points); typically, reduction in usage occurs during peak hours and consumption pattern is often not changed during other periods;
Shifting: this involves rescheduling energy usage away from times of high prices to other times (e.g., a larger industrial customer may shift some peak demand operations to medium and/or off-peak hours).
Let be a customer agent, the energy to be traded in a given block of time and the range of acceptable values for Q. The customer responds to high prices either by curtailing usage or by shifting usage to lower-priced hours. Accordingly, can adjust the value q of Q within a feasible DR range, represented by , where and are the lower and upper DR bounds, respectively.
Keeping the amount of energy within a feasible range is partially justified by the potential costs for customers. In particular, maintaining the quantity at or above a lower DR bound helps to control expected ongoing costs (e.g., to control the expected costs of rescheduling activities). The upper DR bound is a little more arbitrary. If the price differentials between blocks of hours are significant, customers react to high peak prices by adjusting the timing of their electricity usage either to take advantage of lower-priced periods or to avoid consuming during high-priced peak periods [
14].
Consider the specific case of the customer and let and be its initial prices and quantities, respectively. For peak-load periods, may adjust electricity usage by reducing the value q of Q only. Accordingly, for these periods, the upper DR bound is set either at the initial value of Q or at a lower value. For other periods, may adjust electricity usage either by reducing or by increasing Q during the course of trading.
The load response strategies in the two aforementioned fundamental groups are implemented through a variety of tactics. Let be the offer received by at time t and the offer that is ready to send at time . For a given time t, DR tactics compute new values for energy quantities by considering the selling prices . Four representative DR tactics, namely two foregoing tactics and two shifting tactics, follow.
A
price threshold foregoing tactic (PTFT) reduces energy usage in high-priced peak periods when the price rises above a predetermined electricity price threshold. That is, it considers a specific price threshold at which customers will reduce peak loads. Let
be the selling price for quantity
of
Q at time
t. A PTFT tactic for a customer agent
is a function with the following general form:
such that:
where
is a curtailment factor that defines the magnitude of the reduction in
,
is the lower DR bound,
is the price threshold and
is the new value of
.
Constraint (
5) limits how much
Q can decrease and also states that
Q cannot increase. This permits, for instance, the modeling of reductions in quantity for peak-load periods only—that is, the consumption pattern is not changed during low-demand periods. Now, it is worth noting that the following three DR tactics will be modeled as functions of an
n-vector of quantities (and an
n-vector of prices).
An
optimal-load foregoing tactic (OLFT) reduces the total amount of electricity to be delivered by a specific percentage and then adjusts energy usage in the different periods of the day by minimizing the contract cost. Let
be the offer received by the customer agent
at time
t. For
this tactic is formalized by a function
, which takes the energy quantities
and the prices
as arguments, reduces the total amount
by considering a curtailment response factor
and then computes new energy quantities by solving the following optimization problem:
subject to:
where
c is the bilateral contract cost,
is the reduced bilateral contract amount of energy (the magnitude of reduction is defined by
),
is the lower DR bound,
is the new (single) quantity value and
is the price for quantity
. Constraint (
7) ensures that the contract amount stays at the level defined by
and constraint (
8) keeps the value of
at or above the lower bound and also prevents
from increasing.
An
optimal-load shifting tactic (OLST) adjusts the timing of electricity usage to take advantage of lower-priced periods. Specifically, it reschedules usage away from high-priced peak periods to lower-priced periods by minimizing the contract cost. For a customer agent
, this tactic is formalized by a function
, which takes
Q and
P as input and shifts electricity usage to lower-priced periods by computing new energy quantities, i.e., by solving the following optimization problem:
subject to:
where
c is the bilateral contract cost,
is the bilateral contract amount of energy,
is the lower DR bound and
is the upper DR bound. Note that constraint (
10) keeps the bilateral contract amount at
and constraint (
11) gives upper and lower bounds for
.
A
price threshold optimal shifting tactic (PTOST) manages the timing of electricity usage by considering price thresholds. Specifically, it reschedules usage away from time periods when selling prices rise above predetermined price thresholds to other time periods. For a customer agent
, this tactic is formalized by a function
, which takes
Q and
P as input and shifts usage from hours when selling prices rise above price thresholds to lower-priced hours, by solving the following optimization problem:
subject to:
Constraints (
13)–(
15) are essentially identical to the previous constraints and details are therefore omitted.
4. A Study on Time-of-Use Tariffs
4.1. The Experimental System and Hypotheses
The experimental system consists of two software agents and a simulated environment. Let be the set of agents. The agent plays the role of seller (or retailer) and the agent plays the role of a buyer (or customer). The agents negotiate a three-rate tariff, i.e., negotiation involves six major issues: price-1 to price-3 and volume-1 to volume-3. This tariff follows the usual three-rate tariff, by taking into account the following:
Peak: from 11 a.m. to 3 p.m. and from 6 p.m. to 10 p.m.;
Intermediate: from 7 a.m. to 11 a.m., from 3 p.m. to 6 p.m. and from 10 p.m. to 12 p.m.;
Base: from 12 p.m. to 7 a.m.
The retailer agent sets the hourly rates in accordance with the wholesale price, i.e., more expensive in periods where the price is higher and cheaper when it is lower. On the one hand, the retailer agent “advises” the customer agent when to place consumption. From the point of view of the customer agent, the increment of price at certain hours constitutes an incentive to move consumption into cheaper hours.
Every agent is equipped with the aforementioned negotiation model. Negotiation involves an iterative exchange of offers and counter-offers, where:
The first agent to submit a proposal is the retailer agent;
The agents are allowed to propose only strictly monotonic offers—the customer’s offers increase monotonically and the retailer’s offers decrease monotonically;
The acceptability of a proposal is determined by a negotiation threshold—an agent accepts a proposal , submitted by at period , when the difference between the benefit provided by the proposal that is ready to send in the next time period t is lower than or equal to a negotiation threshold;
The agents are allowed to exchange only a maximum number of proposals, denoted by .
The agents and the environment have a built-in set of parameters that govern their behavior and facilitate experimentation. The relevant parameters for the experiment and their values are shown in
Table 1. Most values are based on data and results of case studies published in the negotiation literature (see, e.g., [
43]).
Table 2 shows the reference prices and energy quantities for both agents (the retailer and the customer). Some values were selected by looking up to real trading prices associated with a pool market in an attempt to approximate this experience to the real world. Specifically, the minimum retailer price (i.e., the limit) per period is equal to the market reference price per period. The market reference price was obtained through the analysis of the Iberian market day-ahead electricity prices. Moreover, the energy volumes are based on a large commercial load profile provided by the New Hampshire Electric Co-op. The perceived market price is computed from the reference market value. The limit and the initial level of prices are then computed from the perceived market price.
The independent variable is the customer (or buyer) pricing strategy (and associated tactics). This variable has five levels, namely the control strategy/tactic (EDPCT) and the four DR strategies/tactics presented in
Section 3. The value of this variable is under the control of the experimenter. The dependent variables are the negotiated prices and volumes, the customer’s utility, the joint utility, the time spent in negotiation and the outcome of the negotiation. The values of these variables are observed by the experimenter as measurements. The first and second dependent variables are the negotiated prices and volumes. These are the most important variables. The volumes can show the impact of DR and the prices may demonstrate if the customer’s effort to reduce peak consumption could result in better prices. The third dependent variable is the customer’s utility. This is a dependent variable because a major purpose of the research consists of examining the effect of concession strategies on the bargainer who uses these strategies (the customer in this study) and not the opponent.
Consider that
and
agreed with a proposal containing the prices
and the volumes
. The utility
of
is given by the following function:
where
is the weight of
for an issue
,
is the weight of
for an issue
,
is a constant,
is the (marginal) utility function of
for
and
is the (marginal) utility function of
for
. The (marginal) utility function
is defined as follows:
where
is the limit of
for the price
and
is the customer’s initial price in the first proposal. Similarly,
is defined as follows:
where
is the customer standard profile at period
n.
The fourth dependent variable is the joint utility, measured in terms of the sum of both agents’ utilities. A high joint utility is normally obtained through the use of win–win or integrative negotiation strategies and typically means that both agents achieve a mutual beneficial agreement, so all are satisfied. The fifth dependent variable is the total number of offers exchanged by the agents until either they found an agreement or reached the maximum number of proposals, set to . The last dependent variable is the outcome of negotiation (agreement or not). This variable is used to compute the percentage of deals made in a number of negotiations.
The customer agent adopts the energy dependent concession making a strategy/tactic for changing the energy prices during the course of negotiation. The retailer agent negotiates electricity prices with the customer agent and may adopt different strategies, such as the well known tit-for-tat strategy, which imitates the price concessions of the opponent throughout negotiation (see, e.g., [
44]).
The experimental hypotheses are as follows:
H1: The DR strategies lead, on average, to a peak volume reduction (in relation to the control strategy);
H2: The curtailment strategies (i.e., PTFT and OLFT) lead, on average, to a higher peak volume reduction than the shifting strategies (i.e., OLST and PTOST);
H3: The DR strategies lead, on average, to a peak price reduction (in relation to the control strategy);
H4: The curtailment strategies lead, on average, to a higher peak price reduction than the shifting strategies;
H5: The DR strategies lead, on average, to a lower total cost (in relation to the control strategy);
H6: The curtailment strategies lead, on average, to a lower total cost than the shifting strategies;
H7: The DR strategies lead, on average, to a decrease in the consumption (in relation to the control strategy);
H8: The curtailment strategies lead, on average, to a decrease in the consumption (in relation to all the other strategies);
4.2. Experimental Results and Discussion
The experiment was conducted on a personal computer using the MATREM system [
45]. For each of the strategies, we conducted 30 trials, in a total of 360 trials. The results are shown in
Table 3. We note that most results are statistically significant.
The main response measures are the negotiated volumes and prices. In relation to the energy volumes, it was predicted that the DR strategies yielded a peak reduction when compared with the control strategy.
Table 3 reports the mean volumes obtained in negotiation. The results indicate that the DR strategies lead to a peak volume reduction and therefore hypothesis 1 is supported. Moreover, considering the curtailment strategies, it was predicted that they yielded a reduction in high peak volumes. The results in
Table 3 indicate that the OLFT and OLST strategies lead to higher reductions in peak volumes when compared with all other strategies. However, we found no statistical differences between the results and therefore hypothesis 2 is not supported.
Another key response measure is the energy price. The prediction was that the DR strategies decreased the peak volume, which then resulted in a peak price reduction. The results indicate that this prediction is confirmed (see
Table 3). The DR strategies lead to a decrease in the peak price and therefore hypothesis 3 is supported. Analyzing, now, the curtailment strategies, it was predicted that they yielded a lower peak price. The results indicate that the OLFT and OLST strategies lead to lower peak prices when compared with all the other strategies (see
Table 3). However, we found no statistical differences between these results. Hence, hypothesis 4 is not supported.
Another important measure is the total cost. It was predicted that the DR strategies yielded lower costs due to a reduction in the peak volume. The results indicate that this prediction is confirmed (see
Table 3) and therefore hypothesis 5 is supported. It was also predicted that the curtailment strategies yielded a lower cost due to a reduction in the peak and intermediate volumes, while keeping the base volume, which would result in a reduction in the total volume (when compared with all the other strategies) and thus would lead to a decrease in the total cost. The results indicate that this prediction is confirmed. Thus, hypothesis 6 is supported. The OLFT strategy leads to a lower cost when compared with all the other strategies (see
Table 3).
The last measure involves the adoption of different strategies and the subsequent decrease in consumption. While the use of the shifting strategies do not bring any changes to consumption, the curtailment strategies can reduce consumption significantly (see
Table 3). Thus, hypothesis 7 is not supported, while hypothesis 8 is supported. The OLFT strategy leads to the highest reduction in consumption when comparing with all the other strategies.
In the next paragraphs, we analyze the results obtained with the different trials to get some preliminary conclusions about the behavior of both the customer and the retailer. Although preliminary, the conclusions can shed some light on the typical behavior of the customer and the retailer, regarding the adoption of the three-rate tariff (by the customer) and the price-based response (of the retailer).
Customer response to the three-rate tariff. Typically, the customer agent responds to the three-rate tariff by reducing consumption in the peak period. This agent also reduces consumption in the intermediate period, but not always (e.g., when the consumer keeps or increases the consumption in that period). In the base period, the consumer agent only maintains or increases consumption.
Figure 2 depicts the behavior of the customer agent in relation to the energy prices. Broadly, we can conclude that the customer responds to the magnitude of the prices almost independently of the block periods. For high prices, the tendency is to decrease large amounts of energy and for low prices to increase or maintain consumption. Statistically, we found no differences between the results of the control strategy (EDPCT) and the curtailment strategies, meaning that the consumer tends to maintain the base consumption. However, we note that the shifting strategies led to an increase in the base consumption.
For intermediate prices, the results of the various strategies are statistically significant. The exception is the PTOST strategy, a shifting strategy, which led the agent to maintain the intermediate consumption in the majority of the trials. The curtailment strategies led to reductions in consumption of different magnitudes.
The peak prices are critical for the customer agent. The OLFT and OLST strategies resulted in large reductions in this agent (see
Table 3). In particular, the OLFT strategy led to the highest reduction in the daily cost of electricity. This can also be verified by the levelized price of the corresponding tariff.
Price-response of the retailer. Generally, consumers respond directly to tariffs, while retailers respond to both consumers’ consumption and market prices and thus the analysis of their behavior is more complex. Furthermore, the day-ahead market considers hourly prices while time-of-use tariffs consider two, three or more block periods (with several hours).
For the base period, we found no significant differences in the price. However, for the sake of completeness, we note that the retailer agent tends to make higher discounts for increases in consumption (see
Figure 3). For the intermediate period, the results are statically significant. To some extent, this suggests that the intermediate period is almost as important as the peak period for the retailer agent. Moreover, we can conclude that the retailer only decreases the price in cases of a consumption reduction (see
Figure 4). For the peak period, the behavior of the retailer is similar to the intermediate period, but makes smaller price reductions in order to not cause the customer to increase consumption (see
Figure 5).
5. Conclusions
This paper described retailer agents able to consider DR programs and to propose strategic tariffs by considering the behavior of consumers. Moreover, it described customer agents able to respond to DR programs and to adopt DSM measures in order to deal with different tariffs and minimize costs. To analyze the behavior of the retailer and the consumer agents, the paper presented a study involving a three-rate tariff (time-of-use tariff) and two agents: a retailer and a customer.
The experimental results showed that the customer agent responds directly to the time-of-use tariff, independently of the block period. The response is dependent on the willingness of the agent to reduce or shift consumption, i.e., the flexibility of the customer agent. Moreover, the response of the retailer agent to the customer variation of consumption is as follows. For the base period, the retailer gives small discounts (<1%) for reasonable increases in consumption (>8%). For the intermediate and peak periods, the retailer increases the price (>1%) for small increases in consumption (<5%) and slightly decreases the price (>1%) for significant decreases in consumption (>5%). This behavior incentivizes the customer agent to keep changing their consumption behavior.
To conclude, a DR program in the form of a time-of-use tariff can lead to a reduction in market price, since the base and peak prices seem to get closer. The reduction of market price can, in turn, lead retailers to increase their return and consequently, to reduce the prices of their tariffs. For consumers, there are also advantages, since they can benefit from lower tariffs and by reducing peak consumption, from lower global costs.
In future work, we intend to study the behavior of several consumers adopting DR programs and the impact of retail competition, by taking into consideration several retailers that try to attract consumers to their portfolios (we note that the present study only considers the behavior of one consumer and one retailer).


