
Study of the Relationship between the Level of Lubricating Oil Contamination with Distillation Fuel and the Risk of Explosion in the Crankcase of a Marine Trunk Type Engine

Abstract
:1. Introduction
1.1. Genesis of Undertaking the Research Topic
- main conditions required for crankcase explosion;
- methods of crankcase explosion risk detection;
- methods of crankcase explosion prevention and minimizing the effects;
- list of rules, standards, and regulations;
- description of secondary explosion phenomena;
- analysis of lubricant flash point as a reliable indicator for the risk of crankcase explosion.
1.2. Dilution of Lubricating Oil with Fuel and Explosion Hazard
- decreasing air velocity;
- increasing the temperature of the flammable mixture;
- increasing the size of the ignitor.
- evaporation of oil in contact with a hot spot inside the crankcase;
- condensation of oil vapors in contact with cooler areas in the crankcase, resulting in a white oil mist with a droplet diameter of 5–10 μm;
1.3. Methods for Detecting Lubricating Oil Contamination with Fuel
2. Materials and Methods
- (1)
- change in the flammable properties of the oil;
- (2)
- deterioration of lubrication conditions of the engine’s tribological nodes.
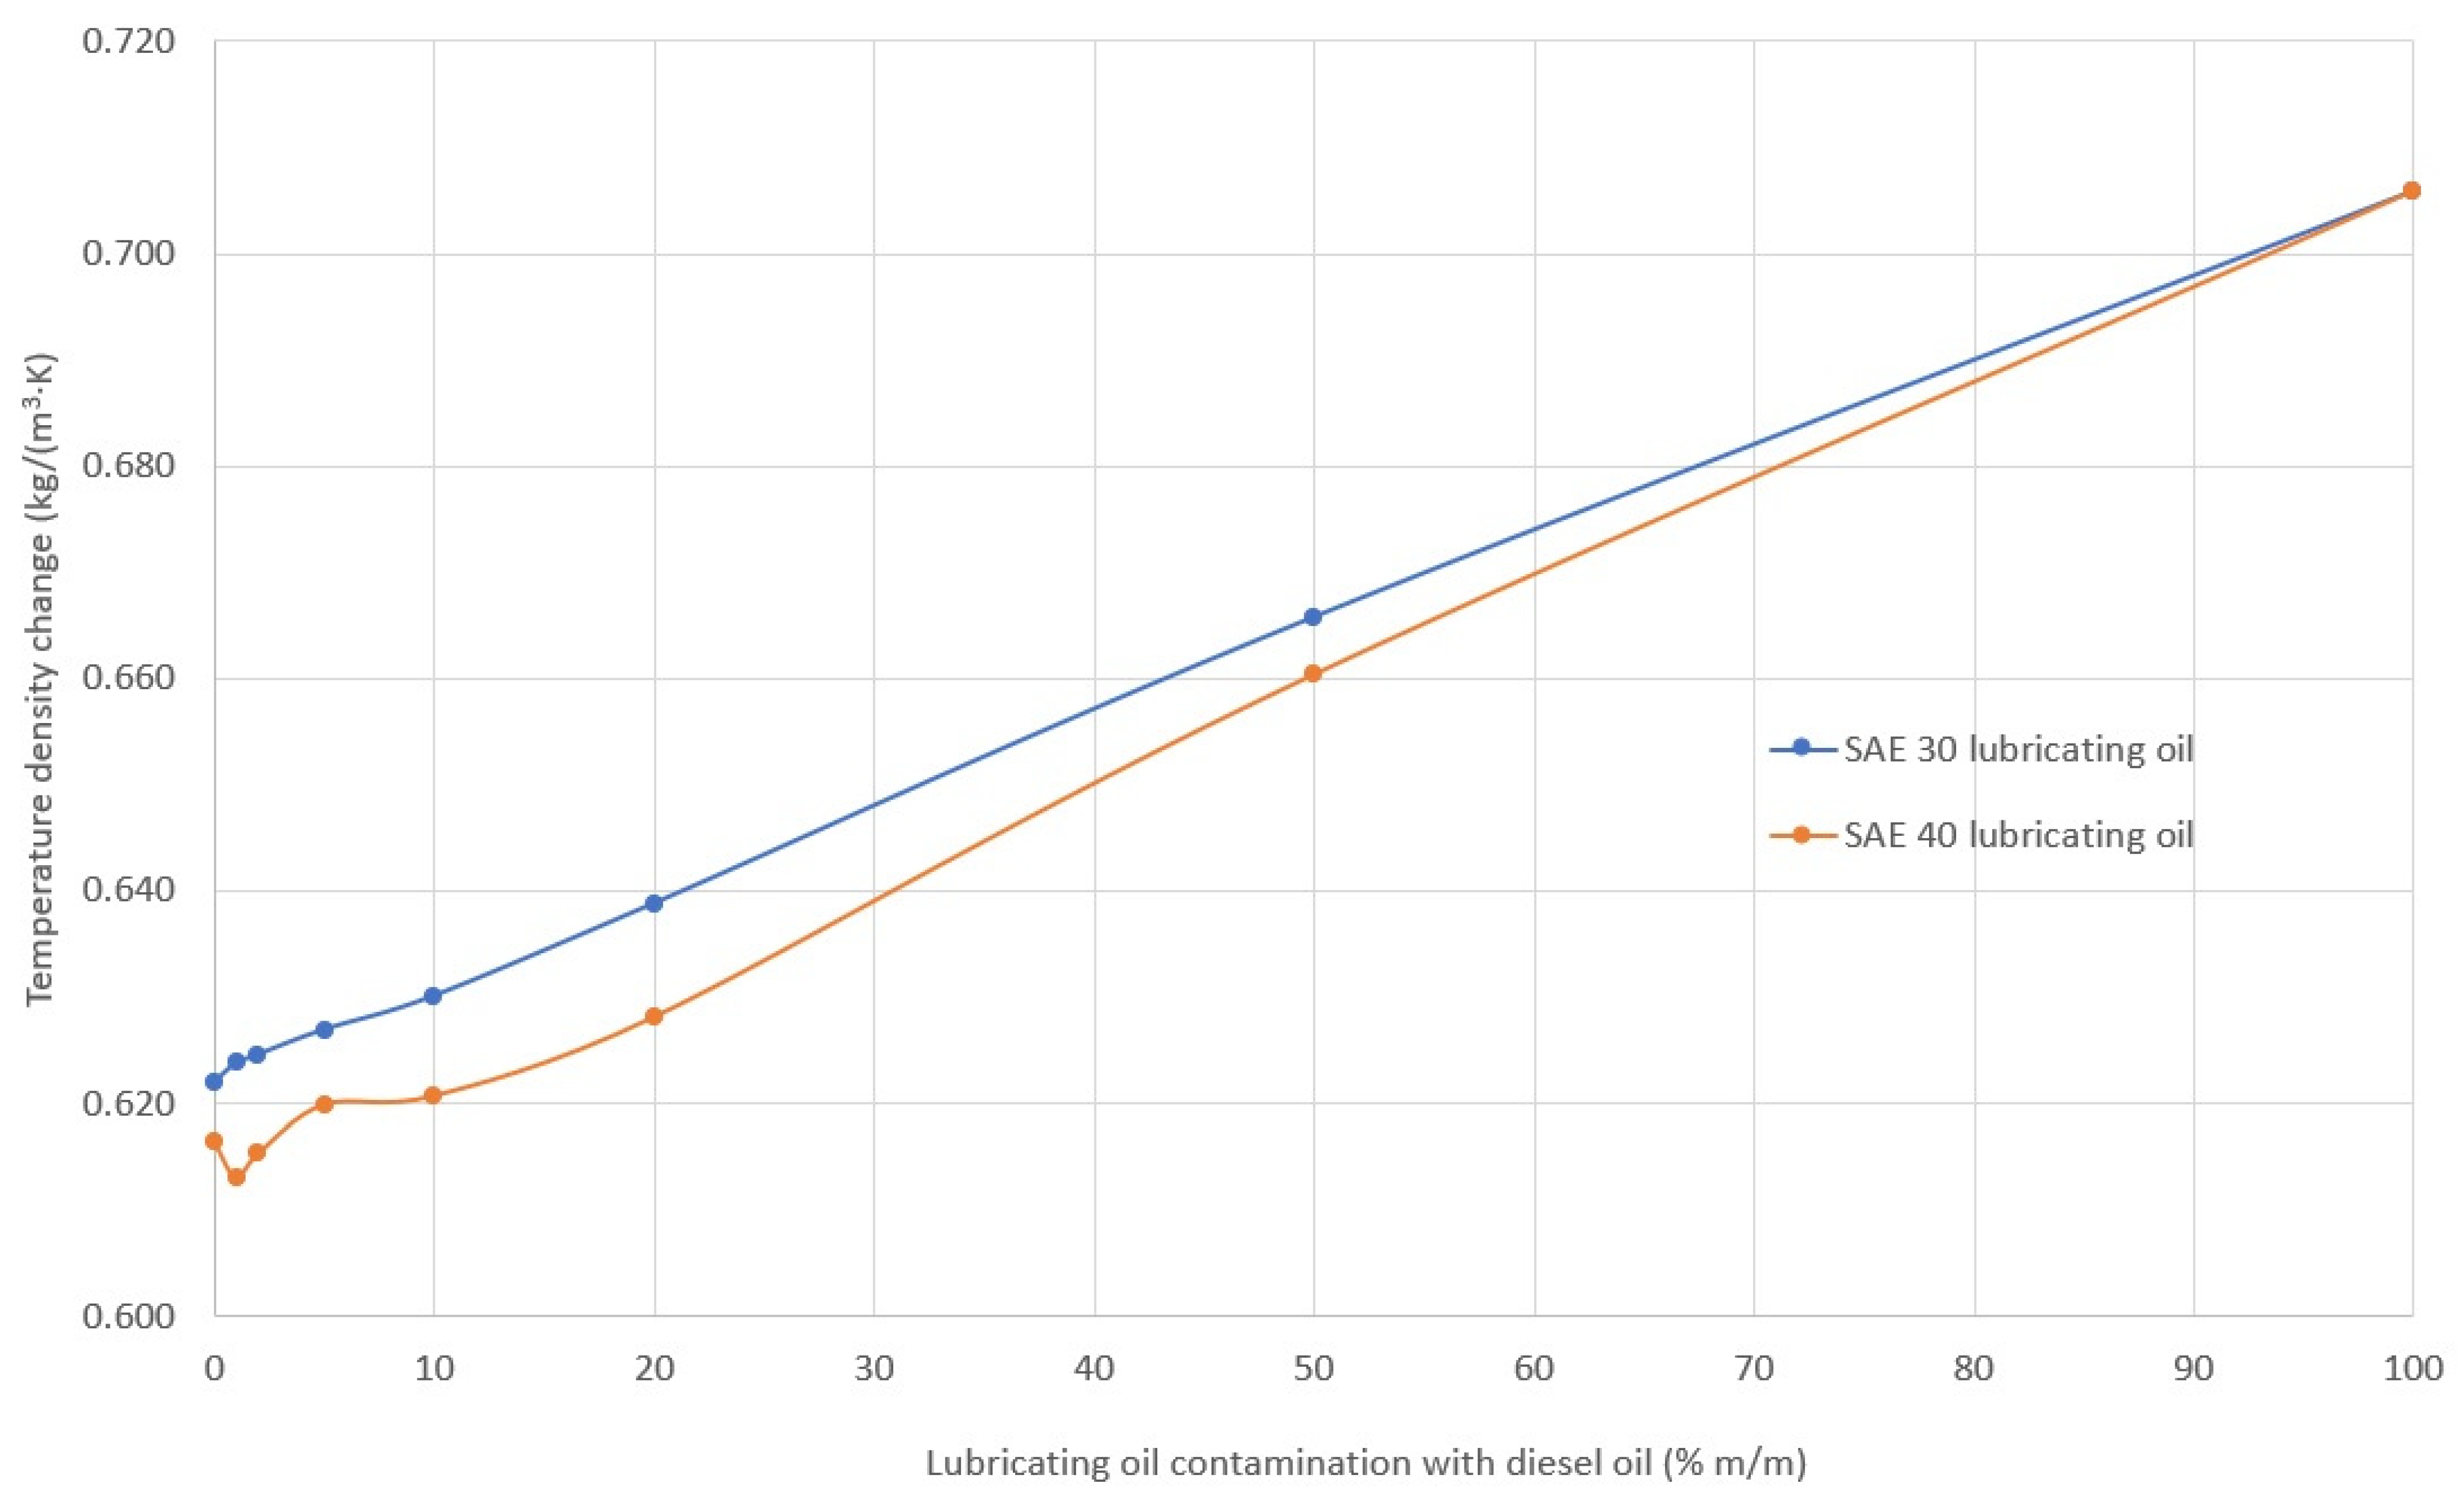
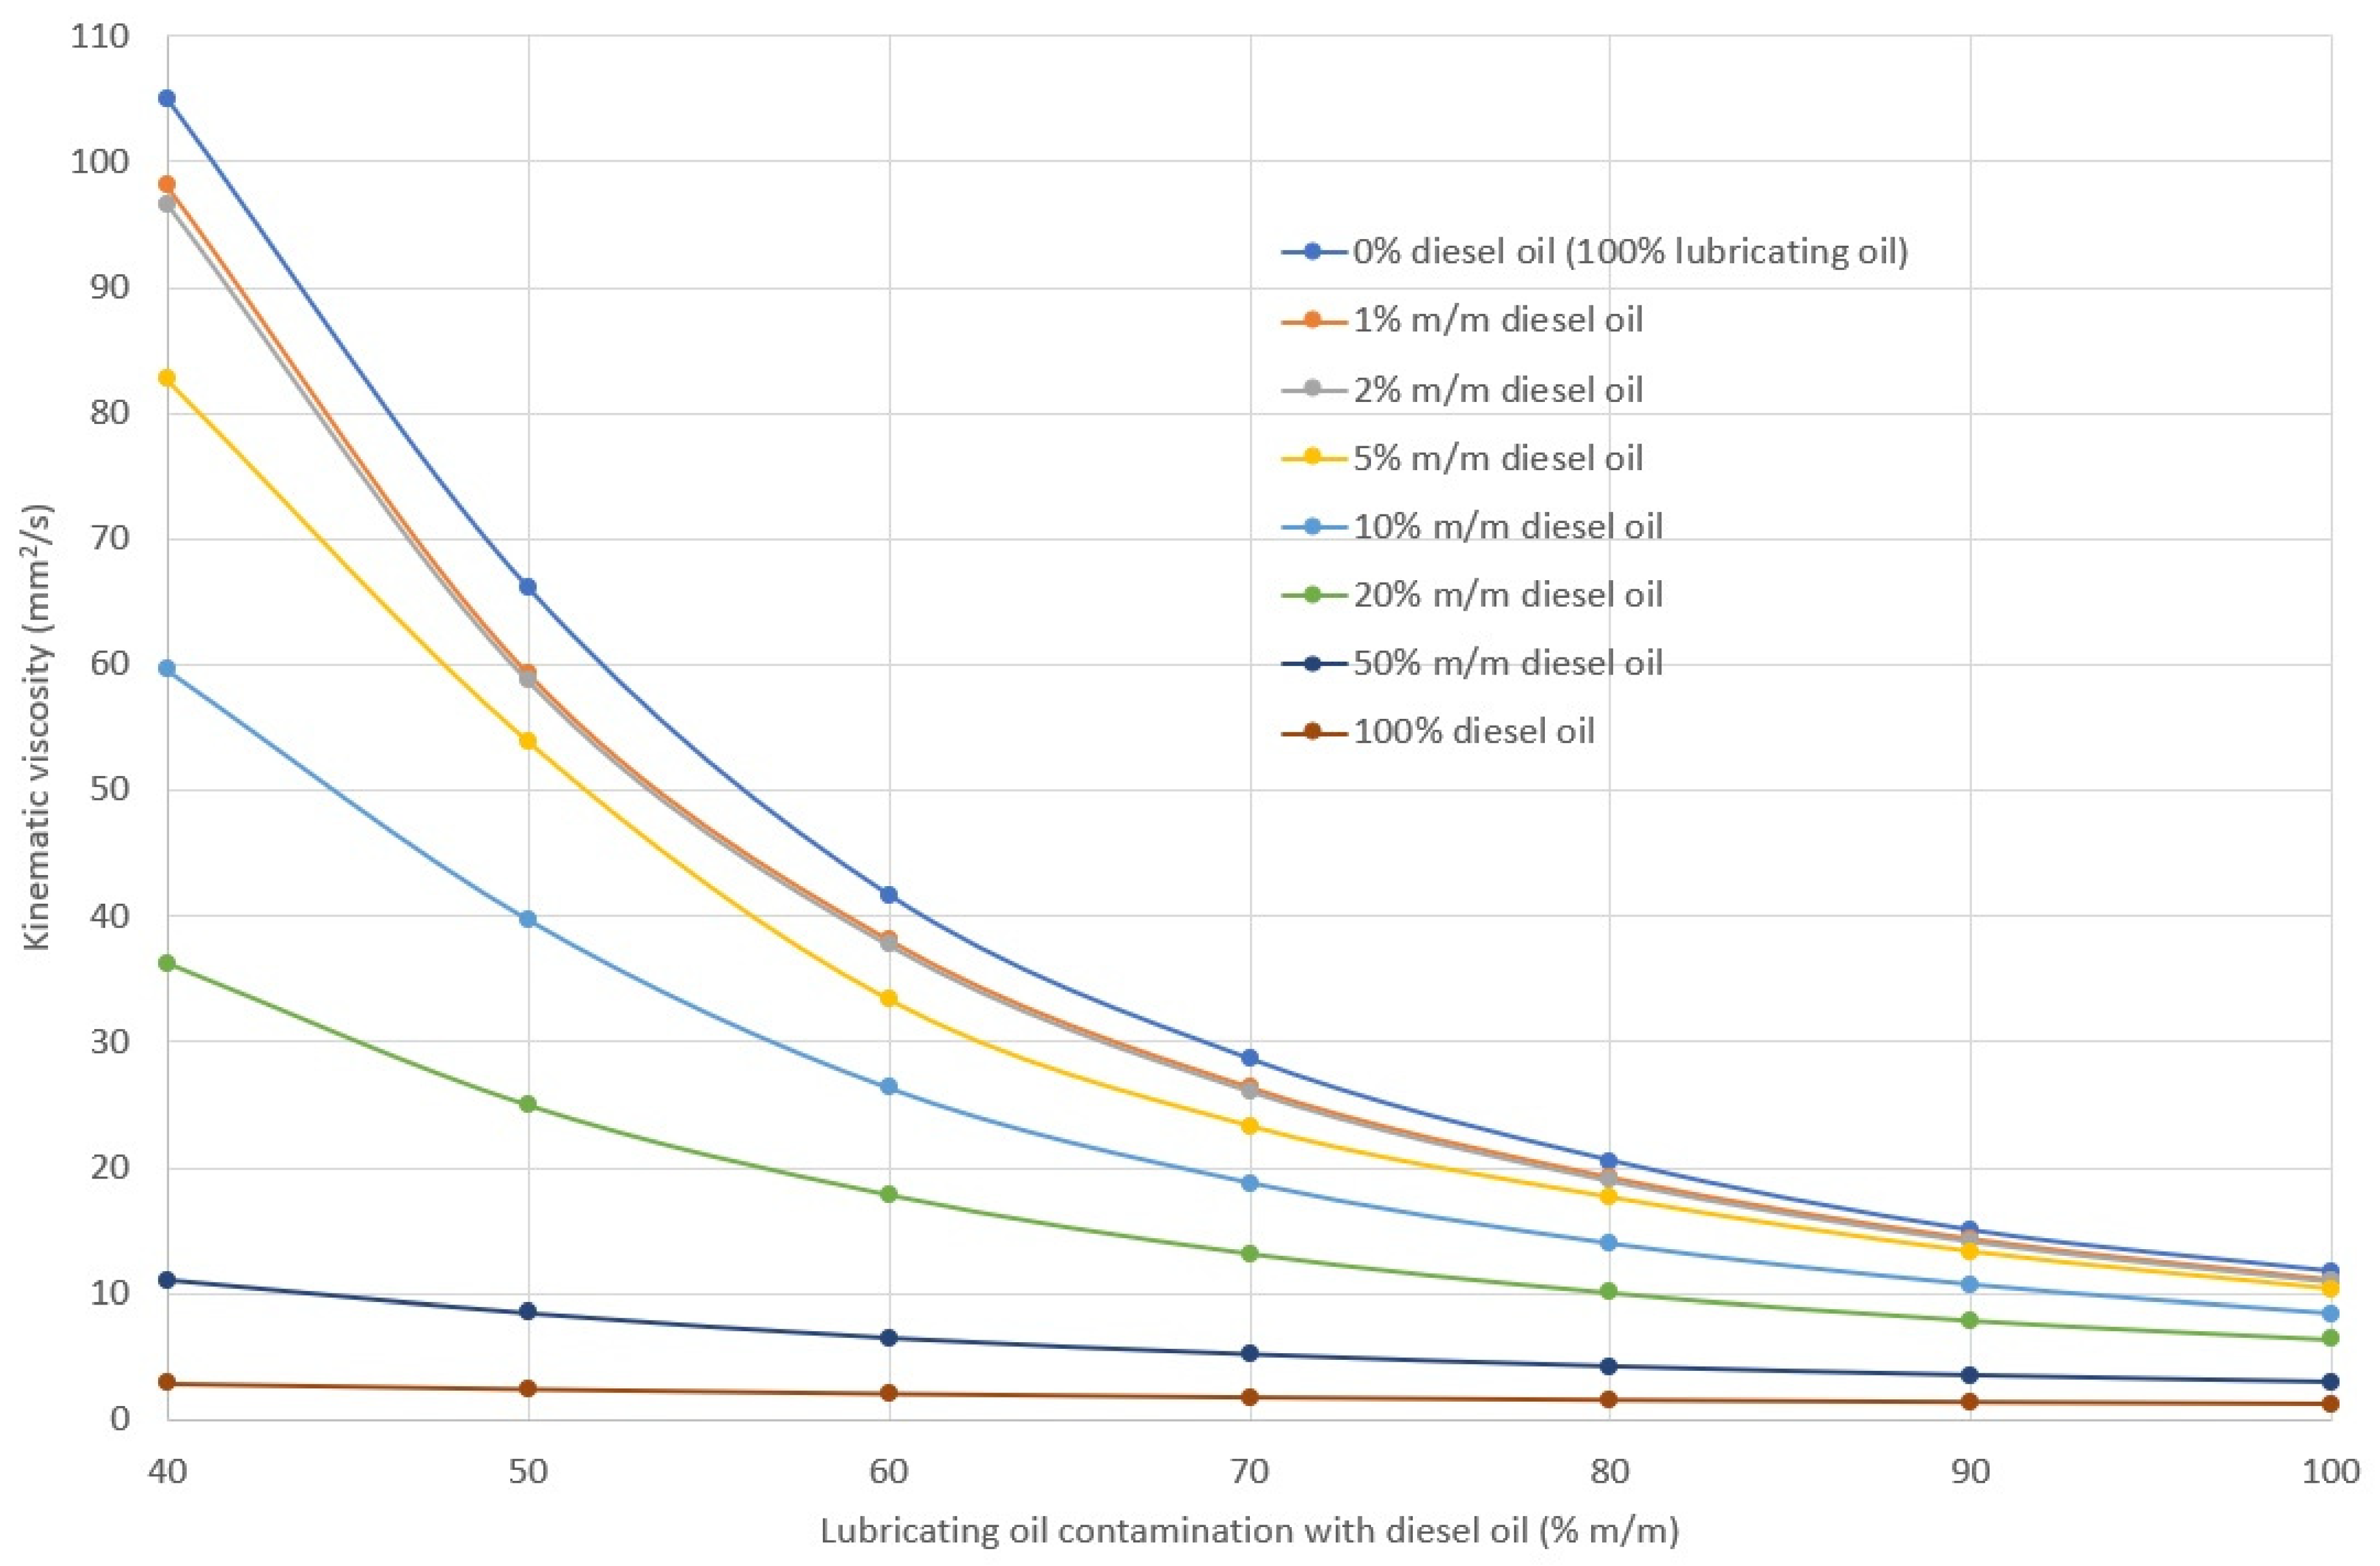
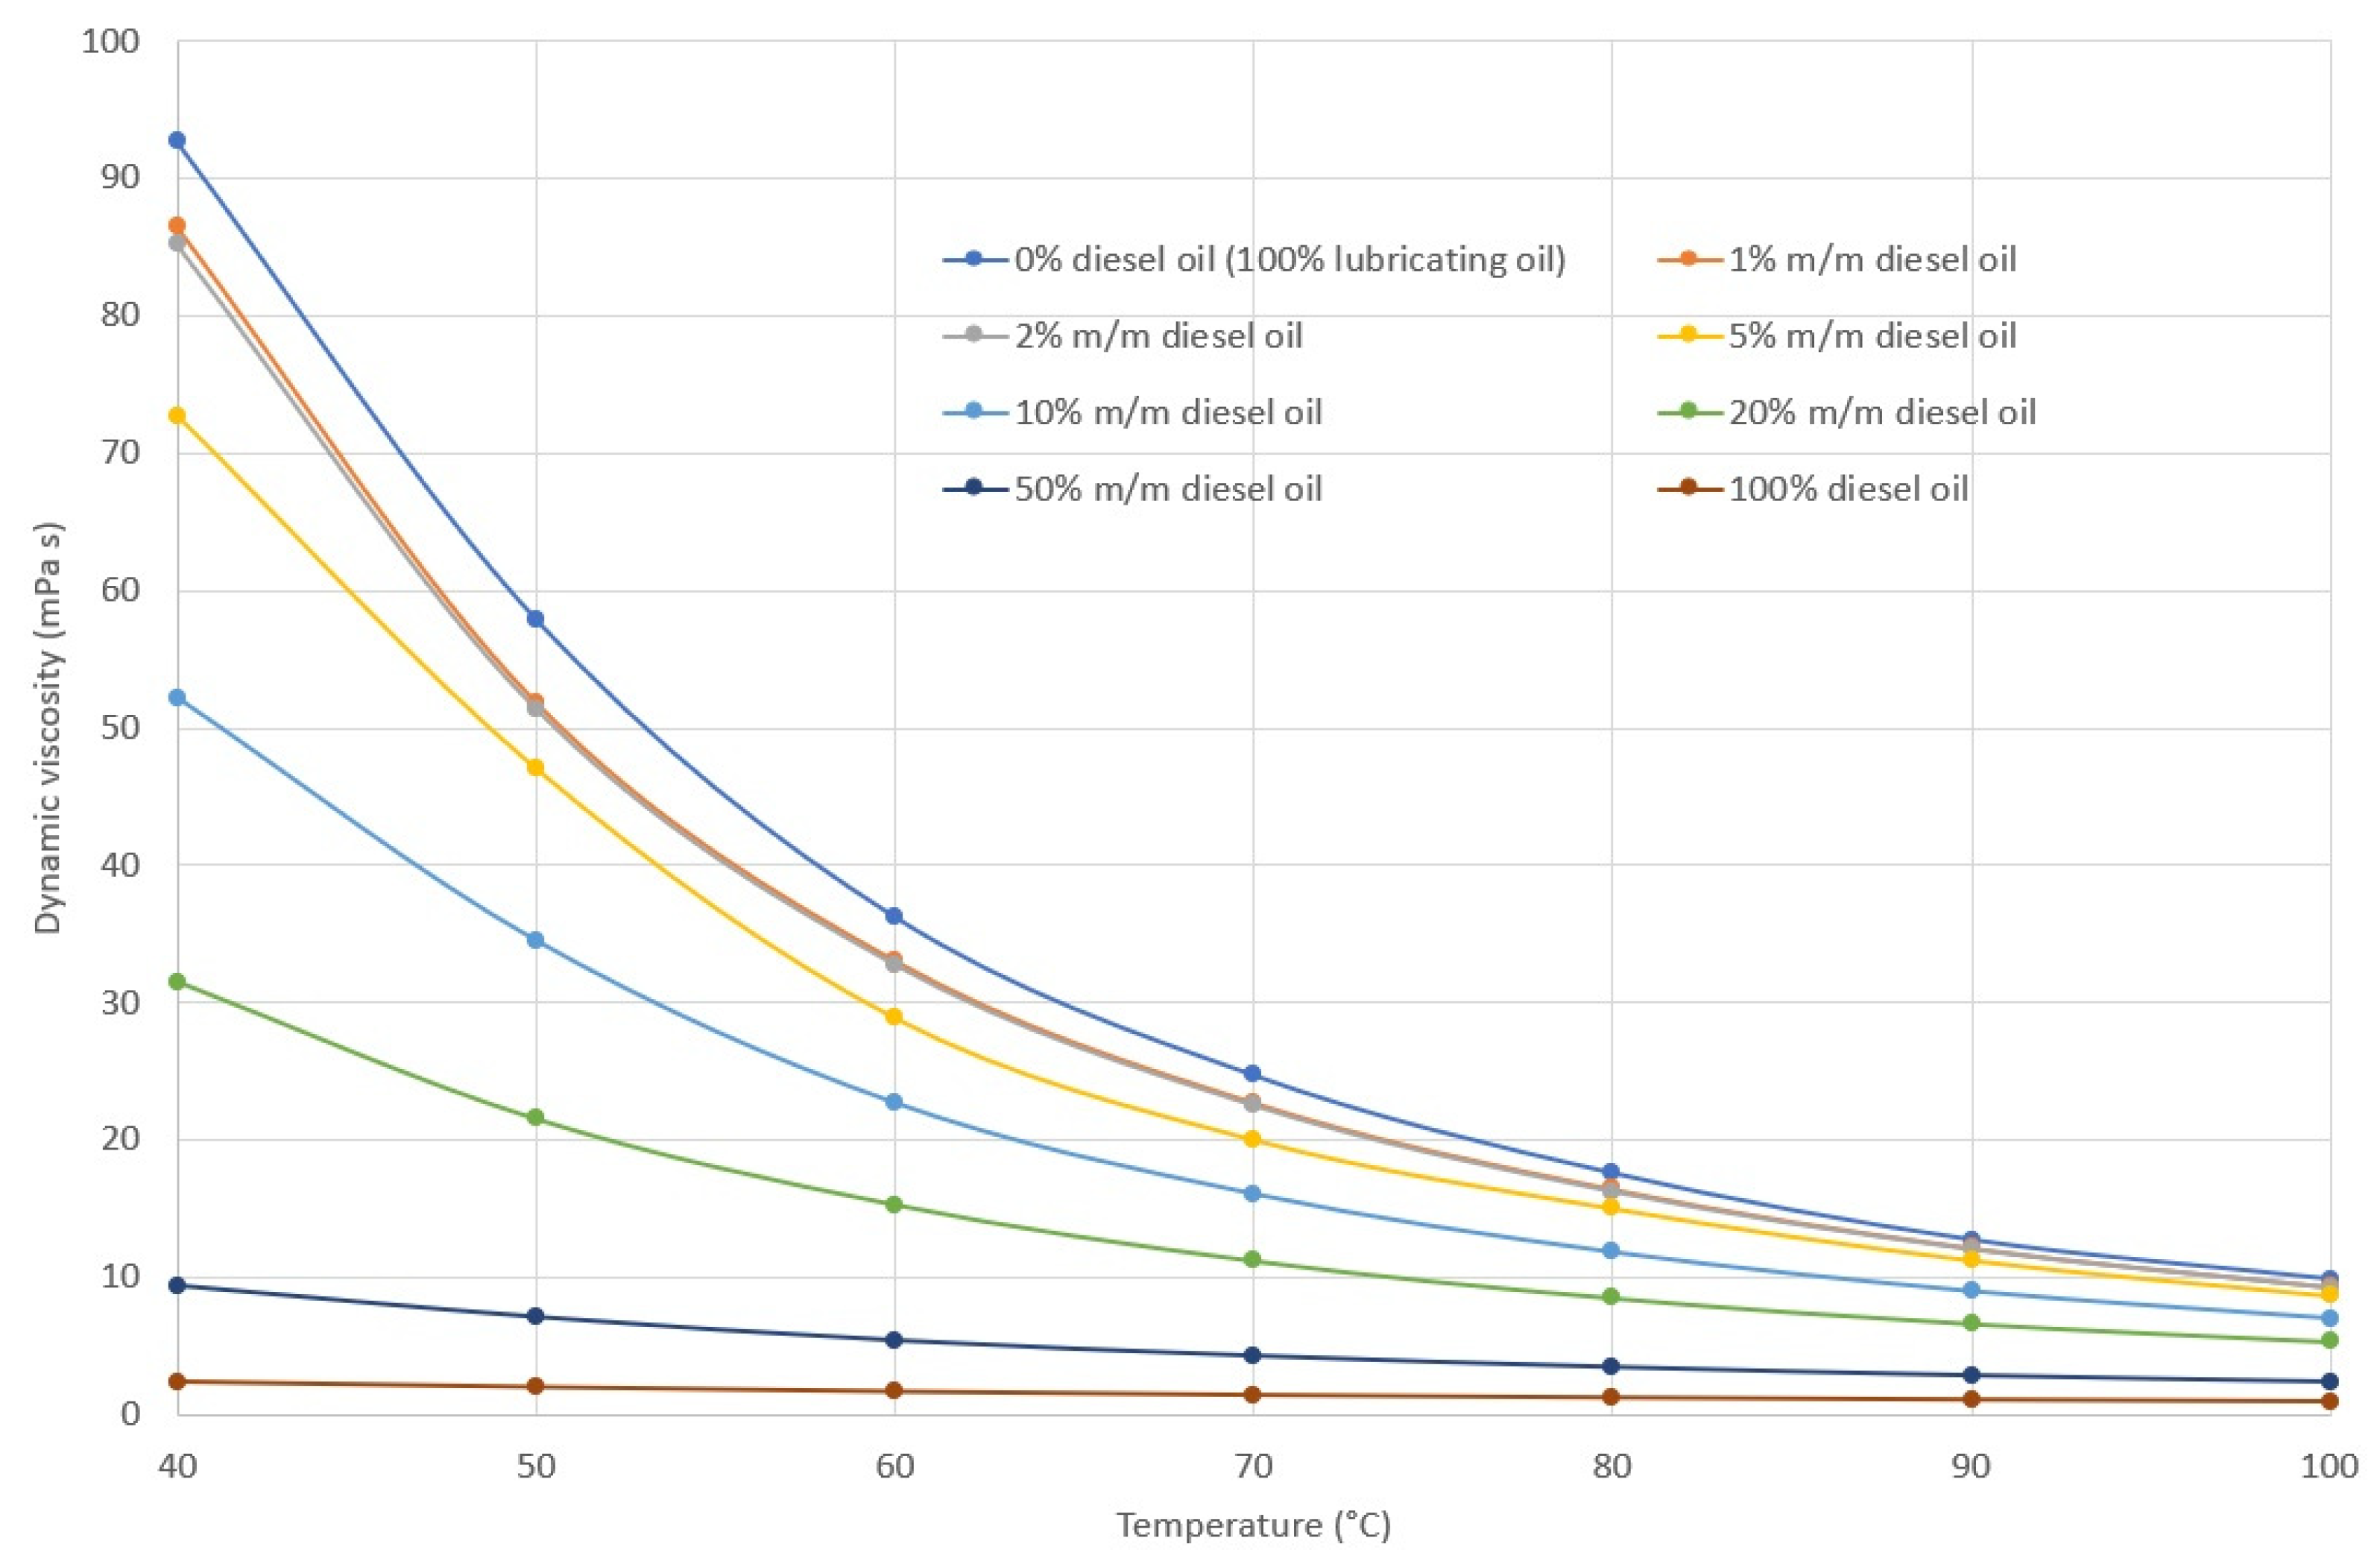
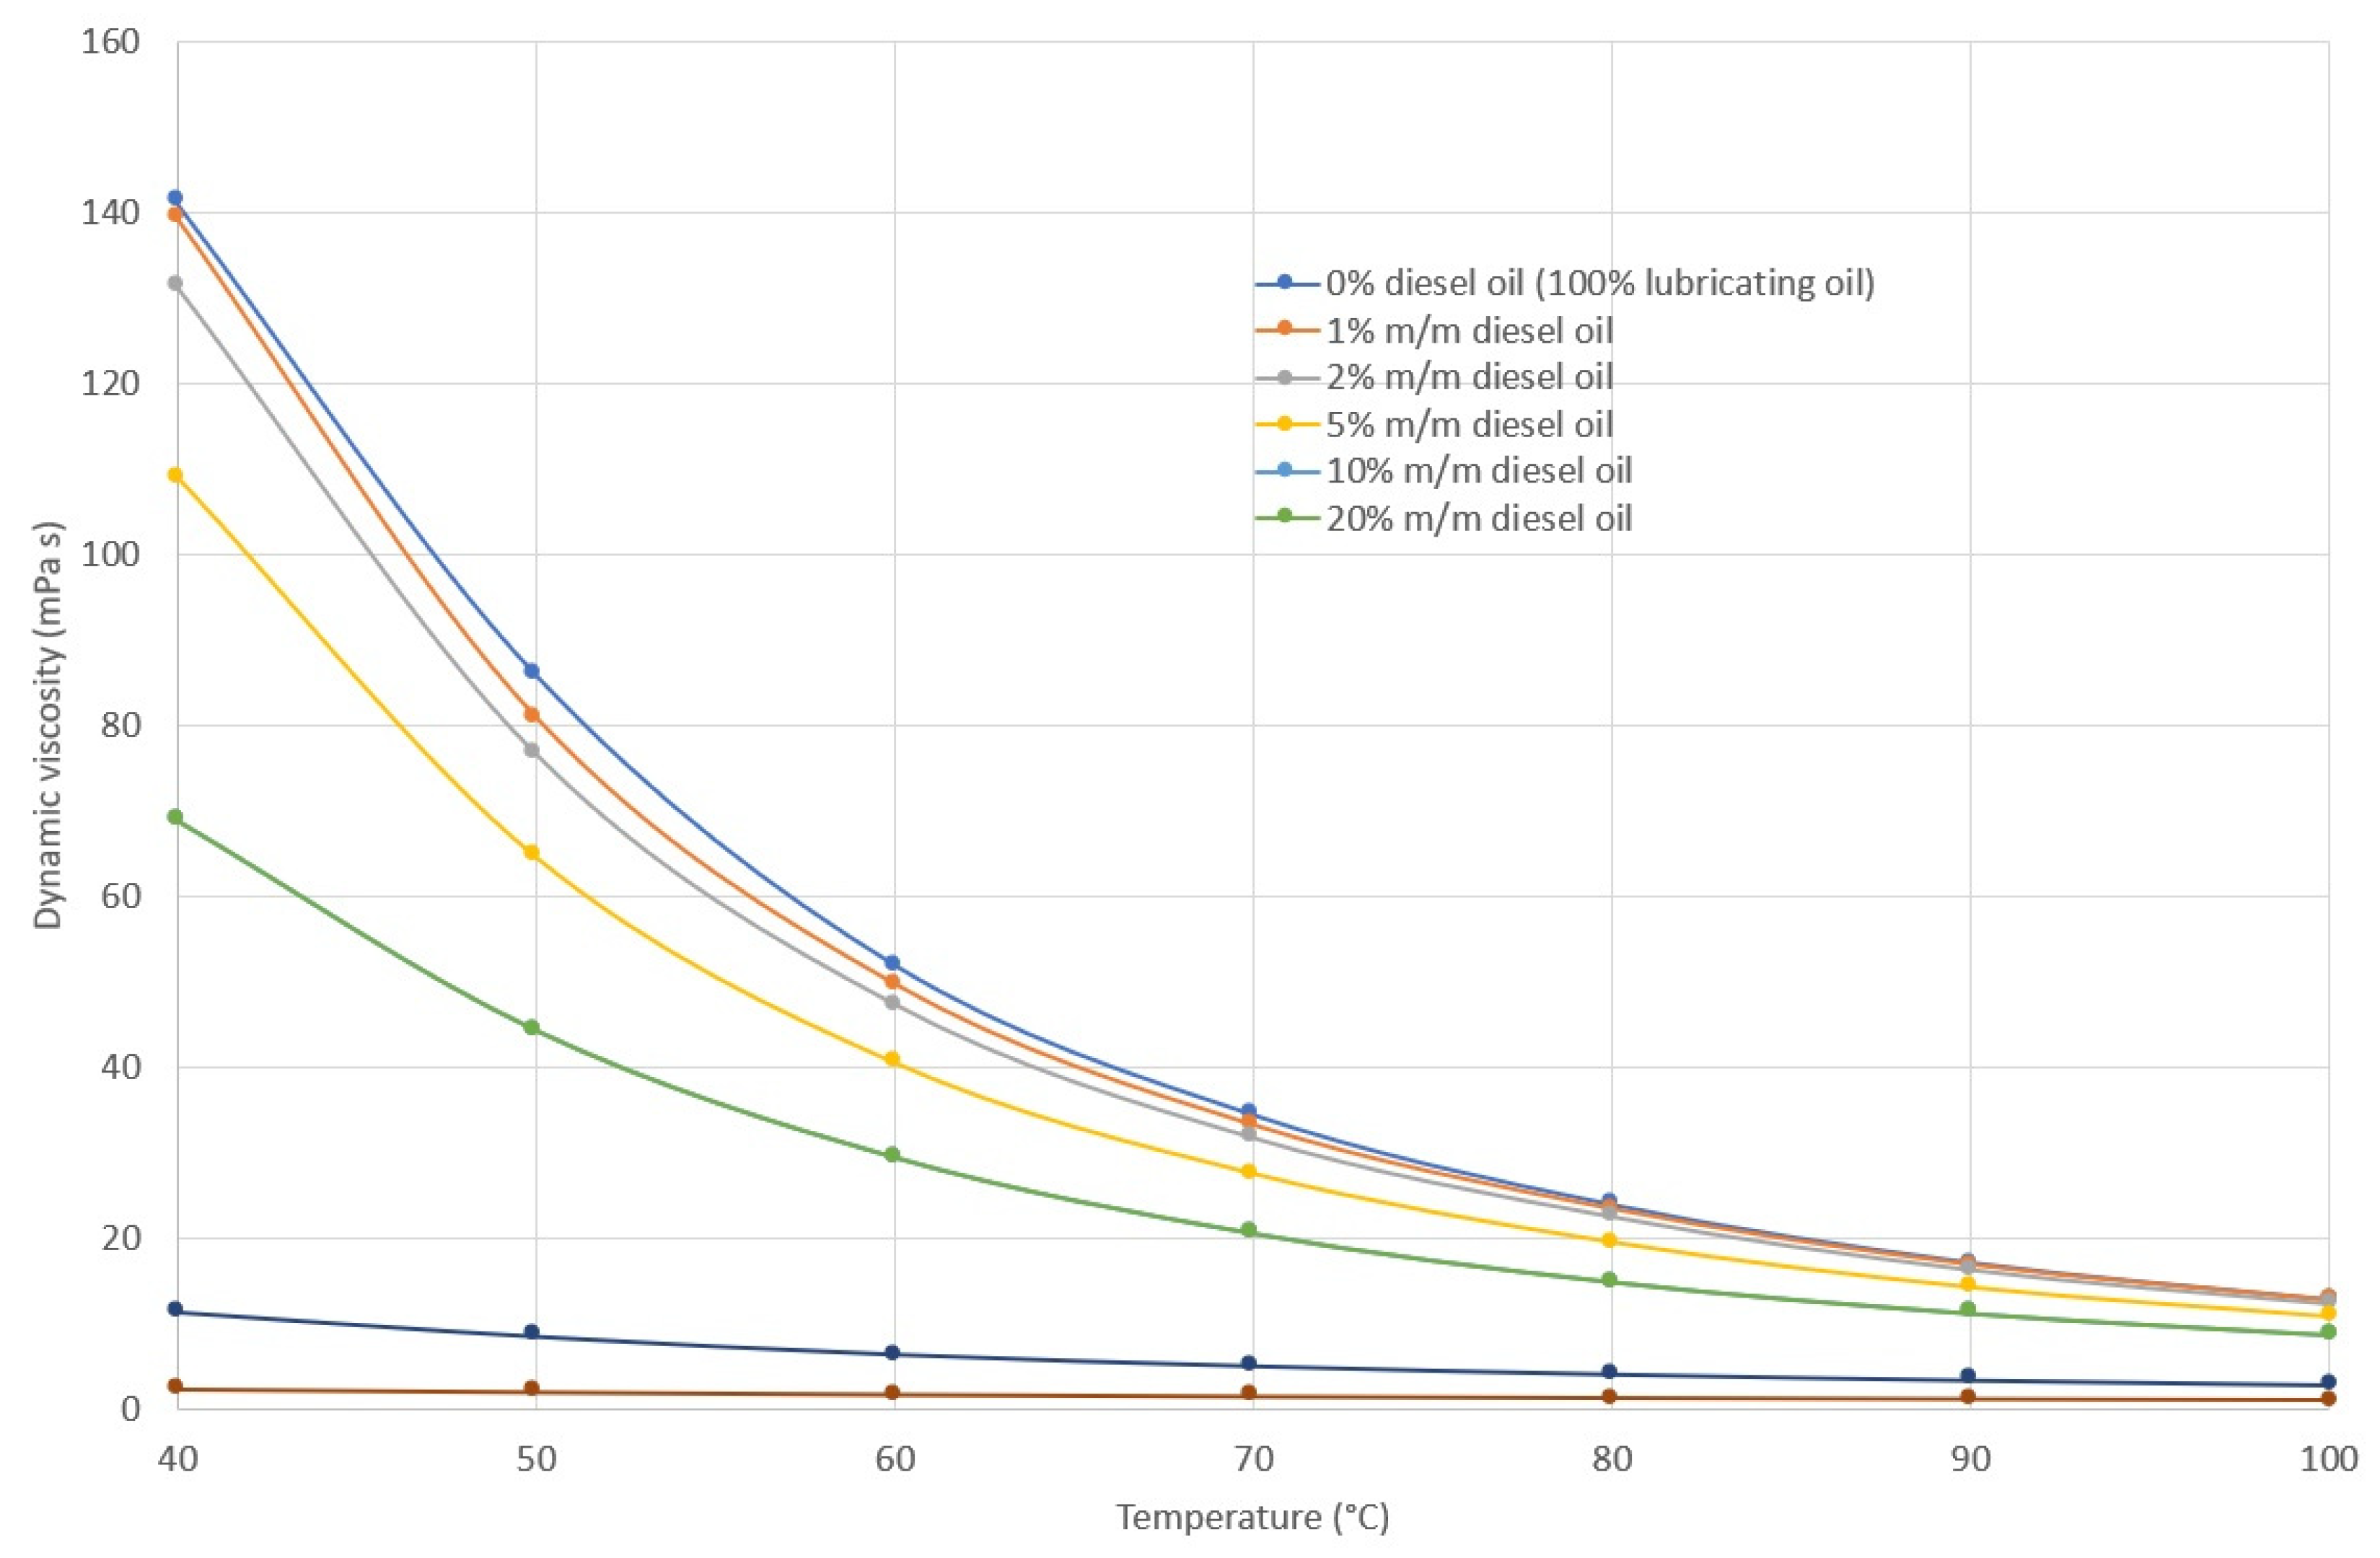
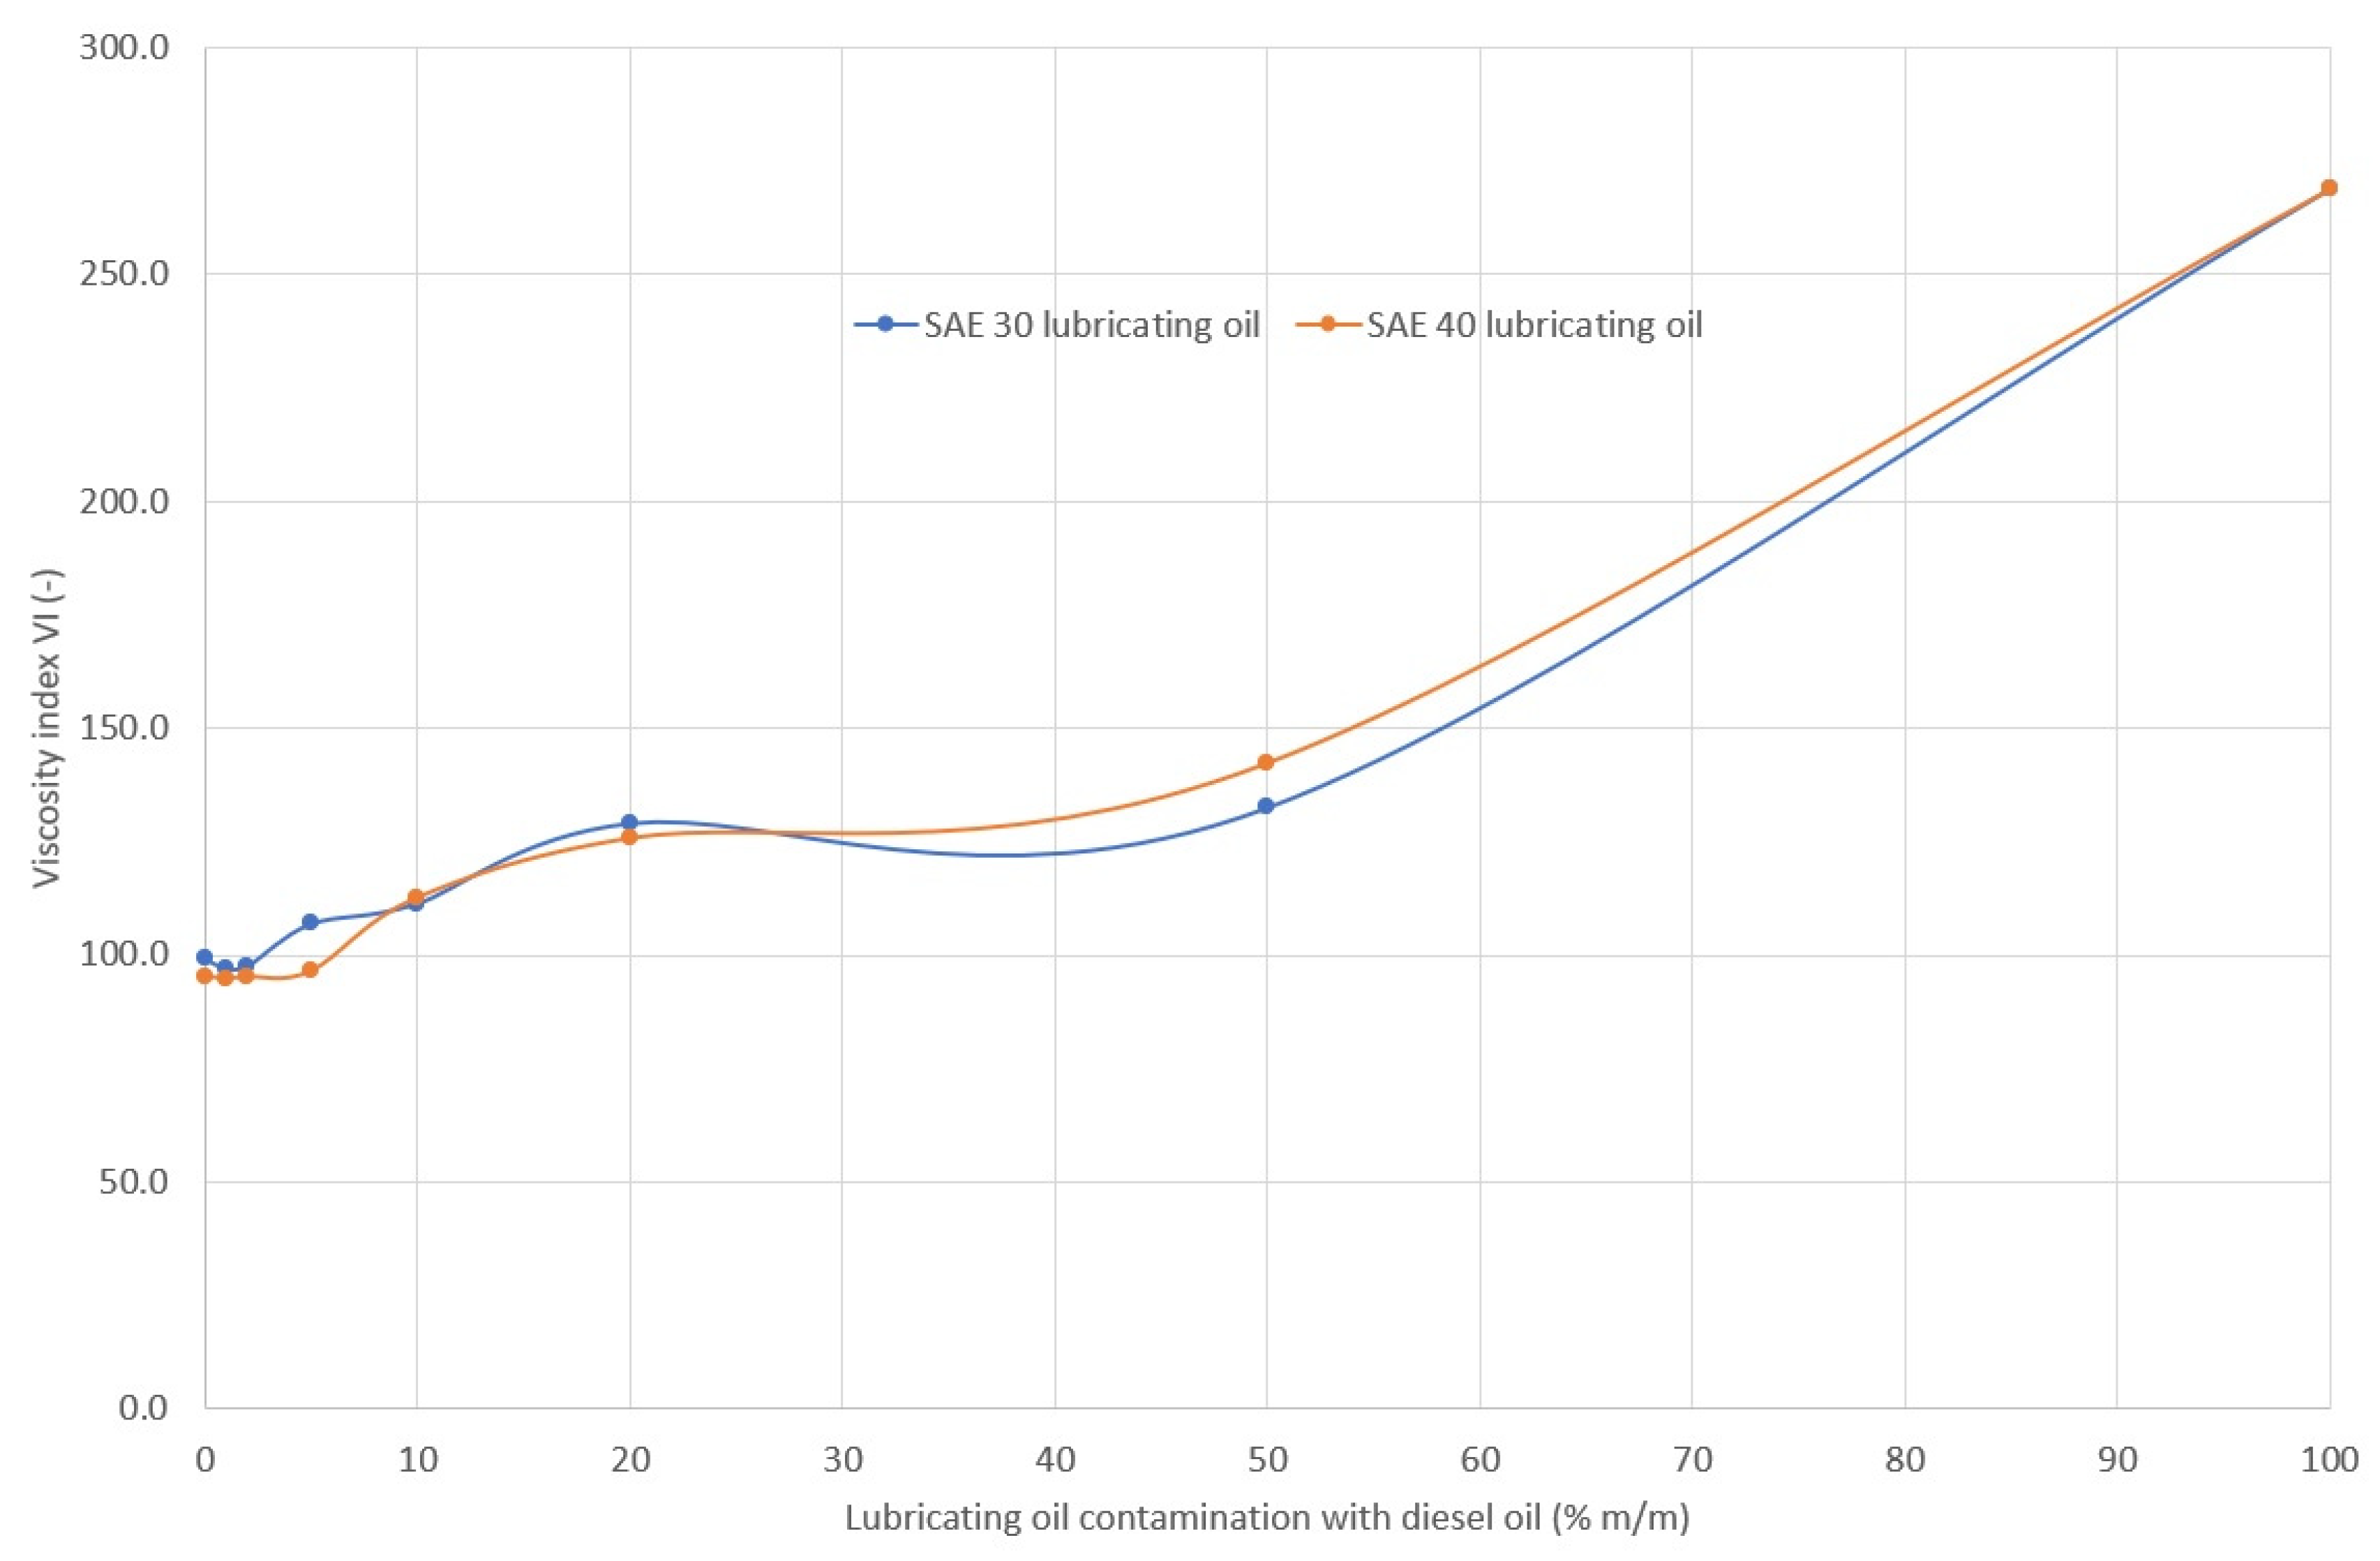
- rheological properties (kinematic viscosity ν, density ρ, temperature coefficient of density change ε, dynamic viscosity η, and viscosity index VI were determined);
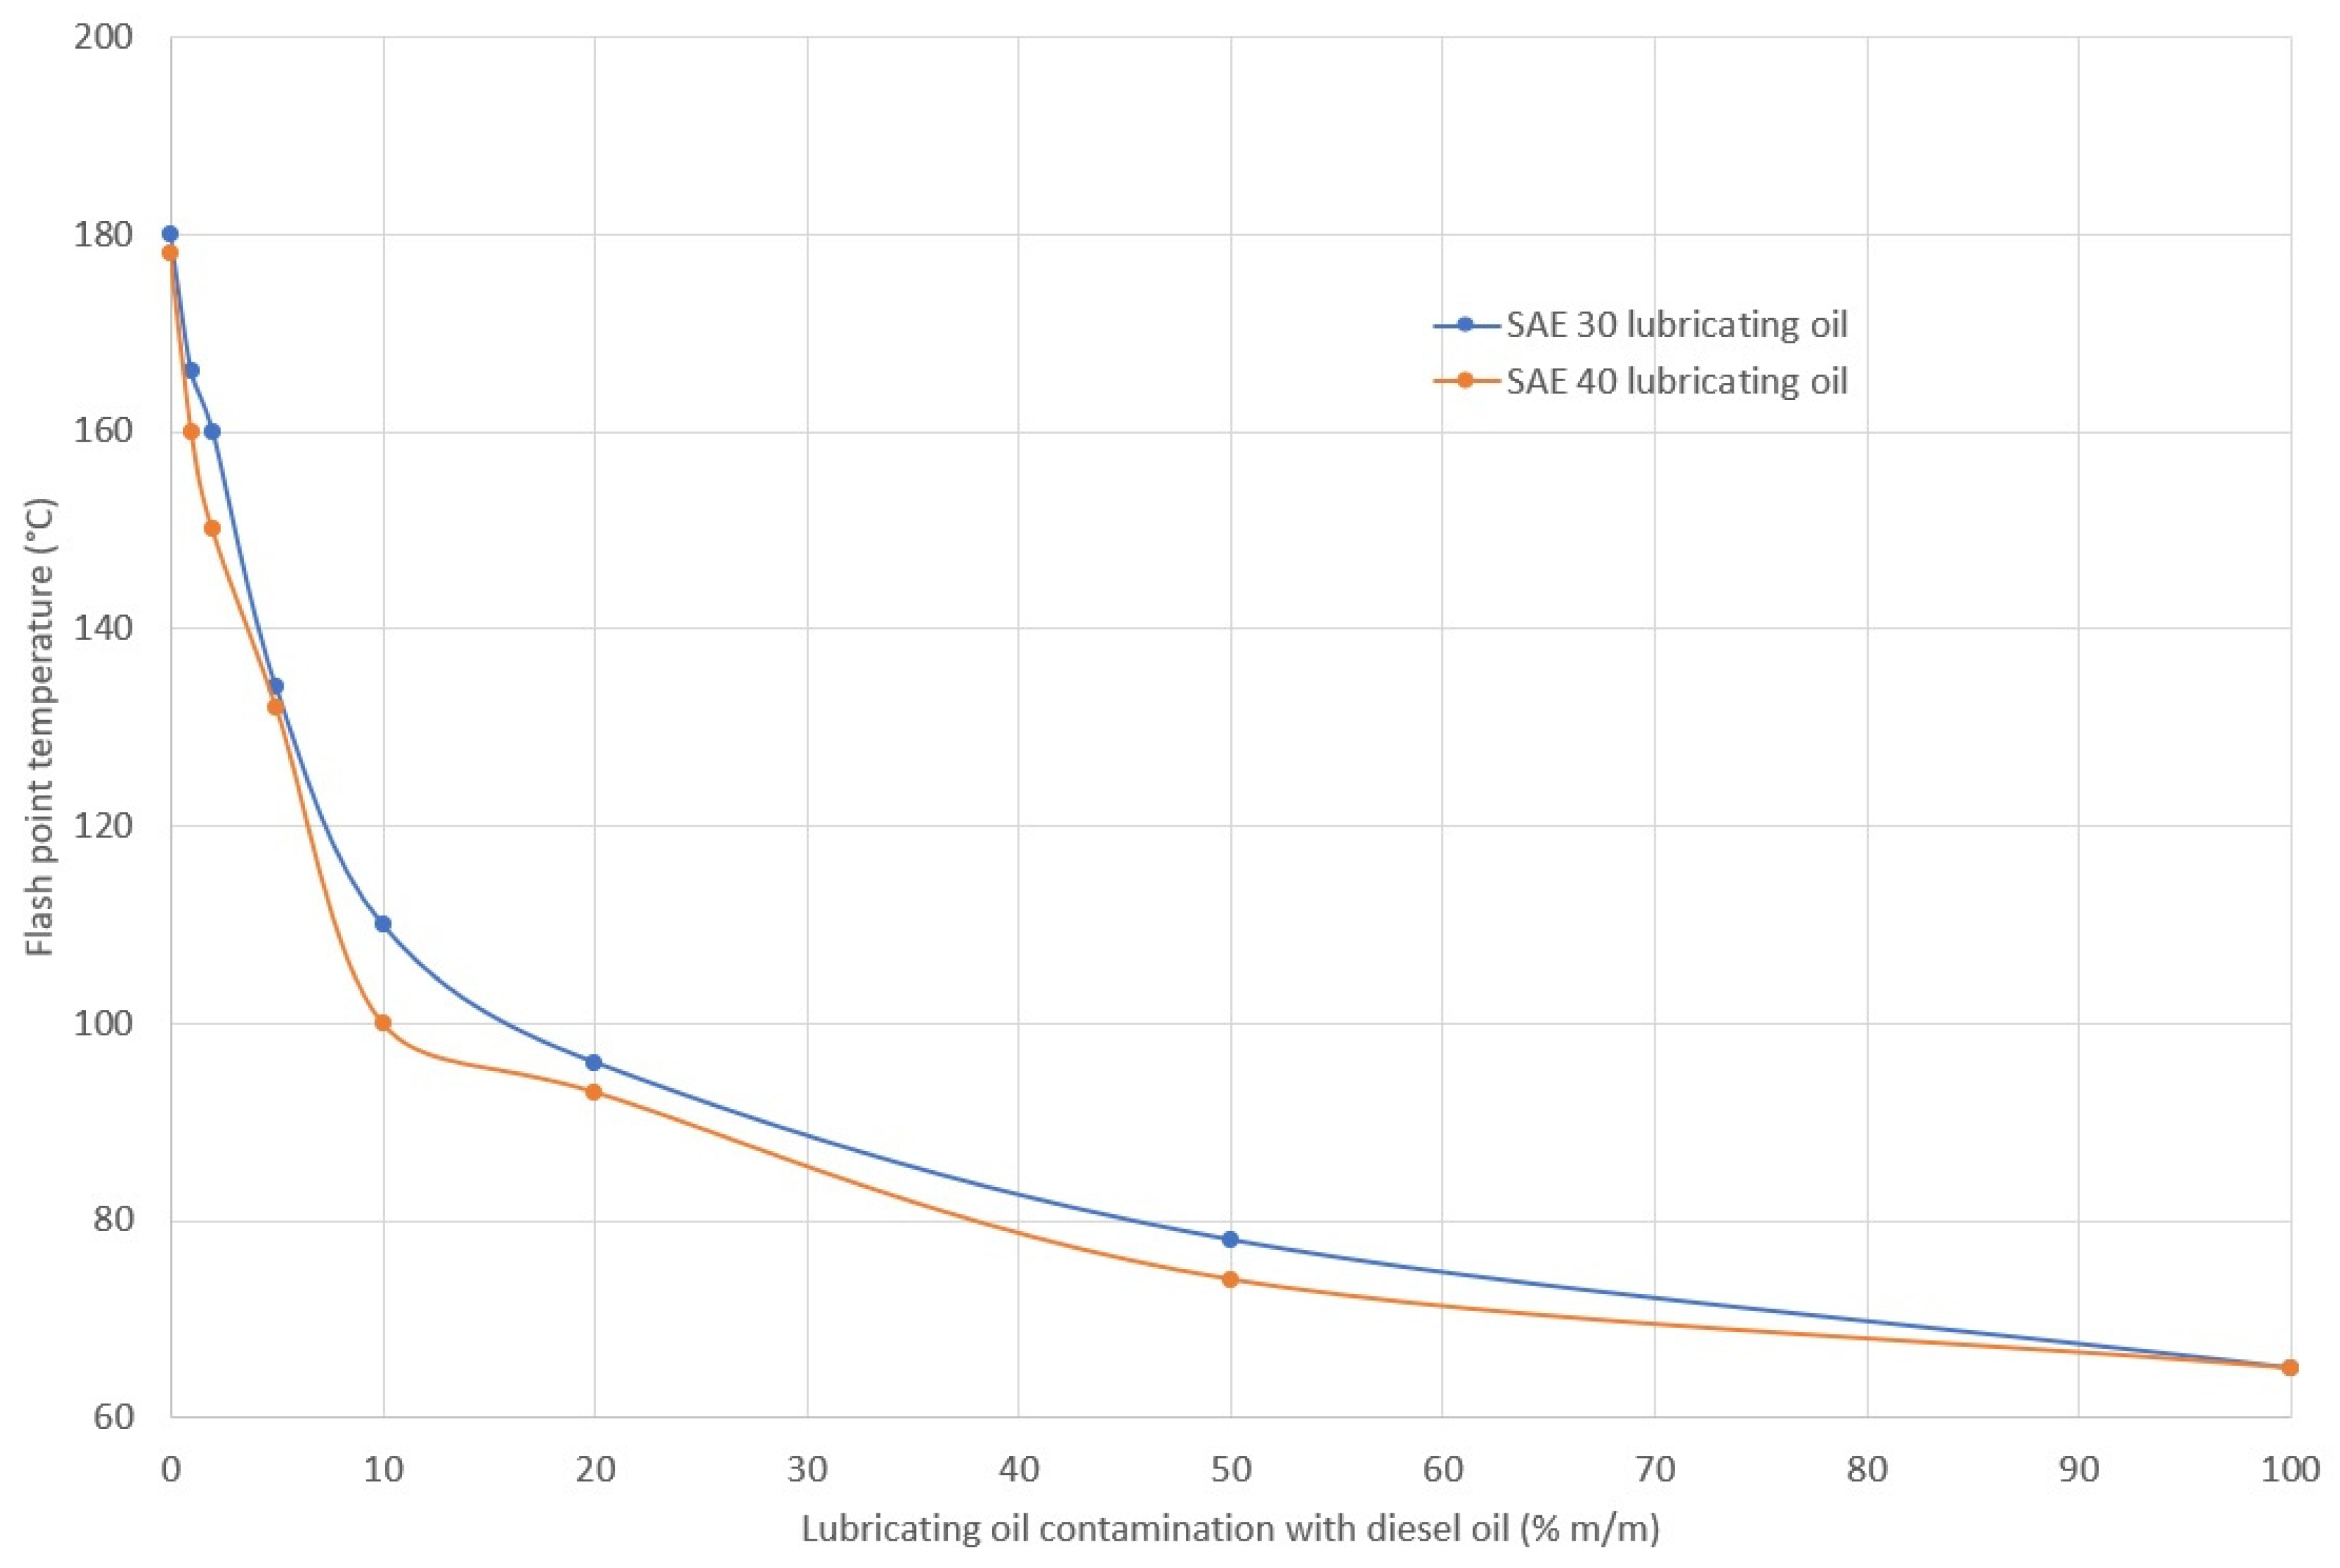
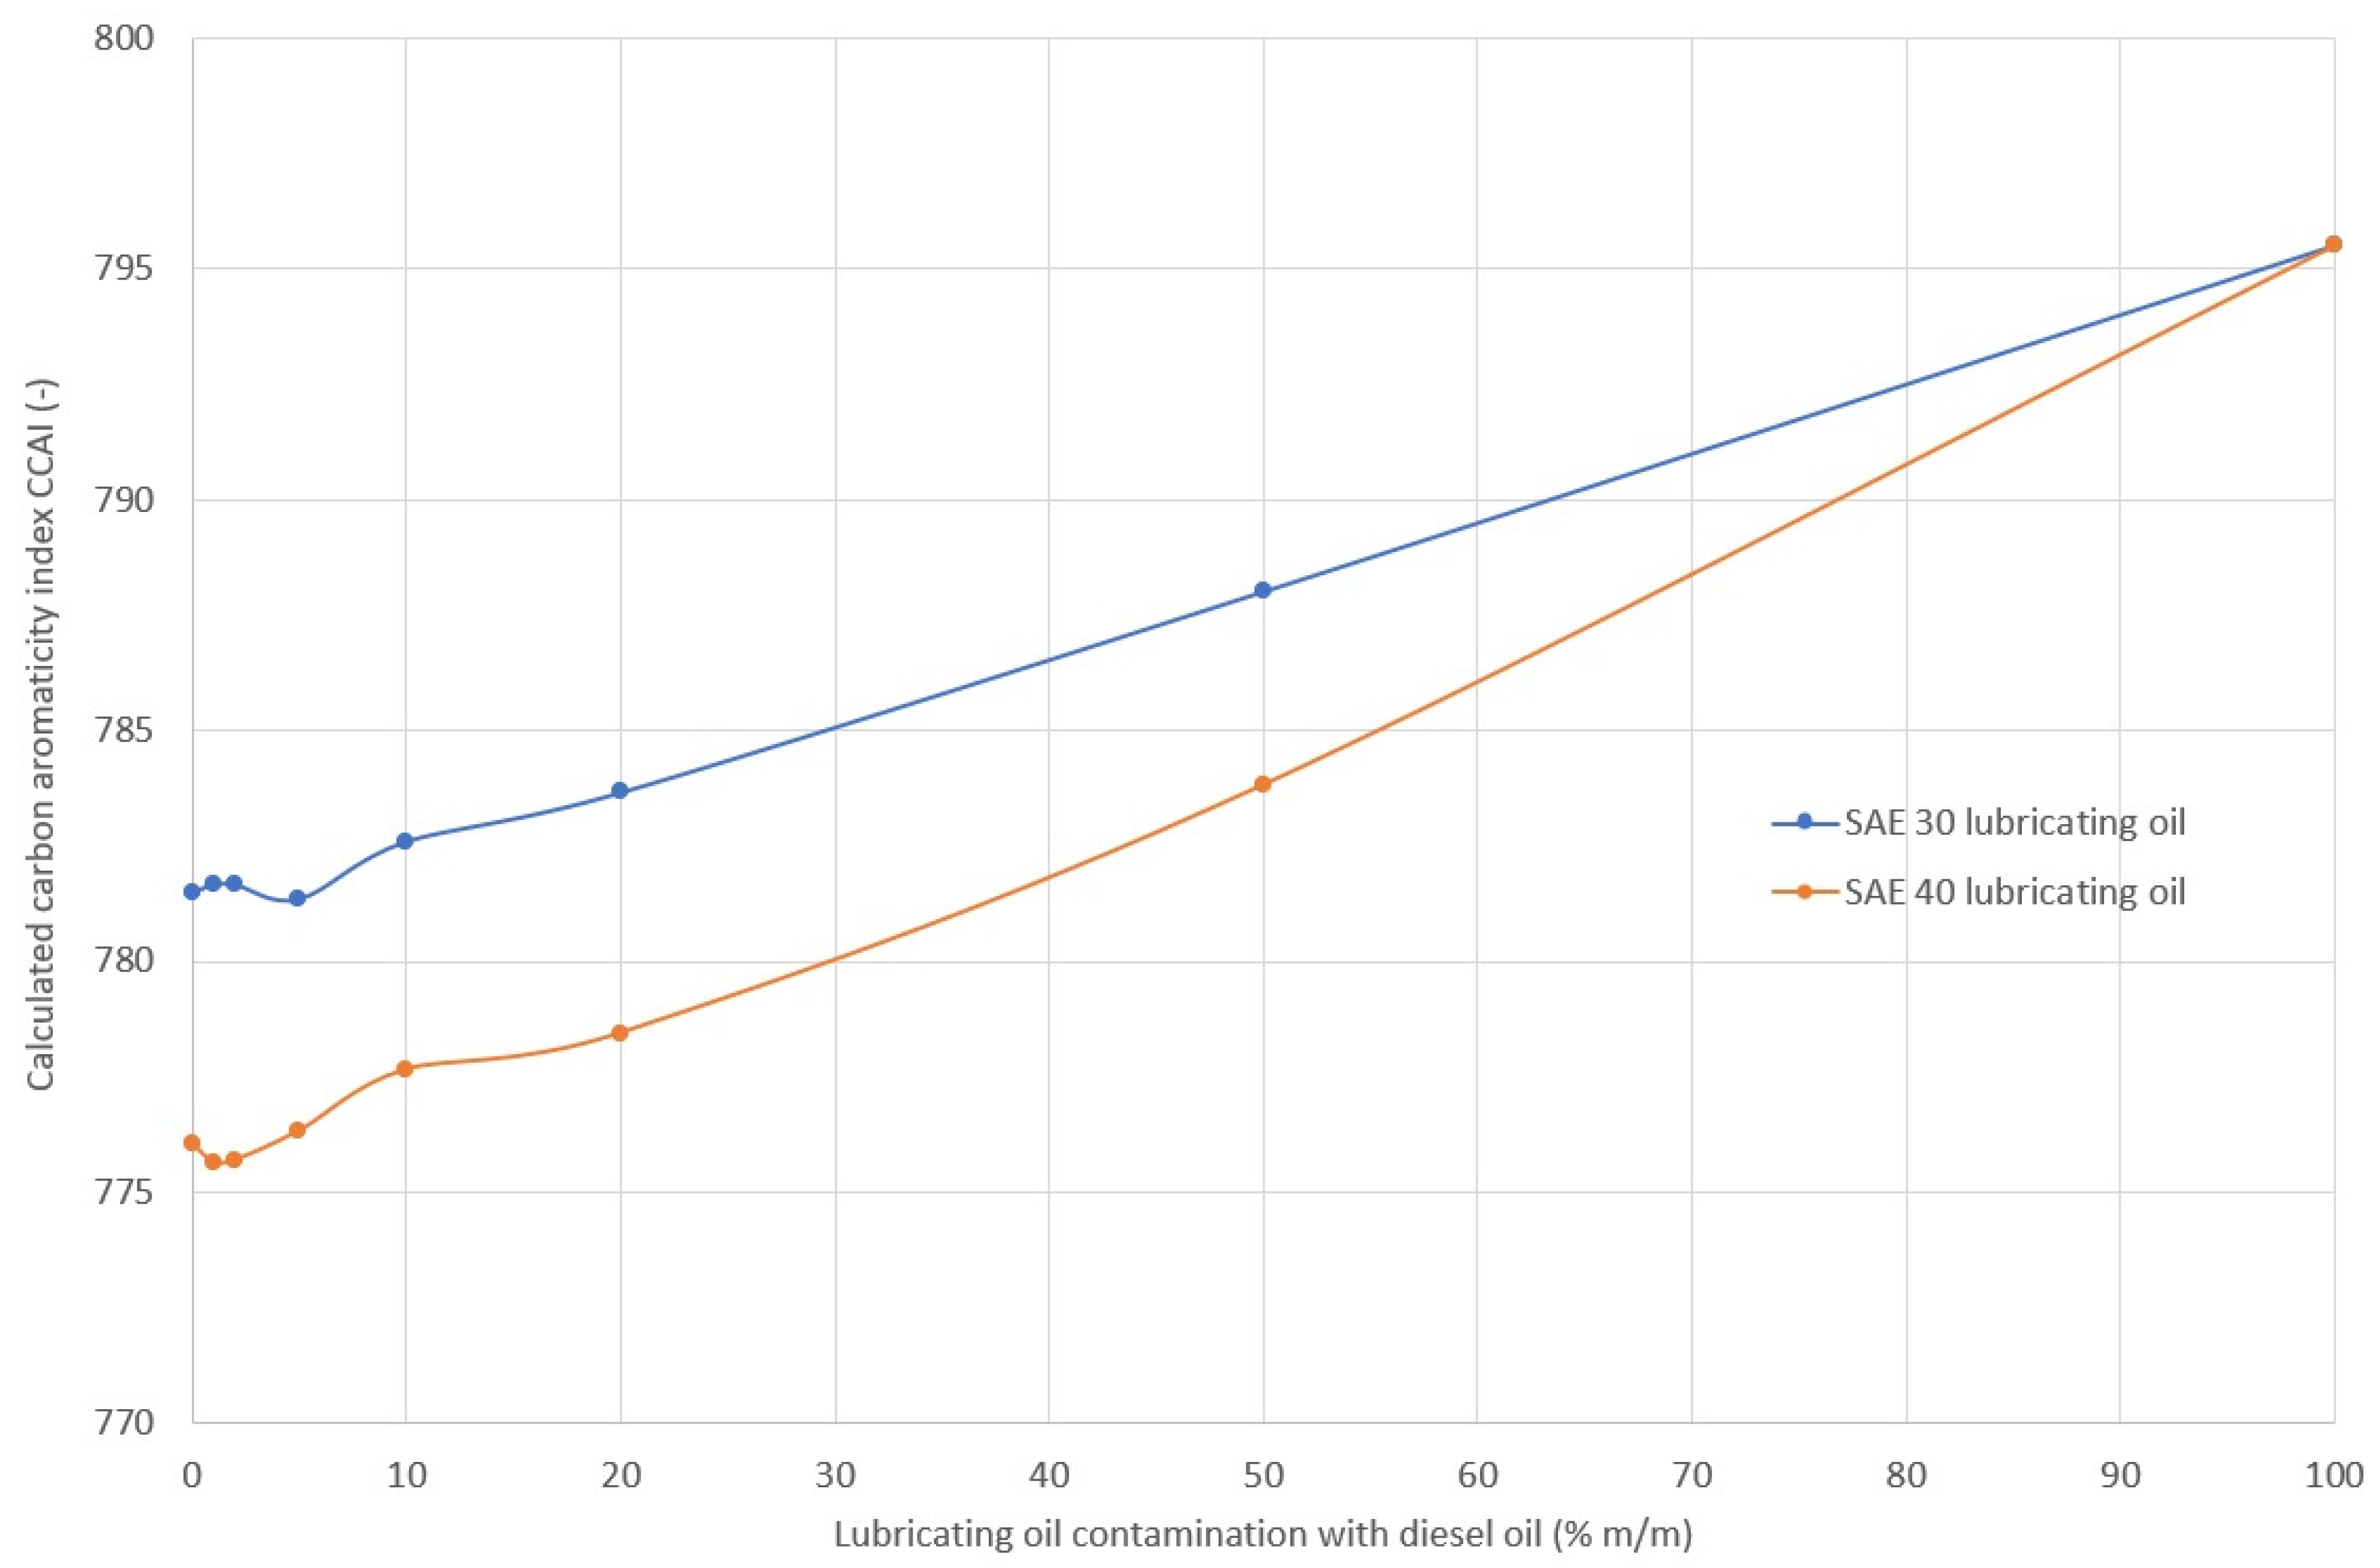
- ignition properties (flash point FP temperature, derived cetane number DCN, calculated cetane index CCI, calculated carbon aromaticity index CCAI, and calculated ignition index CII were determined);
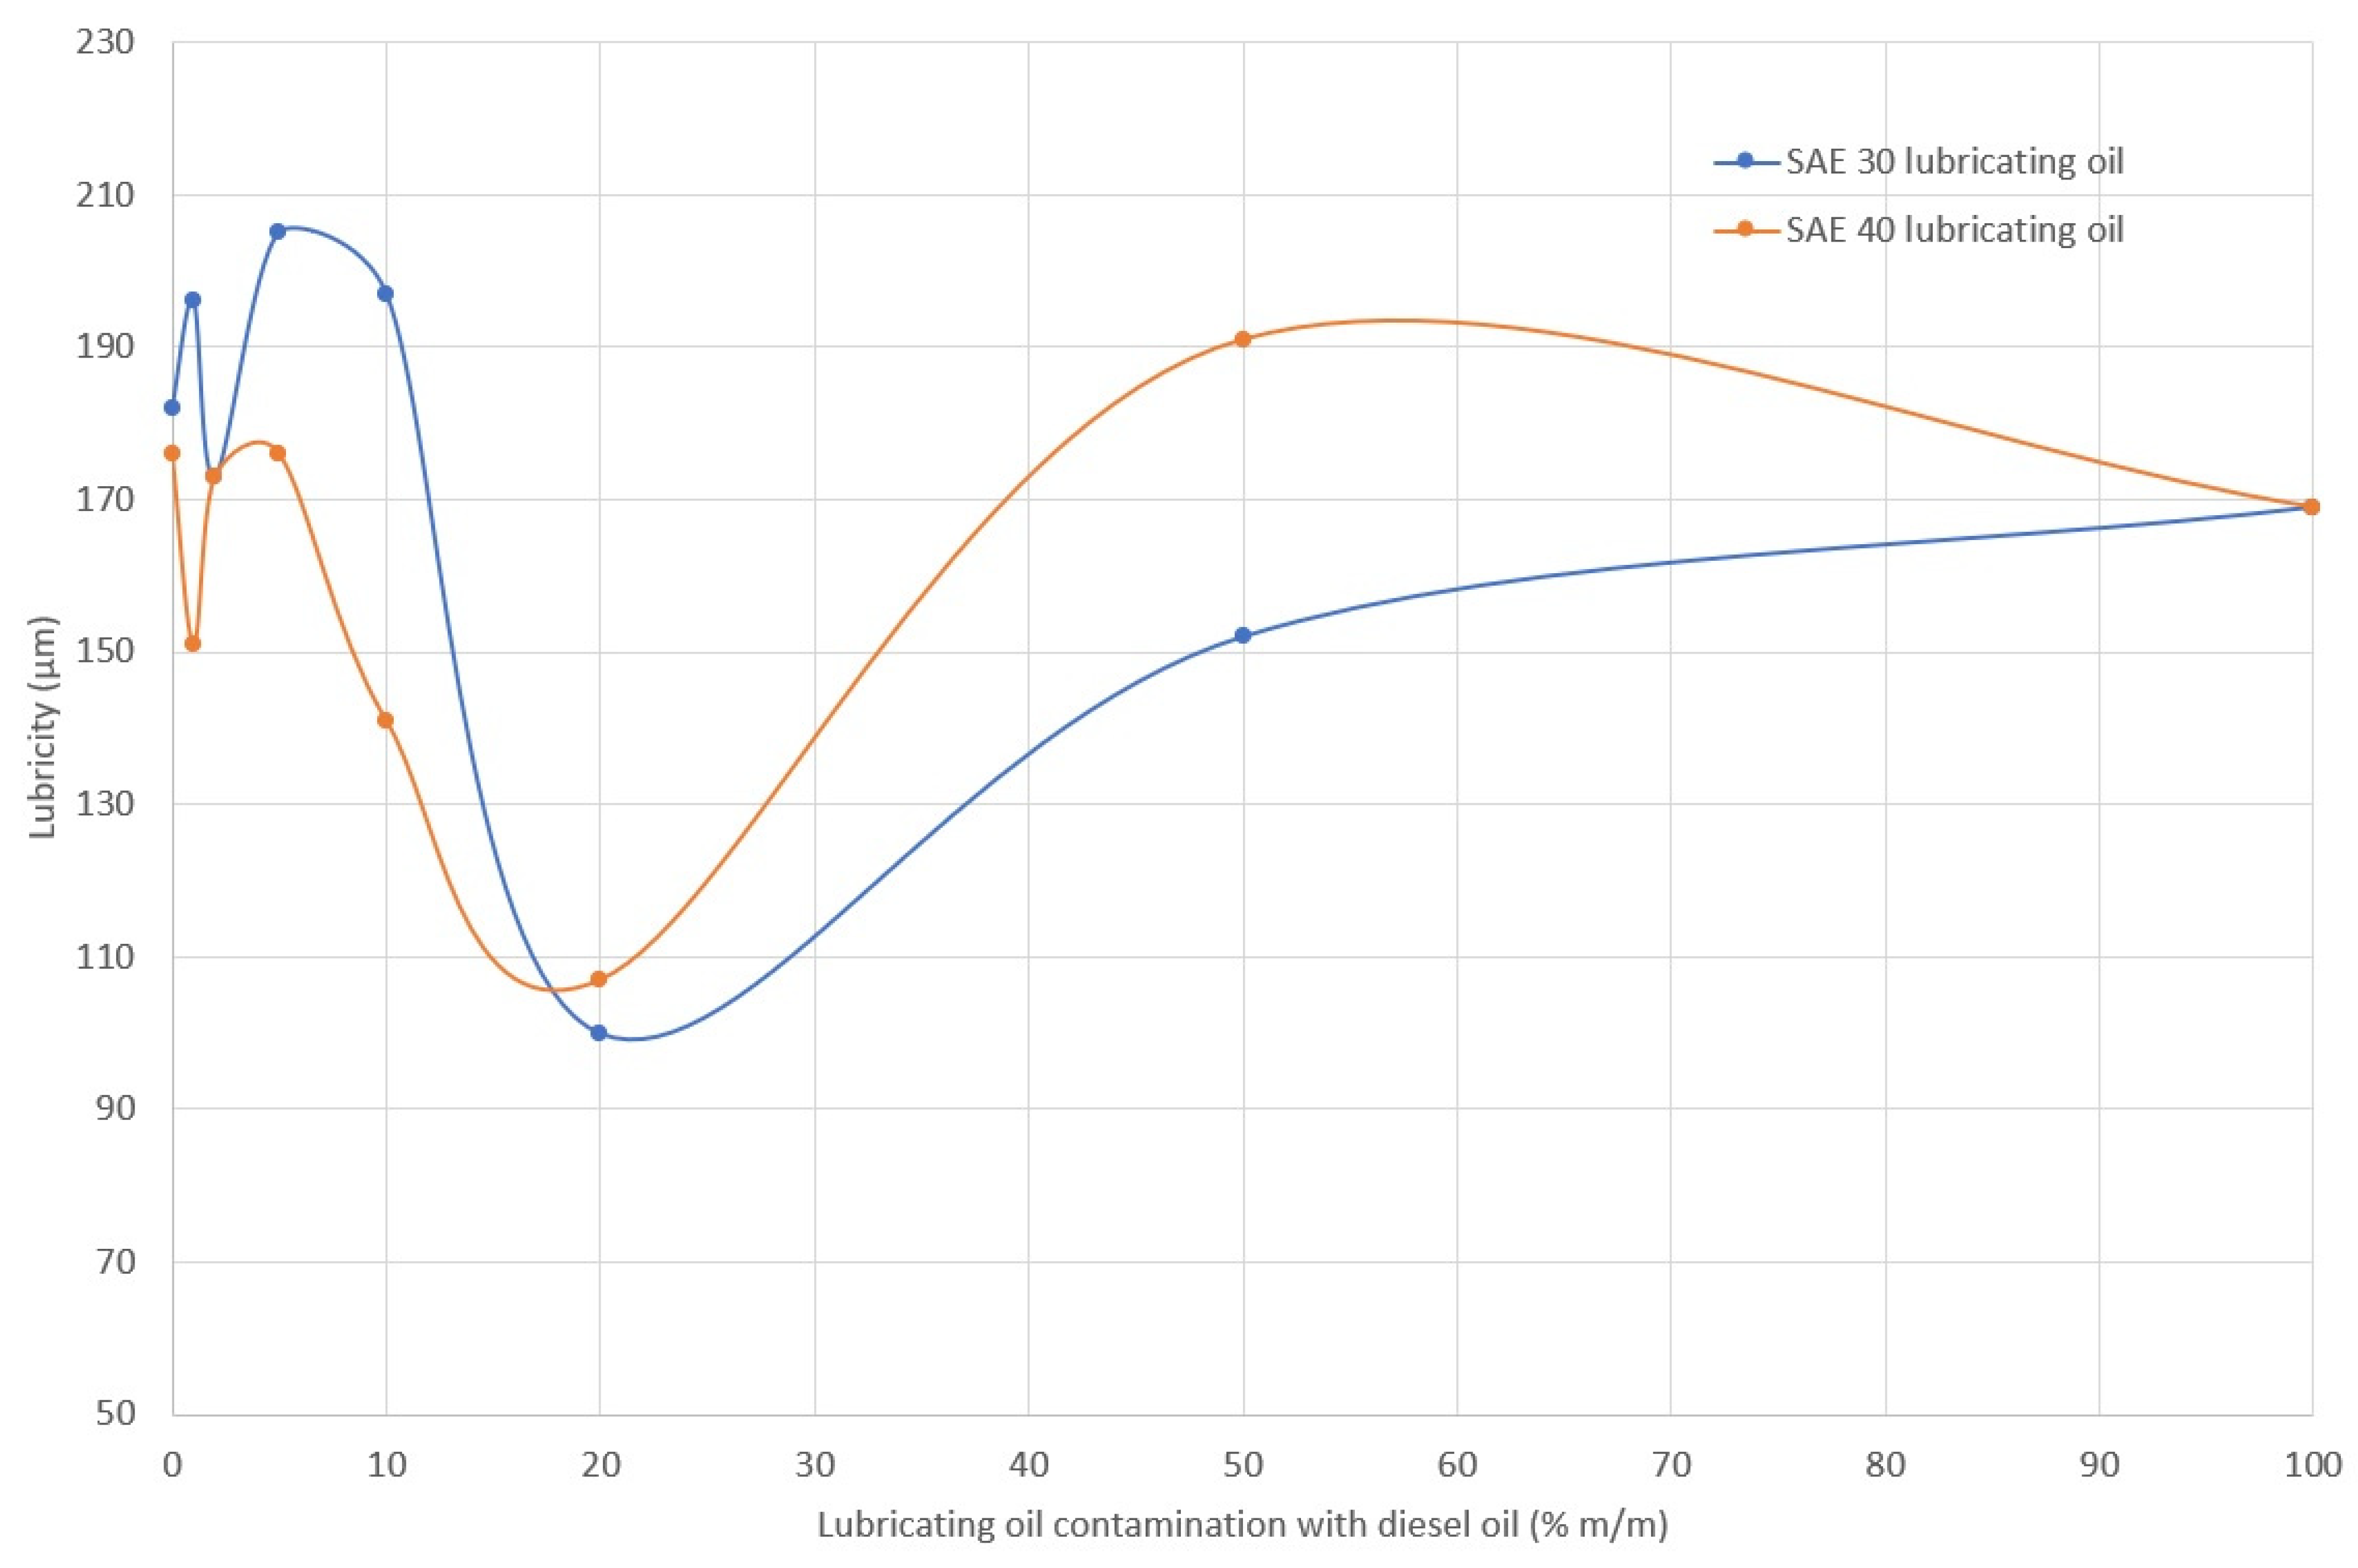
- lubricant properties (the average wear scar diameter WSD during the tribometer test, the coefficient of friction μ under test conditions, and the parameter describing the thickness of the oil film under test conditions FILM were determined).
2.1. Tested Diesel and Lubricating Oils
2.2. Density, Viscosity and Viscosity Index of Lubricating Oil
2.3. Anti-Seizure Properties of Lubricating Oil
2.4. Ignition Properties of Lubricating Oil
- constant volume combustion chamber instrument (CVCC) analyzers such as the ignition quality tester (IQT) according to ASTM D6890, cetane ignition delay (CID) according to ASTM D7668, or fuel ignition tester (FIT) according to ASTM D7170 for measuring the derived cetane number (DCN);
- laboratory methods for determining flammability indices, cetane indices (CI and CCI), and others based on the physical and chemical properties of a substance, e.g., “four variable equations” (ASTM D4737) based on density, 10% 50% and 90% recovery temperatures or “two variable methods” (ASTM D976), which use just density and the 50% recovery temperature.
3. Results and Discussion
3.1. Rheological Properties
3.2. Anti-Seizure Properties of Oil
3.3. Ignition Properties of Oil
4. Final Conclusions
- A decrease in the lubricating oil flash point is an indicator of oil contamination with fuel.
- A change in viscosity does not necessarily indicate contamination (among other contaminations), since, depending on the type of fuel, oil viscosity can:
- not change (engines powered by different fuels);
- decrease (engines powered by distillation fuel);
- increase (engines fueled by residual fuel).
- 3.
- Changing the oil composition can change its viscosity, which alters the distribution of the number and size of droplets in the oil mist. Occurrence of this mist, once set limits are exceeded, promotes the initiation of explosions.
- 4.
- A reduction in the ignition temperature of a mixture may be indirectly associated with a reduction in the autoignition temperature (although not necessarily) [14,75]. If this situation occurs, the risk of explosion increases in view of the higher volatility of diesel fuel than lubricating oil. Contamination of lubricating oil with distillation fuel does not significantly affect the autoignition delay, which, for clean and contaminated oil, corresponds to conditions that can be classified as very good autoignition properties [76].
- 5.
- Deterioration of the tribological conditions of the bearings, as seen in the change in viscosity, viscosity index, and lubricity of the oil, causes an increase in bearing temperature and the possibility of hot spots. Viscosity index, lubricity, coefficient of friction and reduction in oil film resistance change significantly when the concentration of diesel fuel in the lubricating oil exceeds 10%. The observation is in line with some previous works [36]. At such concentrations, increased friction in tribological pairs lubricated with lubricating oil contaminated with diesel fuel can intensify the wear of mating components, increase their temperature, and ultimately intensify the formation of white oil mist in the crankcase.
Funding
Data Availability Statement
Acknowledgments
Conflicts of Interest
Abbreviations
| ASTM | American Society for Testing and Materials | |
| CCE | crankcase explosion | |
| CEA | crankcase explosion apparatus | |
| CFR | Cooperative Fuel Research | |
| CID | cetane ignition delay | |
| CIMAC | International Council on Combustion Engines | |
| CCAI | calculated carbon aromaticity index | |
| CCI | calculated cetane index | |
| CI | cetane index | |
| CII | calculated ignition index | |
| CN | cetane number | |
| CVCC | constant volume combustion chamber | |
| DCN | derived cetane number | |
| DO | diesel oil | |
| ECP | electrical contact potential | |
| FDM | fuel dilution meter | |
| FID | flame ionization detector | |
| FILM | measure of oil film resistance | |
| FIT | fuel ignition tester | |
| FP | flash point temperature | |
| FTIF | Fourier-transform infrared | |
| GC | gas chromatography | |
| HFO | heavy fuel oil | |
| HFRR | high frequency reciprocating rig | |
| IEC | International Electrotechnical Commission | |
| IQT | ignition quality tester | |
| ISO | International Organization for Standardization | |
| SAE | Society of Automotive Engineers | |
| SAE 30, SAE 40 | viscosity grades of lubricating oils according to SAE J300-2021 standard | |
| SAW | surface acoustic wave | |
| VI | viscosity index | |
| WSD | wear scar diameter | |
| Symbols | ||
| m | mass of the substance | |
| t | measured temperature of the substance under operating conditions | |
| V | volume of the substance | |
| shear rate | ||
| ε | the coefficient of change of density of a substance when it is heated by 1 °C | |
| η | dynamic viscosity of the substance | |
| λ | thermal conductivity coefficient | |
| μ | coefficient of friction | |
| ν | kinematic viscosity of the substance | |
| ρ | density of the substance | |
| ρ15 | density of the substance at 15 °C | |
| ρt | density of the substance at temperature t | |
| τ | time | |
| shear stresses | ||
Appendix A

| Action | Effect | What to Do |
|---|---|---|
| Continued operation with stops and start. | The fuel does not burn off completely. | Reduce the mileage change interval to the strictest change interval indicated by the manufacturer. |
| Starting in the cold. | The fuel does not burn off well because the combustion temperature is low. | Wait for the engine to increase in temperature before accelerating. |
| Problems in the injection system. | The droplets of fuel being injected into the chamber are big, leading to poor combustion. | Incomplete combustion is occurring; inspect the injectors. |
| Poor combustion. | The fuel is not burning off completely. | Incomplete combustion is occurring. Check that the combustion chamber and the injection system are working properly. |
| Worn-out engine parts: valve guides, injectors, and wear. | Conditions change in the combustion chamber, meaning it is no longer optimized. | Inspect the engine and injectors. |
| Excessive acceleration. | Excess inflow of fuel. | Incomplete combustion is occurring; adjust control system. |
| Mixture of rich fuels. | Excess fuel. | Incomplete combustion is occurring; inspect the injection system. |
| Faulty injectors. | Can produce excessive inflow of fuel or inadequate fuel injection. | It does not burn fuel as well, resulting in deposits. Inspection of the injection system. |
| Method | Advantages | Disadvantages |
|---|---|---|
| Gas Chromatography | Widely accepted industry standard Highly precise Suited for high volume labs Can detect biodiesel and ethanol | Can only be carried out in a lab Mandates costly equipment and gases Takes much time to produce best results Requires an expensive equipment and gases |
| Viscosity Analysis | The availability of portable instruments and lab instruments Accepted routine test for testing lubricant condition Optimum screening test for probable fuel dilution Ability to detect ethanol and biodiesel | Inability to definitively indicate fuel dilution issue Mandates a careful technician |
| Flash Point Testing | A pass/fail result is enough in the case of most applications Ability to detect ethanol Very little sample required (1–2 mL) | Inability to detect biodiesel Mandates a careful technician Knowledge of the oil/fuel type mandatory for quantitative measurement Risks posed by heating fuel-laden samples |
| FTIR Spectroscopy | Low cost per sample after initial equipment purchase; test can be carried out quickly | Mandates the use of costly equipment; calibrations are mostly specific to a narrow sample type |
| Surface Acoustic Wave Sensing | Easy to use Portable Requires only 0.5 mL of sample Less expensive than gas chromatographs Can complete the test quickly Easily adaptable to different oil/fuel types | Inability to measure biodiesel Mandates calibration with a reference fluid |
| Specification | Parameter |
|---|---|
| Cetane index | ≤51 |
| Initial boiling point | 75–180 °C |
| Boiling temperature range | 95% vol. distils to 360 °C |
| Flash point (determined in a closed crucible) | >56 °C |
| Autoignition temperature (according to DIN51794:2003-05) | approx. 240 °C |
| Kinematic viscosity (according to EN ISO 3104) | 1.5–4.5 mm2/s (2.549 mm2/s) at 40 °C approx. 2.151 mm2/s at 50 °C |
| Density | 820–845 kg/m3 at 15 °C |
| Relative vapor density | approx. 6 (air = 1) |
| Cloud point | −7 °C |
| Cold filter plugging point | −8 °C |
| Specification | Parameter | |
|---|---|---|
| Oil | Agip Cladium 120 SAE 30 CD | Agip Cladium 120 SAE 40 CD |
| Kinematic viscosity (according to EN ISO 3104) | 108 mm2/s at 40 °C 12.0 mm2/s at 100 °C | 160 mm2/s at 40 °C 15.7 mm2/s at 100 °C |
| Viscosity index | 100 | 100 |
| Total base number | 12 mg KOH/g | 12 mg KOH/g |
| Flash point (marked in closed crucible) | 225 | 235 °C |
| Pour point | −18 °C | −15 °C |
| Density | 895 kg/m3 at 15 °C | 900 kg/m3 at 15 °C |
| Tribometer | Friction Association | Type of Contact | Application of Tests |
|---|---|---|---|
| Four-ball machine |  | Punctual | Testing the anti-wear properties of lubricating oils, plastic lubricants and other operating fluids. |
| Timken | 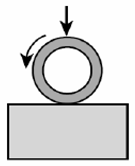 | Linear | Testing the anti-wear properties of plastic lubricants. |
| Falex | 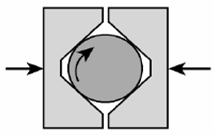 | Linear | Testing the properties of the solid lubrication film, anti-wear properties of lubricating oils and the properties of plastic lubricants. |
| Almen-Eieland |  | Surface | Testing the anti-wear properties and maximum load of lubricating oils and plastic lubricants. |
| FZG |  | Linear | Testing the anti-wear properties of lubricating oils and plastic lubricants, especially gear oils. |
| Vickers | 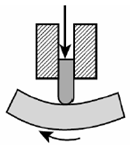 | Punctual | Testing the anti-wear properties of thermo-oxidizing fluids hydraulic fluids, turbine oils, gear oils. |
| HFFR | 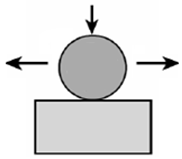 | Punctual | Testing the anti-wear properties of diesel oils, heating oils and lubricating oils. |
| ASTM Standard | CN Applicable Range | Range (mix.—min.) | Instrument |
|---|---|---|---|
| D6890 (DCN) | 33–64 | 31.0 | IQT (CVCC) |
| 64–100 | 36.0 | ||
| D613 (CN) | 40–56 | 16.0 | CFR engine |
| D7170 (DCN) | 39.5–55.2 | 15.7 | FIT (CVCC) |
| D7668 (DCN) | 39.4–66.8 [66] | 27.4 [66] | CID 510 (CVCC) |
| 35.0–60.0 [67] | 25.0 [67] | ||
| 15.0–100.0 [68] | 85.0 [68] | ||
| D976 (CI) | 30–60 | 30.0 | Correlation |
| D4737 (CCI) | 32.5–56.5 | 24.0 | Correlation |
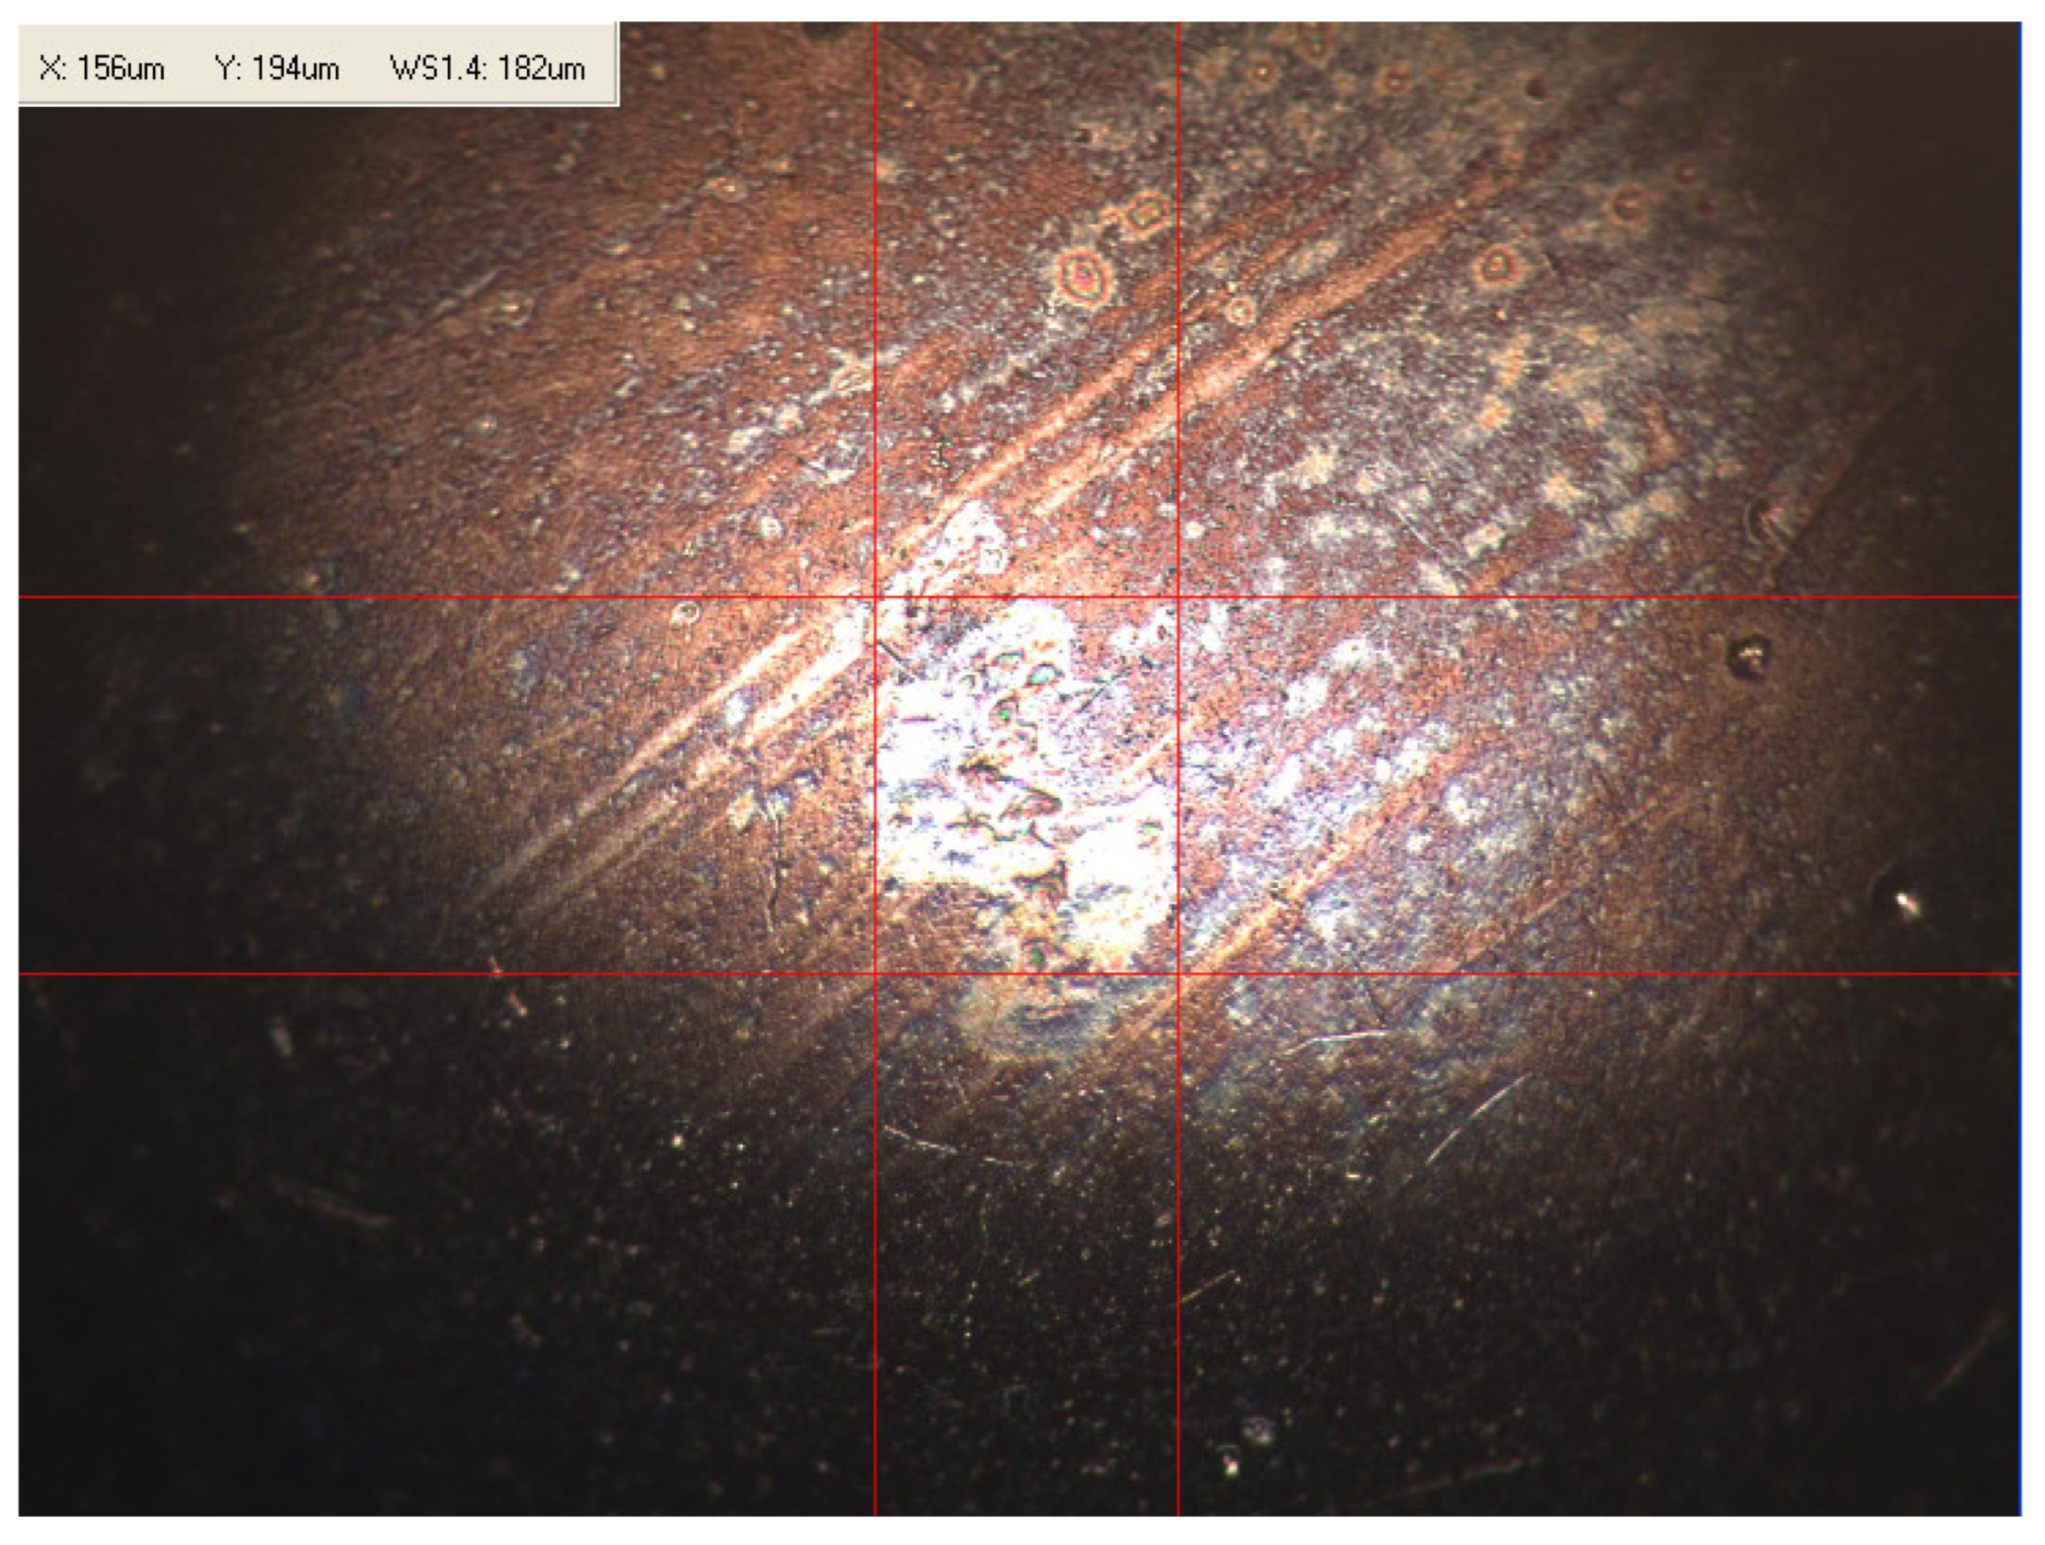
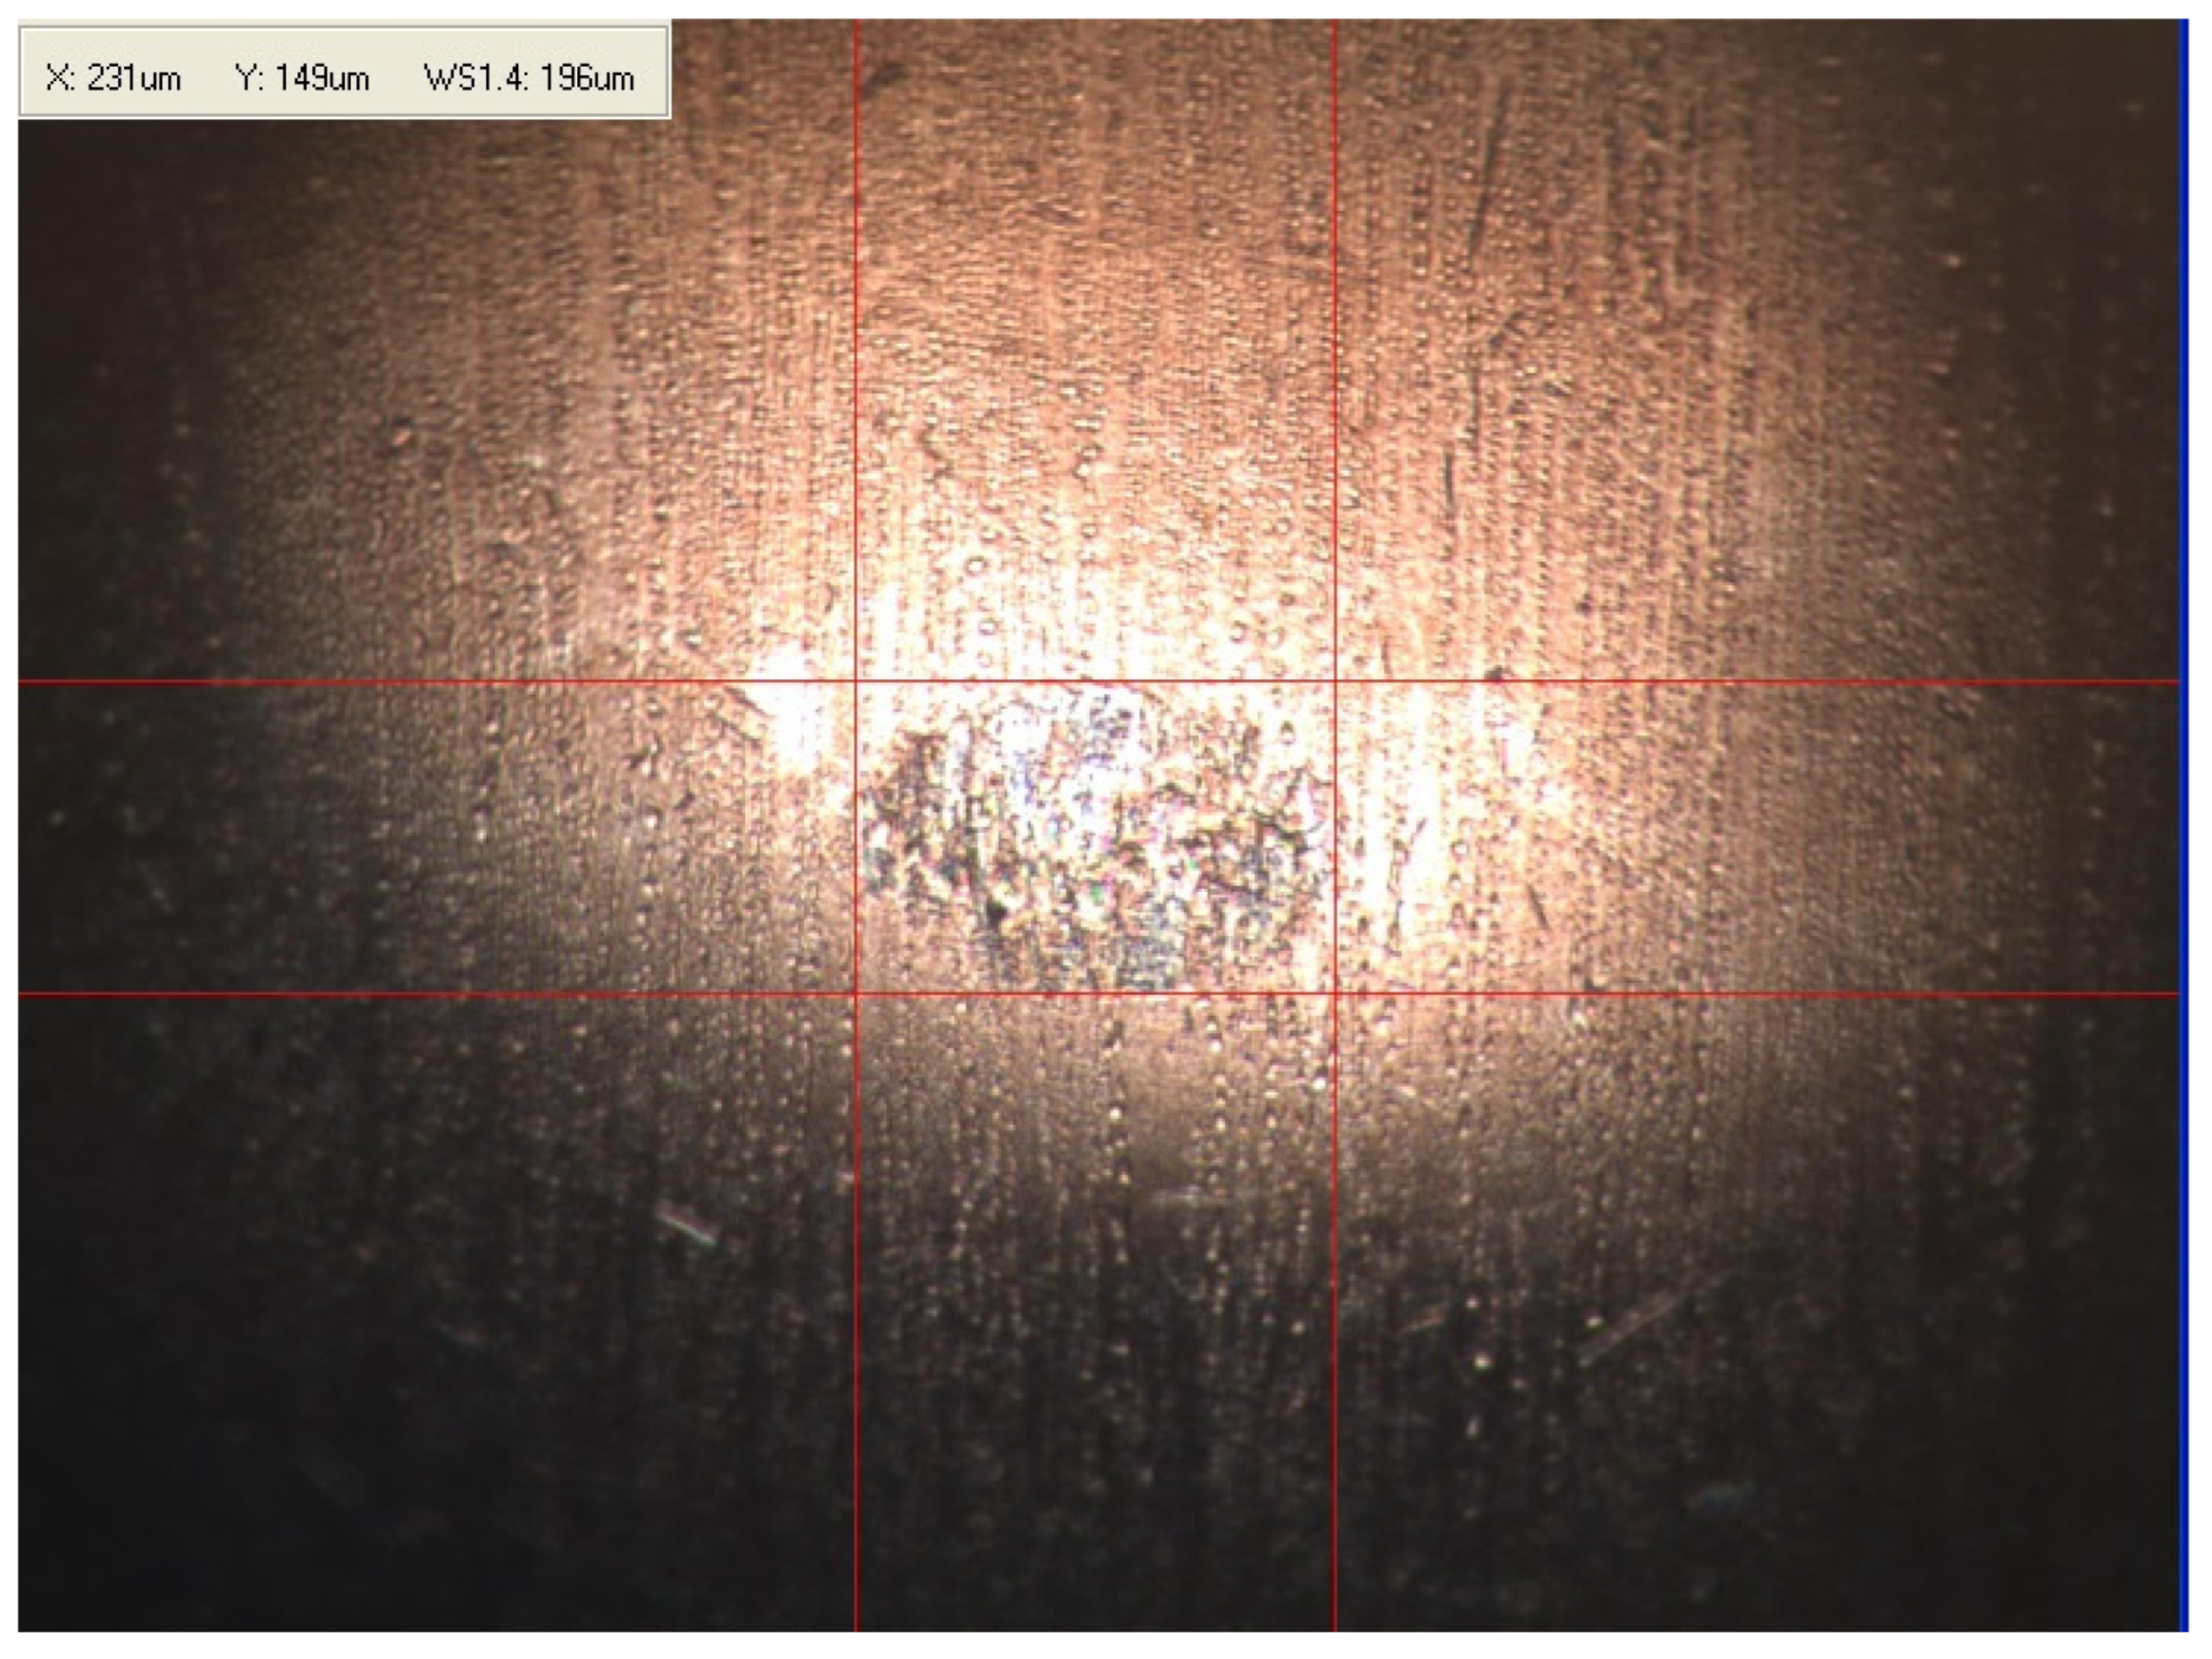
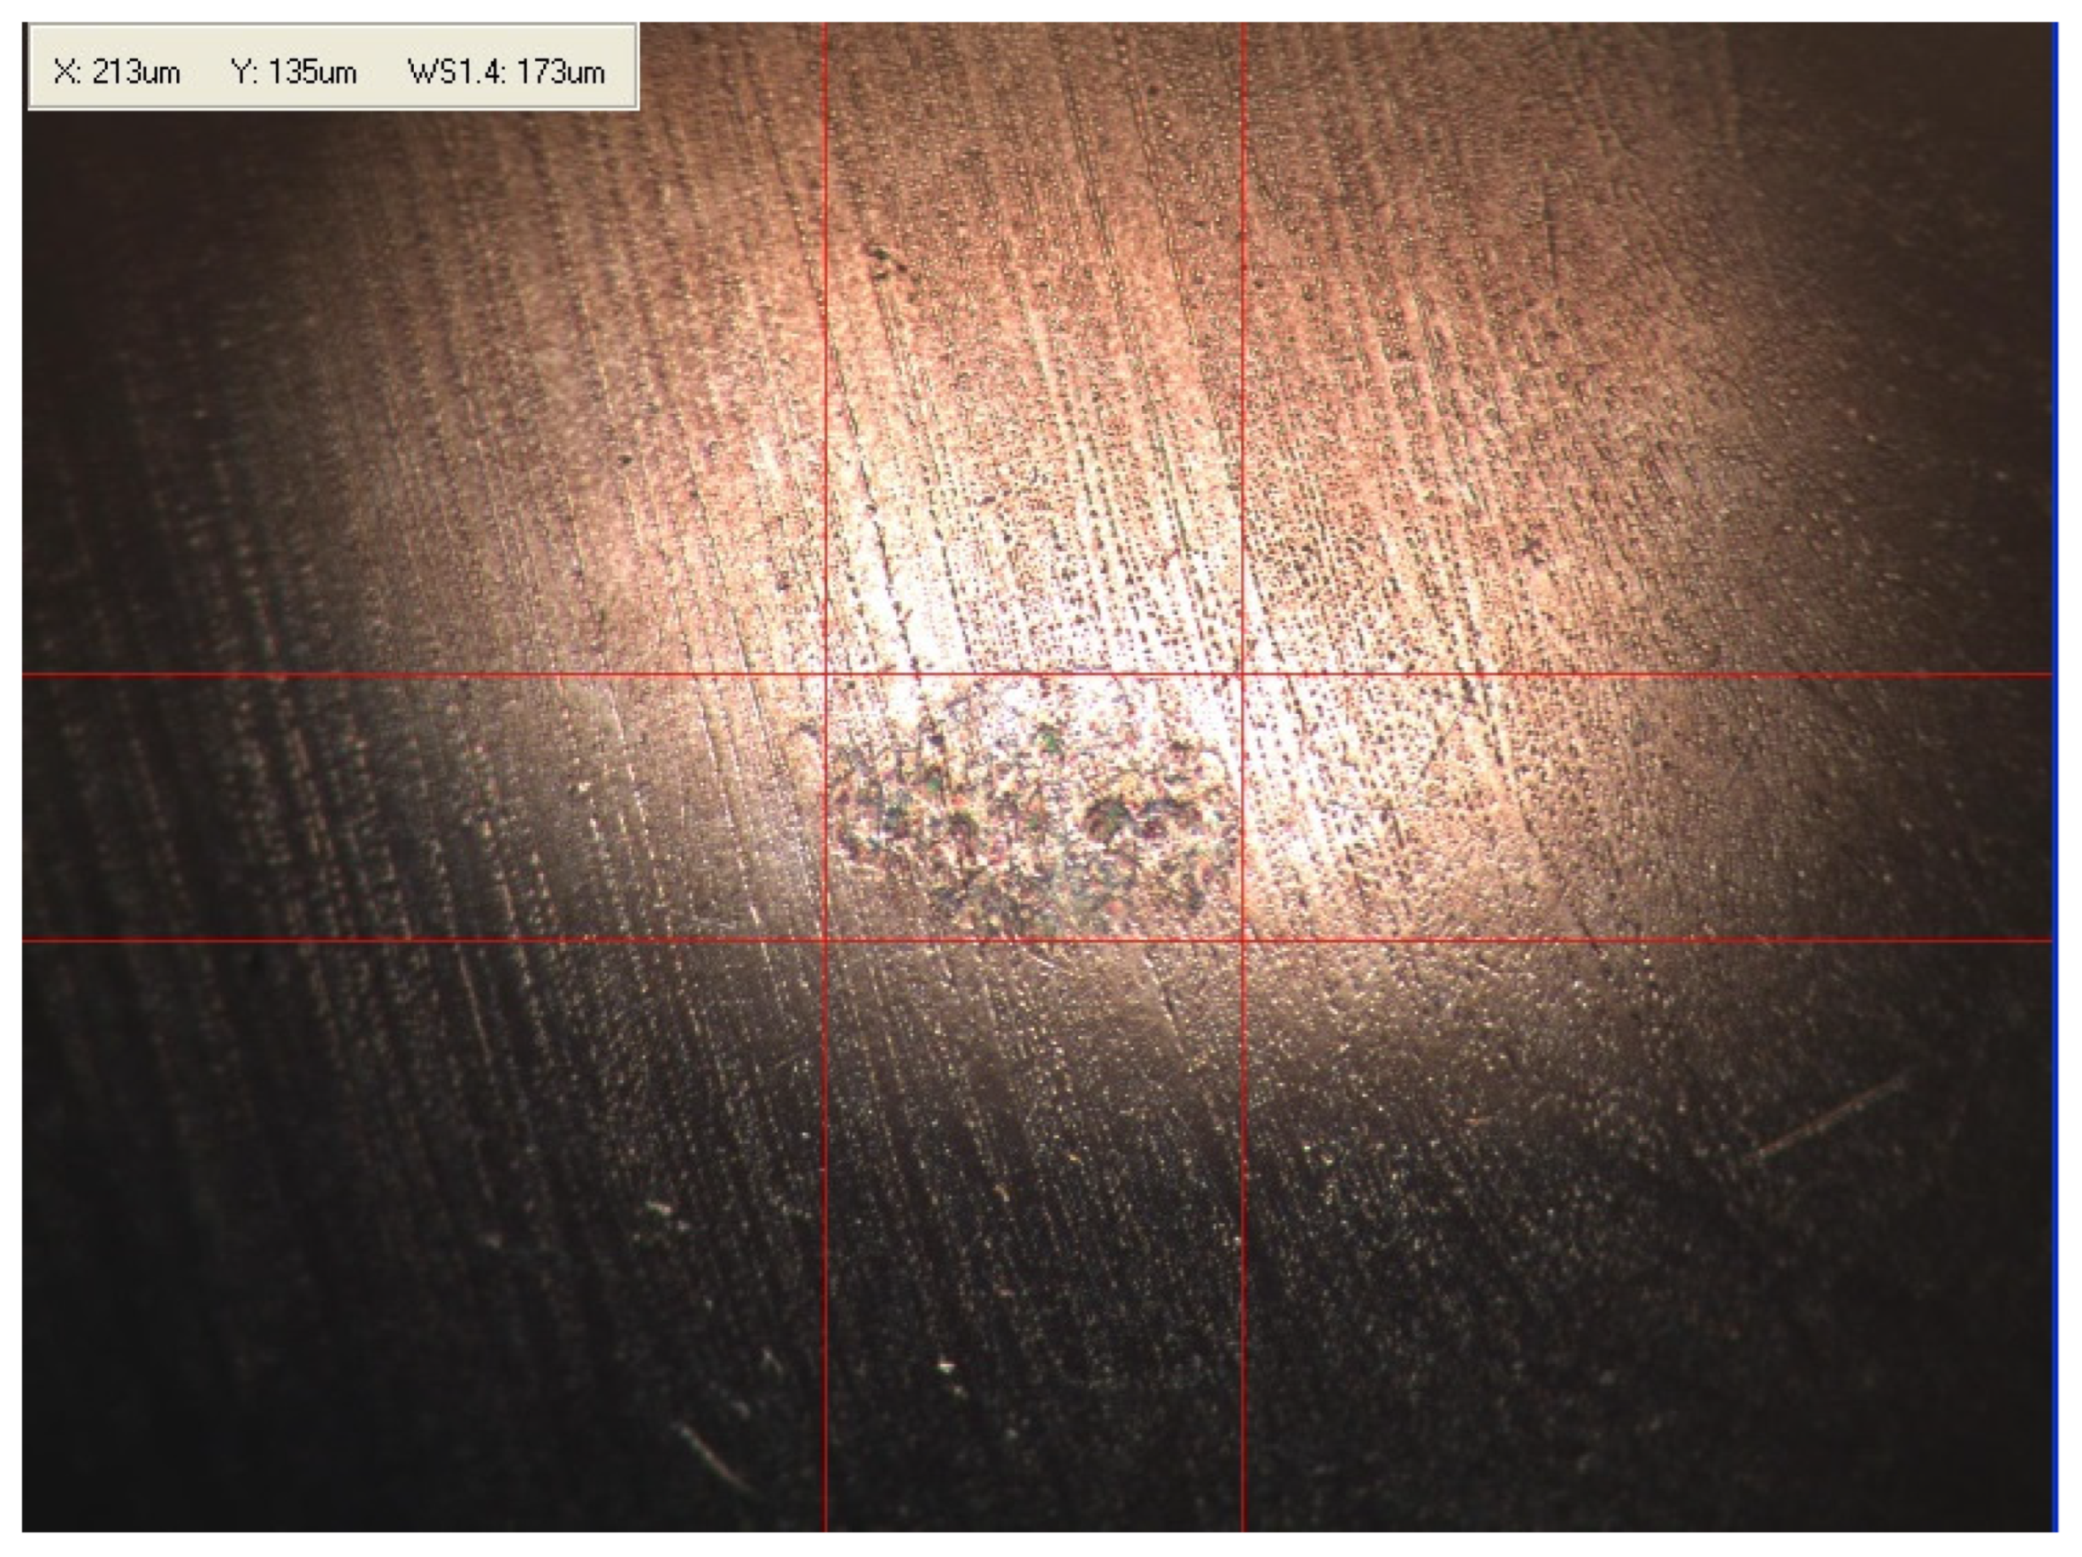
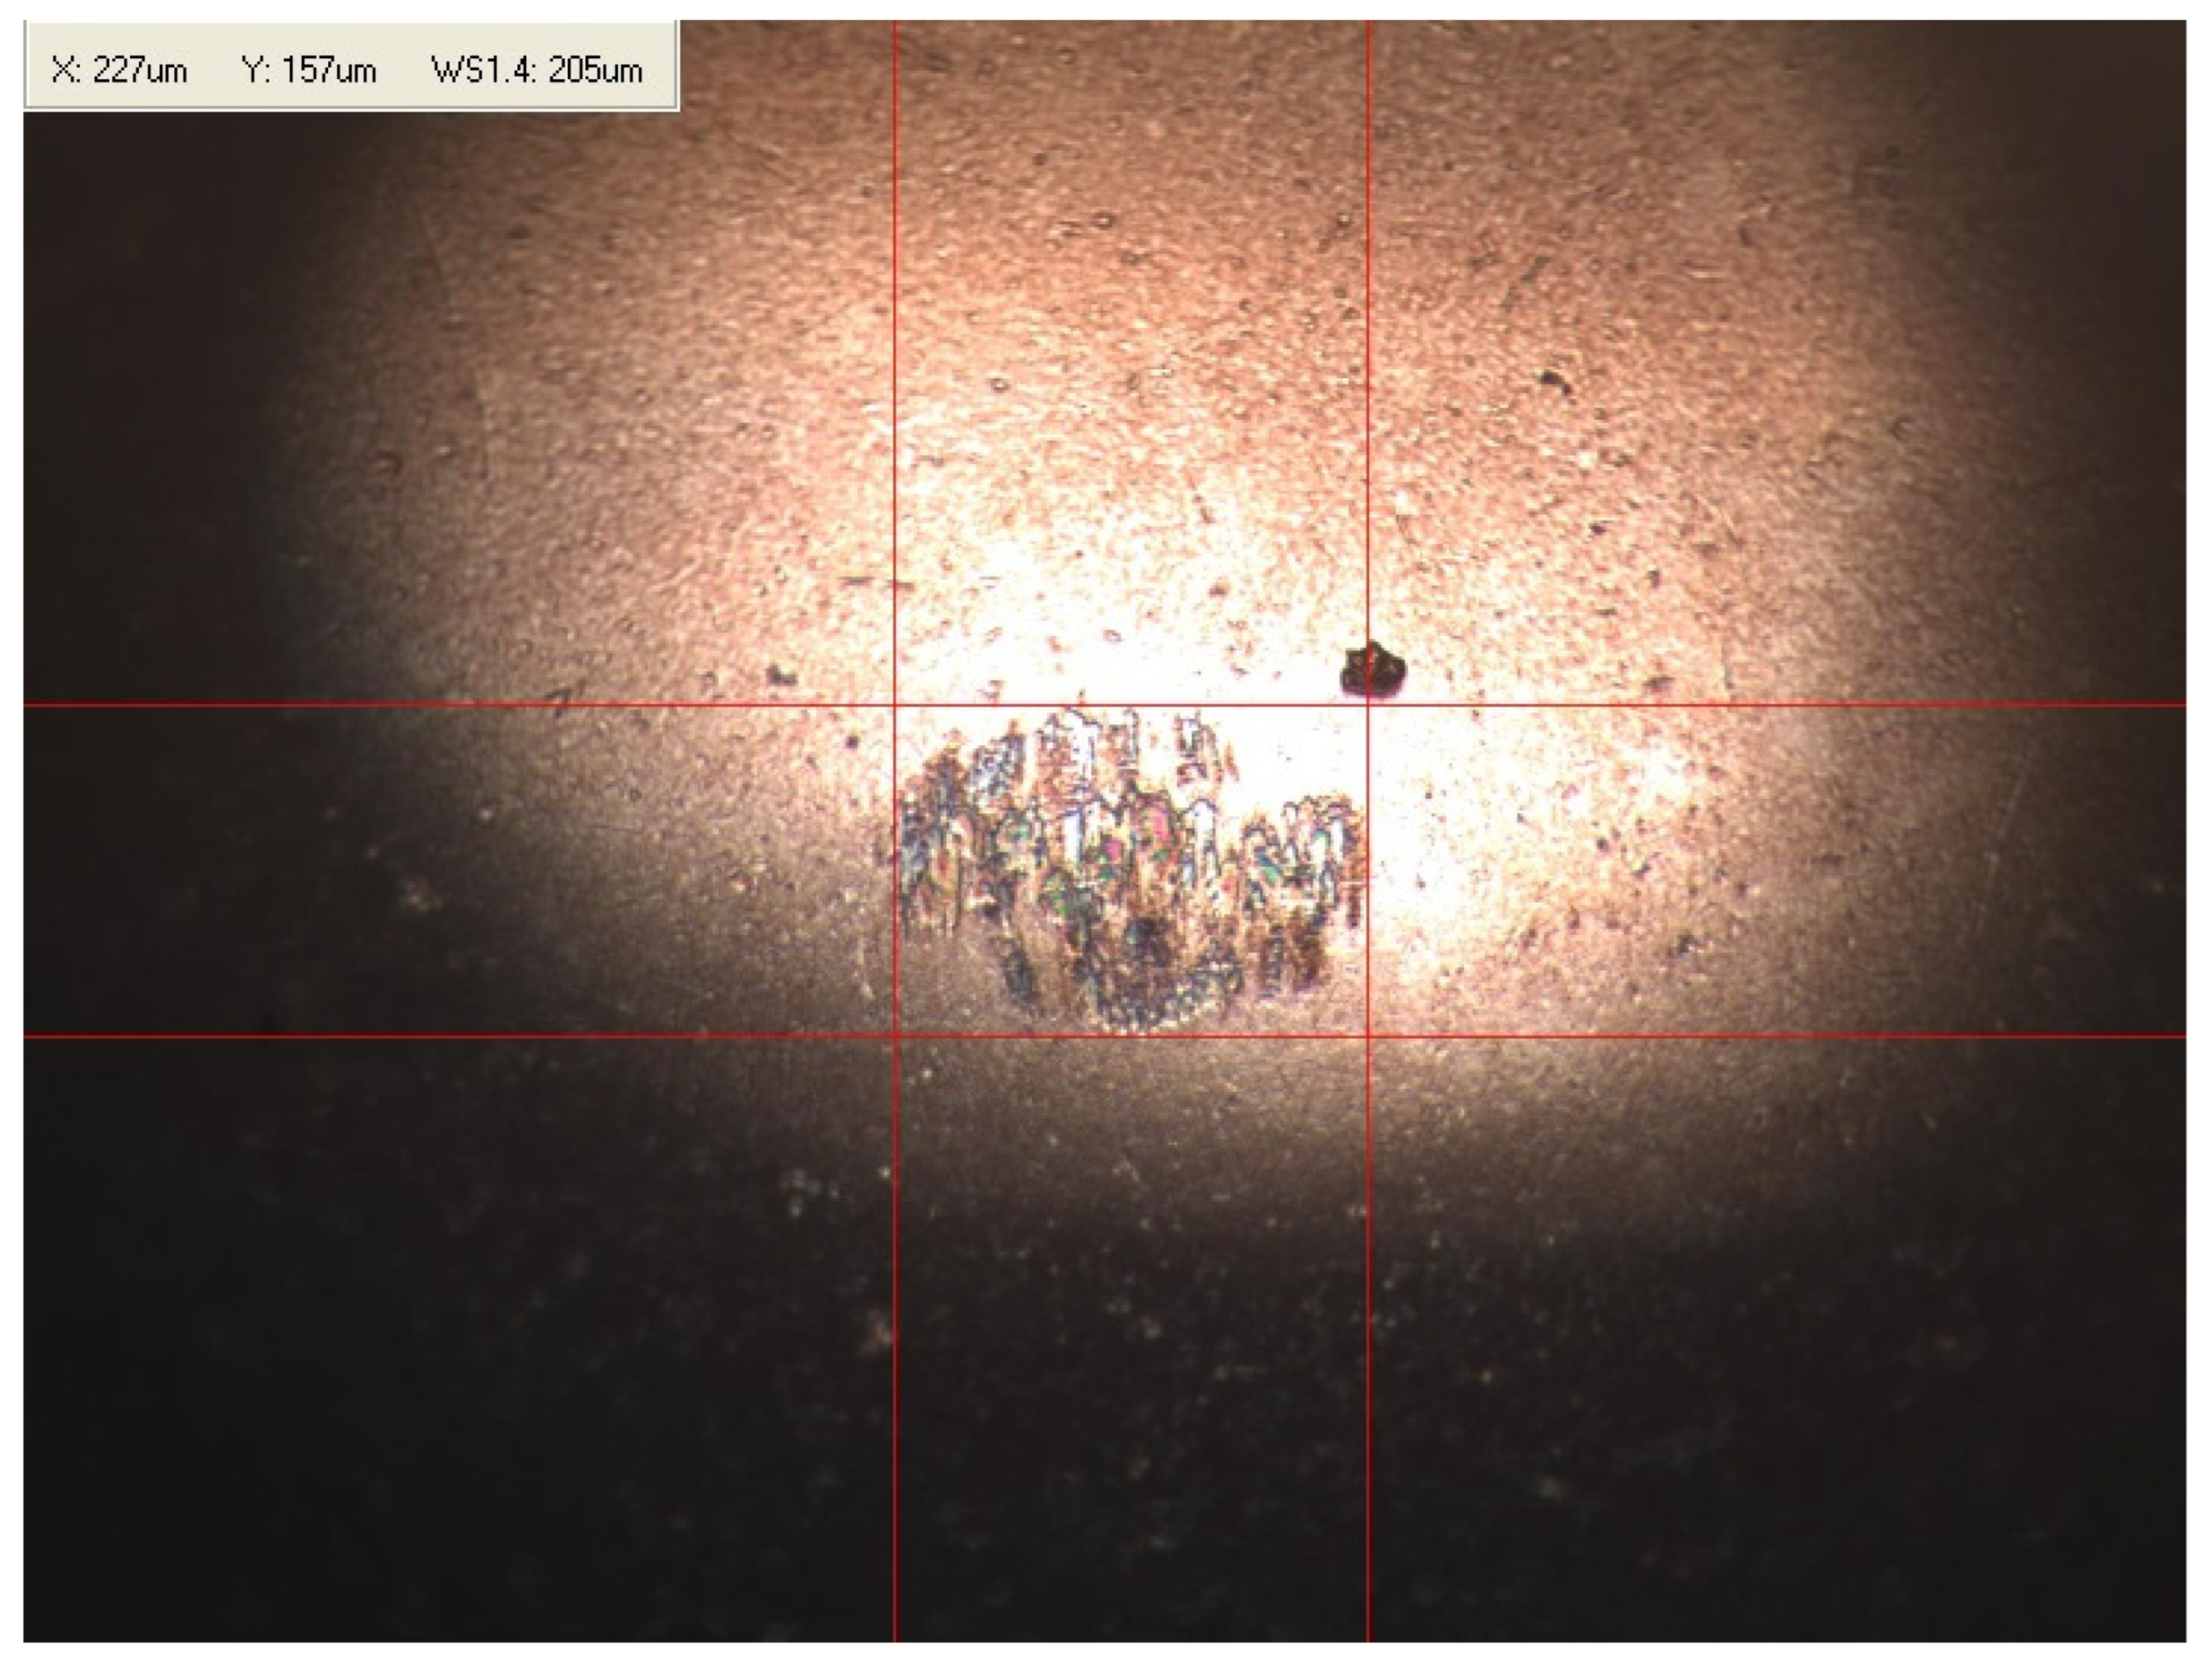
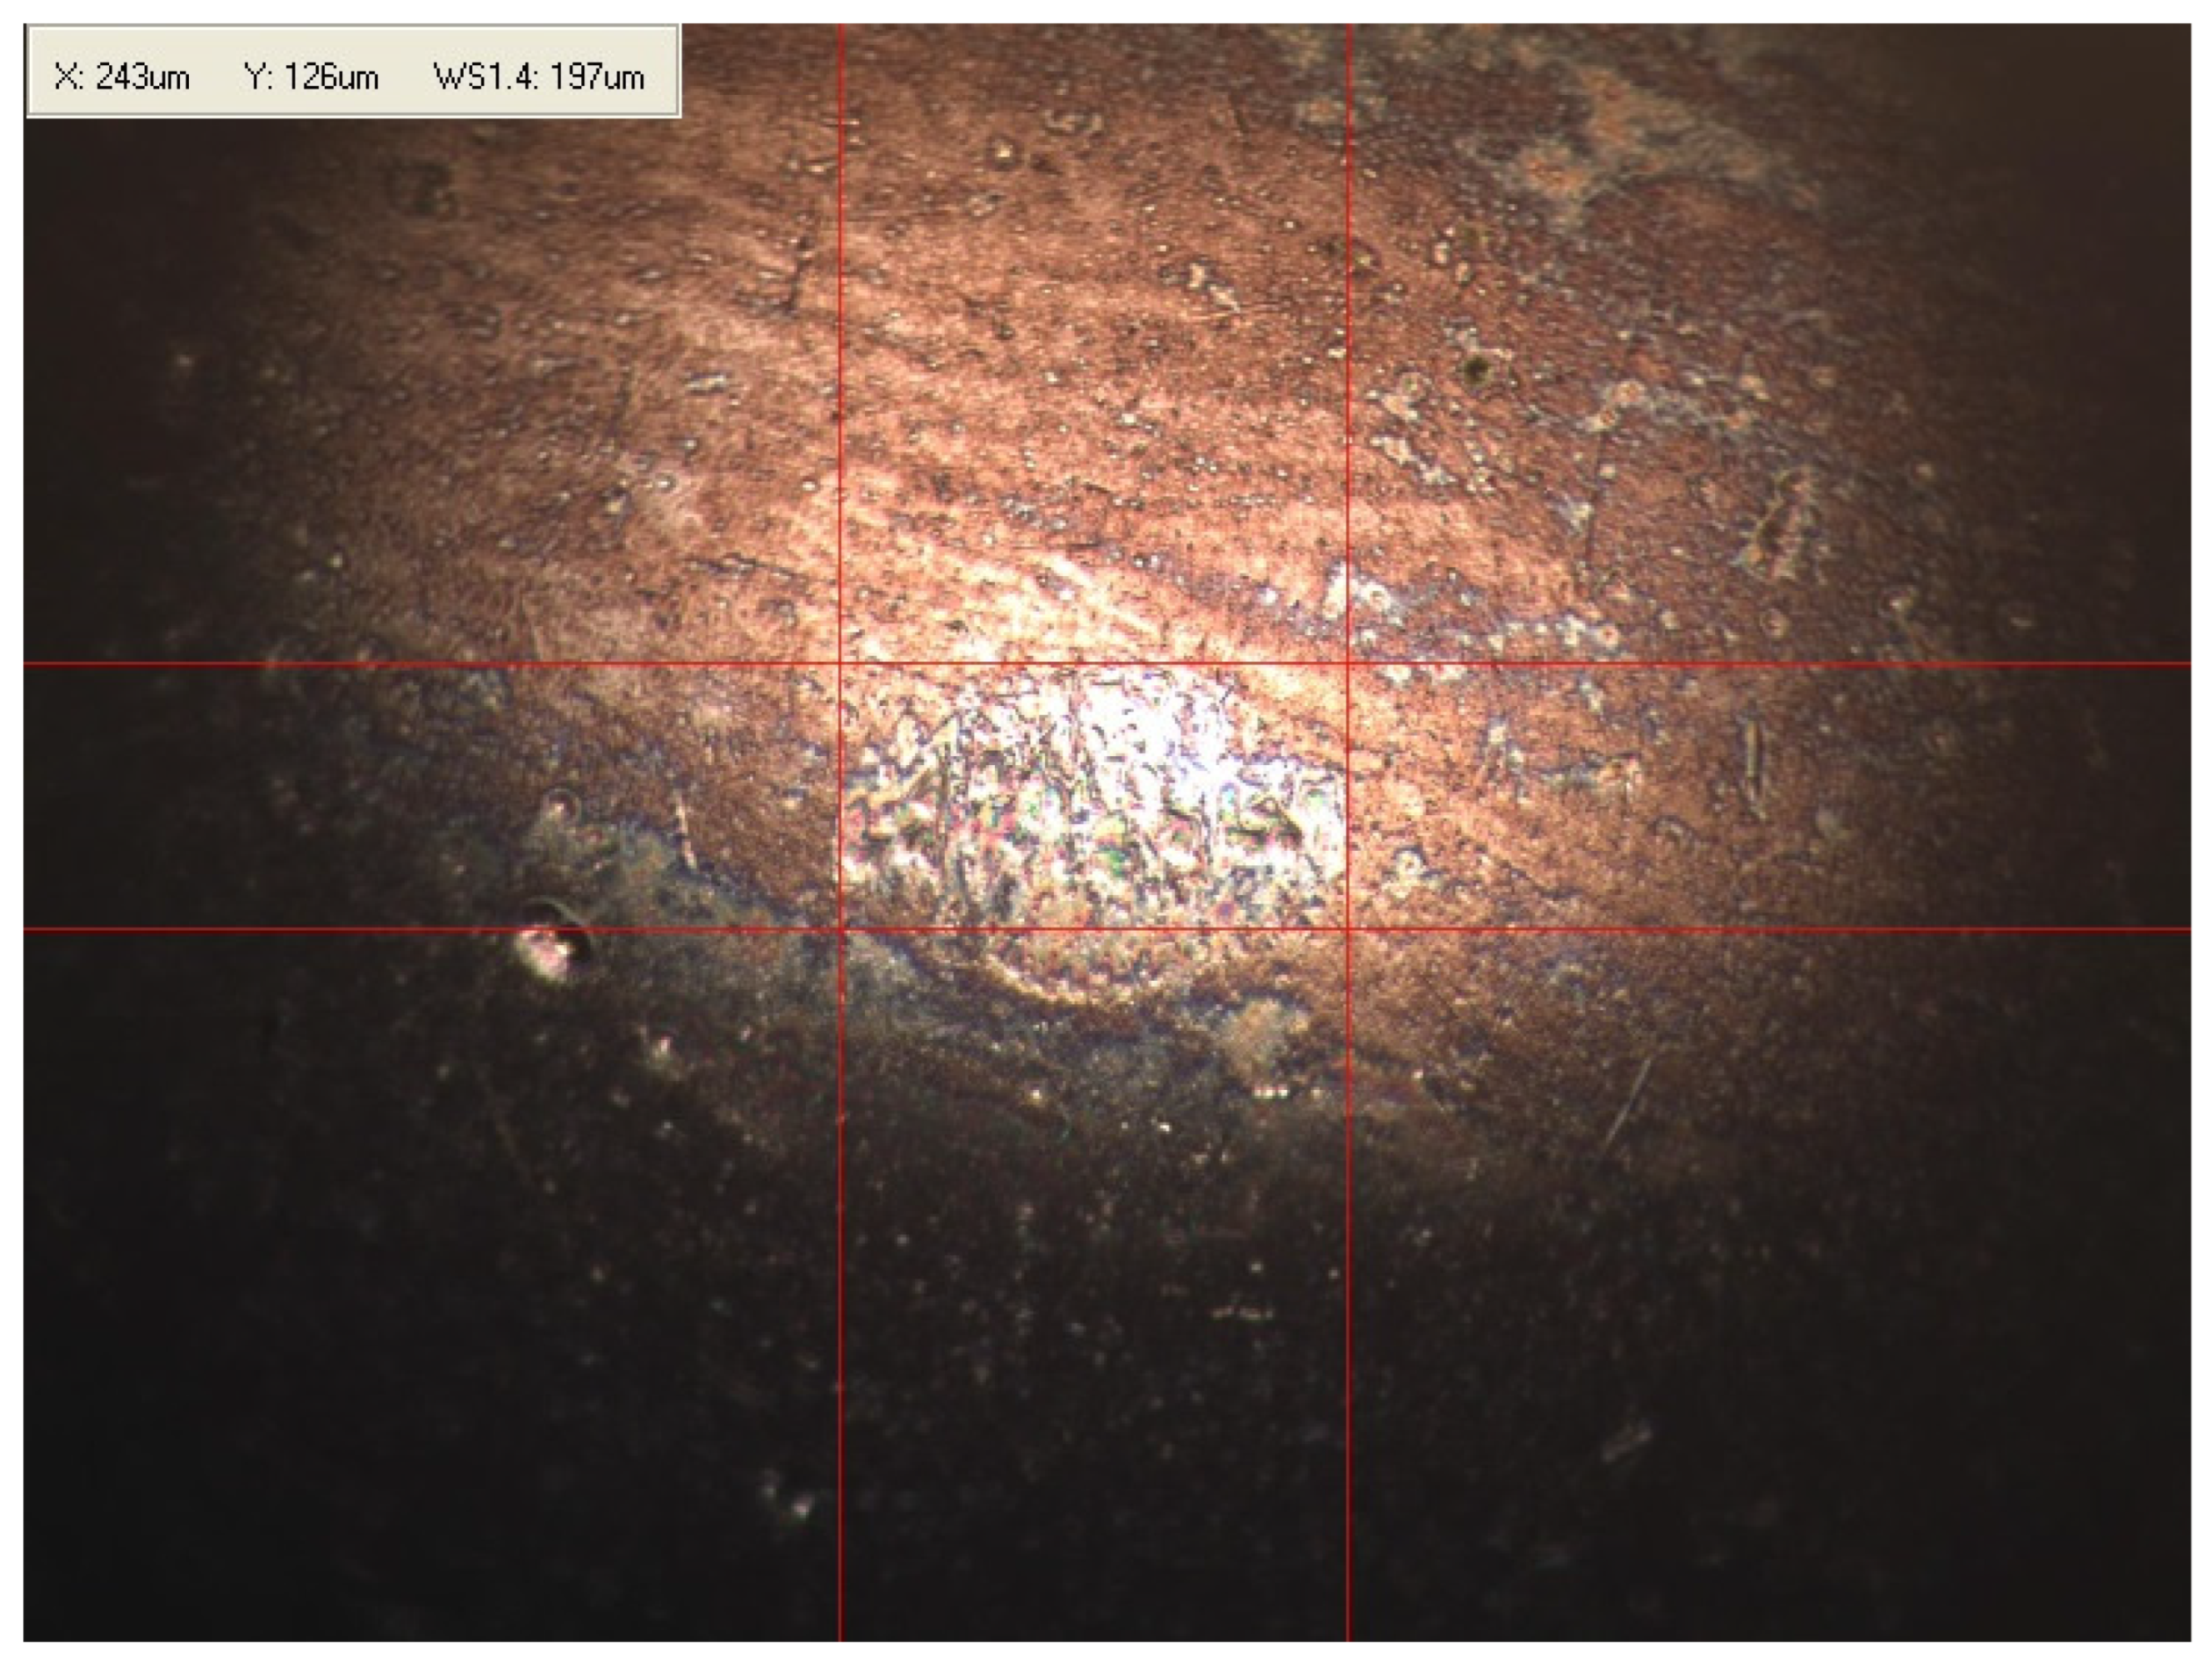
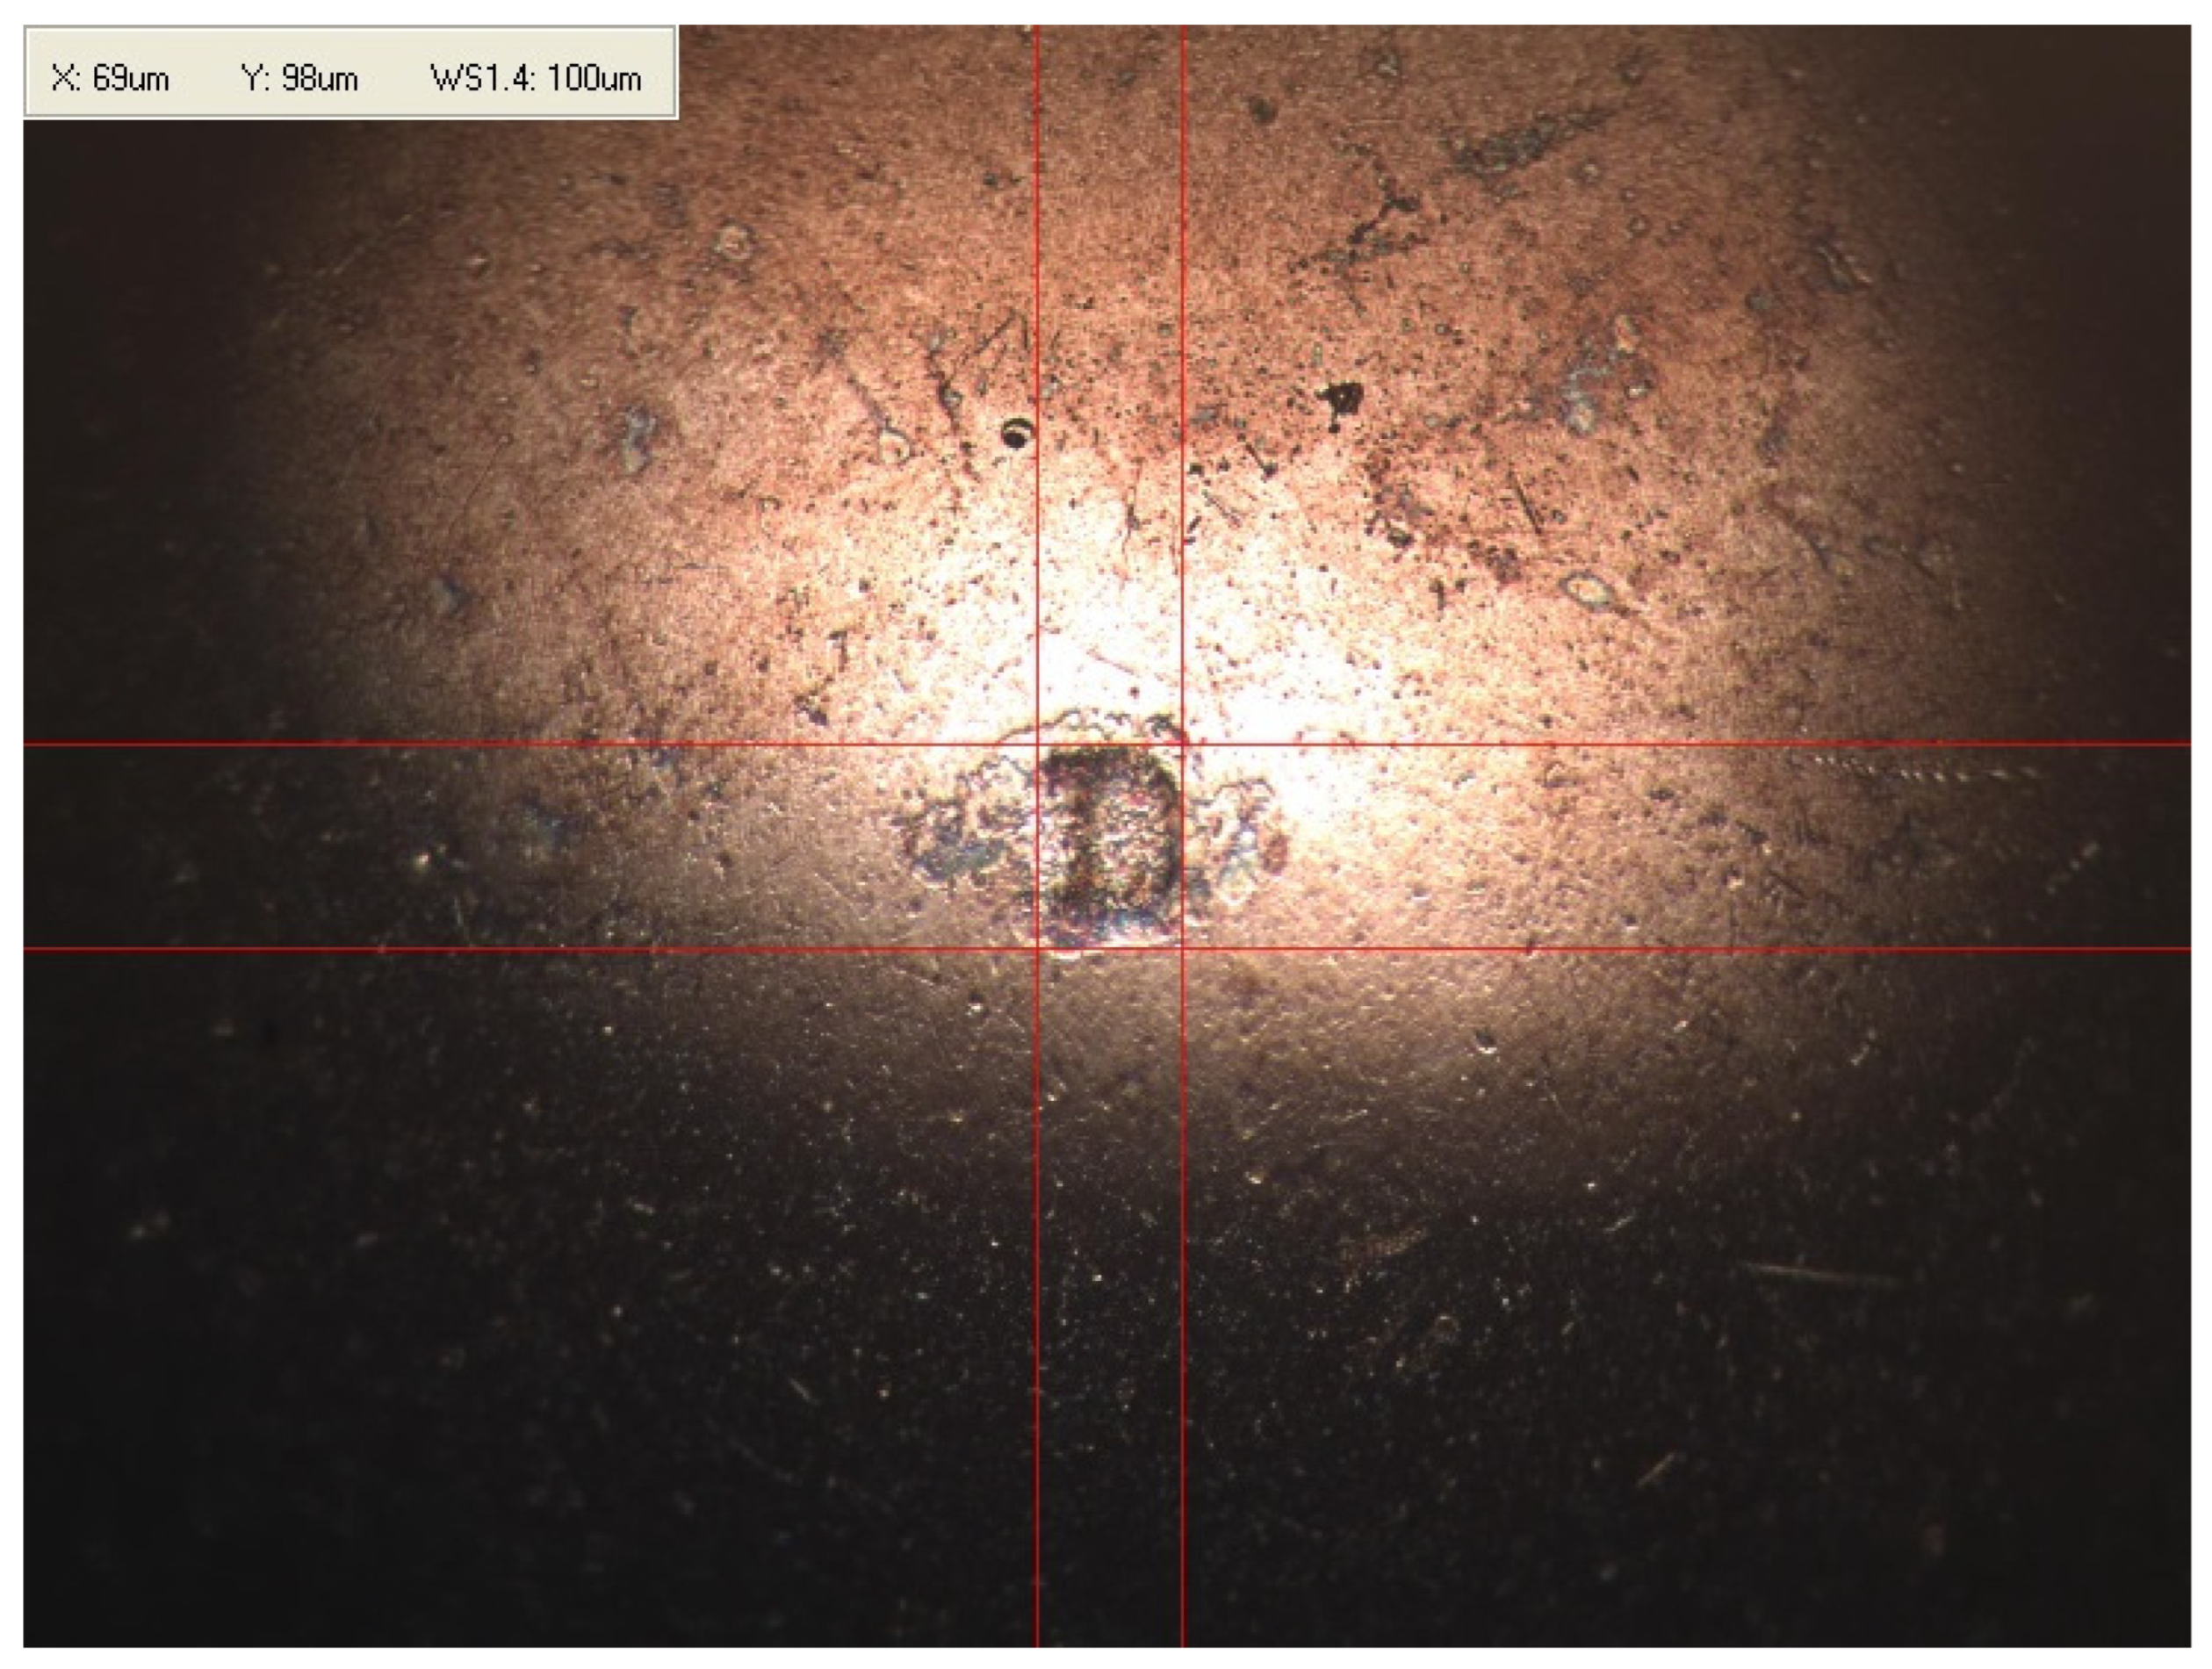
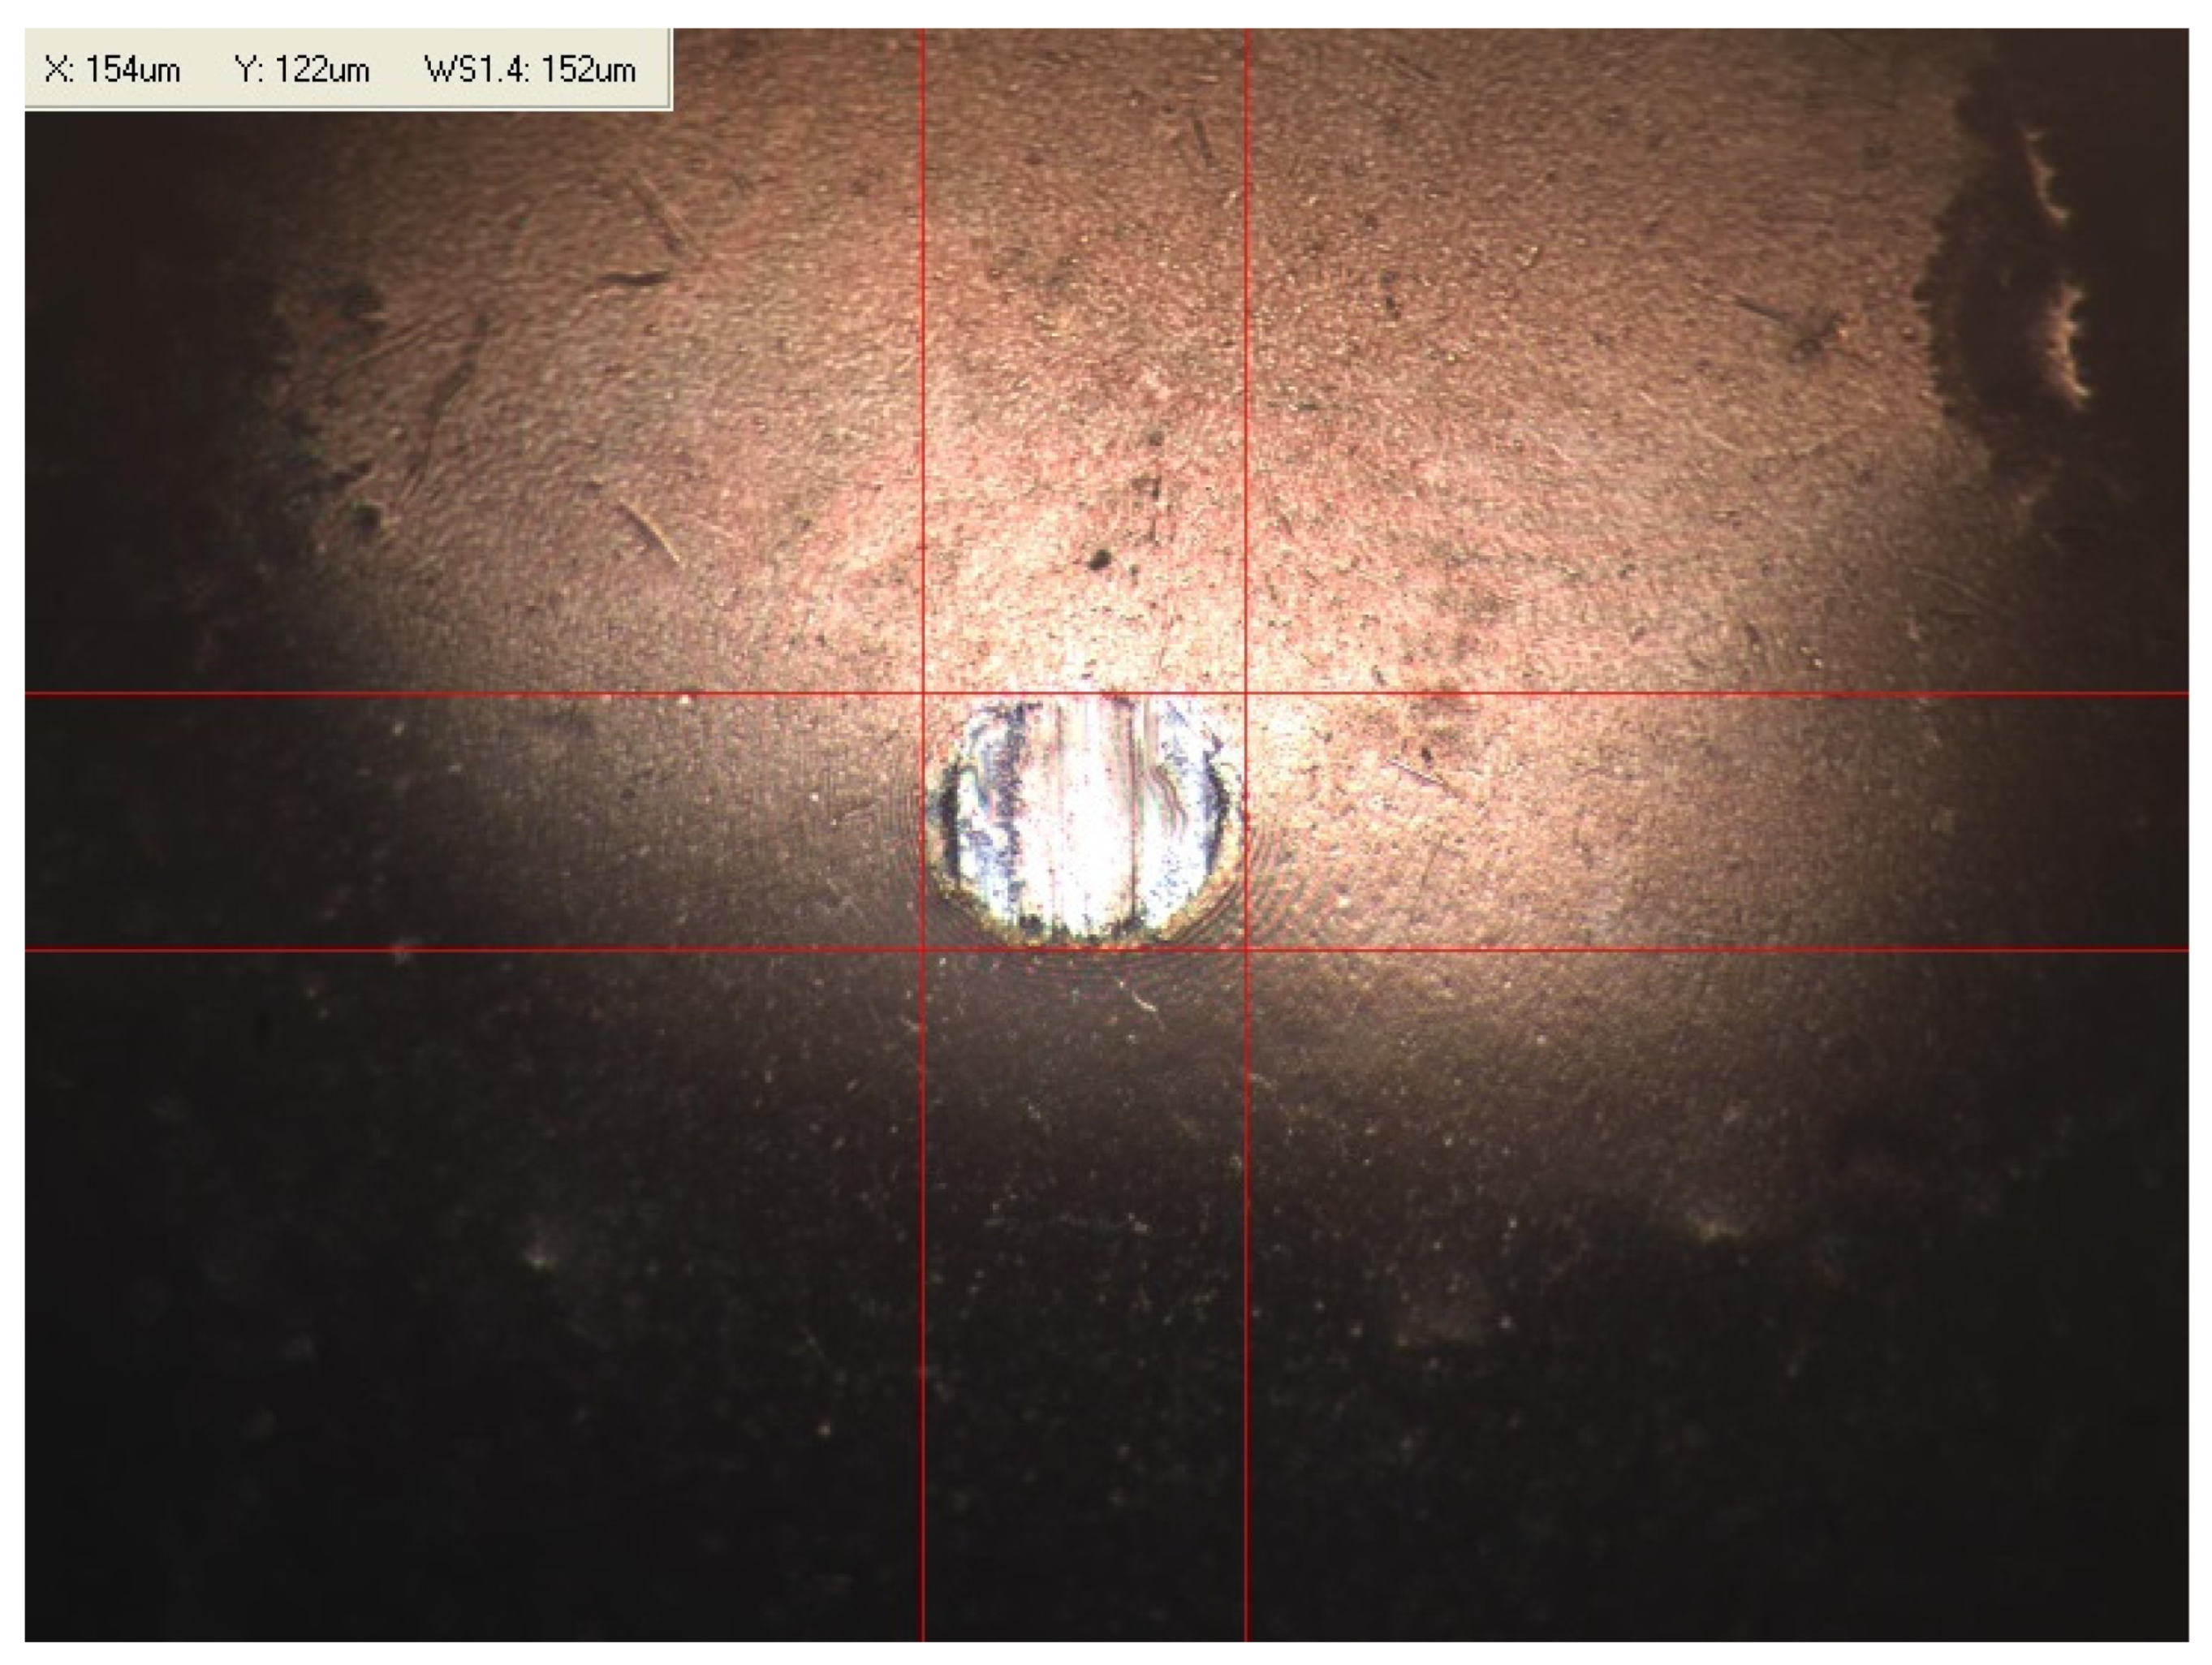
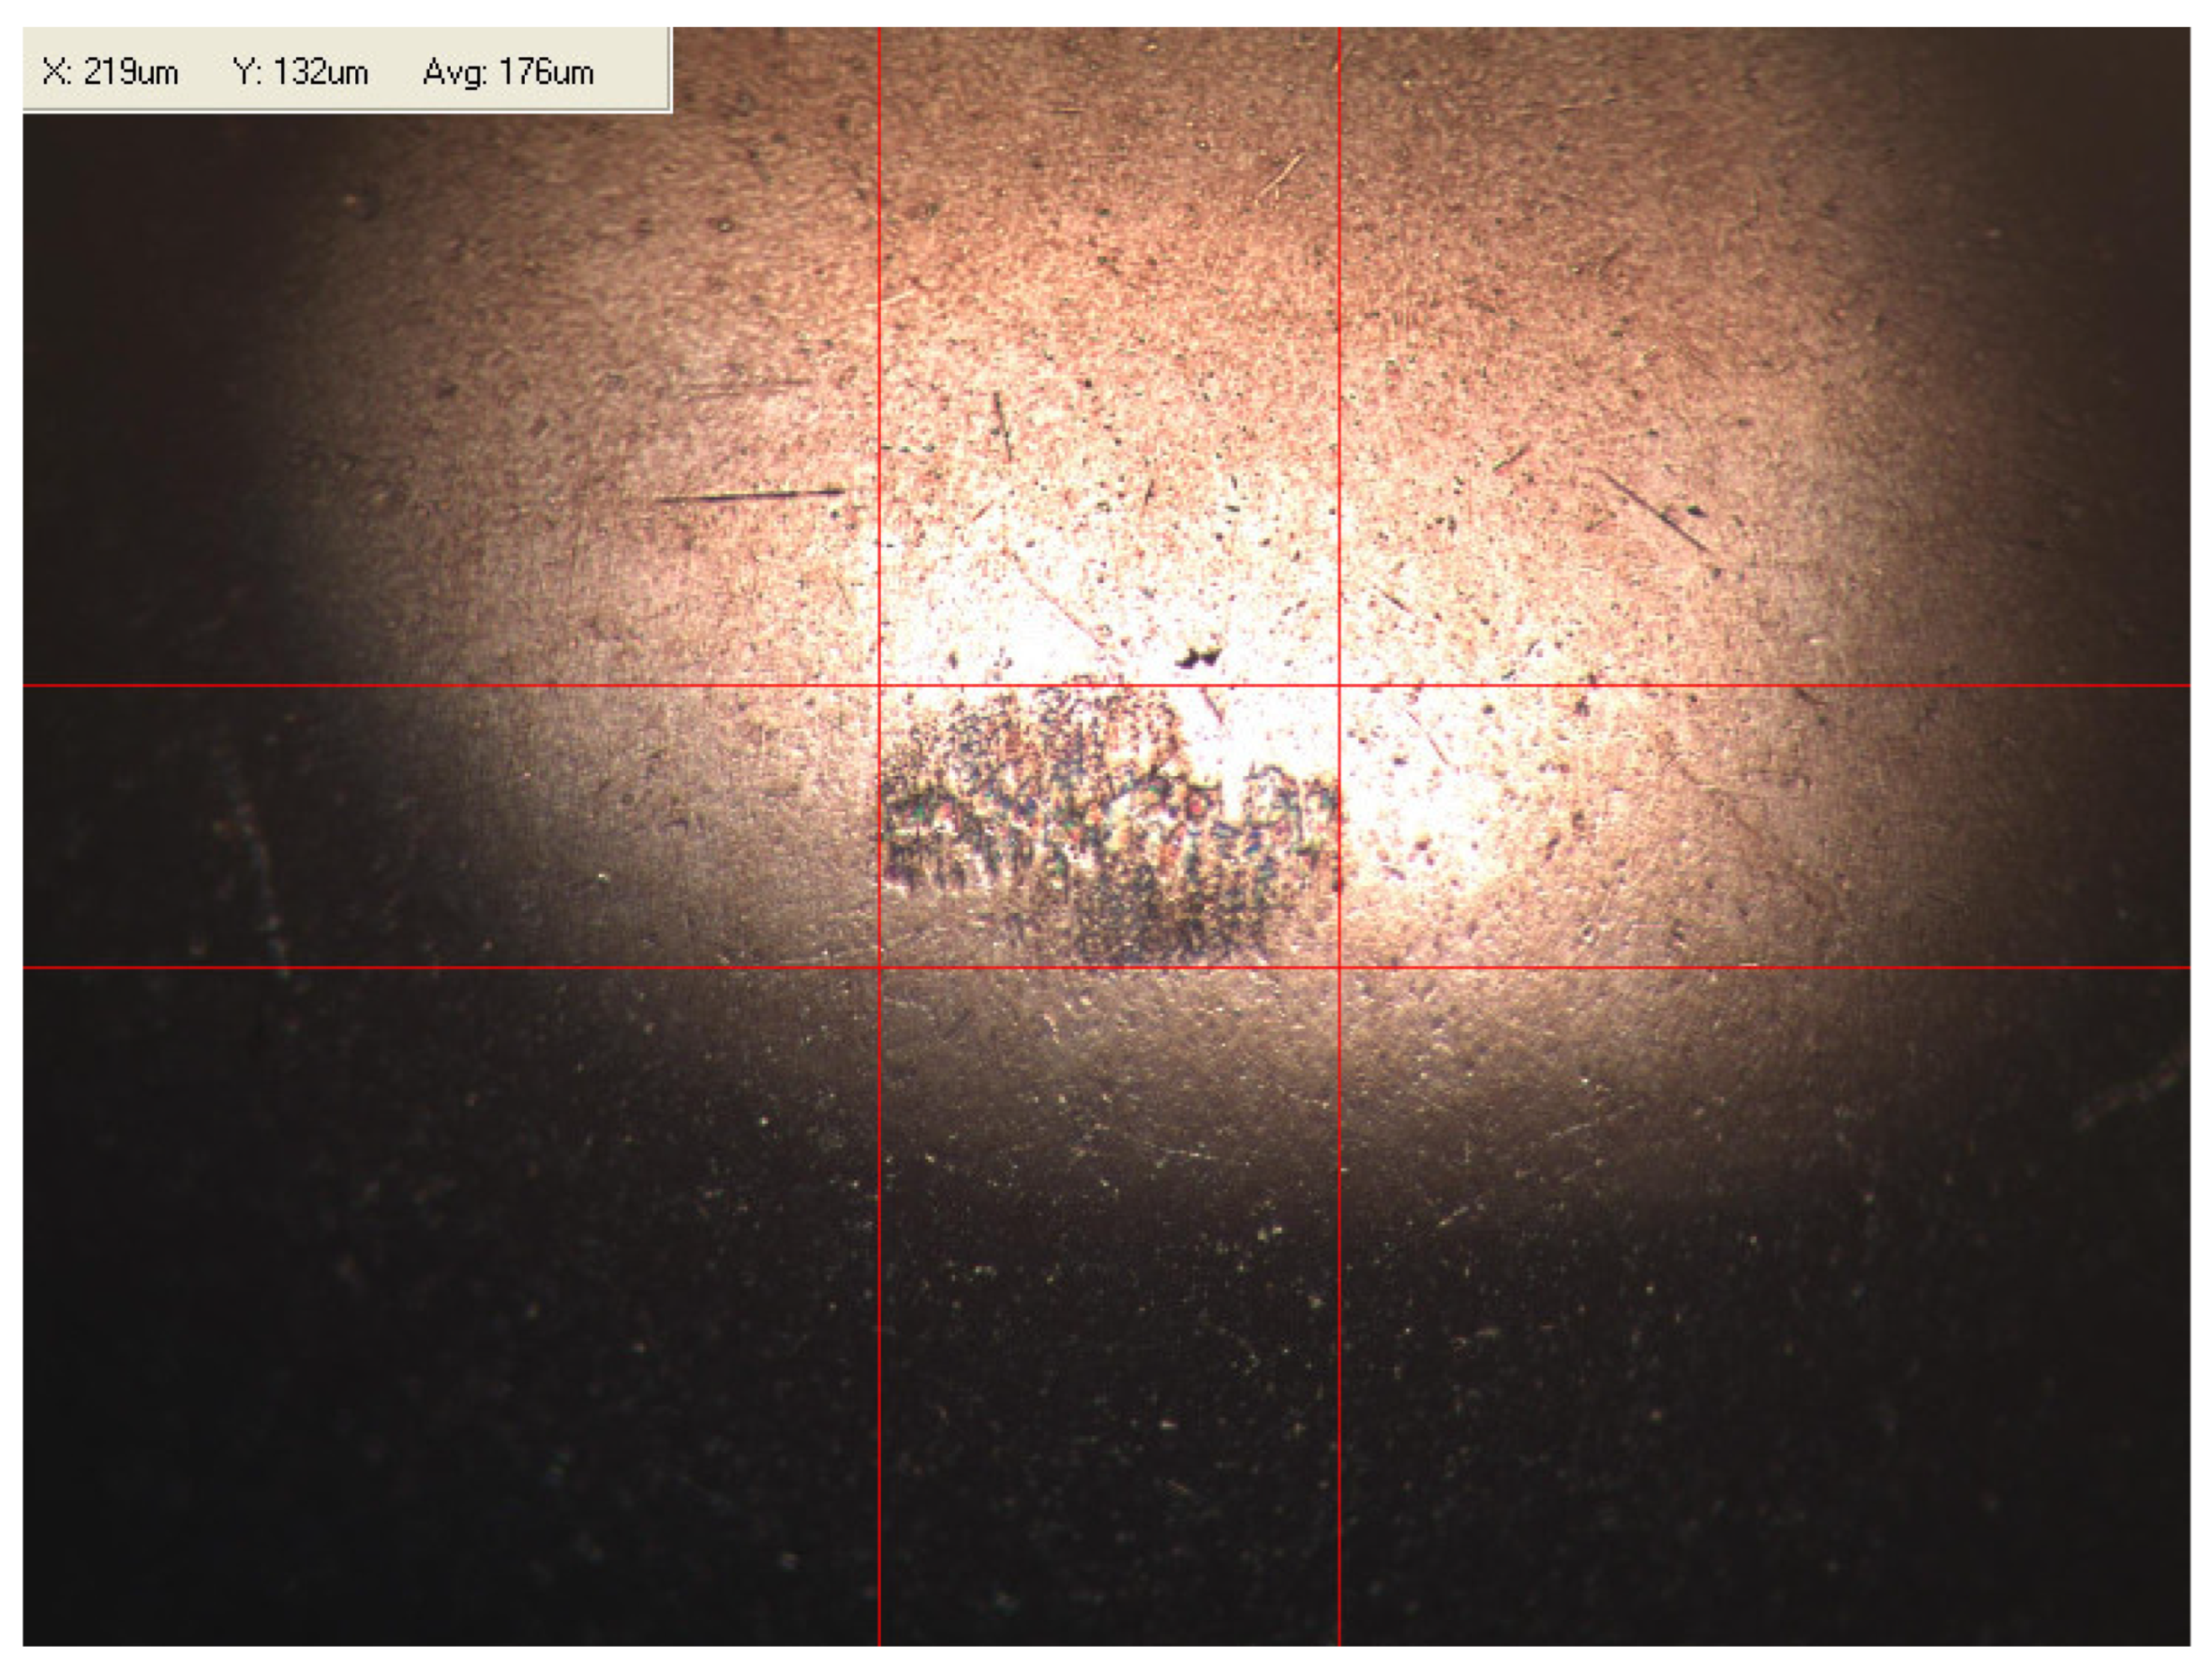
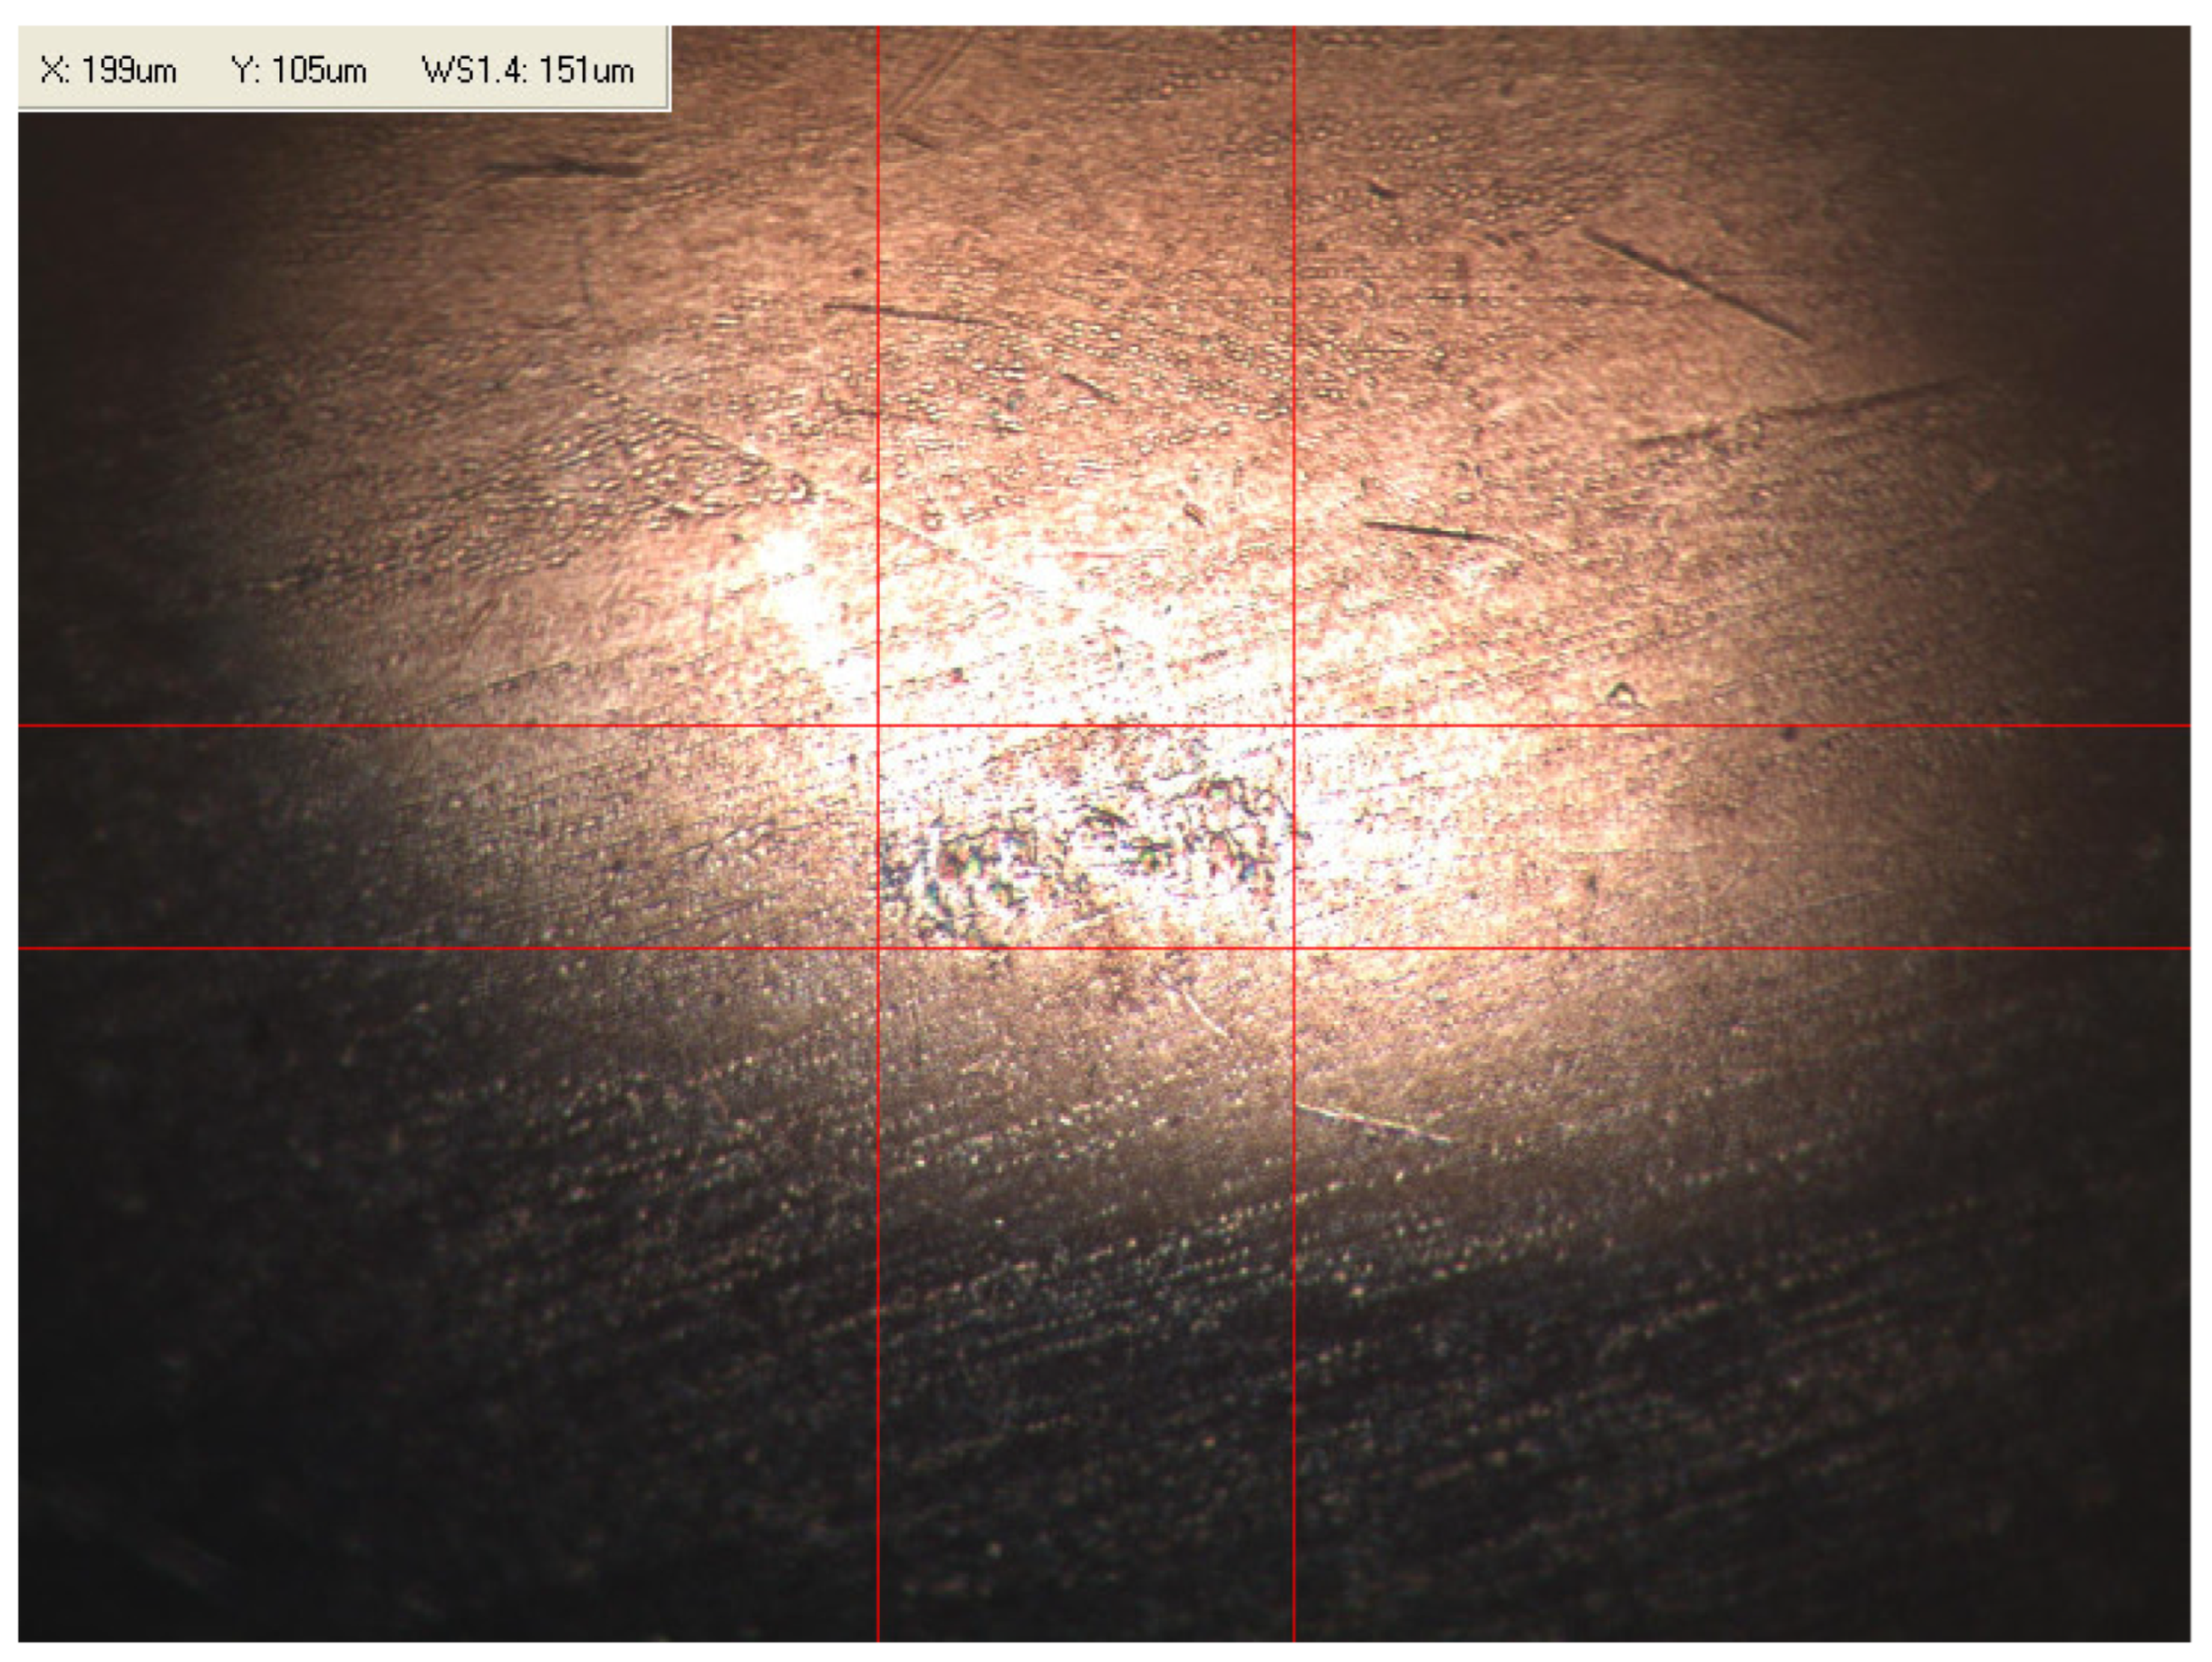
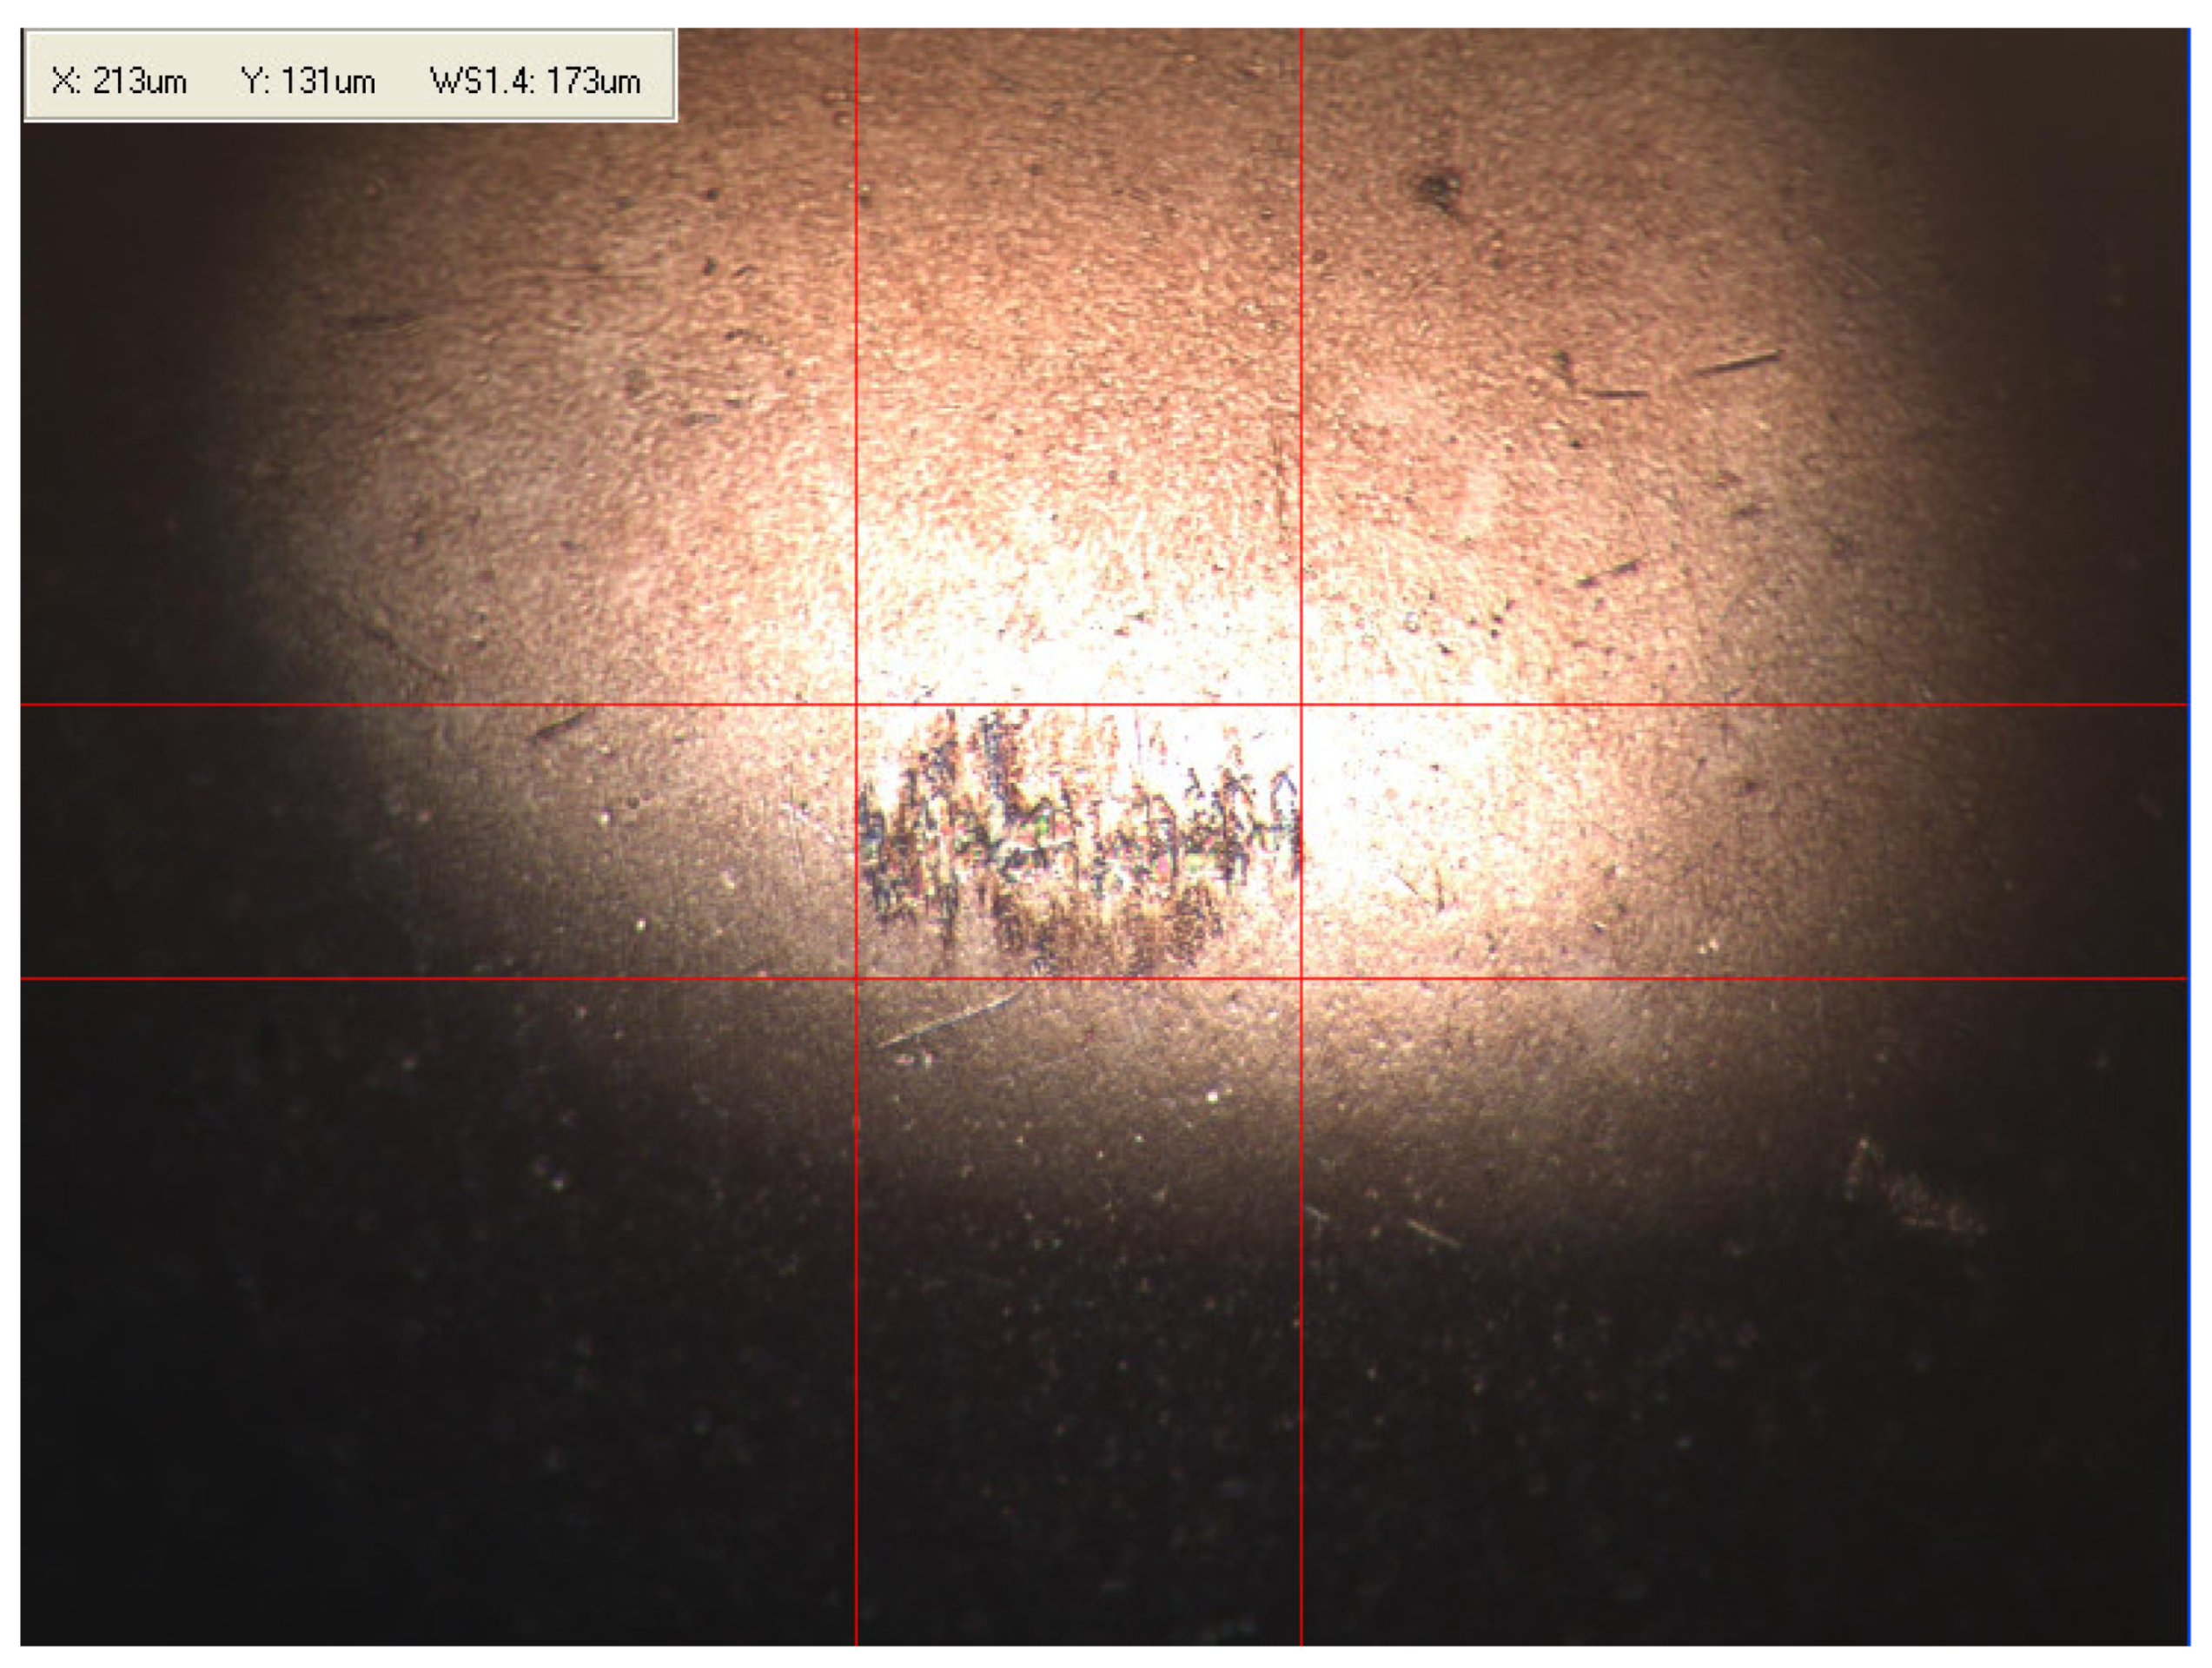
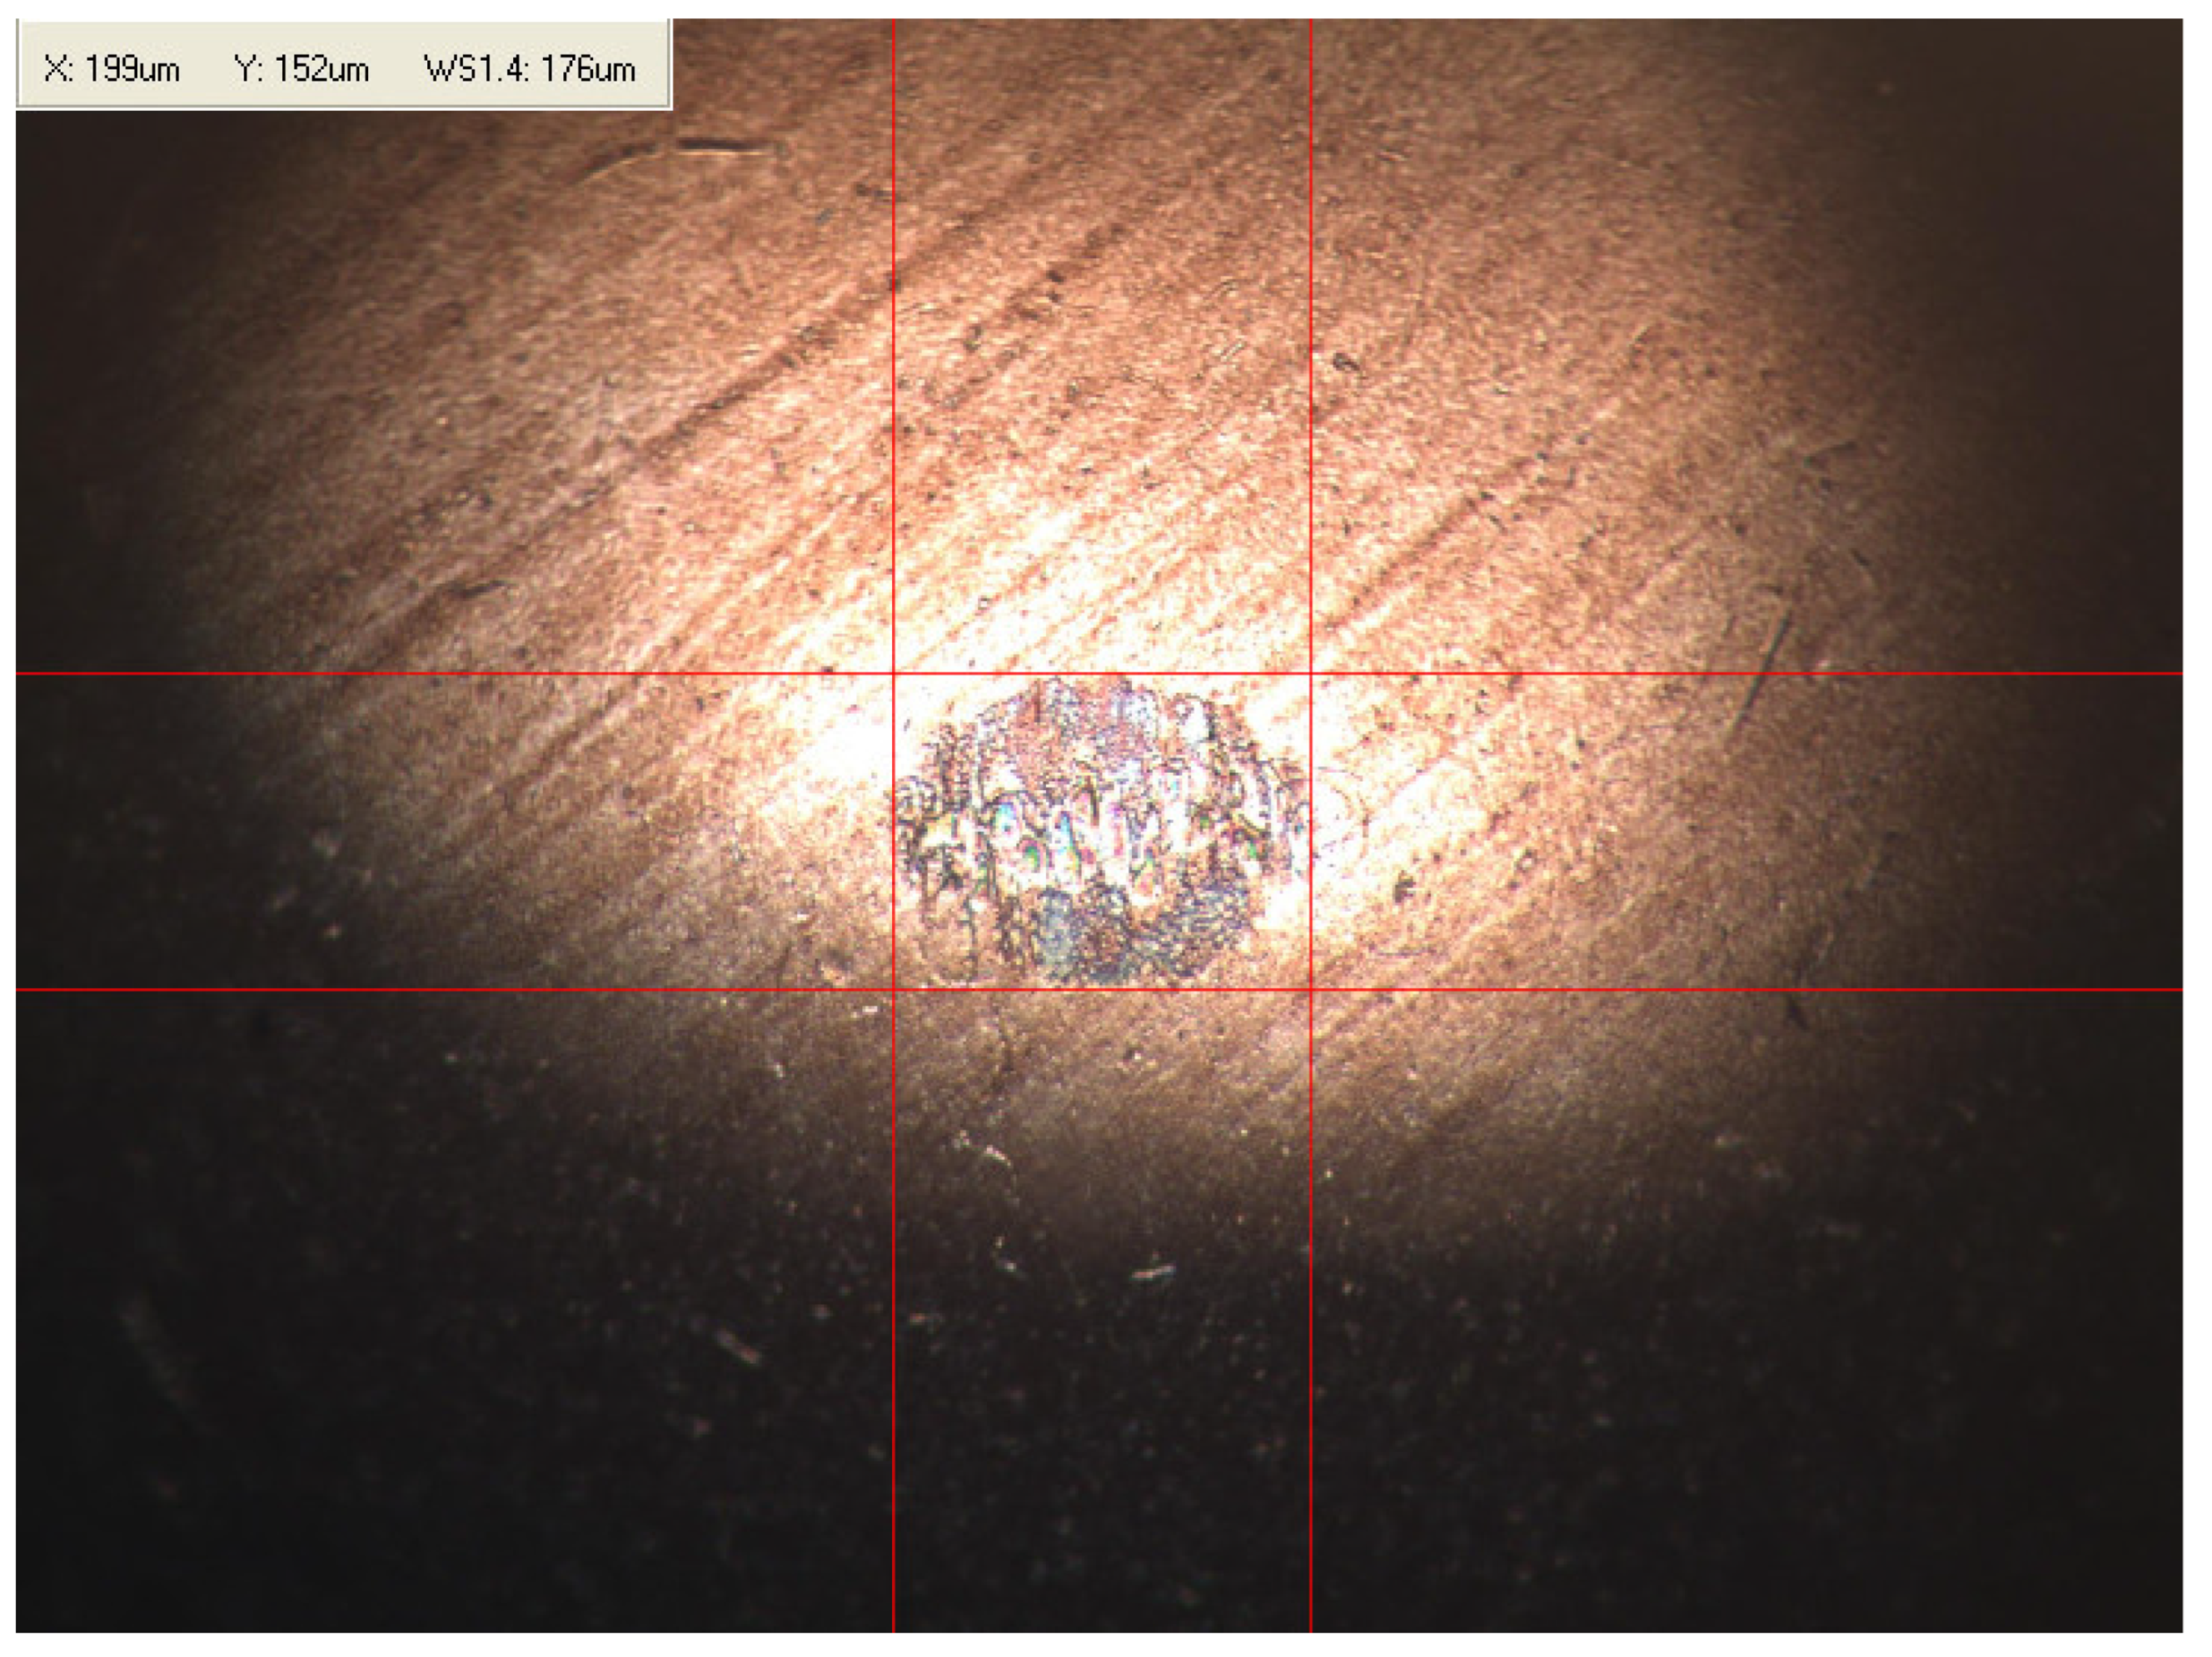
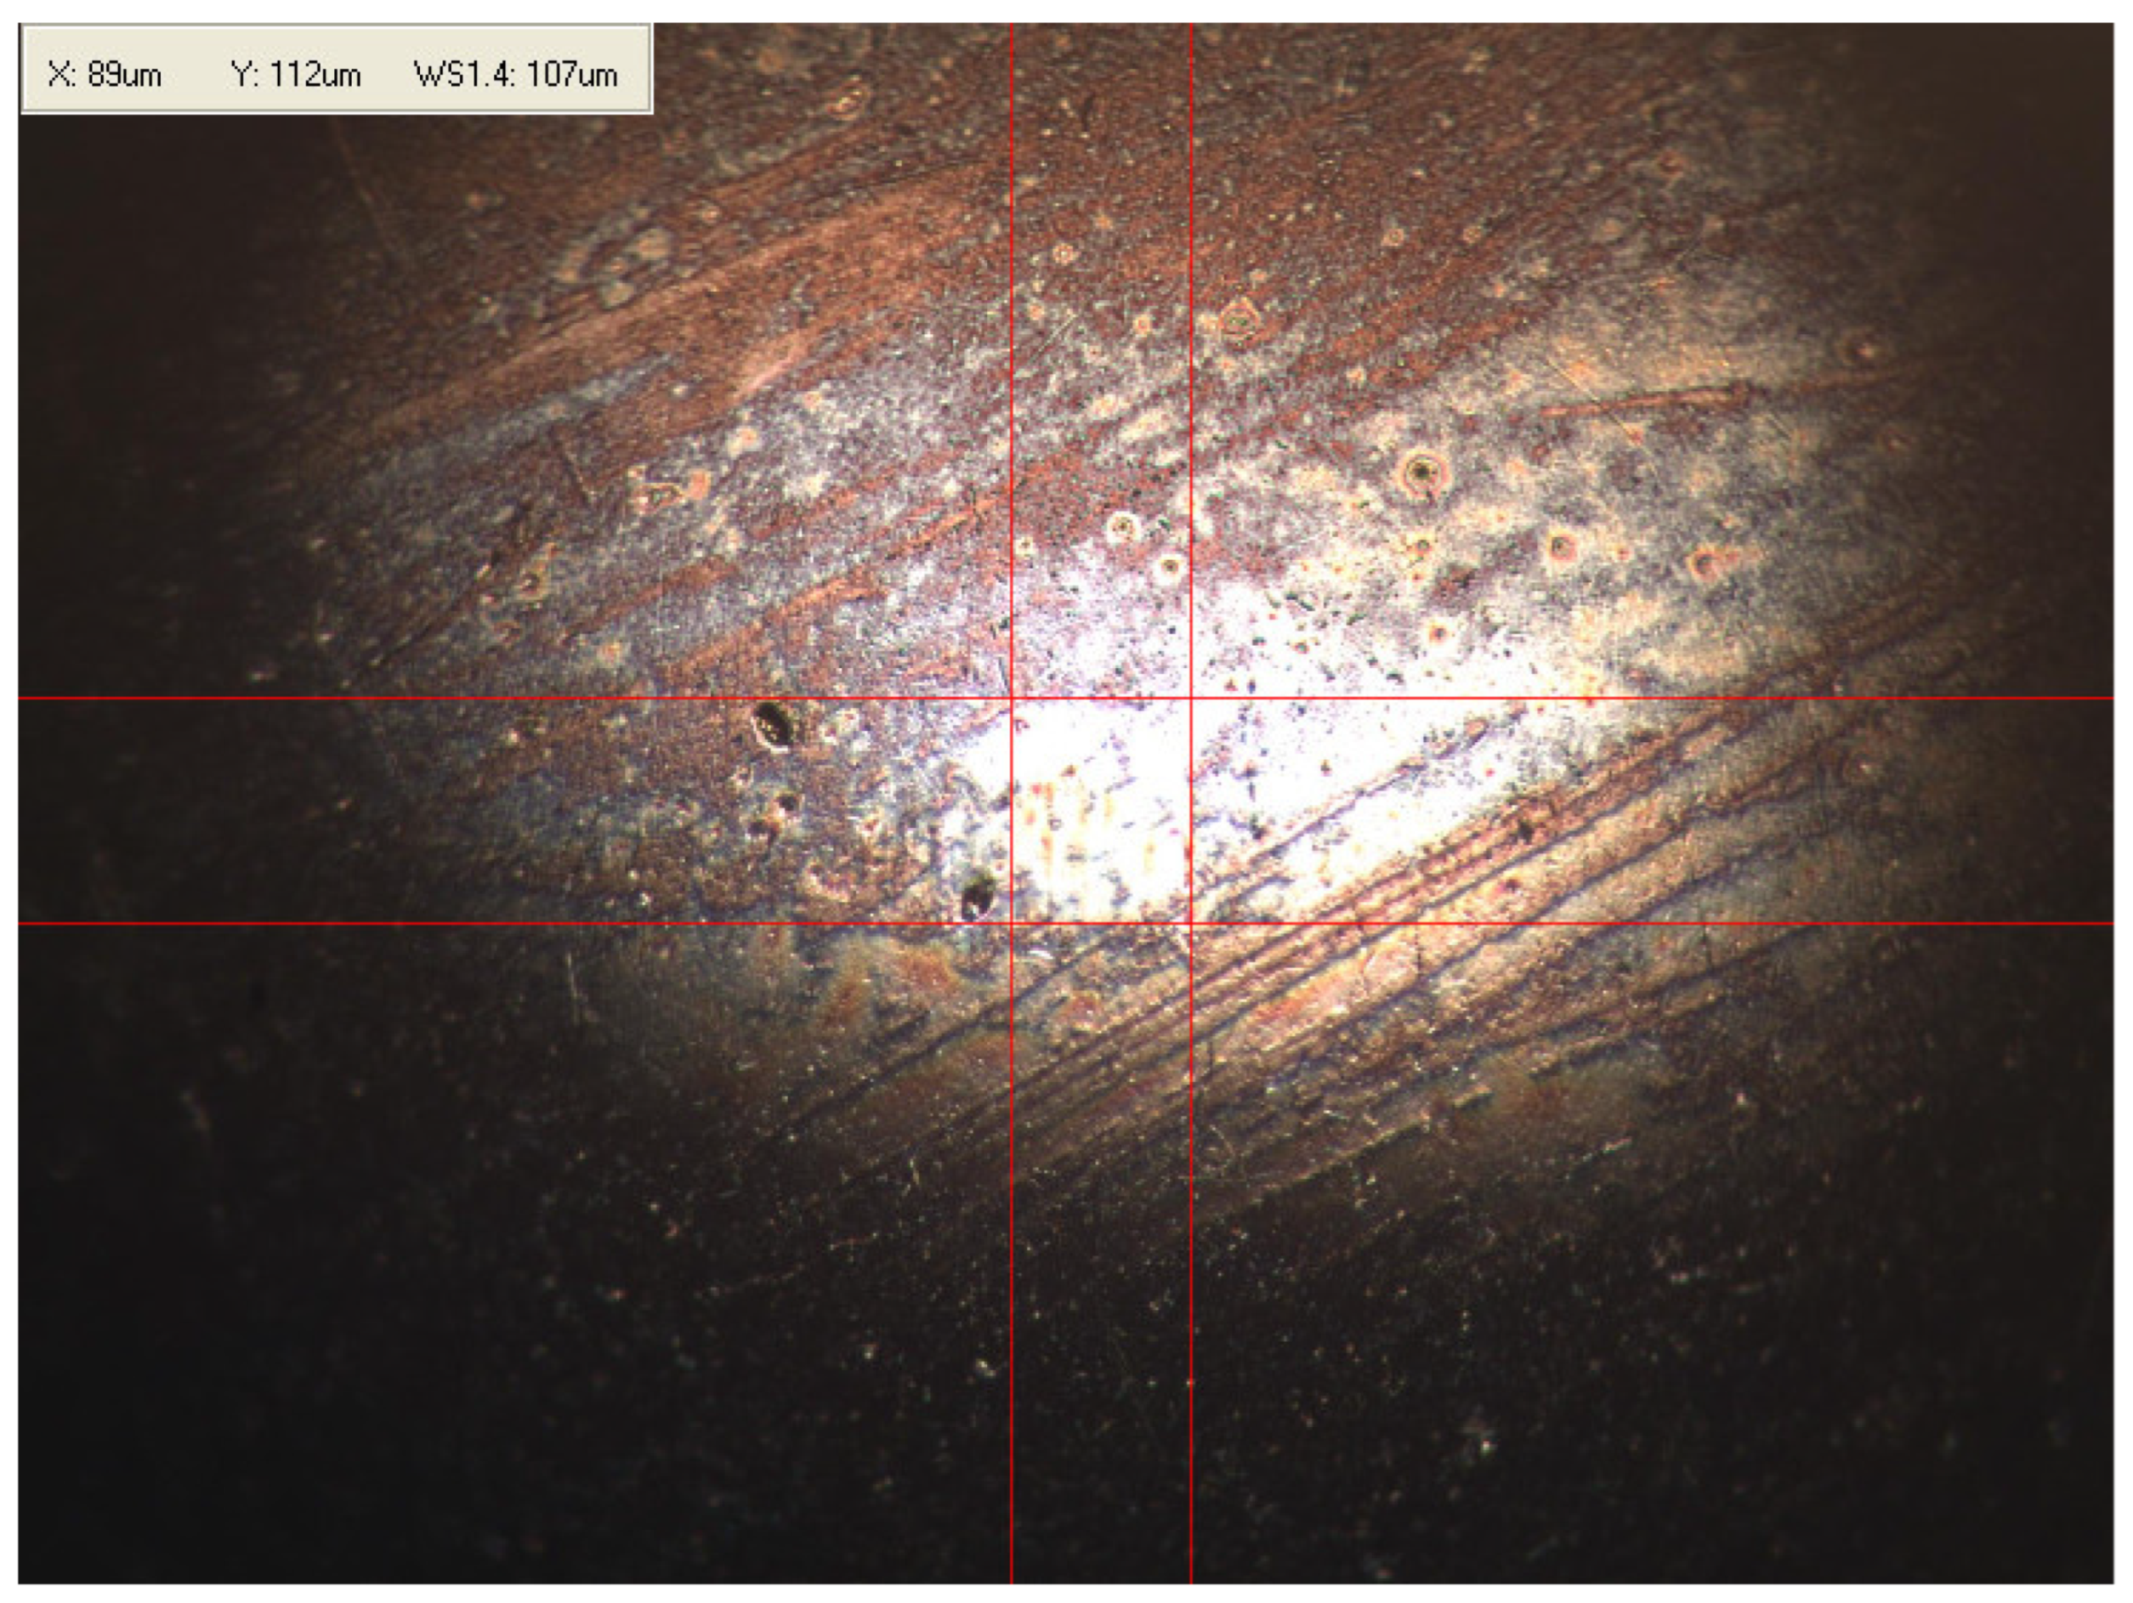
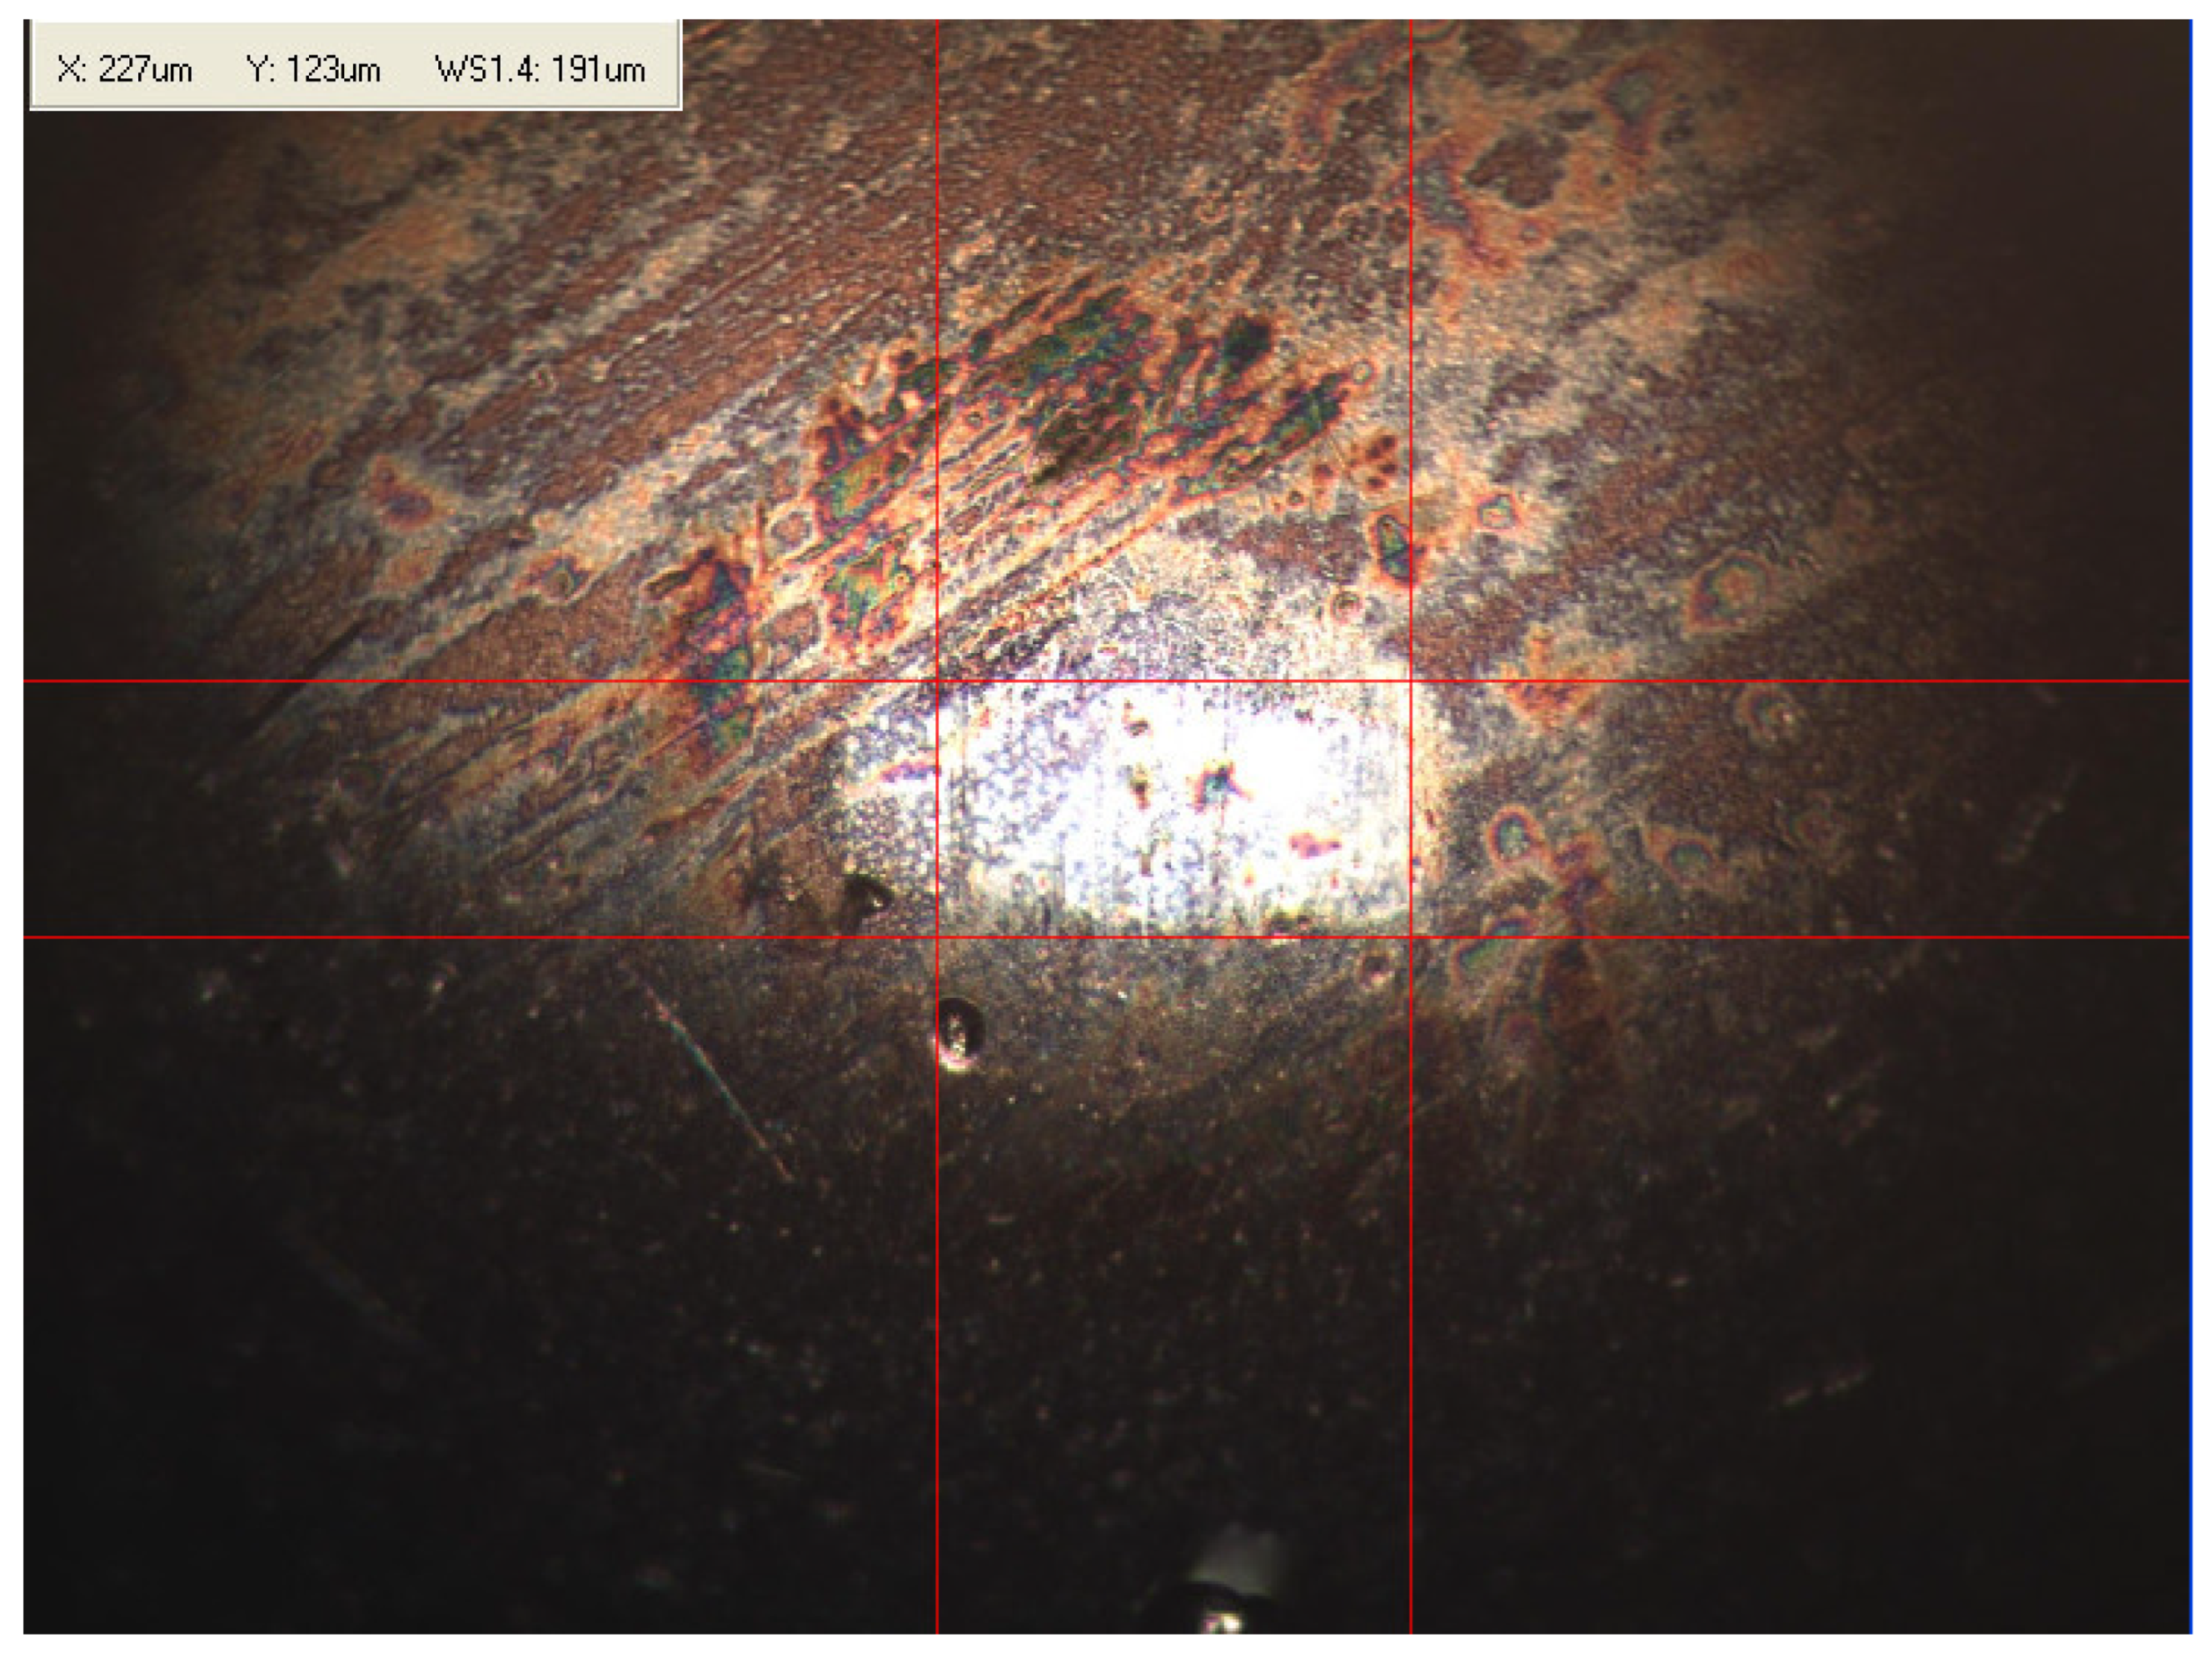
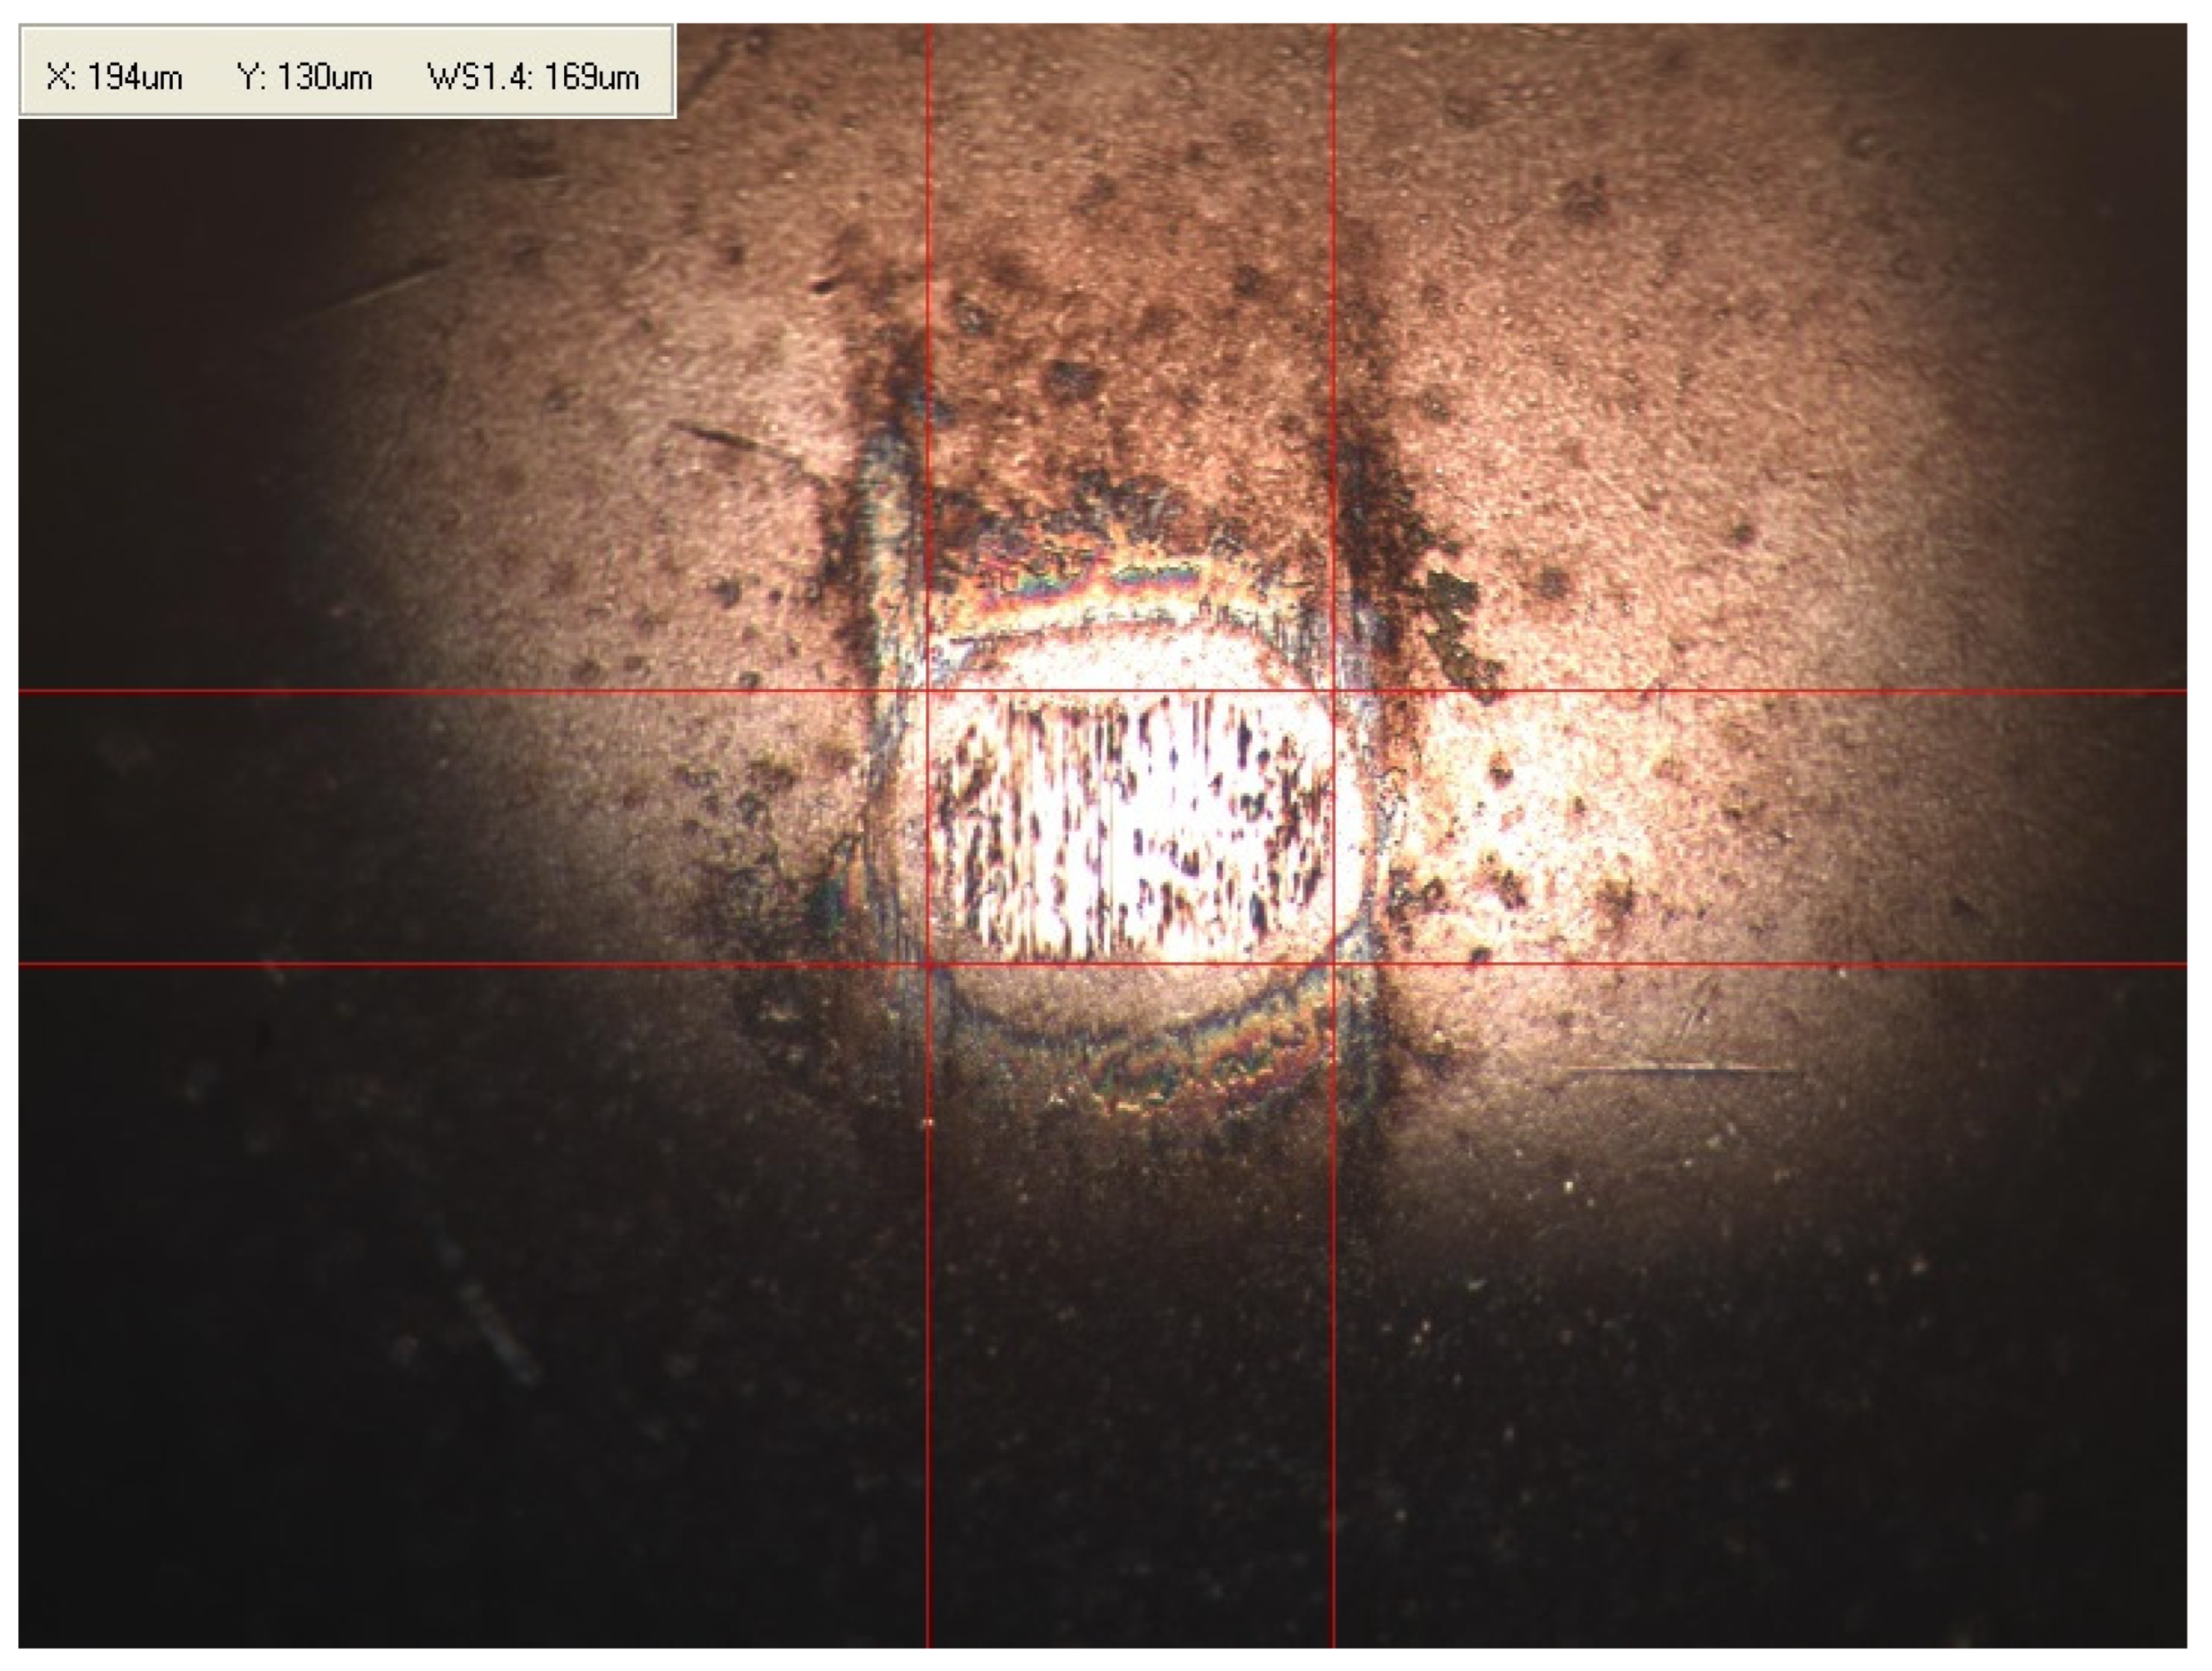
Appendix B. Photographs of Traces of Wear on a Moving Component after an HFRR Lubricity Test

References
- Oran, E.S.; Chamberlain, G.; Pekalski, A. Mechanisms and occurrence of detonations in vapor cloud explosions. Prog. Energy Combust. Sci. 2020, 77, 100804. [Google Scholar] [CrossRef]
- Kadota, T.; Yamasaki, H. Recent advances in the combustion of water fuel emulsion. Prog. Energy Combust. Sci. 2002, 28, 385–404. [Google Scholar] [CrossRef]
- Sun, Q.; Jiang, L.; Li, M.; Sun, J. Assessment on thermal hazards of reactive chemicals in industry: State of the Art and perspectives. Prog. Energy Combust. Sci. 2020, 78, 100832. [Google Scholar] [CrossRef]
- Wiaterek, D.; Chybowski, L. Assessing the topicality of the problem related to the explosion of crankcases in marine main propulsion engines (1972–2018). Sci. J. Marit. Univ. Szczec. Zesz. Nauk. Akad. Mor. Szczec. 2022, 71, 1733–8670. [Google Scholar]
- Cicek, K.; Celik, M. Application of failure modes and effects analysis to main engine crankcase explosion failure on-board ship. Saf. Sci. 2013, 51, 6–10. [Google Scholar] [CrossRef]
- Ünver, B.; Gürgen, S.; Sahin, B.; Altın, İ. Crankcase explosion for two-stroke marine diesel engine by using fault tree analysis method in fuzzy environment. Eng. Fail. Anal. 2019, 97, 288–299. [Google Scholar] [CrossRef]
- Metalock Engineering UK Crankcase Explosion. Following Catastrophic Engine Failure When a Con-Rod Breaks through the Crankcase Door, Water Jacket and Liner Area, Does This Mean a New Engineblosk? Available online: https://www.metalockengineering.com/en/metalock-engineering-uk-limited/news/crankcase-explosion/ (accessed on 20 June 2022).
- Schaller Automation Crankcase Explosion. Available online: https://schaller.sg/product/crankcase-explosion/ (accessed on 20 June 2022).
- Skjold, T.; Souprayen, C.; Dorofeev, S. Fires and explosions. Prog. Energy Combust. Sci. 2018, 64, 2–3. [Google Scholar] [CrossRef]
- Zhang, L.; Wang, H.; Liu, D.; Zhang, Q.; Guo, W.; Yang, N.; Xu, J.; Fu, S.; Yang, B.; Liu, S.; et al. Research on wear detection mechanism of cylinder liner-piston ring based on energy dissipation and AE. Wear 2022, 508–509, 204472. [Google Scholar] [CrossRef]
- Chybowski, L. Eksplozje w Skrzyniach Korbowych Silników Okrętowych—Przyczyny, Zapobieganie i Minimalizacja Skutków; Akademia Morska w Szczecinie: Szczecin, Poland, 2022. [Google Scholar]
- Hu, T.; Teng, H.; Luo, X.; Lu, C.; Luo, J. Influence of Fuel Dilution of Crankcase Oil on Ignitability of Oil Particles in a Highly Boosted Gasoline Direct Injection Engine; SAE Technical Paper; SAE: Warrendale, PA, USA, 2015. [Google Scholar]
- Xiong, H.; Sun, W. Investigation of Droplet Atomization and Evaporation in Solution Precursor Plasma Spray Coating. Coatings 2017, 7, 207. [Google Scholar] [CrossRef] [Green Version]
- Chybowski, L. The Initial Boiling Point of Lubricating Oil as an Indicator for the Assessment of the Possible Contamination of Lubricating Oil with Diesel Oil. Energies 2022, 15, 7927. [Google Scholar] [CrossRef]
- Lenk, J.-R.; Meyer, L.; Provase, I.S. Oil Dilution Model for Combustion Engines—Detection of Fuel Accumulation and Evaporation. In Proceedings of the 23rd SAE Brasil International Congress and Display, Washington, DC, USA, 17–19 January 2014. [Google Scholar]
- Gupta, R. Crankcase Explosion: Precaution and Regulation (Part 3). Available online: http://www.marinelesson.com/general/crank-case-explosion/crankcase-explosionpart-3/crankcase-explosion-precaution-and-regulationpart-3/ (accessed on 8 June 2022).
- Kaminski, P. Experimental Investigation into the Effects of Fuel Dilution on the Change in Chemical Properties of Lubricating Oil Used in Fuel Injection Pump of Pielstick PA4 V185 Marine Diesel Engine. Lubricants 2022, 10, 162. [Google Scholar] [CrossRef]
- Bejger, A.; Chybowski, L.; Gawdzińska, K. Utilising elastic waves of acoustic emission to assess the condition of spray nozzles in a marine diesel engine. J. Mar. Eng. Technol. 2018, 17, 153–159. [Google Scholar] [CrossRef] [Green Version]
- Wiaterek, D.; Chybowski, L. Comparison of selected models useful in ranking the root causes of explosions in marine engine crankcases. Sci. J. Marit. Univ. Szczec. Zesz. Nauk. Akad. Mor. Szczec. 2022, 72, 77. [Google Scholar]
- IACS. Requirements Concerning Machinery Installations; International Association of Classification Societies: London, UK, 2016. [Google Scholar]
- IMO. Resolution MSC.391(95) Adoption of the International Code of Safety for Ships Using Gases of Other Low-Flashpoint Fuels (IGF CODE)—MSC 95/22/Add.1; International Maritime Organization: London, UK, 2015. [Google Scholar]
- IMO. SOLAS–Consolidated Edition 2020; International Maritime Organization: London, UK, 2020. [Google Scholar]
- DNV. Rules for Classification. Ships Part 5 Ship Types Chapter 7 Liquefied Gas Tankers; DNV: Oslo, Norway, 2021. [Google Scholar]
- Rickaby, P.; Rattenbury, N.; Uebel, H.; Ohlsen, E.; Evans, D.J.; Milne, A.M.; Rose, D.J.; Heikamp, W.; Bowen, P.; Brunk, H.; et al. Crankcase Explosions; IMAREST: London, UK, 2002. [Google Scholar]
- MAN B&W Diesel A/S. Crankcase Explosions in Two-Stroke Diesel Engines; MAN Burmeister and Wain: København, Denmark, 2002. [Google Scholar]
- Chybowski, L.; Gawdzińska, K.; Ślesicki, O.; Patejuk, K.; Nowosad, G. An engine room simulator as an educational tool for marine engineers relating to explosion and fire prevention of marine diesel engines. Sci. J. Marit. Univ. Szczec. Zesz. Nauk. Akad. Mor. Szczec. 2016, 43, 15–21. [Google Scholar] [CrossRef]
- Graddage, M. Crankcase Explosions—Detection or Prevention? In Crankcase Explosions; IMAREST: London, UK, 2002; pp. 126–147. [Google Scholar]
- Bowen, P.J. Current Understanding of Oil-Mist Explosions. In Crankcase Explosions; IMAREST: London, UK, 2002; pp. 149–164. [Google Scholar]
- Technomics International Case Study—Fuel Dilution of Engine Oil in Locomotives. Available online: https://www.techenomics.net/case-studies/fuel-dilution-engine-oil/ (accessed on 8 June 2022).
- Total Energies Fuel Dilution of Engine Oil: Causes and Effects. Available online: https://lubricants.totalenergies.com/fuel-dilution-engine-oil-causes-and-effects (accessed on 14 June 2022).
- CIMAC. Guideline on the Relevance of Lubricationt Flash Point in Connection with Crankcase Explosions; CIMAC Working Group 8 ”Marine Lubricants”: Frankfurt, Germany, 2013. [Google Scholar]
- Larsson, E.; Heinrichs, J.; Jacobson, S. Tribological evaluation of a boric acid fuel additive in various engine fuels. Wear 2022, 502–503, 204381. [Google Scholar] [CrossRef]
- Niculescu, R.; Iorga-Simăn, V.; Trică, A.; Clenci, A. Study on the engine oil’s wear based on the flash point. IOP Conf. Ser. Mater. Sci. Eng. 2016, 147, 012124. [Google Scholar] [CrossRef] [Green Version]
- Critchley, L. Fuel Dilution in Engine Oil—How It Happens and What It Leads to. Available online: https://www.azom.com/article.aspx?ArticleID=16891 (accessed on 16 June 2022).
- Wolak, A.; Zając, G.; Żółty, M. Changes of properties of engine oils diluted with diesel oil under real operating conditions. Combust. Engines 2018, 173, 34–40. [Google Scholar] [CrossRef]
- Ljubas, D.; Krpan, H.; Matanović, I. Influence of engine oils dilution by fuels on their viscosity, flash point and fire point. Nafta 2010, 61, 73–79. [Google Scholar]
- Dieselhub Fuel Dilution in Diesel Engines. Fuel Dilution Causes, How to Protect Your Engine. Available online: https://www.dieselhub.com/maintenance/fuel-dilution.html (accessed on 14 June 2022).
- Krupowies, J. Badania Pierwiastków Śladowych w Oleju Obiegowym Jako Element Diagnostyki Silnika; Wyższa Szkoła Morska w Szczecinie: Szczecin, Poland, 2001. [Google Scholar]
- Krupowies, J. Badania i Ocena Zmian Właściwości Użytkowych Olejów Urządzeń Okrętowych; Maritime University of Szczecin: Szczecin, Poland, 2009. [Google Scholar]
- Sejkorová, M.; Hurtová, I.; Jilek, P.; Novák, M.; Voltr, O. Study of the Effect of Physicochemical Degradation and Contamination of Motor Oils on Their Lubricity. Coatings 2021, 11, 60. [Google Scholar] [CrossRef]
- Abdulmunem, O.M.; Abdul-Munaim, A.M.; Aller, M.M.; Preu, S.; Watson, D.G. THz-TDS for Detecting Glycol Contamination in Engine Oil. Appl. Sci. 2020, 10, 3738. [Google Scholar] [CrossRef]
- Bonisławski, M.; Hołub, M.; Borkowski, T.; Kowalak, P. A Novel Telemetry System for Real Time, Ship Main Propulsion Power Measurement. Sensors 2019, 19, 4771. [Google Scholar] [CrossRef] [PubMed] [Green Version]
- Borkowski, T.; Kowalak, P.; Myśków, J. Vessel main propulsion engine performance evaluation. J. Kones 2012, 19, 53–60. [Google Scholar] [CrossRef]
- Kowalak, P.; Borkowski, T.; Bonisławski, M.; Hołub, M.; Myśków, J. A statistical approach to zero adjustment in torque measurement of ship propulsion shafts. Measurement 2020, 164, 108088. [Google Scholar] [CrossRef]
- Ferguson, G.W. Diesel Engine Crankcase Explosion Investigation. SAE Tech. Pap. 1951, 510104, 1–28. [Google Scholar] [CrossRef]
- Freeston, H.G.; Roberts, J.D.; Thomas, A. Crankcase Explosions: An Investigation into Some Factors Governing the Selection of Protective Devices. Proc. Inst. Mech. Eng. 1956, 170, 811–824. [Google Scholar] [CrossRef]
- Bureau of Ships. Diesel Engine Maintenance Training Manual; Maritime Press: Bremen, Germany, 2015. [Google Scholar]
- Quan, W.; Wei, J.; Zhao, Y.W.; Sun, L.H.; Bianl, X. Development of an Automatic Optical Measurement System for Engine Crankshaft. In Proceedings of the International Conference on Computational Science and Applications, Singapore, 1–3 June 2011; pp. 68–75. [Google Scholar]
- Firoz, J. Crankcase Explosion on Ships—Marine Engineering. Available online: https://marineengineeringonline.com/crankcase-explosion-on-ships/amp/ (accessed on 20 June 2022).
- Marinediesel 21–22 The Best Tutorials on Crankcase Explosion. Available online: https://www.marinediesel.co.in/crankcase-explosion-scavenge-fire-hotspot-mist-detector-relief-valve/ (accessed on 20 June 2022).
- MAIB. Catastrophic Engine Failure, Resulting in a Fire and Serious Injuries to the Engineer on Board Wight Sky, Off Yarmouth 12 September 2017; Marine Accident Investigation Branch: London, UK, 2018. [Google Scholar]
- Rattenbury, N. Crankcase Expolsions—A Historical Review—Where We Are Today. In Crankcase Explosions; IMAREST: London, UK, 2002; pp. 3–13. [Google Scholar]
- The Hong Kong Special Administrative Region. Report of Investigation Into the Engine Room Fire on Board Hong Kong Registered M.T. “An Tai Jiang” on 9 January 2009; Marine Department; Marine Accident Investigation Section: Hong Kong, China, 2009. [Google Scholar]
- Australian Transport Safety Bureau. Independent Investigation into the Equipment Failure Aboard the Australian Flag Roll-On/Roll-Off Vessel Searoad Mersey; Australian Goverment: Canberra, Australia, 2004. [Google Scholar]
- Kowalak, P.; Myśków, J.; Tuński, T.; Bykowski, D.; Borkowski, T. A method for assessing of ship fuel system failures resulting from fuel changeover imposed by environmental requirements. Eksploat. Niezawodn. Maint. Reliab. 2021, 23, 619–626. [Google Scholar] [CrossRef]
- AMETEK Spectro Scientific Measuring Fuel Dilution in Lubricating Oil. Available online: https://www.azom.com/article.aspx?ArticleID=12880 (accessed on 14 June 2022).
- Chybowski, L. Lube Oil—Diesel Oil Mixes—Dataset; Version 3. 2022. Available online: https://data.mendeley.com/datasets/scbx3h2bmf/3 (accessed on 8 November 2022).
- ISO 8217:2017; Petroleum Products—Fuels (class F)—Specifications of Marine Fuels, 6th ed. ISO: Geneva, Switzerland, 2017.
- SAE J300-2021; Engine Oil Viscosity Classification. SAE International: Warrendale, PA, USA, 2021.
- PKN Orlen, S.A. Olej Napędowy. Ecodiesel Ultra B, D, F, Olej Napędowy Arktyczny Klasy 2, Efecta Diesel B, D, F, Verva ON B, D, F; PKN Orlen: Płock, Poland, 2021. [Google Scholar]
- Oleje-Smary AGIP Cladium 120 SAE 30 CD. Available online: https://oleje-smary.pl/pl/p/AGIP-Cladium-120-SAE-30-CD-20-litrow/186 (accessed on 12 July 2022).
- Oleje-Smary AGIP Cladium 120 SAE 40 CD. Available online: https://oleje-smary.pl/pl/p/AGIP-Cladium-120-SAE-40-CD-20-litrow/188 (accessed on 12 July 2022).
- ITALCO (Far East) Pte Ltd. Product Data Sheet—Eni Cladium 120 (Series); ITALCO: Singapore, 2017. [Google Scholar]
- Malinowska, M.; Zera, D. Analiza zmian smarności oleju silnikowego stosowanego w silniku Cegielski-Sulzer 3AL25/30. Zesz. Nauk. Akad. Mor. Gdyni 2016, 96, 93–104. [Google Scholar]
- EN ISO 12156-1:2018; Diesel Fuel—Assesment of Lubricity Using the High-Frequency Reciporating Rig (HFFR)—Part 1: Test Method. ISO: Geneva, Switzerland, 2018.
- Ramadan, O.; Menard, L.; Gardiner, D.; Wilcox, A.; Webster, G. Performance Evaluation of the Ignition Quality Testers Equipped with TALM Precision Package (TALM-IQTTM) Participating in the ASTM NEG Cetane Number Fuel Exchange Program; SAE Technical Paper 2017-01–07; SAE: Warrendale, PA, USA, 2017. [Google Scholar] [CrossRef]
- PAC. Aparat do Oznaczania Pochodnej Liczby Cetanowej; Inkom Instruments Co.: Warszawa, Poland, 2008. [Google Scholar]
- PAC L.P. Herzog Cetane ID 510; PAC L.P.: Houston, TX, USA, 2019. [Google Scholar]
- Olezol Viscosity Index (VI) Calculator. Available online: https://olezol.com/ (accessed on 7 September 2022).
- Anton Paar ASTM D2270/Viscosity Index (VI) from 40 °C and 100 °C. Available online: https://wiki.anton-paar.com/pl-pl/wskaznik-lepkosci-vi-od-40c-i-100c-astm-d2270/ (accessed on 7 September 2022).
- Ehsan, M.; Rahman, M.M.; Hasan, M.S. Effect of Fuel Adulteration on Engine Crankcase Dilution. J. Mech. Eng. 2010, 41, 114–120. [Google Scholar] [CrossRef] [Green Version]
- Zhang, Y.; Ma, Z.; Feng, Y.; Diao, Z.; Liu, Z. The Effects of Ultra-Low Viscosity Engine Oil on Mechanical Efficiency and Fuel Economy. Energies 2021, 14, 2320. [Google Scholar] [CrossRef]
- Ansah, E.O.; Vo Thanh, H.; Sugai, Y.; Nguele, R.; Sasaki, K. Microbe-induced fluid viscosity variation: Field-scale simulation, sensitivity and geological uncertainty. J. Pet. Explor. Prod. Technol. 2020, 10, 1983–2003. [Google Scholar] [CrossRef] [Green Version]
- Purwwasena, I.A.; Sugai, Y.; Sasaki, K. Estimation of the Potential of an Oil-Viscosity-Reducing Bacteria, Petrotoga Isolated from an Oilfield for MEOR. In Proceedings of the IPTC 2009 SPE Annual Technical Conference and Exhibition, Florence, Italy, 19 September 2010. [Google Scholar]
- Haas, F.M.; Won, S.H.; Dryer, F.L.; Pera, C. Lube oil chemistry influences on autoignition as measured in an ignition quality tester. Proc. Combust. Inst. 2019, 37, 4645–4654. [Google Scholar] [CrossRef]
- Chybowski, L.; Wiaterek, D.; Jakubowski, A. The Impact of Marine Engine Component Failures upon an Explosion in the Starting Air Manifold. J. Mar. Sci. Eng. 2022, 10, 1850. [Google Scholar] [CrossRef]
- Johnsson, R. Crankshaft Speed Measurements and Analysis for Control and Engines. Ph.D. Thesis, Luleå Tekniska Universitet, Luleå, Sweden, 2001. [Google Scholar]


Disclaimer/Publisher’s Note: The statements, opinions and data contained in all publications are solely those of the individual author(s) and contributor(s) and not of MDPI and/or the editor(s). MDPI and/or the editor(s) disclaim responsibility for any injury to people or property resulting from any ideas, methods, instructions or products referred to in the content. |
© 2023 by the author. Licensee MDPI, Basel, Switzerland. This article is an open access article distributed under the terms and conditions of the Creative Commons Attribution (CC BY) license (https://creativecommons.org/licenses/by/4.0/).
Share and Cite
Chybowski, L. Study of the Relationship between the Level of Lubricating Oil Contamination with Distillation Fuel and the Risk of Explosion in the Crankcase of a Marine Trunk Type Engine. Energies 2023, 16, 683. https://doi.org/10.3390/en16020683
Chybowski L. Study of the Relationship between the Level of Lubricating Oil Contamination with Distillation Fuel and the Risk of Explosion in the Crankcase of a Marine Trunk Type Engine. Energies. 2023; 16(2):683. https://doi.org/10.3390/en16020683
Chicago/Turabian StyleChybowski, Leszek. 2023. "Study of the Relationship between the Level of Lubricating Oil Contamination with Distillation Fuel and the Risk of Explosion in the Crankcase of a Marine Trunk Type Engine" Energies 16, no. 2: 683. https://doi.org/10.3390/en16020683