Article

Repair Parameter Design of Outer Reinforcement Layers of Offshore Wind Turbine Blade Spar Cap Based on Structural and Aerodynamic Analysis

1
School of Architecture and Civil Engineering, Shenyang University of Technology, Shenyang 110870, China
2
School of Mechanical Engineering, Shenyang University of Technology, Shenyang 110870, China
3
School of Mechanical Engineering, Liaoning Institute of Science and Technology, Benxi 117004, China
4
Jiangsu Key Laboratory of Hi-Tech Research for Wind Turbine Design, Wuxi 214174, China
*
Author to whom correspondence should be addressed.
Energies 2023, 16(2), 712; https://doi.org/10.3390/en16020712
Submission received: 4 December 2022 / Revised: 29 December 2022 / Accepted: 4 January 2023 / Published: 7 January 2023
(This article belongs to the Special Issue Theoretical and Technical Challenges in Offshore Wind Power)

Abstract

:
The influence of the outer reinforcement layers on the repair structure and aerodynamic performance was studied. Firstly, a continuous damage mechanics model was established, and the 3D Hashin criterion and cohesive zone material model were used to analyze the damage repair model. The failure load deviation was 5.5%. Secondly, on the basis of the γ R e θ transition model and SST–ω turbulence model, the aerodynamic analysis model of DU300 airfoil was established. The numerical simulation results showed that the lift coefficient and pressure distribution at the angle of attack of 10° and 15° were deviated from the experimental values by 2%. Furthermore, 27 structural repair models, nine 2D aerodynamic repair models, and a 3D full-scale blade model were designed. It was found that, when the repair length accounted for 60% of the total model length, the failure load increased by 22%, but the aerodynamic power with the repair length of 10 m was decreased by 0.137%. When the repair area was large and the repair height was from 4 mm to 6 mm, the failure load was greatly increased by about 30%, and the aerodynamic pressure distribution and static pressure field fluctuated significantly. The results show that the structural and aerodynamic characteristics were closely related to the repair parameters.

1. Introduction

In recent years, due to global warming, the depletion of traditional energy sources, and global energy structure transformation factors, countries around the world have increased the use of wind energy [1]. Compared with onshore wind turbines (WTs), offshore wind turbines (OWTs) have the advantages of abundant wind resources, lower turbulence, larger construction space, smaller visual impact, lower noise pollution, etc. These significant advantages have led to the rapid development of OWTs [2]. In addition, OWTs have undesirable characteristics such as lower reliability, higher failure rates, and higher operating and maintenance costs. Onshore WT accounts for about 20–25% of the cost of wind power, while OWT accounts for an even larger proportion, up to 30% [3,4]. As the key structure for WT to capture wind energy, OWT blades suffer higher mechanical stress and higher probability of damage than those of onshore WT due to the adverse offshore working environment and extreme wind conditions. As a result, the service life of blades of OWT is significantly shorter than that of onshore WT [5].
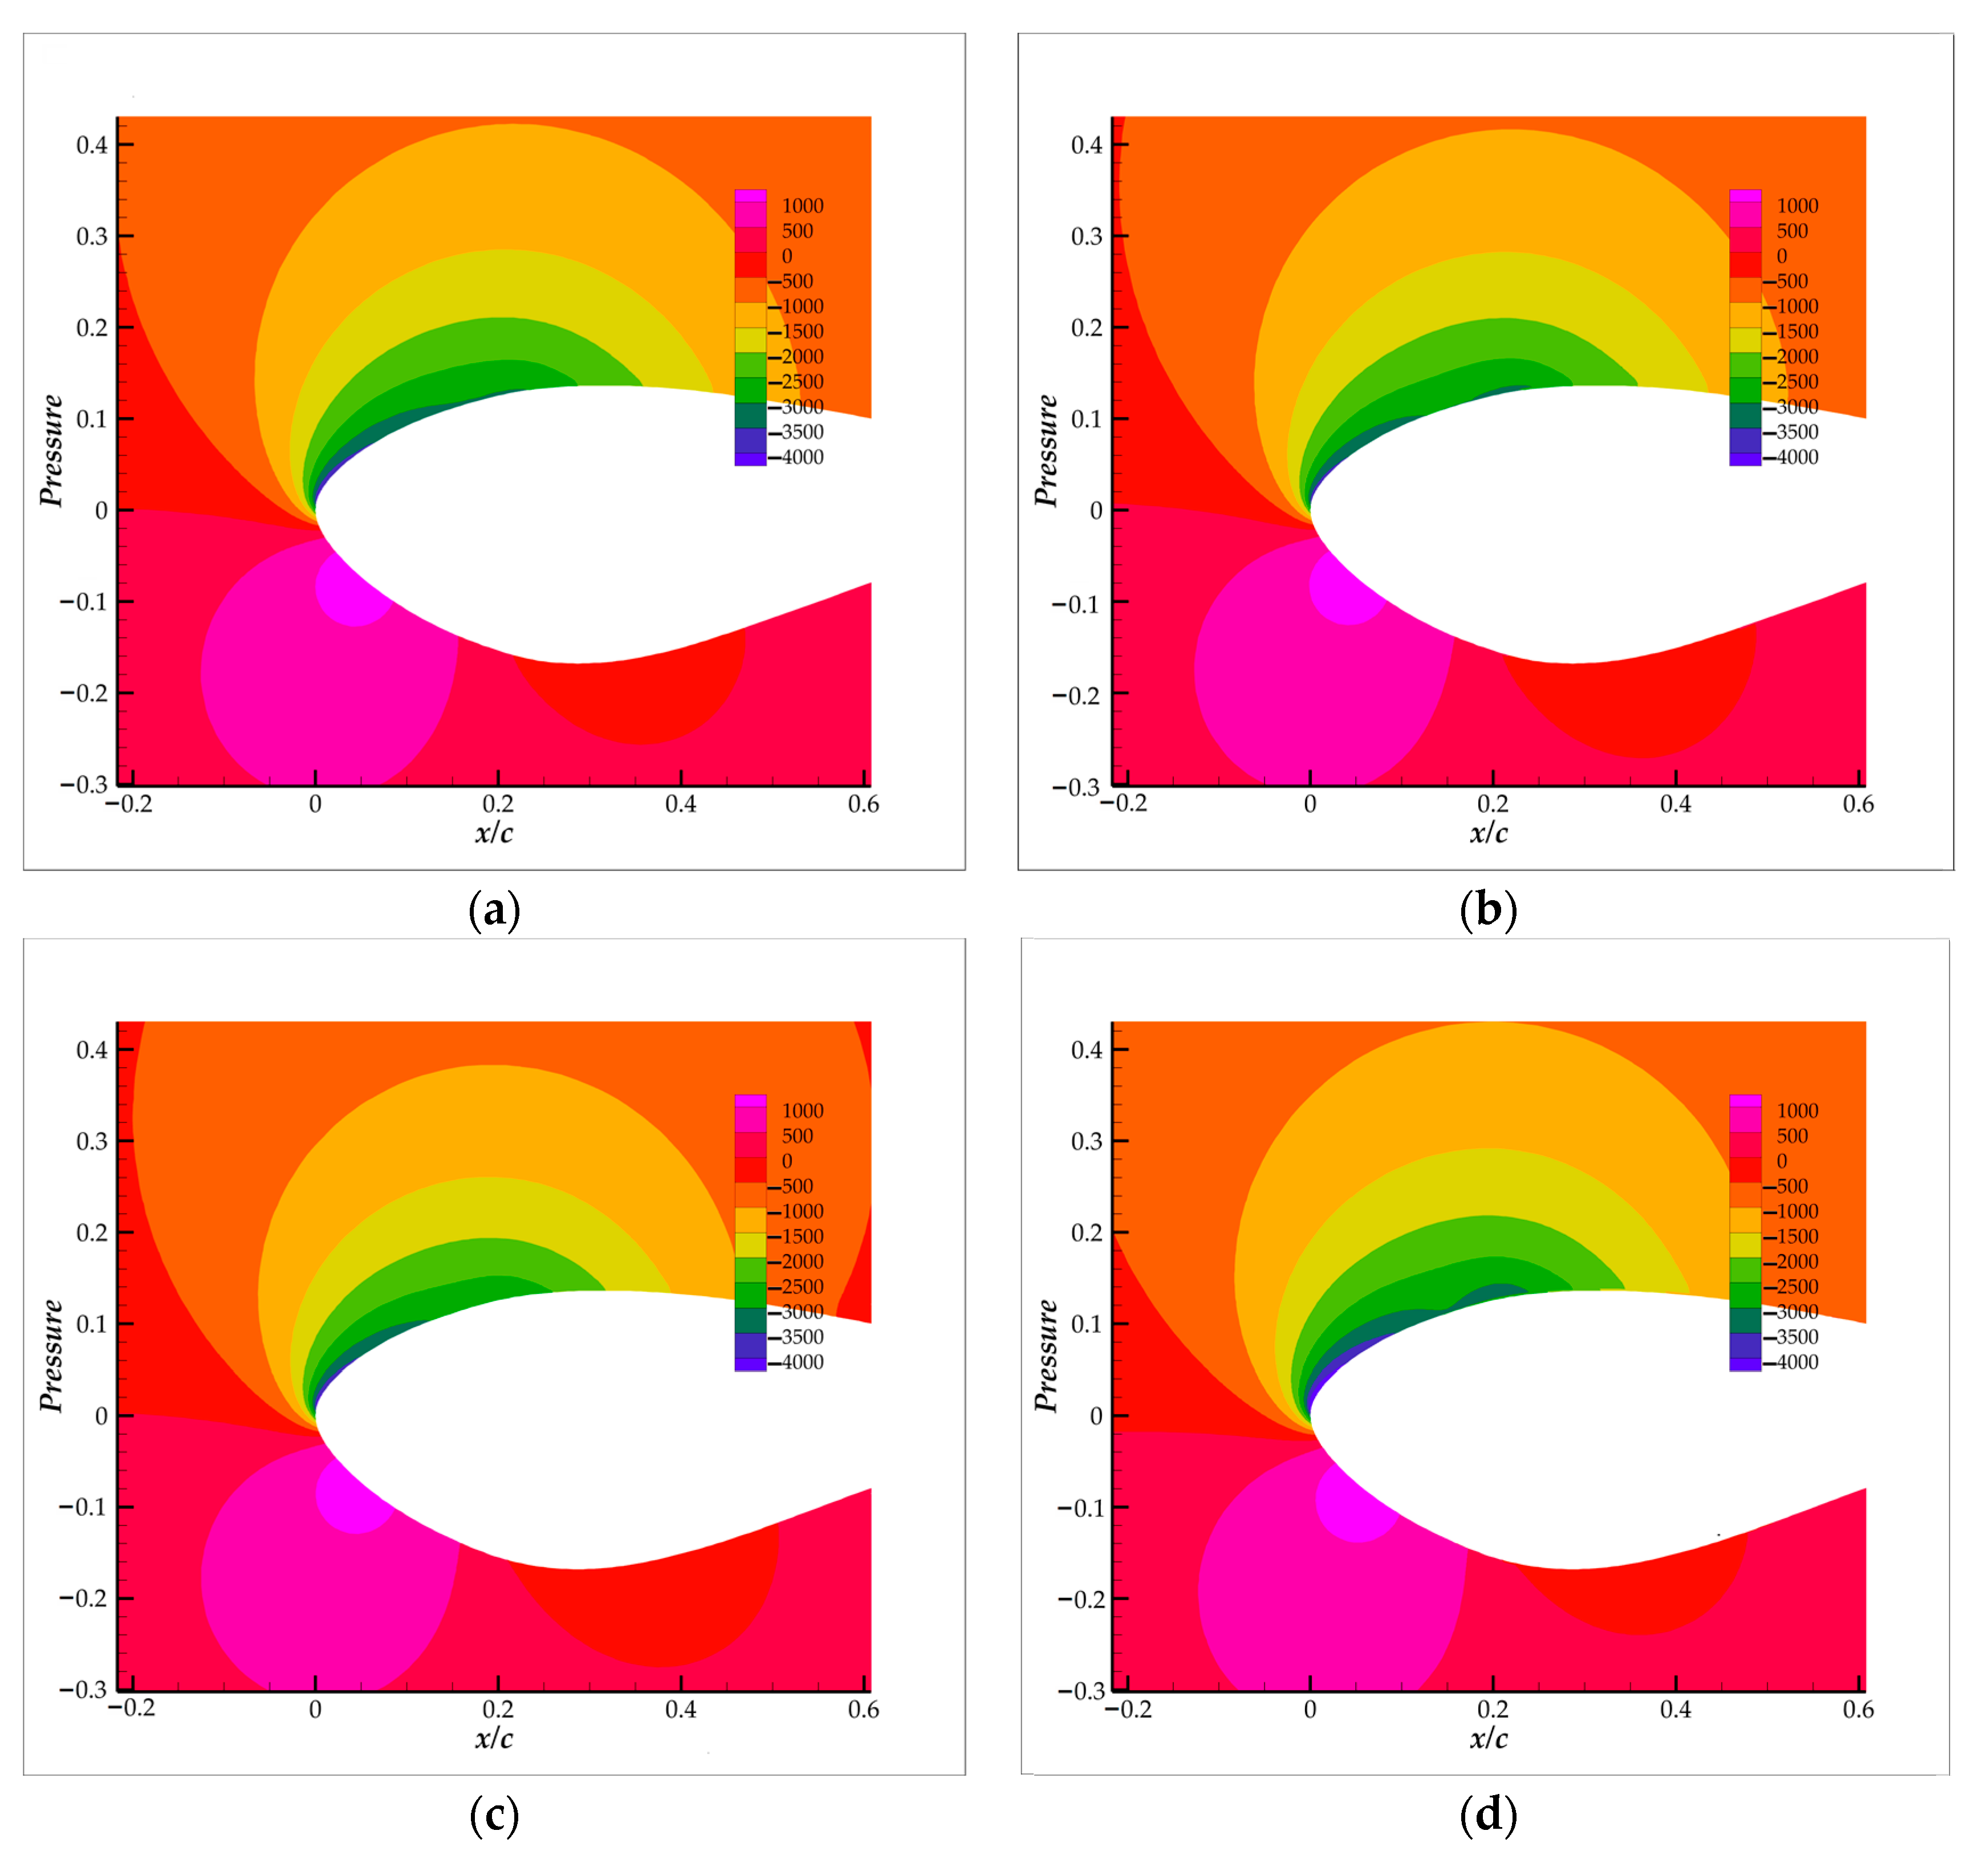
The spar cap, as the most important bearing structure of the blade, is composed of dozens of unidirectional (UD) layers, and it is very easy to introduce wrinkles, porosities and other primary defects during molding [6]. In the offshore service environment of the spar cap, internal primary defects gradually evolve into structural damage, experiencing damage initiation, damage accumulation, and unstable rapid expansion of the evolutionary process, thus significantly reducing the blade strength and stiffness [7,8,9,10], and potentially even causing blade collapse, which is very catastrophic for OWT [11]. According to the results of NASA’s research, one of the major problems hindering the further application of composite materials is damage repair, which is limited by the accuracy of structural damage assessment and the reliability of repair implementation [12]. Therefore, the repair technology of blade structure damage will be one of the important directions to ensure the sustainable development of OWT.
At present, the most widely used repair method for WT blade spar cap structural damage are patch repair and scarf repair [13]. There is no eccentric load in the scarf repair, and it has certain advantages in the areas with high requirements for repair strength and aerodynamic shape [14]. Considering the repair efficiency and the feasibility of overhead operation, stepped-lap scarf repair is more suitable for WT blade damage repair than tapered scarf repair [15]. At this time, the design of repair parameters has a significant impact on the repair performance [16]. The outer reinforcement layers (ORLs) generate an additional load transfer path, reduce the local stress concentration at the end of the stepped-lap surface, and significantly improve the local stiffness and repair strength [17,18,19,20]. Lekou et al. [21] repaired the delamination damage with a thickness of up to 16 layers by designing the patch shape and the number of ORLs, which made the repair strength reach 50–100% of that of the parent structure.
The ORLs of the spar cap will cause a slight deviation of the local aerodynamic profile and affect the aerodynamic lift and pressure distribution of the blade [22,23,24]. Many researchers have studied the impact of aircraft damage repair on aerodynamic performance. For example, Kind [25] and Render [26] studied the impact of rectangular and circular patches on aerodynamic lift coefficient of wings. Djelal et al. [27,28] studied the effects of repair patches of different sizes on the aerodynamics of aircraft and wings. Etemadi [29,30] compared the influence rule on the pressure coefficient of NACA-64 airfoil by using triangle and star patch shapes, repairing only the underwing surface, repairing only the upper wing surface, and repairing both wings at the same time. However, there are few studies on the impact of WT blade repair on aerodynamic performance. It is only mentioned in the international standard for WT blade that the repair should consider the impact on aerodynamic characteristics, but there is no specific guidance basis [31].
Therefore, a reasonable and efficient repair method based on the optimization design of ORLs is proposed in this paper to solve the lack of data foundation in the repair design of OWT blades, aiming at considering the efforts on both the structural strength and the aerodynamic performance. In this paper, using the stepped-lap scarf repair method, the repair parameters of ORLs were designed as the repair height (RH), repair width (RW), and repair length (RL), while the analysis models of the repair structure and repair aerodynamics were created. The accuracy of the numerical analysis model was verified by comparing the results to the test data. The influence rules of the quantitative optimization design of the ORL repair parameters on the repair strength and aerodynamic characteristics were studied, so as to realize the comprehensive evaluation of the repair design on the blade operation safety and power generation efficiency.

2. Design of Repair Parameters of Outer Reinforcing Layers

2.1. Repair Parameters

As shown in Figure 1a, under the excitation of a complex wind environment with a highly unsteady flow field, the nonlinear deformation of slender and huge blades becomes more significant. Once the structural damage in the spar cap area is identified (Figure 1b), the damage will spread and deteriorate rapidly, and it should be repaired immediately. The Y-axis of the blade cross-section is the chord direction, the Z-axis is the direction from root to tip, and the X-axis is perpendicular to the Y-axis. The center of blade profile coordinates is the intersection point of the local deflected neutral axis and cross-section.
The blade cross-section structure id shown in Figure 1c; the double shear webs, pressure surface (PS), and suction surface (SS) constitute a multi-closed chamber thin-walled structure, and the spar cap is located near the main inertia axis of the cross-section. Figure 1d shows the area of the in-service WT blade spar cap after removal of paint from the damaged structure, showing obvious delamination and resin accumulation, which significantly reduced the local strength and stiffness of the spar cap. A stepped-lap scarf method was used to remove the damaged area of the parent structure (Figure 1e,f), and then the patch was filled back. In order to improve the stiffness and strength of the patch, additional ORLs were laid over the repair area. The patch and the parent structure were co-cured in the repair using by vacuum bag pressing method, and a protective coating of paint film was finally rolled onto the repair area, as shown in Figure 1g.
It can be seen that the secondary co-curing of the spar cap parent structure and patch, as well as the additional ORLs, inevitably led to slight deviation from the original blade shape in the repair area. In this paper, the repair ORLs was optimized as the repair width, repair height, and repair length (Figure 1h), thus quantifying the shape deviation introduced by the repair ORLs.

2.2. Design of Repair Parameters

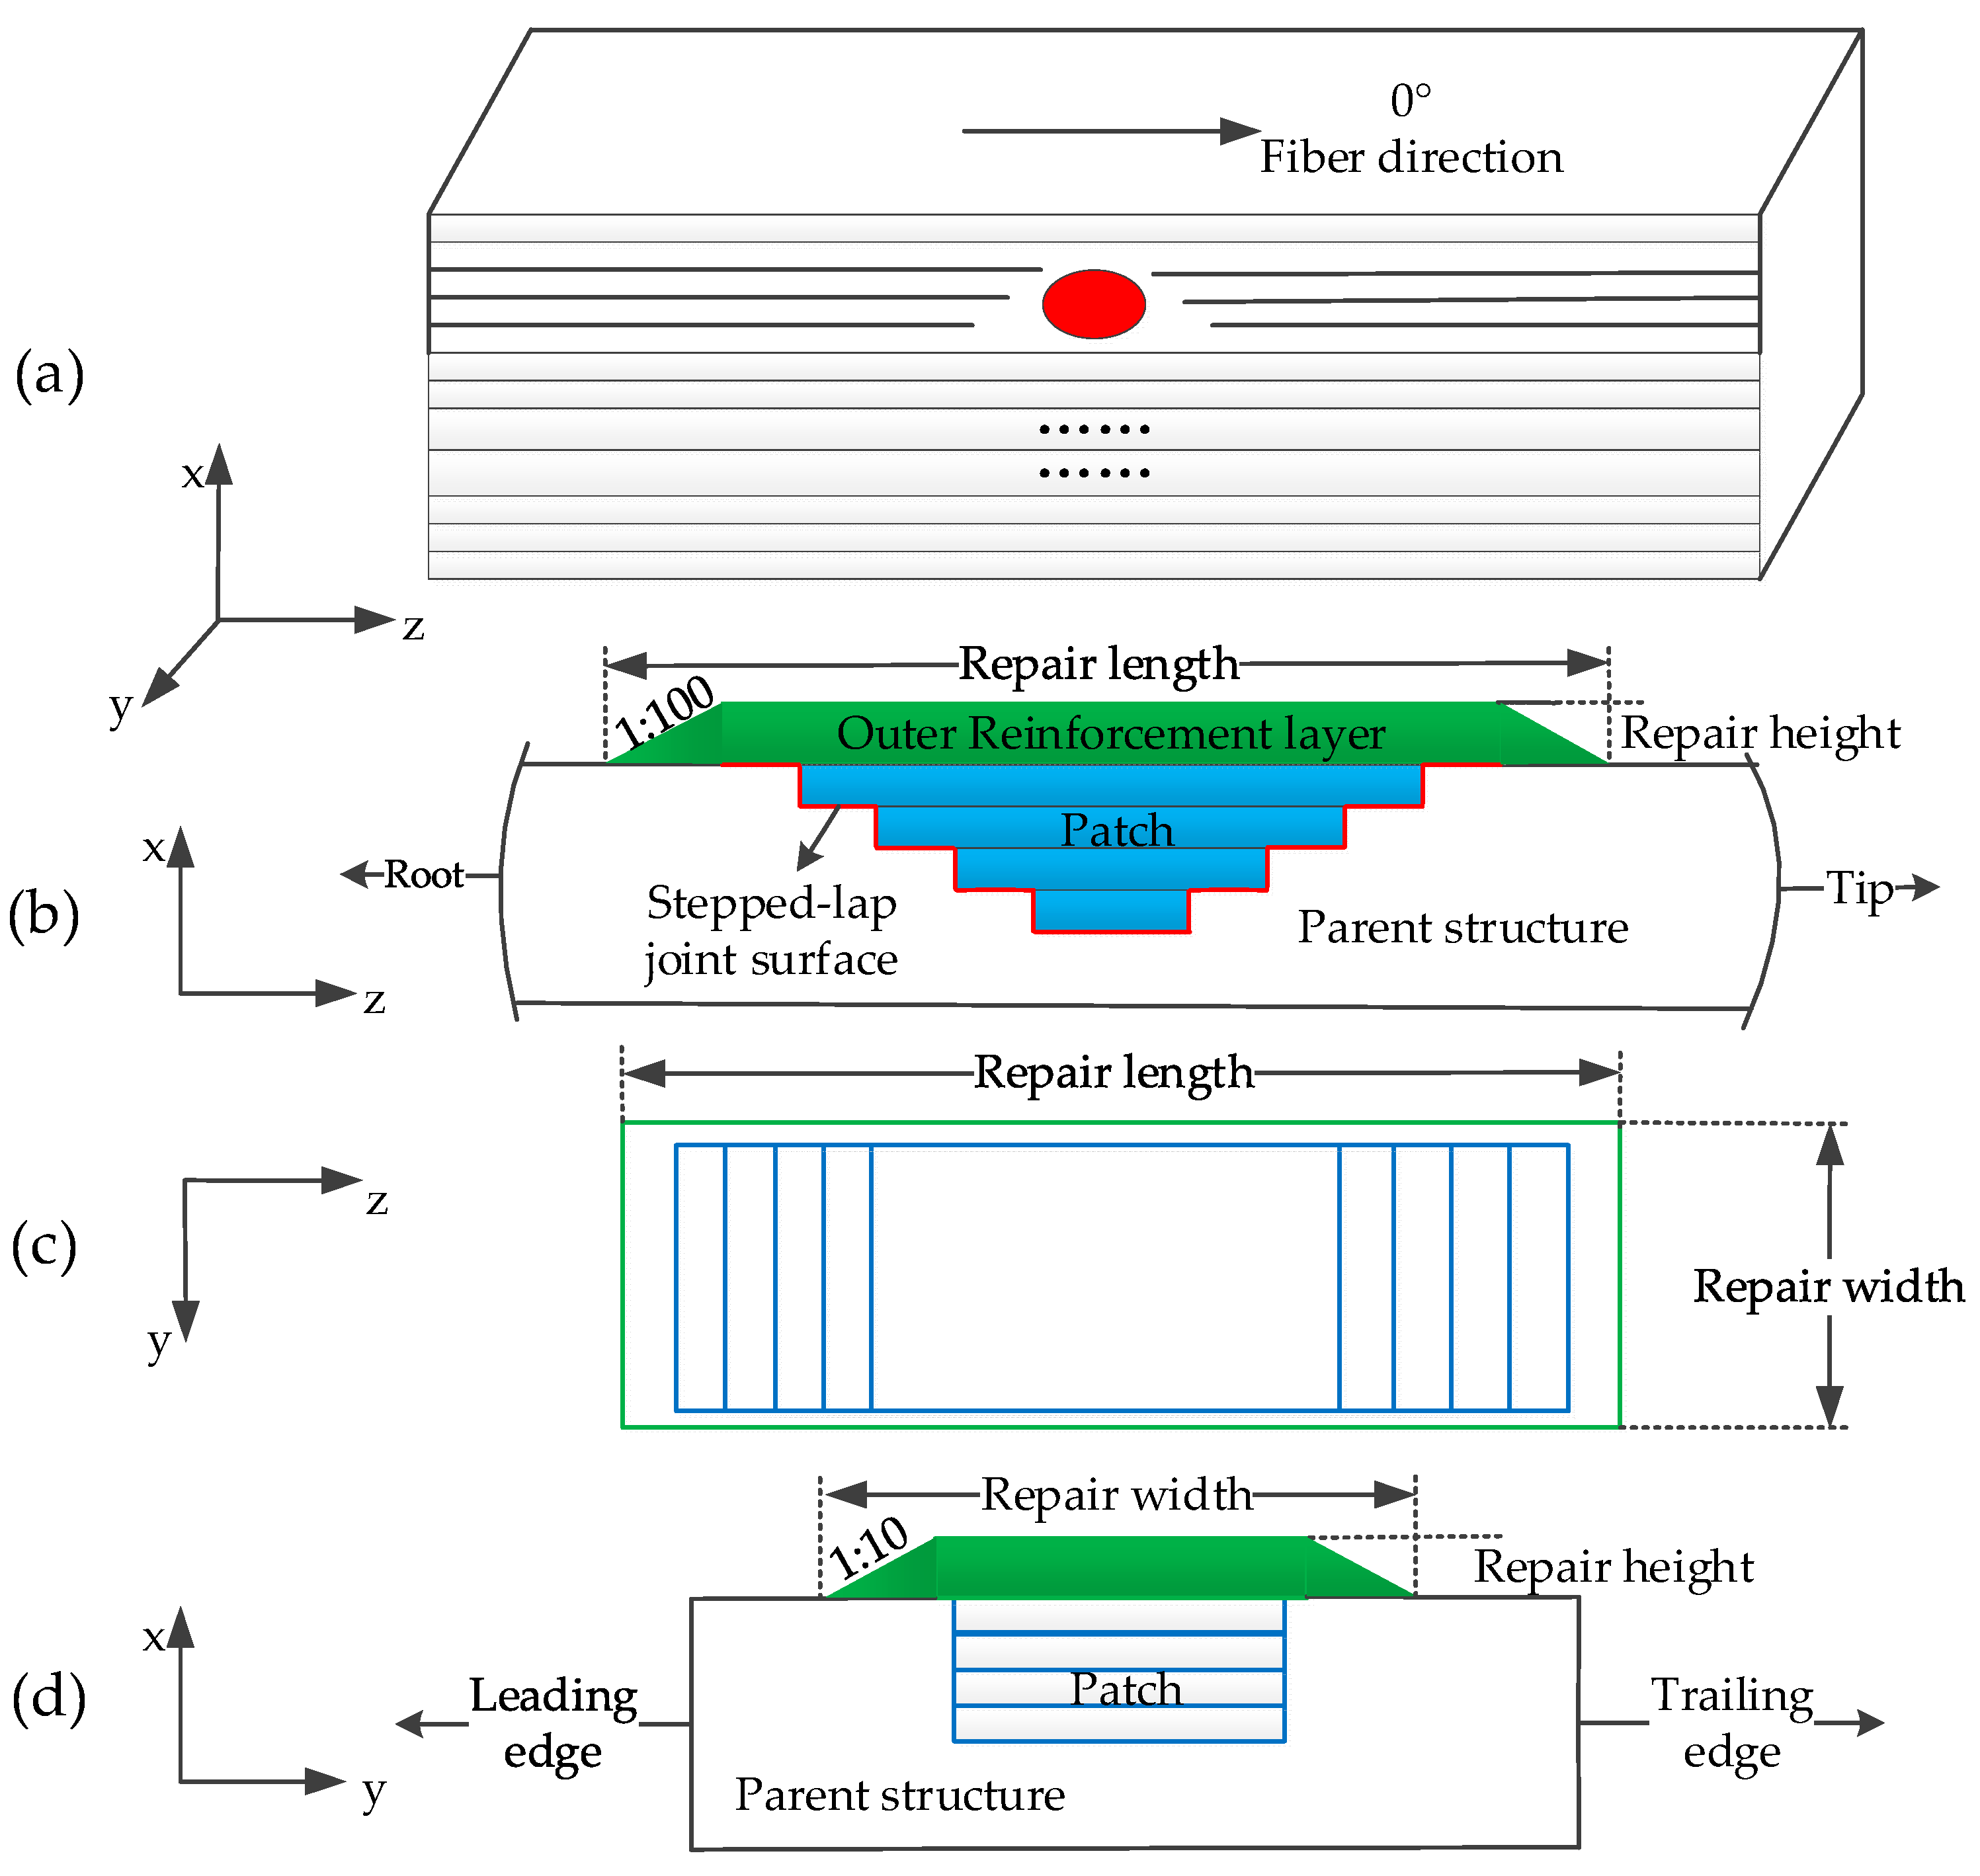
As shown in Figure 2a, the structural damage in the thickness direction of the spar cap is marked by the red symbol, which destroys the continuity of the unidirectional 0° fiber. The front view of Figure 2a shows the stepped-lap scarf repair model [32] (Figure 2b), the parent structure is the undamaged spar cap area, the patch is the repair area indicated in blue, the stepped-lap joint surface is marked in red, and the ORLs are shown in green. The repair length is the total length of the ORLs of the spar cap along the spanwise direction of the blade. In order to ensure the connection performance between the patch and the parent structure, a chamfer of 1:100 along the fiber direction is specified in the international standard for blades [31]. The top view and side view of Figure 2a are respectively used to show the repaired structure (Figure 2c,d); the repair height is the total thickness of the ORLs, and the repair width is the plane width projected along the section arc length from the leading edge to the trailing edge of the blade chord direction, with a chord chamfer of 1:10. The additional ORLs create an additional load transfer path and significantly improve the failure load.
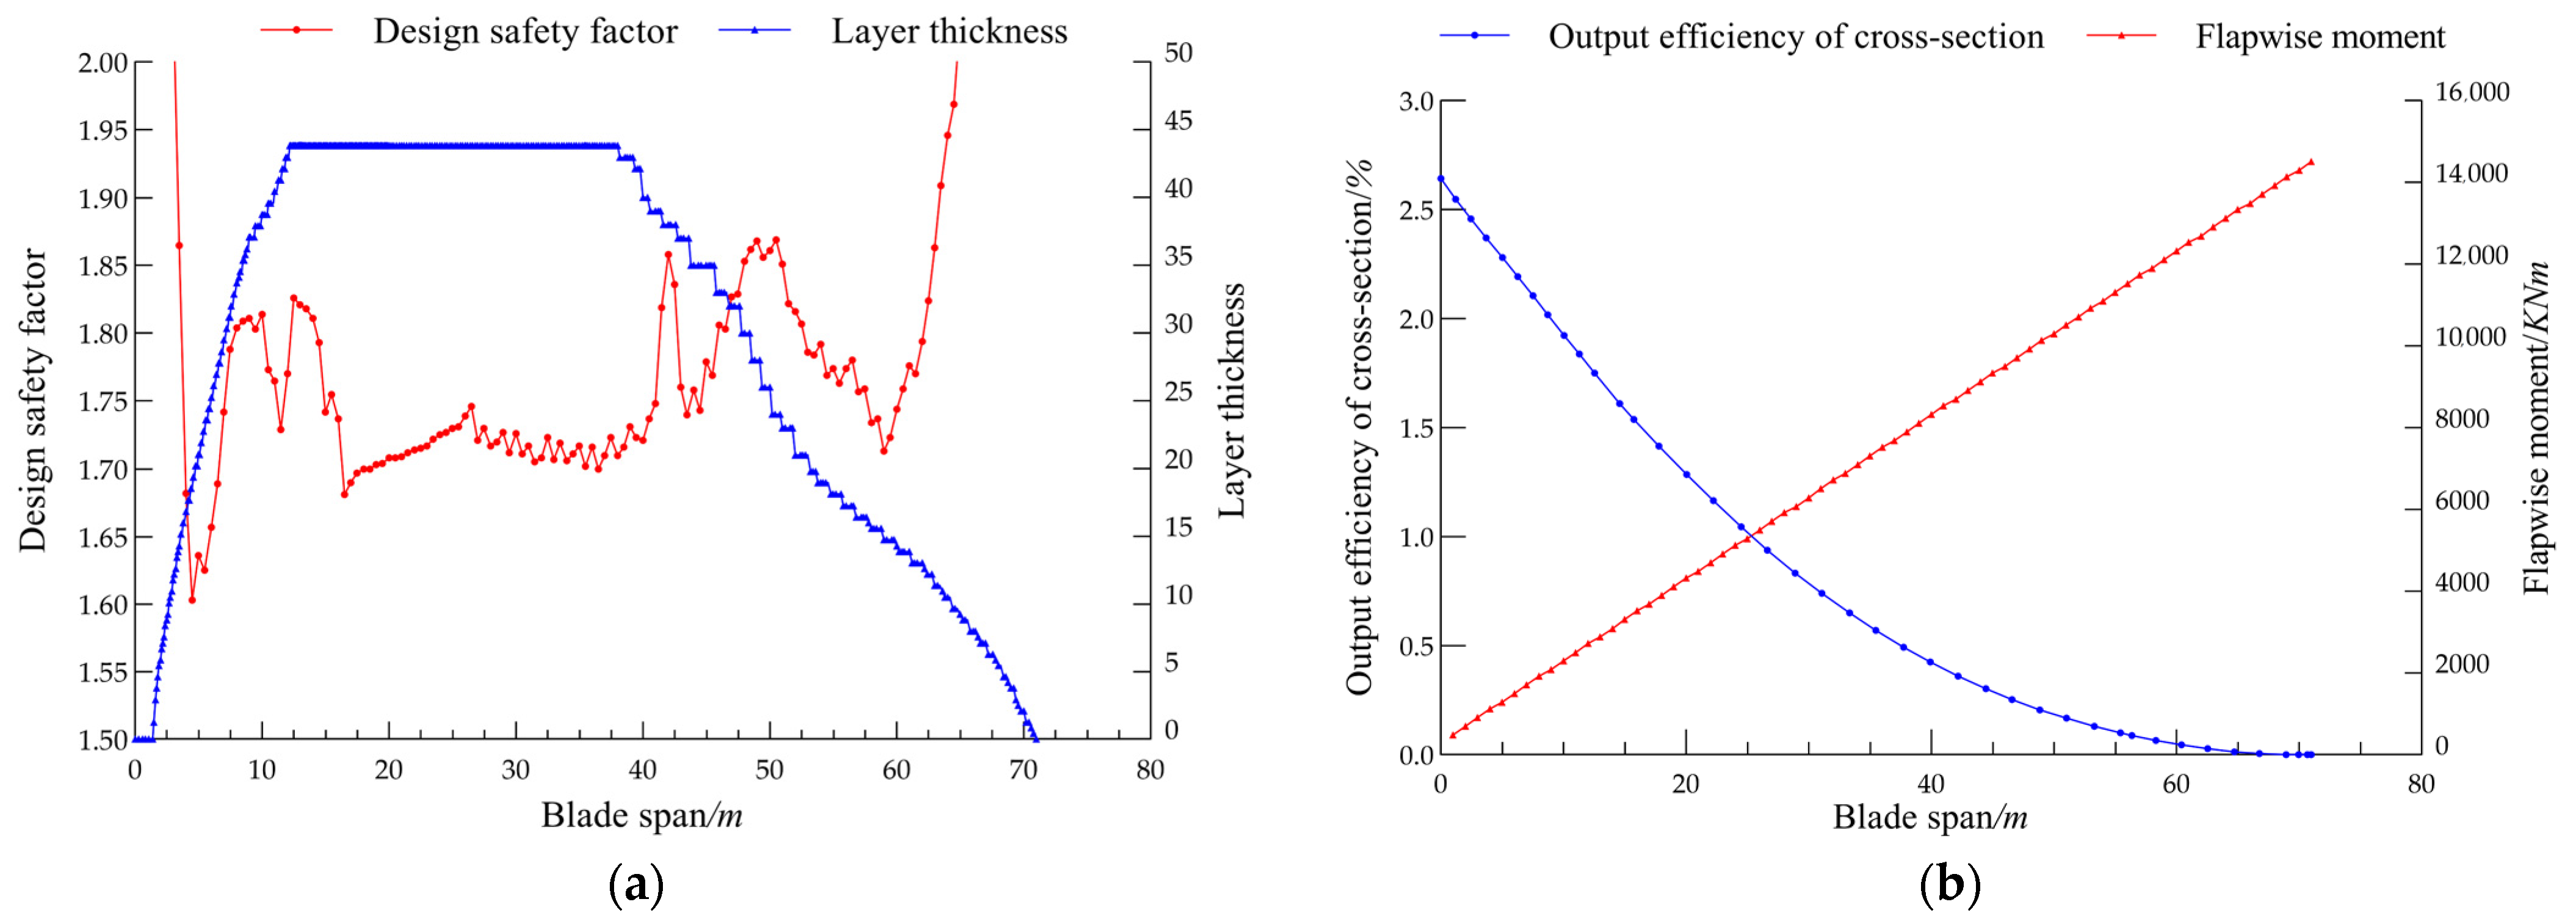
In this paper, a 71 m WT blade (B71 blade for short) was taken as the research object, whose spar cap was designed in the form of equal width and unequal thickness [33,34]. As shown in Figure 3a, the spar cap thickness of the B71 blade increased rapidly from the initial stacking position of the blade root to the maximum thickness at 10 m of the blade, keeping the spar cap stacking thickness constant in a long spanwise range of blade middle section, and gradually decreasing from 40 m to the blade tip section. The minimum design safety factor of the B71 blade spar cap was mainly concentrated in the 30–40 m range; hence, this section was the tradeoff area between the layup thickness and the safety factor of the spar cap. As shown in Figure 3b, the ultimate flapwise moment of the blade presented a cubic spline curve distribution, and the load increased cumulatively from the tip to the root. However, the output efficiency of the blade spanwise section was close to a linear distribution, increasing linearly from the blade root to the blade tip, and a tradeoff area between the blade limit load and aerodynamic power generation efficiency was formed near 30 m in the spanwise direction of the blade. Therefore, in this paper, in order to consider the balance between aerodynamics and load in damage repair, the spar cap repair area of 30–40 m in the spanwise was chosen to analyze the influence of the repair design of the ORLs on blade structure and aerodynamic characteristics.

2.3. Structural and Aerodynamic Repair Models

The spar cap length of the B71 blade was close to the blade length, and the width and thickness of the spar cap were 500 mm and 45 mm, respectively. The aerodynamic shape of the 30–40 m section was based on the DU300 airfoil. In this paper, the width of the spar cap was reduced 10-fold, and the parent structure (10-layer UD) with an aspect ratio of 5:1 was selected to simulate the structural repair analysis model of the spar cap (Table 1). Among them, the repair width of the ORLs was defined as the percentage of the center line of the spar cap projected to the chord length along the leading edge and the trailing edge, the repair height was the product of the number of repair layering layers and the thickness of the single layer, and the repair length was measured from the tip to the root of the blade.
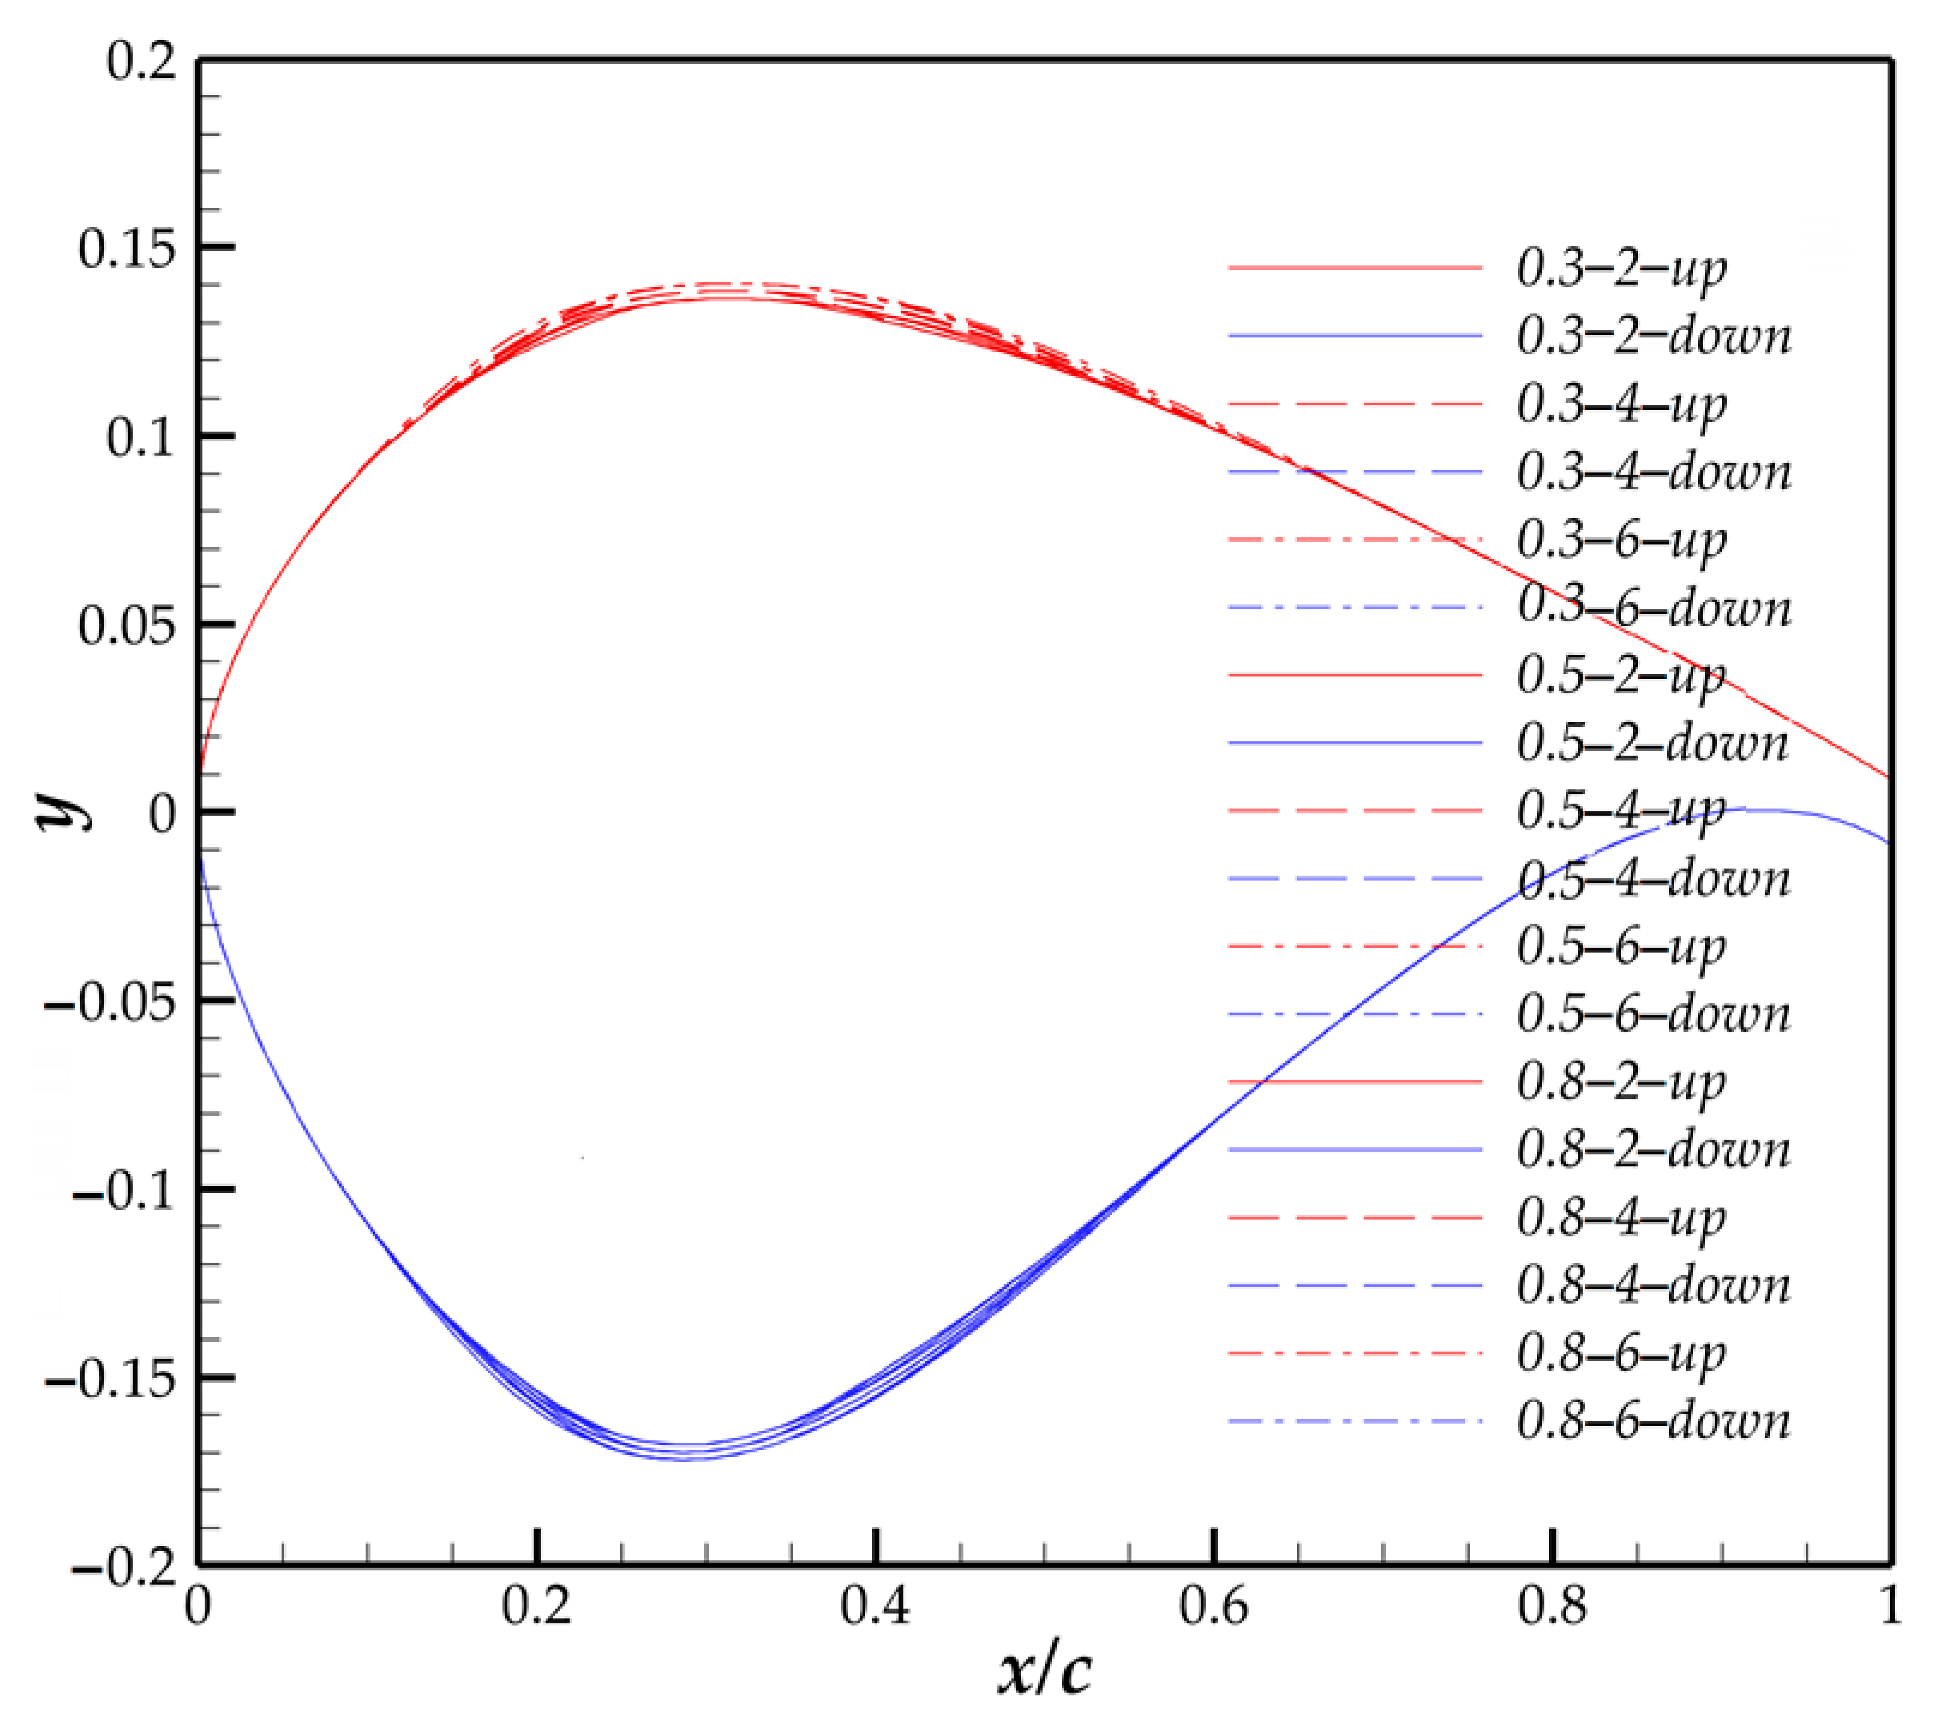
This paper designed a structural repair model of 27 unidirectional laminates (Table 1) with a repair width of 30%, 50%, and 80%, a repair height of 2 mm, 4 mm, and 6 mm, and a repair length of 90 mm, 145 mm, and 200 mm, along with nine 2D aerodynamic repair models of DU300 airfoils (Table 2). All repair analysis models were denoted as repair width-repair height-repair length-up/down.
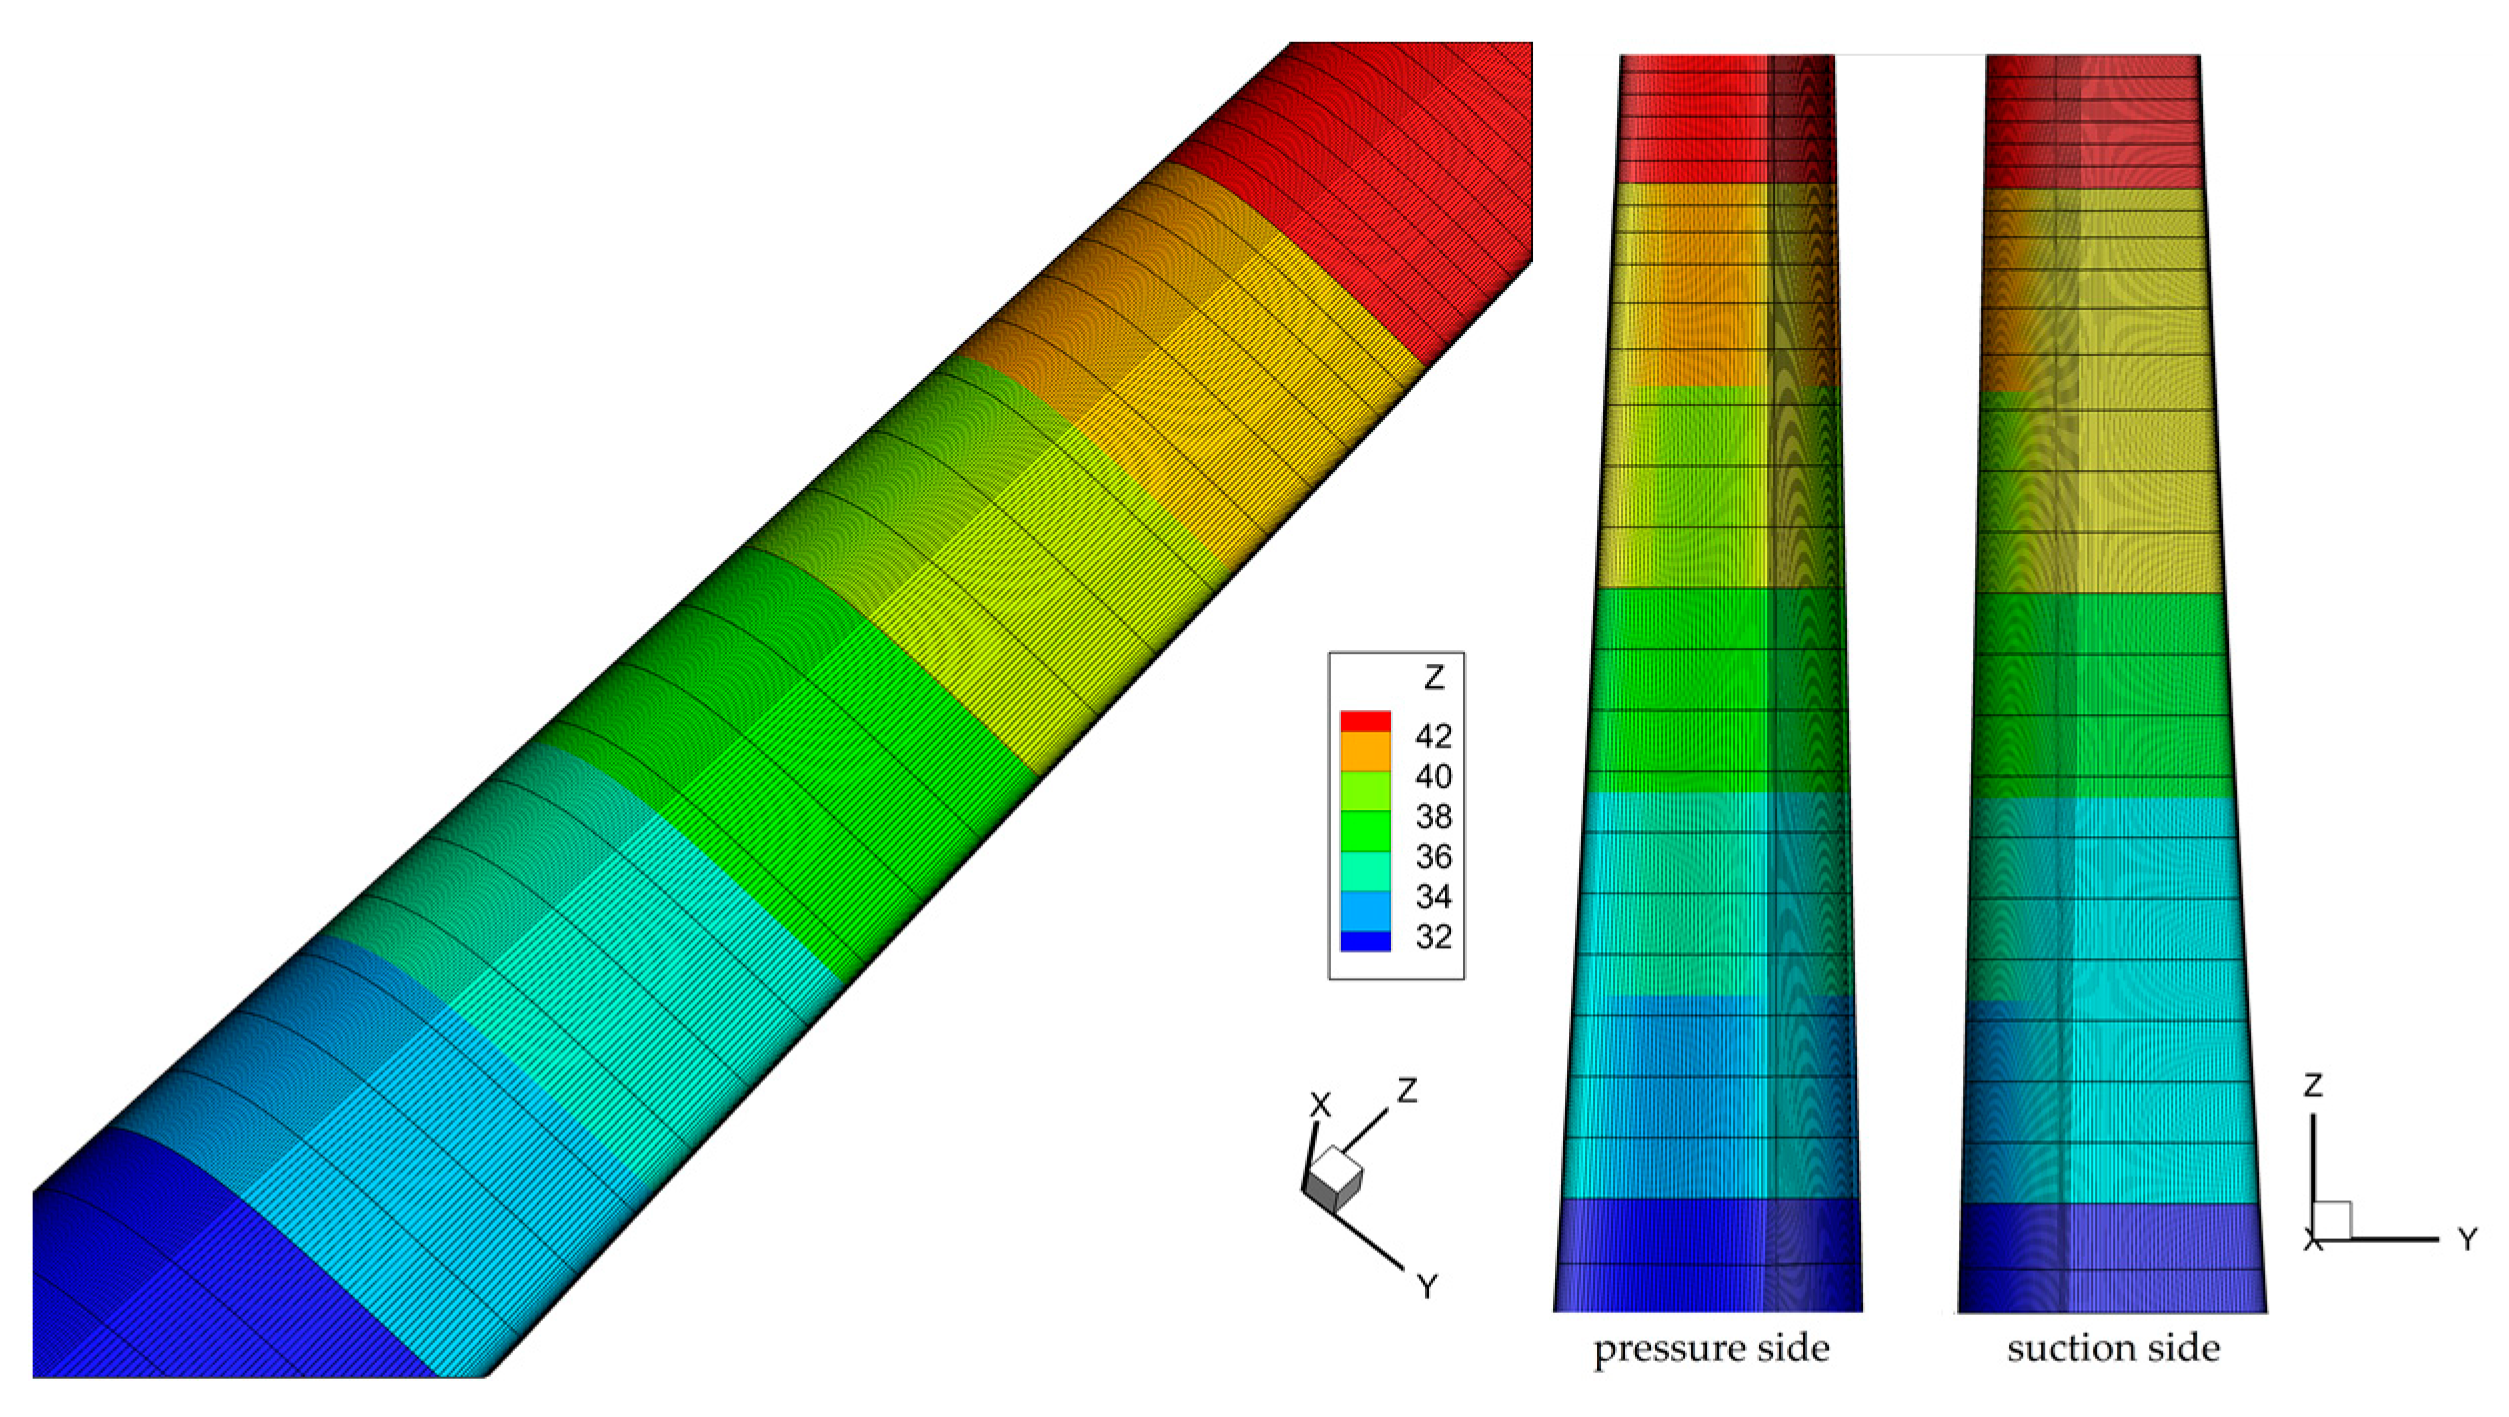
In the full-size 3D blade, the starting and ending positions of the ORLs were chamfered along the spanwise and chord directions, respectively. The ORLs were laid on both the SS and the PS spar cap. As shown in Figure 4, the 3D blade shape of the repaired spar cap with a length of 10 m had a small deviation from the original shape.

3. Validation of the Repair Analysis Model

3.1. Verification of Structural Repair Model

In this section, a 3D finite element structural analysis model for repairing the damage of the unidirectional laminate of the spar cap was established. Using Fortran language, a VUMAT subroutine was written to predict the failure of the repair structure. A continuous-damage mechanics model (CDM) was used to describe the failure process of the parent structure and the patch, and the in-plane damage of the parent structure and the patch was predicted according to the 3D Hashin [35] criterion. Meanwhile, a cohesive zone model (CZM) model [36,37] was applied to introduce damage state variables into continuous damage mechanics.
The bilinear CZM model [38] shown in Figure 5 was used to simulate the damage of the stepped-lap joint surface. The constitutive equation of the stepped-lap joint surface described the mechanical relationship between the traction force σ and the relative displacement of the interface separation δ , and defined that the energy consumed by crack growth was equal to the fracture toughness of the crack tip G C . In this paper, on the basis of the bilinear CZM model, a cohesive element with 0 thickness was used to predict the damage evolution of the stepped-lap joint surface.
When the cohesive element is not damaged, its linear elastic constitutive relation is as follows:
t = d i a g K n n   , K s s   , K t t δ ,
where K n n , K s s , and K t t are the normal tensile stiffness, in-plane shear stiffness, and out-of-plane shear stiffness, respectively, and δ is the opening displacement. When cohesive element damages begin to occur, the constitutive relation changes into
t = 1 D d i a g K n n   , K s s   , K t t δ ,
where D is the damage factor, with a range of [0, 1]. When D = 0, it means the material is intact without damage. When D = 1, it indicates that the stiffness of the material has degraded to zero.
The initial damage of the stepped-lap joint surface was determined as a function of the quadratic nominal stress criterion [39], which comprehensively considers the interaction among various modes:
< t n > t n 0 2 + t s t s 0 2 + t t t t 0 2 = 1 ,
where t n is the normal stress, t s and t t are shear stresses, t n 0 , t s 0 ,   and   t t 0 are the normal strength and the two-shear strength of the stepped-lap joint surface, respectively. The < > symbol denotes the Macaulay bracket.
< t n > = t n       t n > 0 0         t n 0 .
The Benzeggagh-Kenane [40] energy release rate criterion was adopted for damage evolution and failure of the stepped-lap joint surface:
G C = G I C + G I I C G I C G I I G I + G I I η ,
where G I C   and   G I I C are the critical strain energy release rate of mode I and mode II, respectively, and η is the ratio index of mixed modes; for a glass epoxy resin-based unidirectional laminate, η = 2–3.
An analytical model of the unidirectional laminate repair structure was established using Abaqus in this paper (Figure 6). Its geometry, material, layer, and load were identical to the test samples in Section 4 of [15]. Eight-node linear hexahedral elements (C3D8R) were used in the parent structure and patch of the structural analysis model, and eight-node zero-thickness elements (COH3D8) were selected for the stepped-lap joint surface, with a total of 5565 elements. The mesh sensitivity was checked to verify the mesh independence response. The left end of the model was fixed, and the right end was uniformly loaded with 0.5 mm/min displacement load in the z-direction (Figure 7). The parent structure and patch of the repair structure analysis model exhibited orthogonal anisotropy, and the stepped-lap joint surface adopted interface properties. The material properties are shown in Table 3.
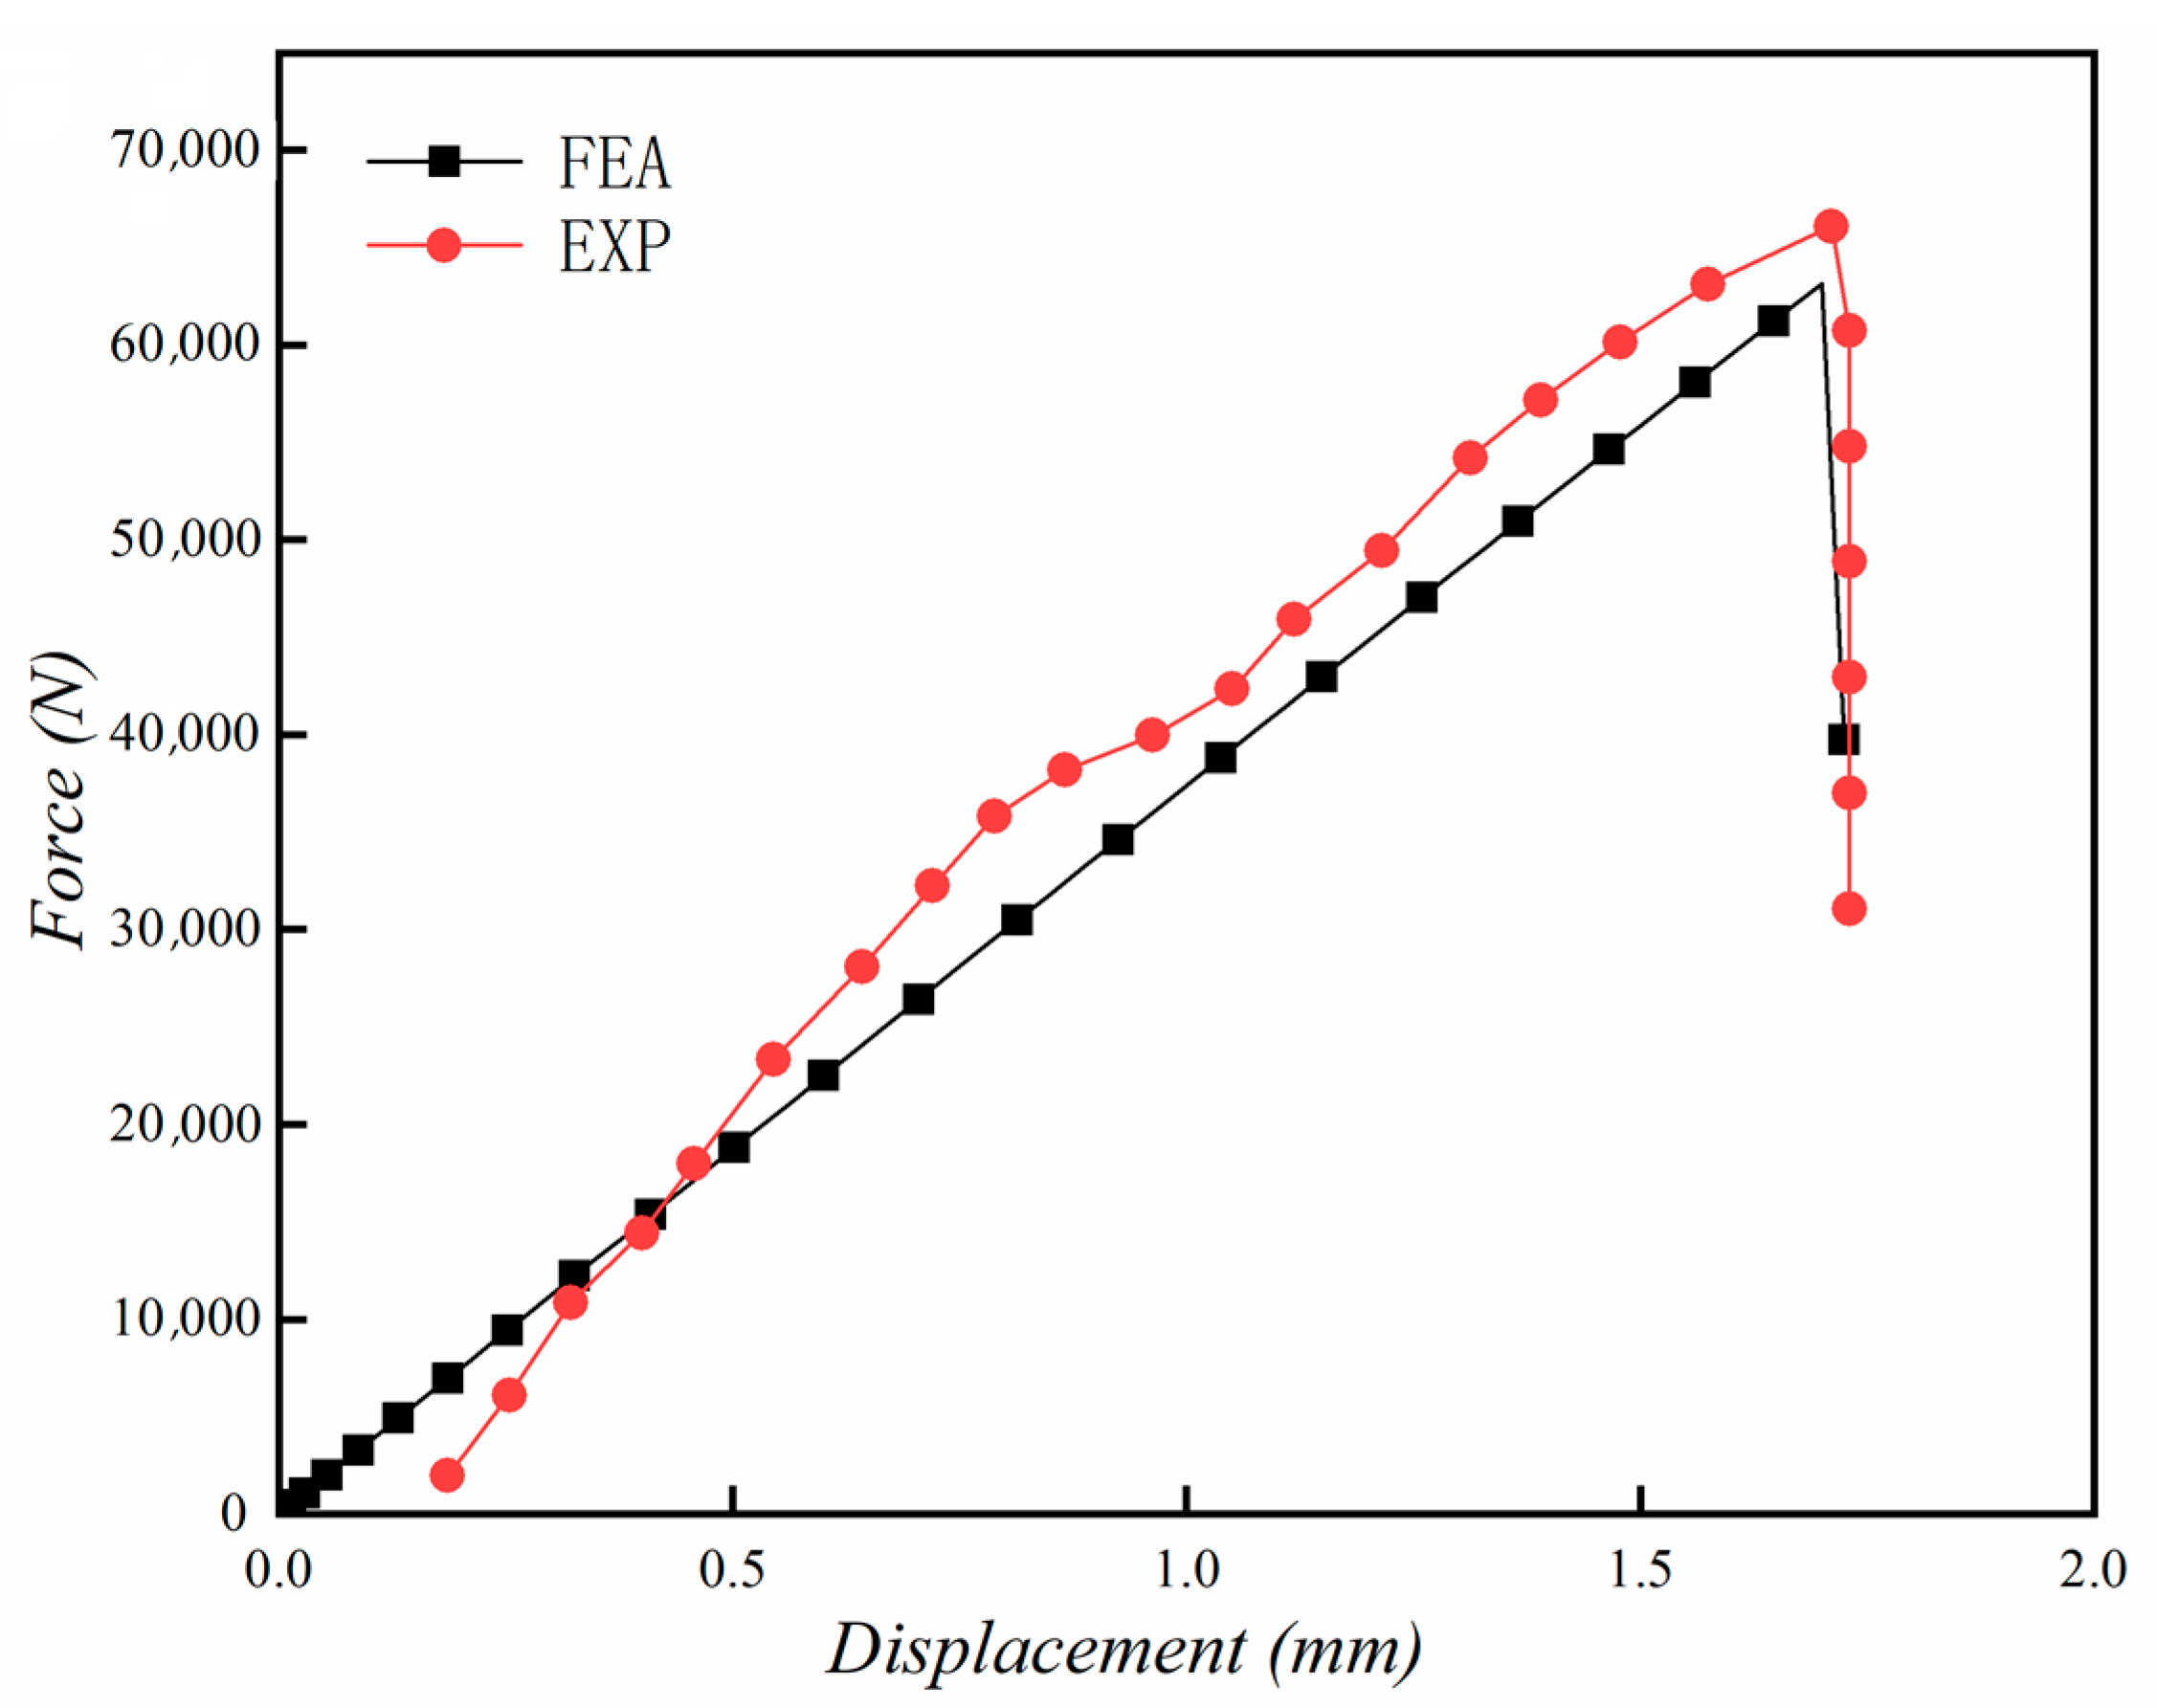
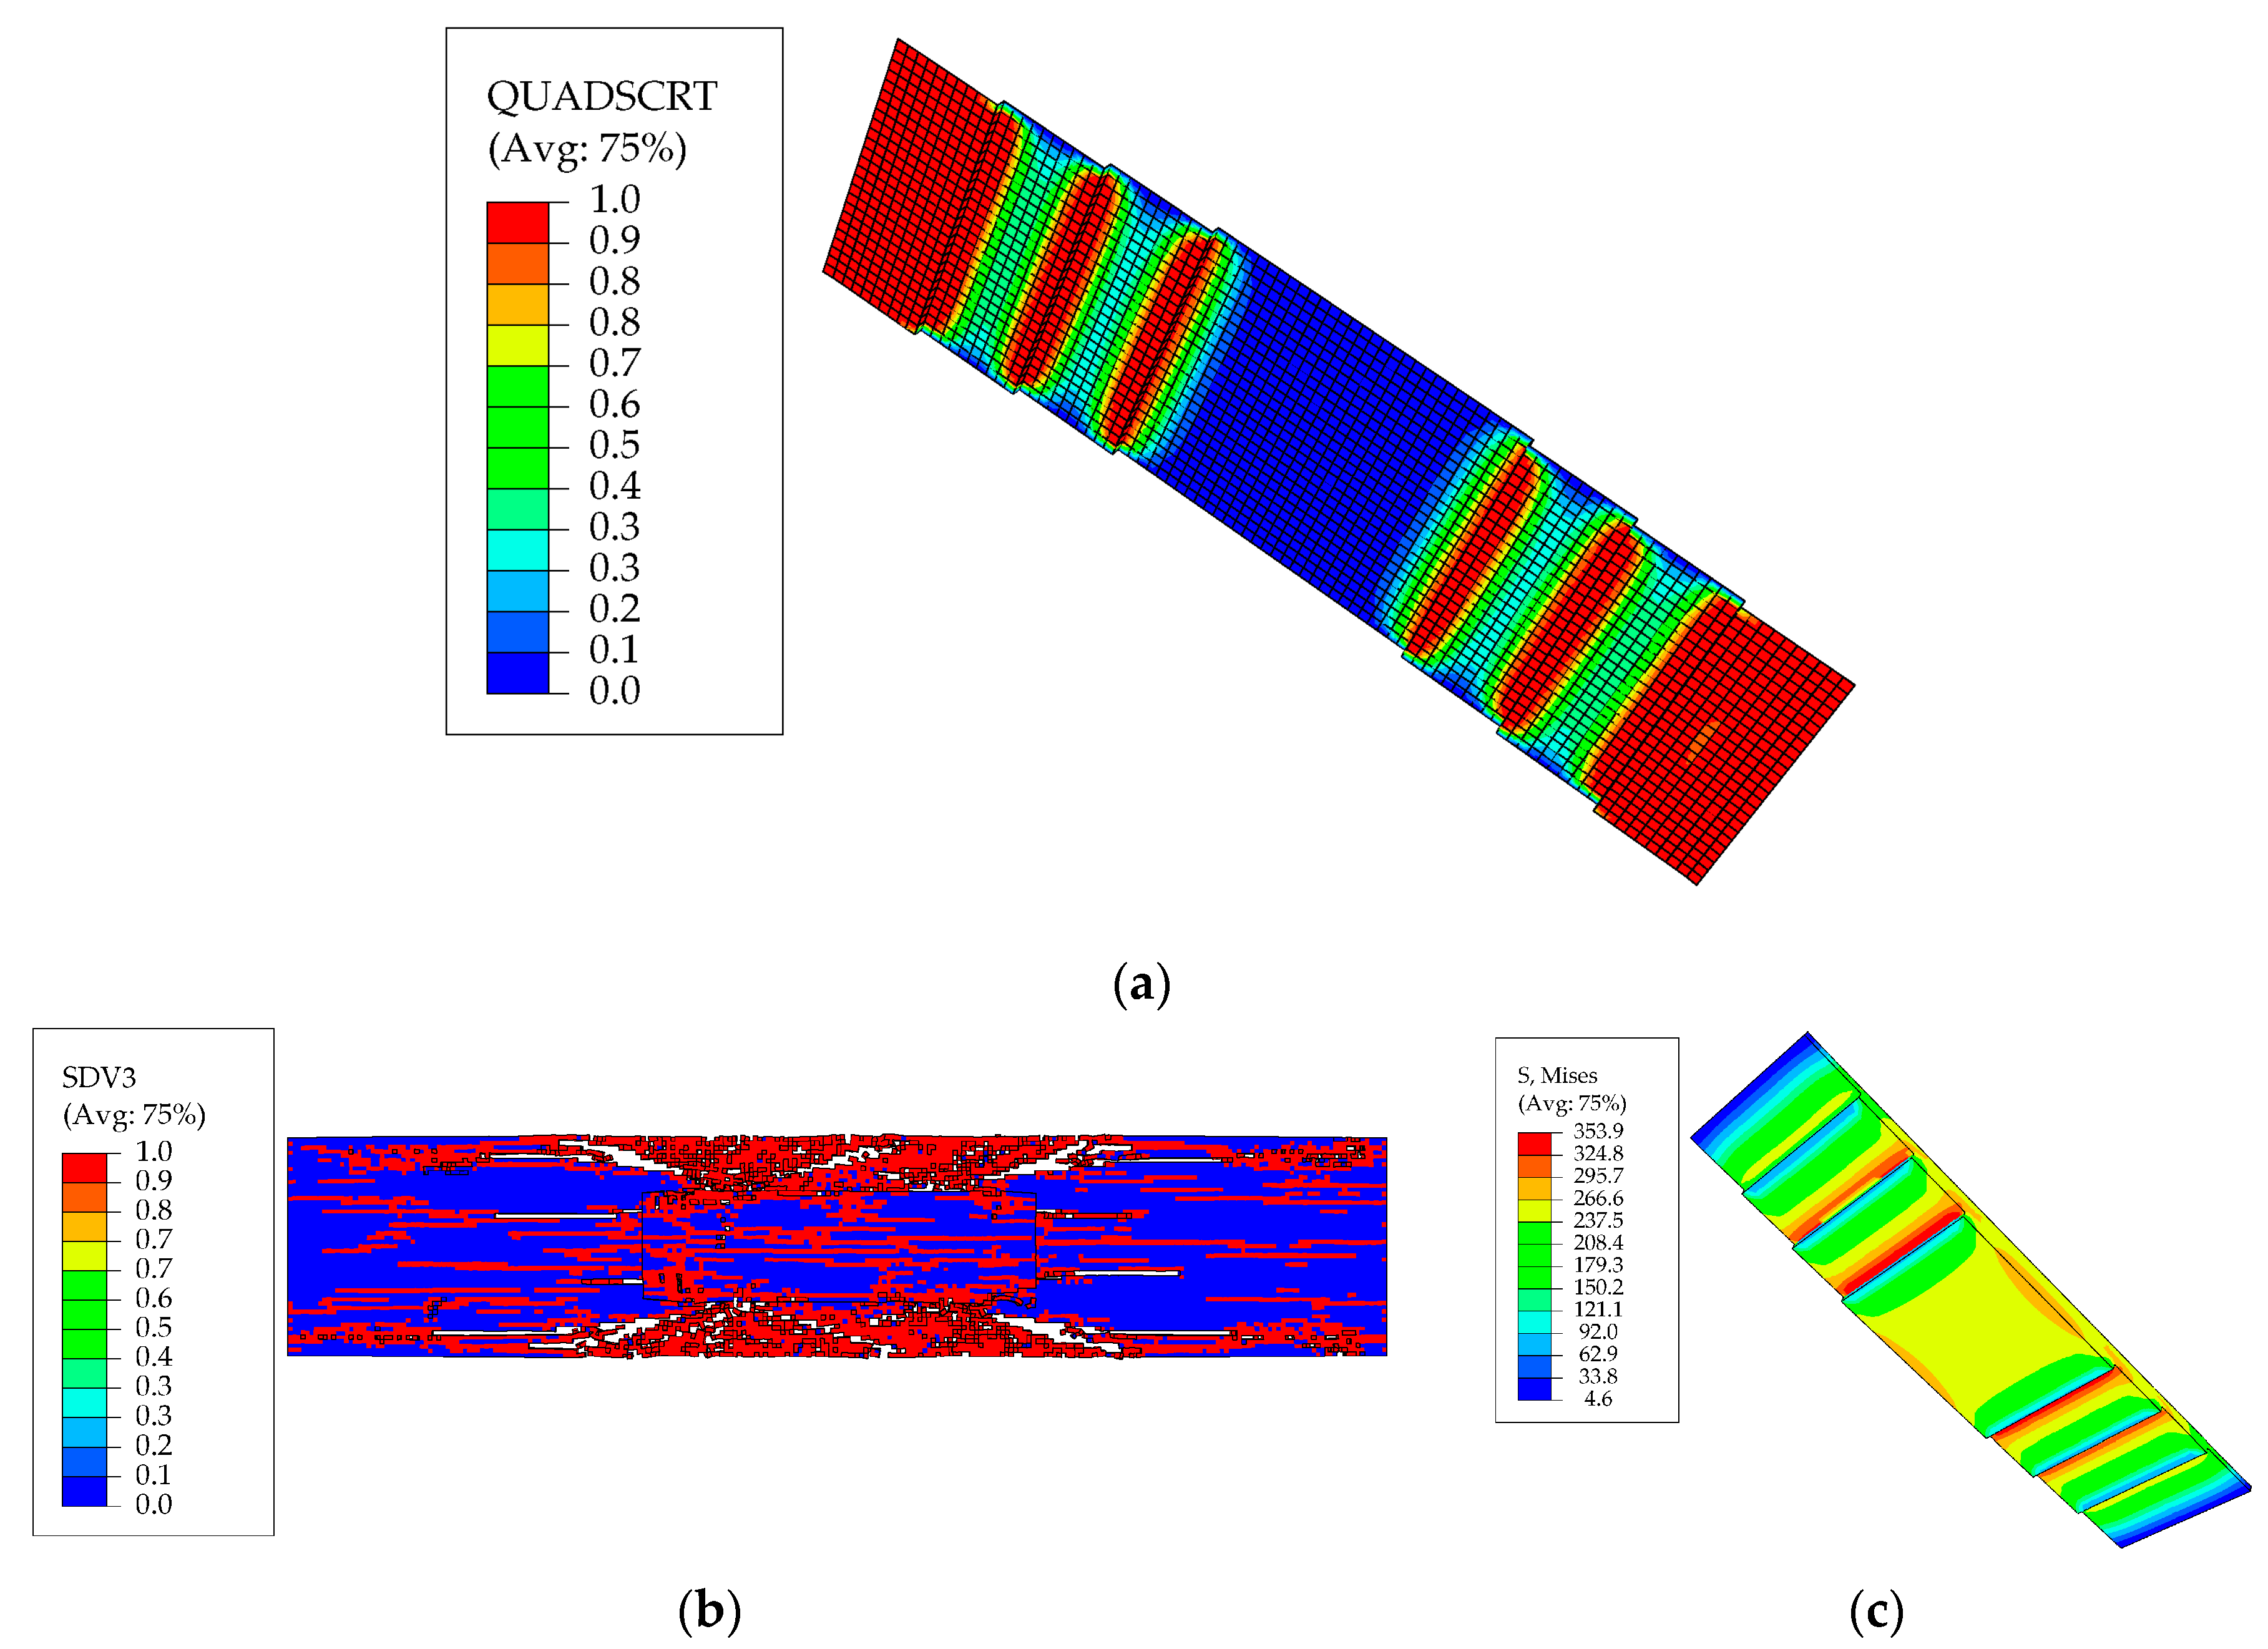
The load–displacement relationship between the numerical simulation and the test is shown in Figure 8. The failure load of structural analysis was 63.1 kN, i.e., 5.5% different from the test result (66.8 kN). When the analysis model of the repaired structure reached the ultimate load of 63.1 kN, the stepped-lap joint surface in Figure 9a completely failed, and the stress concentration at the corner of the stepped-lap joint surface was serious. As shown in Figure 9b, the parent structure was torn apart from the stepped-lap joint surface, and the matrix of the parent structure failed. In Figure 9c, the patch was completely separated from the stepped-lap joint surface, and no obvious damage was observed on the whole structure. This is consistent with the final failure mode (the matrix of parent structure cracking and stepped-lap joint surface separation) studied in the repair model test. Therefore, the failure location, failure mode, and failure load obtained by the numerical simulation of the structural analysis model were basically consistent with the experimental results, verifying the accuracy of the structural analysis model presented in this paper.
Furthermore, Figure 10a–f show the failure factor nephogram of the stepped-lap joint surface extracted from six load steps. As the load continued to increase, the damage from the end of the stepped-lap joint surface gradually expanded along the width direction, and the whole stepped-lap joint surface finally separated. Therefore, the stepped-lap joint surface was considered the key research area of the repair structure.

3.2. Verification of Aerodynamic Repair Model

In order to study the influence of spar cap damage repair on the aerodynamic characteristics, the CFD method was used to obtain the flow details of DU300 airfoil in this section. Compared with the experimental aerodynamic characteristics, the correctness of the aerodynamic analysis model was verified.
The finite volume method was used to discretize the governing equations, and the partial differential equations were transformed into numerically solvable algebraic equations on each grid node. The flow field parameters were stored by grid center format, the pressure term was discretized by the second-order format, the coupling of pressure and velocity was realized by the couple algorithm, the convection term was discretized by the second-order upwind format, and the dissipation term was discretized using central difference discretization format. In the second-order upwind scheme, the values on the elements are calculated using the multidimensional linear reconstruction method, and the values   ϕ f , S O U of the scalars ϕ on the surface f can be calculated as
ϕ f , S O U = ϕ + ϕ · r ,
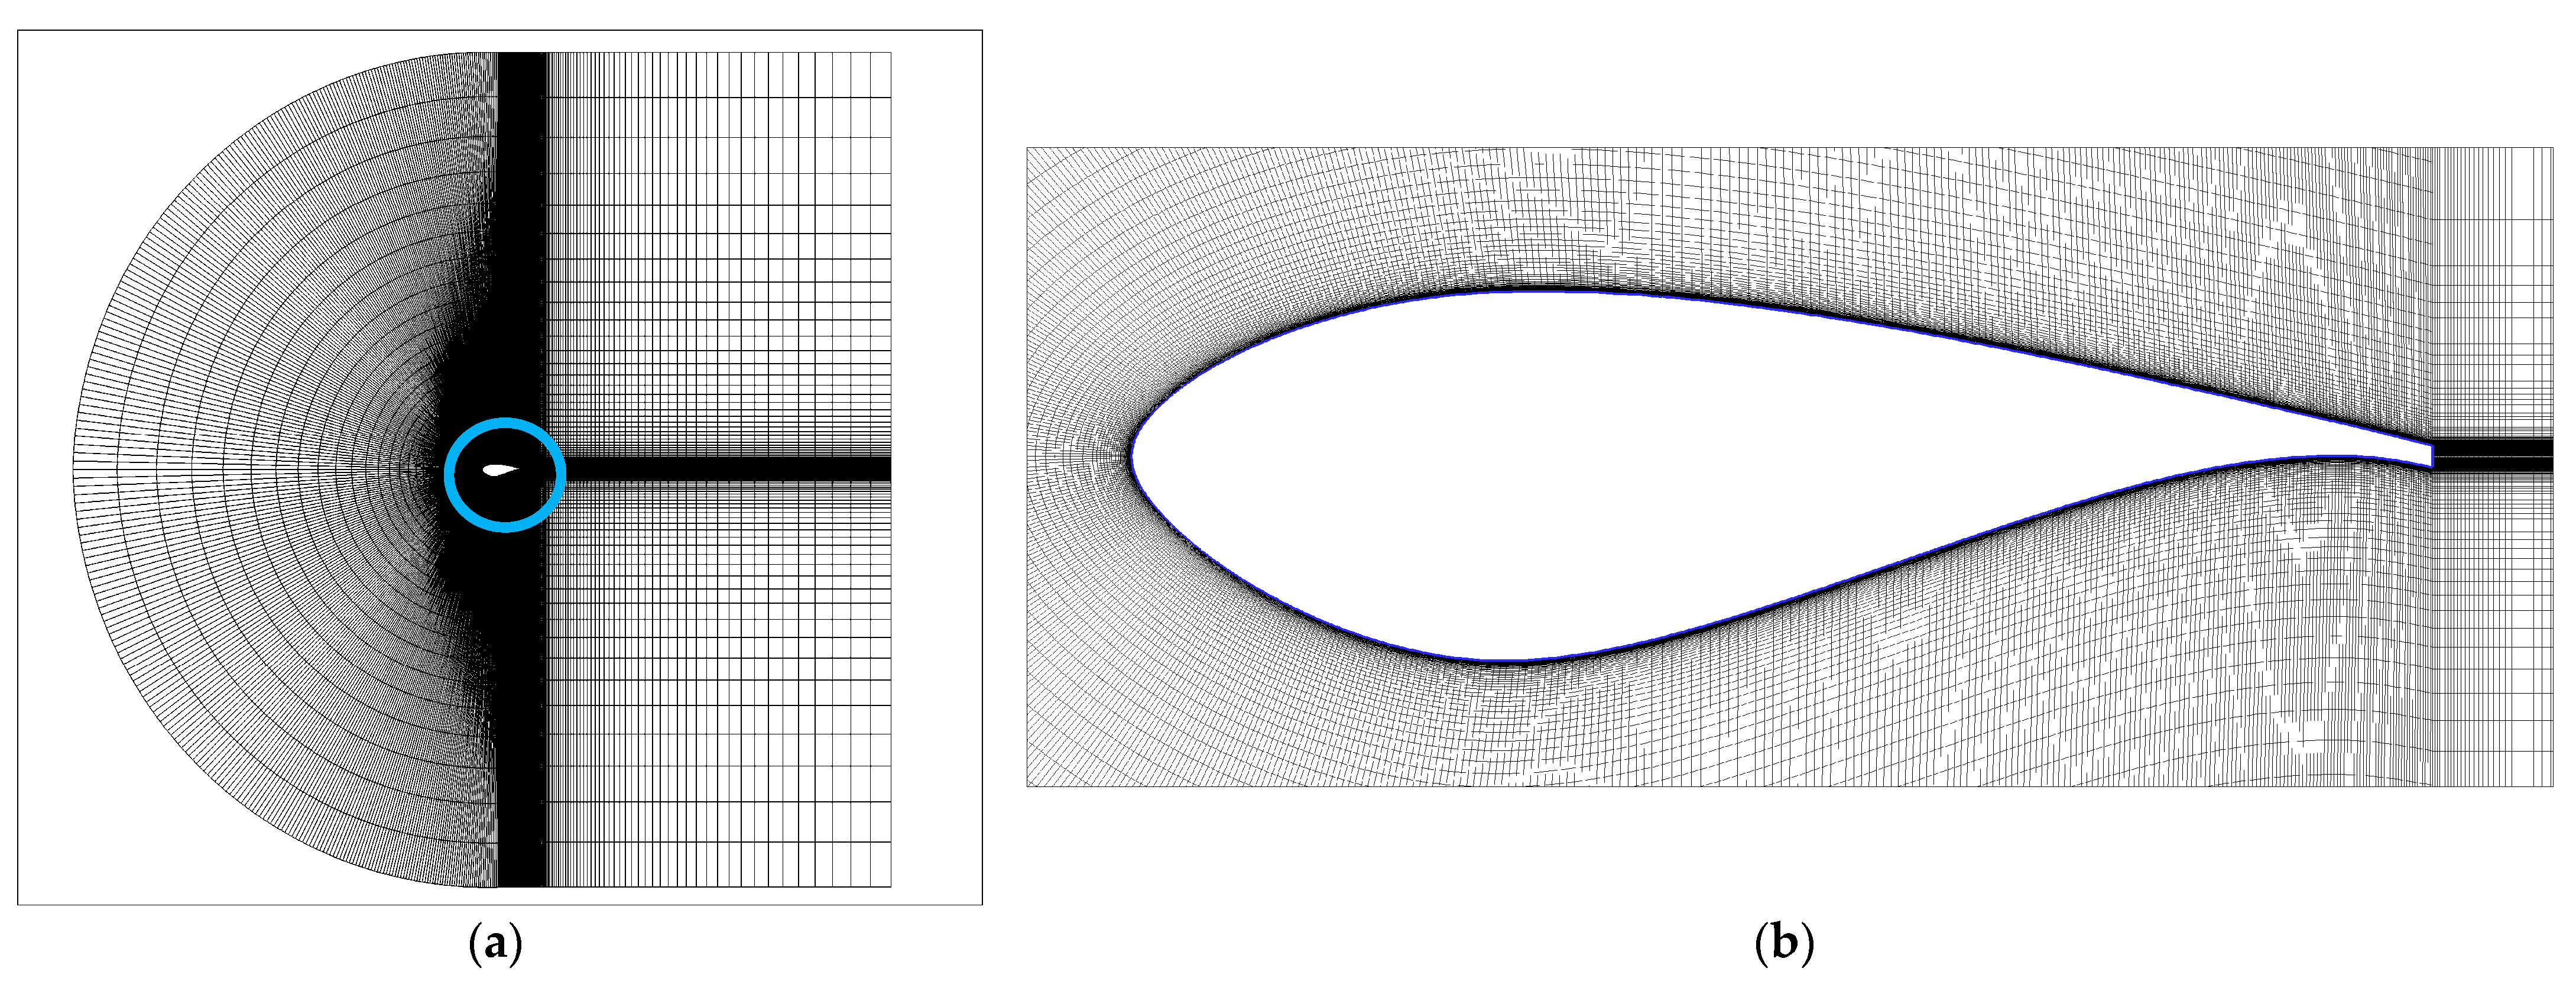
where ϕ is the value at the center of the upstream cell, ϕ is the gradient, and r is the displacement vector at the center of the upstream cell pointing to the center of plane f. The discrete gradient term was realized using the element-based least square method. As shown in Figure 11, DU-300 was a special wind turbine airfoil with a relative thickness of 30%, and the orthogonality between the mesh and the airfoil surface was ensured using a C-type computational grid. In the boundary layer, the thickness of the first layer was 10-5c, and 40 layers of mesh were set along the normal direction with a height growth rate of 1.1. The far field boundary was set 10c away from the airfoil. The front, upper, and lower boundaries of the C-type grid were the velocity inlets, and the rear boundary was the pressure outlet. The number of DU300 grids was 90,000, satisfying the requirements of grid independence.
The conservative unsteady incompressible Reynolds-averaged Navier–Stokes equation was adopted as the governing equation, and the shear stress transport model was adopted as the turbulence model to accurately simulate boundary layer flow and separated flow [41]. On the basis of the γ R e θ transition model [42], many transition mechanisms such as natural transition, crossing transition, and separated flow transition have been considered [43,44]. We used the SIMPLE algorithm to solve the governing equations. The first-order difference scheme was used for the initial pressure and momentum, while the second-order upwind scheme was used for the stabilized pressure; the remaining terms adopted the QUICIK scheme.
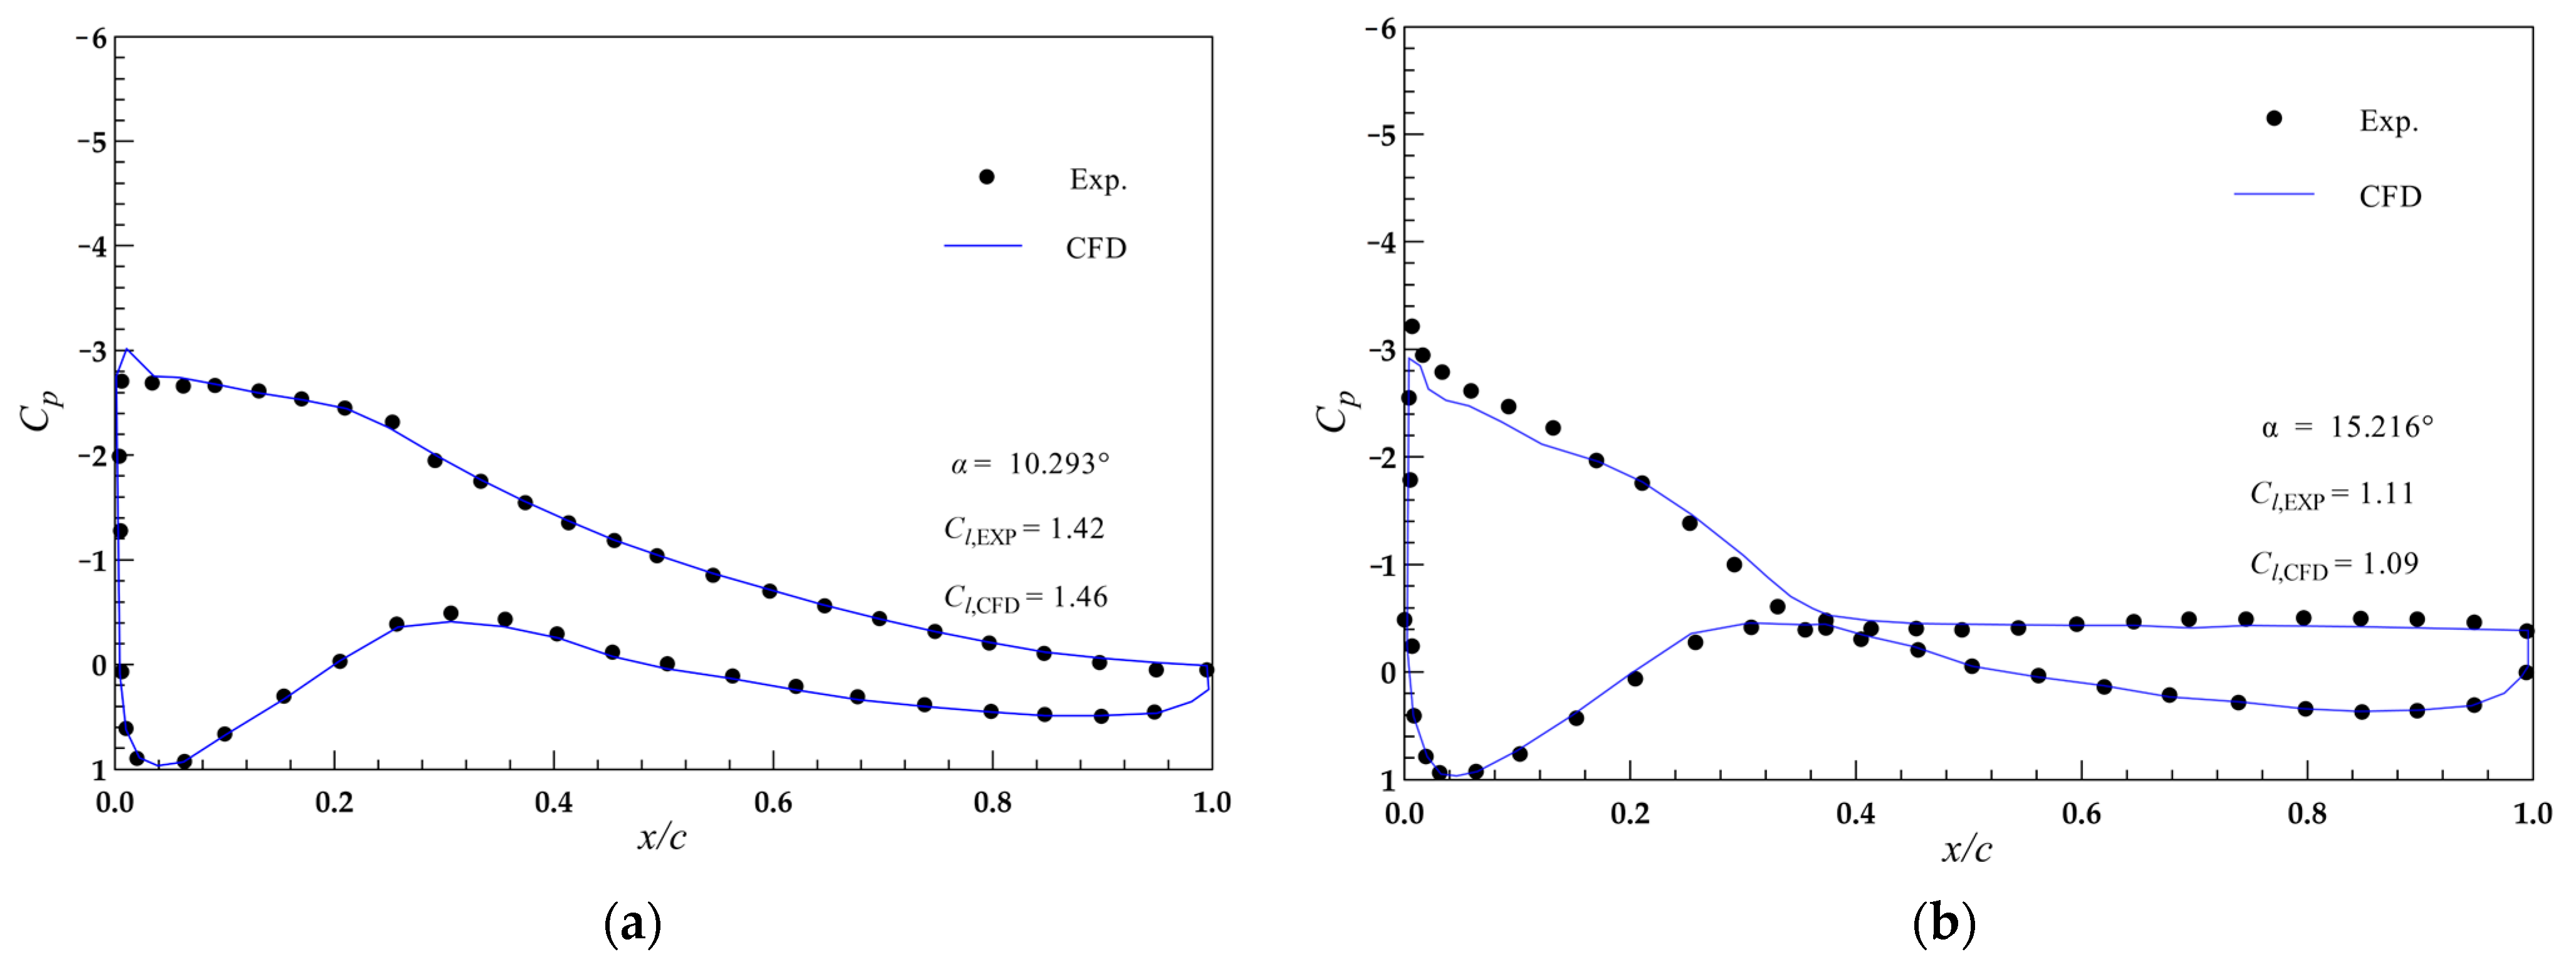
The calculated Reynolds number was set to 2 × 10⁶. The pressure distribution of the DU300 airfoil obtained by numerical simulation is shown in Figure 12. The pressure coefficients for an angle of attack (AOA, α) of 10° and 15° were compared with the test results [45,46,47]; the results show that the lift coefficient and pressure distribution obtained by numerical simulation were in good agreement with the experimental values, and the deviation was within 2% (Figure 13). Consequently, the aerodynamic numerical simulation method could accurately calculate the aerodynamic performance.

4. Influence Analysis of Structural Performance

4.1. Failure Load

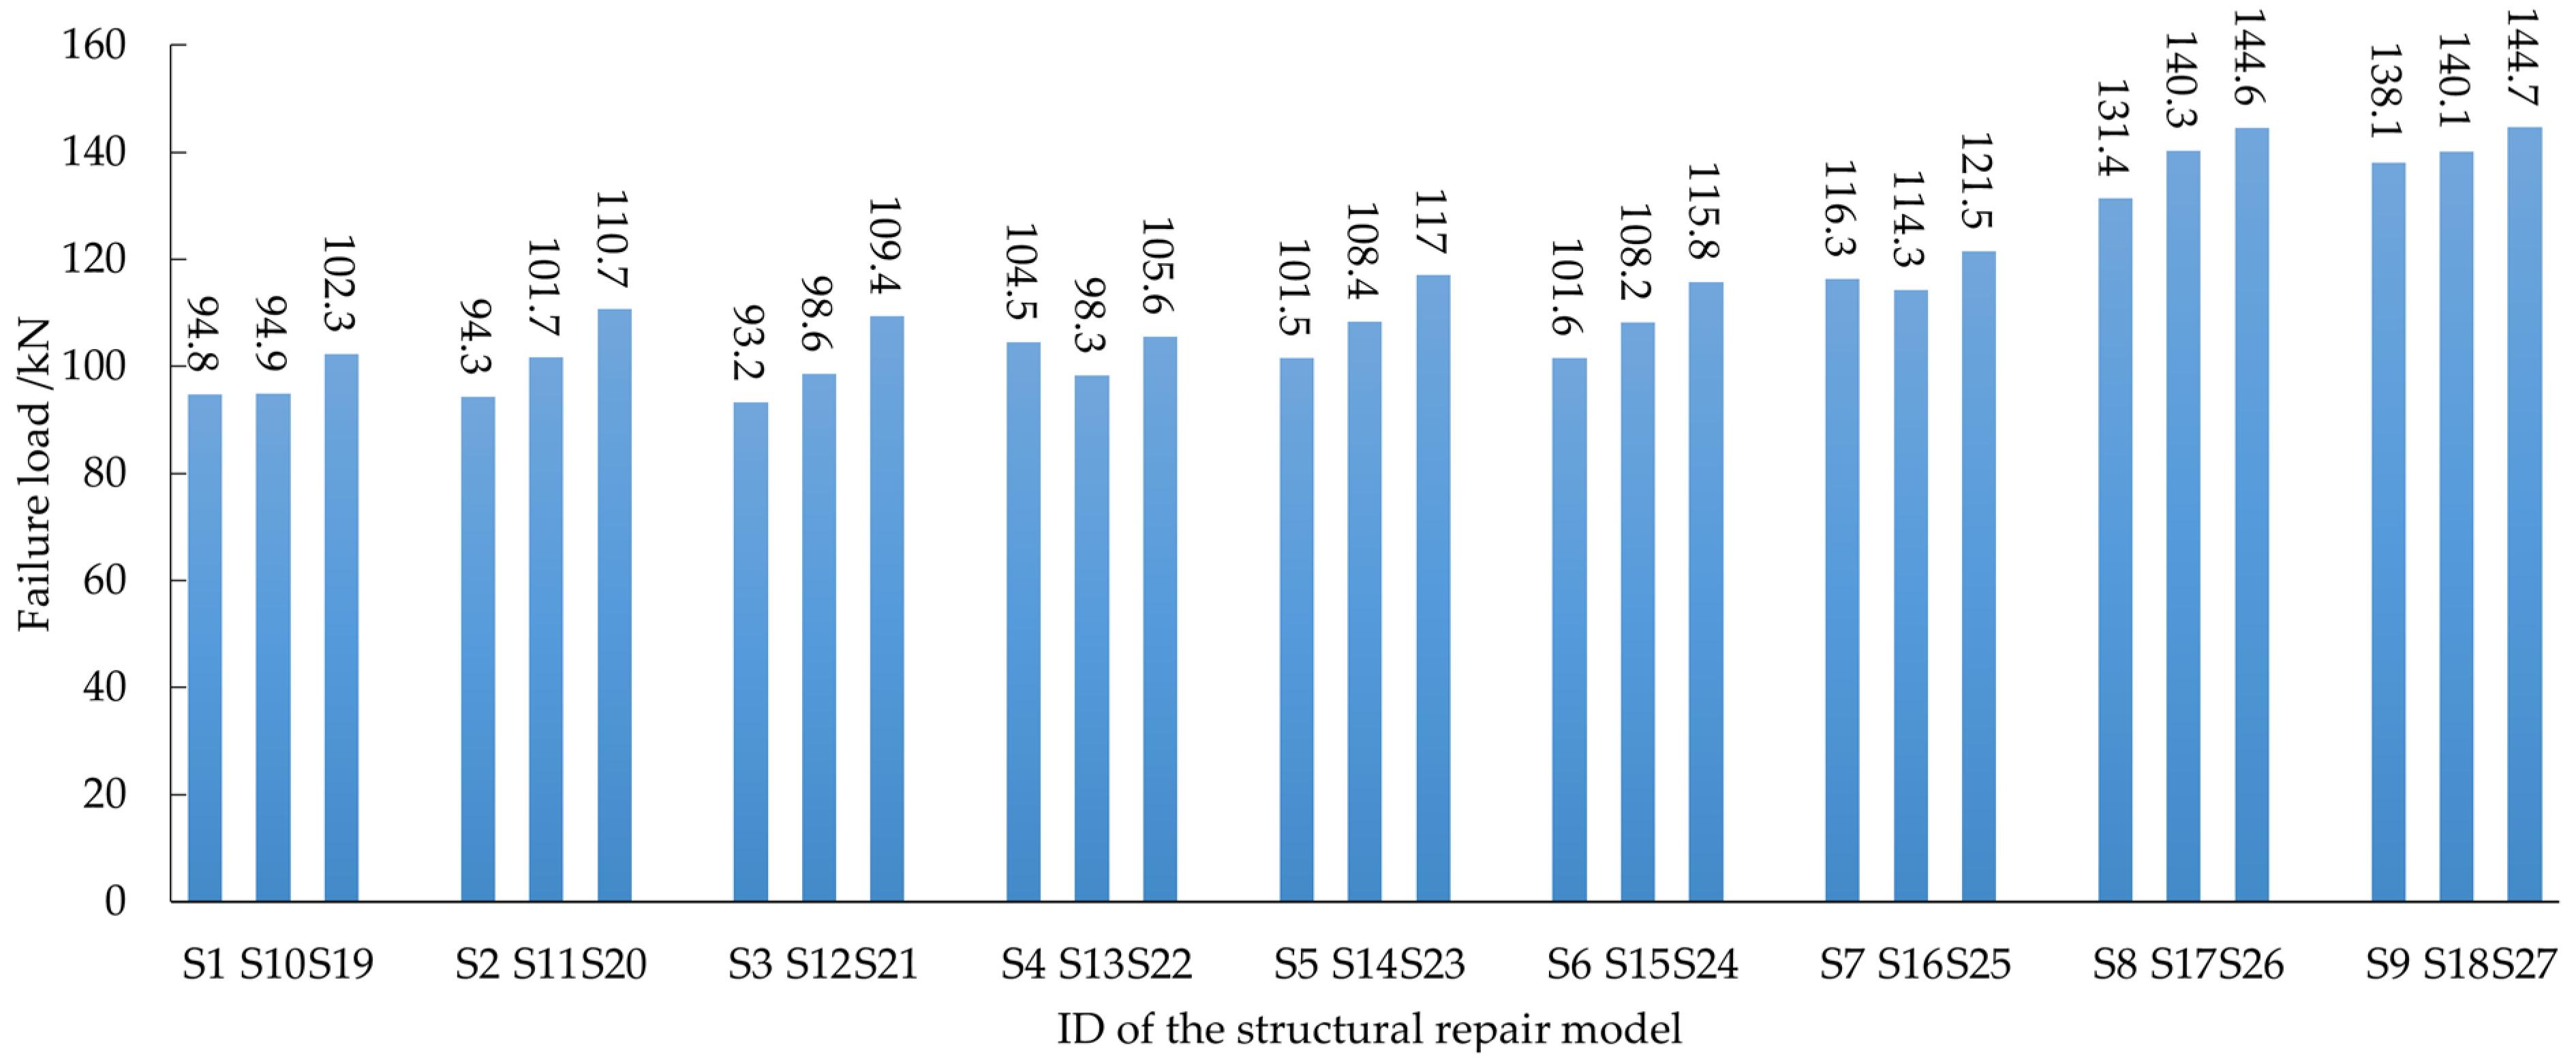
Table 4 shows the failure loads of 27 structural repair models. When the repair length of the structural repair model (S16–S17–S18) changed from 90 mm to 145 mm, the maximum value of failure load increased by 22%; however, when the repair length exceeded 145 mm, the failure load was basically unchanged with the increase in repair width. This could be verified by the adhesive repair theory [48]. With the increase in repair length, the loading capacity of the structural repair model increased; however, until the repair length reached a certain value, the stepped-lap scarf joint surface entered a complete plastic zone. After that, the repair length continued to increase, and the loading capacity of the structure did not improve significantly. Through simulation, it was found that, when the repair length of the ORLs was 145 mm, accounting for 60% of the length of the structural repair model, it was the most suitable. Meanwhile, compared with other structural repair models, the repair height had a significant effect on the failure load. In particular, when the repair height increases from 4 mm to 6 mm, the failure load increased significantly by about 30% with the increase in the repair length and width. The effect of repair width on failure load was relatively stable. When the repair width accounted for more than half of the structural repair model width, the average influence degree on failure load was 7%.

4.2. Influence of Repair Length

In this section, the stepped-lap cohesive area of the structural repair model was taken as the research object, and the interlayer normal stress distribution along the middle line between the repair length and repair width of the cohesive layer marked in red was extracted (Figure 14), so as to study the influence of repairing parameters of the ORLs on the structural repair performance.
As shown in Figure 15a, from the cohesive layer normal stress S33 of nine structural repair models with a repair length of 200 mm, it can be seen that S33 along the repair length was symmetrically distributed in a groove shape, and S33 increased rapidly at both ends of the stepped-lap length, verifying that the shear damage at the end of the stepped-lap surface was the most serious. In the middle region of the repair length, with the increase in repair length, only the width and depth of the elastic groove increased continuously, which did not affect the failure position and interlaminar stress distribution. As shown in Figure 15b, for the curves corresponding to the relationship between limit failure load and displacement of six structural repair models with repair heights of 4 mm and 6 mm and a repair width of 25 mm, the slope before failure was basically the same, and the failure load changed linearly with the increase in repair length. When the repair length increased from 90 mm to 145 mm, the failure load was greatly increased, and the distribution of the failure load–displacement curve tended to be the same when the repair length was 145 mm and 200 mm. Therefore, the repair length could significantly improve the loading capacity of the structure; however, when it was increased to 60% of the total length of the structural repair model, the repair length had little effect on the failure load.

4.3. Influence of Repair Heigth

Compared with Figure 16a, when the repair width and repair length were unchanged, the failure loads of nine structural repair models (S1–S4–S7, S2–S5–S8, and S3–S6–S9) were compared in three groups. With the increase in repair height, the failure load increased gradually, and the loading capacity of the structural repair model increased, but the improvement range was quite different. When the repair area (repair width × repair length) was small, an increase in repair height caused a nearly linear increase in the failure load (the increase was about 11%). When the repair area was large, the repair height increased from 4 mm to 6 mm, which led to a surge of failure load by 29–36%. Taking S5 as the research object, the failure displacement was 1.15 mm when the repair width was 15 mm and the repair length was 145 mm. The cohesive layer normal stress S33 of 0.4 mm, 0.6 mm, 0.8 mm, and 1.0 mm was extracted (Figure 16b). With the increase in displacement loading point, the S33 stress at both ends of the stepped-lap surface increased first and then decreased, reaching the displacement loading point of 1.0 mm, and S33 at both ends dropped sharply. The S33 in the middle of the stepped-lap surface fluctuated greatly with the increase in the loading point, which verifies that the repair stepped-lap surface failed from both ends and expanded along the repair length to the middle area. Therefore, the repair height played an important role in improving the loading capacity of the structure, especially when the repair area was large; the repair height caused the local stiffness of the bonded parts of the ORLs to increase significantly, and it greatly increased the failure load of the structural repair model.

4.4. Influence of Repair Width

Grouped by the repair width, the failure load distribution of the corresponding nine groups of structural repair models is shown in Figure 17. With the increase in repair width, the failure load fluctuation range of each structural repair model was small. This is because the repair width was mainly distributed along the chord of the blade profile, i.e., perpendicular to the fiber 0° direction, while the blade spar cap was stacked with the 0° unidirectional layer. Increasing the layup width in the vertical fiber direction led to limited improvement in the loading capacity of the blade spar cap. Therefore, the repair width had no significant improvement effect on the loading capacity of the structural repair model.

5. Influence Analysis of Aerodynamic Performance

5.1. Lift and Drag Performance

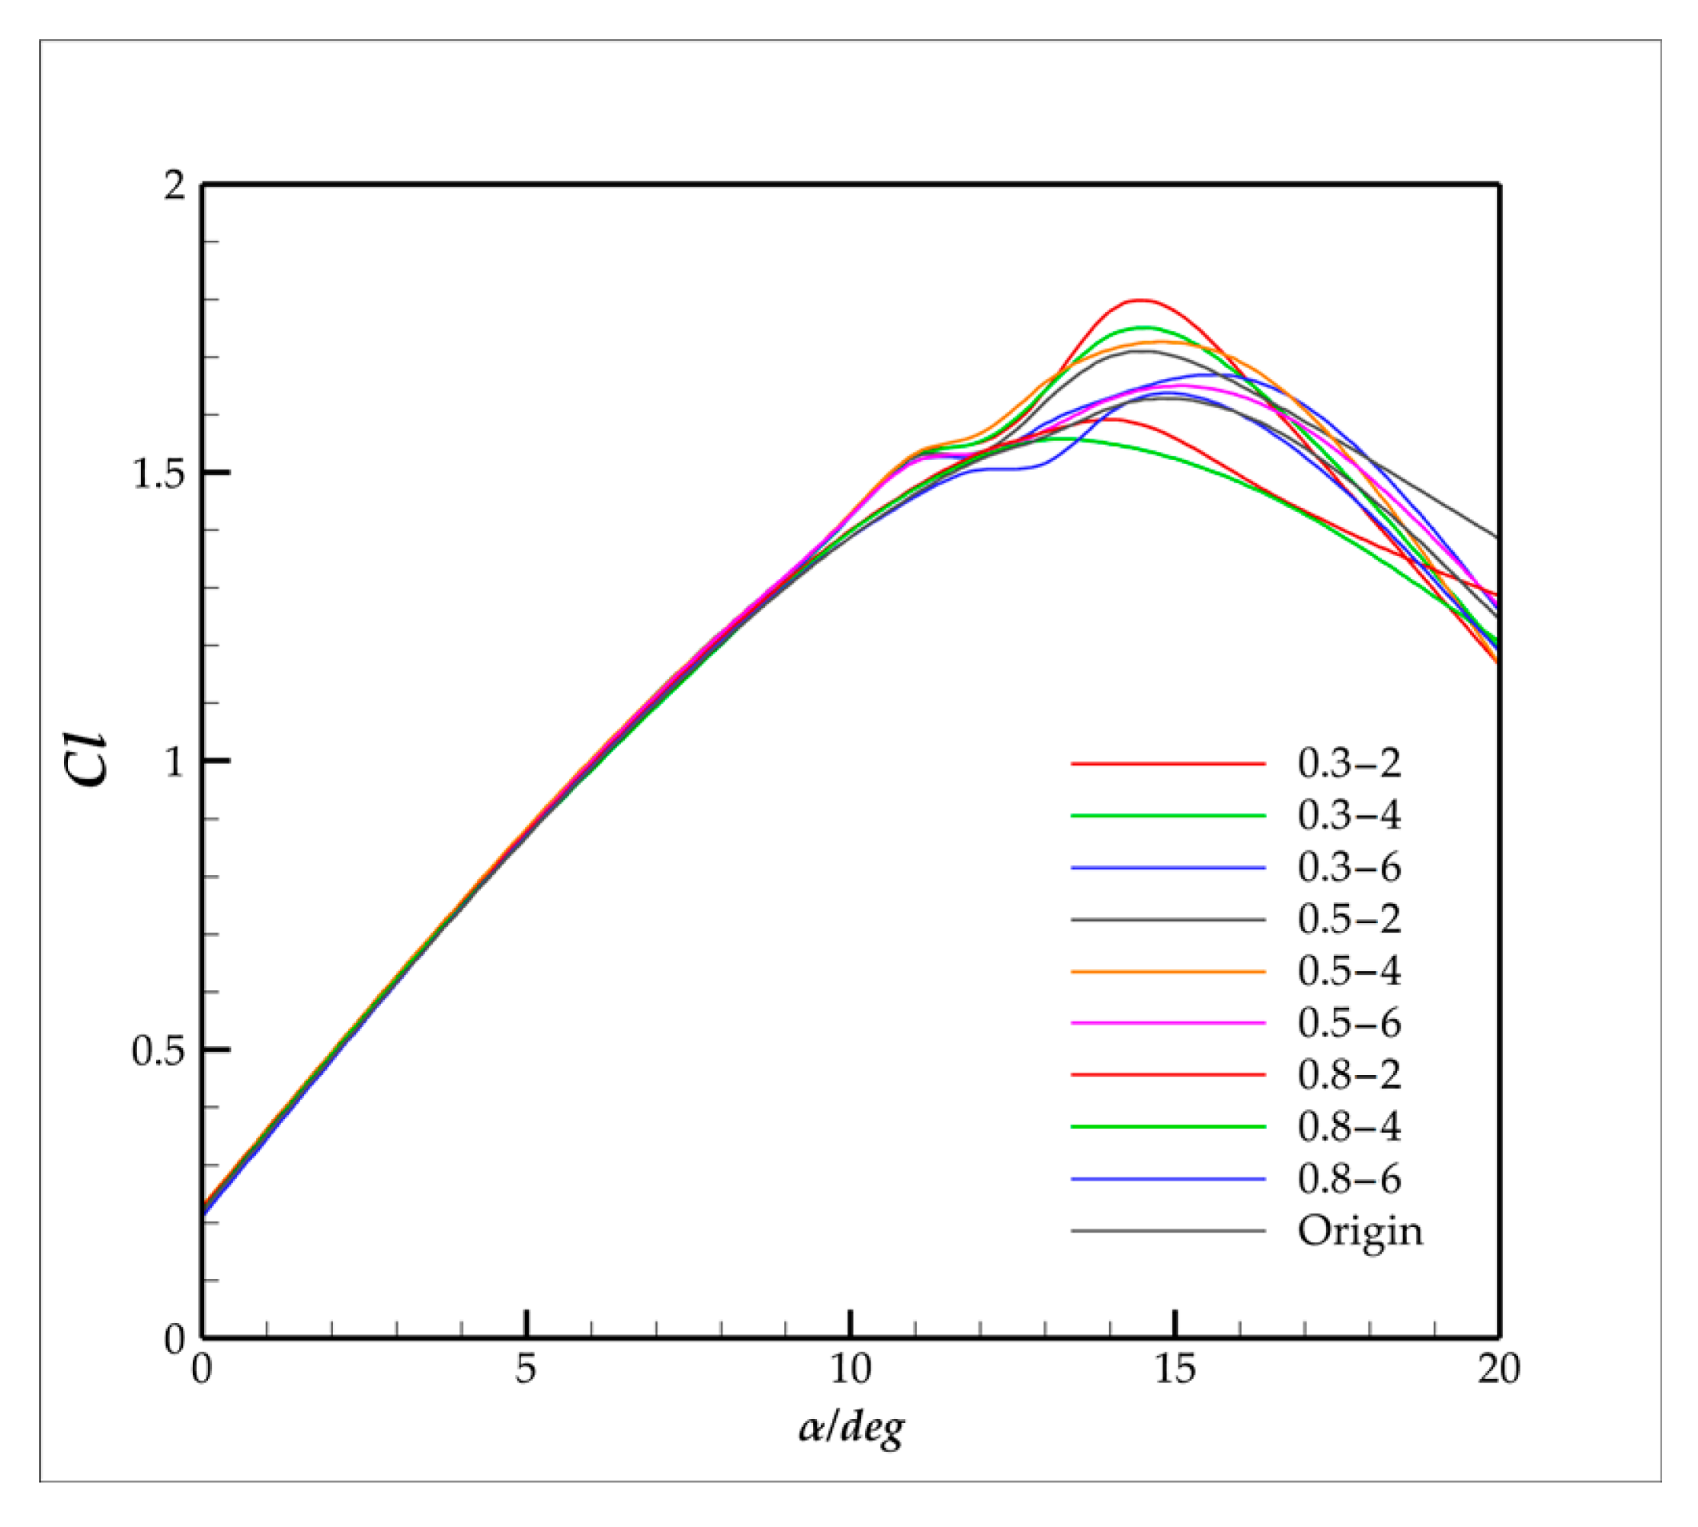
Table 5 shows the airfoil lift coefficient and lift–drag ratio of the nine repair models. When the repair width was less than half of the spar cap width, the lift coefficient of the aerodynamic repair model was increased compared with the original DU300 airfoil, and the lift coefficient of the model (0.3–2) was increased from 1.612 to 1.780 compared with the original airfoil, which was 10% higher. When the repair width was close to the total width of the spar cap, both the lift coefficient and the lift–drag ratio of the aerodynamic repair model decreased, and the lift coefficient of the model (0.8–2) decreased from 1.612 to 1.550. As the AOA increased gradually, the influence of spar cap repair on the aerodynamic characteristics increased significantly, and the failure AOA also changed. The stall AOA of aerodynamic repair models 0.3–6 and 0.5–6 changed from 14° of the original DU300 to 16°. Therefore, the lift coefficient and lift–drag characteristics of the 2D repair model were closely related to repair width and height.

5.2. Influence of Repair Width

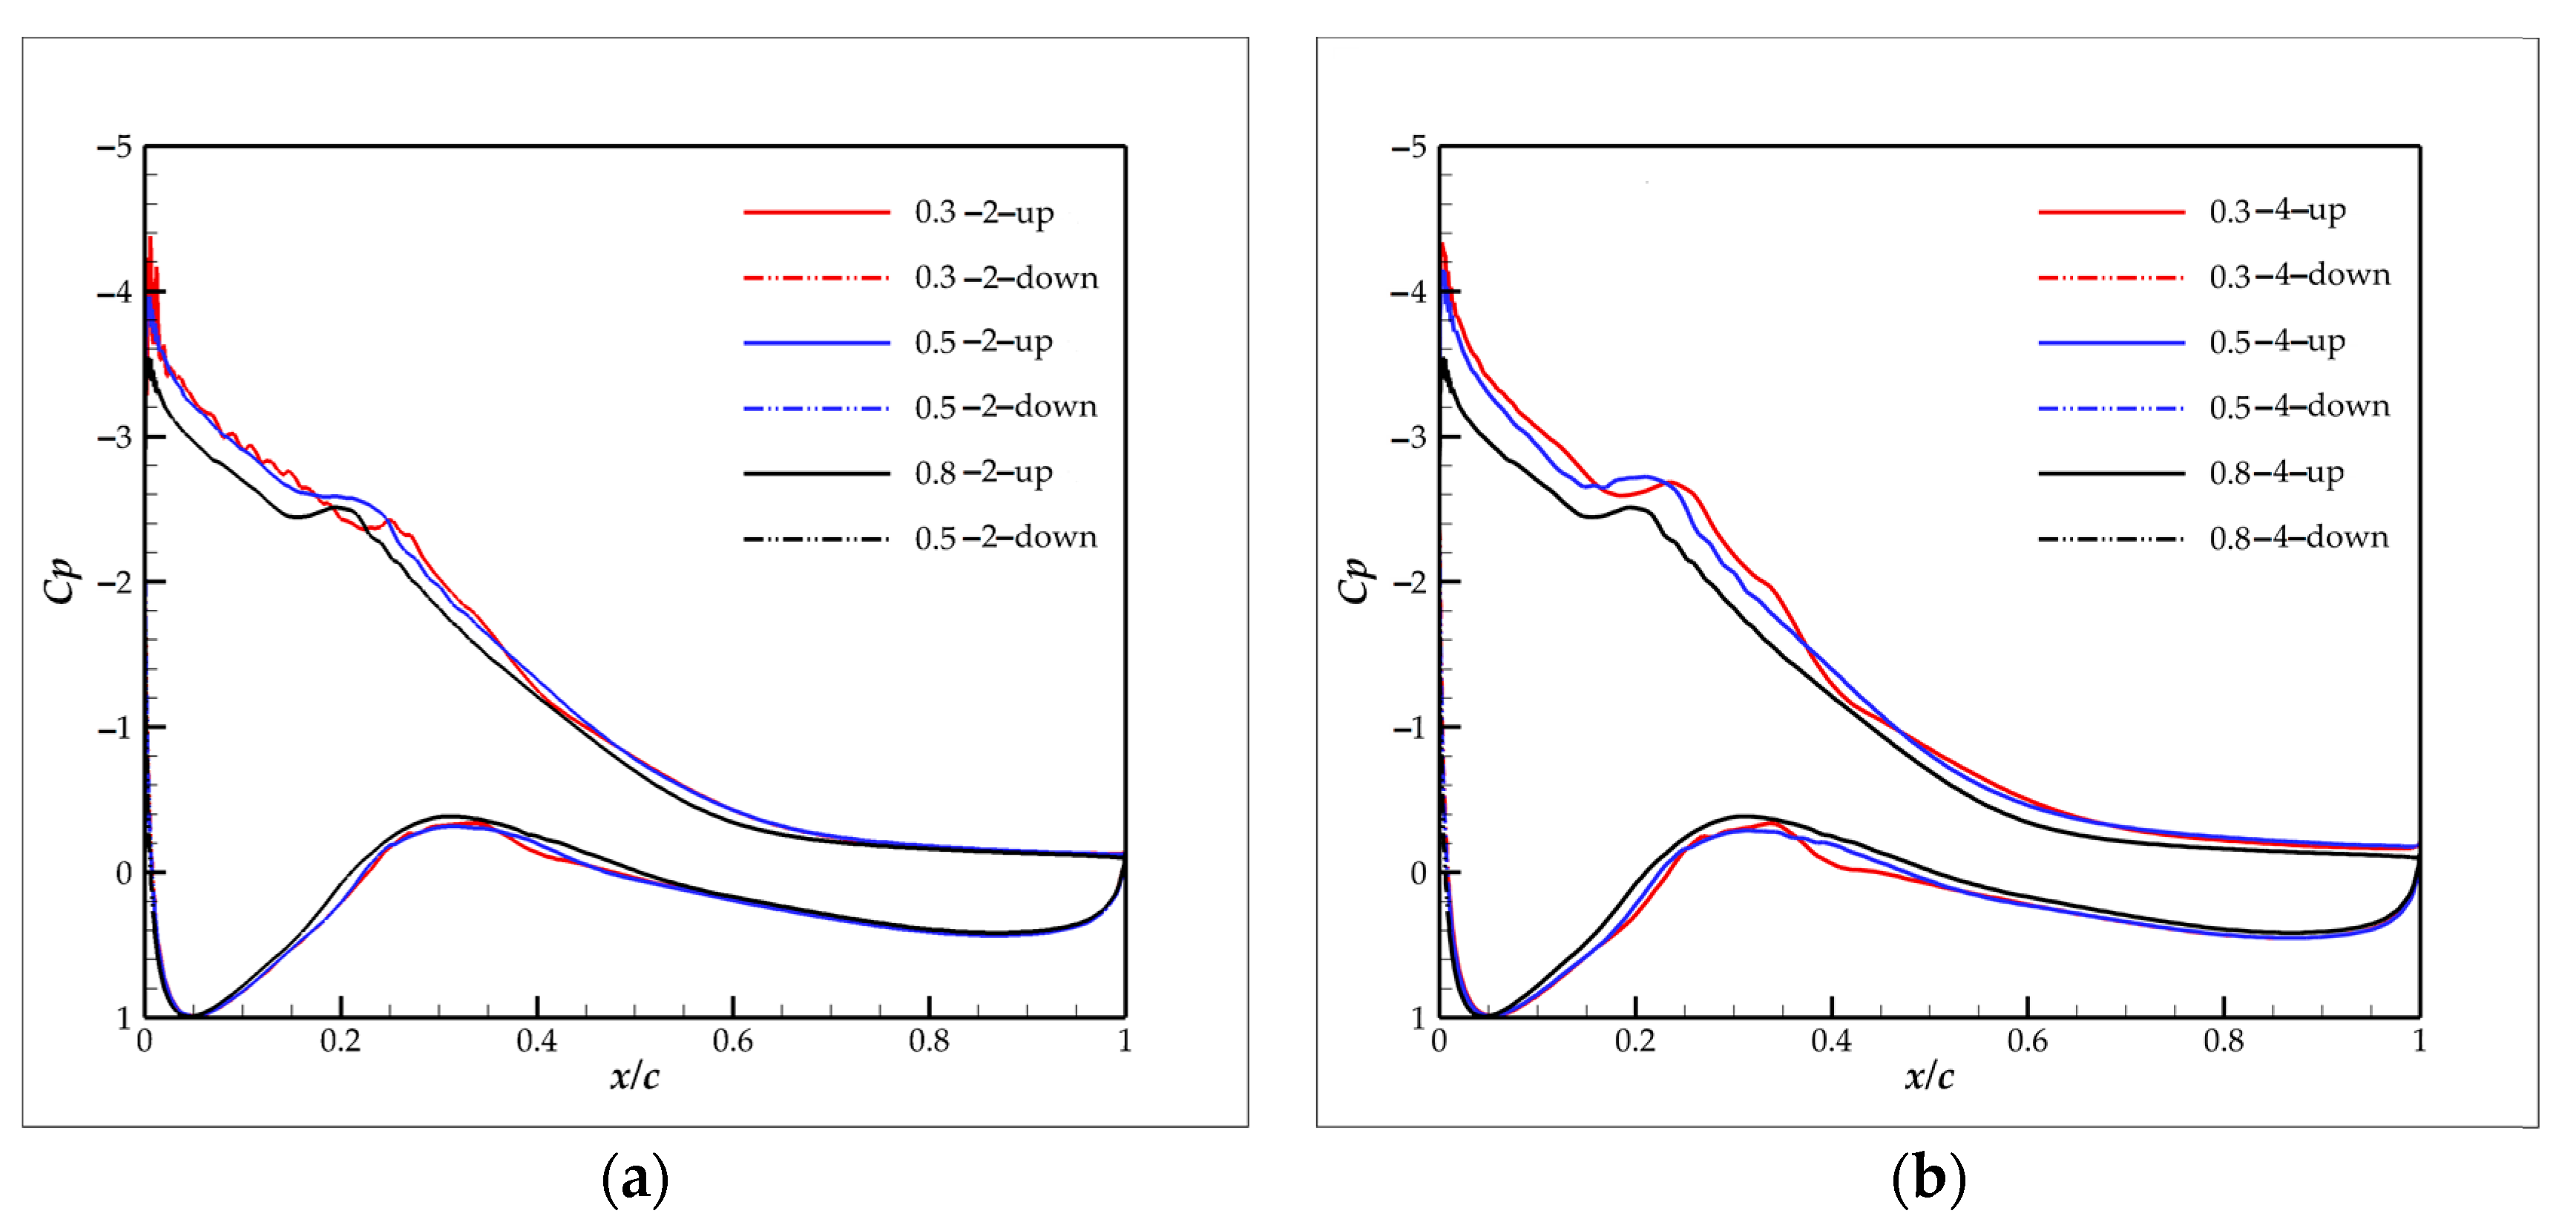
As shown in Figure 18, the repair heights were 2 mm and 4 mm. With the change in repair width, the pressure distribution trend of the aerodynamic repair model was the same, and the suction surface of the airfoil was more affected by repair than the pressure surface. Near the 14° stall AOA, with the increase in the repair width, especially when more than half of the original spar cap width or even close to the total width of the spar cap, the aerodynamic pressure on the suction surface of the airfoil decreased significantly from the leading edge to the repaired area. At this time, the pressure distribution envelope area of the repair model with 80% of the spar cap repair width on the suction surface was less than 30% and 50% of the repair width, resulting in a decrease in the airfoil lift coefficient, which could be mutually verified with the lift coefficient distribution of the repair model corresponding to Table 5.

5.3. Influence of Repair Heigth

As shown in Figure 19a,b, from α = 4° to α = 13°, with the increase in the repair height, the pressure distribution on the local suction surface of the spar cap varied greatly and the pressure surface was basically unaffected by the repair height. However, when the stall angle of attack exceeded 20° (Figure 19c), the fluctuation degree of aerodynamic pressure distribution on the whole suction surface of the airfoil was significantly increased due to the 6 mm repair height, and its influence on the aerodynamic characteristics of the pressure surface increased. Figure 20 shows the static pressure field of the aerodynamic repair model at α = 12° and α = 14°; the influence of the 6 mm repair height on the static pressure field of the suction surface of the spar cap was significantly higher than that of the 2 mm repair height. Therefore, the influence of repair height on airfoil pressure distribution and static pressure field changed significantly with the angle of attack.
Furthermore, the lift coefficient and pressure distribution of the 0.3–2, 0.5–4, and 0.8–6 aerodynamic repair models were compared, indicating that the repair width and repair height should be coordinated (i.e., the ratio of repair width and repair height should be optimized), so as to achieve smooth transition of aerodynamic shape in as wide a range as possible, as well as achieve higher aerodynamic characteristics.

5.4. Influence of Repair Length

The calculation conditions of the 3D rotating blade of B71 were set as 7 m/s wind speed, 13.618 rpm, 2 m hub radius, and 0° pitch angle. In this paper, the flow field of five different density grids of the 3D blade was simulated, where the grid number increased from five million to 18 million. The aerodynamic characteristics of the blade showed good convergence, and the deviation of the calculation results was within 1%. According to the mesh independence test results, a hexahedral mesh and periodic boundary conditions were selected for the B71 blade, and the total number of meshes was 20.16 million (Figure 21).
In the calculation model state, taking the 0.8–6 repair model which seriously affected the aerodynamic performance of the 2D airfoil as the reference, the overall aerodynamic characteristics of the 3D rotating blade featuring a spar cap with a repair length of 30–40 m repaired were compared. As shown in Figure 22, the differential pressure coefficient field (pressure for the repaired blade minus pressure for the original blade) on the pressure surface of the blade in the repair length fluctuated obviously. Moreover, the blade root torque of the 0.8–6 aerodynamic repair model with the 30–40 m repair length of the spar cap changed from 741,766 N·m to 740,751 N·m, and the aerodynamic power changed from 1057.81 kW to 1056.27 kW, i.e., a 0.137% decrease.
The aerodynamic pressure distribution of the 2D profiles with different spanwise directions of the 3D rotating blades under the calculation model state was extracted, as shown in Figure 23a–c. Along the initial chord position of the spar cap, the repair length caused a stepwise change in the dynamic pressure distribution of the suction surface and pressure surface of the 2D profile from the leading edge to the spar cap repair area, which slightly reduced the envelope area. This resulted in a small decrease in the aerodynamic characteristics of the repair section, which could be mutually verified by the lift coefficient distribution of the 2D aerodynamic repair model shown in Table 5 in Section 5.1.
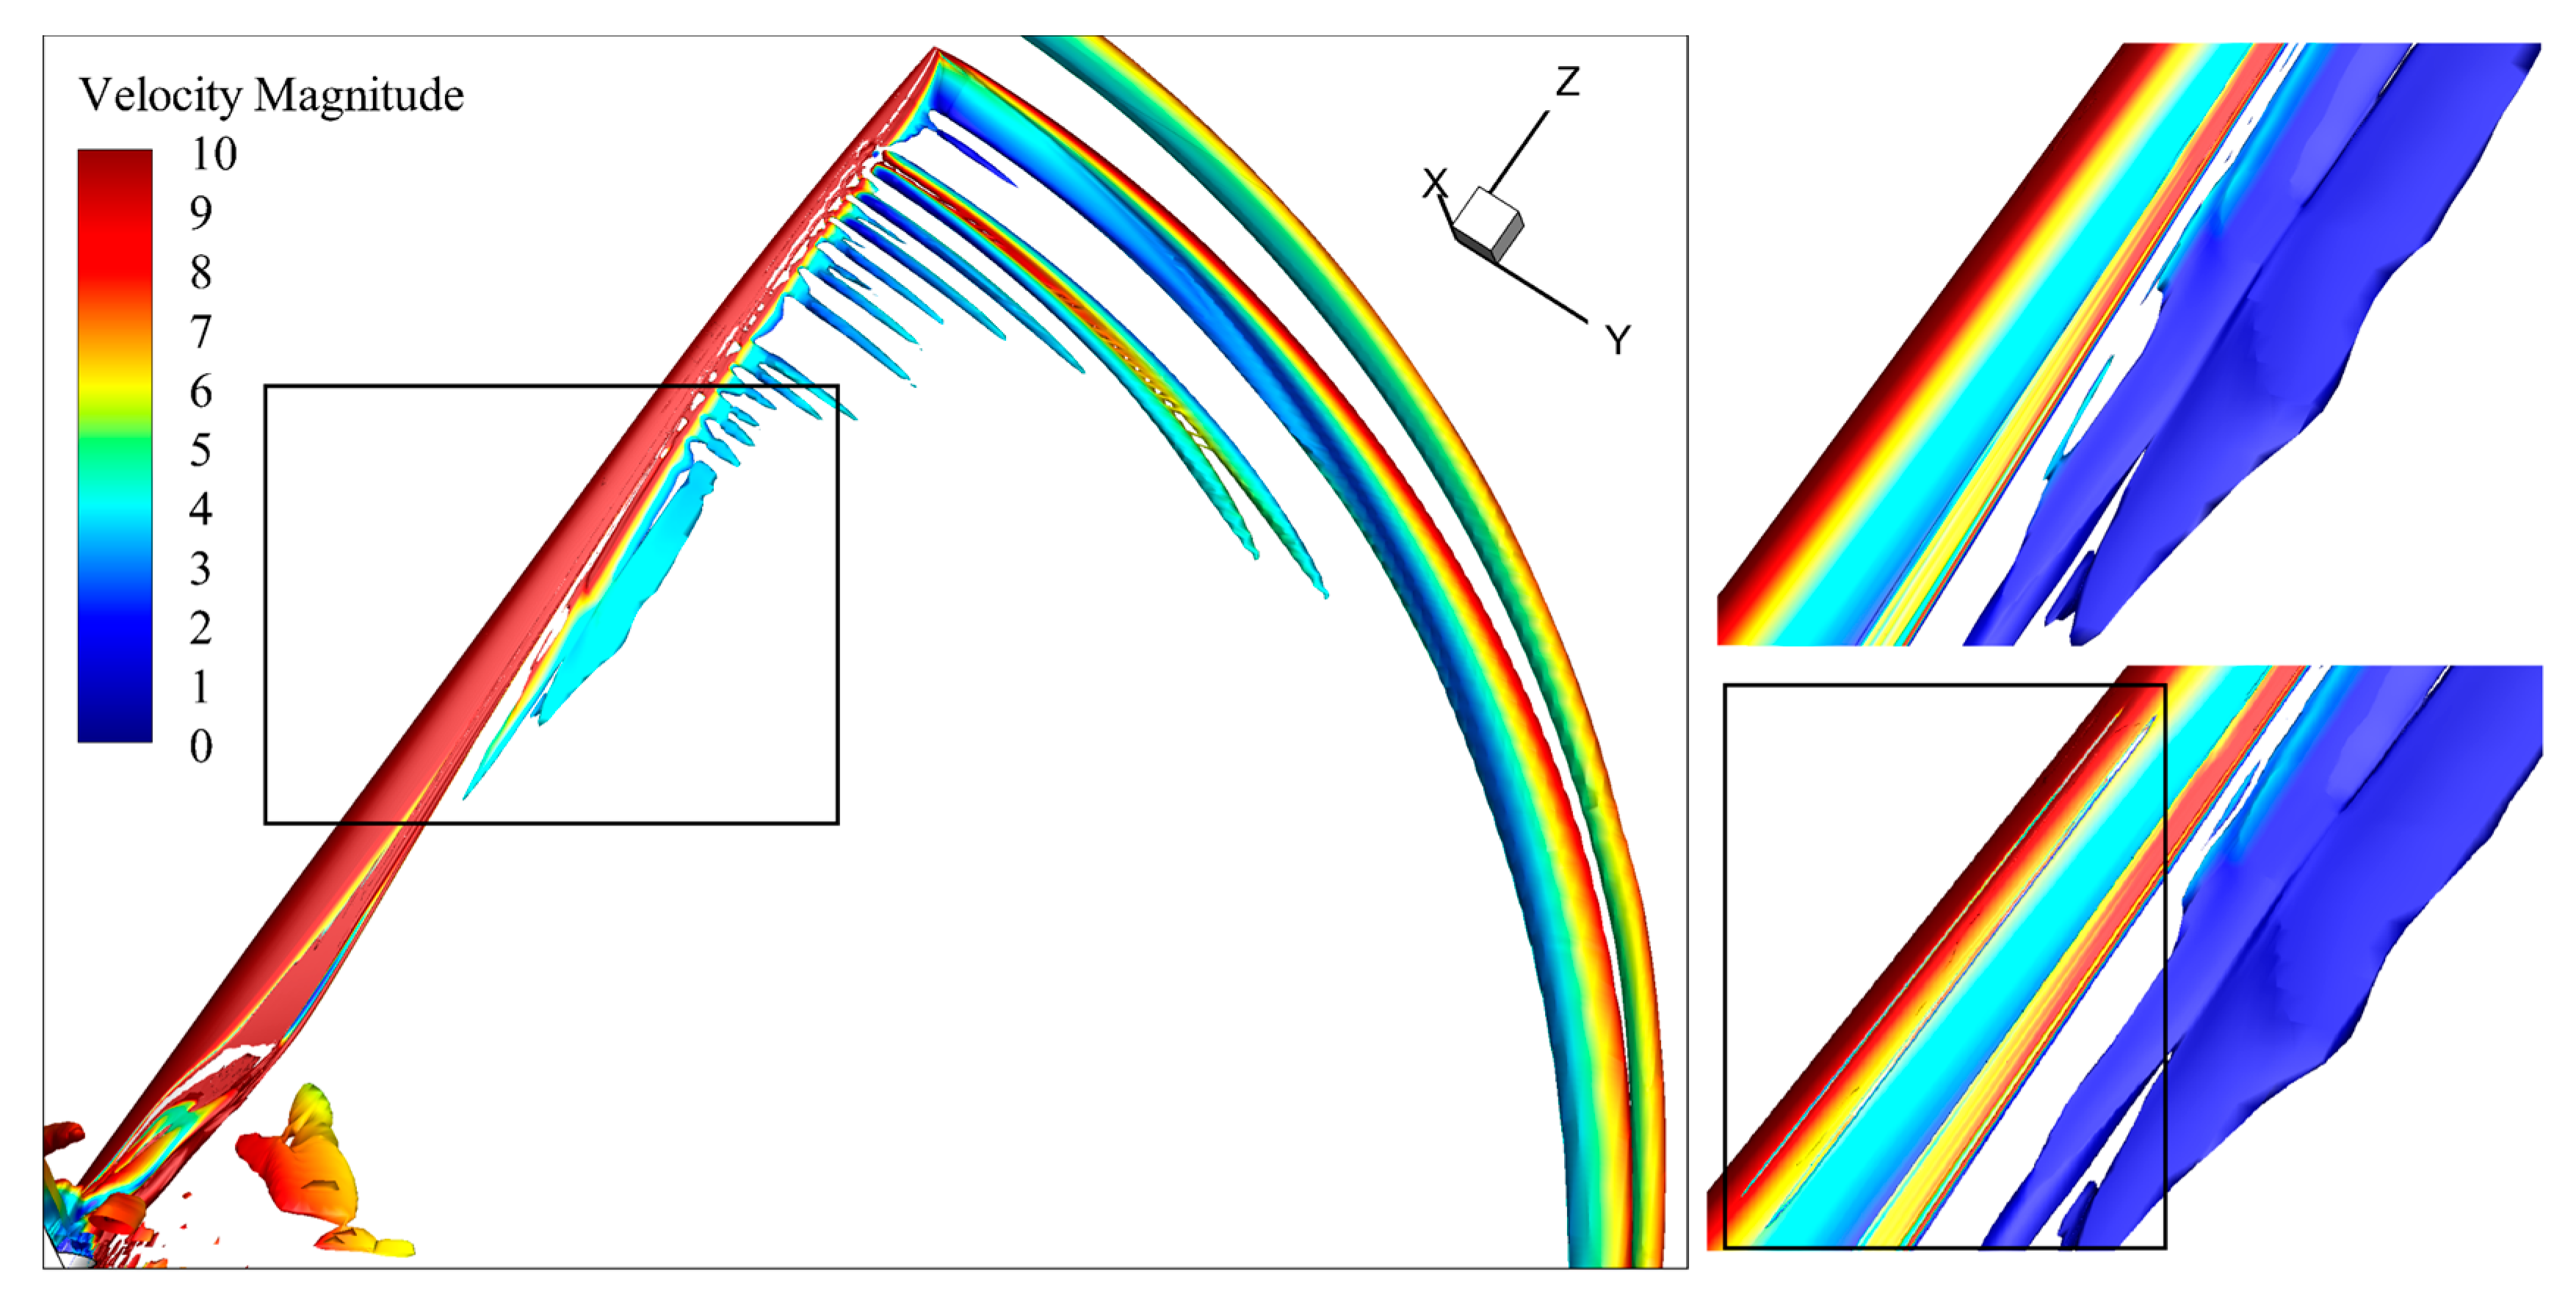
Furthermore, using the vortex lambda2 analysis method [49,50,51], the surface vortex was identified. Figure 24 shows that, in the repair area of the spar cap (R = 30–40 m), local vortex shedding could be seen on the suction surface of the blade. However, as shown in Figure 25, between the original and the repaired blades of the R = 37 m cross-section, the local flow separation of the blade cross-section was not obvious, and the vorticity field in the near-wake field was little affected.

6. Results and Discussion

  • Aiming at the damage repair problem of the spar cap structure of offshore WT blades, using the stepped-lap scarf joint repair model, the repair parameters of ORLs influencing the repair strength and aerodynamic characteristics were divided into repair width, repair height, and repair length. On the basis of the quantitative values of repair parameters in design optimization of the blade ORLs, 27 unidirectional plate structural repair models, nine 2D aerodynamic repair models, and a 3D full-scale blade repair model were designed.
  • The accuracy of structural repair model and aerodynamic repair model was verified experimentally.
    • Abaqus was used to establish the three-dimensional stepped-lap scarf joint repair model of the unidirectional laminate spar cap with damage elements. The load–displacement distribution trend of the numerical simulation was consistent with that of the experiment, and the failure load deviation was 5.5%. The final failure mode (matrix cracking of parent structure and stepped-lap scarf joint surface peeling) and failure location (stepped-lap scarf joint surface) were the same as those observed in the test. It is clear that the damage gradually expanded from the end of the stepped-lap scarf joint surface to the middle area, before leading to the whole surface peeling.
    • The aerodynamic simulation analysis model of the DU300 airfoil was established using Fluent, and the flow characteristics of the DU300 airfoil at 10° and 15° angles of attack were simulated. The lift coefficient and pressure distribution obtained via numerical simulation were in good agreement with the experimental values, and the overall error was within 2%.
  • A total of 27 structural repair models were designed to compare the influence of repair parameter optimization in the design of ORLs on the failure load and cohesive layer normal stress S33.
    • The repair length could significantly improve the loading capacity of the structure. When the repair length was increased from 90 mm to 145 mm, the maximum failure load was increased by 22%. However, when the repair length exceeded 145 mm, only the width and depth of the elastic groove increased continuously, which did not affect the failure load and interlaminar stress distribution.
    • The repair height played an important role in improving the loading capacity of the structure, especially when the repair area (repair length × repair width) was large; the repair height caused the local stiffness of the ORL bonded parts to increase, resulting in a significant increase in the failure load by about 30%.
    • The repair width only increased the width of the spar cap in the chord direction perpendicular to the fiber direction, which led to no significant improvement in the loading capacity of the structural repair model.
    • With the increase in the displacement loading step until the failure displacement, the S33 at both ends dropped sharply. The S33 in the middle of the stepped-lap surface fluctuated greatly with the increase in the loading point, verifying that the repair stepped-lap surface failed from both ends and expanded along the repair length to the middle area.
  • The 2D airfoil with nine groups of aerodynamic repair models and the 3D rotating blade repaired model were designed for the slight deviation of the local spar cap caused by the repair width, repair height, and repair length, and then subjected to aerodynamic response analysis.
    • The lift and drag properties of the spar cap repair models were closely related to the width and height of the repair. The lift coefficient increased or decreased by 3.8–10% with different optimization design of the repair width and height.
    • The influence of repair width and repair height on the aerodynamic pressure distribution and static pressure field of the spar cap repair model changed significantly with the angle of attack, and the influence degree on the suction surface was greater than that on the pressure surface. Repair height had a more significant effect on the aerodynamic performance than repair width. The repair width and repair height needed to be coordinated to achieve smooth transition of aerodynamic shape and reduce the influence of shape deviation on the aerodynamic performance.
    • Under the calculation model state, the torque and power of the 3D rotation blade using the repair model with 30–40 m repair length, 80% repair width, and 6 mm repair height were resolved by 0.137% compared with the original blade. In addition, the 2D airfoil profiles at different spanwise positions of the 3D blades were extracted; along the initial chord position of the spar cap, the repair length caused a stepwise change in the aerodynamic pressure coefficient of the suction surface and pressure surface of the 2D profile from the leading edge to the spar cap repair area, but the vorticity field in the near-wake field was little affected.
    • Therefore, by reasonably optimizing the repair length, repair width, and repair height of the outer reinforcement layers, the comprehensive measurement of structural characteristics and aerodynamic performance was realized, which can provide technical support for the damage repair of the spar cap of the offshore blade in service.

7. Conclusions

Aiming at the damage repair problem of the offshore wind turbine blade spar cap, the influence of the quantitative design of repair width, repair height, and repair length of the outer reinforcement layer on the repair structure and aerodynamic performance was studied. By reasonably optimizing the repair parameters of the outer reinforcement layer, the balance between aerodynamic and structural repair could be realized. This can provide an important application basis for repairing offshore wind turbine blades.

Author Contributions

H.L., conceptualization, methodology, data curation, investigation, visualization, writing—original draft. X.L., W.X. and Z.G., writing—review and editing, and funding acquisition; B.Z., B.N. and H.B., resources and supervision. All authors have read and agreed to the published version of the manuscript.

Funding

This research was funded by the National Natural Science Foundation of China under grant No. 52175105 and the Basic Scientific Research Project of Liaoning Province under grant No. LJKMZ20220486.

Data Availability Statement

The test data used to verify the correctness of the structural model in this paper are disclosed: [15].

Conflicts of Interest

The authors declare no conflict of interest.

References

  1. Guedes Soares, C.; Bhattacharjee, J.; Karmakar, D. Overview and prospects for development of wave and offshore wind energy. Brodogradnja 2014, 65, 87–109. [Google Scholar]
  2. Ren, Z.; Verma, A.S.; Li, Y.; Teuwen, J.J.; Jiang, Z. Offshore wind turbine operations and maintenance: A state-of-the-art review. Renew. Sustain. Energy Rev. 2021, 144, 110886. [Google Scholar] [CrossRef]
  3. Shafiee, M.; Patriksson, M.; Strömberg, A.-B. An Optimal Number-Dependent Preventive Maintenance Strategy for Offshore Wind Turbine Blades Considering Logistics. Adv. Oper. Res. 2013, 2013, 205847. [Google Scholar] [CrossRef] [Green Version]
  4. Nordahl, M. The development of a life cycle cost model for an offshore wind farm. Master’s Thesis, Department of Applied Mechanics, Chalmers University of Technology, Gothenburg, Sweden, 2011. Available online: http://publications.lib.chalmers.se/records/fulltext/152402.pdf (accessed on 1 August 2011).
  5. Shafiee, M.; Finkelstein, M.; Bérenguer, C. An opportunistic condition-based maintenance policy for offshore wind turbine blades subjected to degradation and environmental shocks. Reliab. Eng. Syst. Saf. 2015, 142, 463–471. [Google Scholar] [CrossRef]
  6. Zhou, B.; Yu, F.; Luo, Y.; Li, H. Detecting defects in the main spar of a wind turbine blade. J. Renew. Sustain. Energy 2020, 12, 053304. [Google Scholar] [CrossRef]
  7. Zhao, L.B.; Gong, Y.; Zhang, J.Y. A survey on delamination growth behavior in fiber reinforced composite laminates. Acta Aeronaut. Astronaut. Sin. 2019, 40, 171–199. [Google Scholar]
  8. Bolotin, V.V. Delaminations in composite structures: Its origin, buckling, growth and stability. Compos. Part B Eng. 1996, 27, 129–145. [Google Scholar] [CrossRef]
  9. Pietropaoli, E.; Riccio, A. Formulation and assessment of an enhanced finite element procedure for the analysis of delamination growth phenomena in composite structures. Compos. Sci. Technol. 2011, 71, 836–846. [Google Scholar] [CrossRef] [Green Version]
  10. Waas, V.D.; Hidayat, M.; Noerochim, L. Finite Element Simulation of Delamination in Carbon Fiber/Epoxy Laminate Using Cohesive Zone Model: Effect of Meshing Variation. Mater. Sci. Forum 2019, 964, 257–262. [Google Scholar] [CrossRef]
  11. Jiménez, A.A.; Zhang, L.; Muñoz, C.Q.G.; Márquez, F.P.G. Maintenance management based on machine learning and nonlinear features in wind turbines. Renew. Energy 2020, 146, 316–328. [Google Scholar] [CrossRef]
  12. Tenney, D.R.; Davis, J.G., Jr.; Pipes, R.B.; Johnston, N. NASA Composite Materials Development: Lessons Learned and Future Challenges; NATO Research and Technology Agency: Neuilly sur Seine, France, 2009; pp. 1–58. [Google Scholar]
  13. Mischnaewski, L., III; Mishnaevsky, L., Jr. Structural repair of wind turbine blades: Computational model for the evaluation of the effect of adhesive properties. Wind Energy 2021, 24, 402–408. [Google Scholar] [CrossRef]
  14. Bajere, P.A. Handbook of adhesive bonded structural repair. J. Test Eval. 1994, 22, 1–10. [Google Scholar]
  15. Li, H.; Chen, C.; Wang, T.; Wang, L. Experimental Study of Stepped-Lap Scarf Joint Repair for Spar Cap Damage of Wind Turbine Blade in Service. Appl. Sci. 2020, 10, 922. [Google Scholar] [CrossRef]
  16. Li, H.; Zhang, X.; Zhou, B.; Wang, L.; Zhu, C. Study on the repair parameters for trailing-edge bonding failure of wind turbine blade in service. Energy Sci. Eng. 2022. Early View. [Google Scholar] [CrossRef]
  17. Mishnaevsky, L. Repair of wind turbine blades: Review of methods and related computational mechanics problems. Renew. Energy 2019, 140, 828–839. [Google Scholar] [CrossRef]
  18. Sun, C.; Zhao, W.; Zhou, J.; Altenaiji, M.; Cantwell, W.; Wang, Q.; Guan, Z. Mechanical behaviour of composite laminates repaired with a stitched scarf patch. Compos. Struct. 2021, 255, 112928. [Google Scholar] [CrossRef]
  19. Bendemra, H.; Compston, P.; Crothers, P.J. Optimisation study of tapered scarf and stepped-lap joints in composite repair patches. Compos. Struct. 2015, 130, 1–8. [Google Scholar] [CrossRef]
  20. Beylergil, B.; Aktas, A.; Cunedioglu, Y. Buckling and compressive failure of stepped-lap joints repaired with composite patches. J. Compos. Mater. 2012, 46, 3213–3230. [Google Scholar] [CrossRef]
  21. Lekou, D.J.; Vionis, P. Report on Repair Techniques for Composite Parts of Wind Turbine Blades; OPTIMAT Blades, WMC Technology Center: Wieringerwer, The Netherlands, 2002; pp. 1–15. [Google Scholar]
  22. Black, K.J. An investigation of the effects of battle-damaged repair patches on the aerodynamic responses of an airfoil. Ph.D. Thesis, Carleton University, Ottawa, ON, Canada, 1995. [Google Scholar]
  23. Irwin, A.J. Investigation into the Aerodynamic Effects of Simulated Battle Damage to a Wing. Ph.D. Thesis, Loughborough University, Loughborough, UK, 1999. [Google Scholar]
  24. Render, P.M.; de Silva, S.; Walton, A.J.; Mahmoud, M. Experimental Investigation into the Aerodynamics of Battle Damaged Airfoils. J. Aircr. 2007, 44, 539–549. [Google Scholar] [CrossRef]
  25. Kind, R.J.; Block, K.J.; Carnegie, C.L. A preliminary investigation of the effects of battle-damage repair patches on the aerodynamic performance of a CF-18 airfoil. Can. Aeronaut. Space J. 1998, 44, 73–81. [Google Scholar]
  26. Render, P.M.; Walton, A.J. Aerodynamics of battle damaged wings—The influence of flaps camber and repair schemes. In Proceedings of the 23rd AIAA Applied Aerodynamic Conference, Toronto, ON, Canada, 6–9 June 2005. [Google Scholar]
  27. Djellal, S.; Render, P.M.; Ouibrahim, A. Effects of battle damage repairs on the aerodynamics of a wing. In Proceedings of the JNAGT05, Oran, Algeria, 5–6 December 2005. [Google Scholar]
  28. Djellal, S.; Ouibrahimi, A. Aerodynamic Performances of Battle-Damaged and Repaired Wings of an Aircraft Model. J. Aircr. 2008, 45, 2009–2023. [Google Scholar] [CrossRef]
  29. Etemadi, F.; Mani, M.; Etemadi, M. Experimental and numerical analysis of repairing a triangular shaped airfoil. In Proceedings of the Fluids Engineering Division Summer Meeting, Hamamatsu, Japan, 24–29 July 2011; Volume 44403, pp. 3455–3461. [Google Scholar]
  30. Etemadi, F.; Etemadi, M.; Mani, M.; Pooladsanj, S. Experimental and numerical analysis of aerodynamic effects of repair patches on damaged airfoils. J. Mech. Sci. Technol. 2017, 31, 651–658. [Google Scholar] [CrossRef]
  31. Det Norske Veritas. DNVGL-ST-0376. Rotor Blades for Wind Turbines. 2015. Available online: https://rules.dnvgl.com/docs/pdf/DNVGL/ST/2015-12/DNVGL-ST-0376.pdf (accessed on 1 December 2015).
  32. Webber, J.P.H. Scarf repair joints in carbon fibre reinforced plastic strips. J. Adhes. 1981, 12, 257–281. [Google Scholar] [CrossRef]
  33. Li, J.; Wang, J.; Zhang, L.; Huang, X.; Yu, Y. Study on the Effect of Different Delamination Defects on Buckling Behavior of Spar Cap in Wind Turbine Blade. Adv. Mater. Sci. Eng. 2020, 2020, 6979636. [Google Scholar] [CrossRef]
  34. Hayat, K.; Siddique, S.; Sultan, T.; Ali, H.T.; Aloufi, F.A.; Halawani, R.F. Effect of Spar Design Optimization on the Mass and Cost of a Large-Scale Composite Wind Turbine Blade. Energies 2022, 15, 5612. [Google Scholar] [CrossRef]
  35. Hashin, Z. Failure Criteria for Unidirectional Fiber Composites. J. Appl. Mech. 1980, 47, 329–334. [Google Scholar] [CrossRef]
  36. Barenblatt, G.I. The formation of equilibrium cracks during brittle fracture. General ideas and hypotheses. Axially-symmetric cracks. J. Appl. Math. Mech. 1959, 23, 622–636. [Google Scholar] [CrossRef]
  37. Dugdale, D.S. Yielding of steel sheets containing slits. J. Mech. Phys. Solids 1960, 8, 100–104. [Google Scholar] [CrossRef]
  38. Camacho, G.T.; Ortiz, M. Computational modeling of impact damage in brittle materials. Int. J. Solids Struct. 1996, 33, 289–2938. [Google Scholar] [CrossRef]
  39. Richefeu, V.; Chrysochoos, A.; Huon, V.; Monerie, Y.; Peyroux, R.; Wattrisse, B. Toward local identification of cohesive zone models using digital image correlation. Eur. J. Mech. A Solids 2012, 34, 38–51. [Google Scholar] [CrossRef]
  40. Shokrieh, M.; Zeinedini, A.; Ghoreishi, S. On the mixed mode I/II delamination R-curve of E-glass/epoxy laminated composites. Compos. Struct. 2017, 171, 19–31. [Google Scholar] [CrossRef]
  41. Xu, H.R.; Yang, H.; Liu, C.; Hong, Z.D. Research on the effect of different turbulence models on the aerodynamic performance prediction accuracy of MEXICO wind turbines. Proc. CSEE 2013, 33, 95–101. [Google Scholar]
  42. Menter, F.R. Two-equation eddy-viscosity turbulence models for engineering applications. AIAA J. 1994, 32, 1598–1605. [Google Scholar] [CrossRef] [Green Version]
  43. Wang, Q.; Zhao, N.; Wang, T.G.; Zhong, W.; Wang, L. Numerical simulation of wind turbine airfoil dynamic stall with transition modeling. Acta Energy Sol. Sin. 2012, 33, 113–119. [Google Scholar]
  44. Zhong, W.; Wang, T.G. Numerical analysis of transition effect on stall performance of wind turbine airfoils and blades. Acta Aerodyn. Sin. 2011, 29, 385–390. [Google Scholar]
  45. Baldacchino, D.; Ferreira, C.; Tavernier, D.D.; Timmer, W.A.; van Bussel, G.J.W. Experimental parameter study for passive vortex generators on a 30% thick airfoil. Wind Energy 2018, 21, 745–765. [Google Scholar] [CrossRef] [Green Version]
  46. Dataset Description-Experimental Parameter Study for Passive Vortex Generators on a Thick Airfoil. Available online: https://data.4tu.nl/articles/dataset/Experimental_parameter_study_for_passive_vortex_generators_on_a_thick_airfoil_version_1_/12721421 (accessed on 1 March 2017).
  47. Zhu, C.; Qiu, Y.; Feng, Y.; Wang, T.; Li, H. Combined effect of passive vortex generators and leading-edge roughness on dynamic stall of the wind turbine airfoil. Energy Convers. Manag. 2022, 251, 115015. [Google Scholar] [CrossRef]
  48. Xie, M.J. Joints for Composites Materials; Shanghai Jiao Tong University Press: Shanghai, China, 2011. [Google Scholar]
  49. Jeong, J.; Hussain, F. On the identification of a vortex. J. Fluid Mech. 1995, 285, 69–94. [Google Scholar] [CrossRef]
  50. Mariotti, A.; Buresti, G.; Salvetti, M.V. Separation delay through contoured transverse grooves on a 2D boat-tailed bluff body: Effects on drag reduction and wake flow features. Eur. J. Mech. B Fluids 2019, 74, 351–362. [Google Scholar] [CrossRef]
  51. Galletti, C.; Mariotti, A.; Siconolfi, L.; Mauri, R.; Brunazzi, E. Numerical investigation of flow regimes in T-shaped micromixers: Benchmark between finite volume and spectral element methods. Can. J. Chem. Eng. 2018, 97, 528–541. [Google Scholar] [CrossRef]
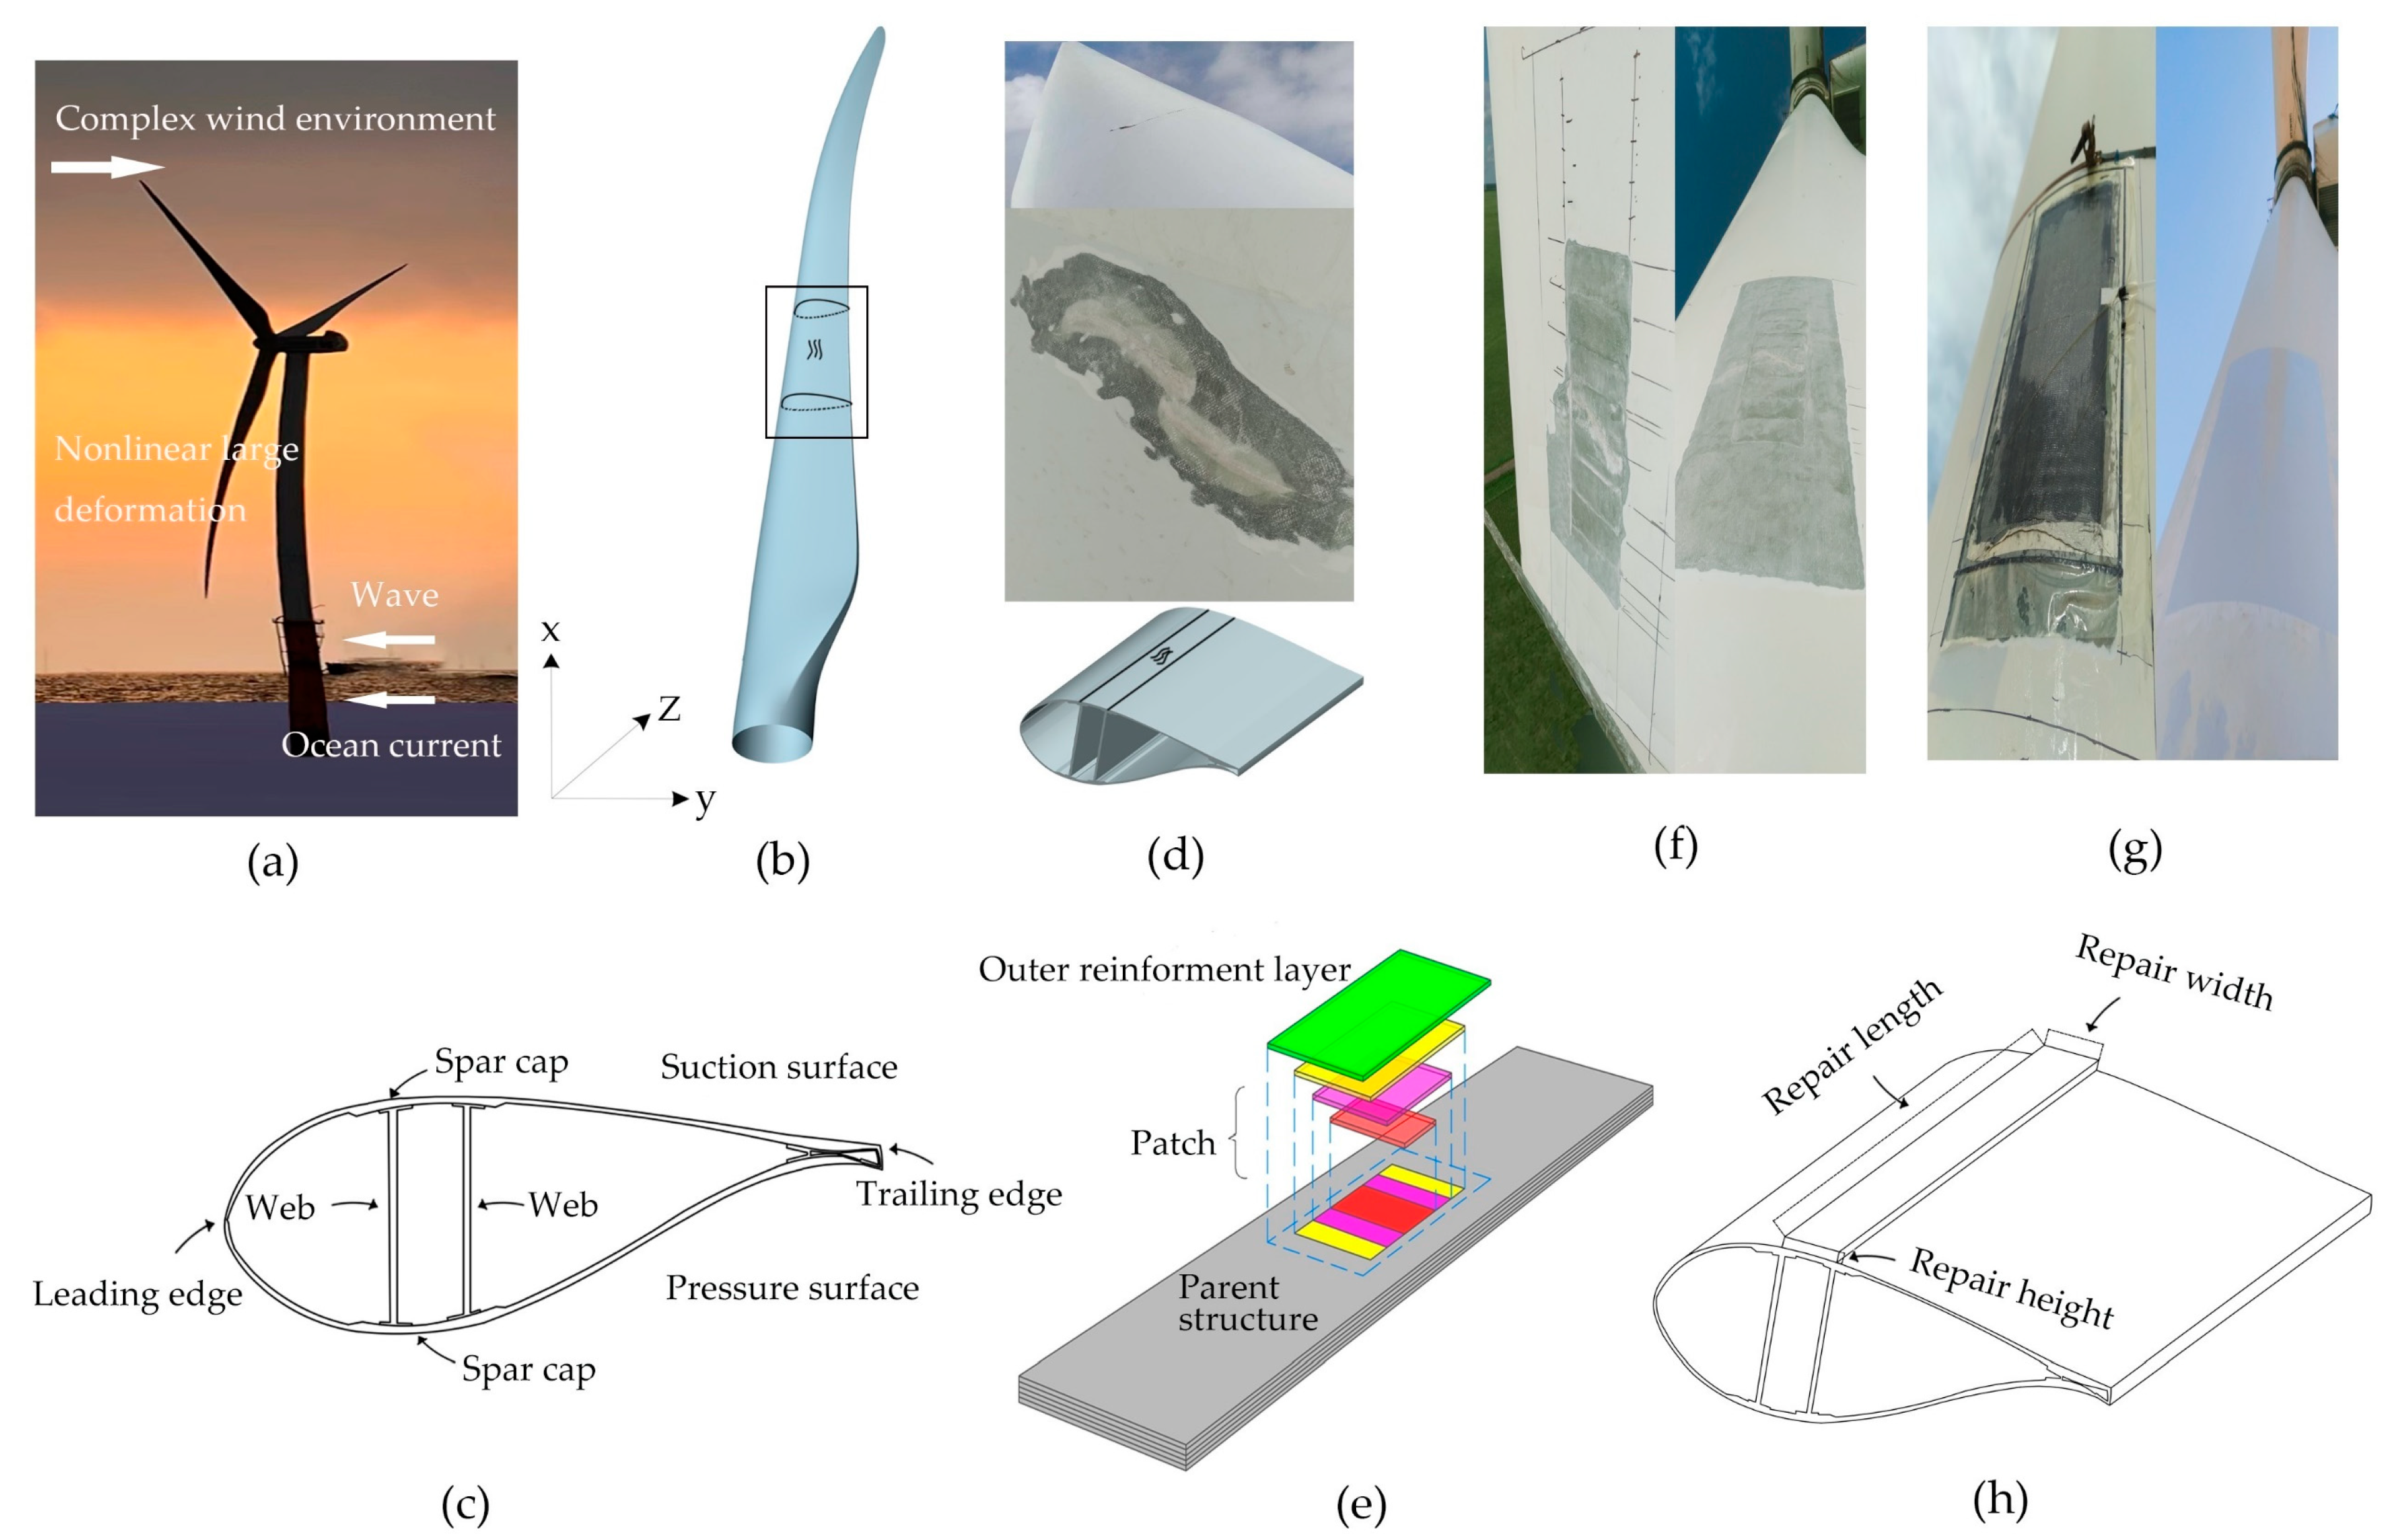
Figure 1. Damage repair design of offshore WT blades structures: (a) nonlinear deformation of blades in complex offshore wind environments; (b) spar cap damage of full-size blades; (c) blade cross-section structure; (d) blade profiles; (e) implementation of stepped-lap scarf repair method under high altitude operation; (f) schematic diagram of repair patch and ORLs; (g) repair process; (h) design of repair parameters for ORLs.
Energies 16 00712 g001
Figure 2. Repair parameters of the ORLs: (a) structural damage of spar cap; (b) front view—repair length and repair height; (c) top view—repair length and repair width; (d) side view—repair width and repair height.
Energies 16 00712 g002
Figure 3. Blade design distribution of B71: (a) spar cap layering thickness and safety factor; (b) ultimate flapwise moment and output efficiency of blade.
Energies 16 00712 g003
Figure 4. The repair length of 3D blade: (a) repair length of 30–40 m; (b) repaired cross-section; (c) repaired spar cap.
Energies 16 00712 g004
Figure 5. Bilinear CZM constitutive model.
Energies 16 00712 g005
Figure 6. Structural analysis model.
Energies 16 00712 g006
Figure 7. Boundary conditions and displacement load of structural analysis model.
Energies 16 00712 g007
Figure 8. Load–displacement comparison between numerical simulation and test.
Energies 16 00712 g008
Figure 9. Failure mode of structural repair model: (a) failure factor nephogram of stepped-lap joint surface; (b) failure factor nephogram of parent structure; (c) stress nephogram of patch.
Energies 16 00712 g009
Figure 10. Damage evolution of stepped-lap joint surface: (a) F = 30.5 kN; (b) F = 37.4 kN; (c) F = 44.3 kN; (d) F = 50.9 kN; (e) F = 56.9 kN; (f) F = 63.1 kN.
Energies 16 00712 g010
Figure 11. DU300 airfoil grid: (a) sliding interface marked by blue; (b) boundary layer grid.
Energies 16 00712 g011
Figure 12. Pressure distribution of DU300: (a) α = 10°; (b) α = 15°.
Energies 16 00712 g012
Figure 13. Comparison of airfoil performance between experimental and simulation (a) α = 10°; (b) α = 15°.
Energies 16 00712 g013
Figure 14. The red line marks the location of stress extraction.
Energies 16 00712 g014
Figure 15. Analysis results of structural repair model: (a) cohesive layer normal stress S33 corresponding to RL = 200 mm; (b) failure load–displacement curve.
Energies 16 00712 g015
Figure 16. Analysis results of structural repair models: (a) failure loads of 9 groups of structural repair models; (b) cohesive layer normal stress S33 at different displacement steps.
Energies 16 00712 g016
Figure 17. Failure loads of all structural repair models corresponding to nine groups with repair widths.
Energies 16 00712 g017
Figure 18. Pressure distribution of aerodynamic repair models with different repair widths at α = 14°: (a) RH = 2 mm; (b) RH = 4 mm.
Energies 16 00712 g018
Figure 19. Pressure distribution with 50% repair width: (a) α = 4°; (b) α = 13°; (c) α = 20°.
Energies 16 00712 g019
Figure 20. Static pressure field: (a) 0.5–2, α = 12°; (b) 0.5–6, α = 12°; (c) 0.8–2, α = 14°; (d) 0.8–6, α = 14°.
Energies 16 00712 g020
Figure 21. The grids of 3D rotating blade.
Energies 16 00712 g021
Figure 22. Differential pressure coefficient field of the repaired blade and original blade.
Energies 16 00712 g022
Figure 23. Aerodynamic pressure coefficient distribution in 2D repair profile of 3D repaired blade: (a) R = 30 m; (b) R = 33 m; (c) R = 37 m.
Energies 16 00712 g023
Figure 24. Flow field between the original and the repaired blades. The black box shows the repair area of the spar cap (R = 30–40 m).
Energies 16 00712 g024
Figure 25. Flow field of the blade cross-section for R = 37 m: (a) the original blade; (b) the repaired blade.
Energies 16 00712 g025
Table 1. Structural repair analysis model.
RWRHRL
%mmmm
30290Energies 16 00712 i001
504145
806200
Table 2. Aerodynamic repair analysis model.
Repair ModelRWRH
%mm
0.3−2302Energies 16 00712 i002
0.3−4304
0.3−6306
0.5−2502
0.5−4504
0.5−6506
0.8−2802
0.8−4804
0.8−6806
Table 3. Material property of unidirectional laminate. Nomenclature: Young’s modulus (E), shear modulus (G), Poisson’s ratio ( μ ), critical energy release rate (GC), normal strength ( t n 0 ), shear strength ( t s 0 ), mixed mode ratio ( η ), fiber directional strength (X), transverse fiber direction strength (Y), and fiber shear strength (S).
Ply PropertiesCohesive Layer Properties [7]
E 11 47,000 MPa G I C 0.969 kJ/m2
E 22 = E 33 12,690 MPa G I I C 1.719 kJ/m2
G 12 = G 13 = G 23 3890 MPa t n 0 30 MPa
μ 12 = μ 13 0.26 t s 0 35 MPa
μ 23 0.3 t t 0 35 MPa
X T 985 MPa η 2
X C 720 MPa
Y T 43 MPa
Y C 150 MPa
S 12 = S 13 = S 23 43 MPa
The subscripts 1, 2, and 3 correspond to the direction of 0°, direction of 90°, and thickness, respectively; the subscripts T and C correspond to the tension and compression.
Table 4. Repair parameter design and failure load of ORLs of structural repair model.
IDRWRTRLFailure LoadIDRWRTRLFailure LoadIDRWRTRLFailure Load
mmmmmmkNmmmmmmkNmmmmmmkN
S11529094.8S102529094.9S1940290102.3
S215214594.3S11252145101.7S20402145110.7
S315220093.2S1225220098.6S21402200109.4
S415490104.5S132549098.3S2240490105.6
S5154145101.5S14254145108.4S23404145117
S6154200101.6S15254200108.2S24404200115.8
S715690116.3S1625690114.3S2540690121.5
S8156145131.4S17256145140.3S26406145144.6
S9156200138.1S18256200140.1S27406200144.7
Table 5. Lift coefficient and lift–drag ratio of 2D aerodynamic repair model.
Repair ModelClCl/Cd
--
Original1.61254.82Energies 16 00712 i003
0.3–21.780 57.30
0.3–41.738 57.39
0.3–61.665 55.03
0.5–21.701 56.21
0.5–41.71357.55
0.5–61.633 55.05
0.8–21.55054.53
0.8–41.59254.08
0.8–61.60453.61
Disclaimer/Publisher’s Note: The statements, opinions and data contained in all publications are solely those of the individual author(s) and contributor(s) and not of MDPI and/or the editor(s). MDPI and/or the editor(s) disclaim responsibility for any injury to people or property resulting from any ideas, methods, instructions or products referred to in the content.